Cambridge IGCSE Environmental Management 0680 — 2015 May/June Paper 2 · Variant 1
0680/21/M/J/15 · 80 marks · ≈90 min
The question paper and its mark scheme, free to read here and free to download. This is Cambridge’s own paper, exactly as it was sat.
Question paper16 pages
Mark scheme7 pages
Answers below. Sit the paper first if you are practising.
Paper as text
Question paper, page 1
This document consists of 15 printed pages, 1 blank page and 1 Insert. DC (KN/CGW) 91750/5 © UCLES 2015 [Turn over Cambridge International Examinations Cambridge International General Certificate of Secondary Education * 7 5 2 3 2 1 8 0 7 8 * ENVIRONMENTAL MANAGEMENT 0680/21 Paper 2 May/June 2015 1 hour 45 minutes Candidates answer on the Question Paper. Additional Materials: Insert READ THESE INSTRUCTIONS FIRST Write your Centre number, candidate number and name on all the work you hand in. Write in dark blue or black pen. You may use an HB pencil for any diagrams or graphs. Do not use staples, paper clips, glue or correction fluid. DO NOT WRITE IN ANY BARCODES. Answer both questions. Electronic calculators may be used. You may lose marks if you do not show your working or if you do not use appropriate units. At the end of the examination, fasten all your work securely together. The number of marks is given in brackets [ ] at the end of each question or part question. The Insert is not required by the Examiner.
Question paper, page 2
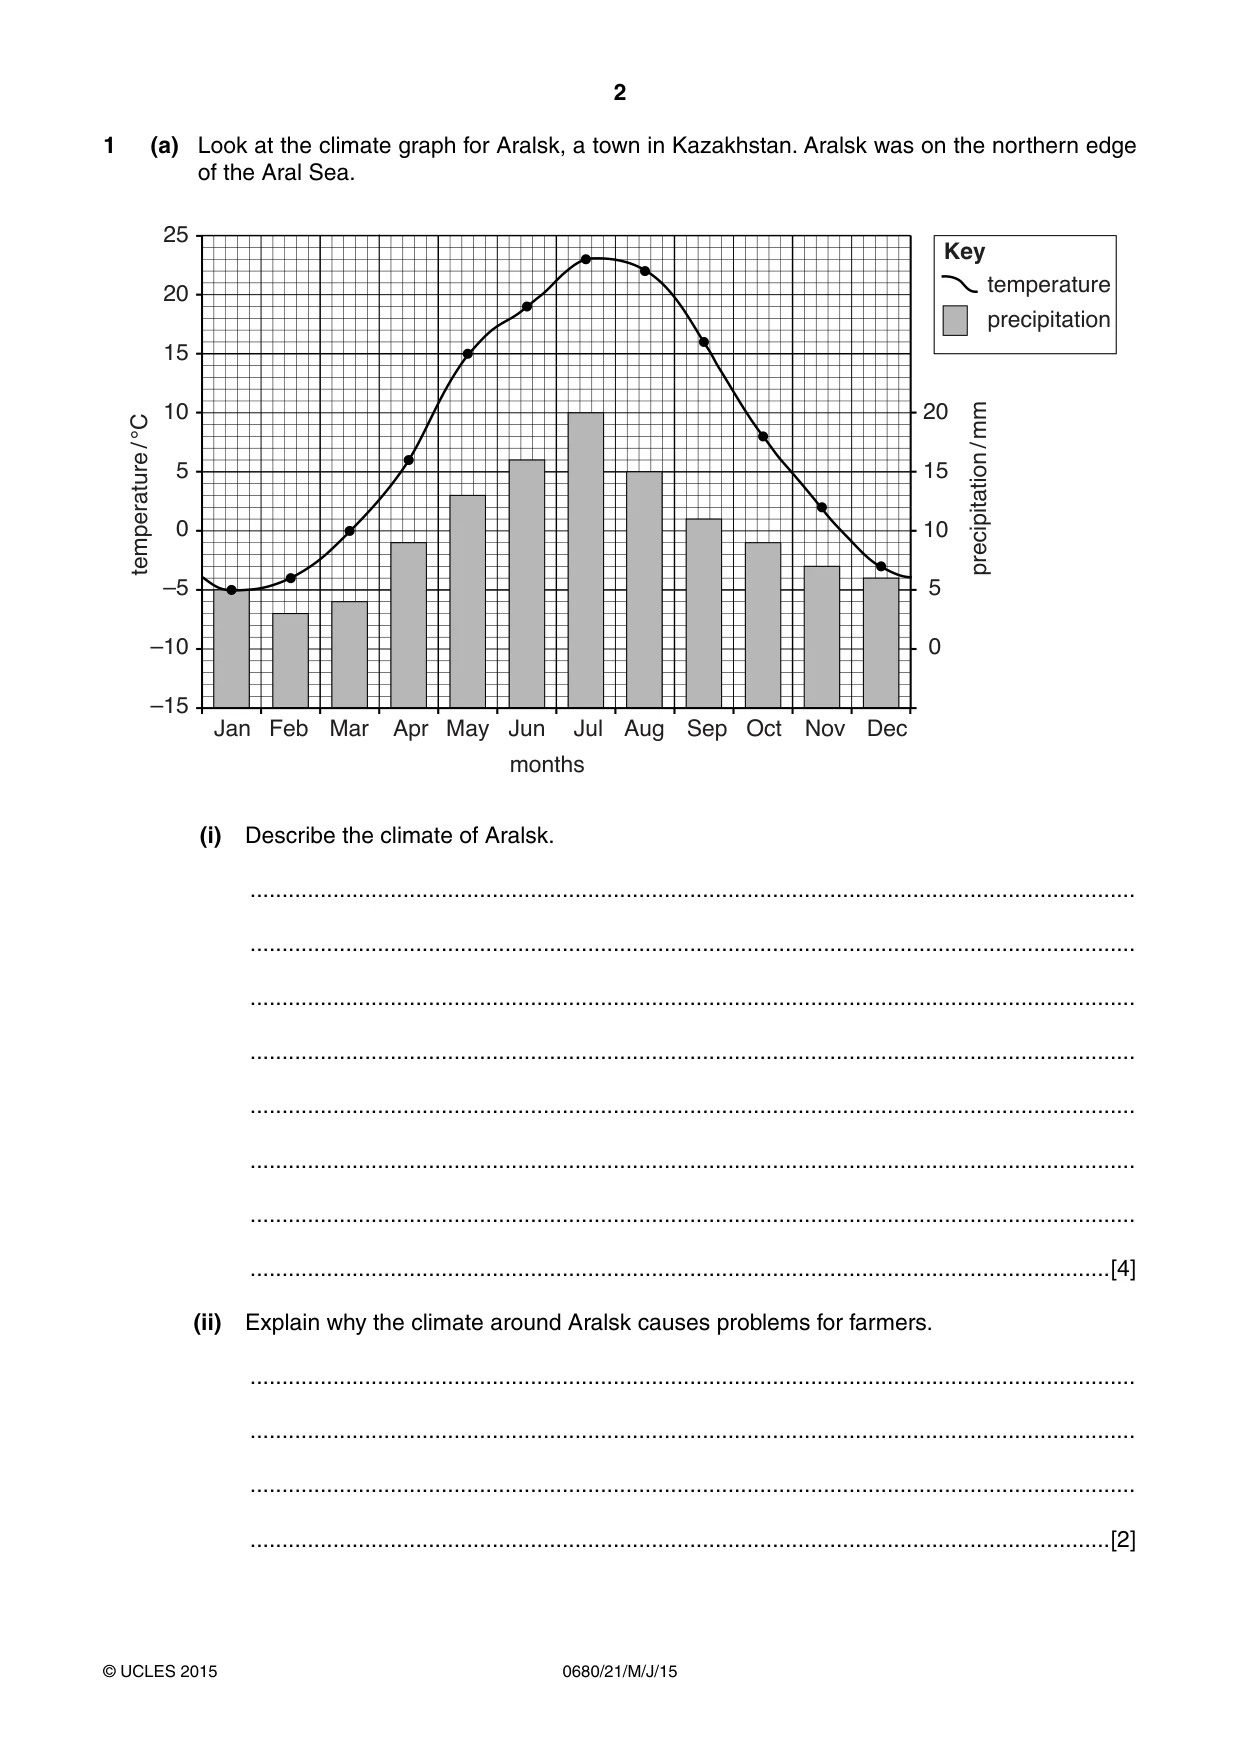
2 0680/21/M/J/15 © UCLES 2015 1 (a) Look at the climate graph for Aralsk, a town in Kazakhstan. Aralsk was on the northern edge of the Aral Sea. 0 5 10 15 20 0 5 10 15 20 25 –5 –10 –15 Jan Feb Mar Apr May Jun Jul Aug Sep Oct Nov Dec months temperature / °C precipitation / mm precipitation Key temperature (i) Describe the climate of Aralsk. … … … … … … … …[4] (ii) Explain why the climate around Aralsk causes problems for farmers. … … … …[2]
Question paper, page 3
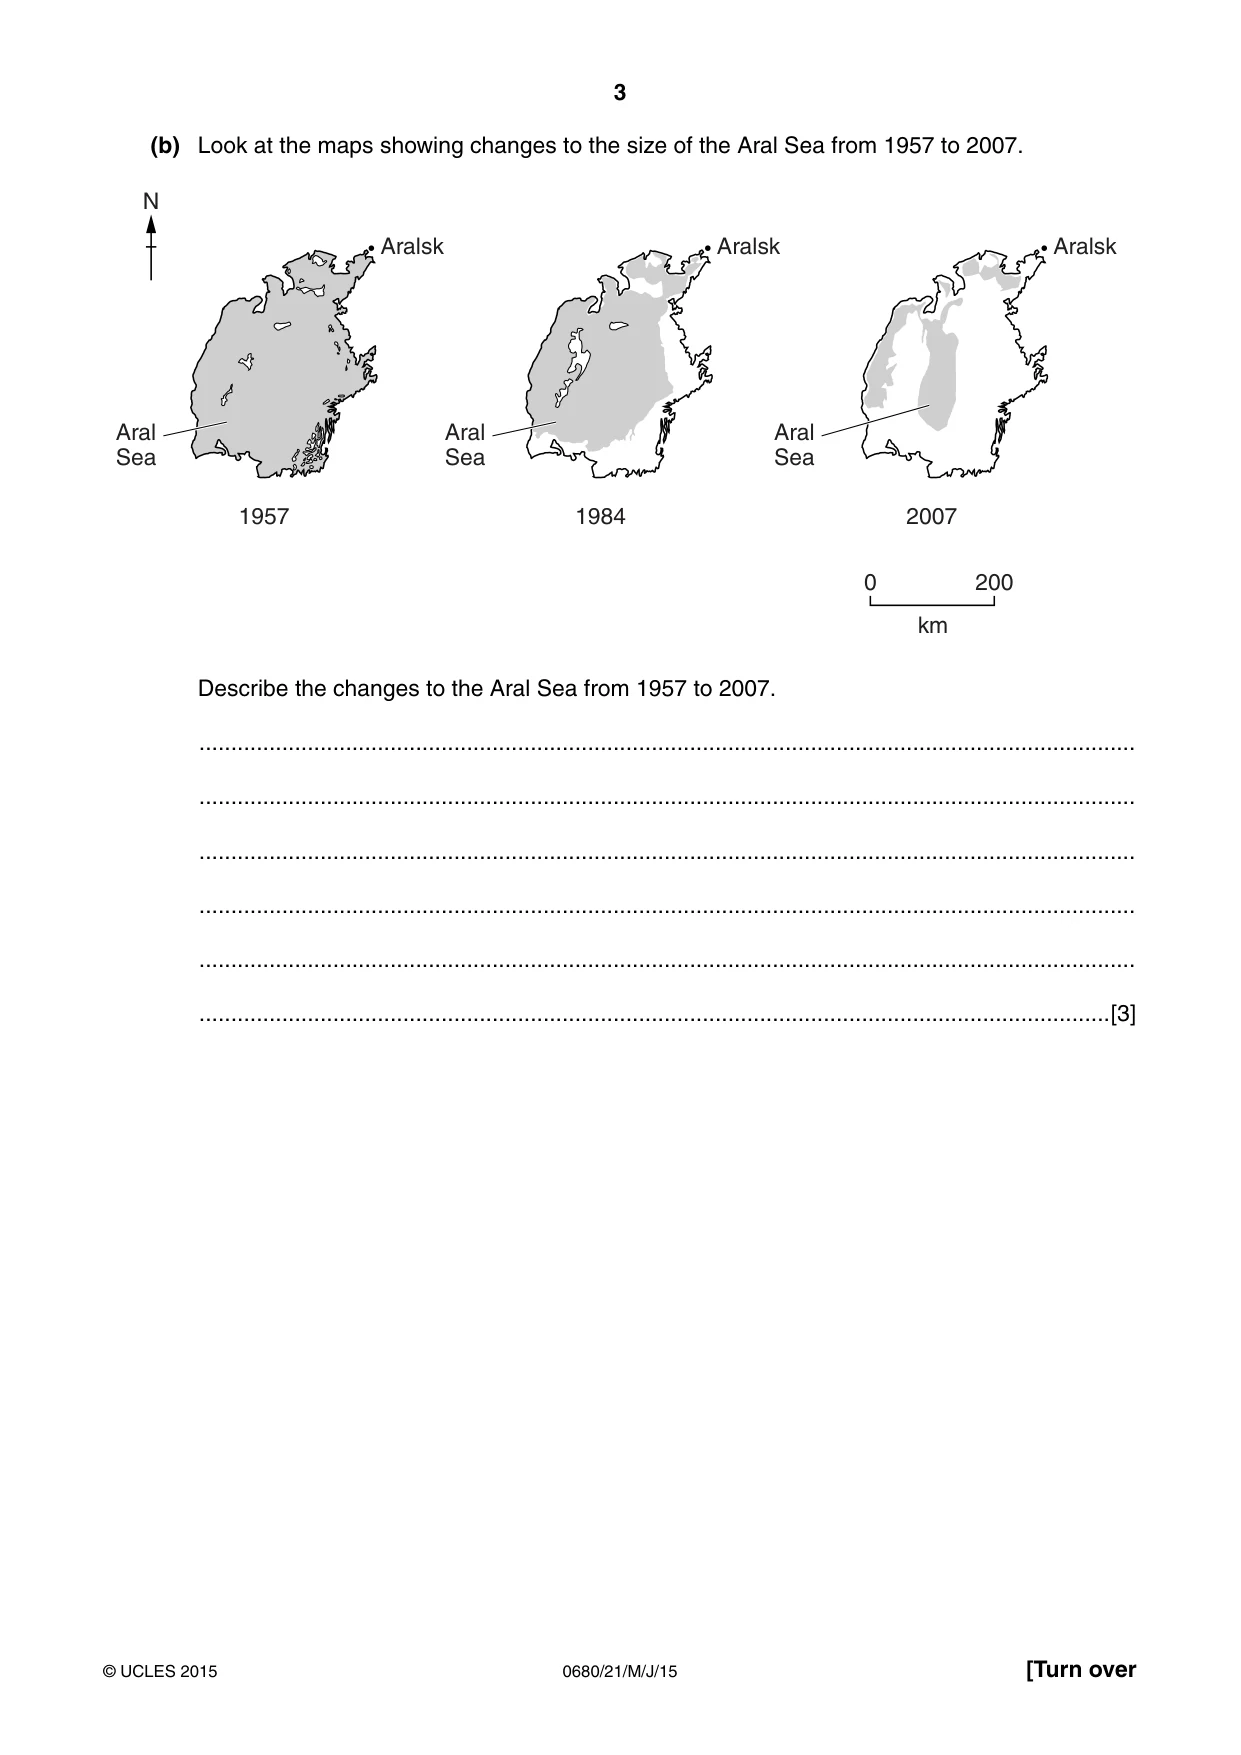
3 0680/21/M/J/15 © UCLES 2015 [Turn over (b) Look at the maps showing changes to the size of the Aral Sea from 1957 to 2007. 1957 1984 Aral Sea Aralsk 2007 0 200 km Aral Sea Aral Sea N Aralsk Aralsk Describe the changes to the Aral Sea from 1957 to 2007. … … … … … …[3]
Question paper, page 4
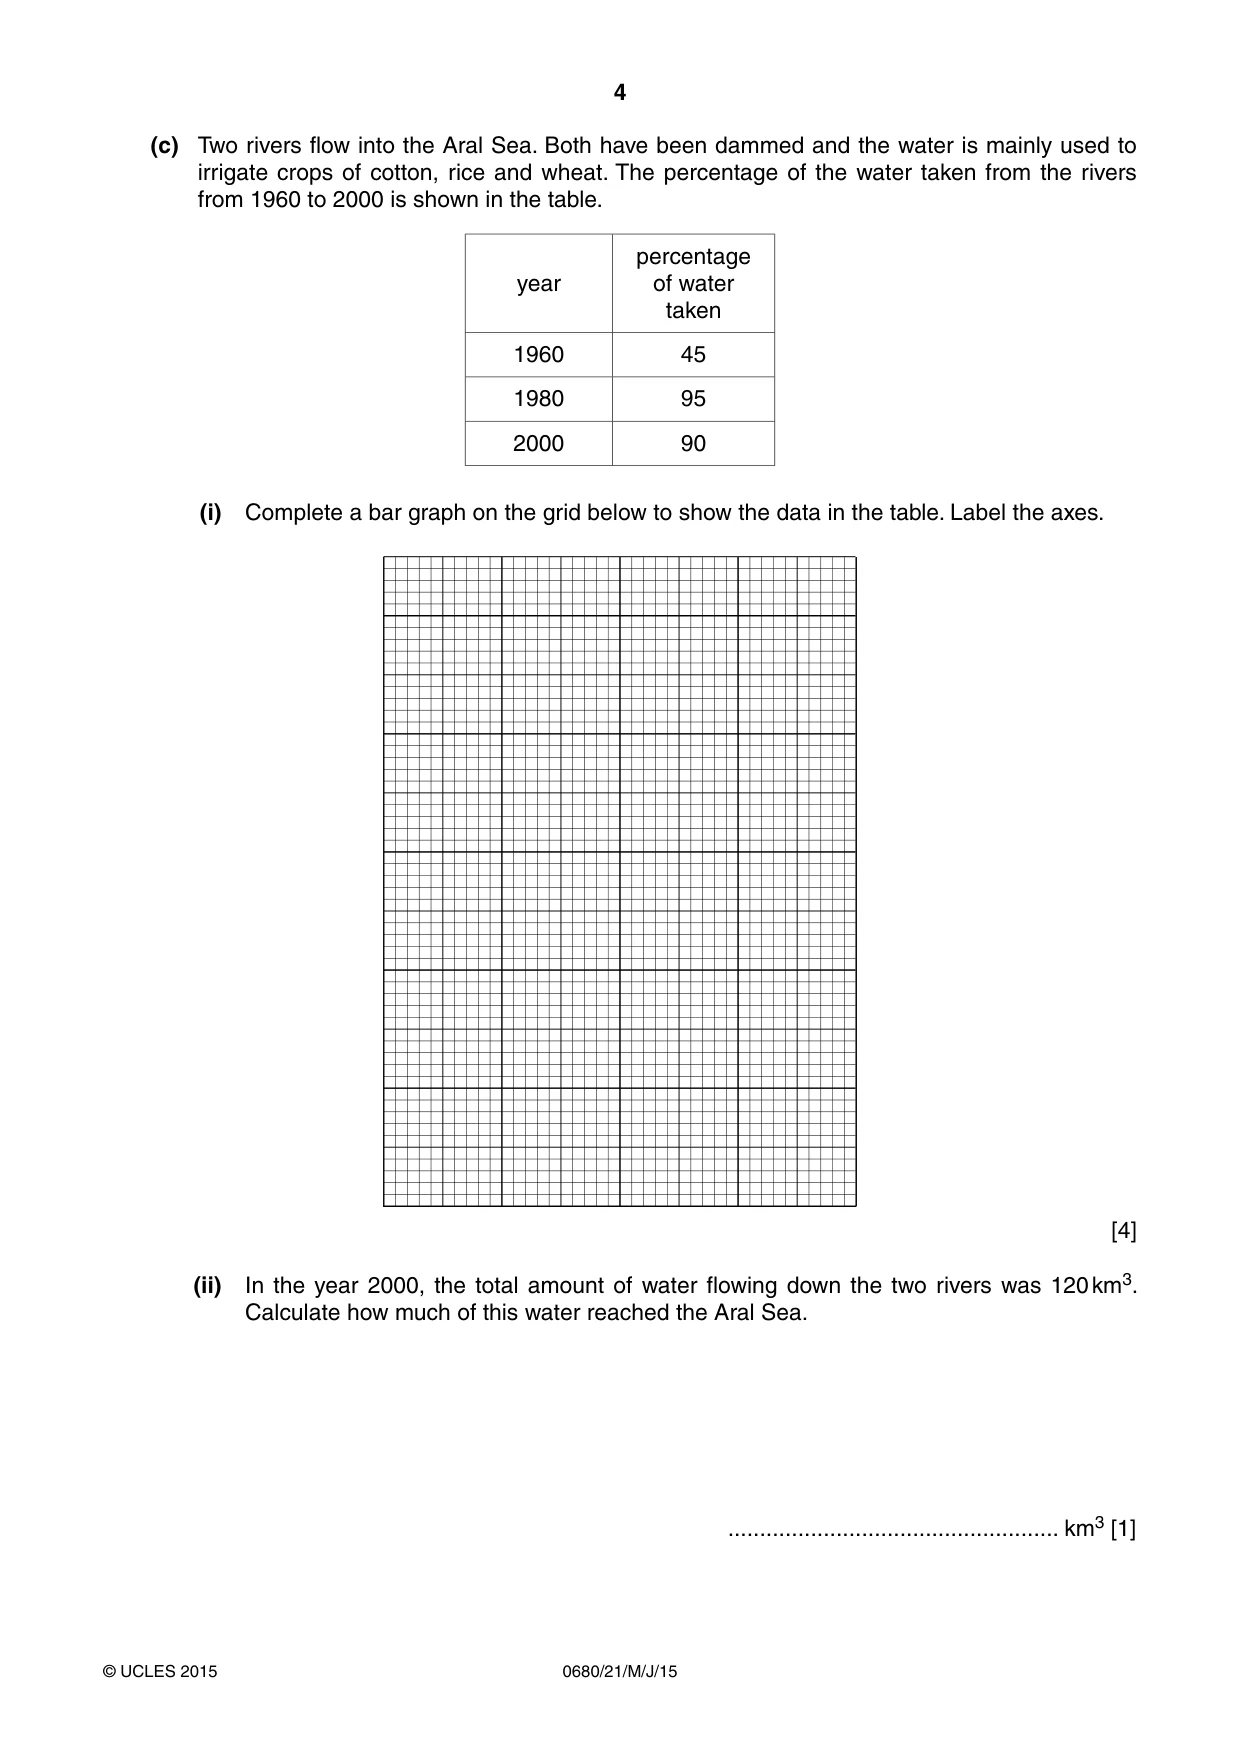
4 0680/21/M/J/15 © UCLES 2015 (c) Two rivers flow into the Aral Sea. Both have been dammed and the water is mainly used to irrigate crops of cotton, rice and wheat. The percentage of the water taken from the rivers from 1960 to 2000 is shown in the table. year percentage of water taken 1960 45 1980 95 2000 90 (i) Complete a bar graph on the grid below to show the data in the table. Label the axes. [4] (ii) In the year 2000, the total amount of water flowing down the two rivers was 120 km3. Calculate how much of this water reached the Aral Sea. … km3 [1]
Question paper, page 5
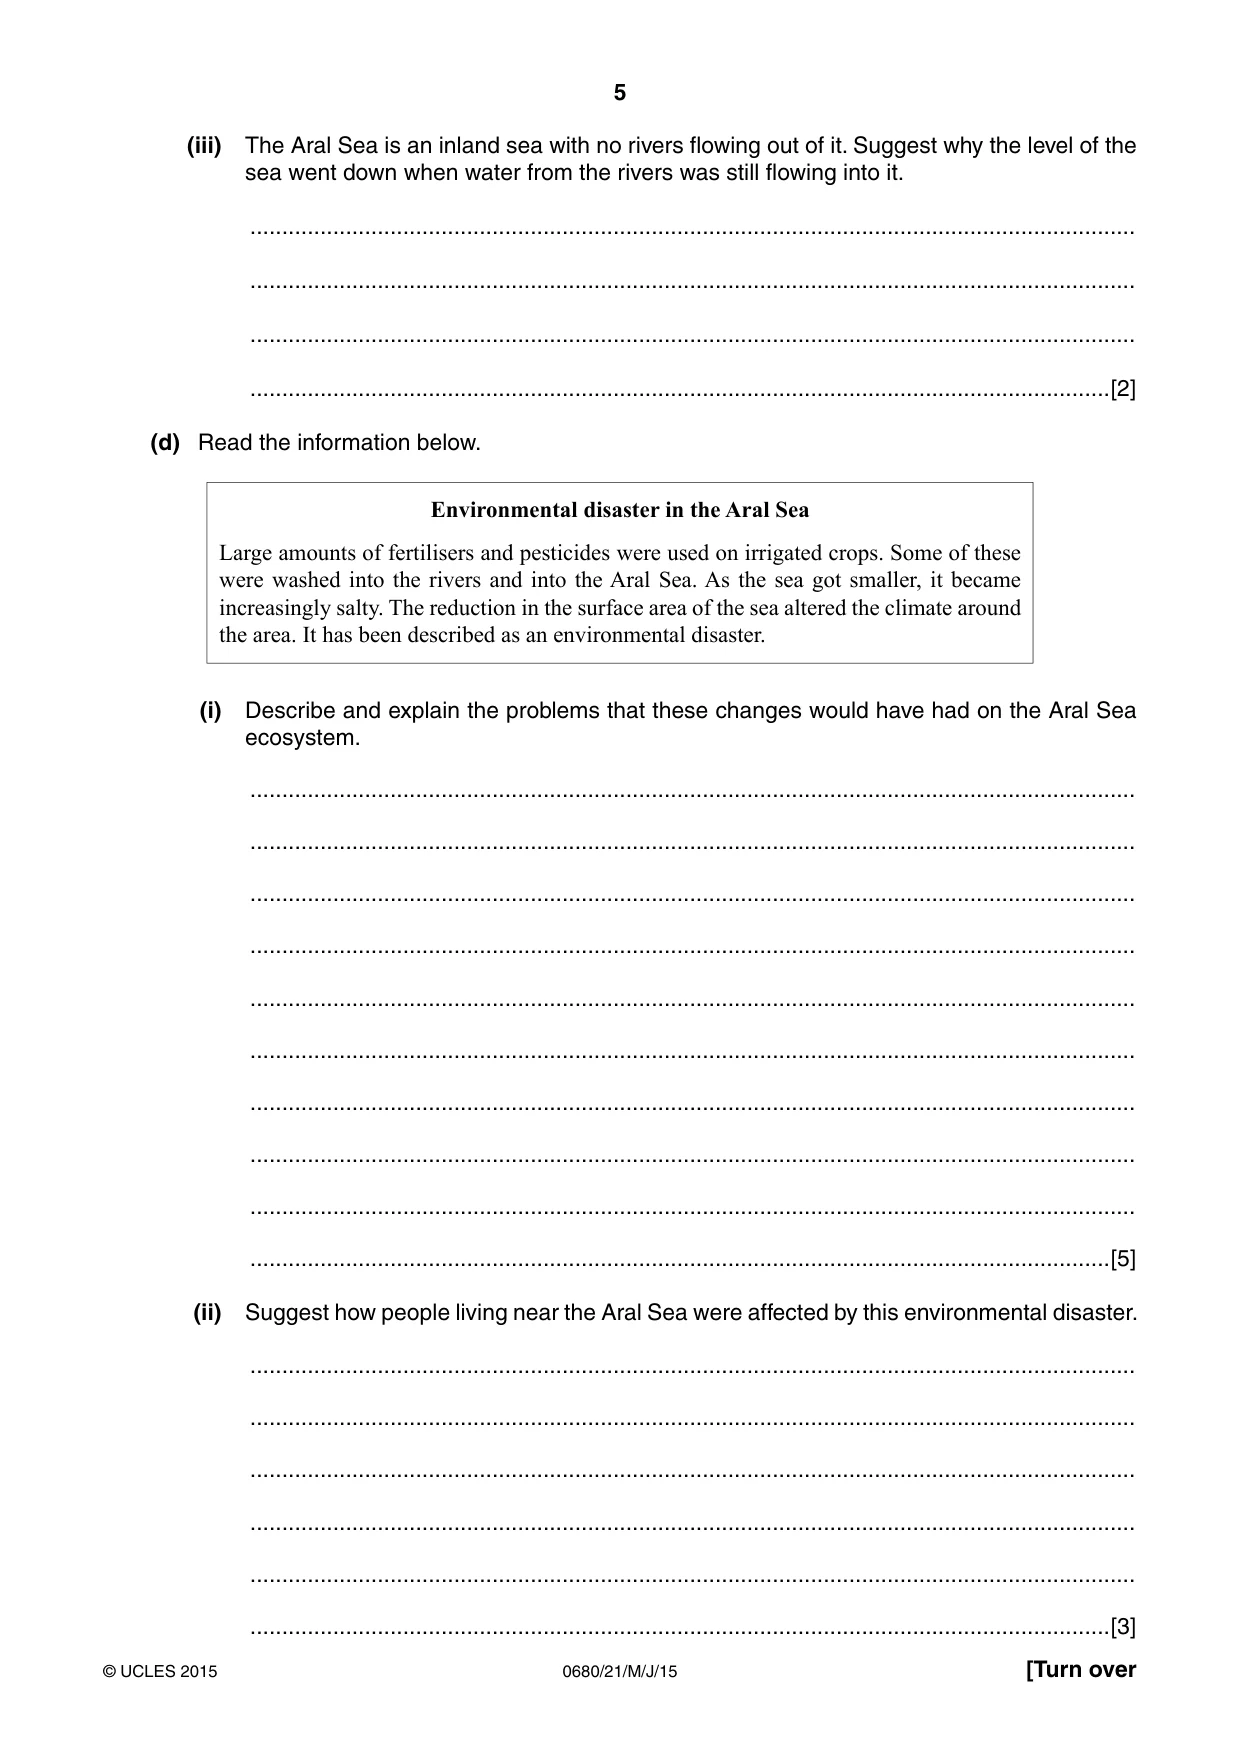
5 0680/21/M/J/15 © UCLES 2015 [Turn over (iii) The Aral Sea is an inland sea with no rivers flowing out of it. Suggest why the level of the sea went down when water from the rivers was still flowing into it. … … … …[2] (d) Read the information below. Environmental disaster in the Aral Sea Large amounts of fertilisers and pesticides were used on irrigated crops. Some of these were washed into the rivers and into the Aral Sea. As the sea got smaller, it became increasingly salty. The reduction in the surface area of the sea altered the climate around the area. It has been described as an environmental disaster. (i) Describe and explain the problems that these changes would have had on the Aral Sea ecosystem. … … … … … … … … … …[5] (ii) Suggest how people living near the Aral Sea were affected by this environmental disaster. … … … … … …[3]
Question paper, page 6
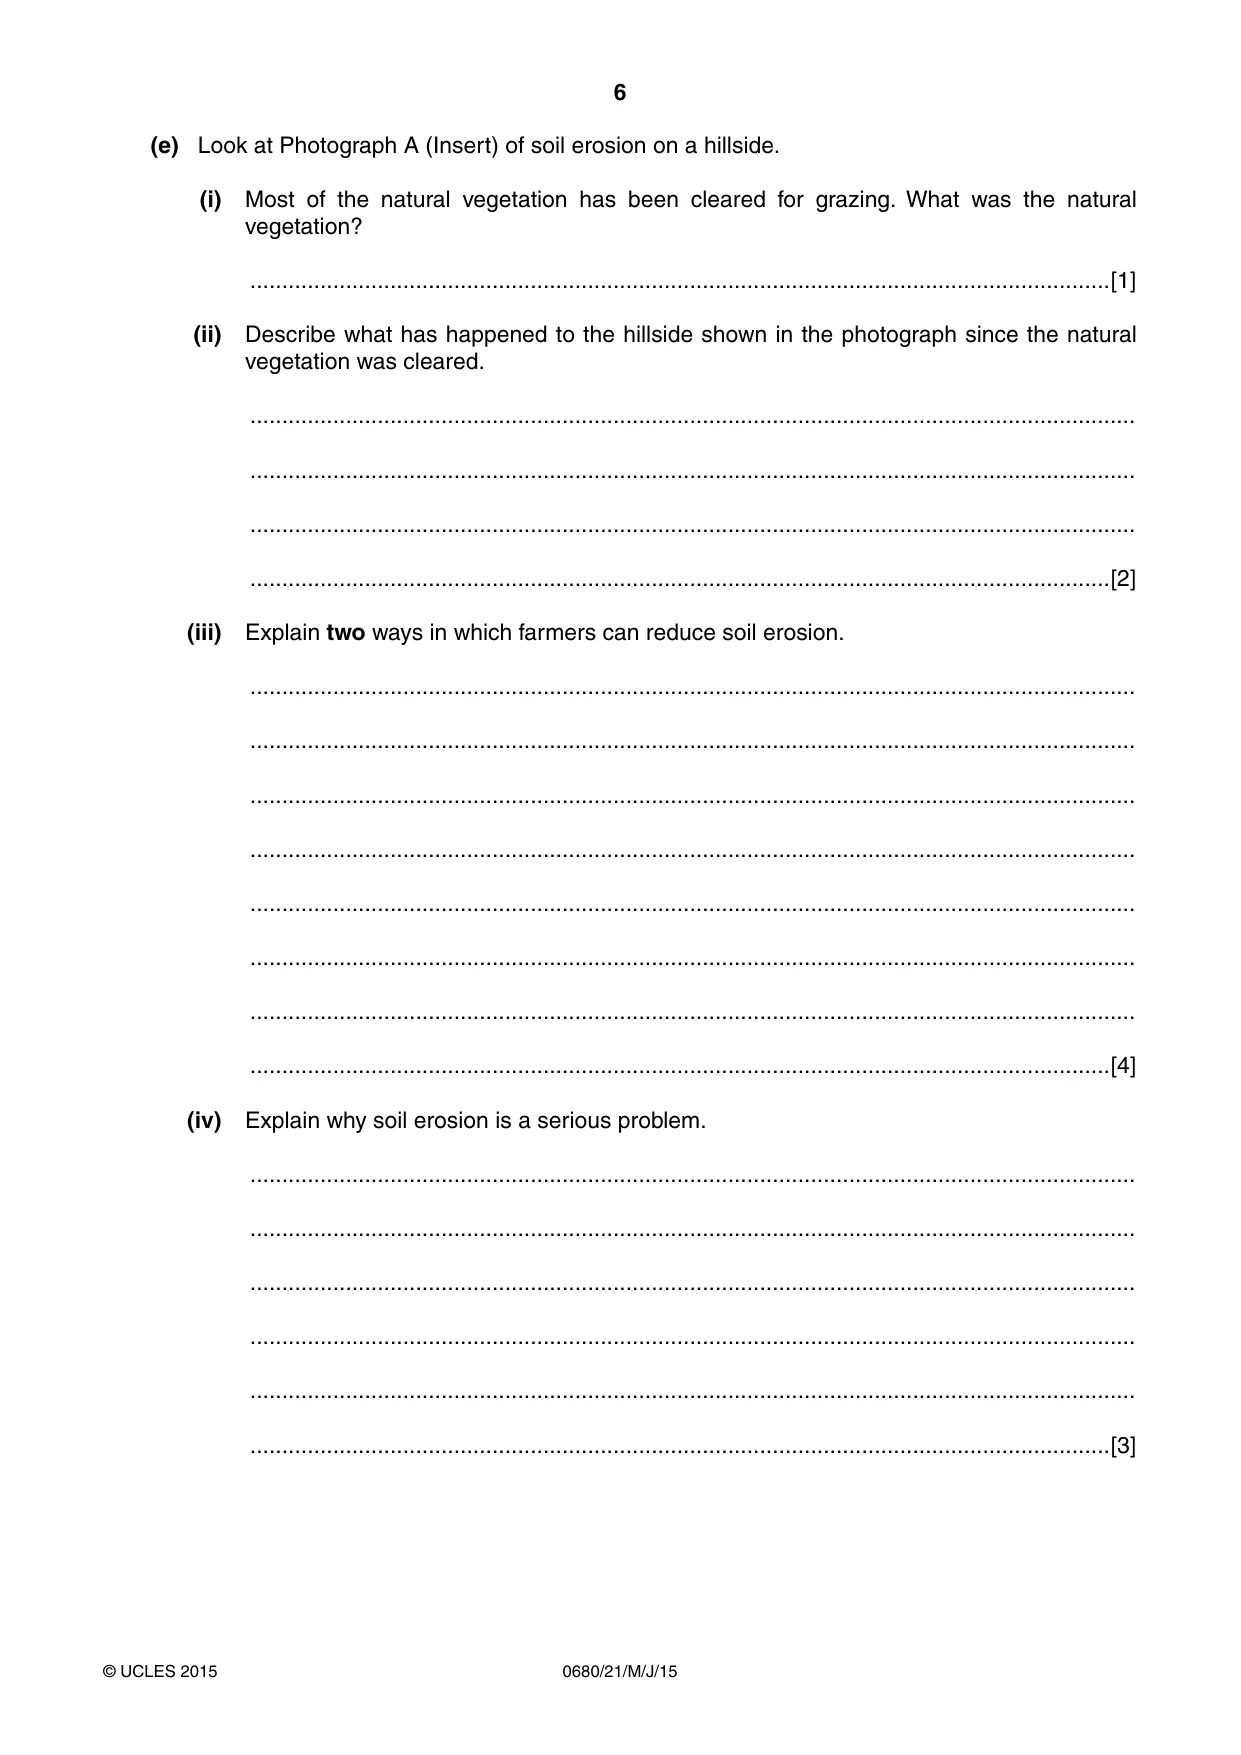
6 0680/21/M/J/15 © UCLES 2015 (e) Look at Photograph A (Insert) of soil erosion on a hillside. (i) Most of the natural vegetation has been cleared for grazing. What was the natural vegetation? …[1] (ii) Describe what has happened to the hillside shown in the photograph since the natural vegetation was cleared. … … … …[2] (iii) Explain two ways in which farmers can reduce soil erosion. … … … … … … … …[4] (iv) Explain why soil erosion is a serious problem. … … … … … …[3]
Question paper, page 7
7 0680/21/M/J/15 © UCLES 2015 [Turn over (f) Can agriculture become sustainable and still feed a growing human population? Explain your answer. … … … … … … … … … … … …[6]
Question paper, page 8
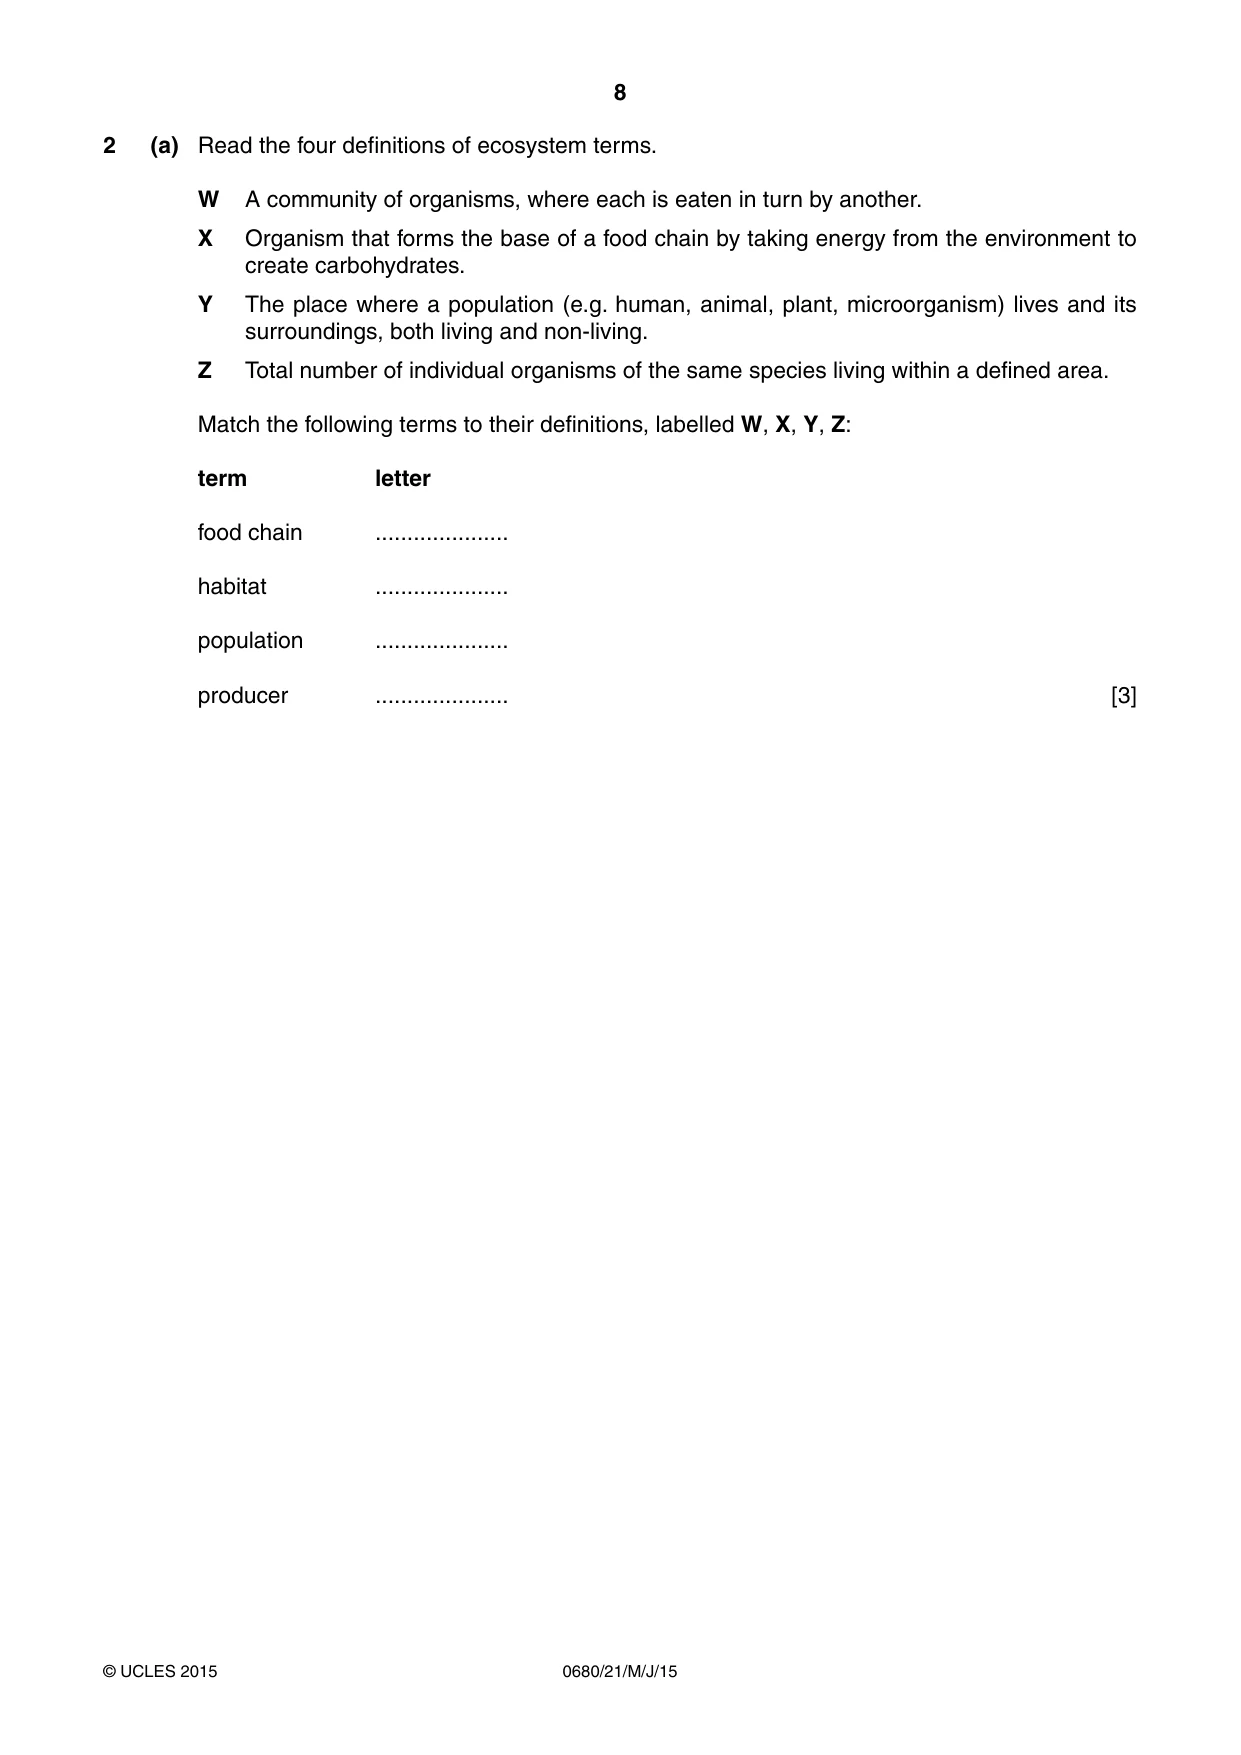
8 0680/21/M/J/15 © UCLES 2015 2 (a) Read the four definitions of ecosystem terms. W A community of organisms, where each is eaten in turn by another. X Organism that forms the base of a food chain by taking energy from the environment to create carbohydrates. Y The place where a population (e.g. human, animal, plant, microorganism) lives and its surroundings, both living and non-living. Z Total number of individual organisms of the same species living within a defined area. Match the following terms to their definitions, labelled W, X, Y, Z: term letter food chain … habitat … population … producer … [3]
Question paper, page 9
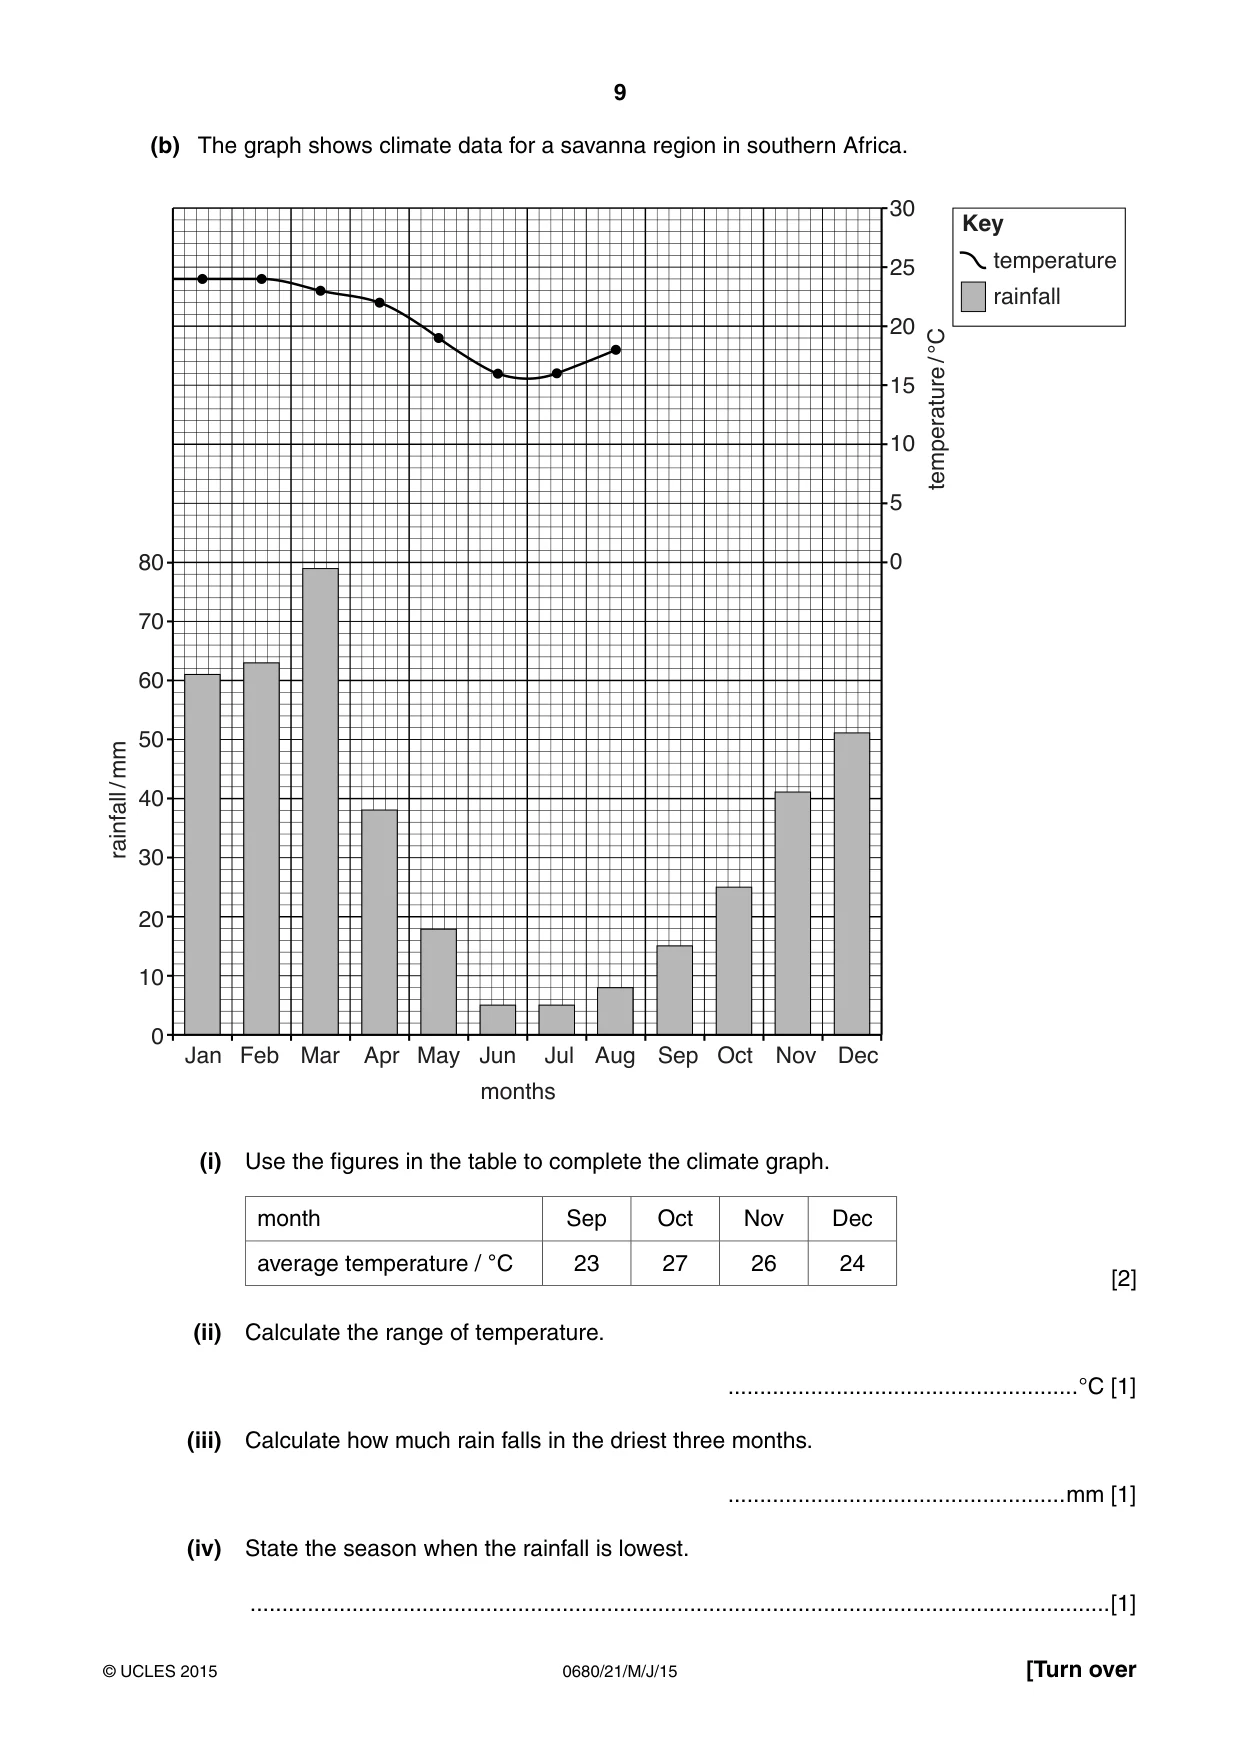
9 0680/21/M/J/15 © UCLES 2015 [Turn over (b) The graph shows climate data for a savanna region in southern Africa. 5 10 0 15 20 30 40 50 0 10 20 25 Jan Feb Mar Apr May Jun Jul Aug Sep Oct Nov Dec 60 70 80 30 months temperature / °C rainfall / mm rainfall Key temperature (i) Use the figures in the table to complete the climate graph. month Sep Oct Nov Dec average temperature / °C 23 27 26 24 [2] (ii) Calculate the range of temperature. …°C [1] (iii) Calculate how much rain falls in the driest three months. …mm [1] (iv) State the season when the rainfall is lowest. …[1]
Question paper, page 10
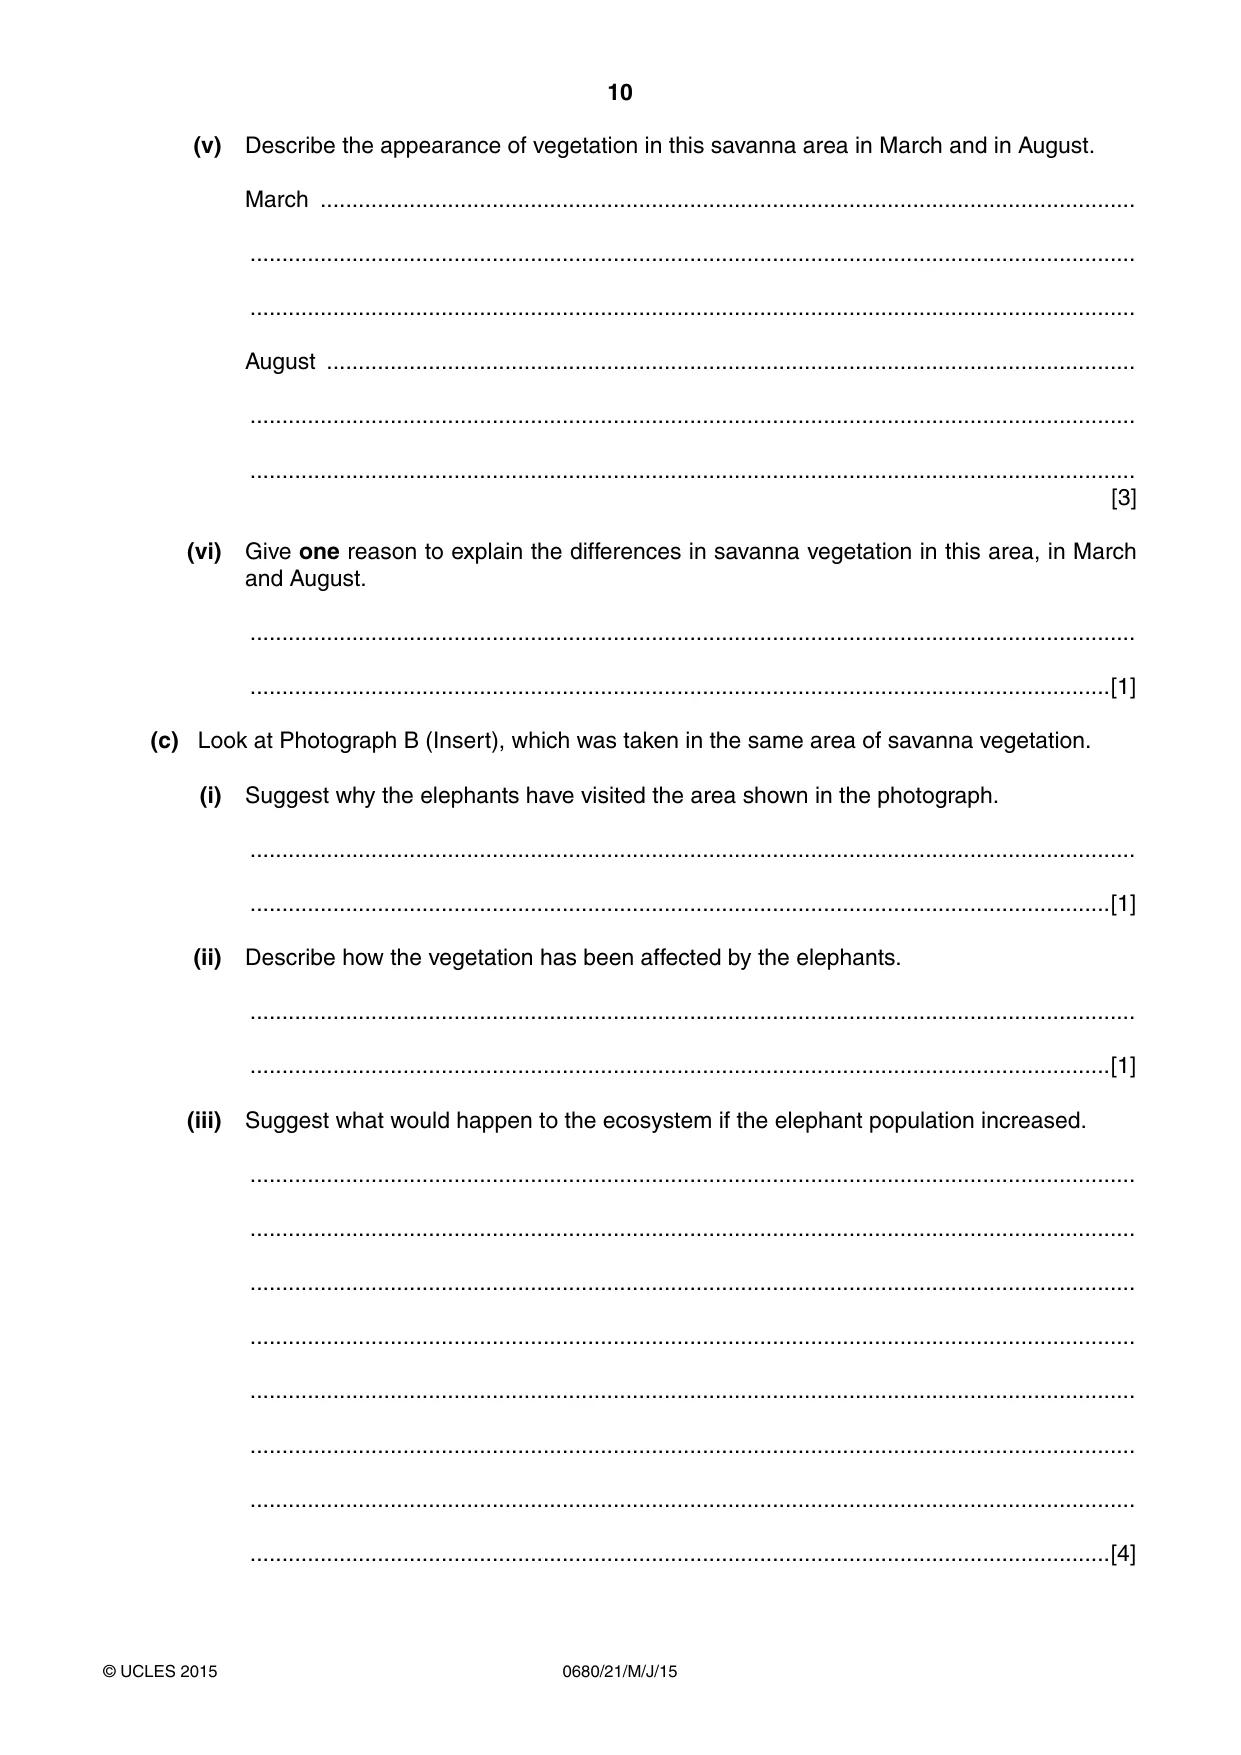
10 0680/21/M/J/15 © UCLES 2015 (v) Describe th e appearance of vegetation in this savanna area in March and in August. March … … … August … … … [3] (vi) Give one reason to explain the differences in savanna vegetation in this area, in March and August. … …[1] (c) Look at Photograph B (Insert), which was taken in the same area of savanna vegetation. (i) Suggest why the elephants have visited the area shown in the photograph. … …[1] (ii) Describe how the vegetation has been affected by the elephants. … …[1] (iii) Suggest what would happen to the ecosystem if the elephant population increased. … … … … … … … …[4]
Question paper, page 11
11 0680/21/M/J/15 © UCLES 2015 [Turn over (d) In some parts of Africa, elephants cause problems for farmers and villagers. They eat the crops and animal fodder and destroy fences used to keep animals secure. Their numbers have grown in recent years as they are protected and trade in ivory (from their tusks) has been banned for many years. Some villagers think that the number of elephants need to be reduced. Explain why the WWF (World Wide Fund for Nature) would oppose reducing the number of elephants. … … … …[2]
Question paper, page 12
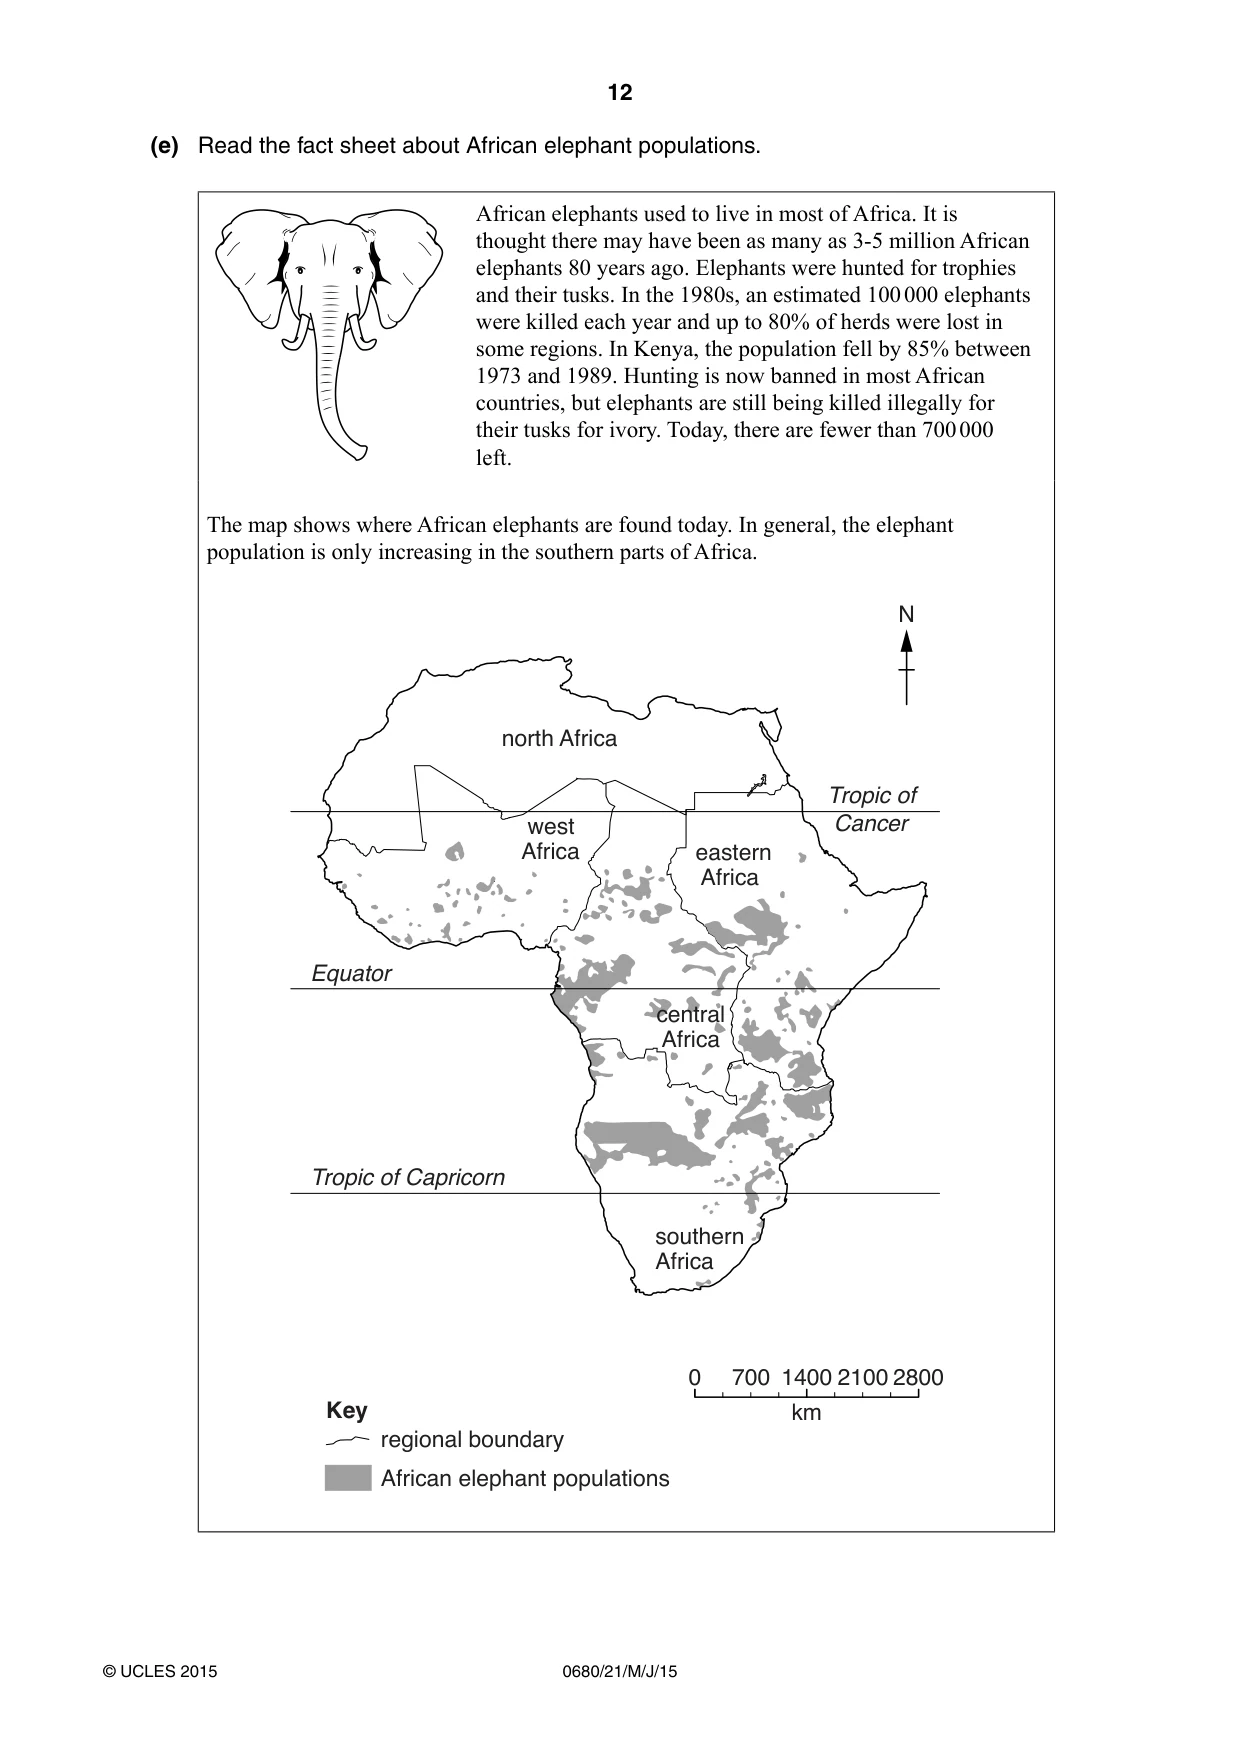
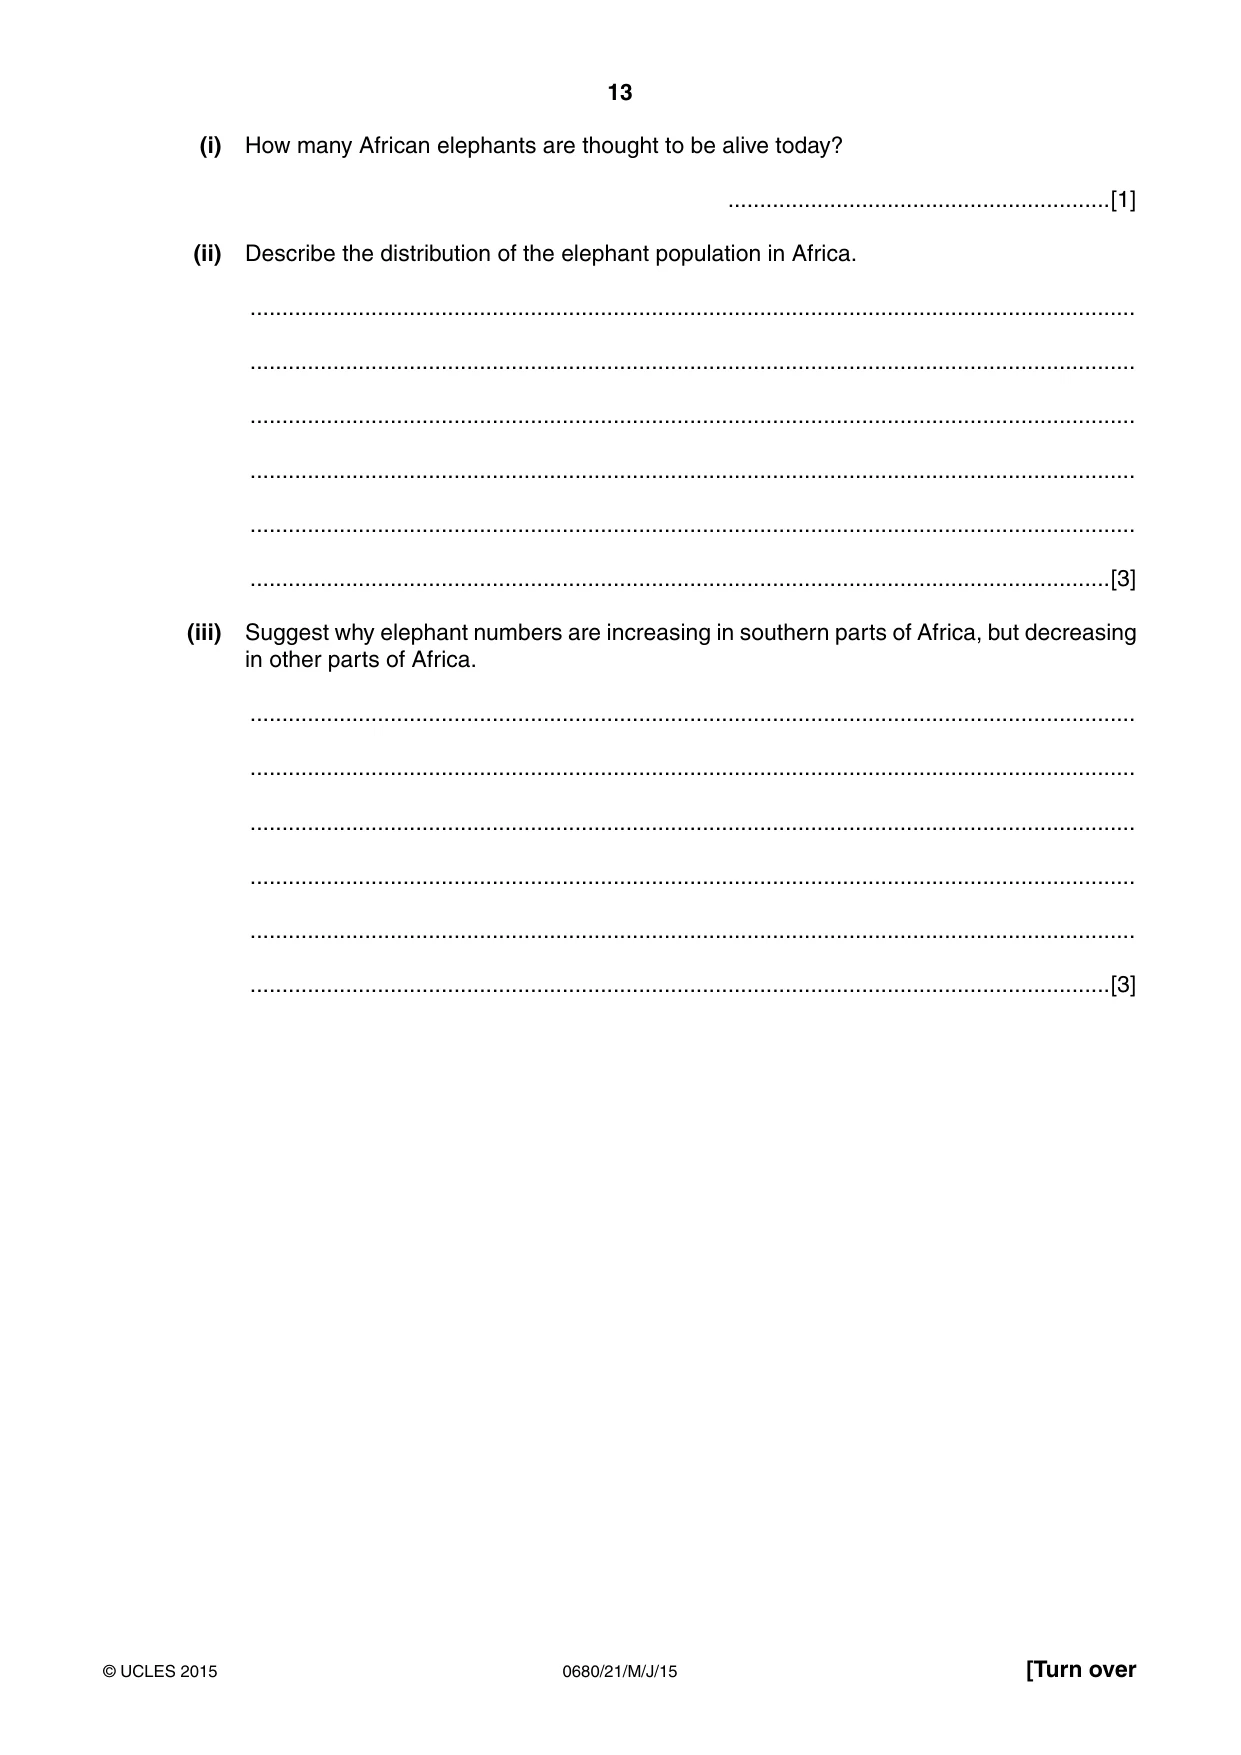
12 0680/21/M/J/15 © UCLES 2015 (e) Read the fact sheet about African elephant populations. African elephants used to live in most of Africa. It is thought there may have been as many as 3-5 million African elephants 80 years ago. Elephants were hunted for trophies and their tusks. In the 1980s, an estimated 100 000 elephants were killed each year and up to 80% of herds were lost in some regions. In Kenya, the population fell by 85% between 1973 and 1989. Hunting is now banned in most African countries, but elephants are still being killed illegally for their tusks for ivory. Today, there are fewer than 700 000 left. The map shows where African elephants are found today. In general, the elephant population is only increasing in the southern parts of Africa. north Africa eastern Africa N west Africa southern Africa 0 1400 km 2800 700 2100 Equator Tropic of Capricorn Tropic of Cancer central Africa Key regional boundary African elephant populations
Question paper, page 13
13 0680/21/M/J/15 © UCLES 2015 [Turn over (i) How many African elephants are thought to be alive today? …[1] (ii) Describe the distribution of the elephant population in Africa. … … … … … …[3] (iii) Suggest why elephant numbers are increasing in southern parts of Africa, but decreasing in other parts of Africa. … … … … … …[3]
Question paper, page 14
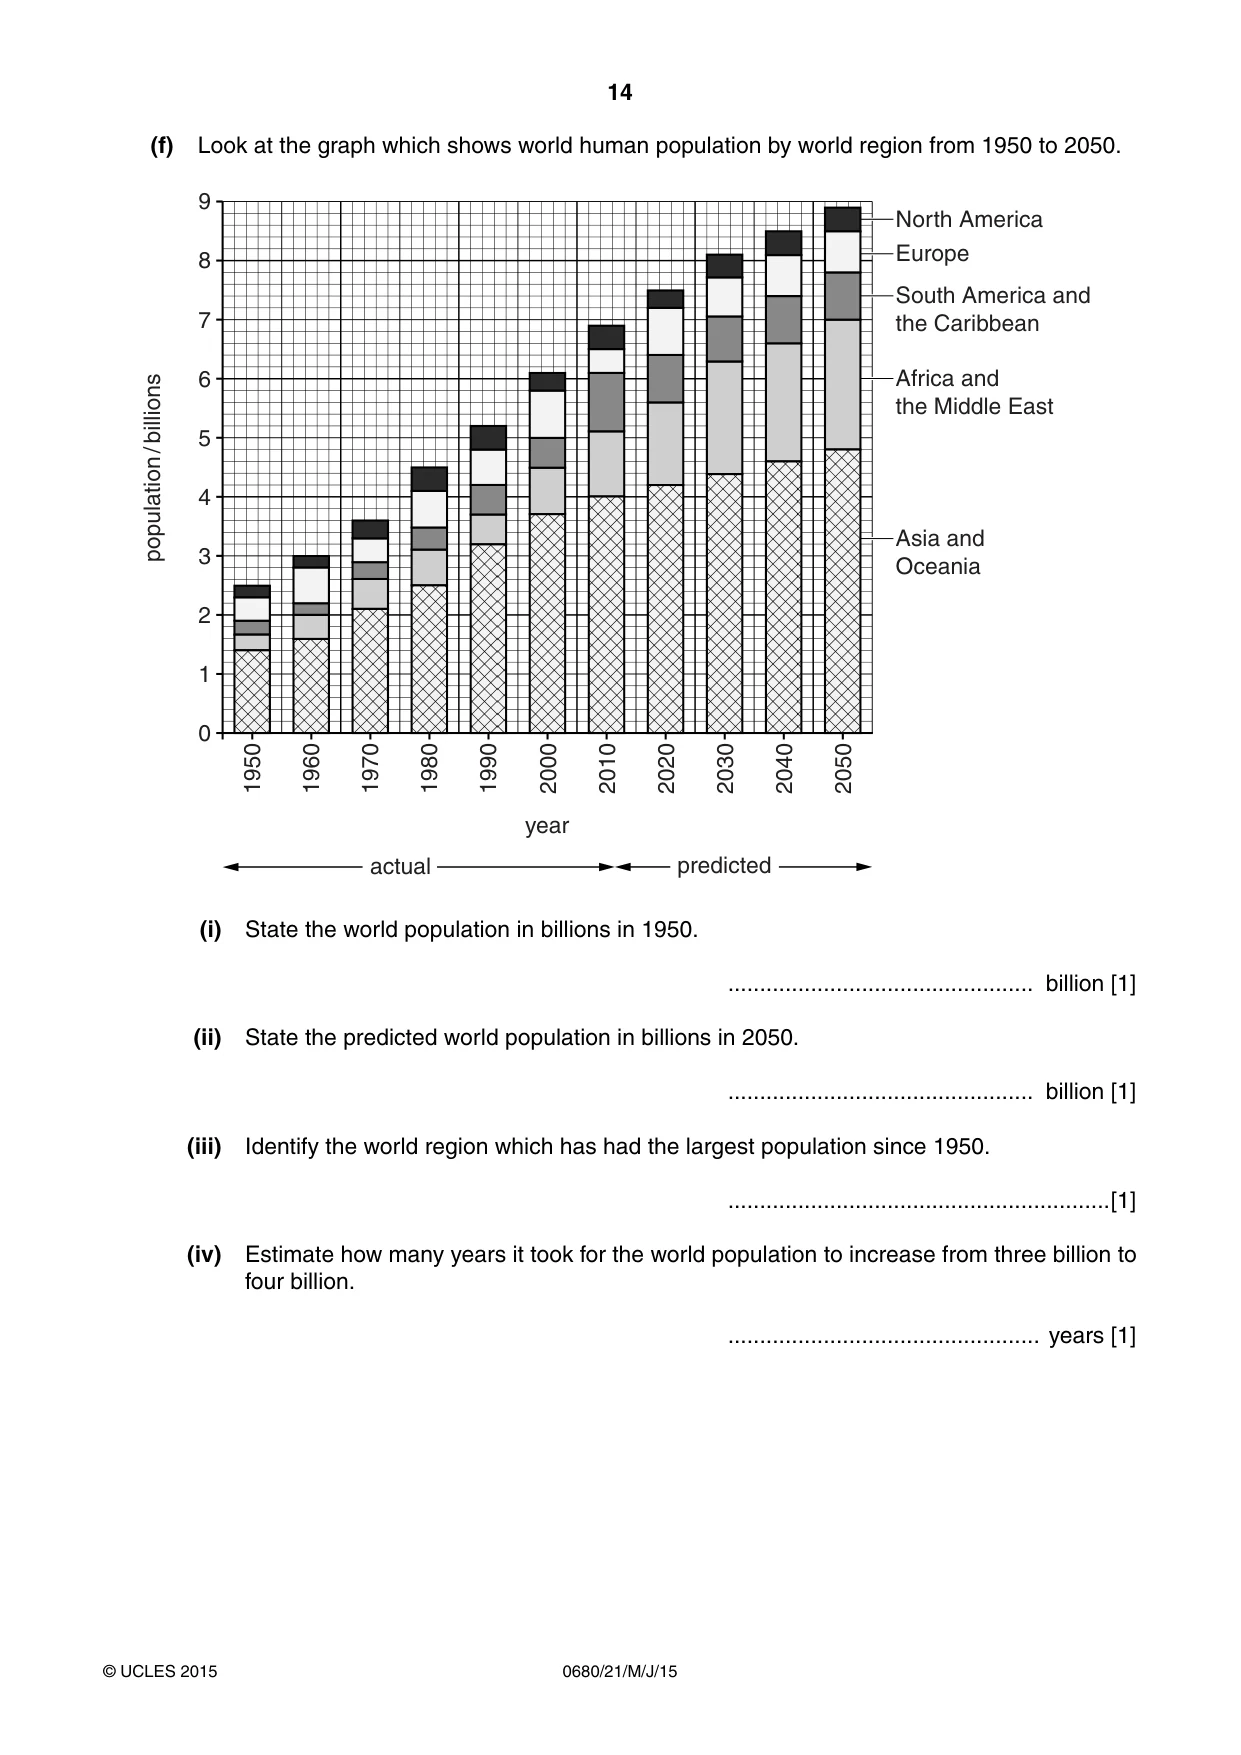
14 0680/21/M/J/15 © UCLES 2015 (f) Look at the graph which shows world human population by world region from 1950 to 2050. 0 1 North America 1950 1960 1970 1980 1990 2000 2010 2020 2030 2050 2040 2 3 4 year 5 population / billions 6 7 8 9 actual predicted Europe South America and the Caribbean Africa and the Middle East Asia and Oceania (i) State the world population in billions in 1950. … billion [1] (ii) State the predicted world population in billions in 2050. … billion [1] (iii) Identify the world region which has had the largest population since 1950. …[1] (iv) Estimate how many years it took for the world population to increase from three billion to four billion. … years [1]
Question paper, page 15
15 0680/21/M/J/15 © UCLES 2015 (v) Explain the rapid increase in world population since 1950. … … … … … …[3] (vi) Explain environmental problems that are caused by an increasing human population. … … … … … … … … … … … …[6]
Question paper, page 16
16 0680/21/M/J/15 © UCLES 2015 Permission to reproduce items where third-party owned material protected by copyright is included has been sought and cleared where possible. Every reasonable effort has been made by the publisher (UCLES) to trace copyright holders, but if any items requiring clearance have unwittingly been included, the publisher will be pleased to make amends at the earliest possible opportunity. To avoid the issue of disclosure of answer-related information to candidates, all copyright acknowledgements are reproduced online in the Cambridge International Examinations Copyright Acknowledgements Booklet. This is produced for each series of examinations and is freely available to download at www.cie.org.uk after the live examination series. Cambridge International Examinations is part of the Cambridge Assessment Group. Cambridge Assessment is the brand name of University of Cambridge Local Examinations Syndicate (UCLES), which is itself a department of the University of Cambridge. BLANK PAGE
Mark scheme, page 1
® IGCSE is the registered trademark of Cambridge International Examinations. CAMBRIDGE INTERNATIONAL EXAMINATIONS Cambridge International General Certificate of Secondary Education MARK SCHEME for the May/June 2015 series 0680 ENVIRONMENTAL MANAGEMENT 0680/21 Paper 2, maximum raw mark 80 This mark scheme is published as an aid to teachers and candidates, to indicate the requirements of the examination. It shows the basis on which Examiners were instructed to award marks. It does not indicate the details of the discussions that took place at an Examiners’ meeting before marking began, which would have considered the acceptability of alternative answers. Mark schemes should be read in conjunction with the question paper and the Principal Examiner Report for Teachers. Cambridge will not enter into discussions about these mark schemes. Cambridge is publishing the mark schemes for the May/June 2015 series for most Cambridge IGCSE®, Cambridge International A and AS Level components and some Cambridge O Level components.
Mark scheme, page 2
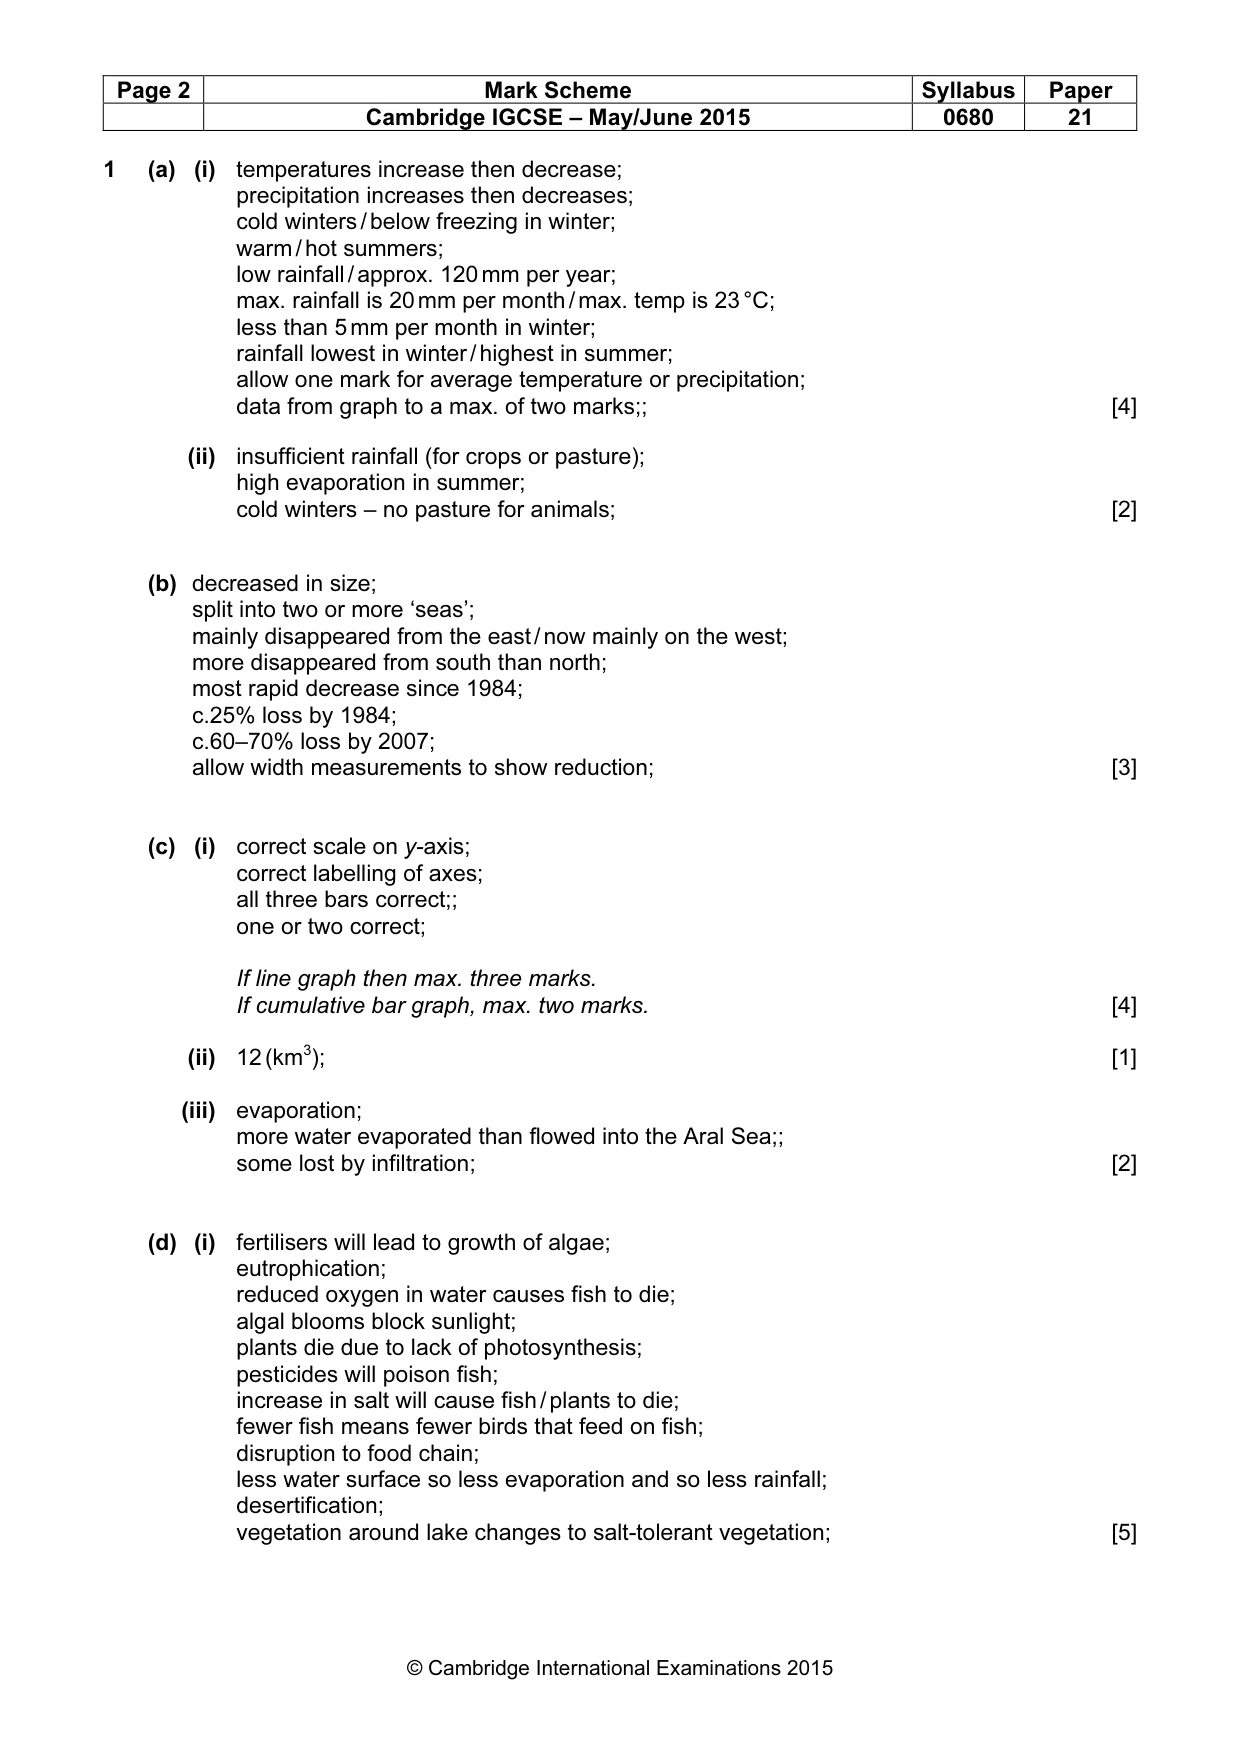
Page 2 Mark Scheme Syllabus Paper Cambridge IGCSE – May/June 2015 0680 21 © Cambridge International Examinations 2015 1 (a) (i) temperatures increase then decrease; precipitation increases then decreases; cold winters / below freezing in winter; warm / hot summers; low rainfall / approx. 120 mm per year; max. rainfall is 20 mm per month / max. temp is 23 °C; less than 5 mm per month in winter; rainfall lowest in winter / highest in summer; allow one mark for average temperature or precipitation; data from graph to a max. of two marks;; [4] (ii) insufficient rainfall (for crops or pasture); high evaporation in summer; cold winters – no pasture for animals; [2] (b) decreased in size; split into two or more ‘seas’; mainly disappeared from the east / now mainly on the west; more disappeared from south than north; most rapid decrease since 1984; c.25% loss by 1984; c.60–70% loss by 2007; allow width measurements to show reduction; [3] (c) (i) correct scale on y-axis; correct labelling of axes; all three bars correct;; one or two correct; If line graph then max. three marks. If cumulative bar graph, max. two marks. [4] (ii) 12 (km3); [1] (iii) evaporation; more water evaporated than flowed into the Aral Sea;; some lost by infiltration; [2] (d) (i) fertilisers will lead to growth of algae; eutrophication; reduced oxygen in water causes fish to die; algal blooms block sunlight; plants die due to lack of photosynthesis; pesticides will poison fish; increase in salt will cause fish / plants to die; fewer fish means fewer birds that feed on fish; disruption to food chain; less water surface so less evaporation and so less rainfall; desertification; vegetation around lake changes to salt-tolerant vegetation; [5]
Mark scheme, page 3
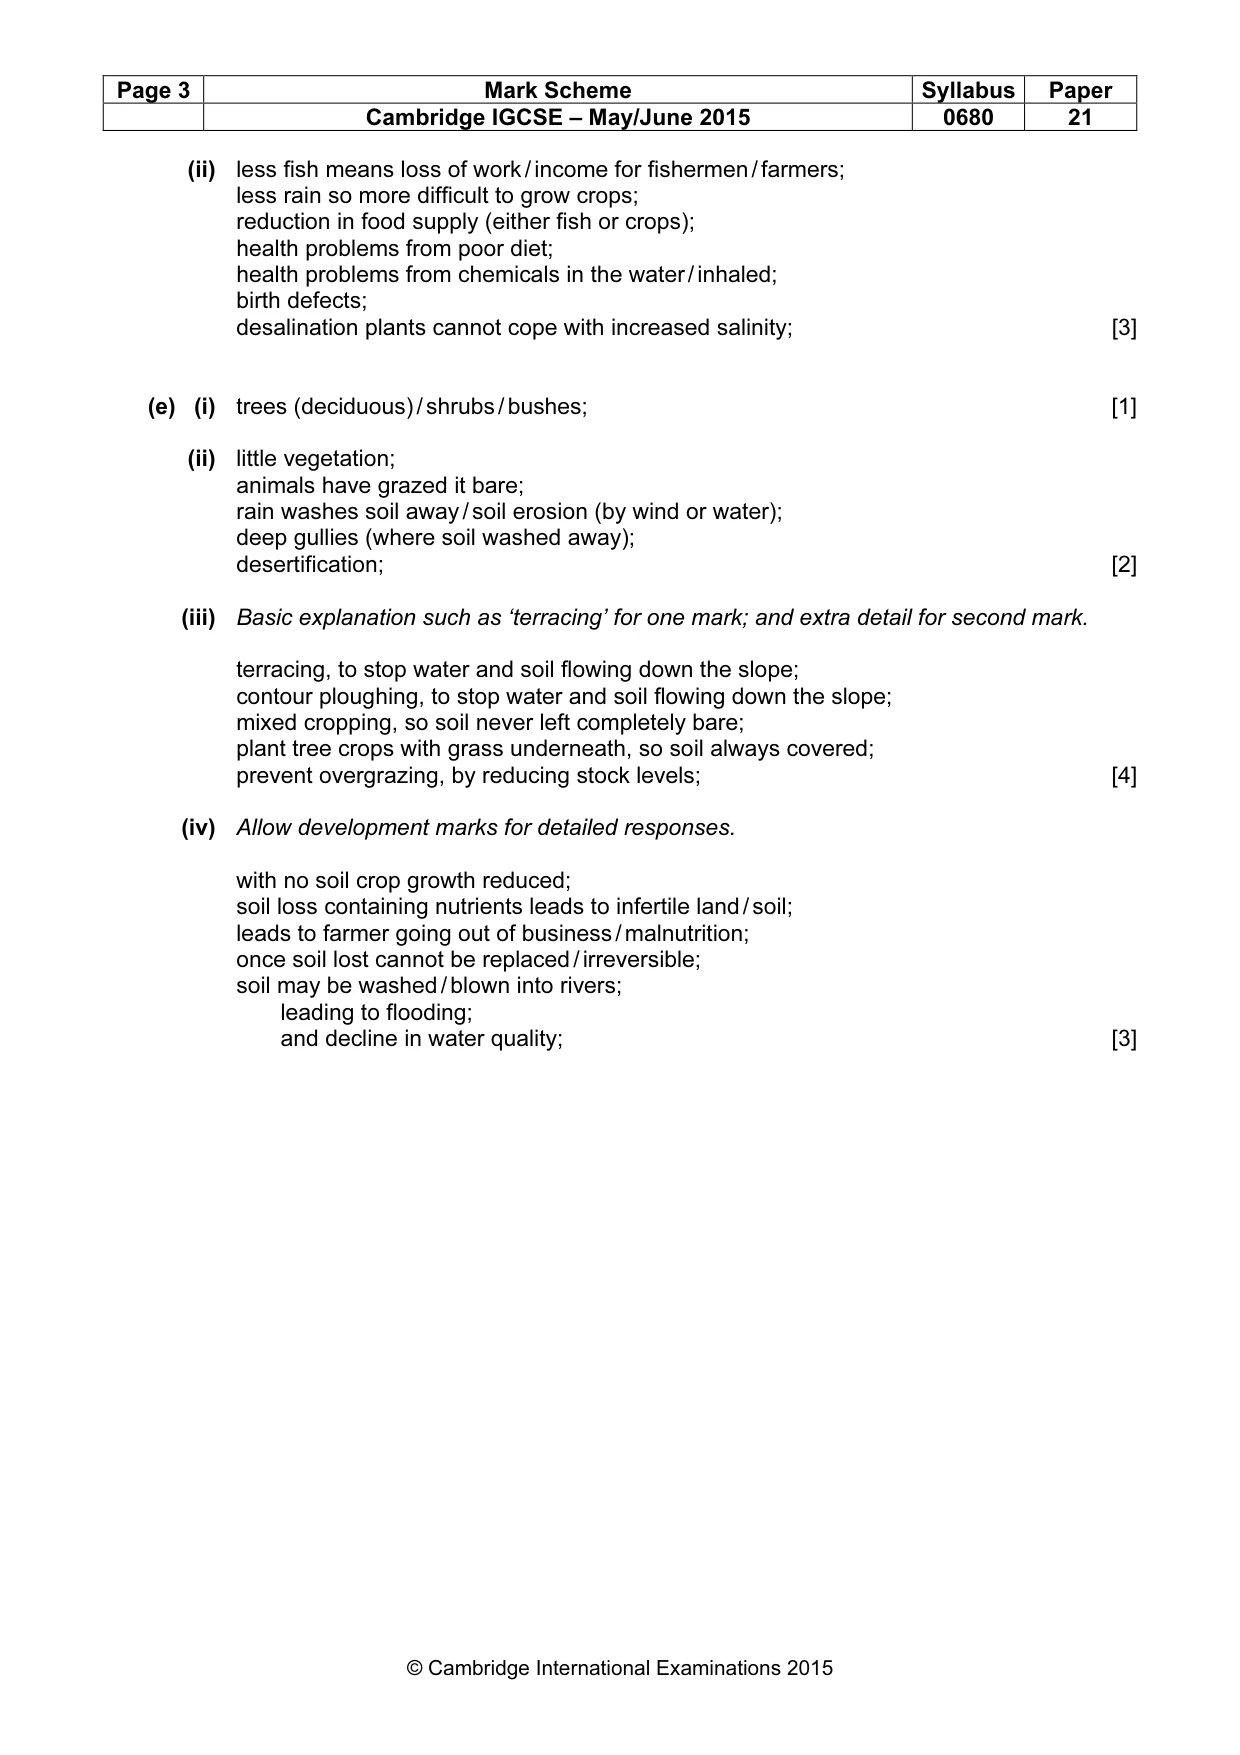
Page 3 Mark Scheme Syllabus Paper Cambridge IGCSE – May/June 2015 0680 21 © Cambridge International Examinations 2015 (ii) less fish means loss of work / income for fishermen / farmers; less rain so more difficult to grow crops; reduction in food supply (either fish or crops); health problems from poor diet; health problems from chemicals in the water / inhaled; birth defects; desalination plants cannot cope with increased salinity; [3] (e) (i) trees (deciduous) / shrubs / bushes; [1] (ii) little vegetation; animals have grazed it bare; rain washes soil away / soil erosion (by wind or water); deep gullies (where soil washed away); desertification; [2] (iii) Basic explanation such as ‘terracing’ for one mark; and extra detail for second mark. terracing, to stop water and soil flowing down the slope; contour ploughing, to stop water and soil flowing down the slope; mixed cropping, so soil never left completely bare; plant tree crops with grass underneath, so soil always covered; prevent overgrazing, by reducing stock levels; [4] (iv) Allow development marks for detailed responses. with no soil crop growth reduced; soil loss containing nutrients leads to infertile land / soil; leads to farmer going out of business / malnutrition; once soil lost cannot be replaced / irreversible; soil may be washed / blown into rivers; leading to flooding; and decline in water quality; [3]
Mark scheme, page 4
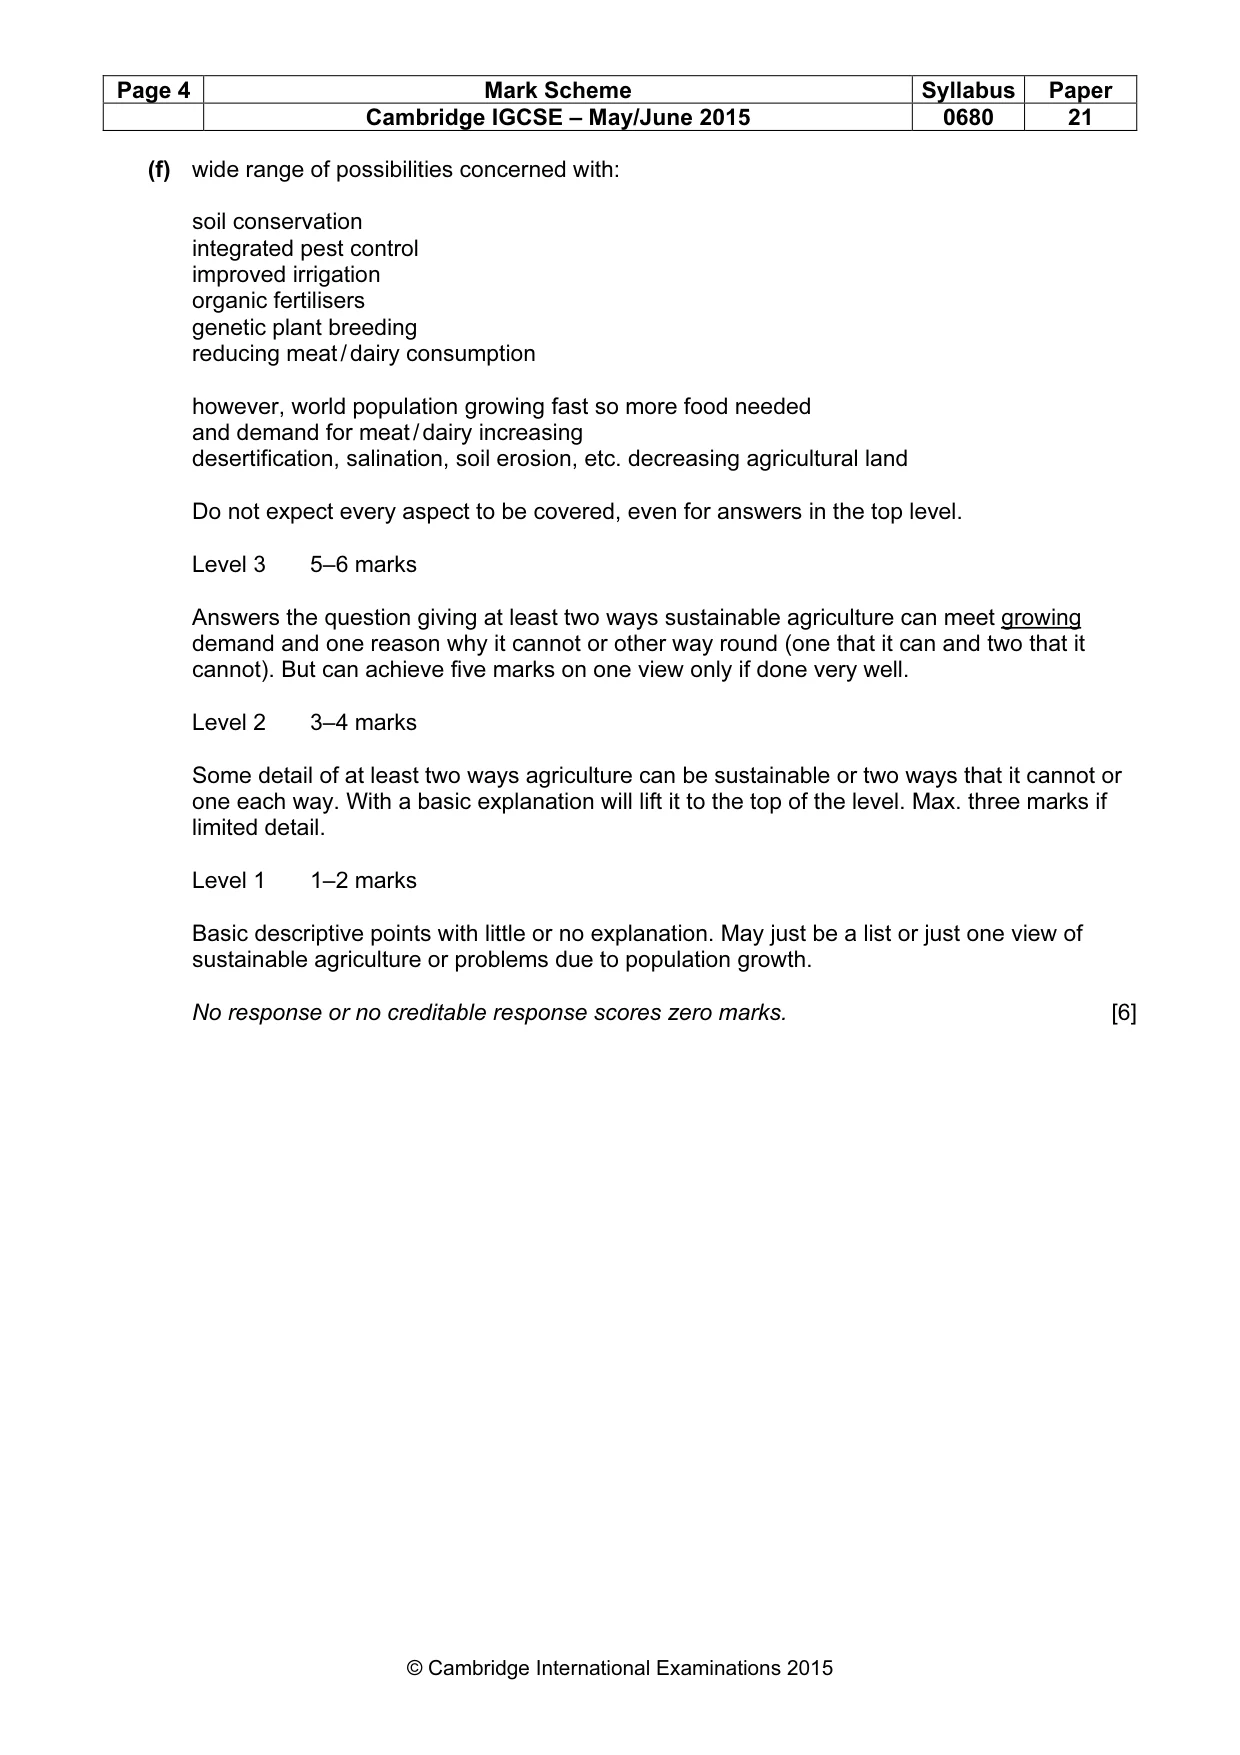
Page 4 Mark Scheme Syllabus Paper Cambridge IGCSE – May/June 2015 0680 21 © Cambridge International Examinations 2015 (f) wide range of possibilities concerned with: soil conservation integrated pest control improved irrigation organic fertilisers genetic plant breeding reducing meat / dairy consumption however, world population growing fast so more food needed and demand for meat / dairy increasing desertification, salination, soil erosion, etc. decreasing agricultural land Do not expect every aspect to be covered, even for answers in the top level. Level 3 5–6 marks Answers the question giving at least two ways sustainable agriculture can meet growing demand and one reason why it cannot or other way round (one that it can and two that it cannot). But can achieve five marks on one view only if done very well. Level 2 3–4 marks Some detail of at least two ways agriculture can be sustainable or two ways that it cannot or one each way. With a basic explanation will lift it to the top of the level. Max. three marks if limited detail. Level 1 1–2 marks Basic descriptive points with little or no explanation. May just be a list or just one view of sustainable agriculture or problems due to population growth. No response or no creditable response scores zero marks. [6]
Mark scheme, page 5
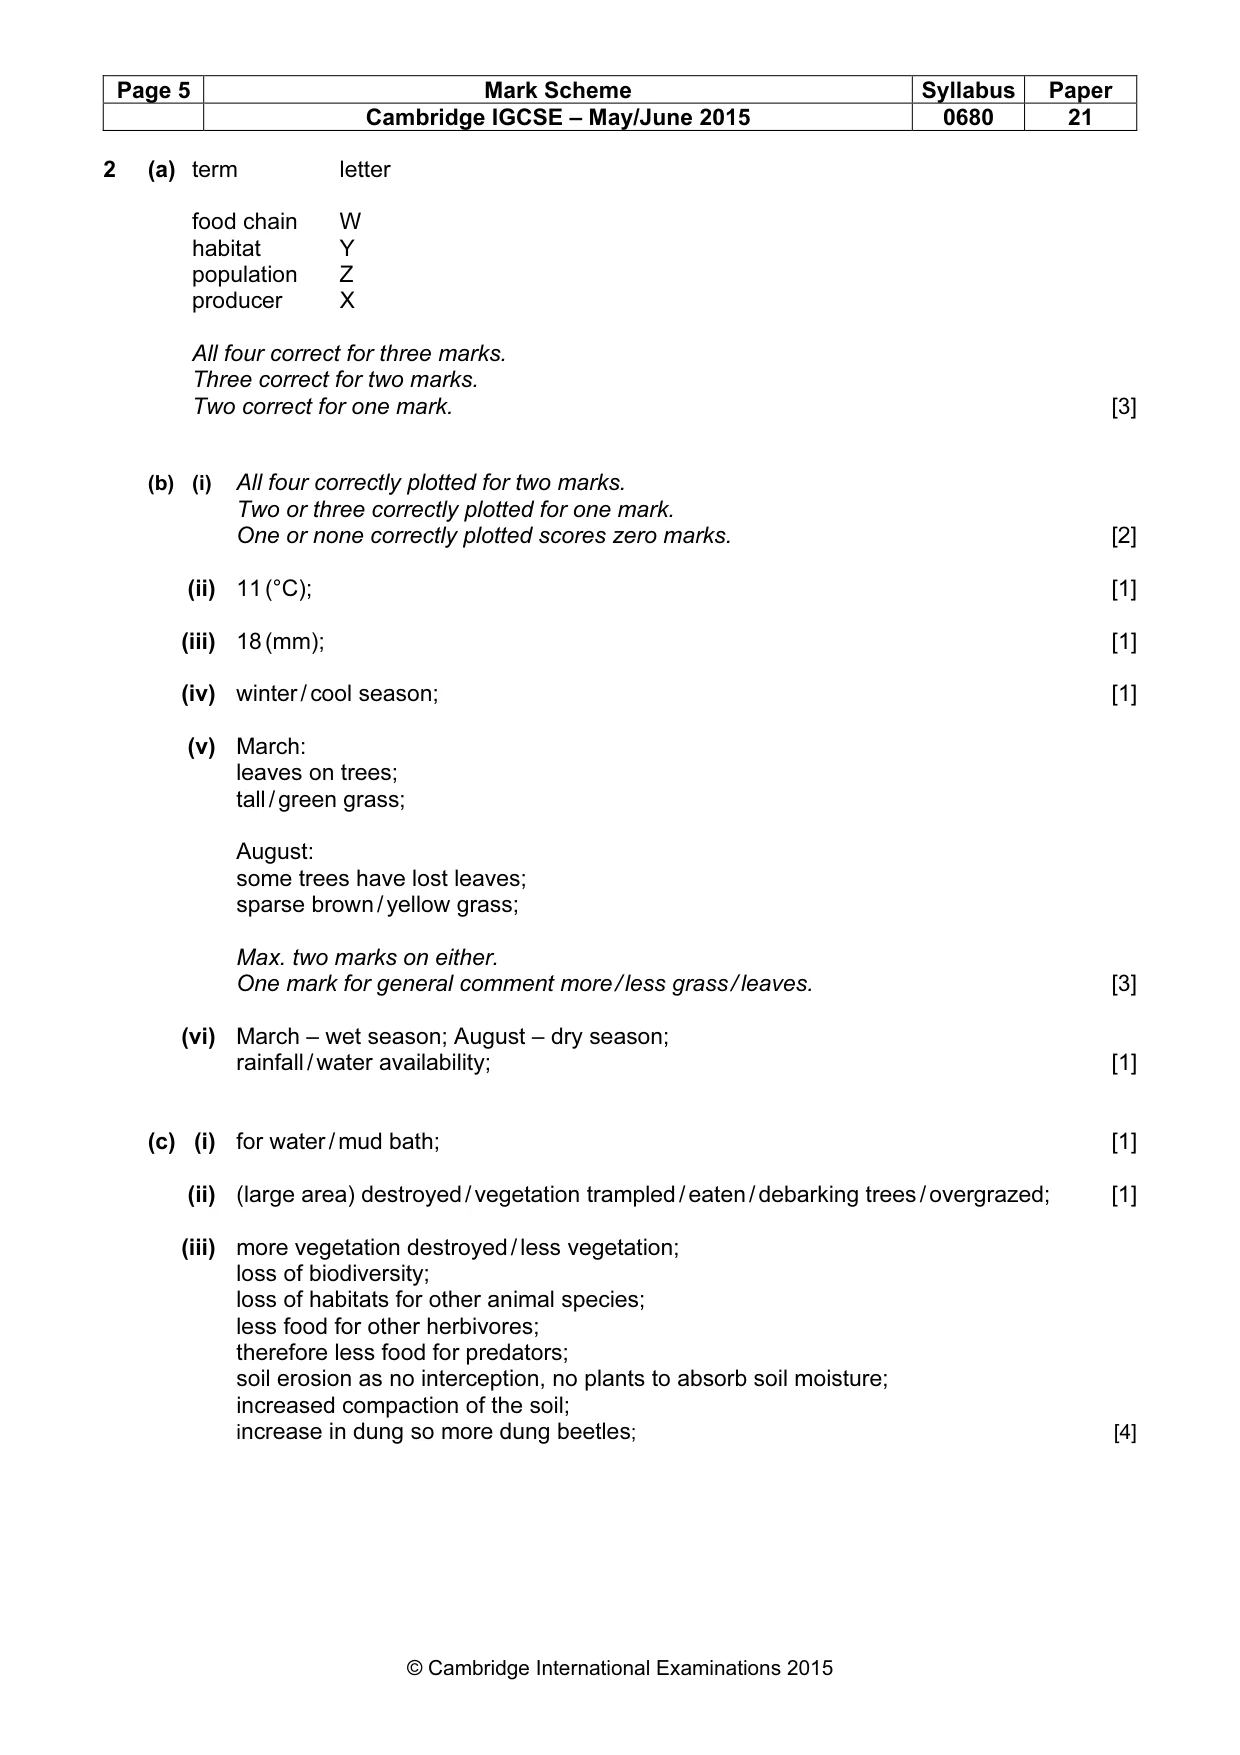
Page 5 Mark Scheme Syllabus Paper Cambridge IGCSE – May/June 2015 0680 21 © Cambridge International Examinations 2015 2 (a) term letter food chain W habitat Y population Z producer X All four correct for three marks. Three correct for two marks. Two correct for one mark. [3] (b) (i) All four correctly plotted for two marks. Two or three correctly plotted for one mark. One or none correctly plotted scores zero marks. [2] (ii) 11 (°C); [1] (iii) 18 (mm); [1] (iv) winter / cool season; [1] (v) March: leaves on trees; tall / green grass; August: some trees have lost leaves; sparse brown / yellow grass; Max. two marks on either. One mark for general comment more / less grass / leaves. [3] (vi) March – wet season; August – dry season; rainfall / water availability; [1] (c) (i) for water / mud bath; [1] (ii) (large area) destroyed / vegetation trampled / eaten / debarking trees / overgrazed; [1] (iii) more vegetation destroyed / less vegetation; loss of biodiversity; loss of habitats for other animal species; less food for other herbivores; therefore less food for predators; soil erosion as no interception, no plants to absorb soil moisture; increased compaction of the soil; increase in dung so more dung beetles; [4]
Mark scheme, page 6
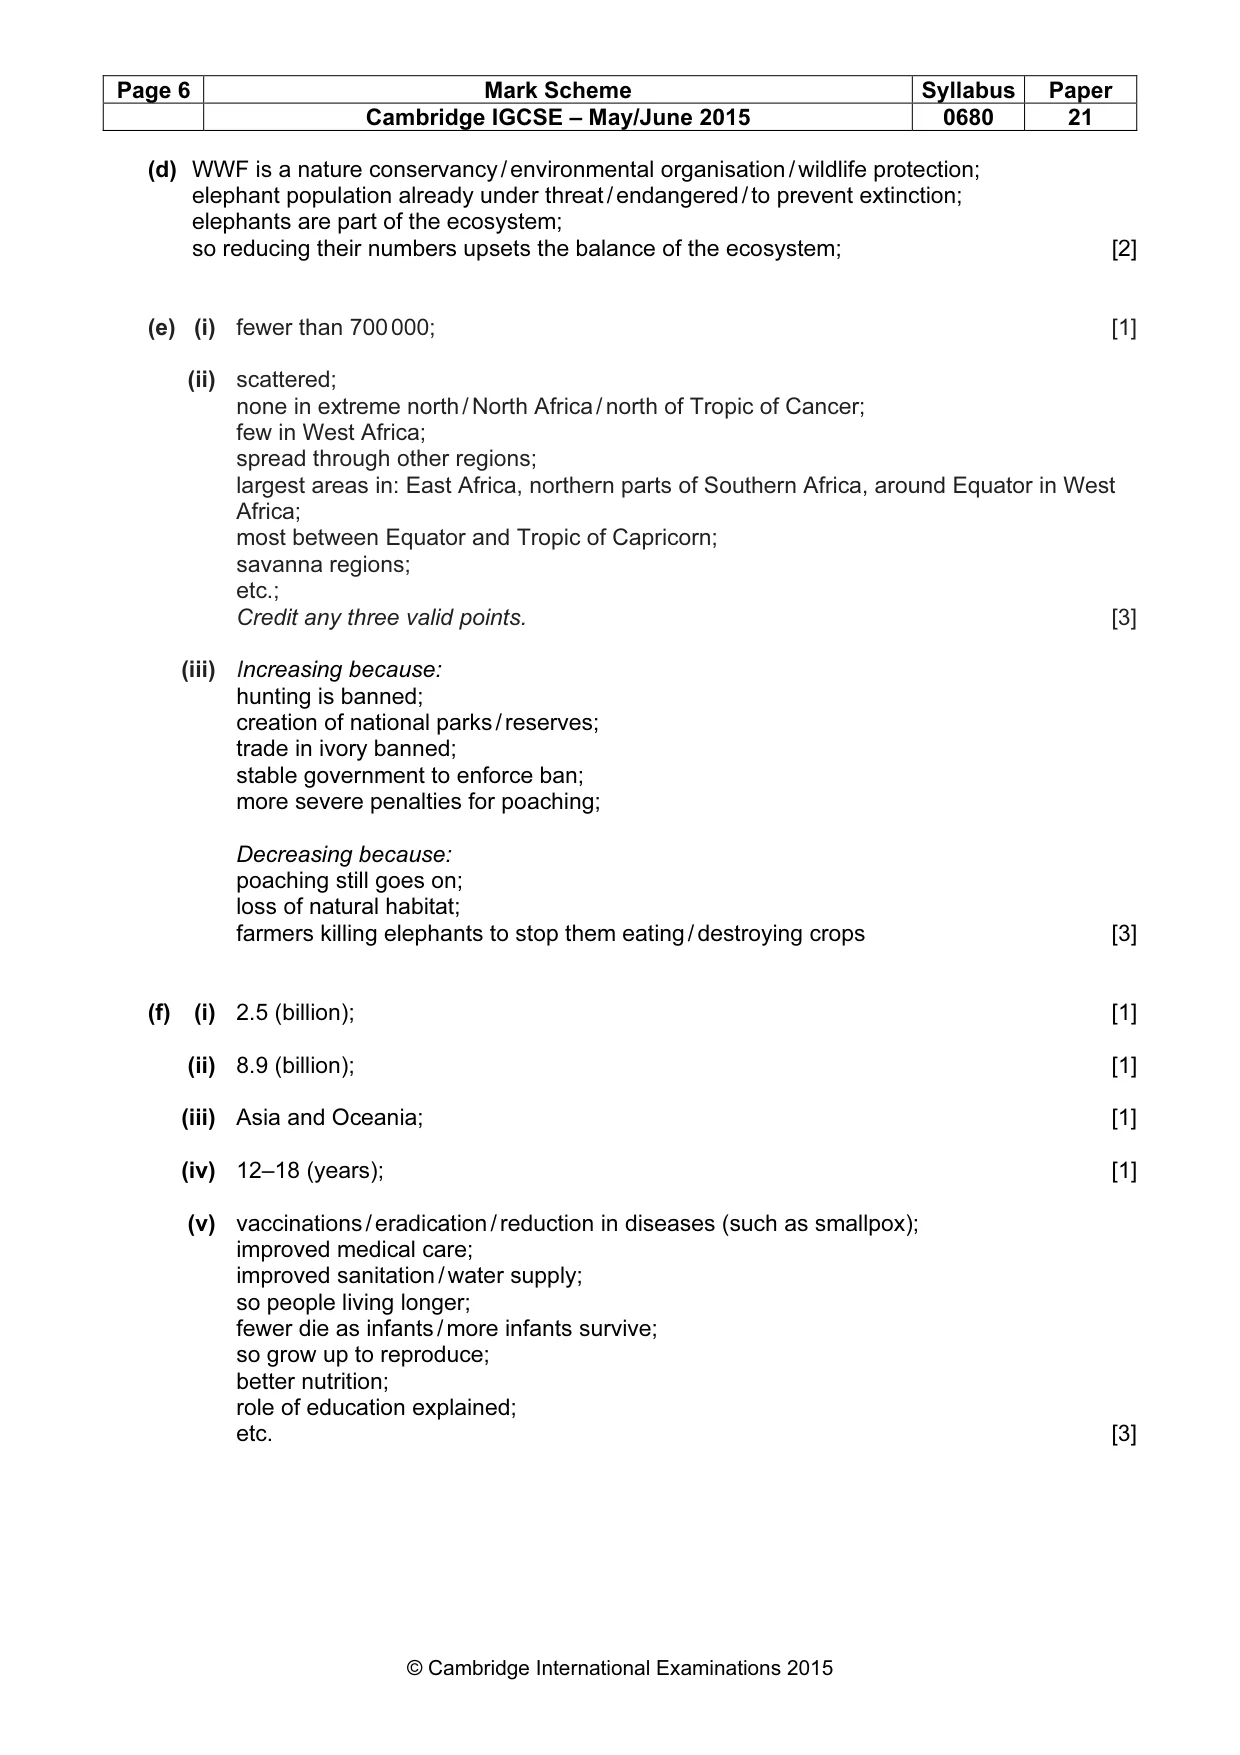
Page 6 Mark Scheme Syllabus Paper Cambridge IGCSE – May/June 2015 0680 21 © Cambridge International Examinations 2015 (d) WWF is a nature conservancy / environmental organisation / wildlife protection; elephant population already under threat / endangered / to prevent extinction; elephants are part of the ecosystem; so reducing their numbers upsets the balance of the ecosystem; [2] (e) (i) fewer than 700 000; [1] (ii) scattered; none in extreme north / North Africa / north of Tropic of Cancer; few in West Africa; spread through other regions; largest areas in: East Africa, northern parts of Southern Africa, around Equator in West Africa; most between Equator and Tropic of Capricorn; savanna regions; etc.; Credit any three valid points. [3] (iii) Increasing because: hunting is banned; creation of national parks / reserves; trade in ivory banned; stable government to enforce ban; more severe penalties for poaching; Decreasing because: poaching still goes on; loss of natural habitat; farmers killing elephants to stop them eating / destroying crops [3] (f) (i) 2.5 (billion); [1] (ii) 8.9 (billion); [1] (iii) Asia and Oceania; [1] (iv) 12–18 (years); [1] (v) vaccinations / eradication / reduction in diseases (such as smallpox); improved medical care; improved sanitation / water supply; so people living longer; fewer die as infants / more infants survive; so grow up to reproduce; better nutrition; role of education explained; etc. [3]
Mark scheme, page 7
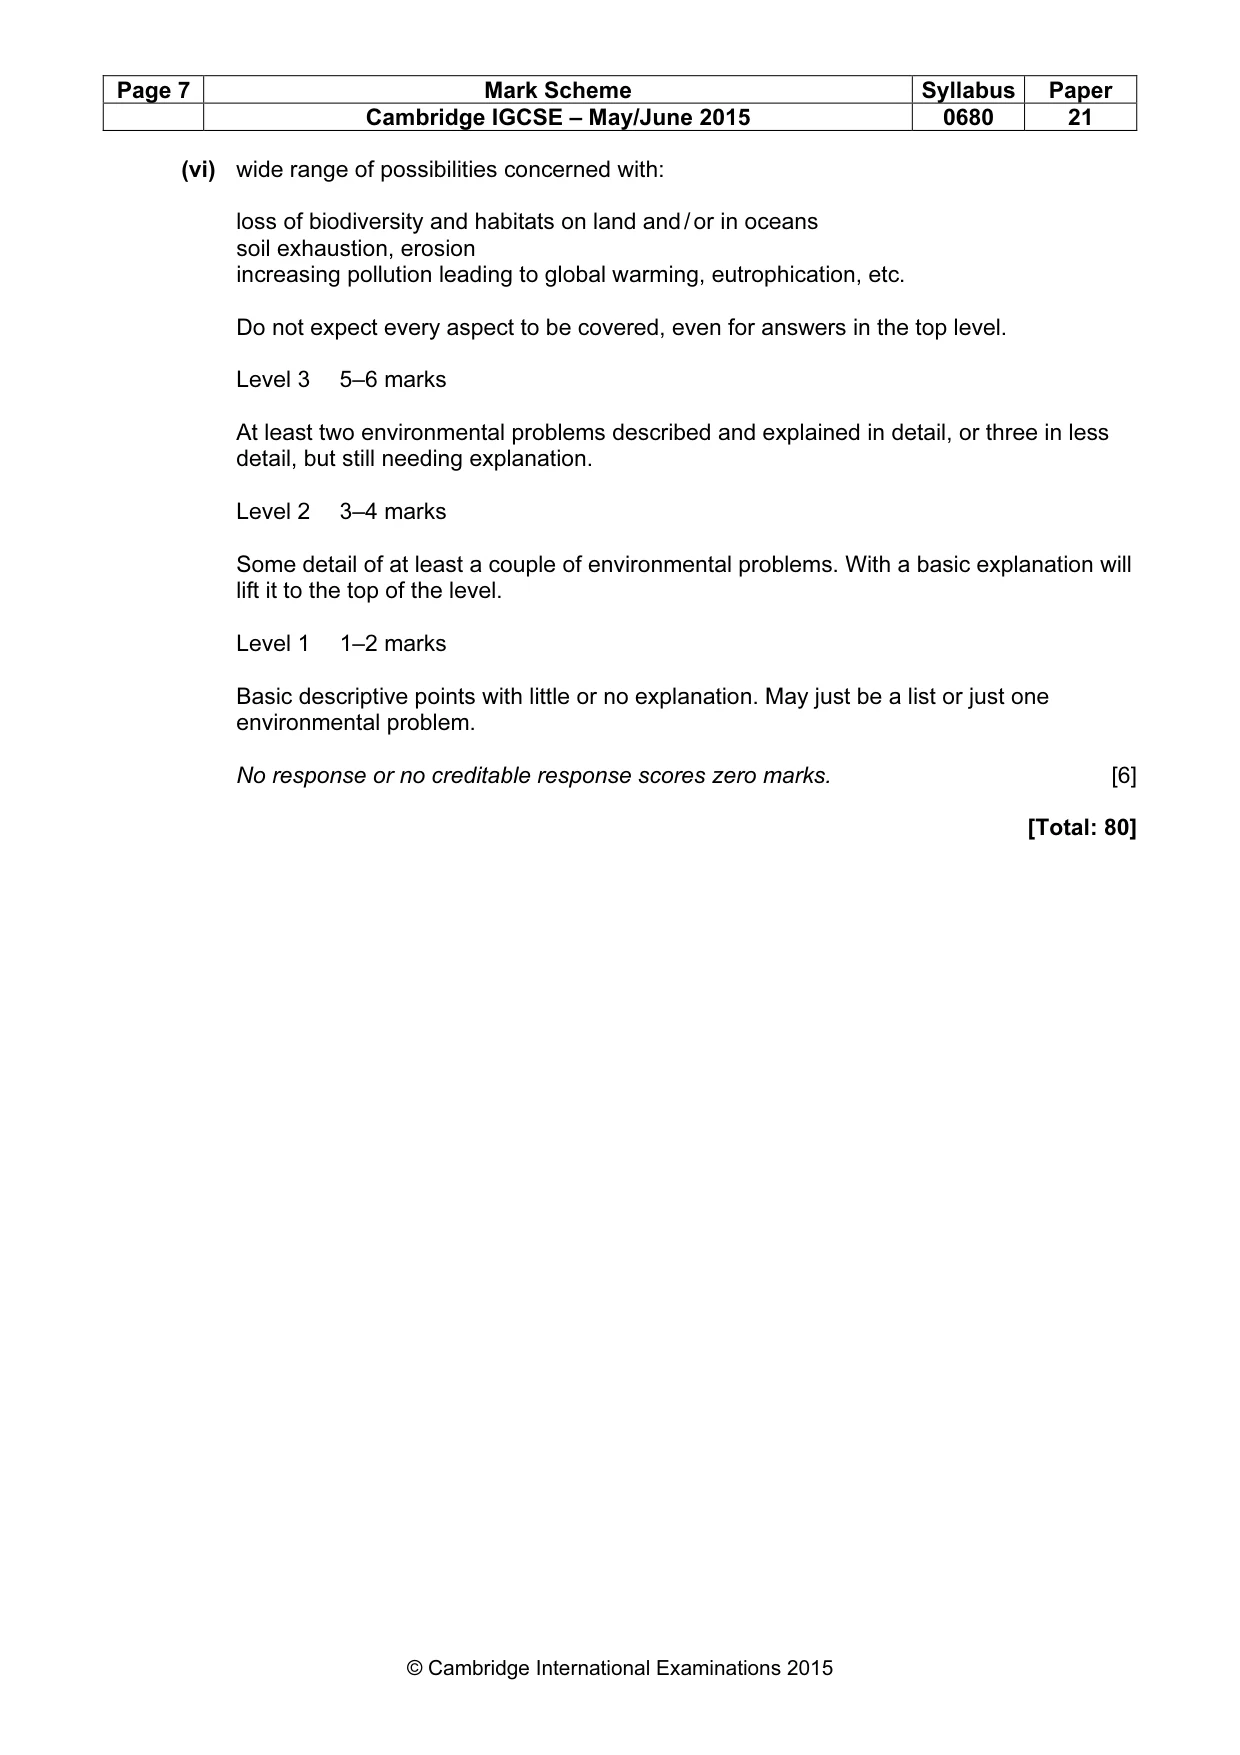
Page 7 Mark Scheme Syllabus Paper Cambridge IGCSE – May/June 2015 0680 21 © Cambridge International Examinations 2015 (vi) wide range of possibilities concerned with: loss of biodiversity and habitats on land and / or in oceans soil exhaustion, erosion increasing pollution leading to global warming, eutrophication, etc. Do not expect every aspect to be covered, even for answers in the top level. Level 3 5–6 marks At least two environmental problems described and explained in detail, or three in less detail, but still needing explanation. Level 2 3–4 marks Some detail of at least a couple of environmental problems. With a basic explanation will lift it to the top of the level. Level 1 1–2 marks Basic descriptive points with little or no explanation. May just be a list or just one environmental problem. No response or no creditable response scores zero marks. [6] [Total: 80]
What you needed in this session
Cambridge’s own grade thresholds for 2015 May/June, Paper 2 · Variant 1. A higher threshold means an easier paper — the bar moves with how the cohort did.