Cambridge IGCSE Environmental Management 0680 — 2015 Feb/March Paper 2 · Variant 2
0680/22/F/M/15 · 80 marks · ≈90 min
The question paper and its mark scheme, free to read here and free to download. This is Cambridge’s own paper, exactly as it was sat.
Question paper16 pages

Mark scheme6 pages
Answers below. Sit the paper first if you are practising.
Paper as text
Question paper, page 1
This document consists of 14 printed pages and 2 blank pages. DC (LEG/SW) 96805/4 © UCLES 2015 [Turn over Cambridge International Examinations Cambridge International General Certificate of Secondary Education * 7 8 4 3 1 9 1 7 0 5 * ENVIRONMENTAL MANAGEMENT 0680/22 Paper 2 February/March 2015 1 hour 45 minutes Candidates answer on the Question Paper. No Additional Materials are required. READ THESE INSTRUCTIONS FIRST Write your Centre number, candidate number and name on all the work you hand in. Write in dark blue or black pen. You may use an HB pencil for any diagrams or graphs. Do not use staples, paper clips, glue or correction fluid. DO NOT WRITE IN ANY BARCODES. Answer both questions. Electronic calculators may be used. You may lose marks if you do not show your working or if you do not use appropriate units. At the end of the examination, fasten all your work securely together. The number of marks is given in brackets [ ] at the end of each question or part question.
Question paper, page 2
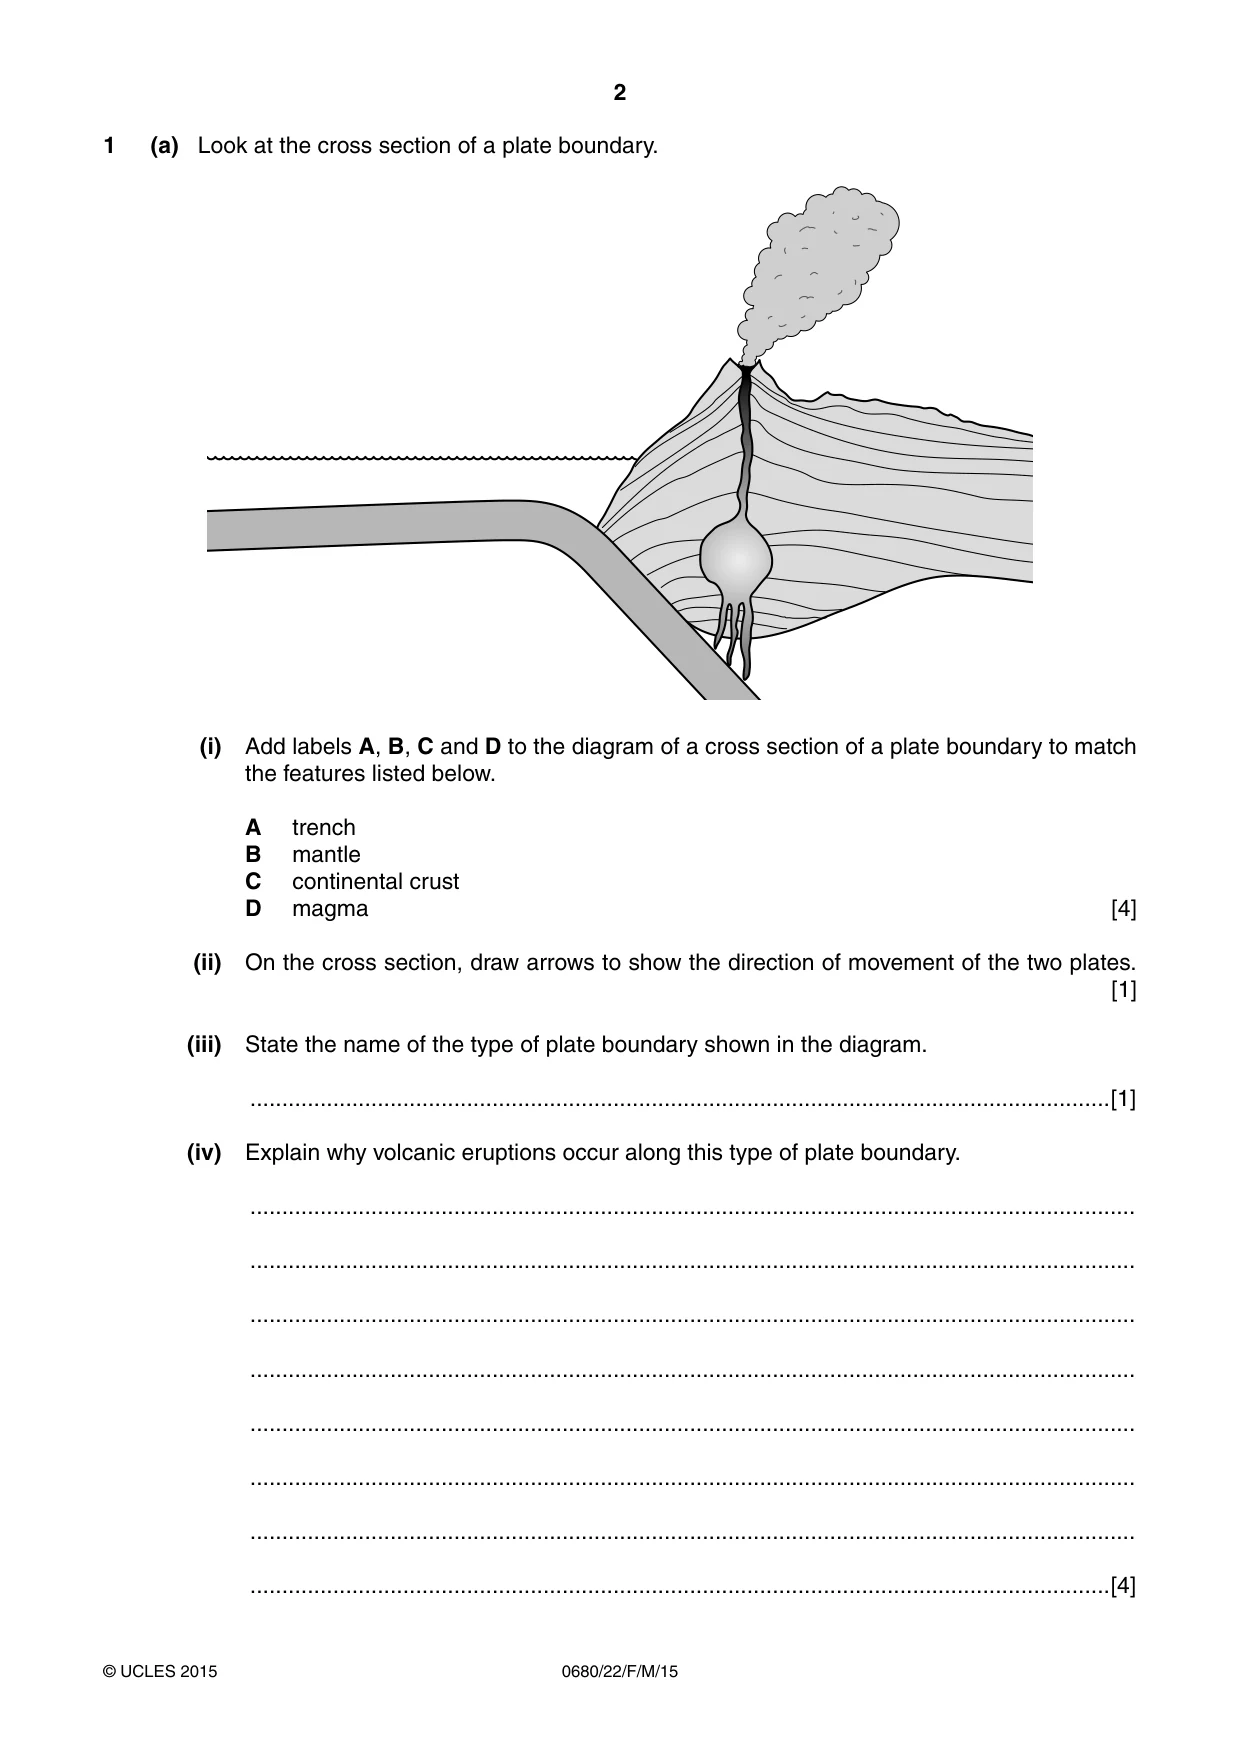
2 0680/22/F/M/15 © UCLES 2015 1 (a) Look at the cross section of a plate boundary. (i) Add labels A, B, C and D to the diagram of a cross section of a plate boundary to match the features listed below. A trench B mantle C continental crust D magma [4] (ii) On the cross section, draw arrows to show the direction of movement of the two plates. [1] (iii) State the name of the type of plate boundary shown in the diagram. …[1] (iv) Explain why volcanic eruptions occur along this type of plate boundary. … … … … … … … …[4]
Question paper, page 3
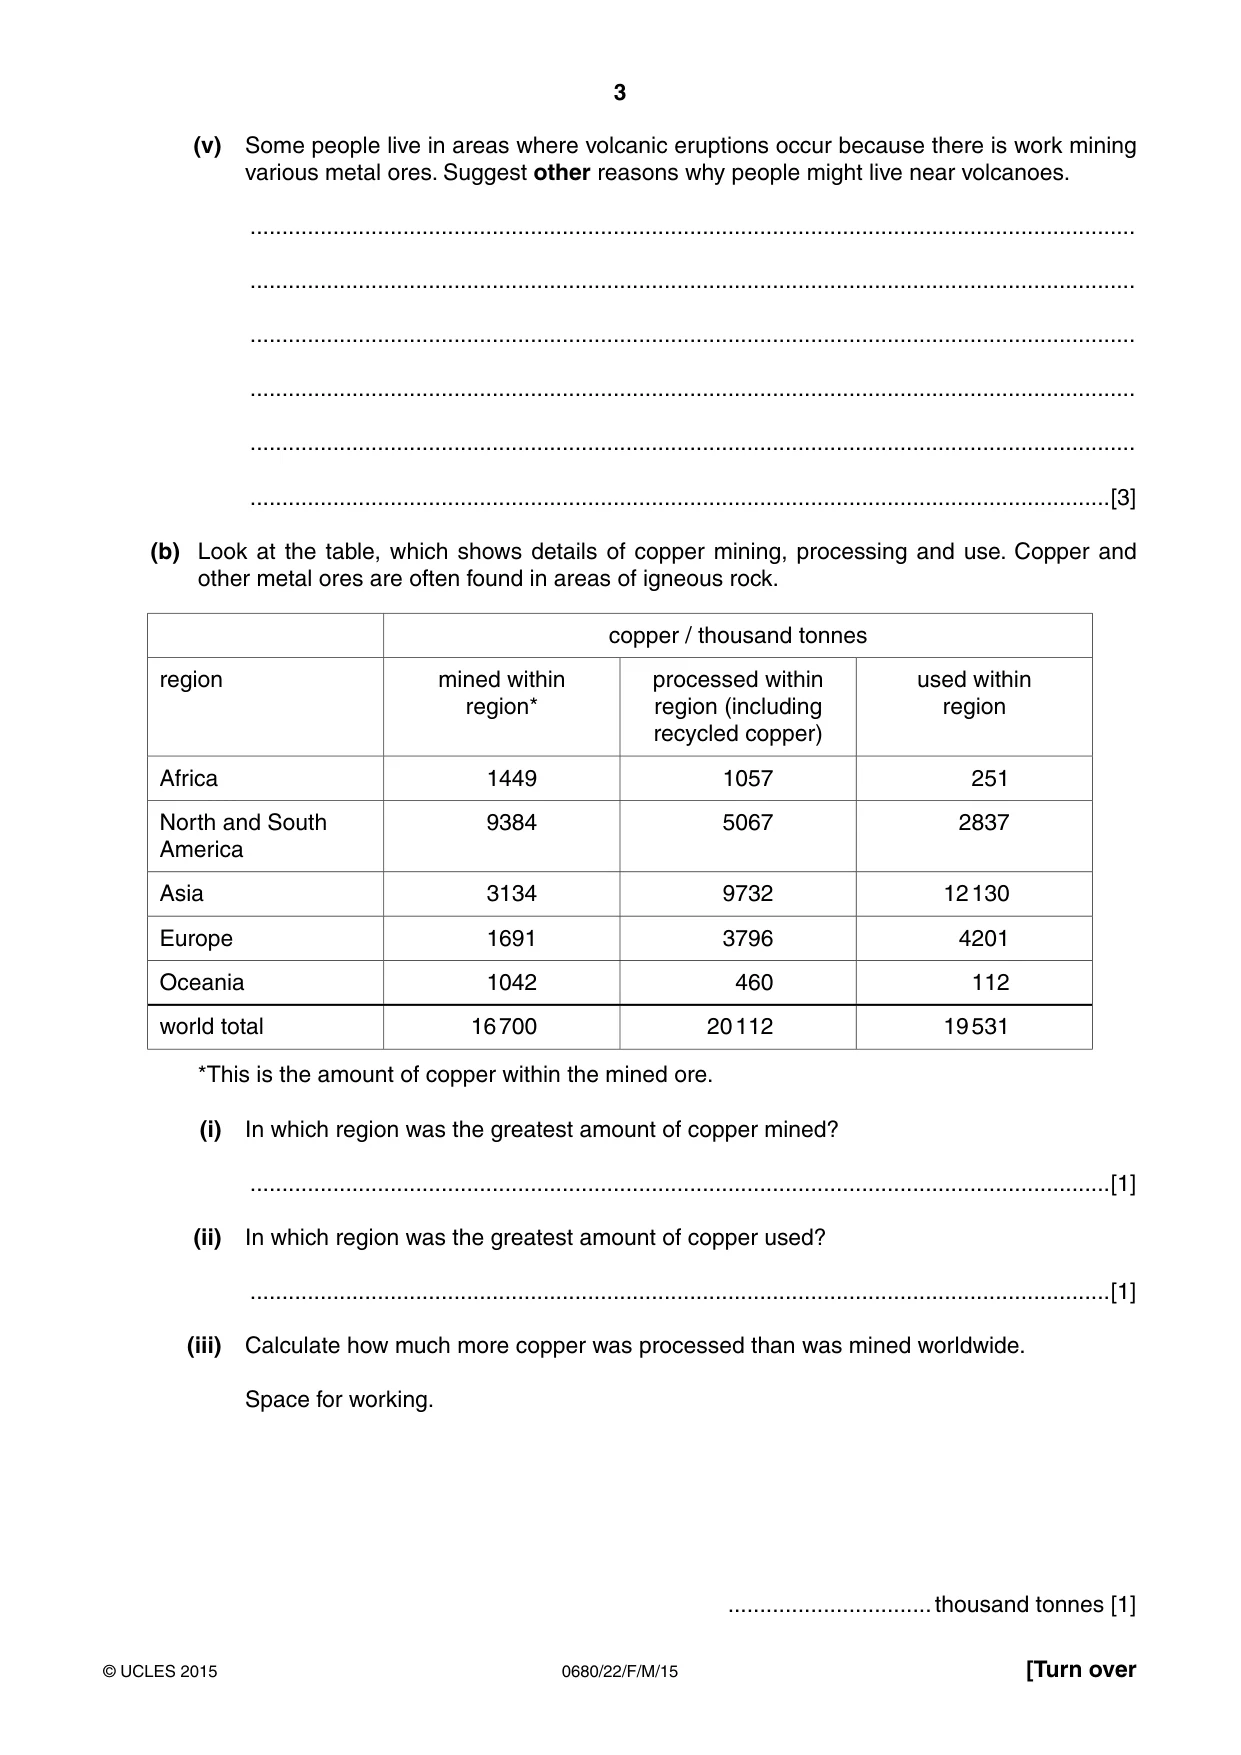
3 0680/22/F/M/15 © UCLES 2015 [Turn over (v) Some people live in areas where volcanic eruptions occur because there is work mining various metal ores. Suggest other reasons why people might live near volcanoes. … … … … … …[3] (b) Look at the table, which shows details of copper mining, processing and use. Copper and other metal ores are often found in areas of igneous rock. copper / thousand tonnes region mined within region* processed within region (including recycled copper) used within region Africa 1449 1057 251 North and South America 9384 5067 2837 Asia 3134 9732 12 130 Europe 1691 3796 4201 Oceania 1042 460 112 world total 16 700 20 112 19 531 *This is the amount of copper within the mined ore. (i) In which region was the greatest amount of copper mined? …[1] (ii) In which region was the greatest amount of copper used? …[1] (iii) Calculate how much more copper was processed than was mined worldwide. Space for working. …thousand tonnes [1]
Question paper, page 4
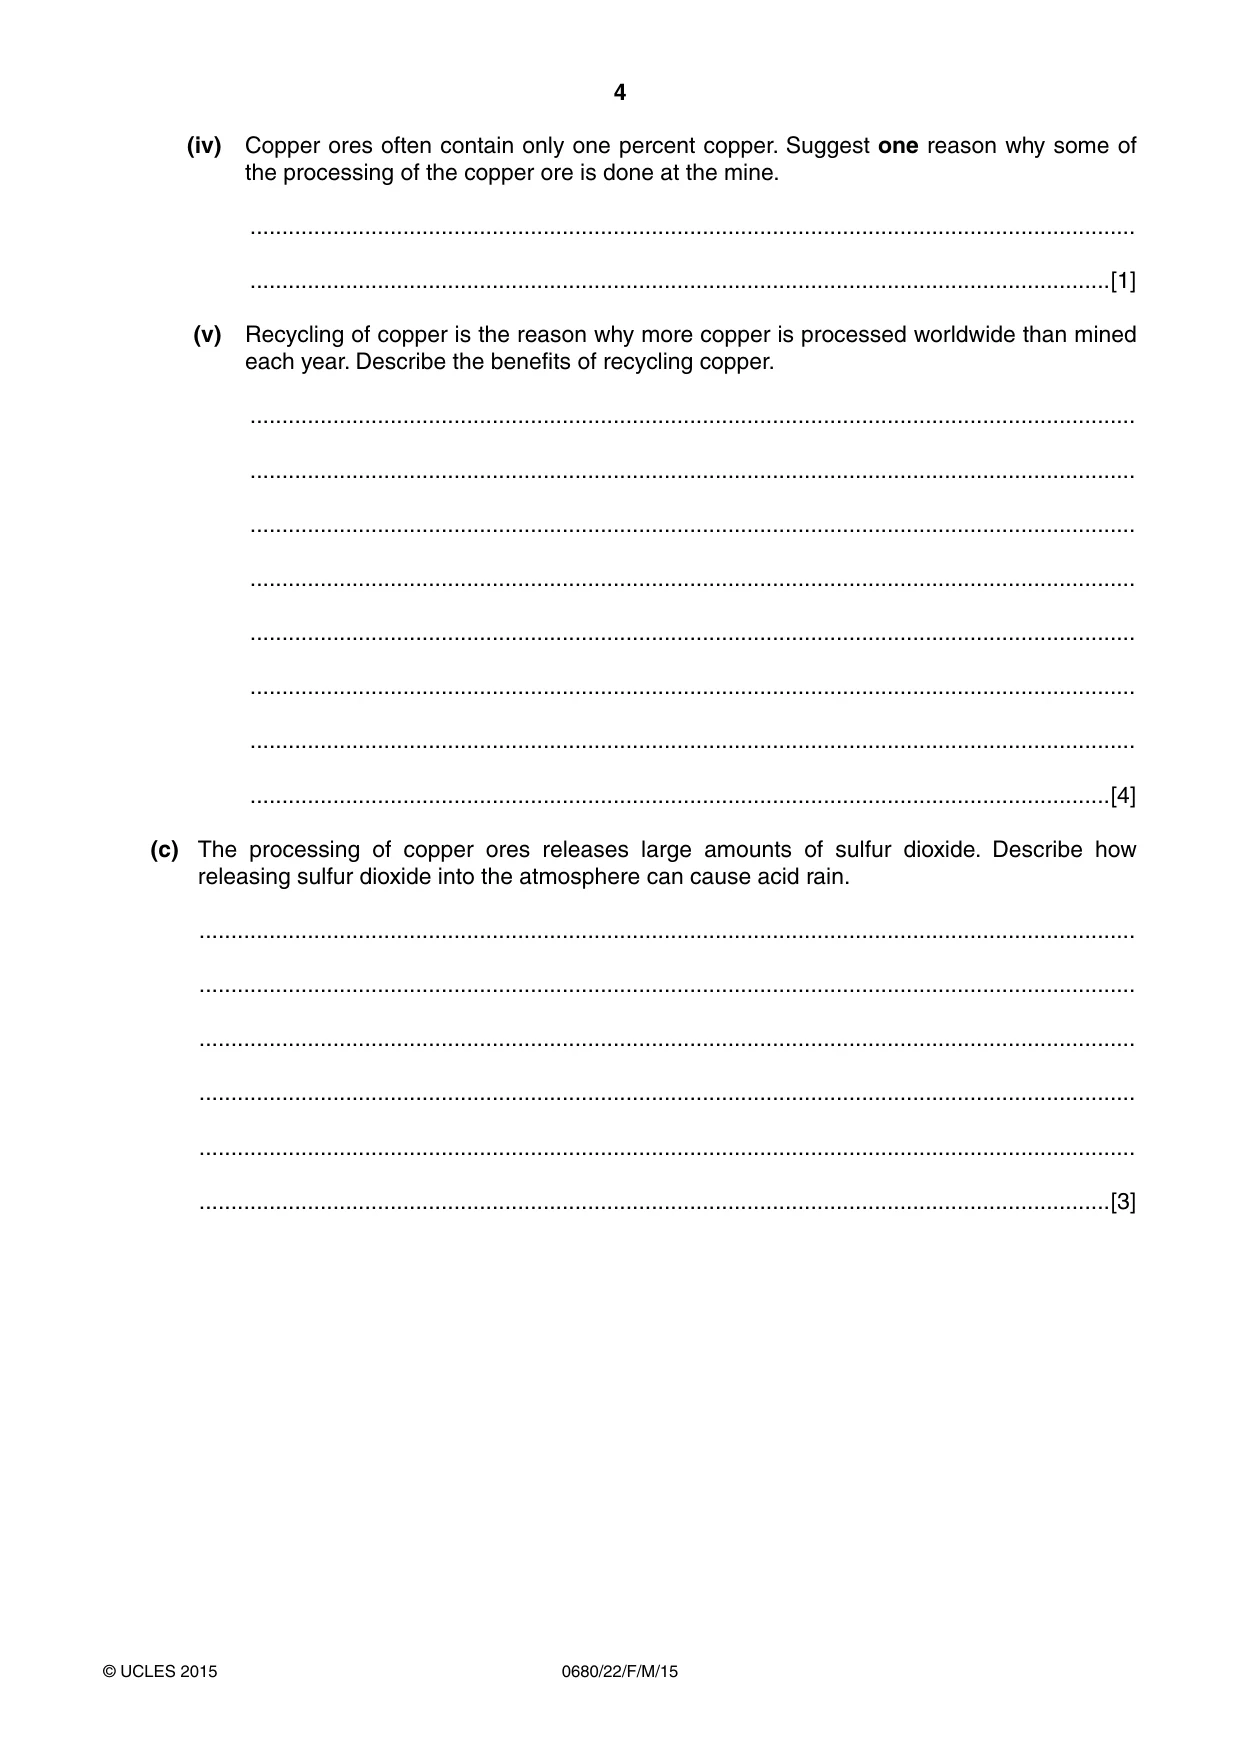
4 0680/22/F/M/15 © UCLES 2015 (iv) Copper ores often contain only one percent copper. Suggest one reason why some of the processing of the copper ore is done at the mine. … …[1] (v) Recycling of copper is the reason why more copper is processed worldwide than mined each year. Describe the benefits of recycling copper. … … … … … … … …[4] (c) The processing of copper ores releases large amounts of sulfur dioxide. Describe how releasing sulfur dioxide into the atmosphere can cause acid rain. … … … … … …[3]
Question paper, page 5
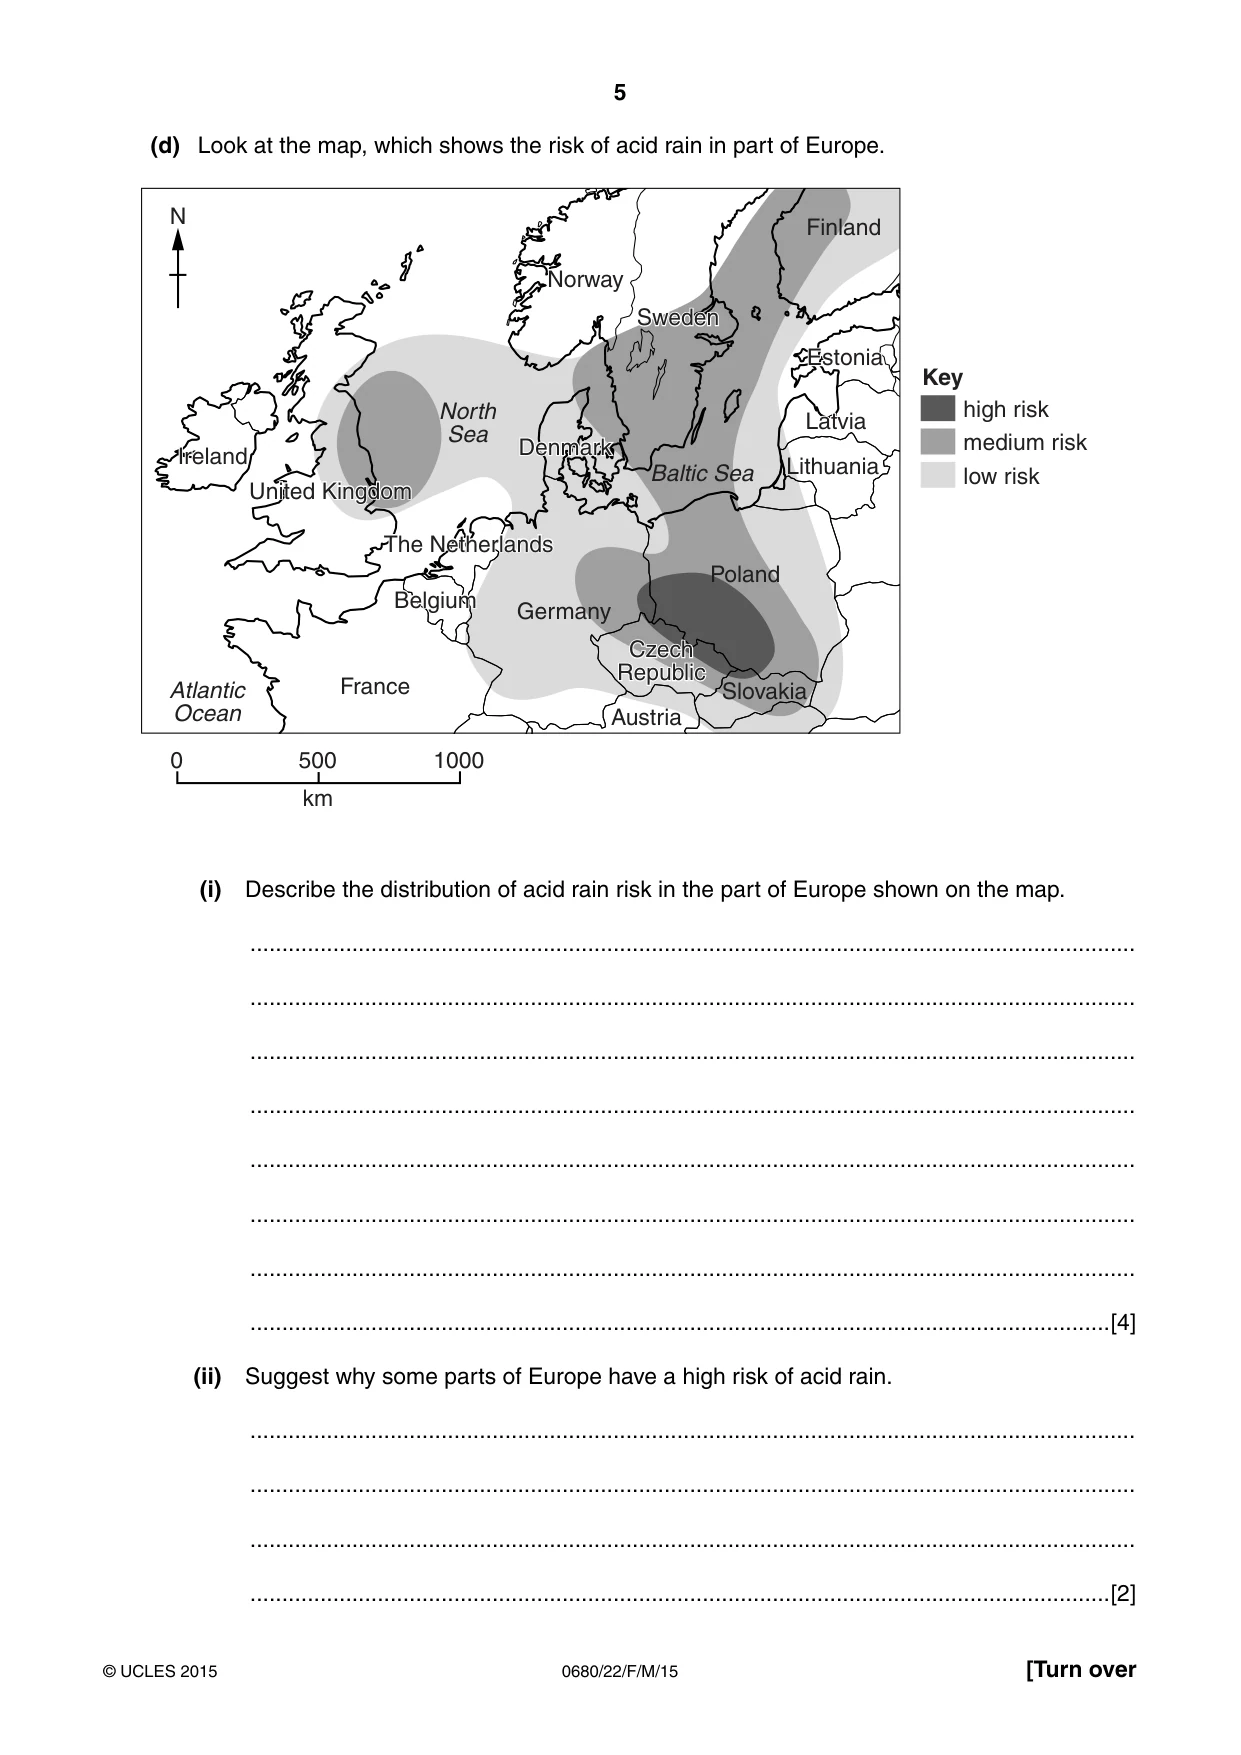
5 0680/22/F/M/15 © UCLES 2015 [Turn over (d) Look at the map, which shows the risk of acid rain in part of Europe. N North Sea Baltic Sea Atlantic Ocean Ireland France Austria Slovakia Poland Lithuania Finland United Kingdom Belgium Czech Republic Latvia Estonia Sweden Denmark Norway The Netherlands Germany high risk medium risk low risk Key 0 500 1000 km (i) Describe the distribution of acid rain risk in the part of Europe shown on the map. … … … … … … … …[4] (ii) Suggest why some parts of Europe have a high risk of acid rain. … … … …[2]
Question paper, page 6
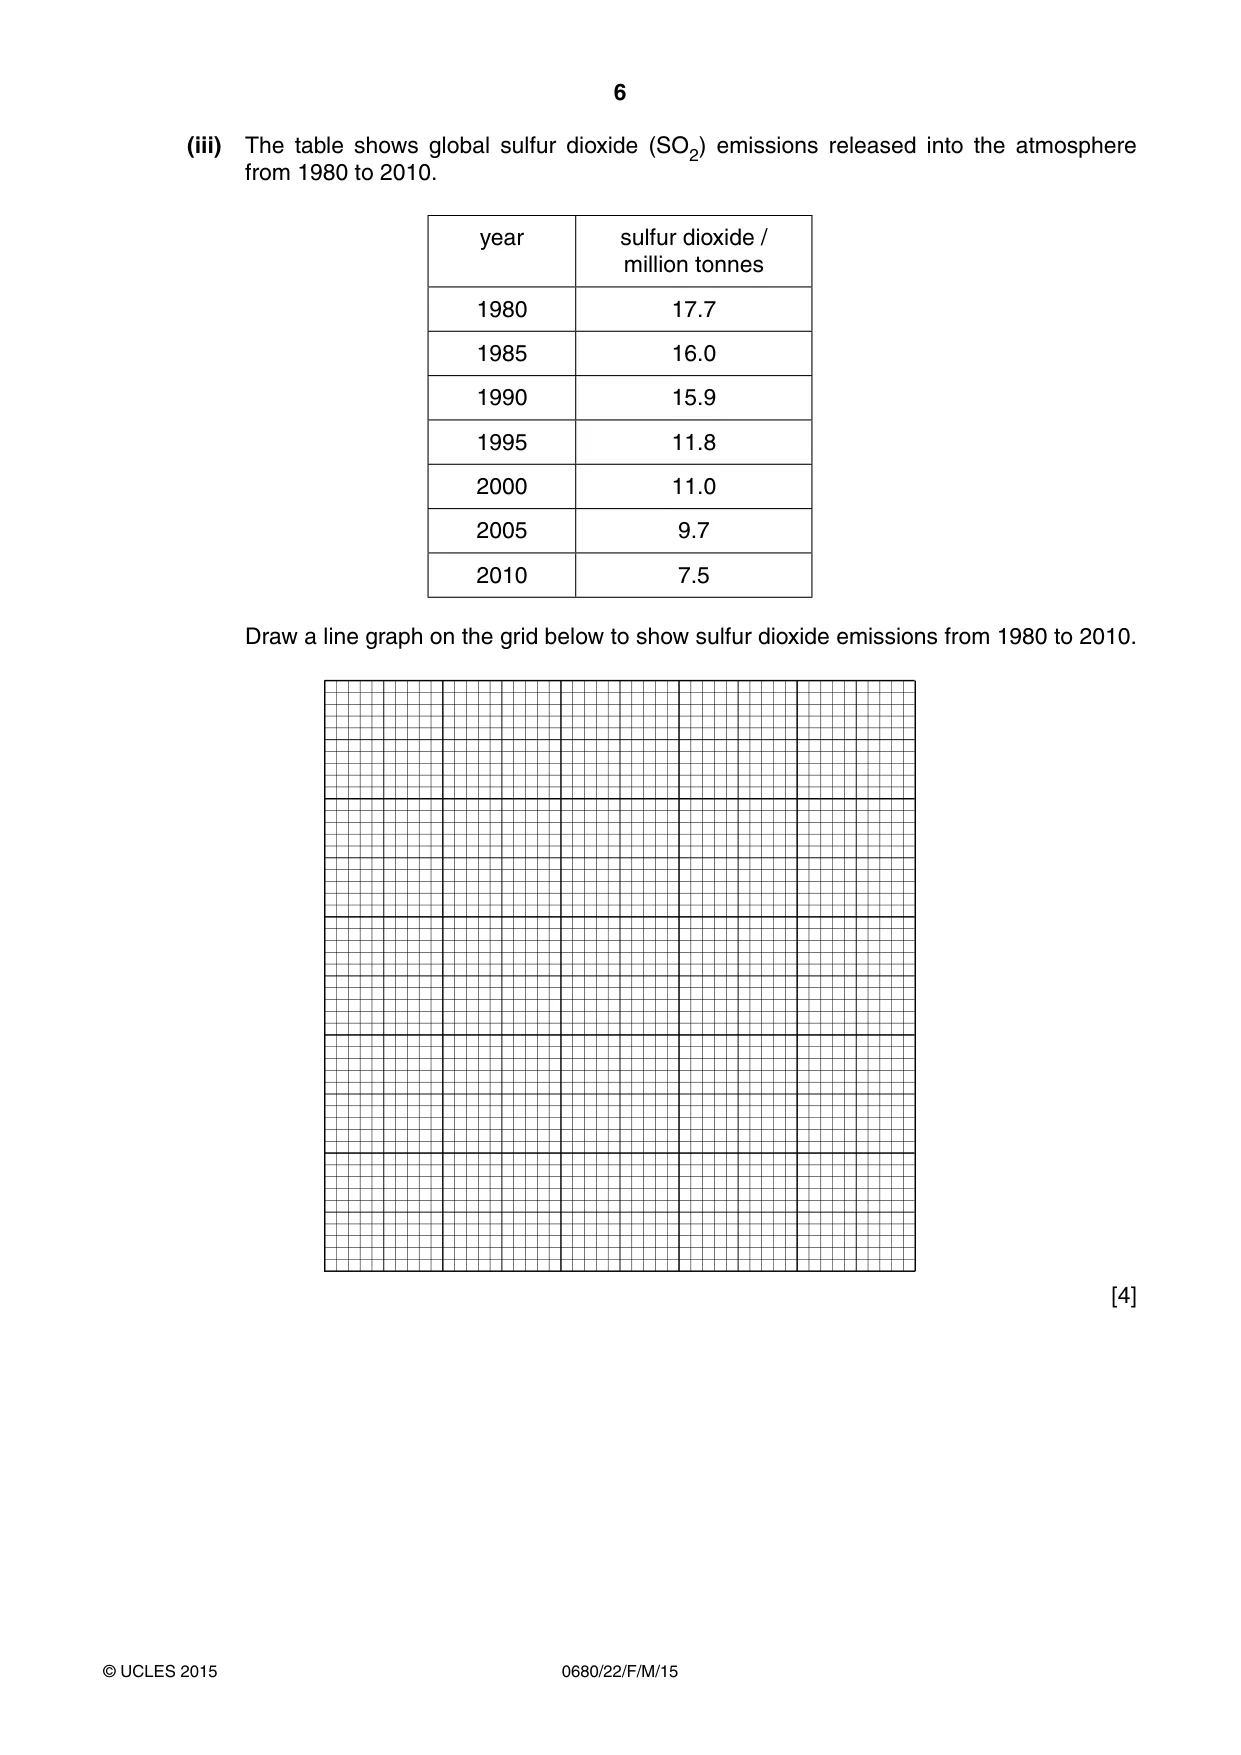
6 0680/22/F/M/15 © UCLES 2015 (iii) The table shows global sulfur dioxide (SO2) emissions released into the atmosphere from 1980 to 2010. year sulfur dioxide / million tonnes 1980 17.7 1985 16.0 1990 15.9 1995 11.8 2000 11.0 2005 9.7 2010 7.5 Draw a line graph on the grid below to show sulfur dioxide emissions from 1980 to 2010. [4]
Question paper, page 7
7 0680/22/F/M/15 © UCLES 2015 [Turn over (iv) Describe the effects of acid rain and suggest how these effects may be reduced. … … … … … … … … … … … …[6]
Question paper, page 8
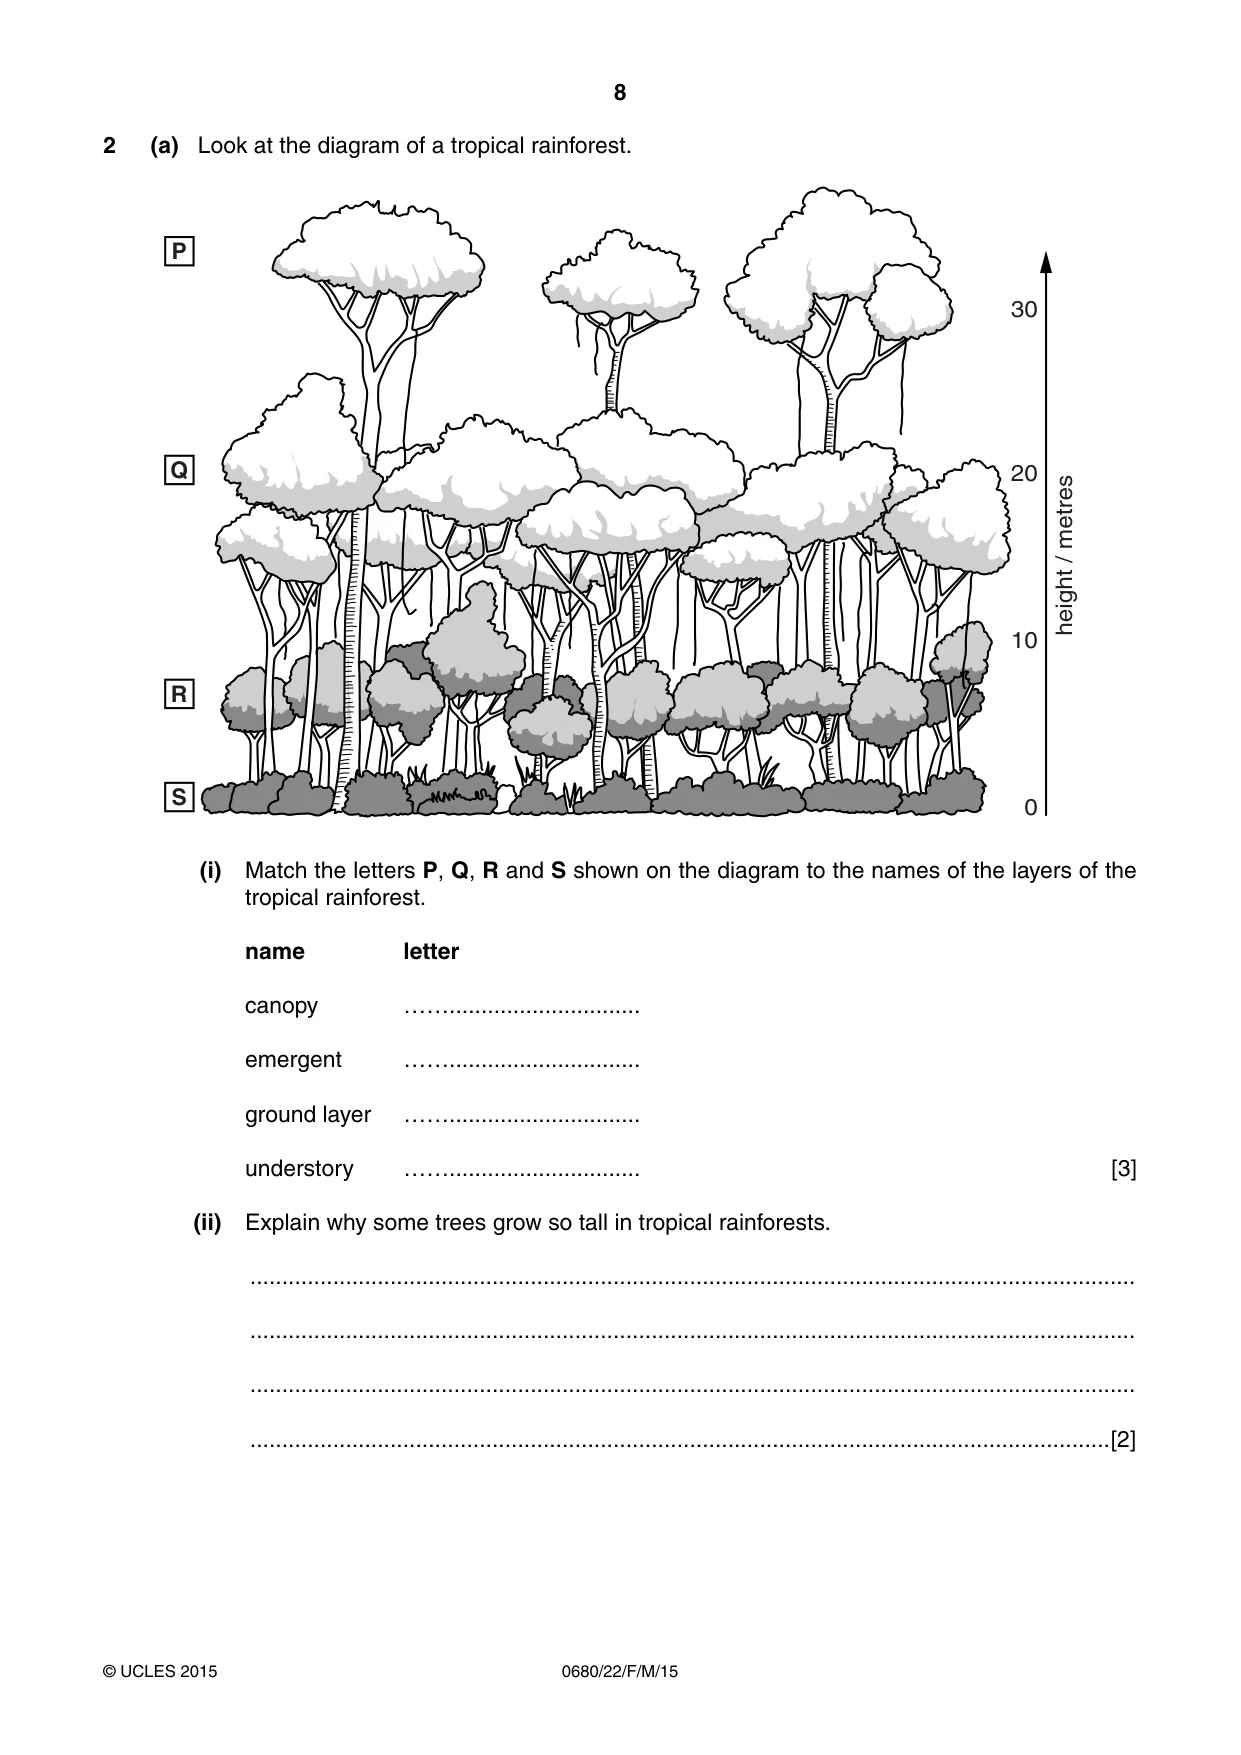
8 0680/22/F/M/15 © UCLES 2015 2 (a) Look at the diagram of a tropical rainforest. S R Q P 30 20 10 height / metres 0 (i) Match the letters P, Q, R and S shown on the diagram to the names of the layers of the tropical rainforest. name letter canopy ……… emergent ……… ground layer ……… understory ……… [3] (ii) Explain why some trees grow so tall in tropical rainforests. … … … …[2]
Question paper, page 9
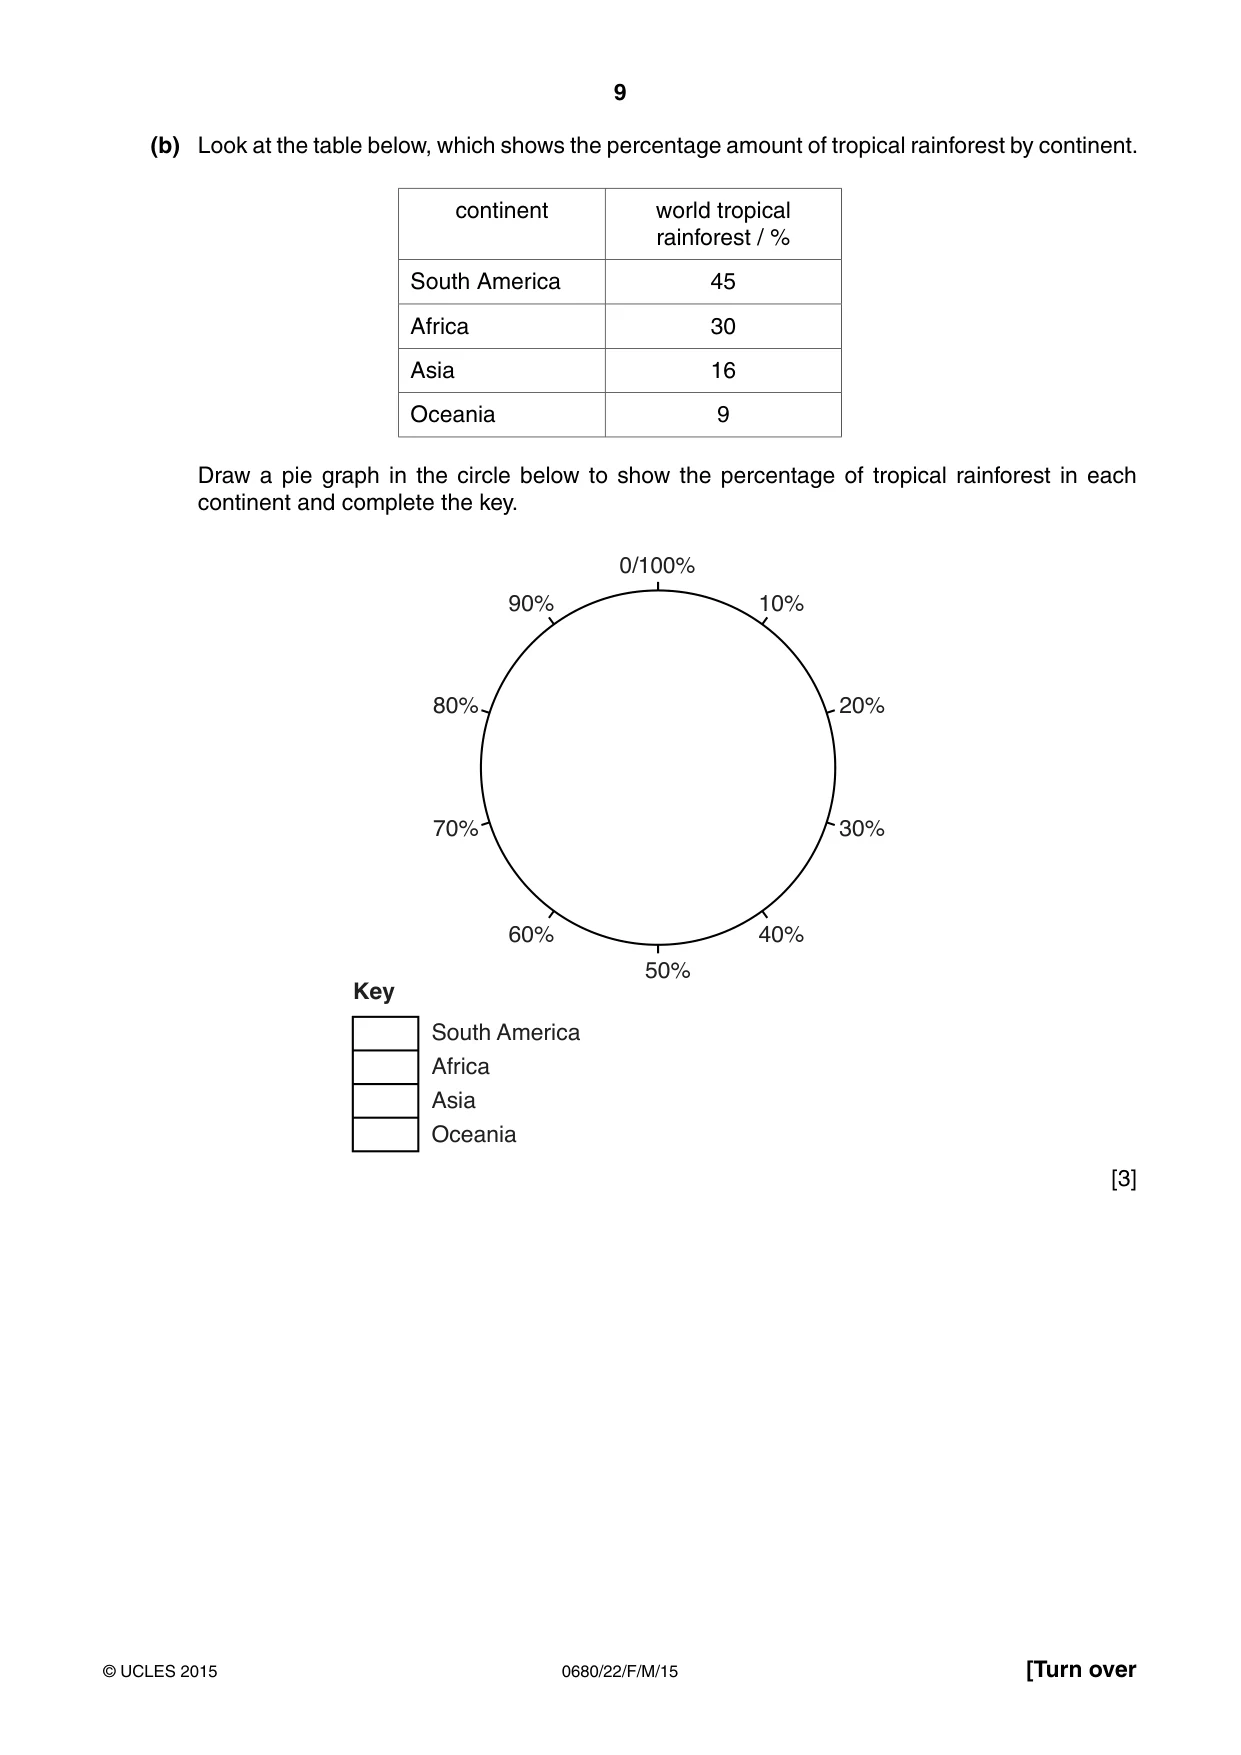
9 0680/22/F/M/15 © UCLES 2015 [Turn over (b) Look at the table below, which shows the percentage amount of tropical rainforest by continent. continent world tropical rainforest / % South America 45 Africa 30 Asia 16 Oceania 9 Draw a pie graph in the circle below to show the percentage of tropical rainforest in each continent and complete the key. 10% 40% Key 90% 0/100% 50% 60% South America Africa Asia Oceania 20% 30% 80% 70% [3]
Question paper, page 10
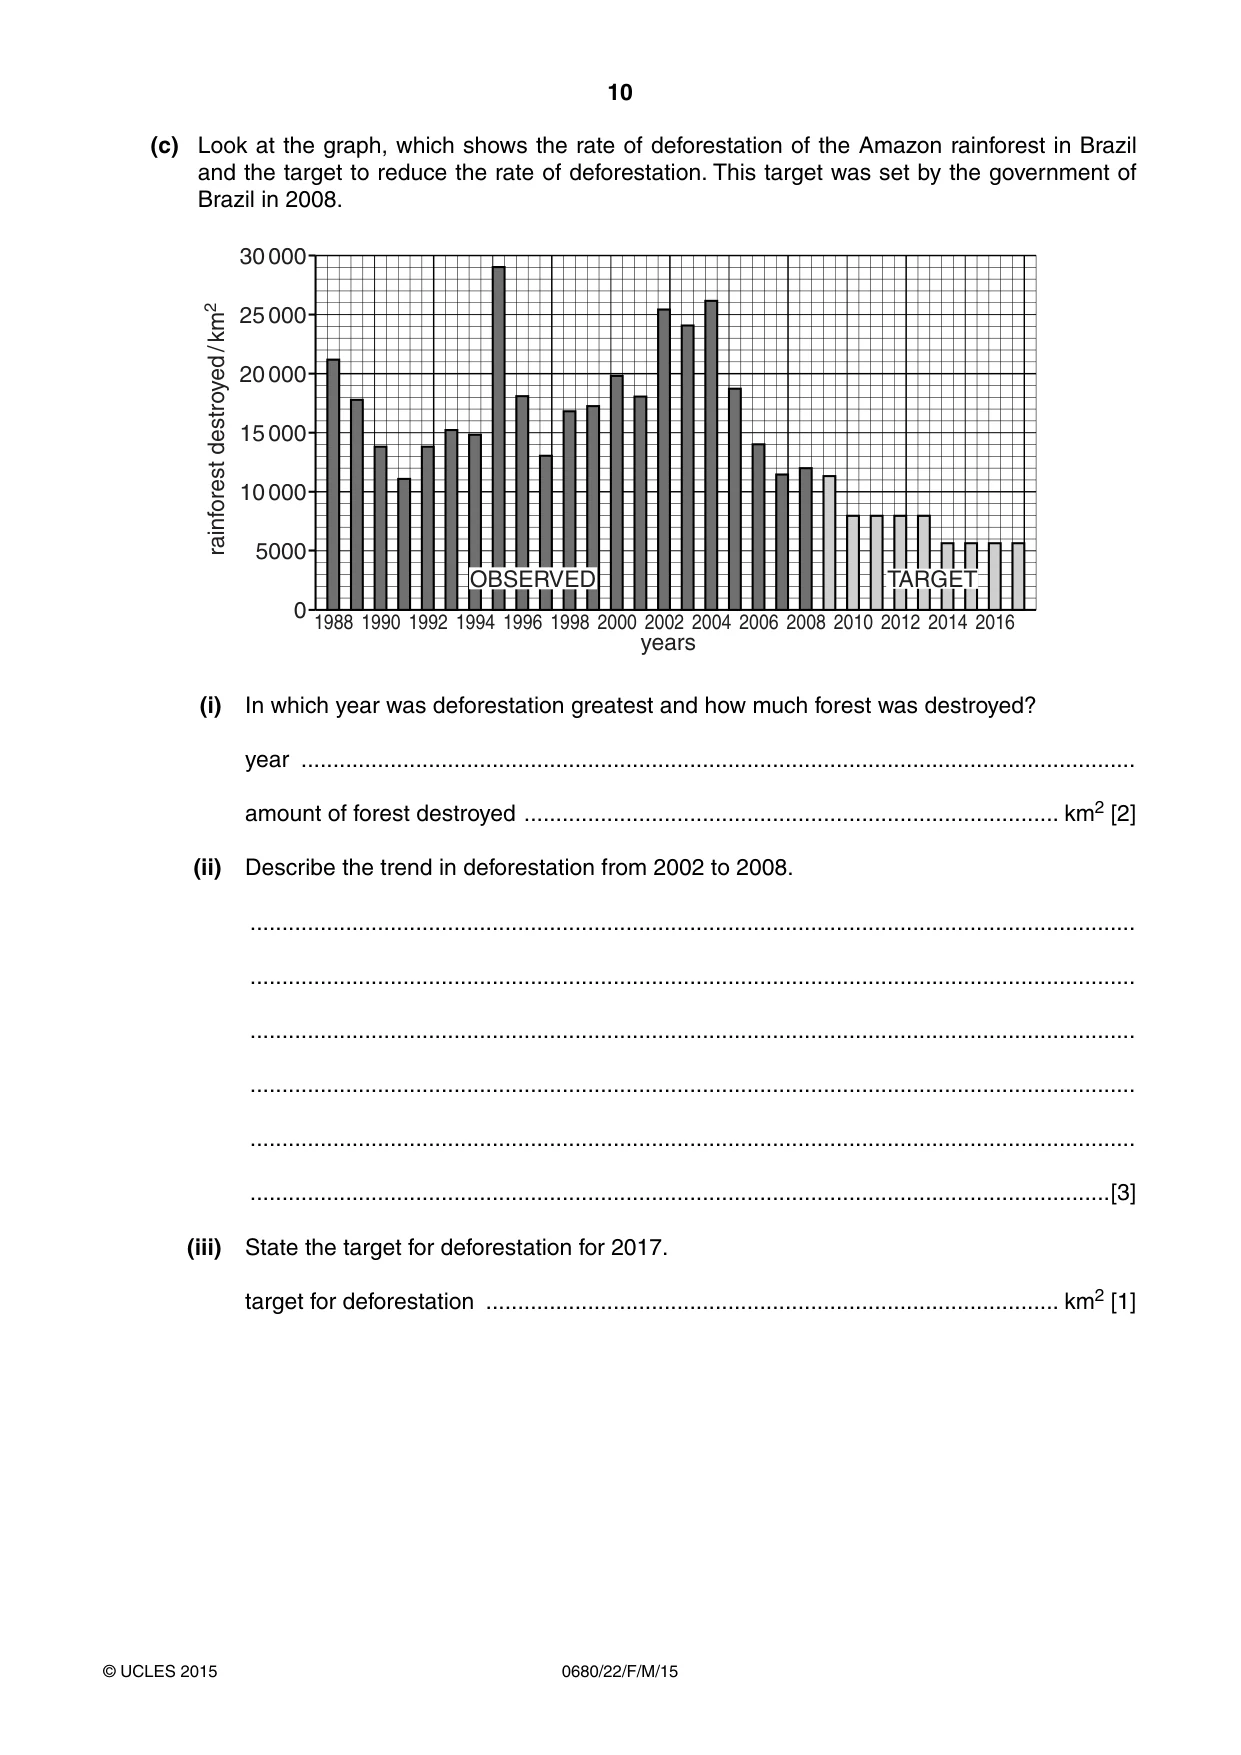
10 0680/22/F/M/15 © UCLES 2015 (c) Look at the graph, which shows the rate of deforestation of the Amazon rainforest in Brazil and the target to reduce the rate of deforestation. This target was set by the government of Brazil in 2008. 0 5000 years rainforest destroyed / km2 10 000 15 000 20 000 25 000 30 000 1988 1990 1992 1994 1996 1998 2000 2002 2004 2006 2008 2010 2012 2014 2016 OBSERVED TARGET (i) In which year was deforestation greatest and how much forest was destroyed? year … amount of forest destroyed … km2 [2] (ii) Describe the trend in deforestation from 2002 to 2008. … … … … … …[3] (iii) State the target for deforestation for 2017. target for deforestation … km2 [1]
Question paper, page 11
11 0680/22/F/M/15 © UCLES 2015 [Turn over (iv) Suggest reasons why the government of Brazil set targets to reduce deforestation of the Amazon rainforest. … … … … … …[3] (v) Suggest reasons why it might be difficult to reduce deforestation of the Amazon rainforest. … … … … … …[3]
Question paper, page 12
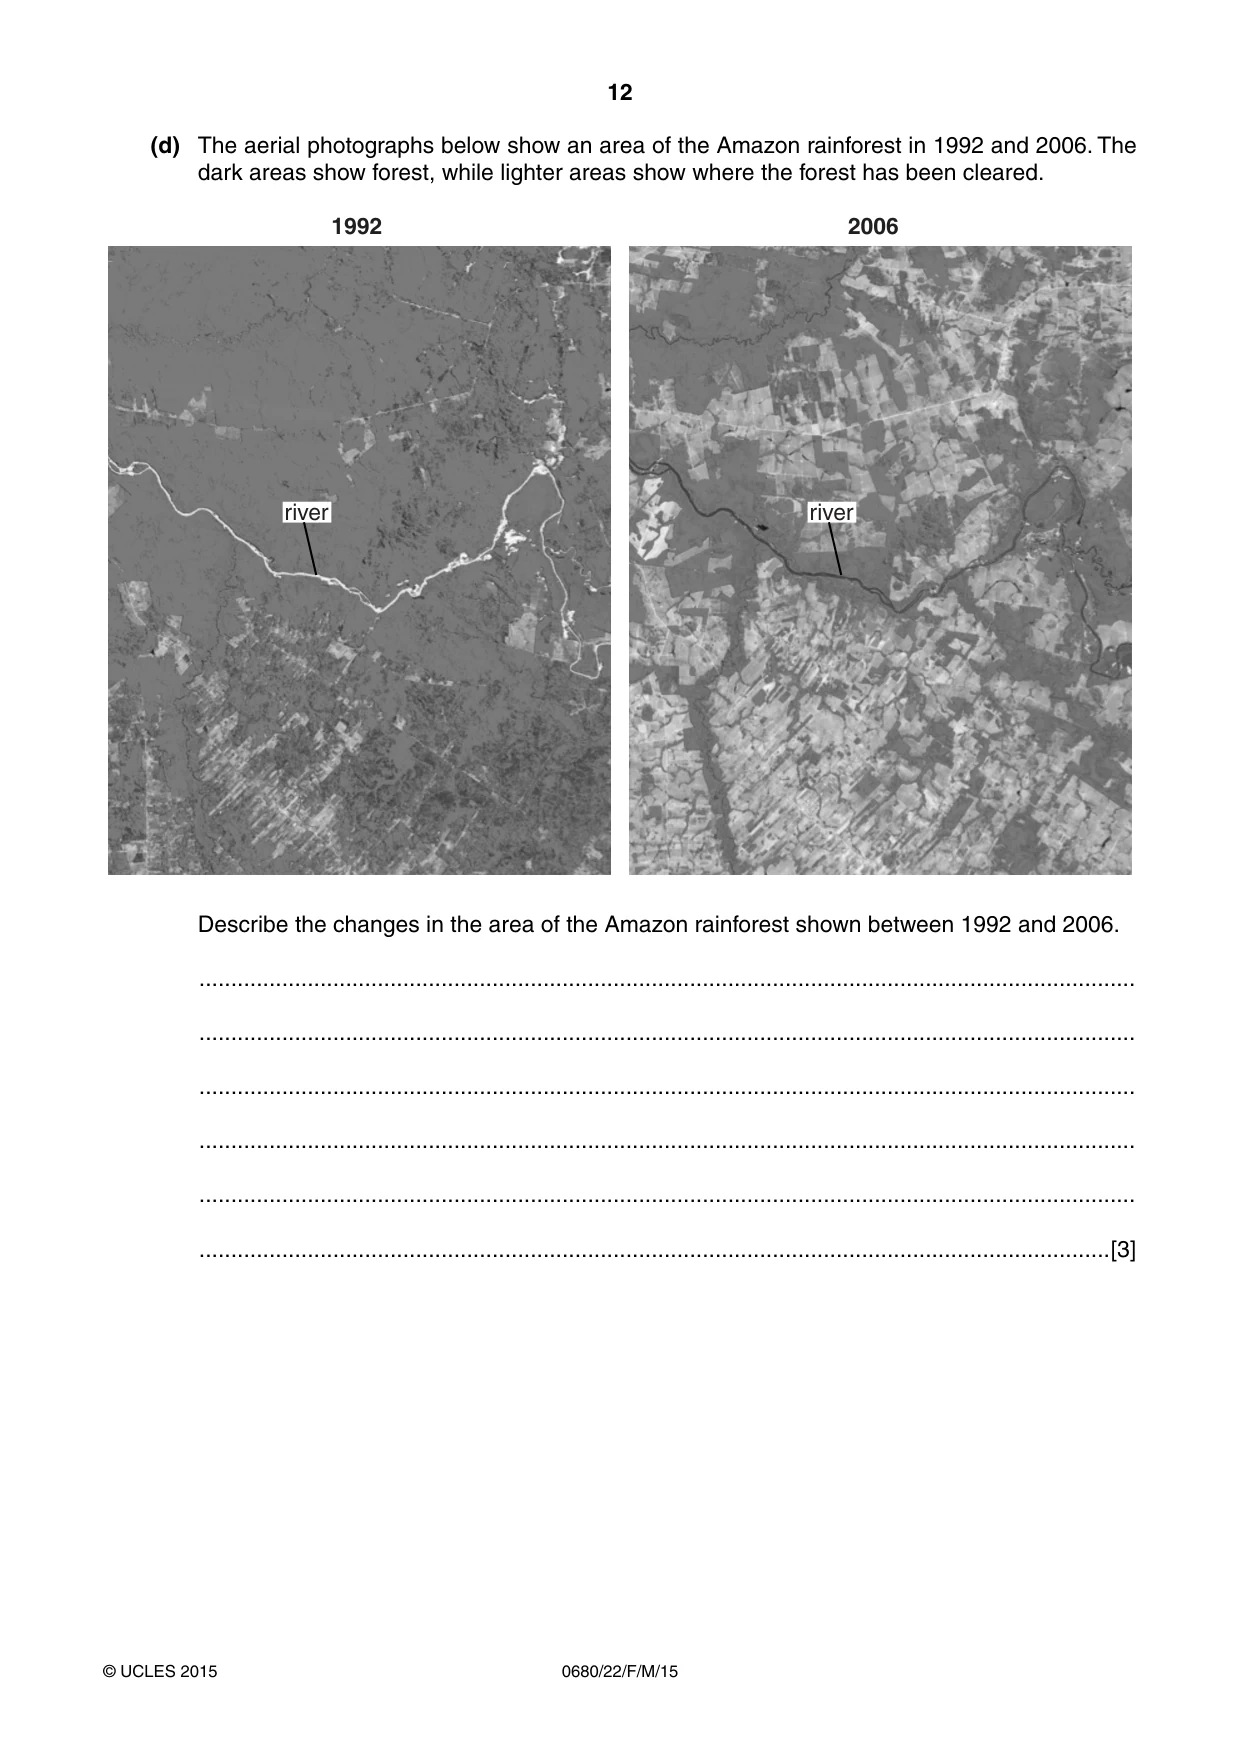
12 0680/22/F/M/15 © UCLES 2015 (d) The aerial photographs below show an area of the Amazon rainforest in 1992 and 2006. The dark areas show forest, while lighter areas show where the forest has been cleared. 1992 2006 river river Describe the changes in the area of the Amazon rainforest shown between 1992 and 2006. … … … … … …[3]
Question paper, page 13
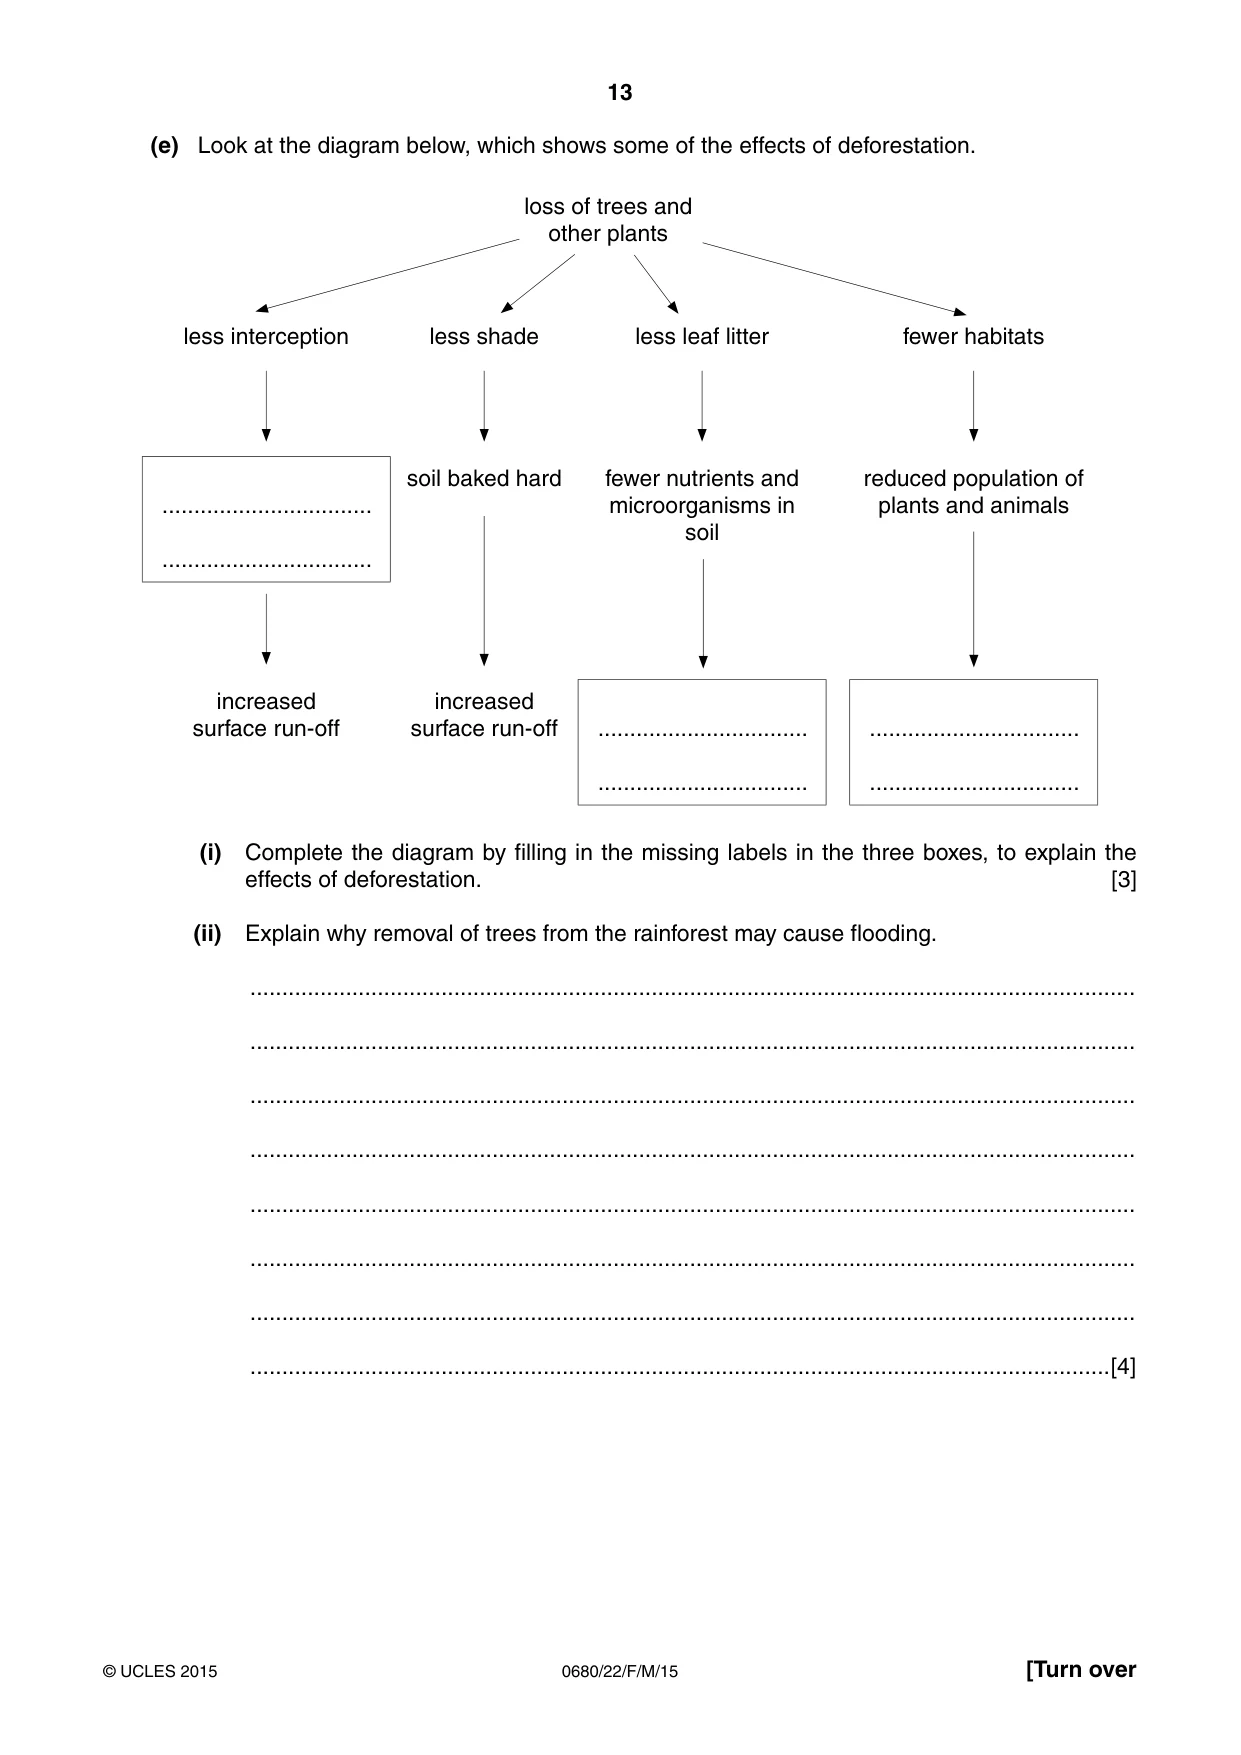
13 0680/22/F/M/15 © UCLES 2015 [Turn over (e) Look at the diagram below, which shows some of the effects of deforestation. loss of trees and other plants less interception less shade less leaf litter fewer habitats … … soil baked hard fewer nutrients and microorganisms in soil reduced population of plants and animals increased surface run-off increased surface run-off … … … … (i) Complete the diagram by filling in the missing labels in the three boxes, to explain the effects of deforestation. [3] (ii) Explain why removal of trees from the rainforest may cause flooding. … … … … … … … …[4]
Question paper, page 14
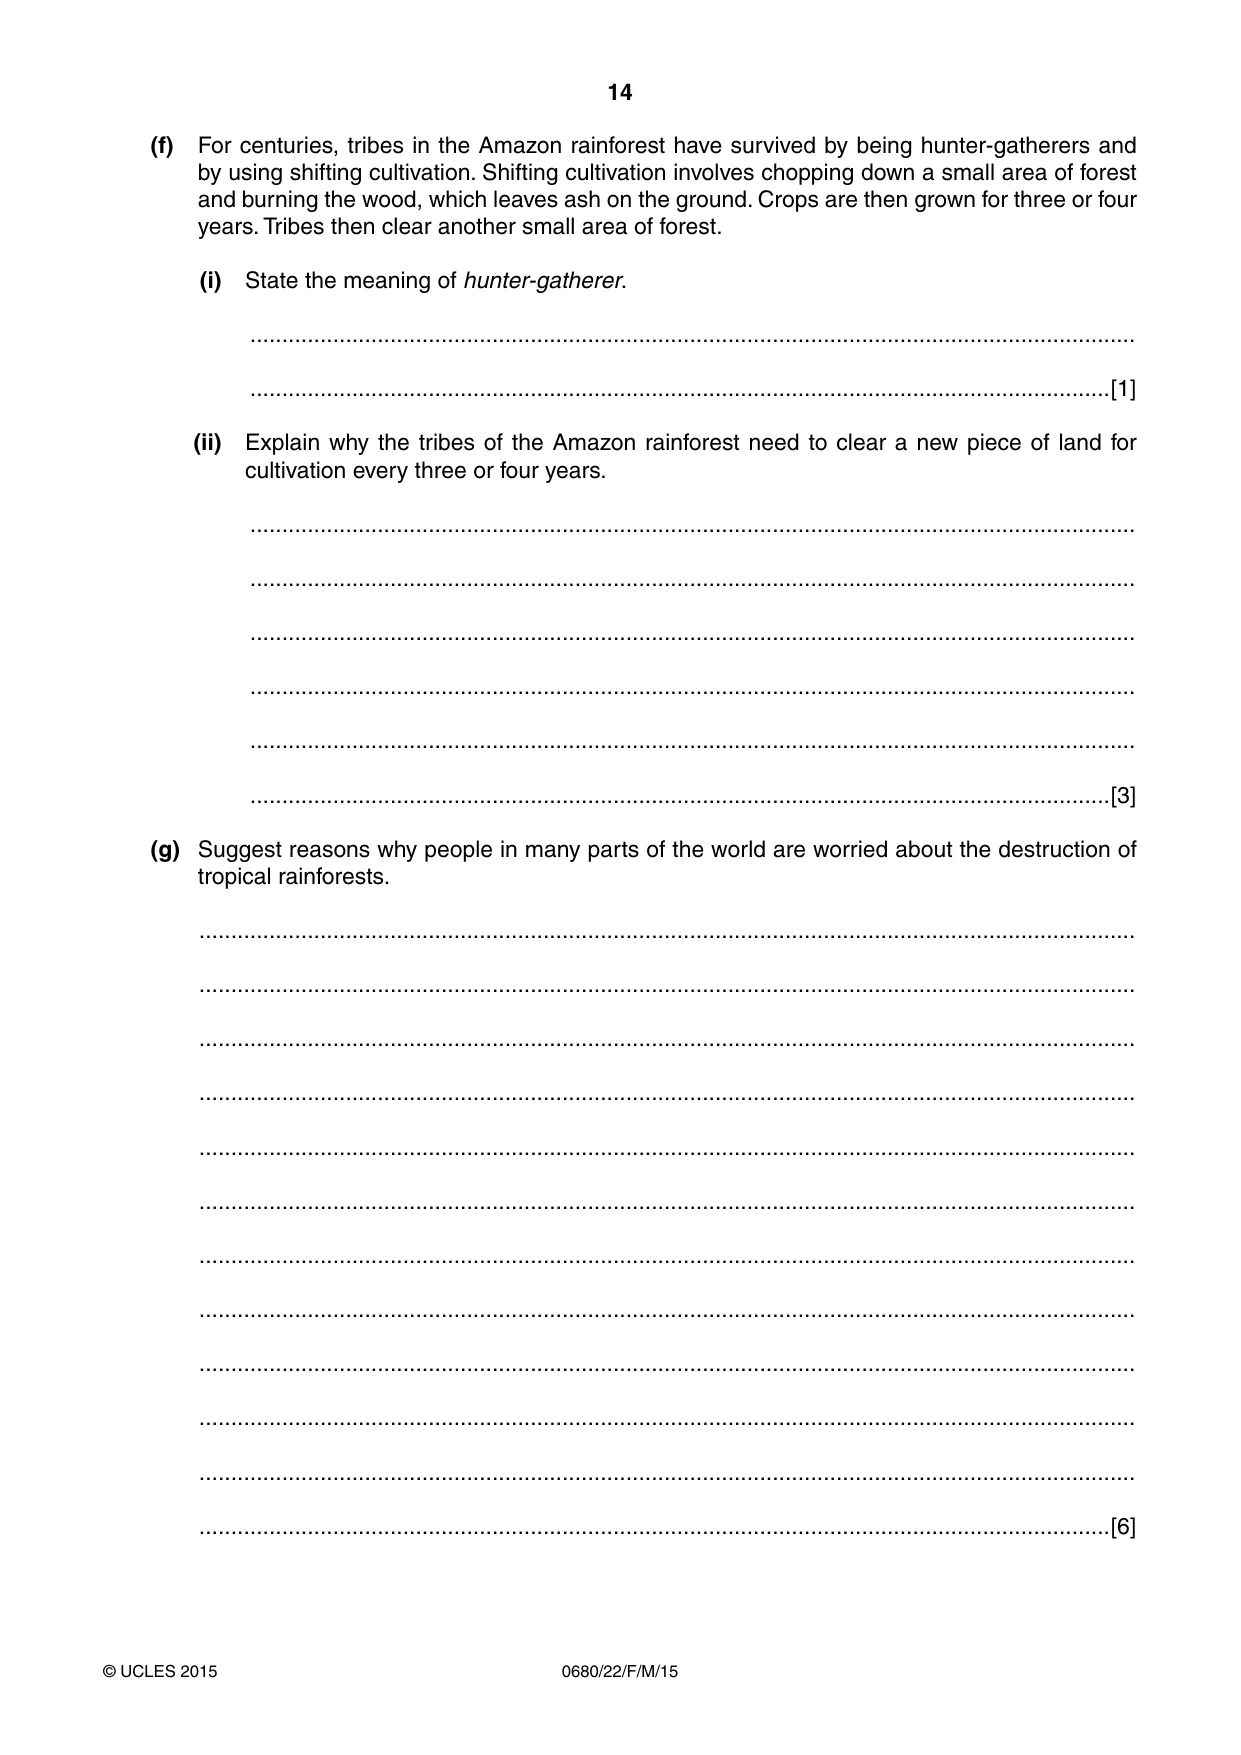
14 0680/22/F/M/15 © UCLES 2015 (f) For centuries, tribes in the Amazon rainforest have survived by being hunter-gatherers and by using shifting cultivation. Shifting cultivation involves chopping down a small area of forest and burning the wood, which leaves ash on the ground. Crops are then grown for three or four years. Tribes then clear another small area of forest. (i) State the meaning of hunter-gatherer. … …[1] (ii) Explain why the tribes of the Amazon rainforest need to clear a new piece of land for cultivation every three or four years. … … … … … …[3] (g) Suggest reasons why people in many parts of the world are worried about the destruction of tropical rainforests. … … … … … … … … … … … …[6]
Question paper, page 15
15 0680/22/F/M/15 © UCLES 2015 BLANK PAGE
Question paper, page 16
16 0680/22/F/M/15 © UCLES 2015 Permission to reproduce items where third-party owned material protected by copyright is included has been sought and cleared where possible. Every reasonable effort has been made by the publisher (UCLES) to trace copyright holders, but if any items requiring clearance have unwittingly been included, the publisher will be pleased to make amends at the earliest possible opportunity. To avoid the issue of disclosure of answer-related information to candidates, all copyright acknowledgements are reproduced online in the Cambridge International Examinations Copyright Acknowledgements Booklet. This is produced for each series of examinations and is freely available to download at www.cie.org.uk after the live examination series. Cambridge International Examinations is part of the Cambridge Assessment Group. Cambridge Assessment is the brand name of University of Cambridge Local Examinations Syndicate (UCLES), which is itself a department of the University of Cambridge. BLANK PAGE
Mark scheme, page 1
® IGCSE is the registered trademark of Cambridge International Examinations. CAMBRIDGE INTERNATIONAL EXAMINATIONS Cambridge International General Certificate of Secondary Education MARK SCHEME for the March 2015 series 0680 ENVIRONMENTAL MANAGEMENT 0680/22 Paper 22, maximum raw mark 80 This mark scheme is published as an aid to teachers and candidates, to indicate the requirements of the examination. It shows the basis on which Examiners were instructed to award marks. It does not indicate the details of the discussions that took place at an Examiners’ meeting before marking began, which would have considered the acceptability of alternative answers. Mark schemes should be read in conjunction with the question paper and the Principal Examiner Report for Teachers. Cambridge will not enter into discussions about these mark schemes. Cambridge is publishing the mark schemes for the March 2015 series for most Cambridge IGCSE® components.
Mark scheme, page 2
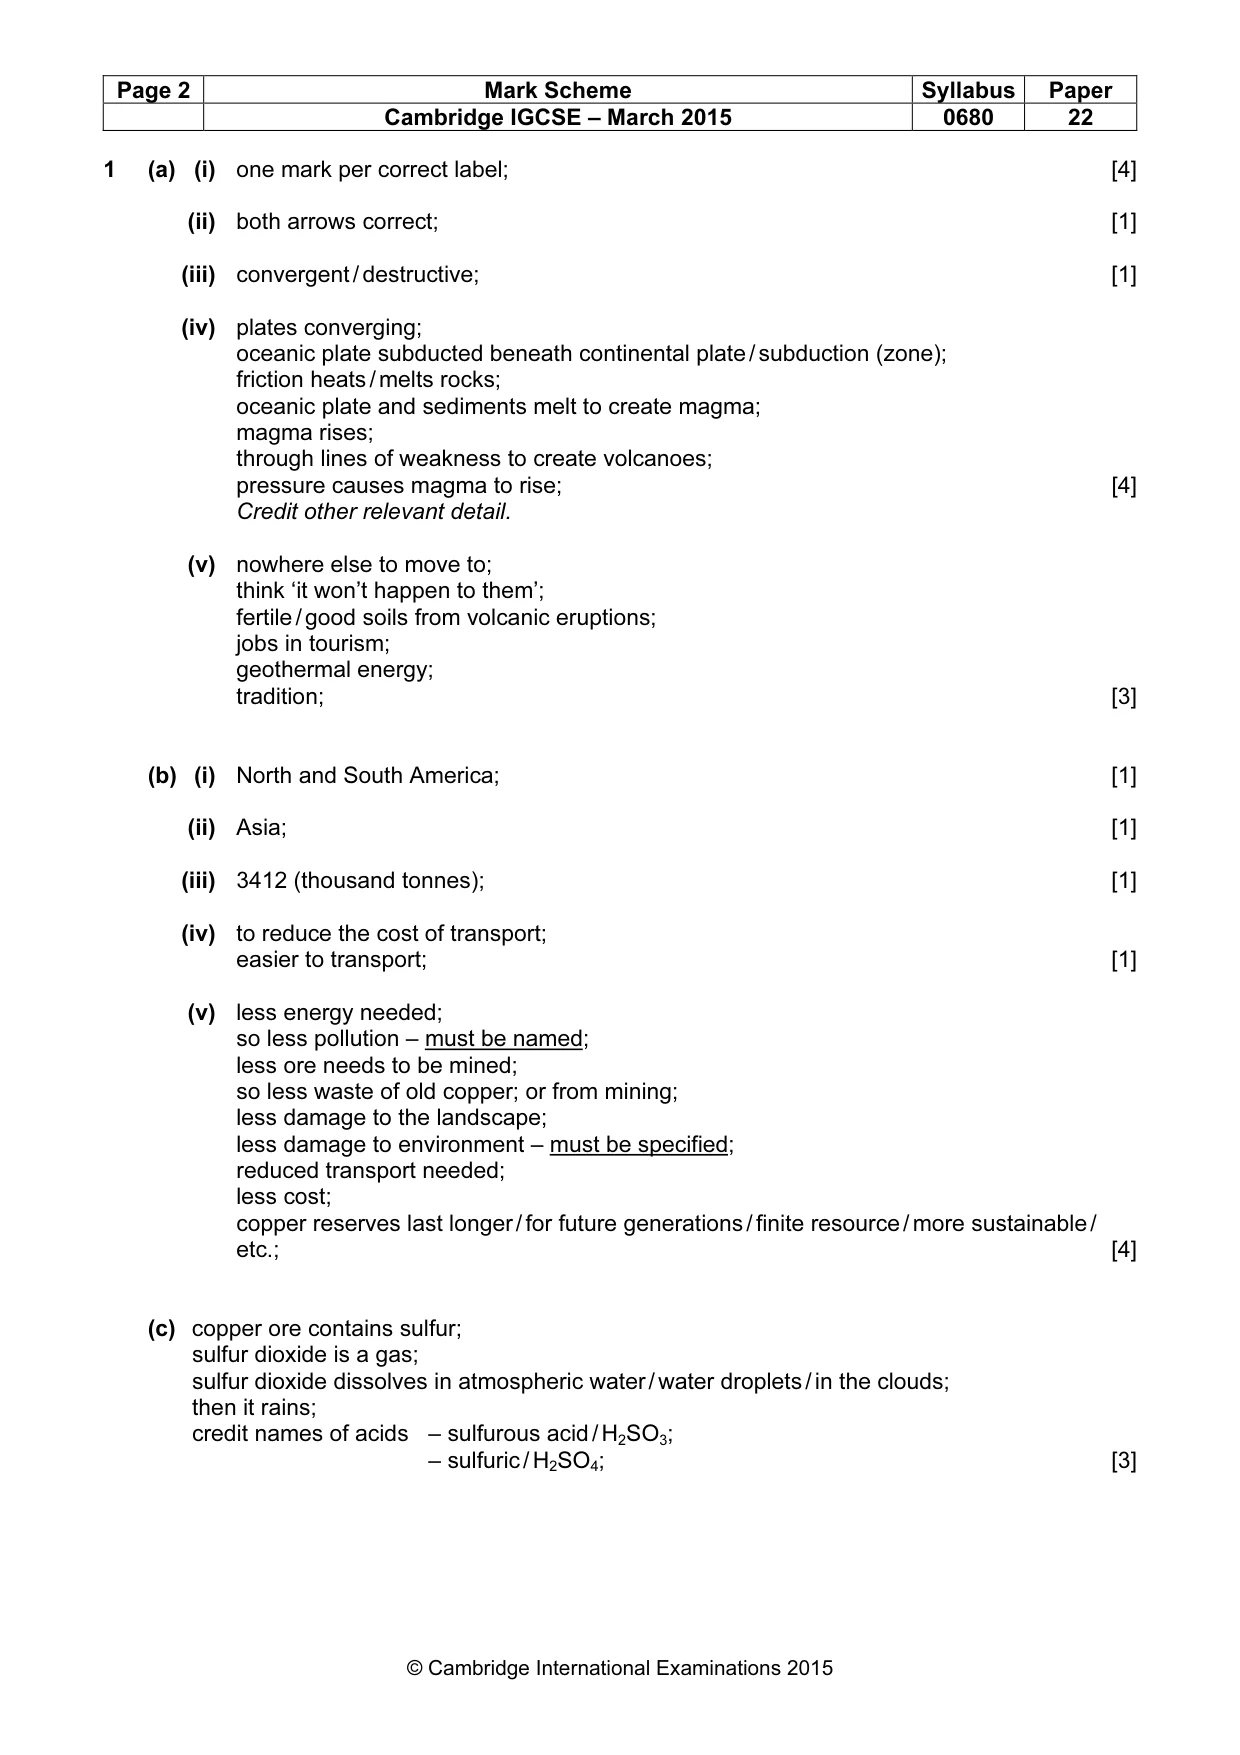
Page 2 Mark Scheme Syllabus Paper Cambridge IGCSE – March 2015 0680 22 © Cambridge International Examinations 2015 1 (a) (i) one mark per correct label; [4] (ii) both arrows correct; [1] (iii) convergent / destructive; [1] (iv) plates converging; oceanic plate subducted beneath continental plate / subduction (zone); friction heats / melts rocks; oceanic plate and sediments melt to create magma; magma rises; through lines of weakness to create volcanoes; pressure causes magma to rise; [4] Credit other relevant detail. (v) nowhere else to move to; think ‘it won’t happen to them’; fertile / good soils from volcanic eruptions; jobs in tourism; geothermal energy; tradition; [3] (b) (i) North and South America; [1] (ii) Asia; [1] (iii) 3412 (thousand tonnes); [1] (iv) to reduce the cost of transport; easier to transport; [1] (v) less energy needed; so less pollution – must be named; less ore needs to be mined; so less waste of old copper; or from mining; less damage to the landscape; less damage to environment – must be specified; reduced transport needed; less cost; copper reserves last longer / for future generations / finite resource / more sustainable / etc.; [4] (c) copper ore contains sulfur; sulfur dioxide is a gas; sulfur dioxide dissolves in atmospheric water / water droplets / in the clouds; then it rains; credit names of acids – sulfurous acid / H2SO3; – sulfuric / H2SO4; [3]
Mark scheme, page 3
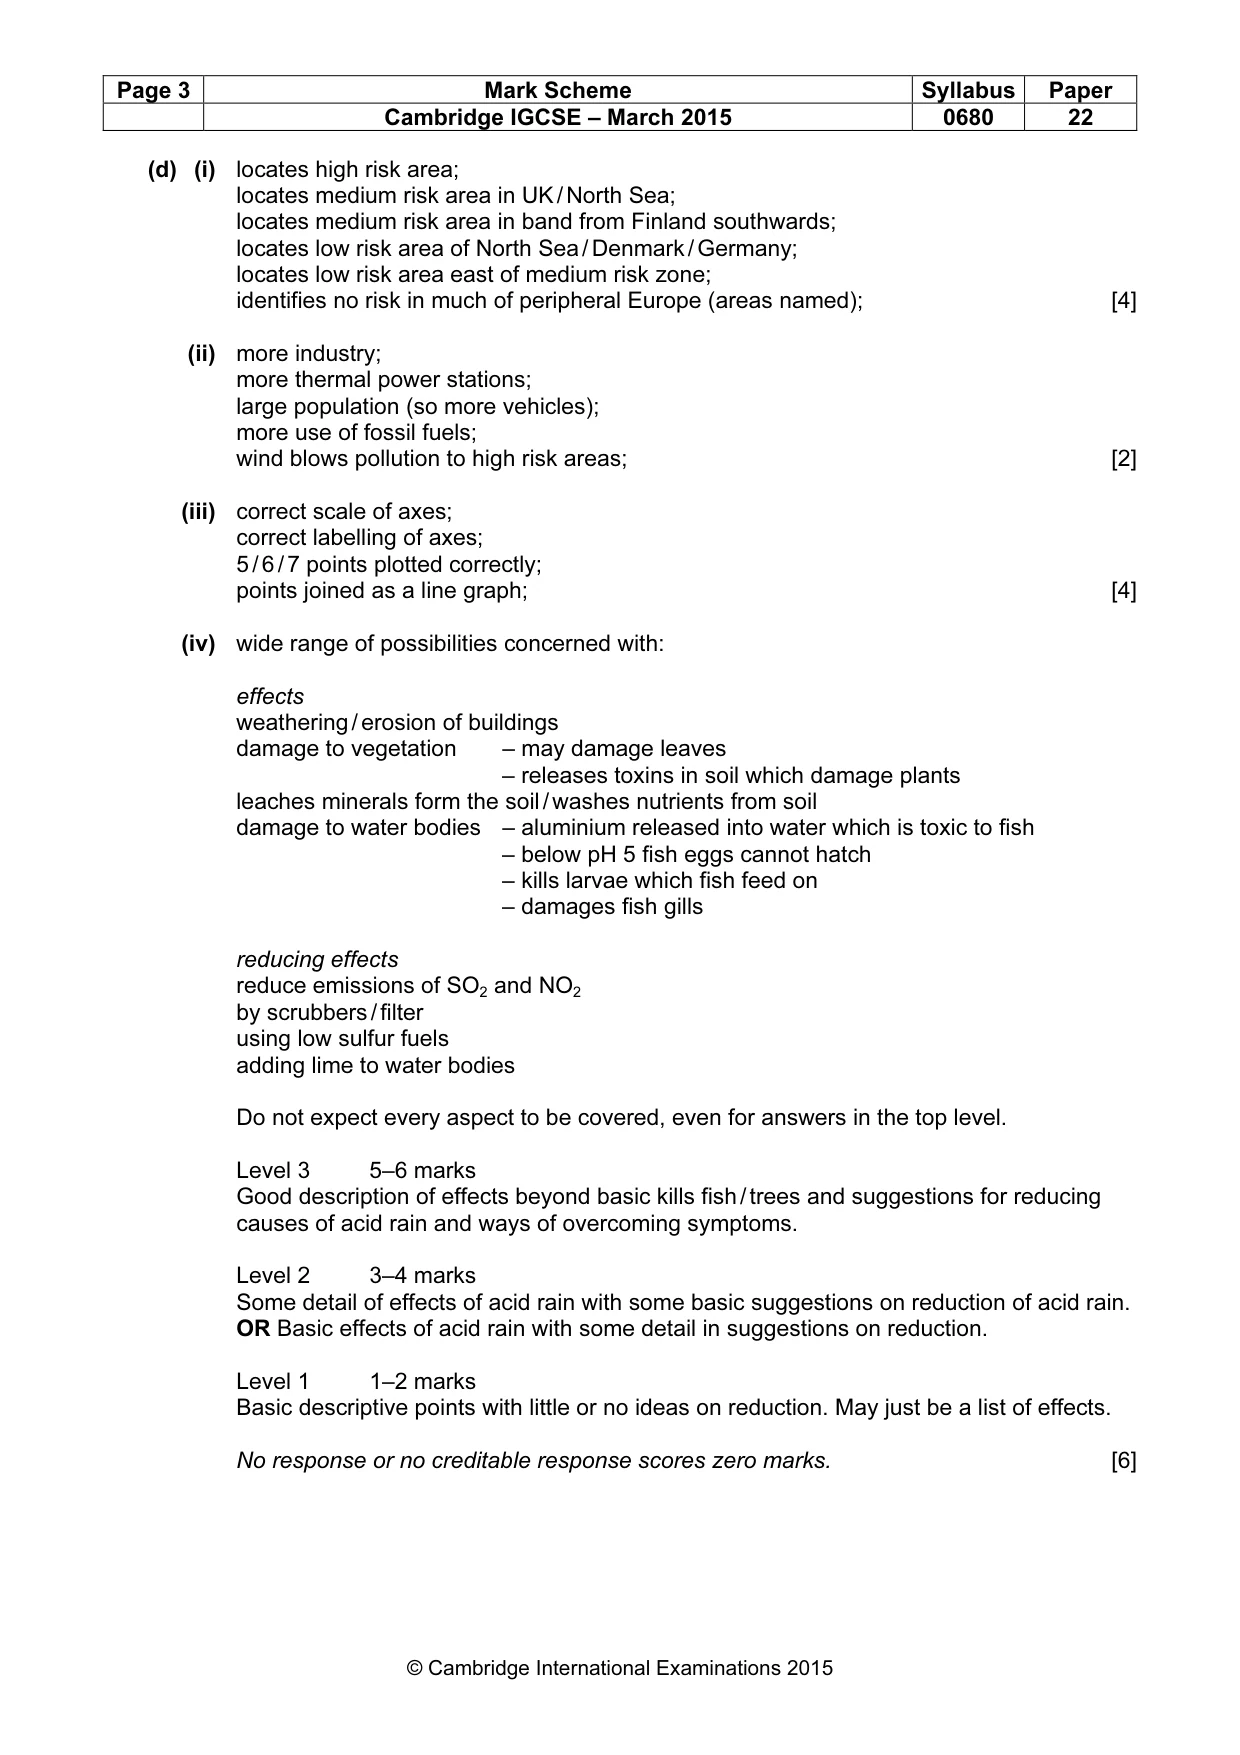
Page 3 Mark Scheme Syllabus Paper Cambridge IGCSE – March 2015 0680 22 © Cambridge International Examinations 2015 (d) (i) locates high risk area; locates medium risk area in UK / North Sea; locates medium risk area in band from Finland southwards; locates low risk area of North Sea / Denmark / Germany; locates low risk area east of medium risk zone; identifies no risk in much of peripheral Europe (areas named); [4] (ii) more industry; more thermal power stations; large population (so more vehicles); more use of fossil fuels; wind blows pollution to high risk areas; [2] (iii) correct scale of axes; correct labelling of axes; 5 / 6 / 7 points plotted correctly; points joined as a line graph; [4] (iv) wide range of possibilities concerned with: effects weathering / erosion of buildings damage to vegetation – may damage leaves – releases toxins in soil which damage plants leaches minerals form the soil / washes nutrients from soil damage to water bodies – aluminium released into water which is toxic to fish – below pH 5 fish eggs cannot hatch – kills larvae which fish feed on – damages fish gills reducing effects reduce emissions of SO2 and NO2 by scrubbers / filter using low sulfur fuels adding lime to water bodies Do not expect every aspect to be covered, even for answers in the top level. Level 3 5–6 marks Good description of effects beyond basic kills fish / trees and suggestions for reducing causes of acid rain and ways of overcoming symptoms. Level 2 3–4 marks Some detail of effects of acid rain with some basic suggestions on reduction of acid rain. OR Basic effects of acid rain with some detail in suggestions on reduction. Level 1 1–2 marks Basic descriptive points with little or no ideas on reduction. May just be a list of effects. No response or no creditable response scores zero marks. [6]
Mark scheme, page 4
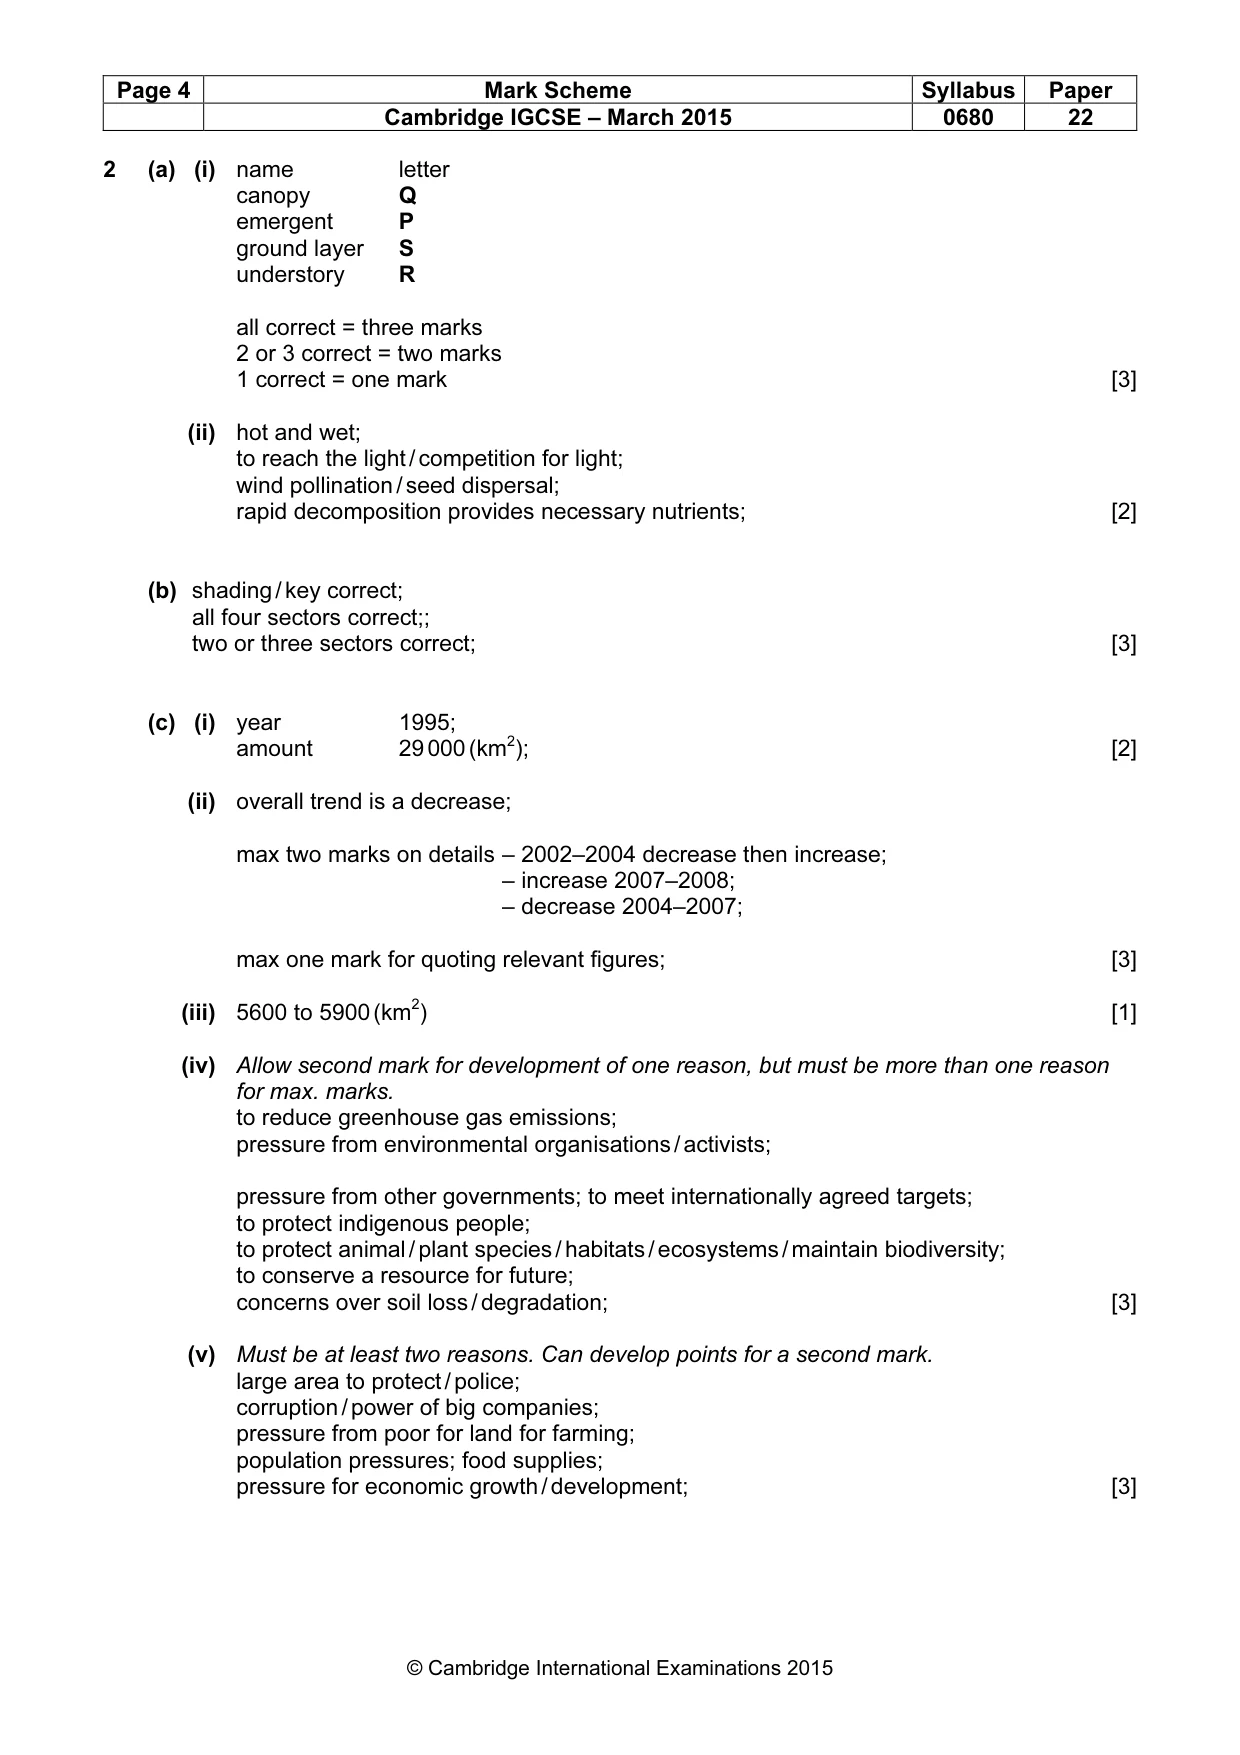
Page 4 Mark Scheme Syllabus Paper Cambridge IGCSE – March 2015 0680 22 © Cambridge International Examinations 2015 2 (a) (i) name letter canopy Q emergent P ground layer S understory R all correct = three marks 2 or 3 correct = two marks 1 correct = one mark [3] (ii) hot and wet; to reach the light / competition for light; wind pollination / seed dispersal; rapid decomposition provides necessary nutrients; [2] (b) shading / key correct; all four sectors correct;; two or three sectors correct; [3] (c) (i) year 1995; amount 29 000 (km2); [2] (ii) overall trend is a decrease; max two marks on details – 2002–2004 decrease then increase; – increase 2007–2008; – decrease 2004–2007; max one mark for quoting relevant figures; [3] (iii) 5600 to 5900 (km2) [1] (iv) Allow second mark for development of one reason, but must be more than one reason for max. marks. to reduce greenhouse gas emissions; pressure from environmental organisations / activists; pressure from other governments; to meet internationally agreed targets; to protect indigenous people; to protect animal / plant species / habitats / ecosystems / maintain biodiversity; to conserve a resource for future; concerns over soil loss / degradation; [3] (v) Must be at least two reasons. Can develop points for a second mark. large area to protect / police; corruption / power of big companies; pressure from poor for land for farming; population pressures; food supplies; pressure for economic growth / development; [3]
Mark scheme, page 5
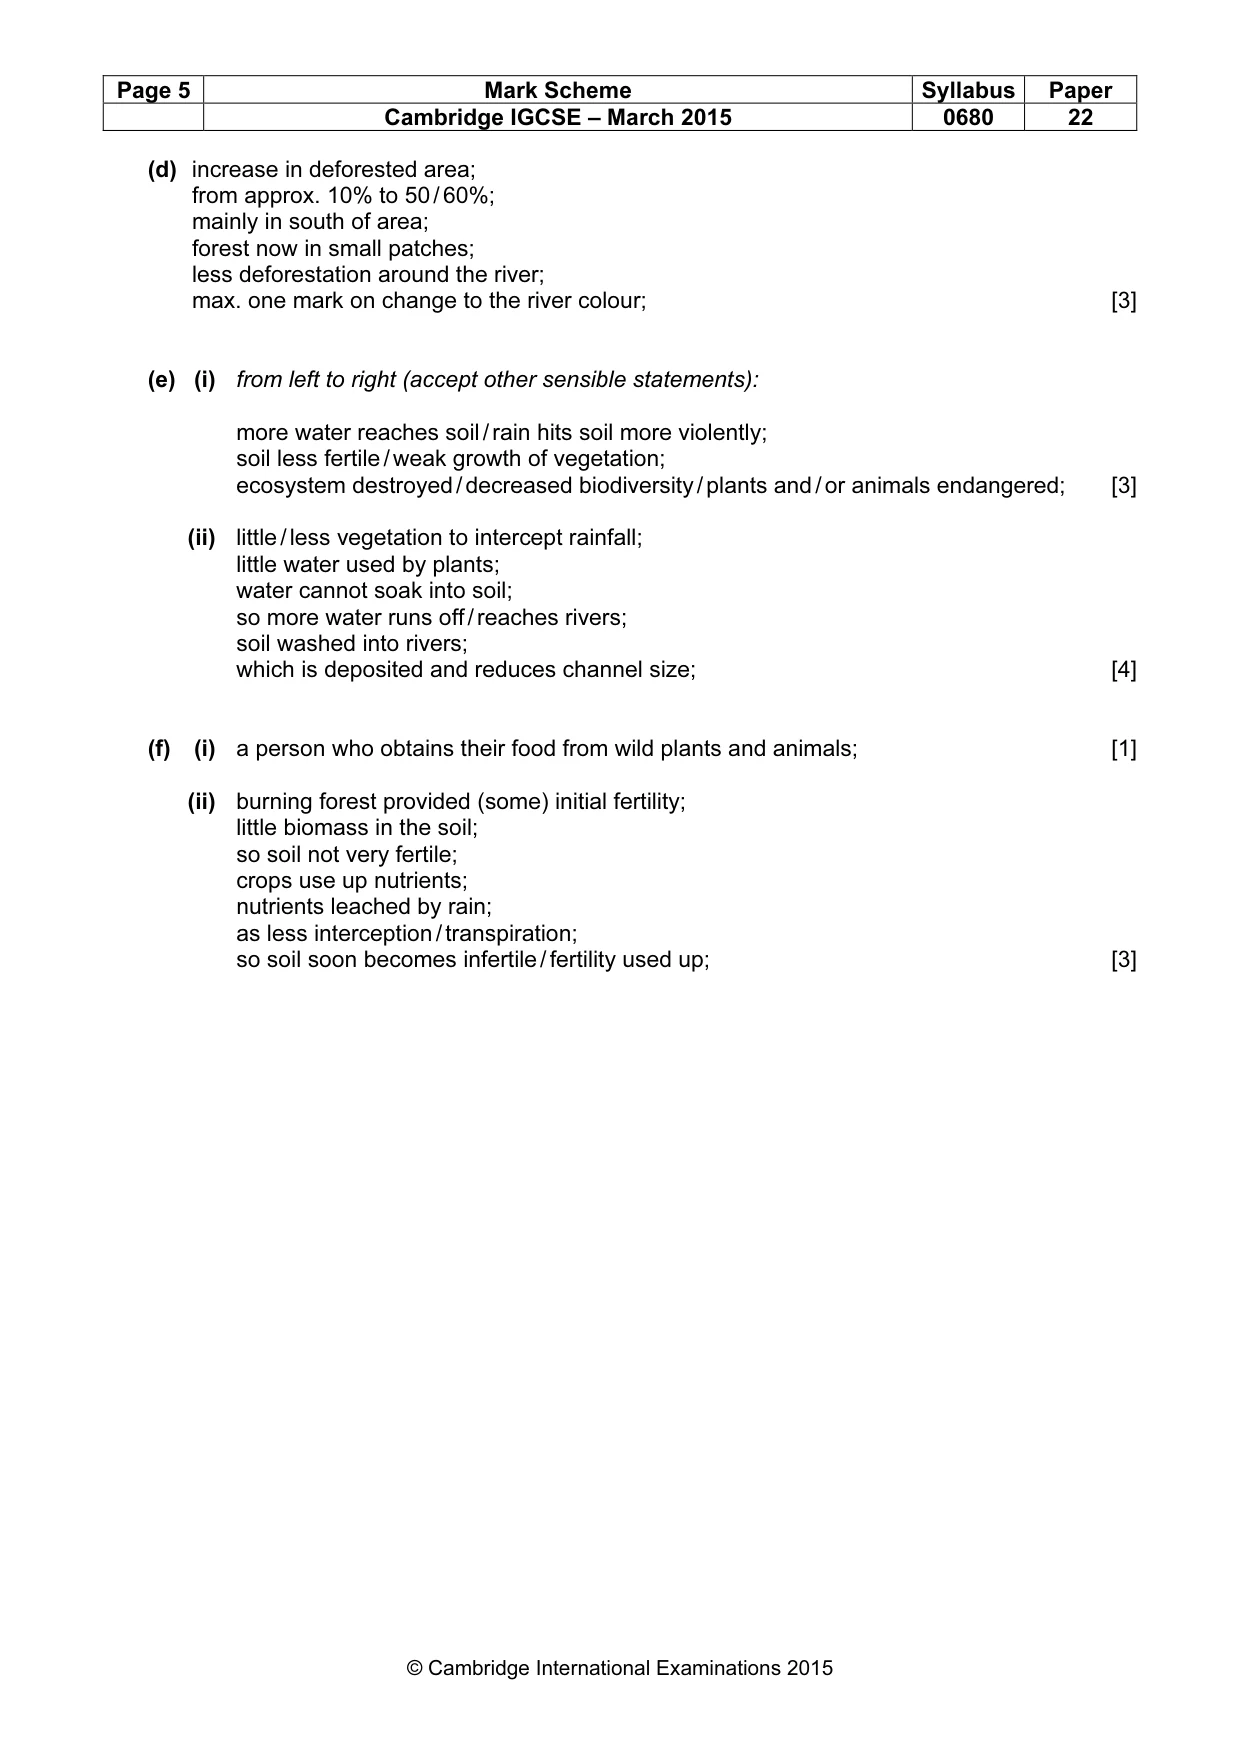
Page 5 Mark Scheme Syllabus Paper Cambridge IGCSE – March 2015 0680 22 © Cambridge International Examinations 2015 (d) increase in deforested area; from approx. 10% to 50 / 60%; mainly in south of area; forest now in small patches; less deforestation around the river; max. one mark on change to the river colour; [3] (e) (i) from left to right (accept other sensible statements): more water reaches soil / rain hits soil more violently; soil less fertile / weak growth of vegetation; ecosystem destroyed / decreased biodiversity / plants and / or animals endangered; [3] (ii) little / less vegetation to intercept rainfall; little water used by plants; water cannot soak into soil; so more water runs off / reaches rivers; soil washed into rivers; which is deposited and reduces channel size; [4] (f) (i) a person who obtains their food from wild plants and animals; [1] (ii) burning forest provided (some) initial fertility; little biomass in the soil; so soil not very fertile; crops use up nutrients; nutrients leached by rain; as less interception / transpiration; so soil soon becomes infertile / fertility used up; [3]
Mark scheme, page 6
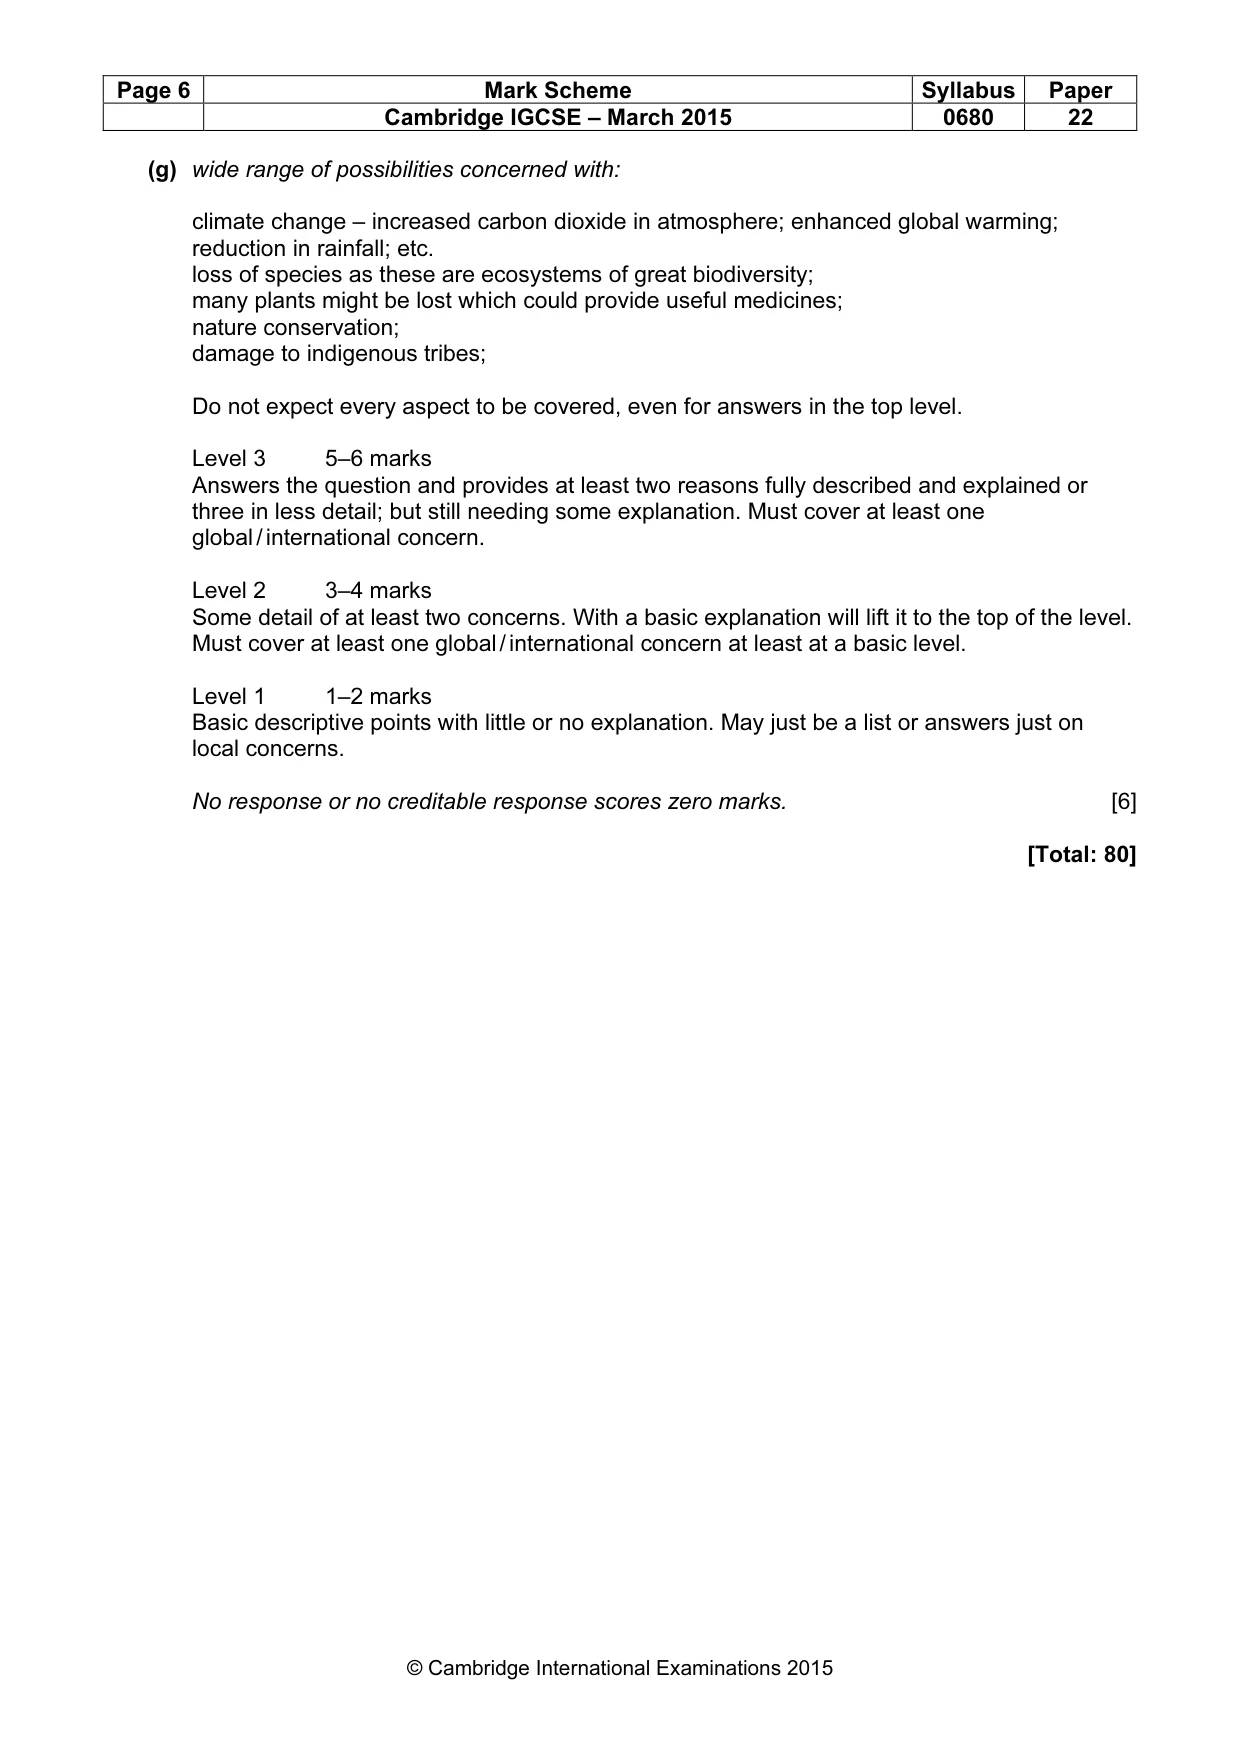
Page 6 Mark Scheme Syllabus Paper Cambridge IGCSE – March 2015 0680 22 © Cambridge International Examinations 2015 (g) wide range of possibilities concerned with: climate change – increased carbon dioxide in atmosphere; enhanced global warming; reduction in rainfall; etc. loss of species as these are ecosystems of great biodiversity; many plants might be lost which could provide useful medicines; nature conservation; damage to indigenous tribes; Do not expect every aspect to be covered, even for answers in the top level. Level 3 5–6 marks Answers the question and provides at least two reasons fully described and explained or three in less detail; but still needing some explanation. Must cover at least one global / international concern. Level 2 3–4 marks Some detail of at least two concerns. With a basic explanation will lift it to the top of the level. Must cover at least one global / international concern at least at a basic level. Level 1 1–2 marks Basic descriptive points with little or no explanation. May just be a list or answers just on local concerns. No response or no creditable response scores zero marks. [6] [Total: 80]
What you needed in this session
Cambridge’s own grade thresholds for 2015 Feb/March, Paper 2 · Variant 2. A higher threshold means an easier paper — the bar moves with how the cohort did.