Cambridge IGCSE Environmental Management 0680 — 2013 Oct/Nov Paper 4 · Variant 2
0680/42/O/N/13 · 60 marks · ≈68 min
The question paper and its mark scheme, free to read here and free to download. This is Cambridge’s own paper, exactly as it was sat.
Question paper20 pages


Mark scheme3 pages
Answers below. Sit the paper first if you are practising.
Paper as text
Question paper, page 1
This document consists of 18 printed pages and 2 blank pages. DC (NF/SW) 67705/3 © UCLES 2013 [Turn over UNIVERSITY OF CAMBRIDGE INTERNATIONAL EXAMINATIONS International General Certificate of Secondary Education * 8 9 4 2 9 3 9 6 6 4 * ENVIRONMENTAL MANAGEMENT 0680/42 Alternative to Coursework October/November 2013 1 hour 30 minutes Candidates answer on the Question Paper. Additional Materials: Ruler READ THESE INSTRUCTIONS FIRST Write your Centre number, candidate number and name on all the work you hand in. Write in dark blue or black pen. You may use a pencil for any diagrams, graphs or rough working. Do not use staples, paper clips, highlighters, glue or correction fluid. DO NOT WRITE IN ANY BARCODES. Answer all questions. Electronic calculators may be used. You may lose marks if you do not show your working or if you do not use appropriate units. Study the appropriate source materials before you start to write your answers. Credit will be given for appropriate selection and use of data in your answers and for relevant interpretation of these data. Suggestions for data sources are given in some questions. You may use the source data to draw diagrams and graphs or to do calculations to illustrate your answers. At the end of the examination, fasten all your work securely together. The number of marks is given in brackets [ ] at the end of each question or part question. For Examiner’s Use 1 2 Total
Question paper, page 2
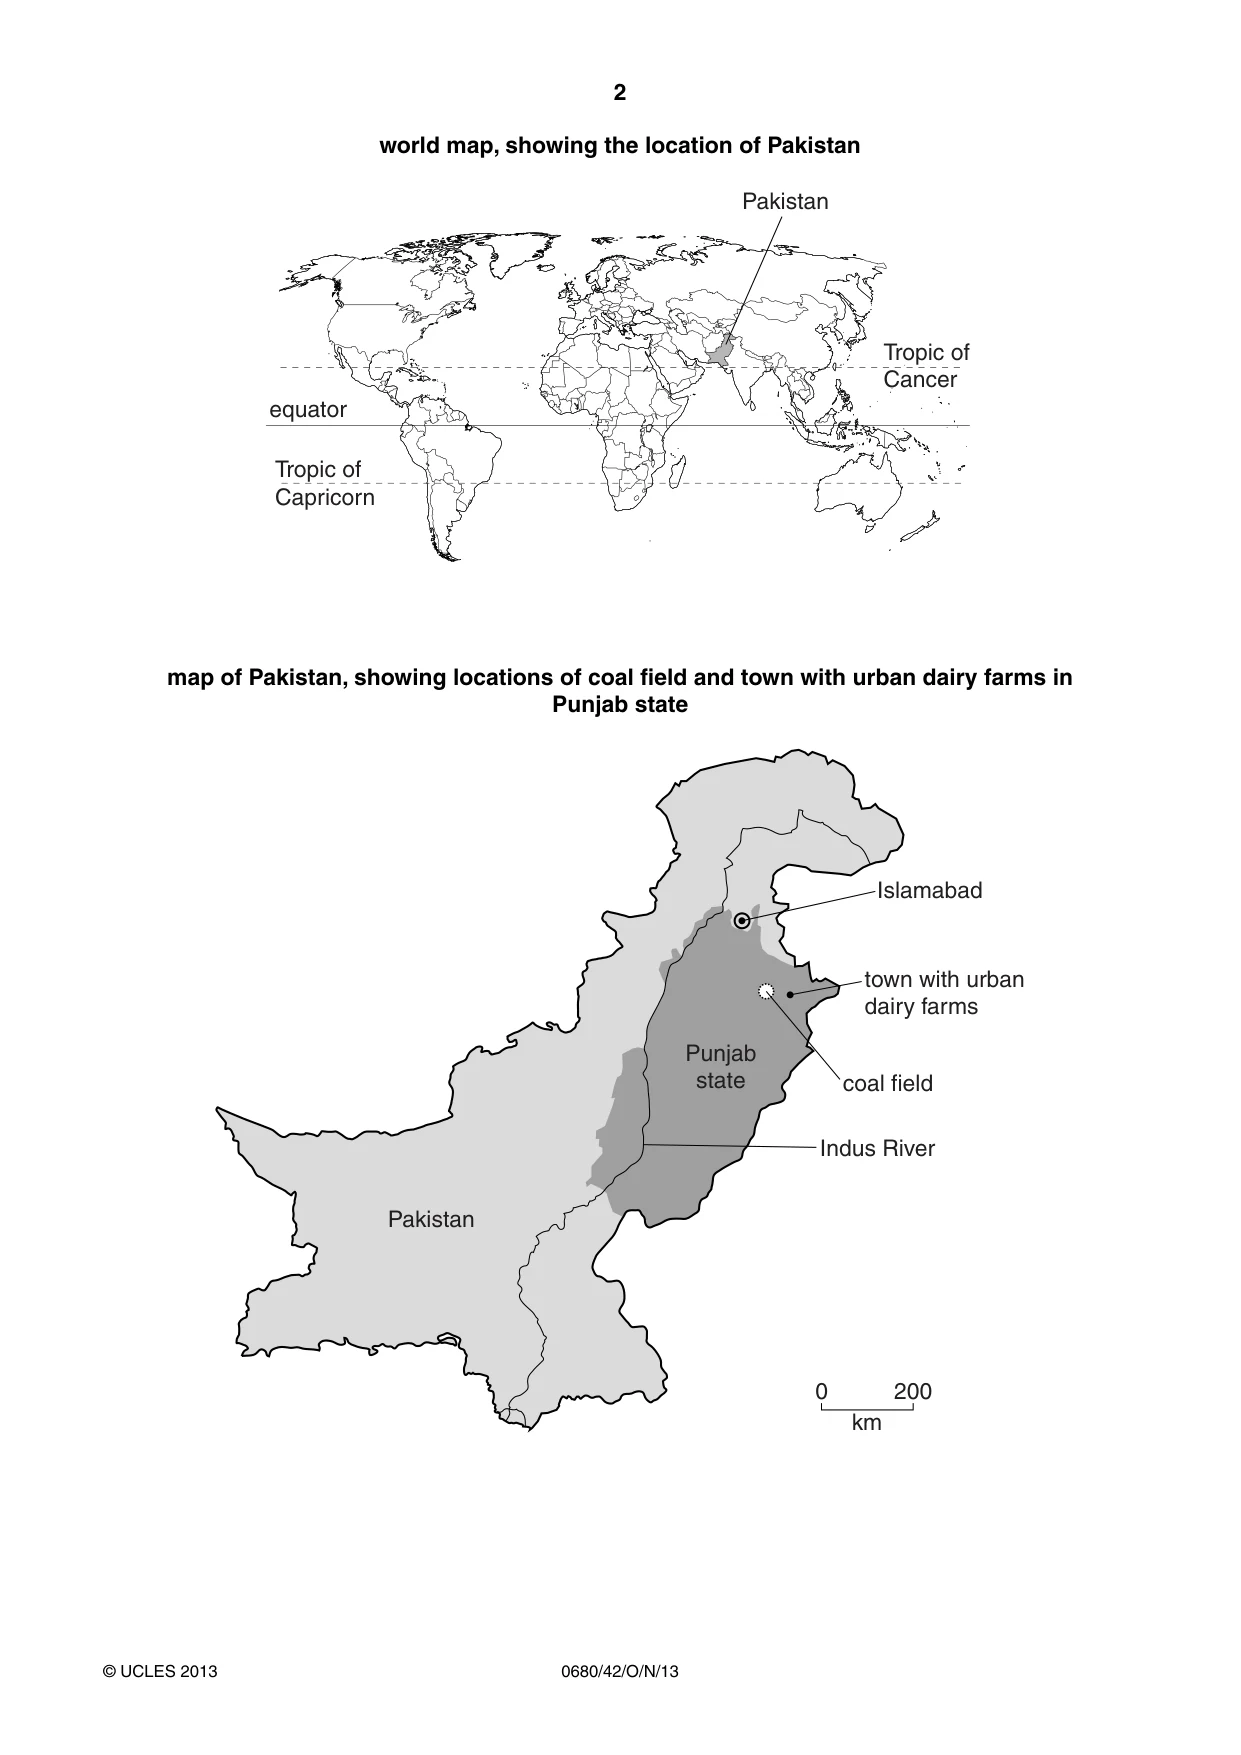
2 0680/42/O/N/13 © UCLES 2013 world map, showing the location of Pakistan Tropic of Cancer Tropic of Capricorn Pakistan equator map of Pakistan, showing locations of coal field and town with urban dairy farms in Punjab state Punjab state Indus River coal field town with urban dairy farms Islamabad Pakistan 200 km 0
Question paper, page 3
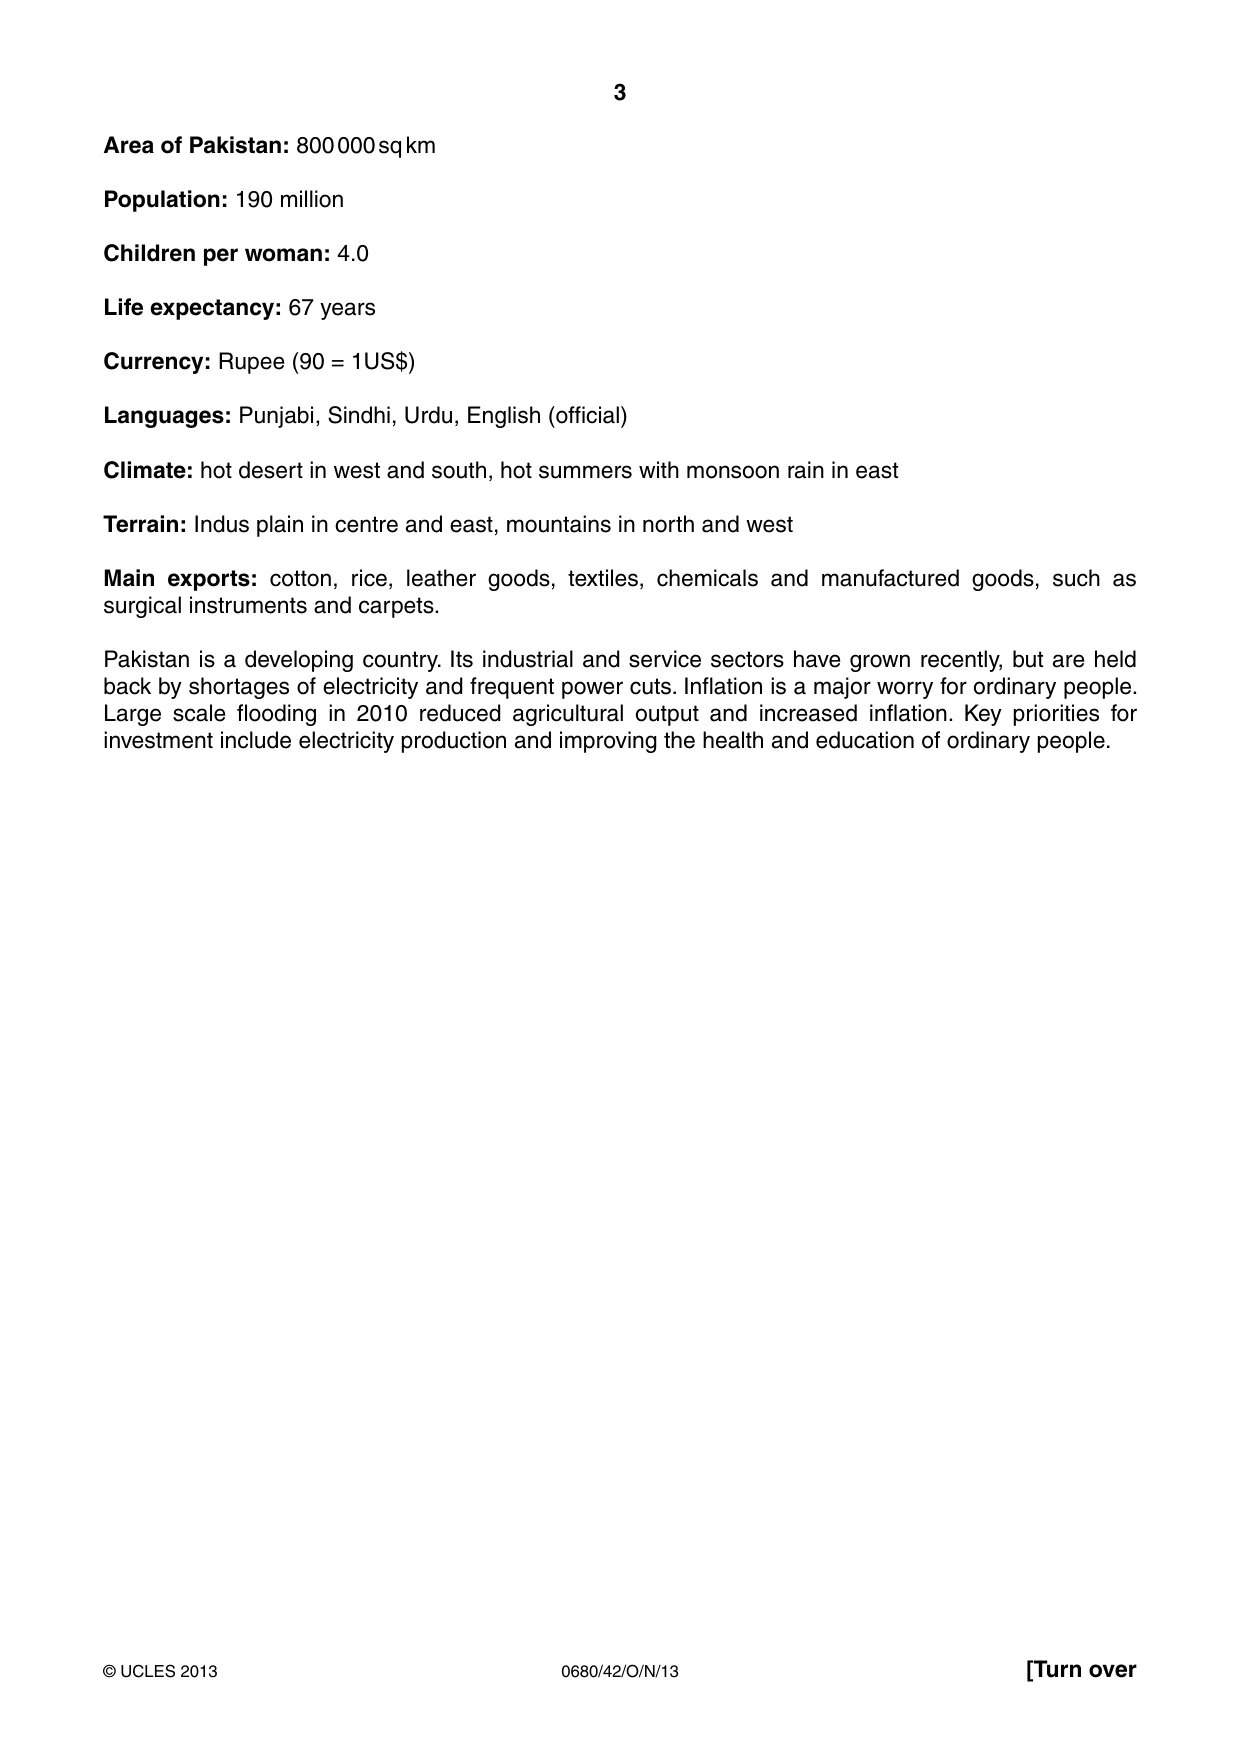
3 0680/42/O/N/13 © UCLES 2013 [Turn over Area of Pakistan: 800 000 sq km Population: 190 million Children per woman: 4.0 Life expectancy: 67 years Currency: Rupee (90 = 1US$) Languages: Punjabi, Sindhi, Urdu, English (official) Climate: hot desert in west and south, hot summers with monsoon rain in east Terrain: Indus plain in centre and east, mountains in north and west Main exports: cotton, rice, leather goods, textiles, chemicals and manufactured goods, such as surgical instruments and carpets. Pakistan is a developing country. Its industrial and service sectors have grown recently, but are held back by shortages of electricity and frequent power cuts. Inflation is a major worry for ordinary people. Large scale flooding in 2010 reduced agricultural output and increased inflation. Key priorities for investment include electricity production and improving the health and education of ordinary people.
Question paper, page 4
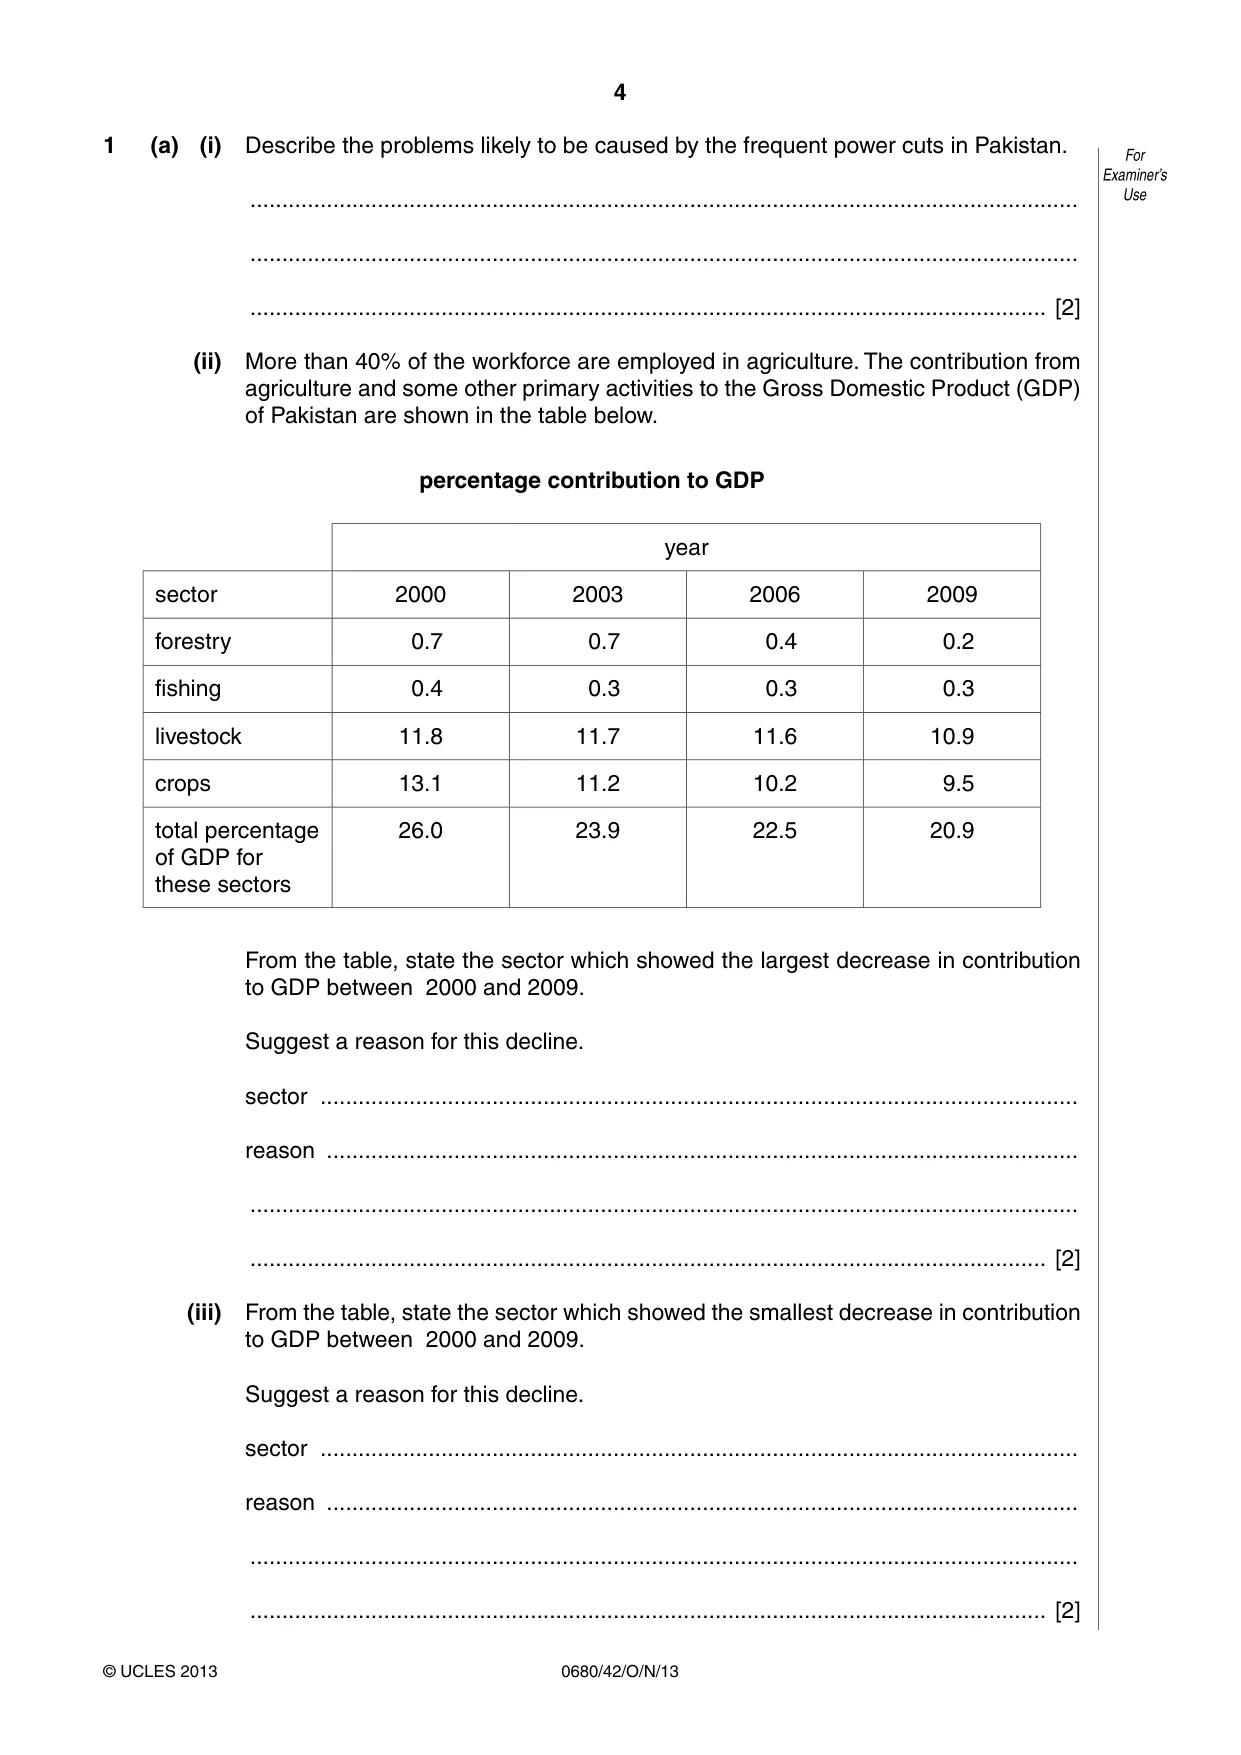
4 0680/42/O/N/13 © UCLES 2013 For Examiner’s Use 1 (a) (i) Describe the problems likely to be caused by the frequent power cuts in Pakistan. … … … [2] (ii) More than 40% of the workforce are employed in agriculture. The contribution from agriculture and some other primary activities to the Gross Domestic Product (GDP) of Pakistan are shown in the table below. percentage contribution to GDP year sector 2000 2003 2006 2009 forestry 0.7 0.7 0.4 0.2 fishing 0.4 0.3 0.3 0.3 livestock 11.8 11.7 11.6 10.9 crops 13.1 11.2 10.2 9.5 total percentage of GDP for these sectors 26.0 23.9 22.5 20.9 From the table, state the sector which showed the largest decrease in contribution to GDP between 2000 and 2009. Suggest a reason for this decline. sector … reason … … … [2] (iii) From the table, state the sector which showed the smallest decrease in contribution to GDP between 2000 and 2009. Suggest a reason for this decline. sector … reason … … … [2]
Question paper, page 5
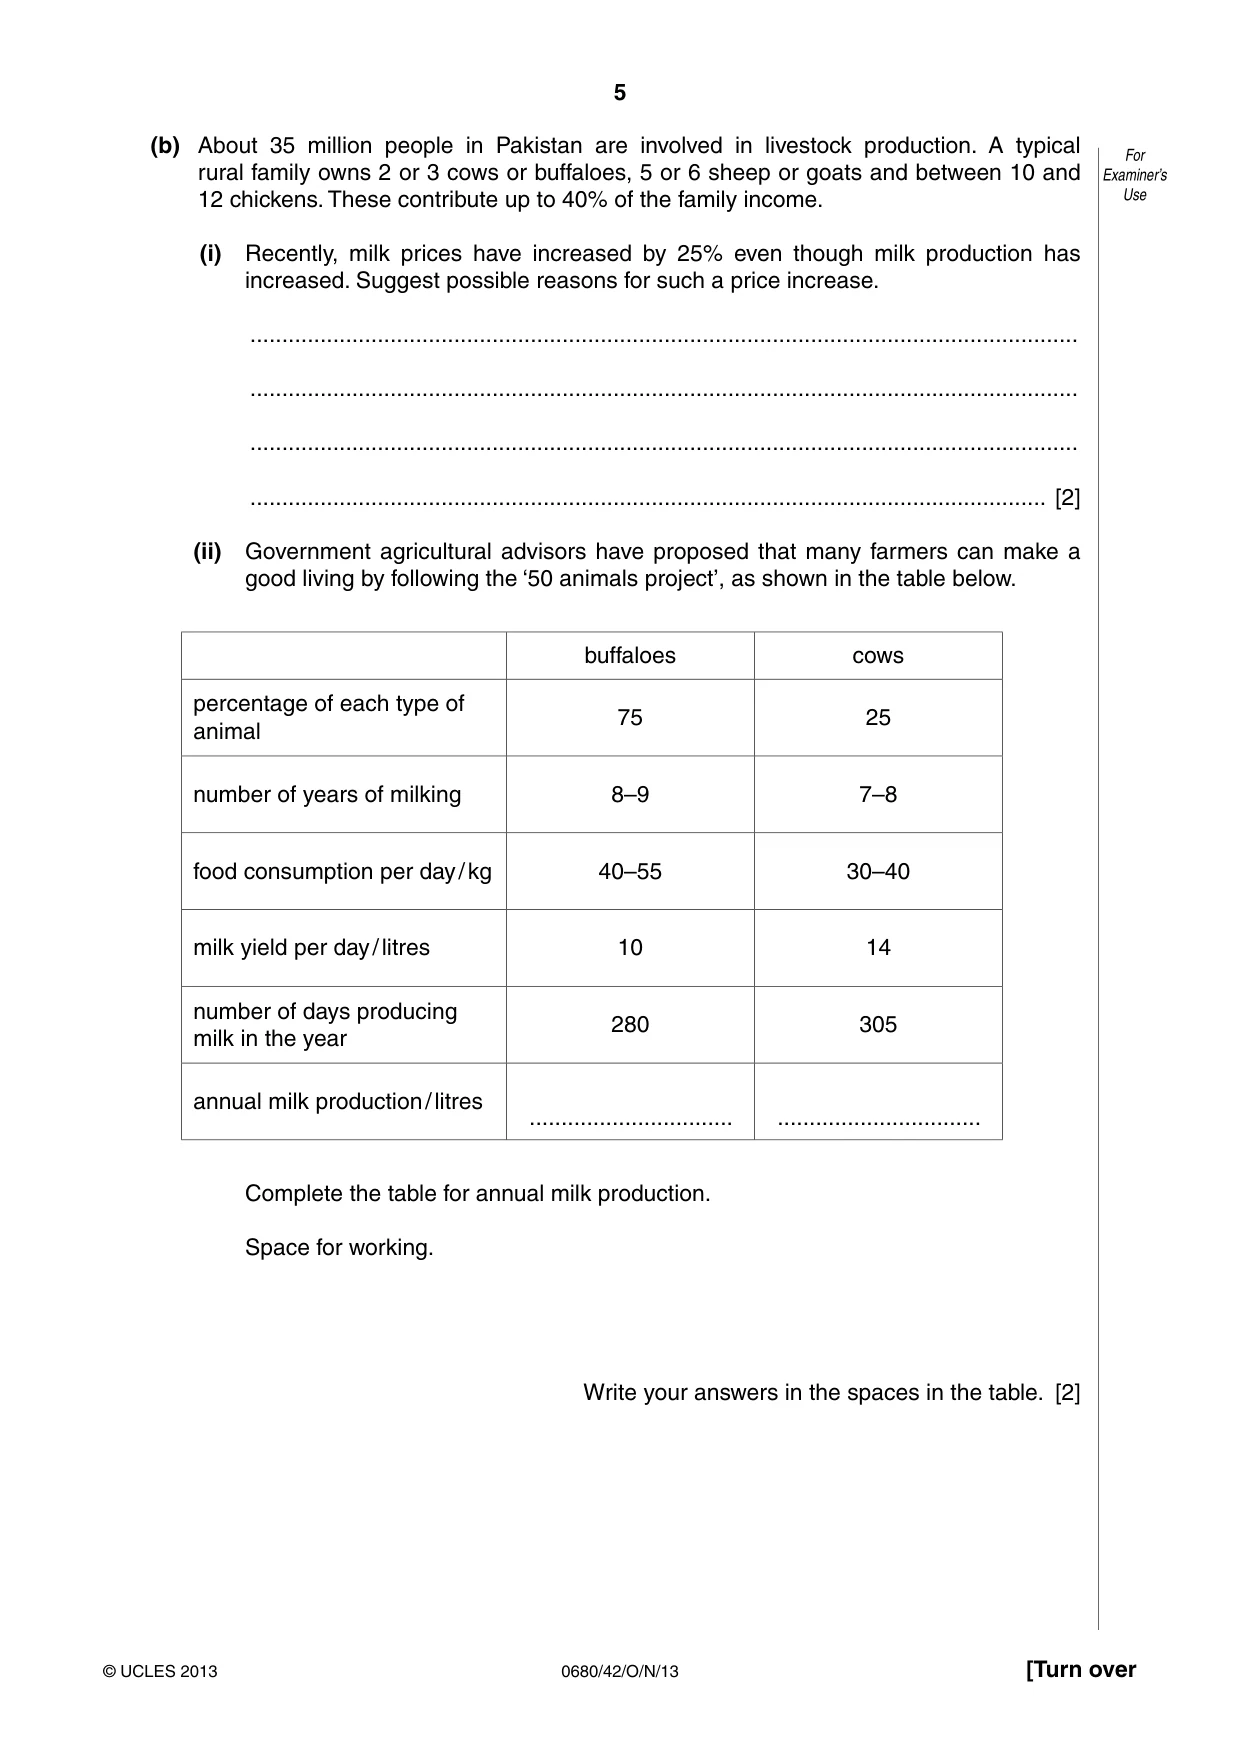
5 0680/42/O/N/13 © UCLES 2013 [Turn over For Examiner’s Use (b) About 35 million people in Pakistan are involved in livestock production. A typical rural family owns 2 or 3 cows or buffaloes, 5 or 6 sheep or goats and between 10 and 12 chickens. These contribute up to 40% of the family income. (i) Recently, milk prices have increased by 25% even though milk production has increased. Suggest possible reasons for such a price increase. … … … … [2] (ii) Government agricultural advisors have proposed that many farmers can make a good living by following the ‘50 animals project’, as shown in the table below. buffaloes cows percentage of each type of animal 75 25 number of years of milking 8–9 7–8 food consumption per day / kg 40–55 30–40 milk yield per day / litres 10 14 number of days producing milk in the year 280 305 annual milk production / litres … … Complete the table for annual milk production. Space for working. Write your answers in the spaces in the table. [2]
Question paper, page 6
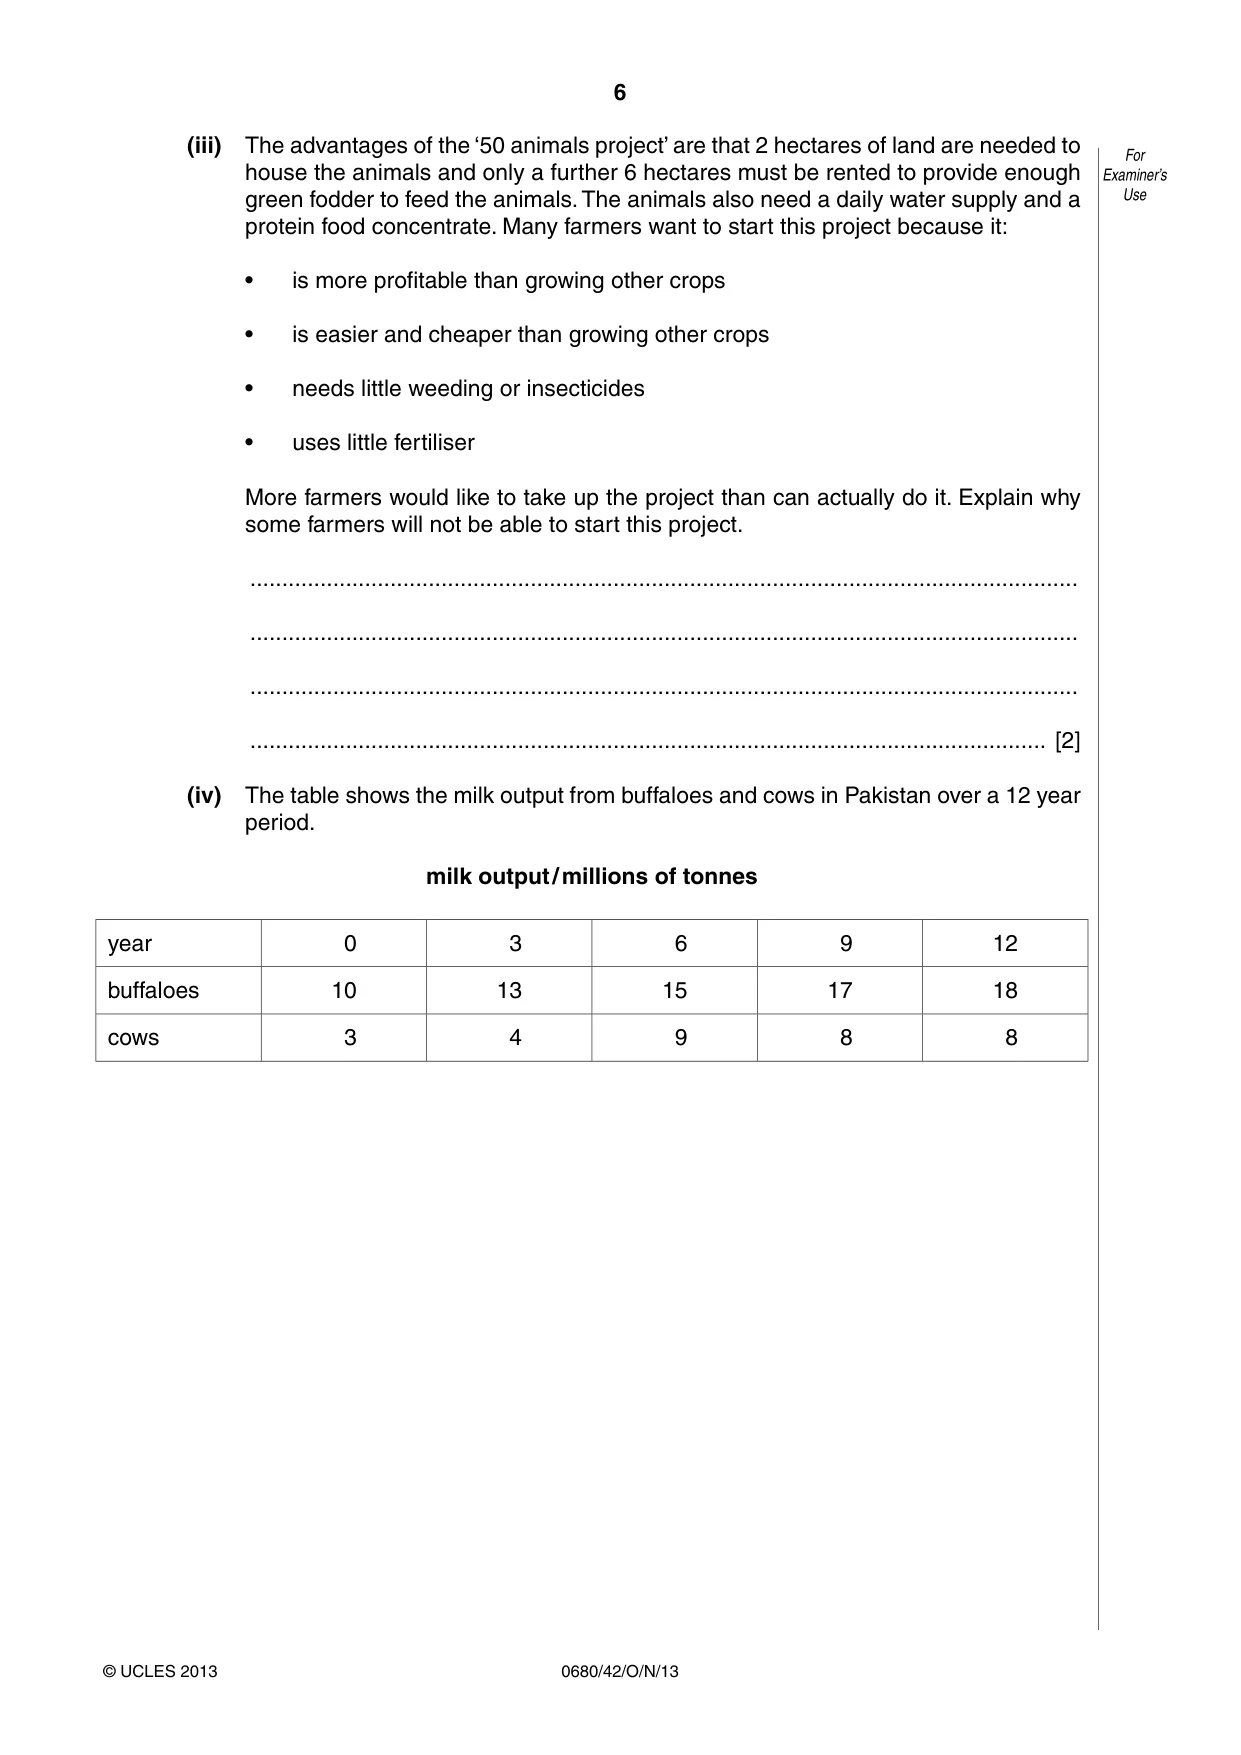
6 0680/42/O/N/13 © UCLES 2013 For Examiner’s Use (iii) The advantages of the ‘50 animals project’ are that 2 hectares of land are needed to house the animals and only a further 6 hectares must be rented to provide enough green fodder to feed the animals. The animals also need a daily water supply and a protein food concentrate. Many farmers want to start this project because it: • is more profitable than growing other crops • is easier and cheaper than growing other crops • needs little weeding or insecticides • uses little fertiliser More farmers would like to take up the project than can actually do it. Explain why some farmers will not be able to start this project. … … … … [2] (iv) The table shows the milk output from buffaloes and cows in Pakistan over a 12 year period. milk output / millions of tonnes year 0 3 6 9 12 buffaloes 10 13 15 17 18 cows 3 4 9 8 8
Question paper, page 7
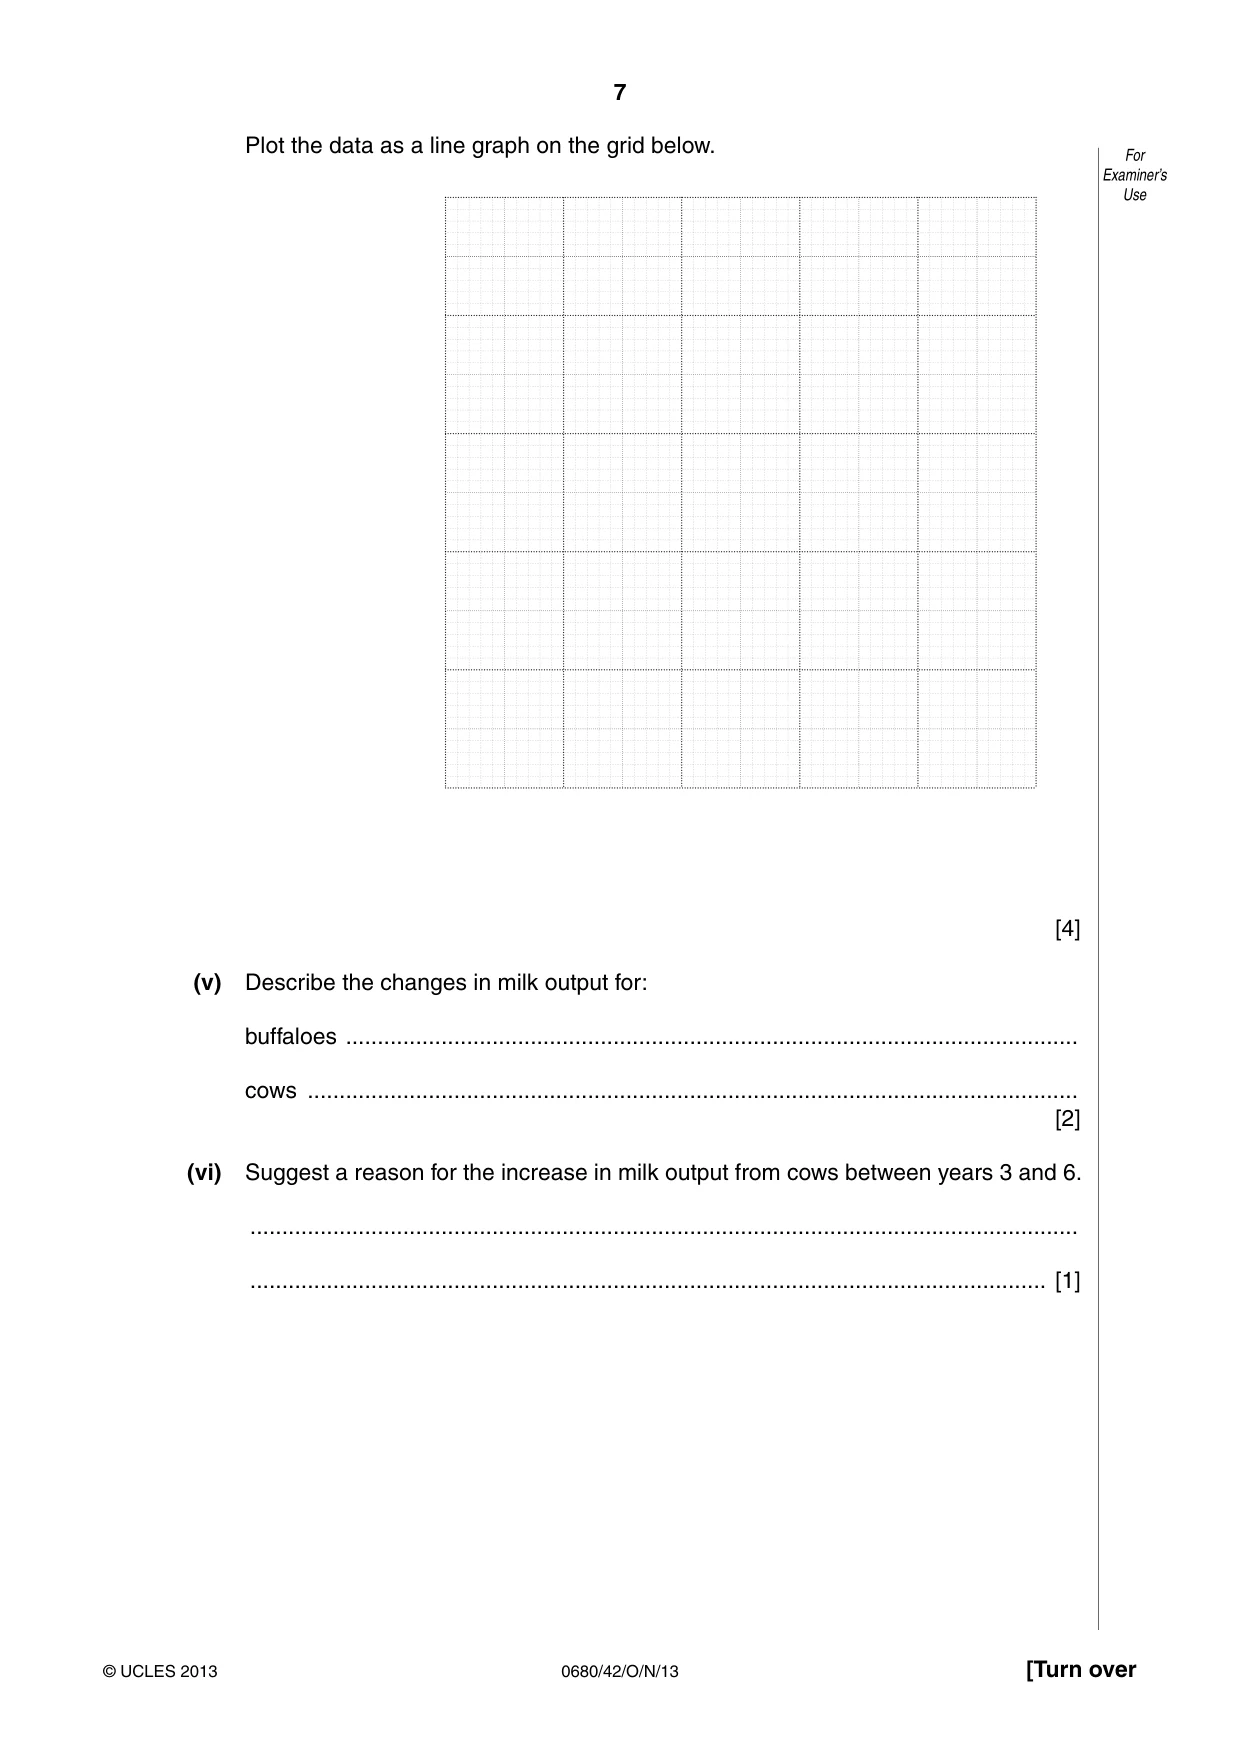
7 0680/42/O/N/13 © UCLES 2013 [Turn over For Examiner’s Use Plot the data as a line graph on the grid below. [4] (v) Describe the changes in milk output for: buffaloes … cows … [2] (vi) Suggest a reason for the increase in milk output from cows between years 3 and 6. … … [1]
Question paper, page 8
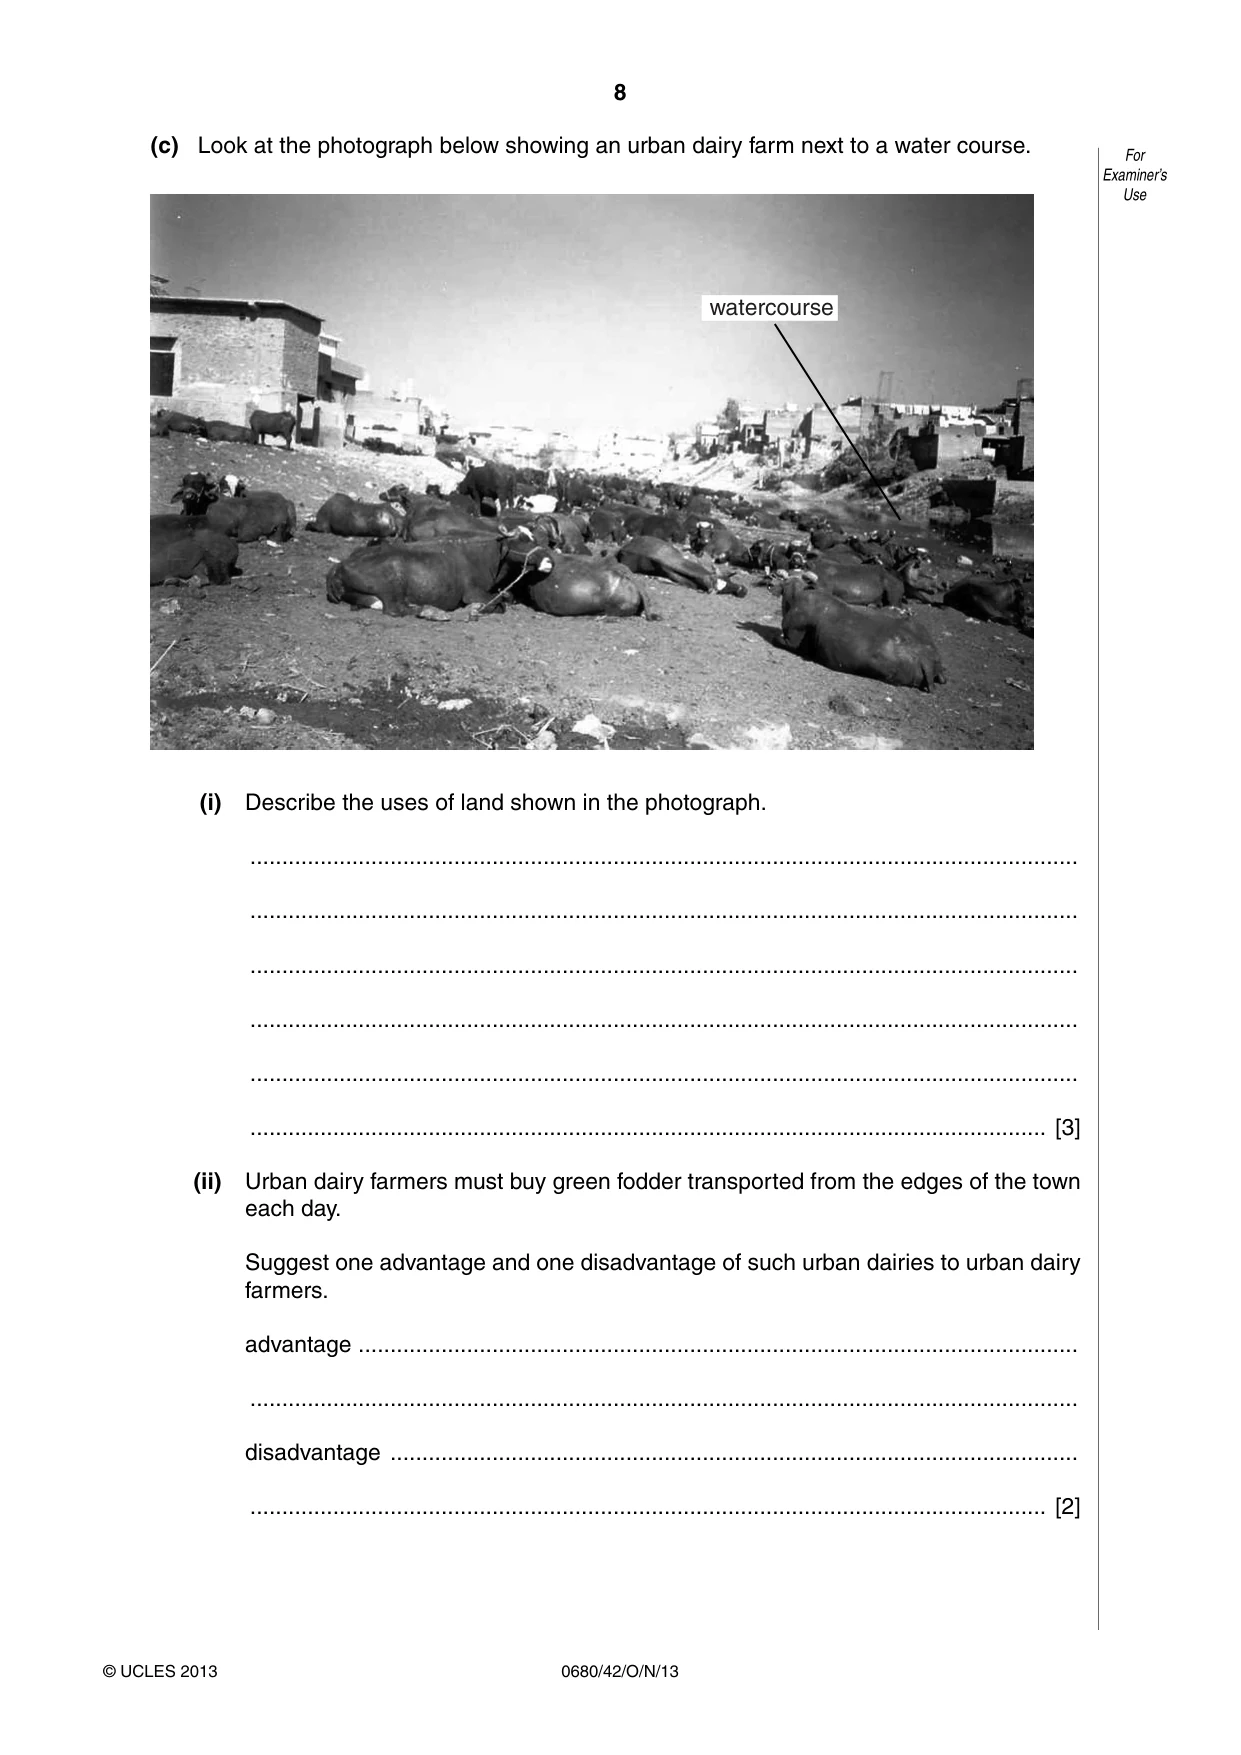
8 0680/42/O/N/13 © UCLES 2013 For Examiner’s Use (c) Look at the photograph below showing an urban dairy farm next to a water course. watercourse (i) Describe the uses of land shown in the photograph. … … … … … … [3] (ii) Urban dairy farmers must buy green fodder transported from the edges of the town each day. Suggest one advantage and one disadvantage of such urban dairies to urban dairy farmers. advantage … … disadvantage … … [2]
Question paper, page 9
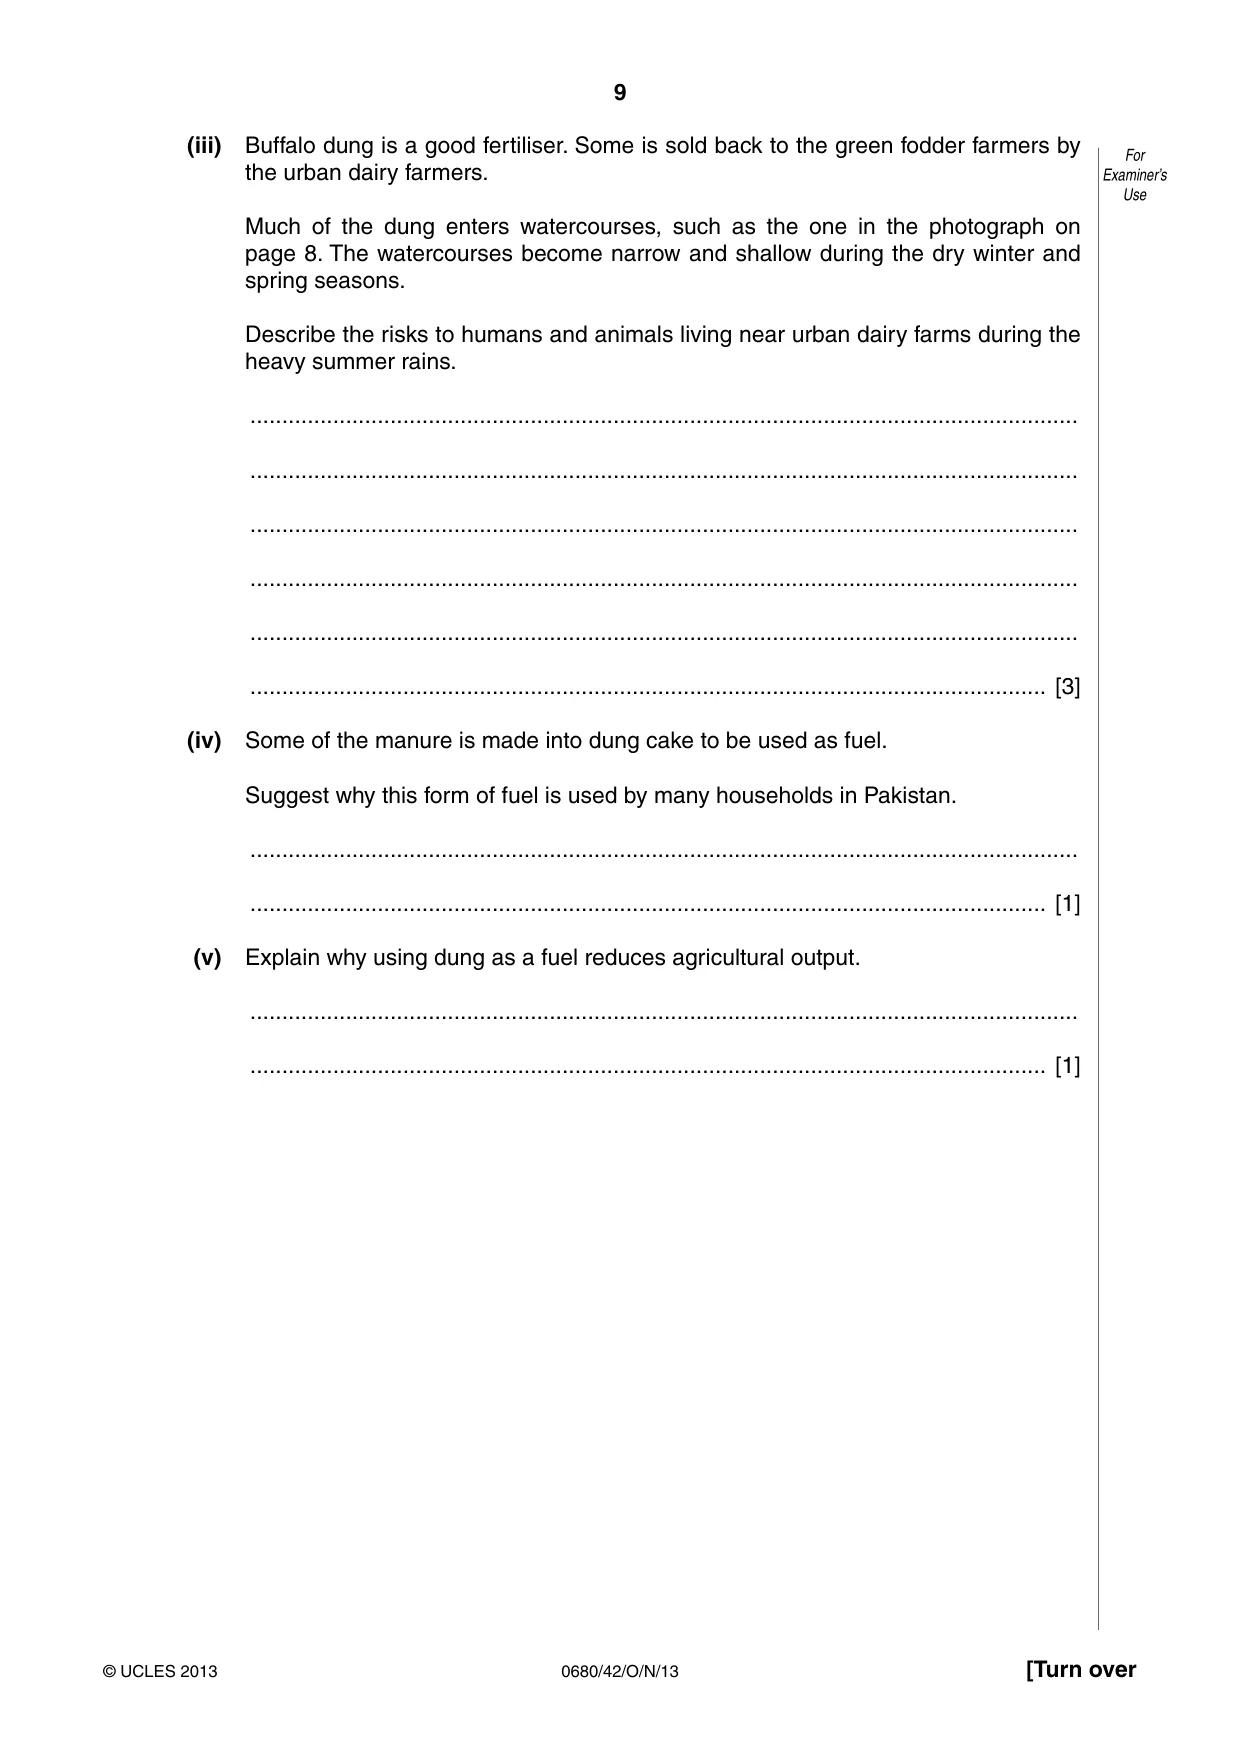
9 0680/42/O/N/13 © UCLES 2013 [Turn over For Examiner’s Use (iii) Buffalo dung is a good fertiliser. Some is sold back to the green fodder farmers by the urban dairy farmers. Much of the dung enters watercourses, such as the one in the photograph on page 8. The watercourses become narrow and shallow during the dry winter and spring seasons. Describe the risks to humans and animals living near urban dairy farms during the heavy summer rains. … … … … … … [3] (iv) Some of the manure is made into dung cake to be used as fuel. Suggest why this form of fuel is used by many households in Pakistan. … … [1] (v) Explain why using dung as a fuel reduces agricultural output. … … [1]
Question paper, page 10
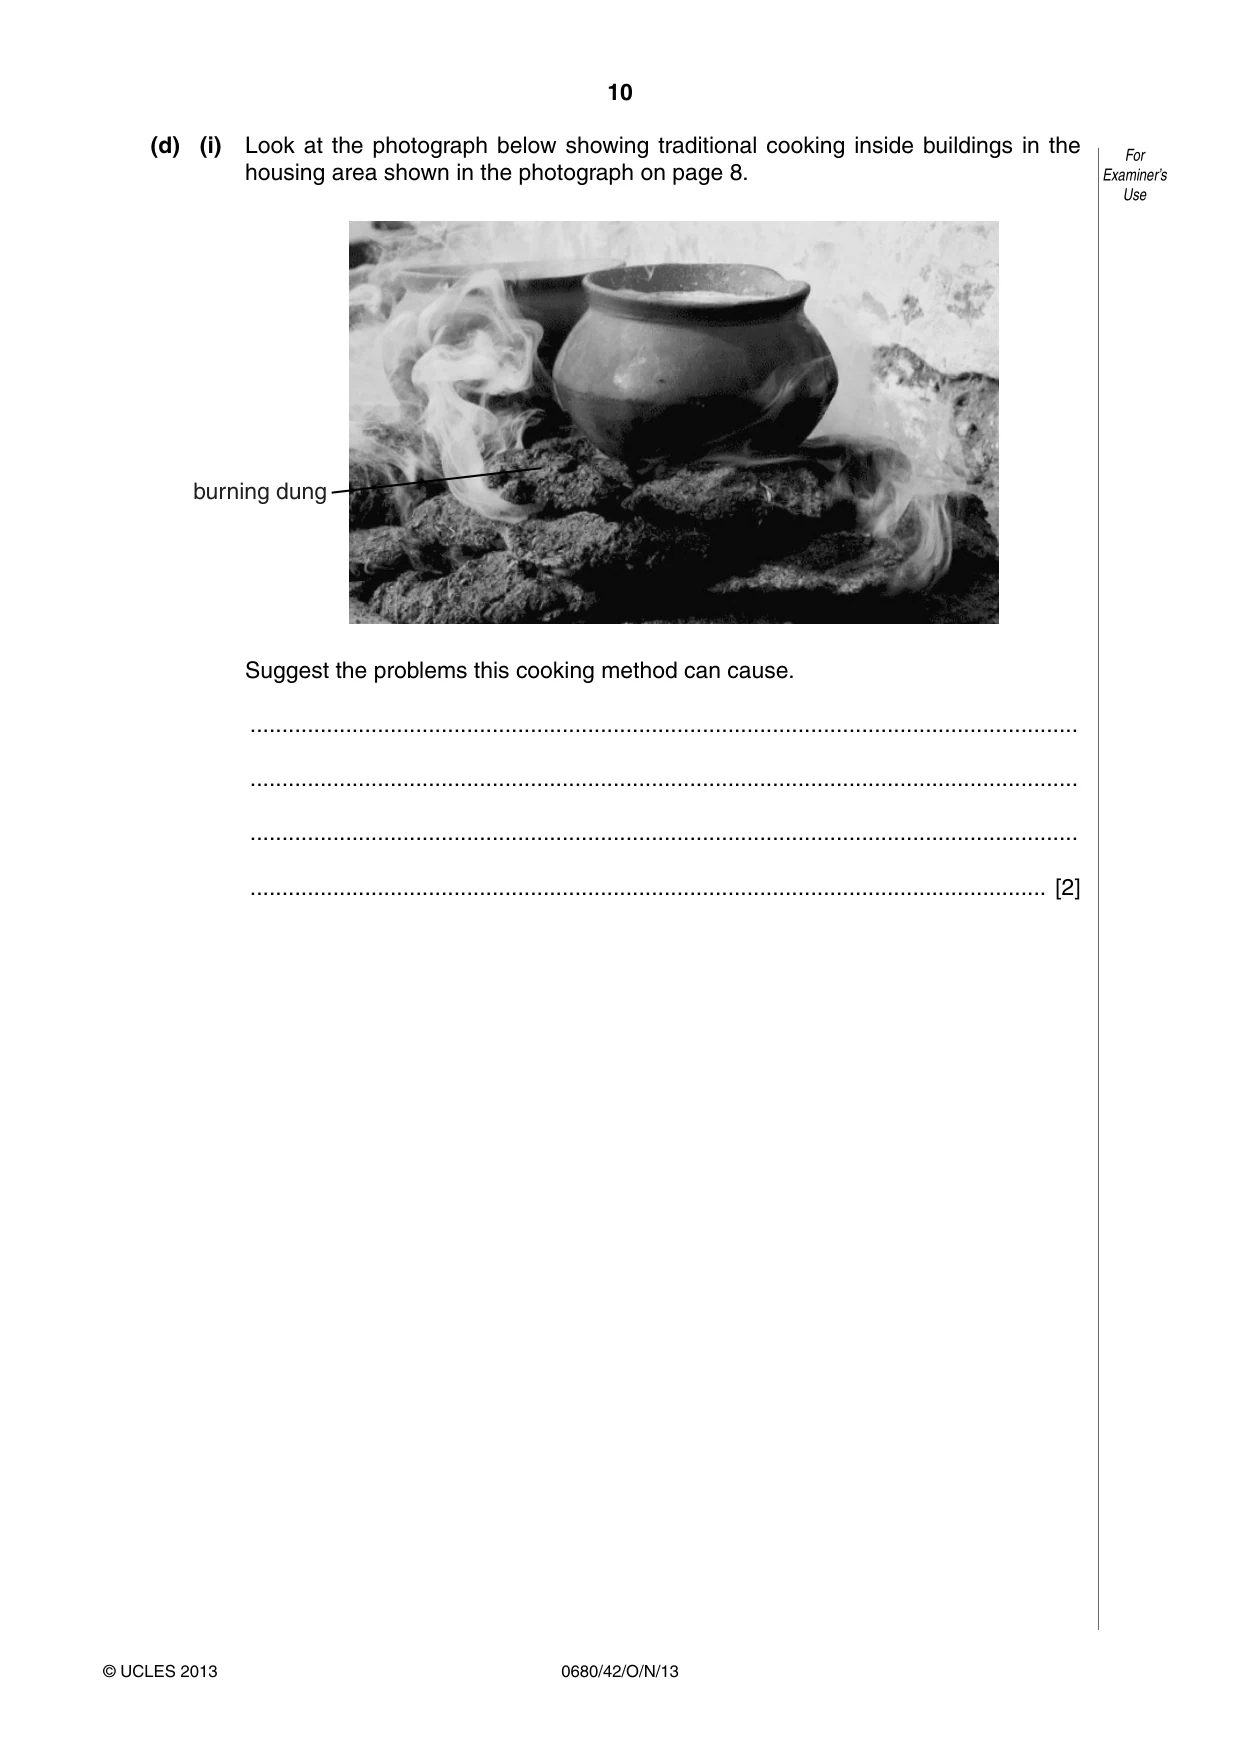
10 0680/42/O/N/13 © UCLES 2013 For Examiner’s Use (d) (i) Look at the photograph below showing traditional cooking inside buildings in the housing area shown in the photograph on page 8. burning dung Suggest the problems this cooking method can cause. … … … … [2]
Question paper, page 11
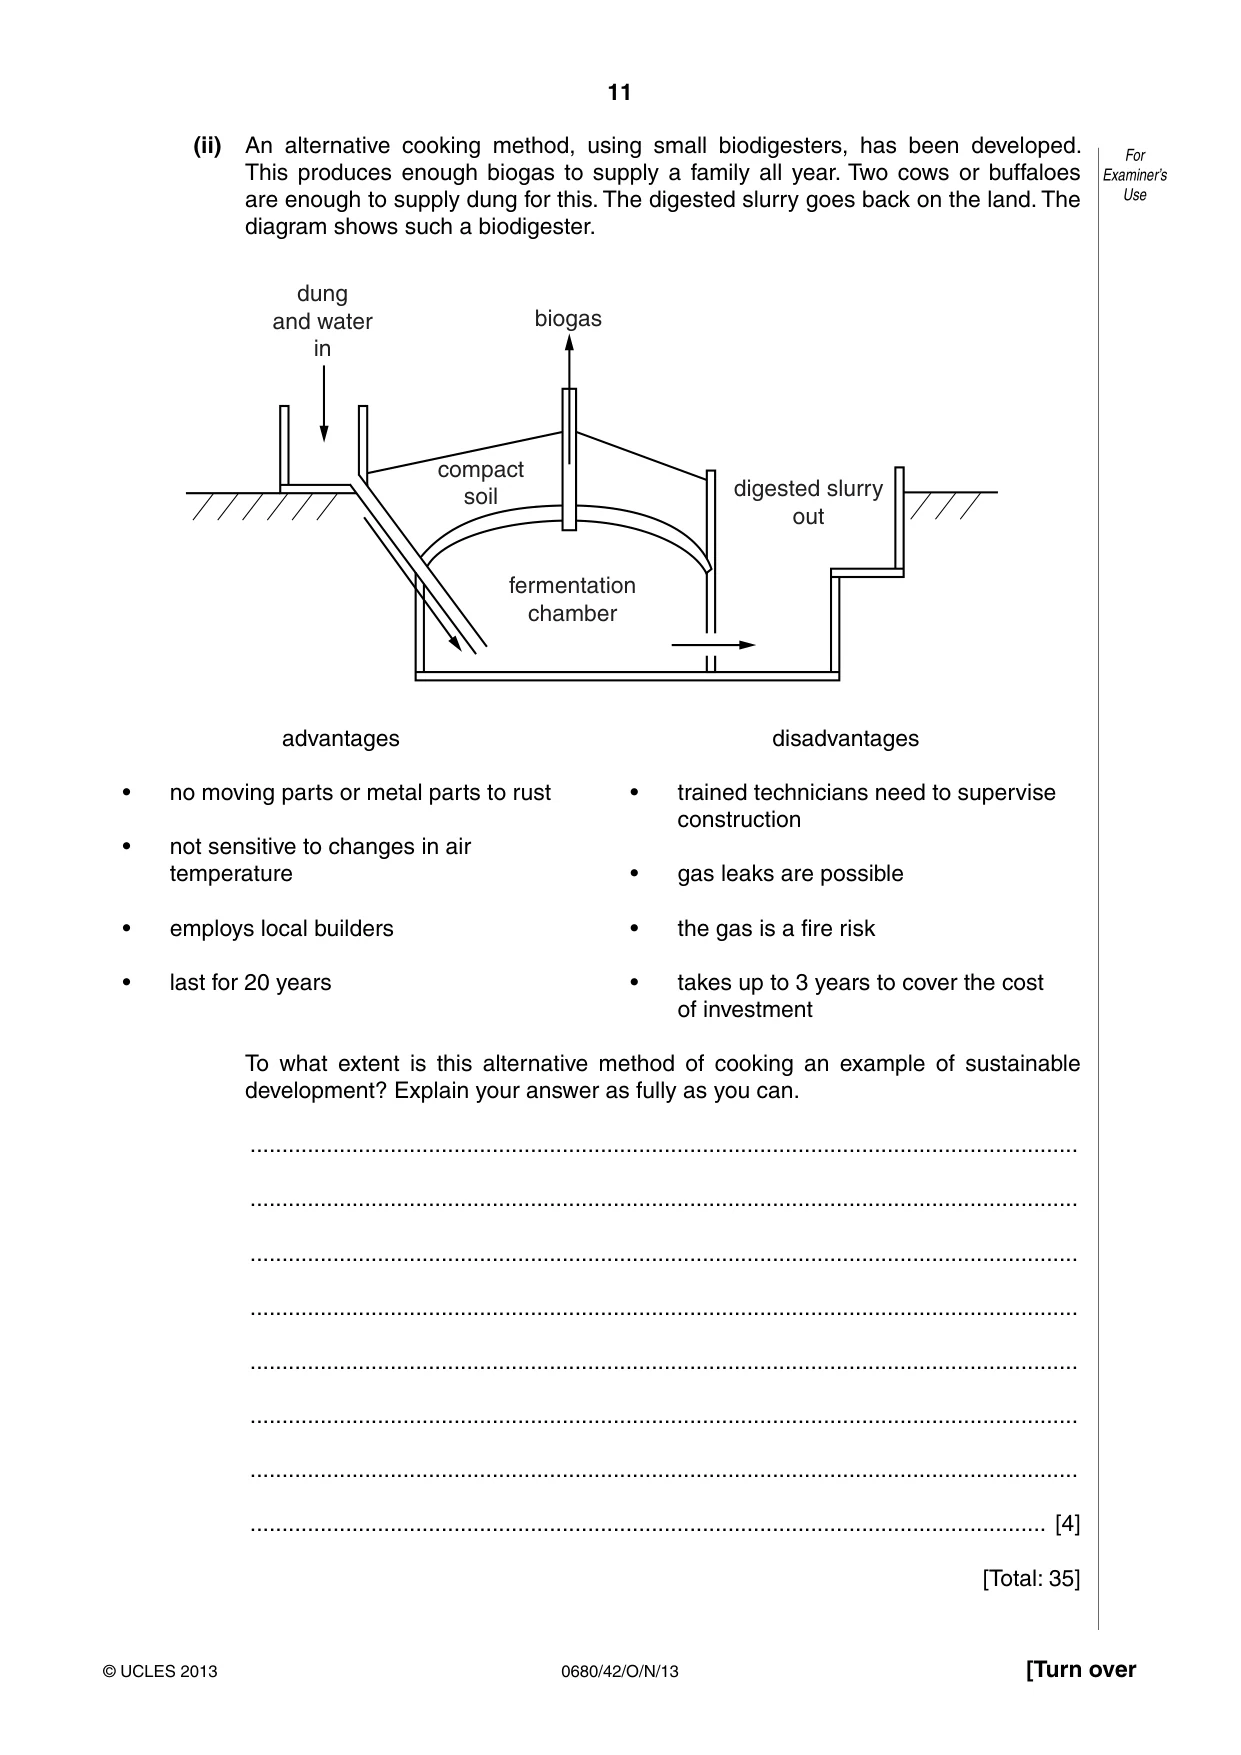
11 0680/42/O/N/13 © UCLES 2013 [Turn over For Examiner’s Use (ii) An alternative cooking method, using small biodigesters, has been developed. This produces enough biogas to supply a family all year. Two cows or buffaloes are enough to supply dung for this. The digested slurry goes back on the land. The diagram shows such a biodigester. digested slurry out compact soil fermentation chamber dung and water in biogas advantages • no moving parts or metal parts to rust • not sensitive to changes in air temperature • employs local builders • last for 20 years disadvantages • trained technicians need to supervise construction • gas leaks are possible • the gas is a fire risk • takes up to 3 years to cover the cost of investment To what extent is this alternative method of cooking an example of sustainable development? Explain your answer as fully as you can. … … … … … … … … [4] [Total: 35]
Question paper, page 12
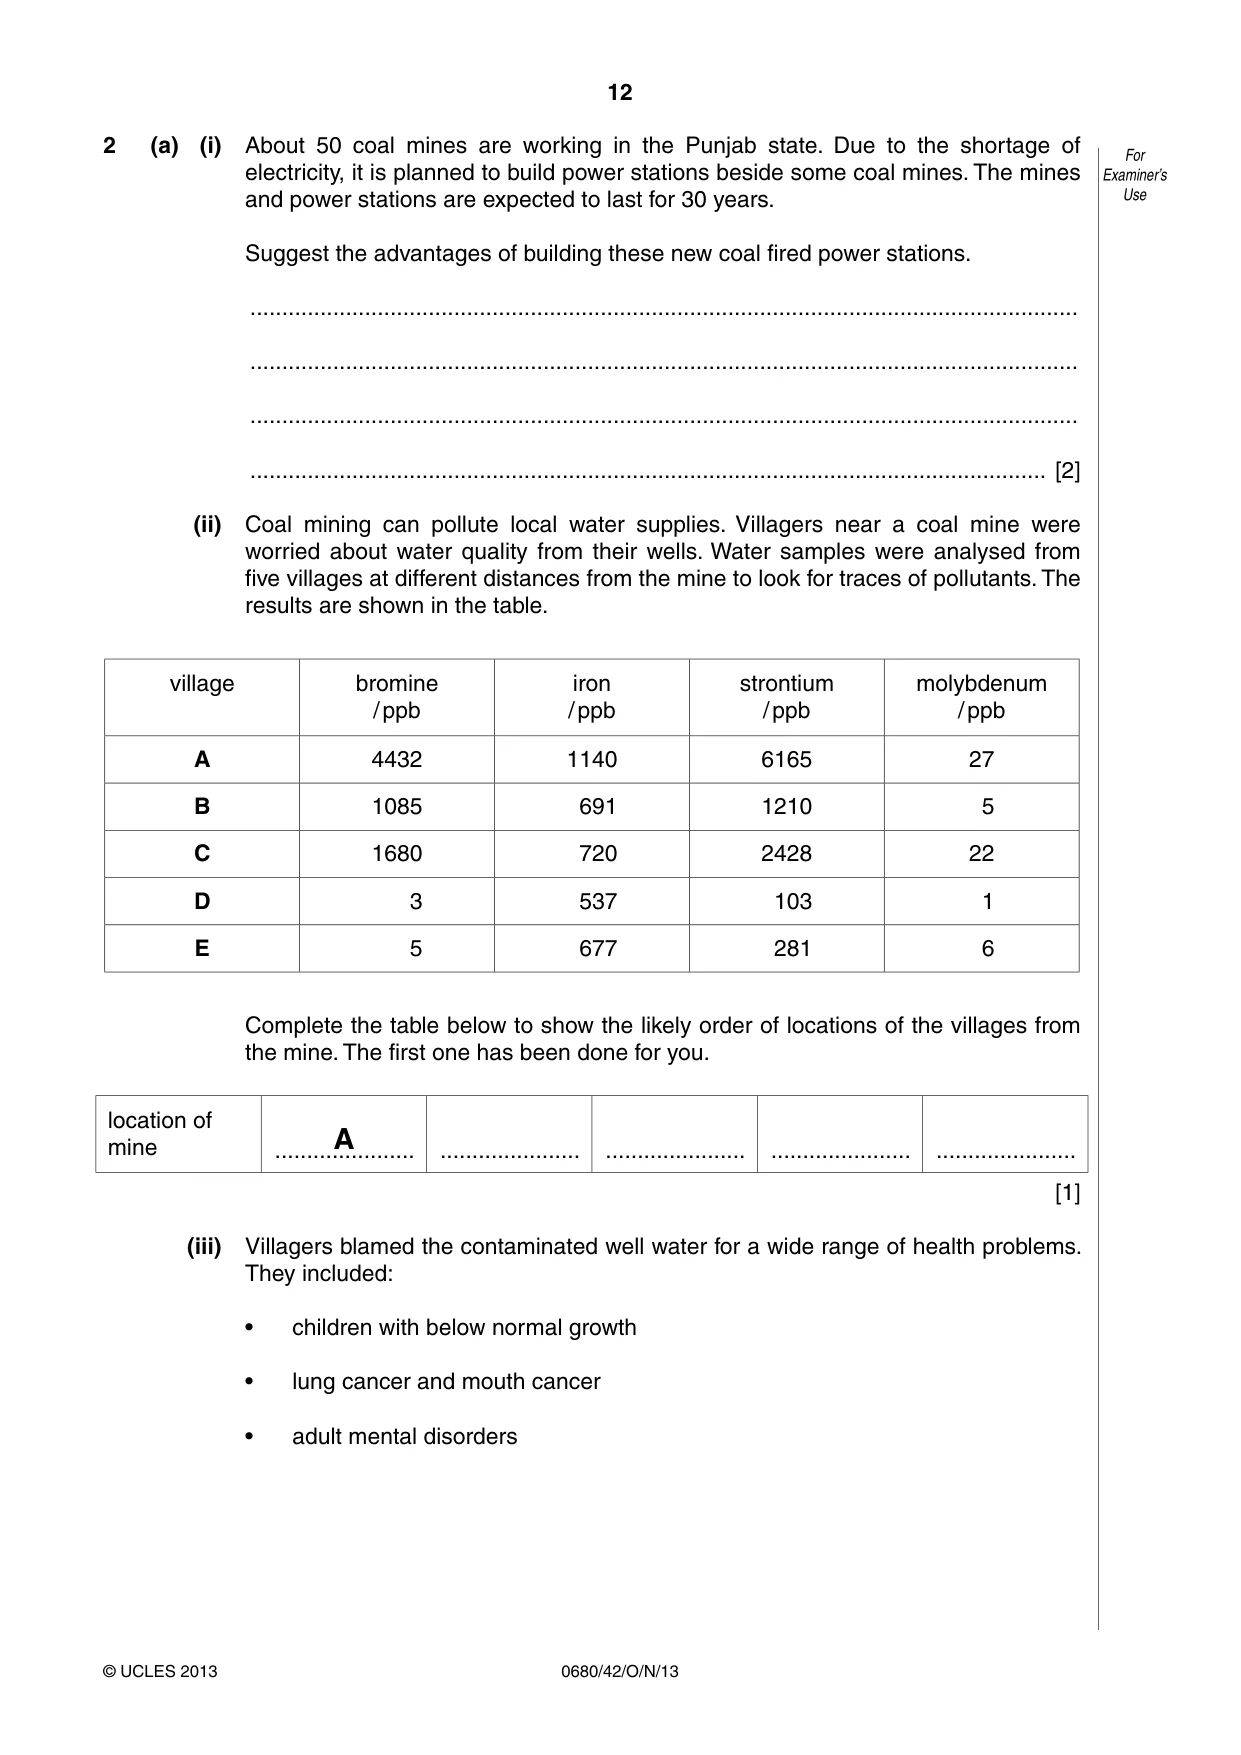
12 0680/42/O/N/13 © UCLES 2013 For Examiner’s Use 2 (a) (i) About 50 coal mines are working in the Punjab state. Due to the shortage of electricity, it is planned to build power stations beside some coal mines. The mines and power stations are expected to last for 30 years. Suggest the advantages of building these new coal fired power stations. … … … … [2] (ii) Coal mining can pollute local water supplies. Villagers near a coal mine were worried about water quality from their wells. Water samples were analysed from five villages at different distances from the mine to look for traces of pollutants. The results are shown in the table. village bromine / ppb iron / ppb strontium / ppb molybdenum / ppb A 4432 1140 6165 27 B 1085 691 1210 5 C 1680 720 2428 22 D 3 537 103 1 E 5 677 281 6 Complete the table below to show the likely order of locations of the villages from the mine. The first one has been done for you. location of mine A … … … … … [1] (iii) Villagers blamed the contaminated well water for a wide range of health problems. They included: • children with below normal growth • lung cancer and mouth cancer • adult mental disorders
Question paper, page 13
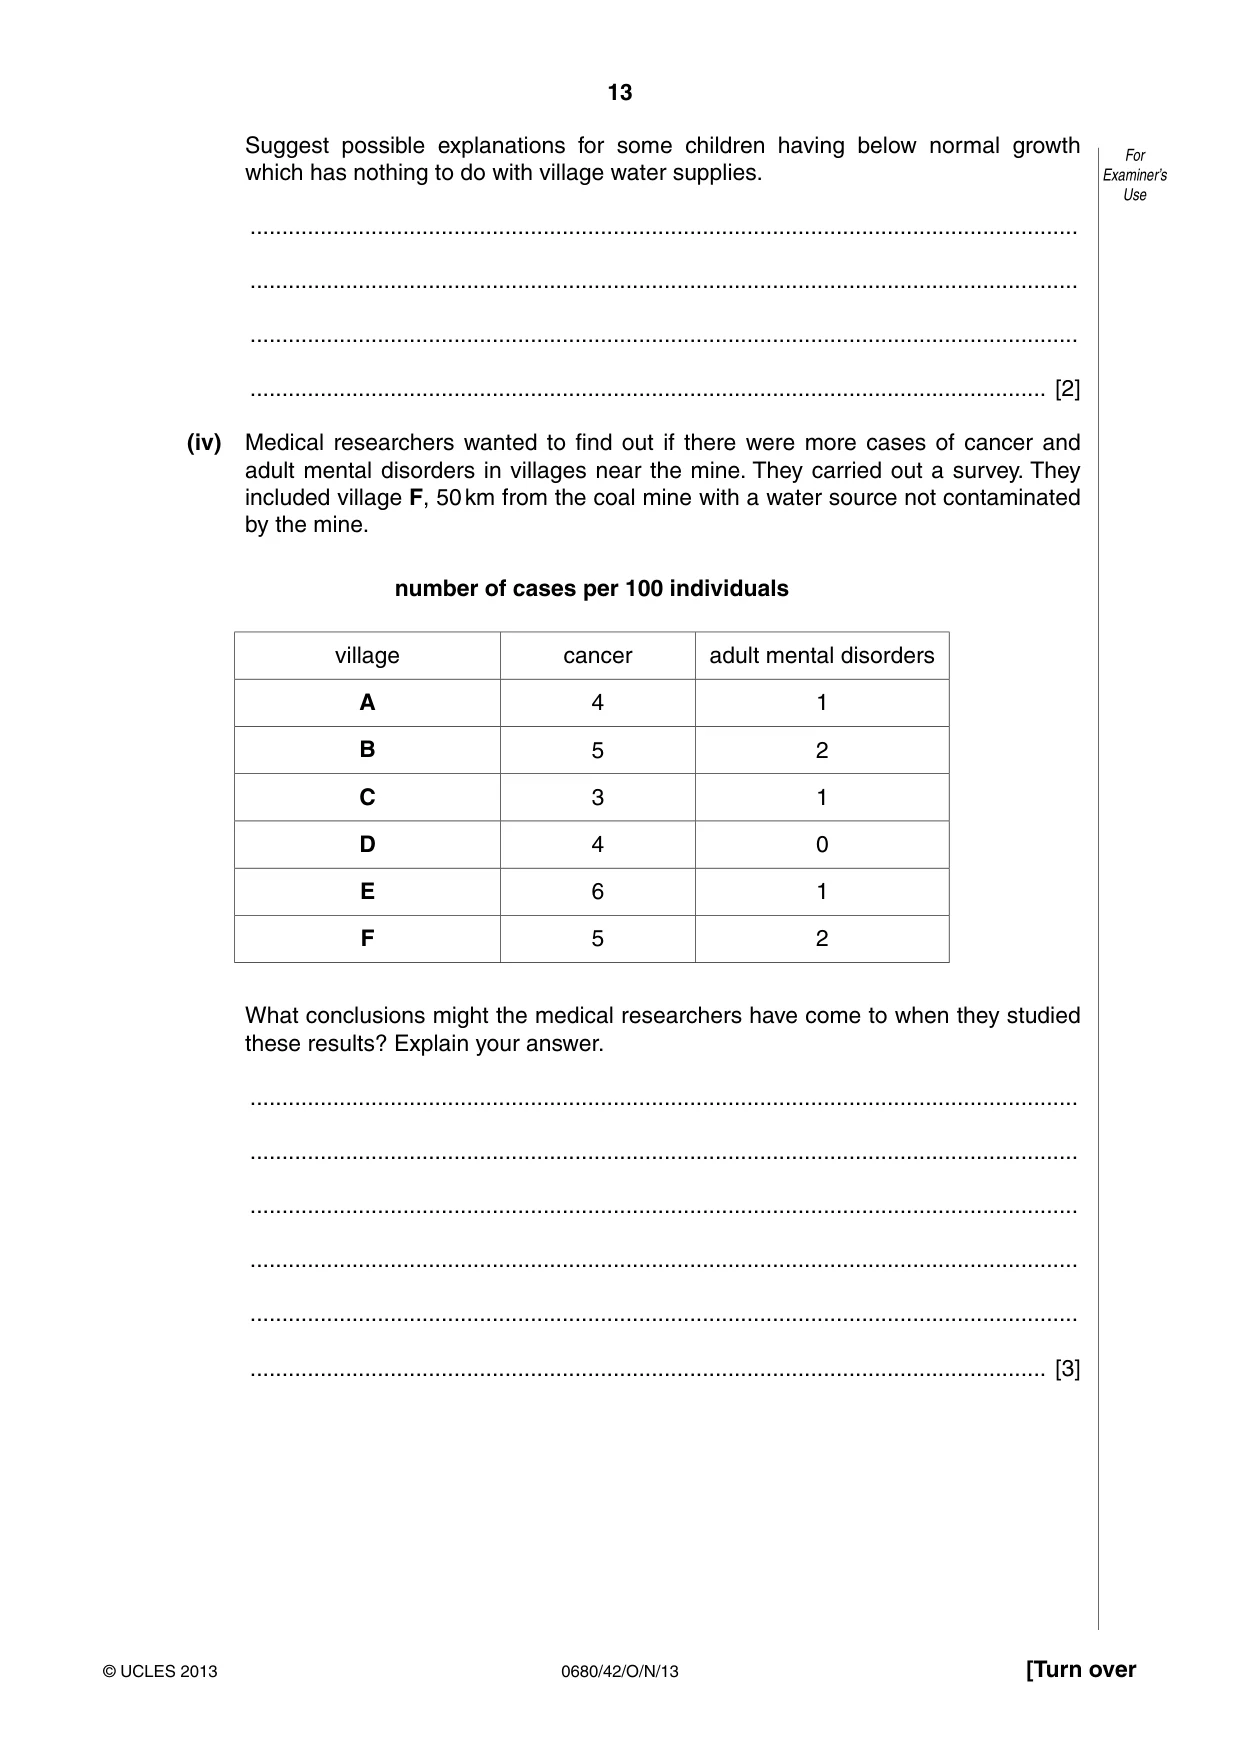
13 0680/42/O/N/13 © UCLES 2013 [Turn over For Examiner’s Use Suggest possible explanations for some children having below normal growth which has nothing to do with village water supplies. … … … … [2] (iv) Medical researchers wanted to find out if there were more cases of cancer and adult mental disorders in villages near the mine. They carried out a survey. They included village F, 50 km from the coal mine with a water source not contaminated by the mine. number of cases per 100 individuals village cancer adult mental disorders A 4 1 B 5 2 C 3 1 D 4 0 E 6 1 F 5 2 What conclusions might the medical researchers have come to when they studied these results? Explain your answer. … … … … … … [3]
Question paper, page 14
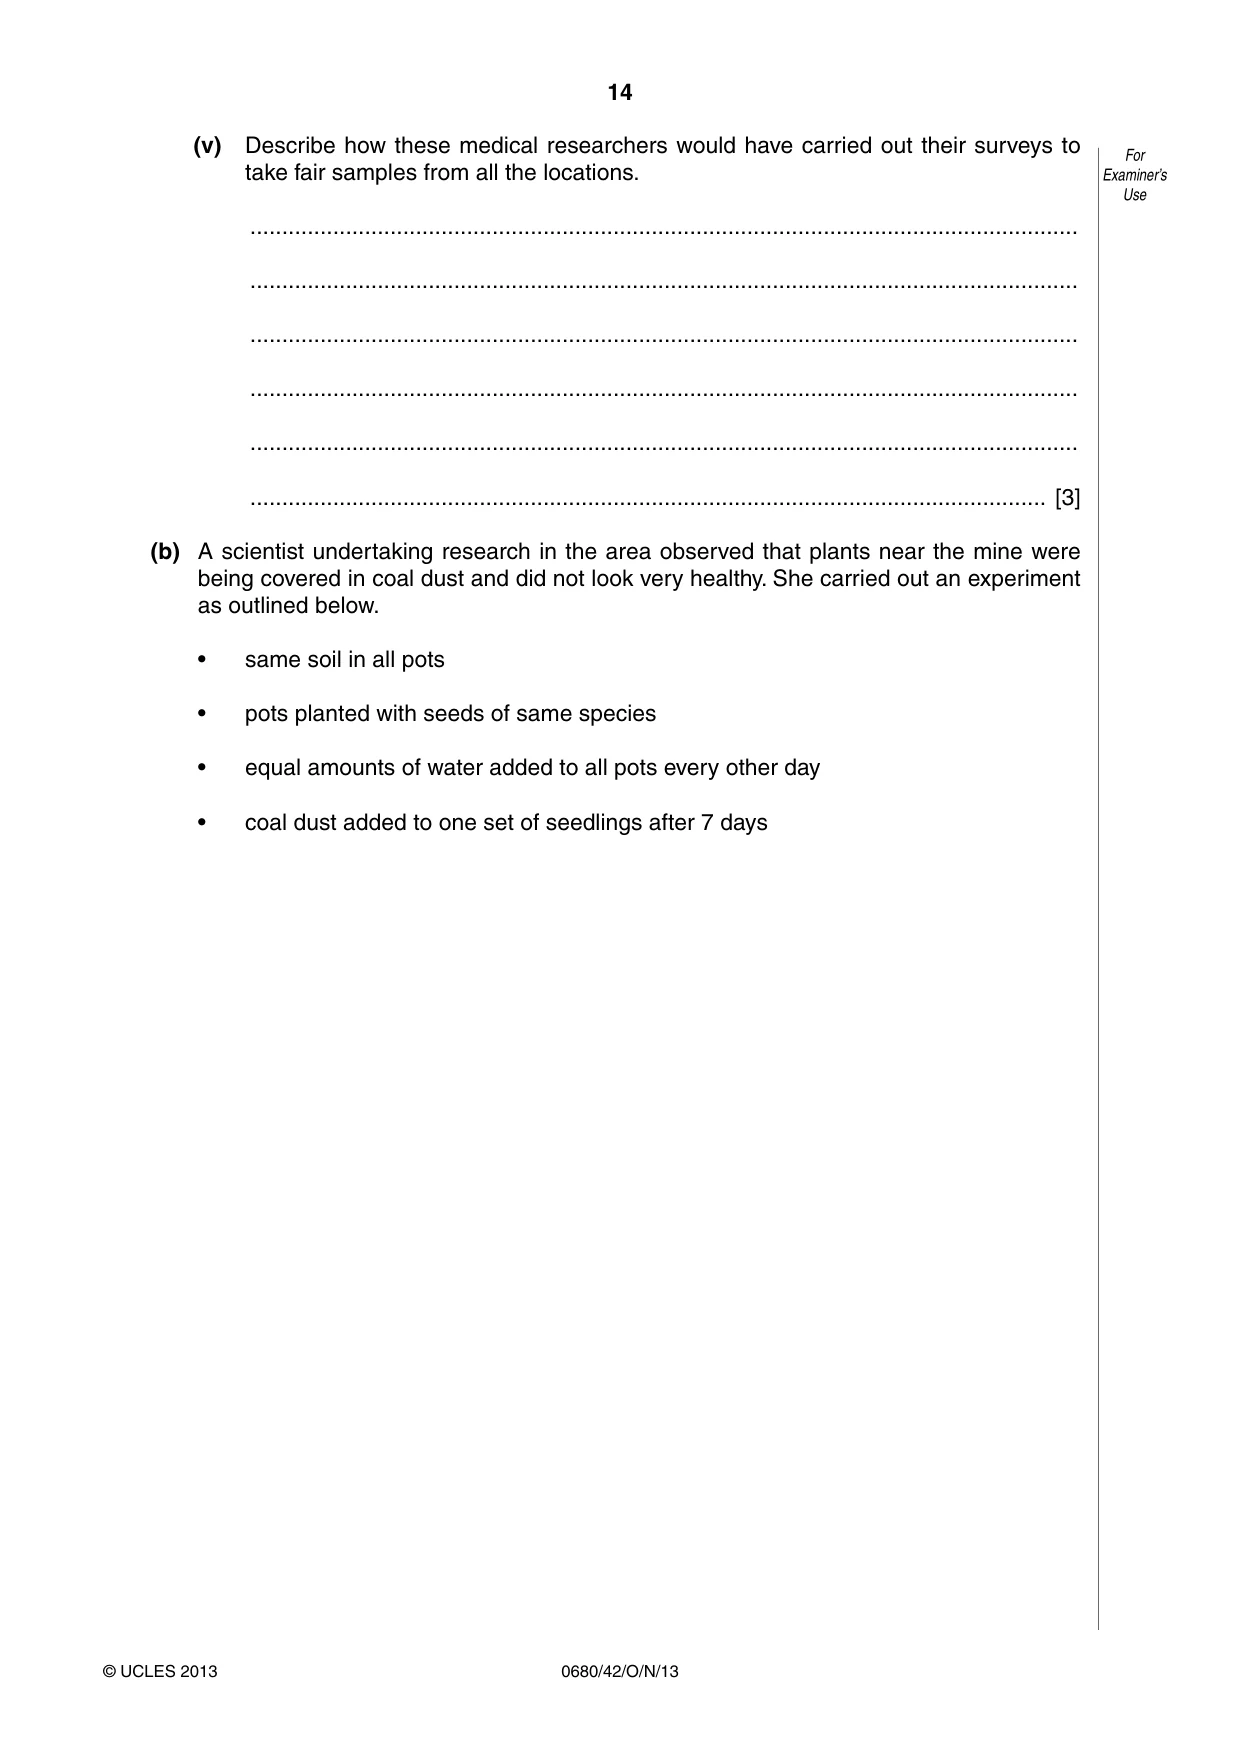
14 0680/42/O/N/13 © UCLES 2013 For Examiner’s Use (v) Describe how these medical researchers would have carried out their surveys to take fair samples from all the locations. … … … … … … [3] (b) A scientist undertaking research in the area observed that plants near the mine were being covered in coal dust and did not look very healthy. She carried out an experiment as outlined below. • same soil in all pots • pots planted with seeds of same species • equal amounts of water added to all pots every other day • coal dust added to one set of seedlings after 7 days
Question paper, page 15
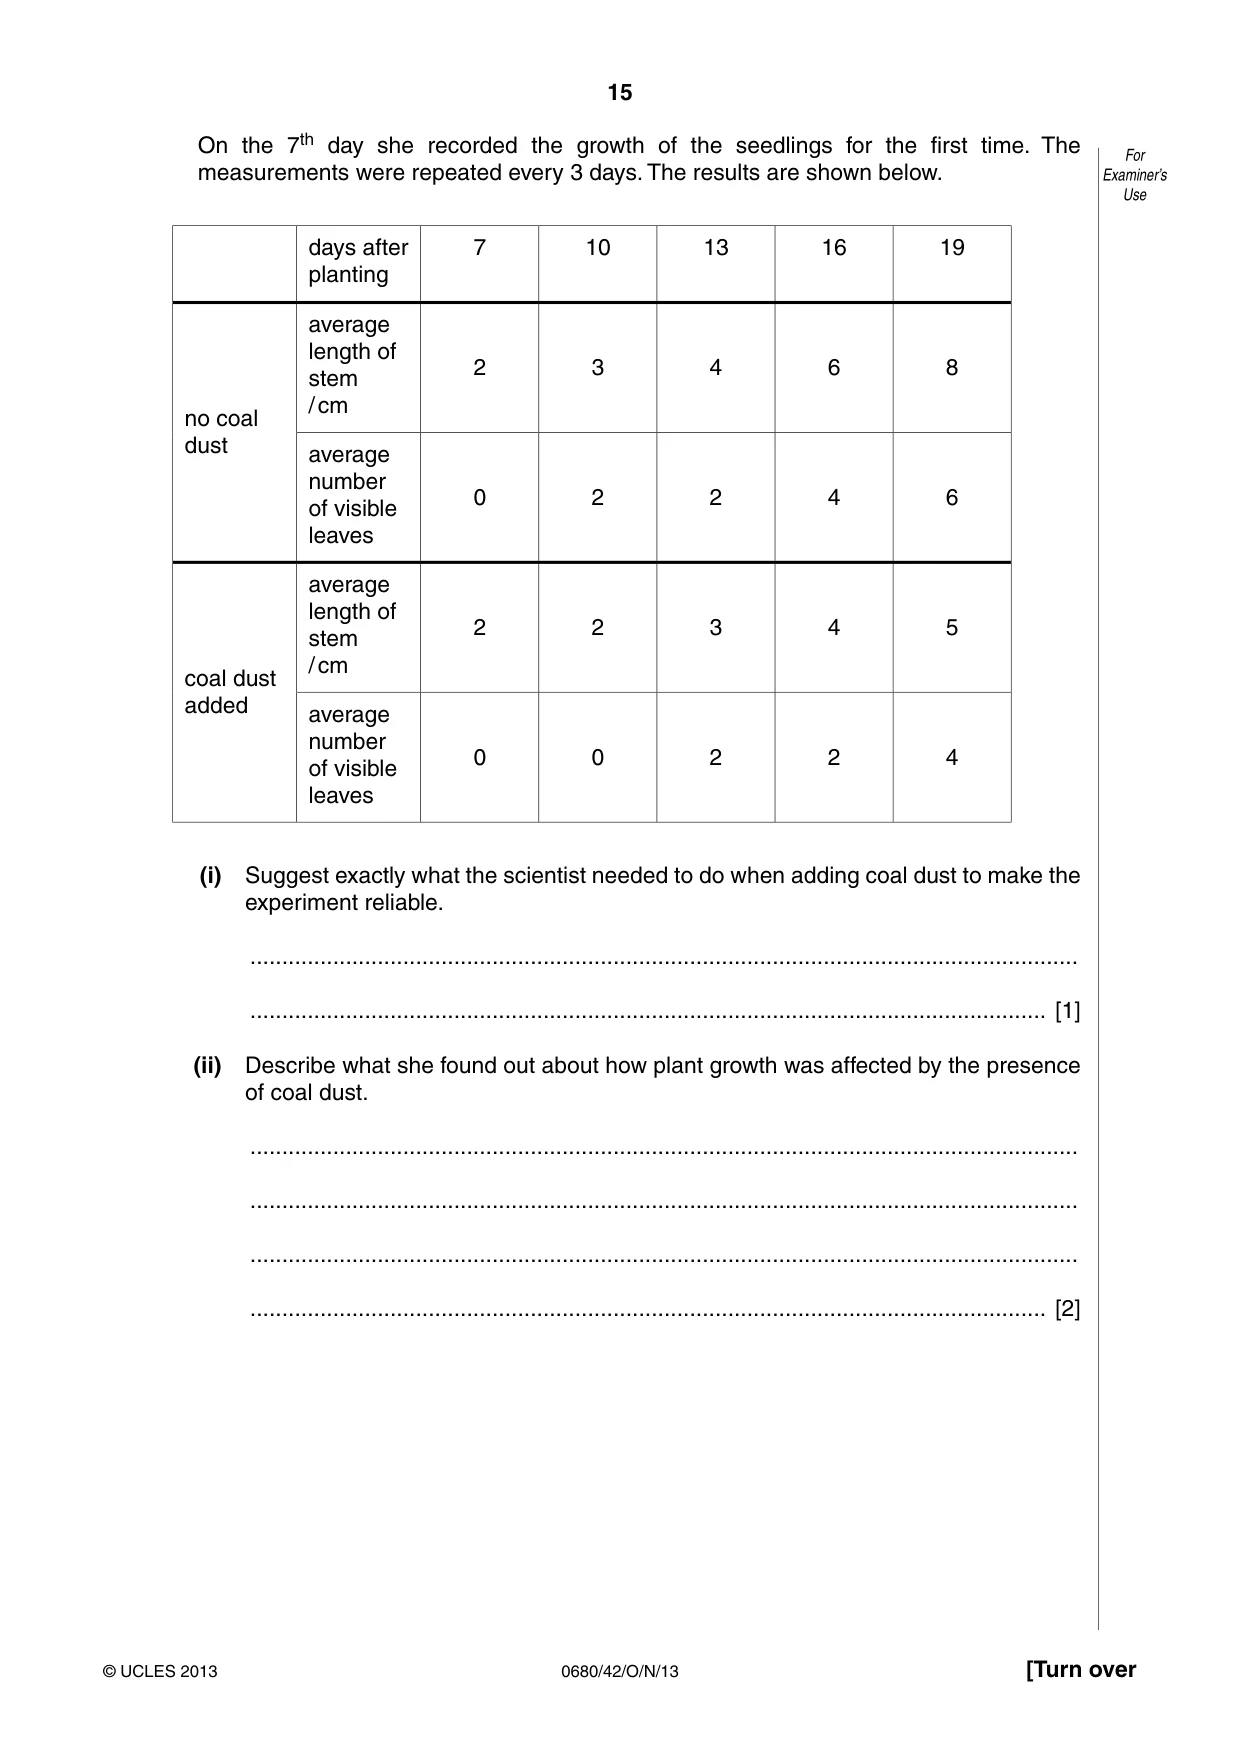
15 0680/42/O/N/13 © UCLES 2013 [Turn over For Examiner’s Use On the 7th day she recorded the growth of the seedlings for the first time. The measurements were repeated every 3 days. The results are shown below. days after planting 7 10 13 16 19 no coal dust average length of stem / cm 2 3 4 6 8 average number of visible leaves 0 2 2 4 6 coal dust added average length of stem / cm 2 2 3 4 5 average number of visible leaves 0 0 2 2 4 (i) Suggest exactly what the scientist needed to do when adding coal dust to make the experiment reliable. … … [1] (ii) Describe what she found out about how plant growth was affected by the presence of coal dust. … … … … [2]
Question paper, page 16
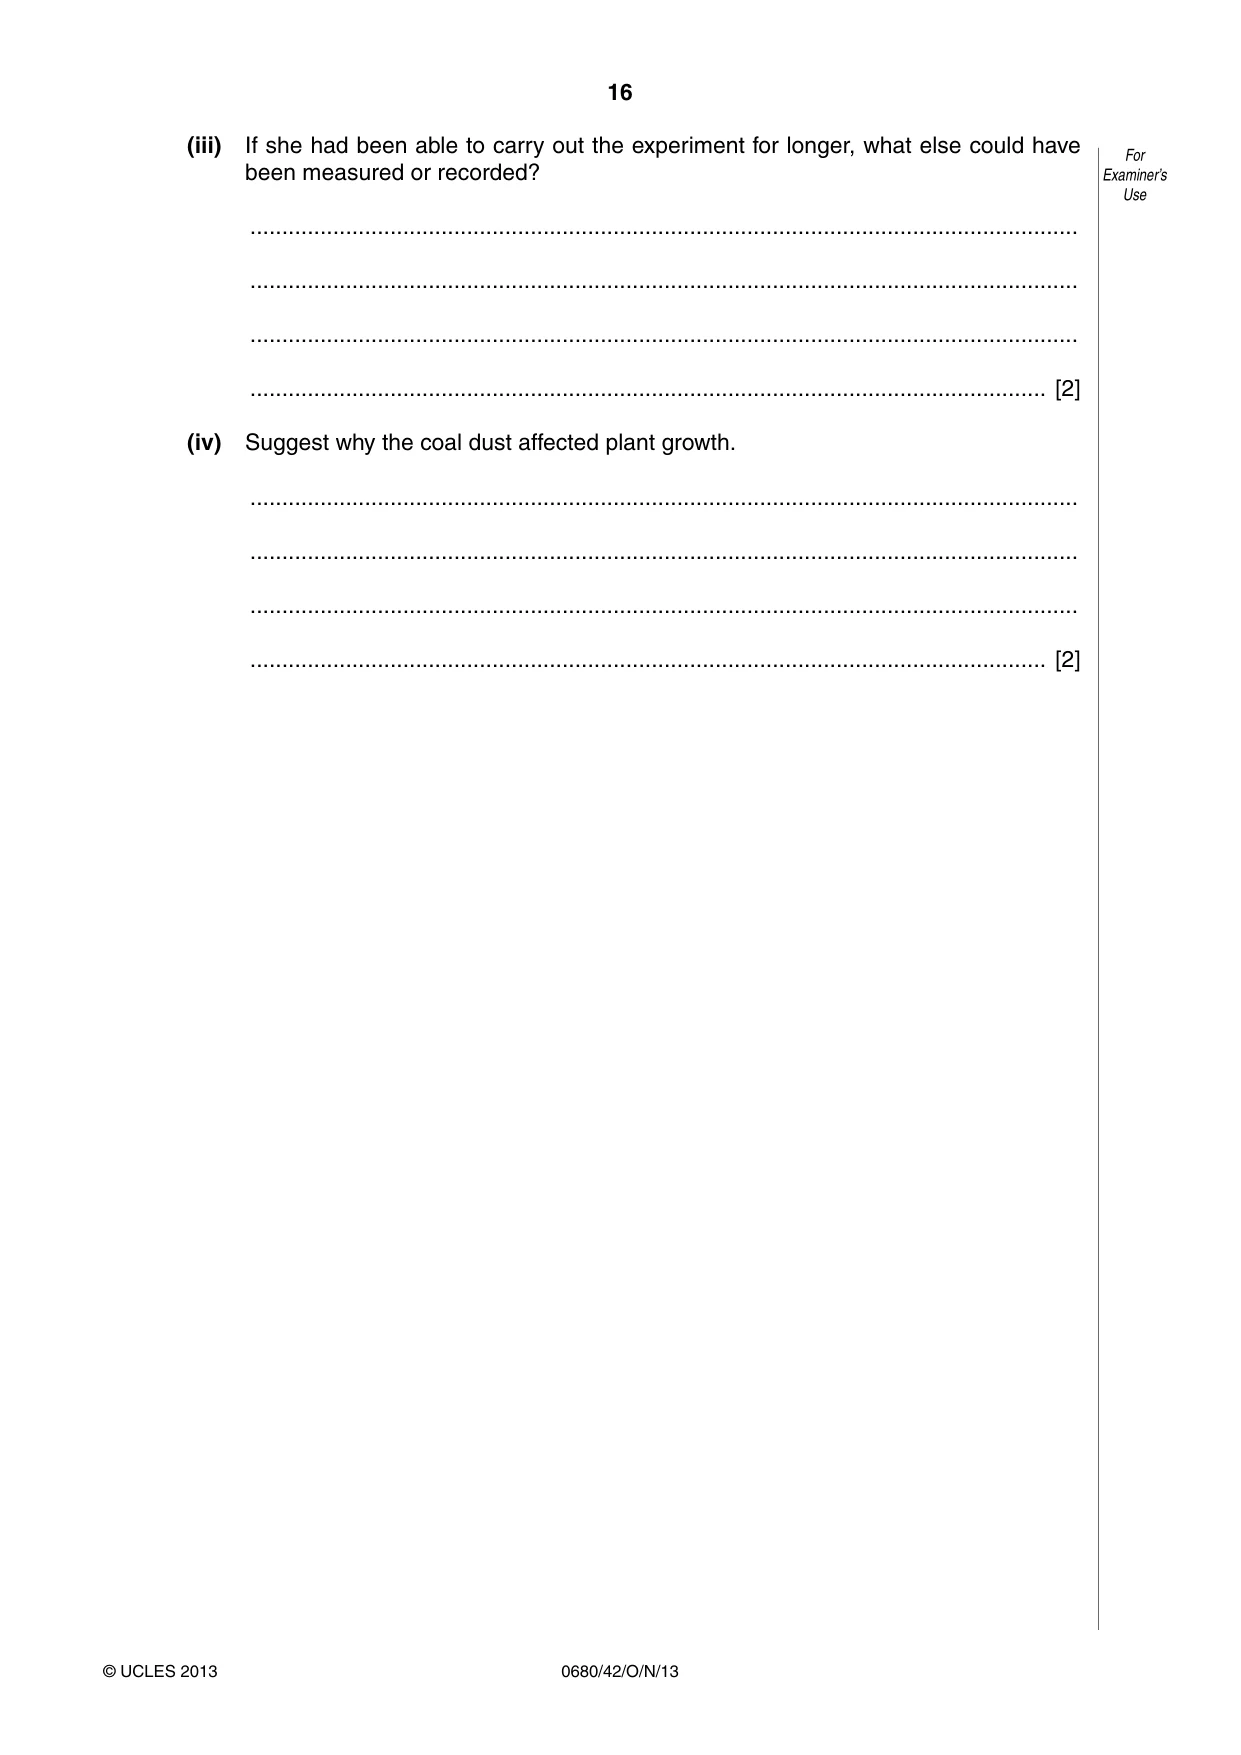
16 0680/42/O/N/13 © UCLES 2013 For Examiner’s Use (iii) If she had been able to carry out the experiment for longer, what else could have been measured or recorded? … … … … [2] (iv) Suggest why the coal dust affected plant growth. … … … … [2]
Question paper, page 17
17 0680/42/O/N/13 © UCLES 2013 [Turn over For Examiner’s Use (c) Later the scientist decided to go back to the mining area to investigate the effect of coal dust on the number of tree species. She carried out her investigation in the following way: • she walked away from the mine for 500 m in four directions • every 100 m she stopped and recorded the total number of different tree species within a five metre radius • she plotted the results on the diagram below 6 W E S N 5 4 4 2 2 1 3 6 8 9 8 numbers show how many different tree species were recorded within a five metre radius of each sample point 3 5 6 6 5 7 8 9 mining area to scale 0 100 m (i) Does coal dust also affect tree species? Give a reason for your answer. … … [1]
Question paper, page 18
18 0680/42/O/N/13 © UCLES 2013 For Examiner’s Use (ii) Which area around the mine is most affected by coal dust? Suggest an explanation for your answer. … … … … [2] (d) Some people in Pakistan want to continue mining this coal field until all the coal reserves have been mined and others do not. Use the information given and your own knowledge of mining to explain their different points of view. … … … … … … … … [4] [Total: 25]
Question paper, page 19
19 0680/42/O/N/13 © UCLES 2013 BLANK PAGE
Question paper, page 20
20 0680/42/O/N/13 © UCLES 2013 Permission to reproduce items where third-party owned material protected by copyright is included has been sought and cleared where possible. Every reasonable effort has been made by the publisher (UCLES) to trace copyright holders, but if any items requiring clearance have unwittingly been included, the publisher will be pleased to make amends at the earliest possible opportunity. University of Cambridge International Examinations is part of the Cambridge Assessment Group. Cambridge Assessment is the brand name of University of Cambridge Local Examinations Syndicate (UCLES), which is itself a department of the University of Cambridge. BLANK PAGE
Mark scheme, page 1
CAMBRIDGE INTERNATIONAL EXAMINATIONS International General Certificate of Secondary Education MARK SCHEME for the October/November 2013 series 0680 ENVIRONMENTAL MANAGEMENT 0680/42 Paper 4 (Alternative to Coursework) maximum raw mark 60 This mark scheme is published as an aid to teachers and candidates, to indicate the requirements of the examination. It shows the basis on which Examiners were instructed to award marks. It does not indicate the details of the discussions that took place at an Examiners’ meeting before marking began, which would have considered the acceptability of alternative answers. Mark schemes should be read in conjunction with the question paper and the Principal Examiner Report for Teachers. Cambridge will not enter into discussions about these mark schemes. Cambridge is publishing the mark schemes for the October/November 2013 series for most IGCSE, GCE Advanced Level and Advanced Subsidiary Level components and some Ordinary Level components.
Mark scheme, page 2
Page 2 Mark Scheme Syllabus Paper IGCSE – October/November 2012 0680 42 © Cambridge International Examinations 2013 1 (a) (i) loss of production; accidents; need to rely on backup generators; especially hospitals; air pollution from generators; AVP e.g. loss of food/air conditioning/power to pump water; [2] (ii) forestry; most mature trees harvested/eq/deforestation; [2] (iii) livestock; value of product has declined relative to other forms of production/eq; [2] (b) (i) increase demand; increase in population; increase in income/reduction of poverty; increased urbanisation; increased exports; increased costs of production/inflation; [2] (ii) 2800; 4270; [2] (iii) lack of land/eq; high cost of renting land; cost of labour; poor water supply; [2] (iv) orientation; plots; both axes labelled; key; [4] (v) buffalo: steady increase; cows: increase till year 6 then decrease/plateau; [2] (vi) new breeds/cross breeds of cattle introduced with higher yields/eq; [1] (c) (i) buffalo kept tied up/enclosed/eq; for milk/food production; drainage along watercourse; animals drink here; unfit for human consumption; dense housing; poor quality housing; AVP; [3] (ii) advantage: close to customers; can sell more milk /more quickly before it goes off/eq; disadvantage: have to rely on other farmers for fodder/pay high(er) prices for fodder; due to cost of transport; (any 2) [2] (iii) flooding qualified e.g. buffalo drown; buffalo waste enters waterway; bacteria multiply in water; water not fit to drink; buffalo get infected/die eq; malaria/eq; breeding mosquitoes; typhoid; dengue fever; yellow fever; diarrhoea; ground drinking water polluted; damage to houses/property; [3] (iv) other fuels not available; dung free/very cheap; [1] (v) minerals/organic matter not returned to the land; soil is less fertile/eq; [1] (d) (i) risks to human health – bronchitis/ARI’s; smoke = air pollution; encourages deforestation; heating food inefficient; food contaminated; [2] (ii) long lasting; low maintenance; reliable source of heat/eq; investment is paid back; land does not loose nutrients/minerals/fertility; no/little impact on the environment/renewable fuel; AVP; [4] [Total: 35]
Mark scheme, page 3
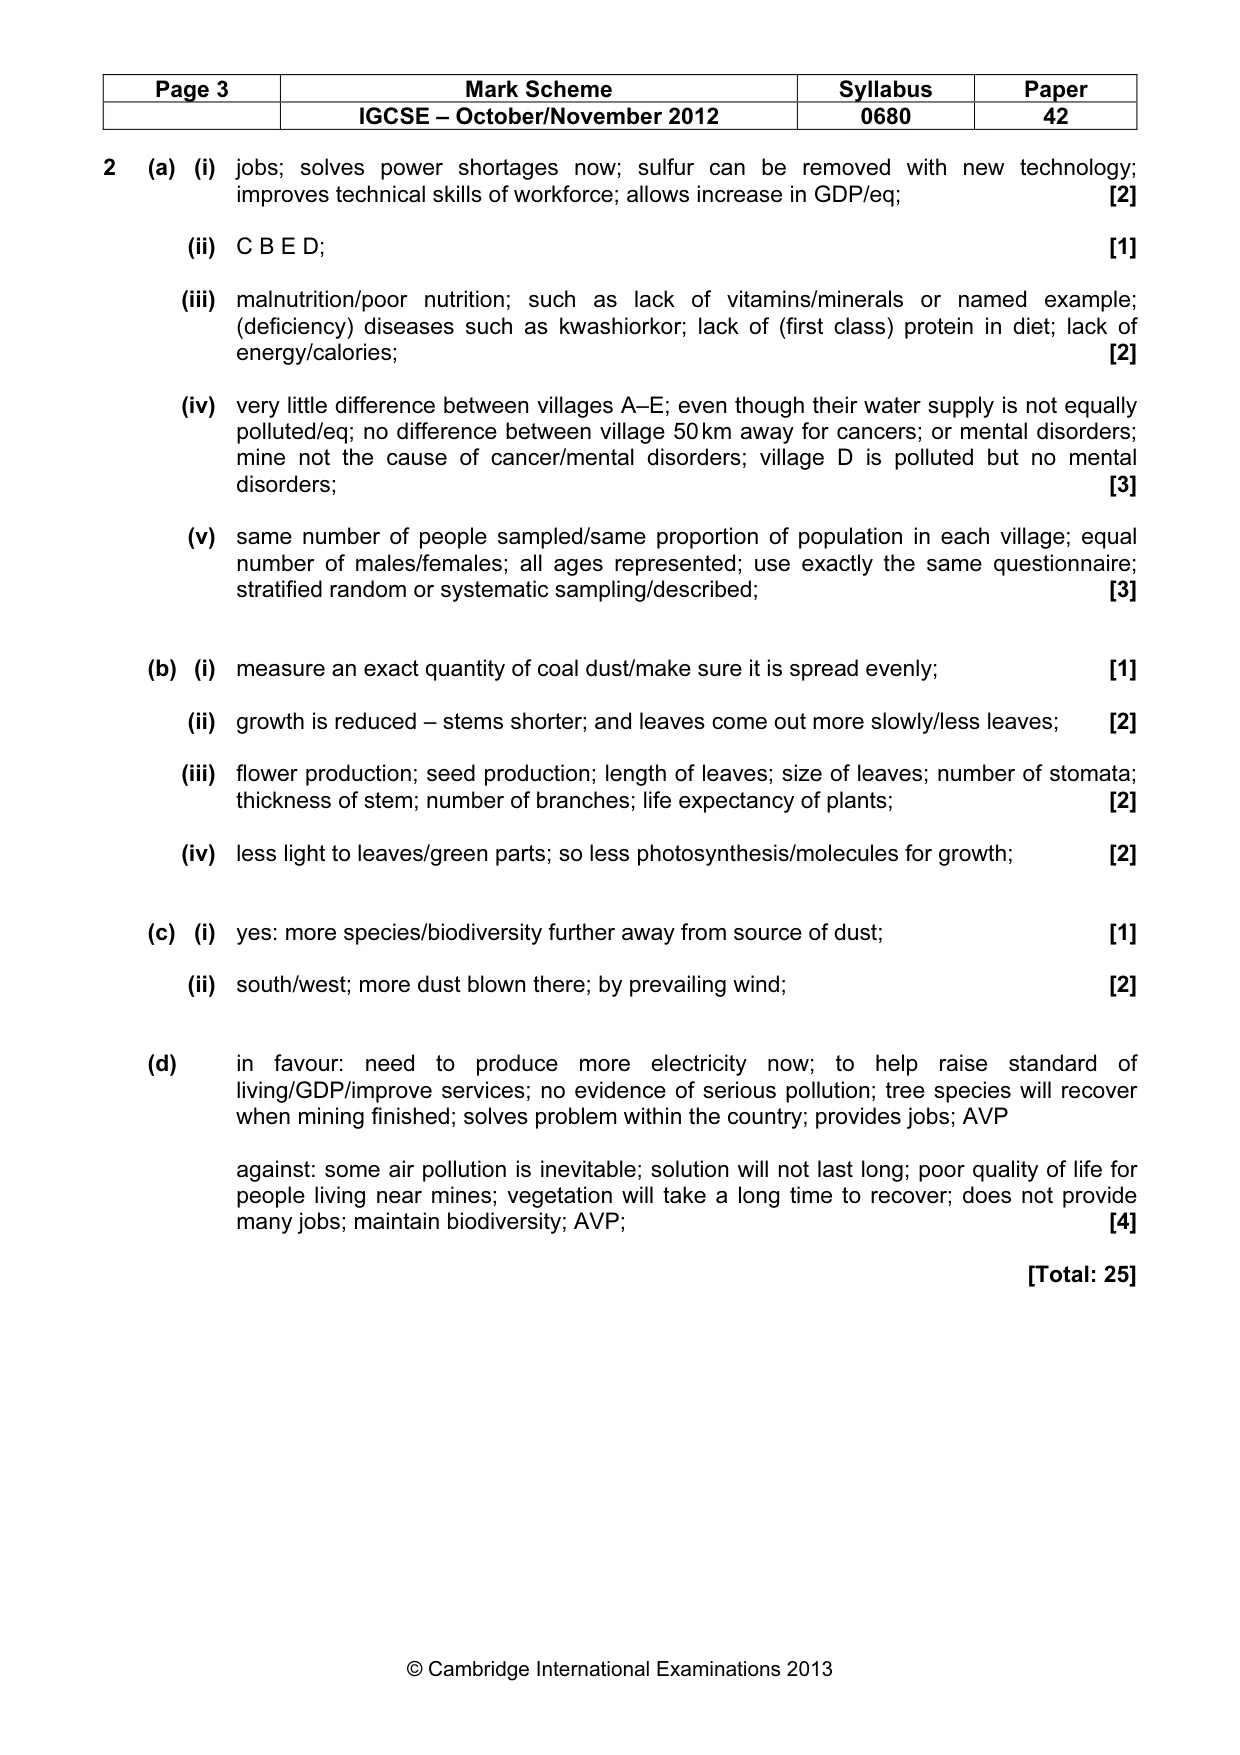
Page 3 Mark Scheme Syllabus Paper IGCSE – October/November 2012 0680 42 © Cambridge International Examinations 2013 2 (a) (i) jobs; solves power shortages now; sulfur can be removed with new technology; improves technical skills of workforce; allows increase in GDP/eq; [2] (ii) C B E D; [1] (iii) malnutrition/poor nutrition; such as lack of vitamins/minerals or named example; (deficiency) diseases such as kwashiorkor; lack of (first class) protein in diet; lack of energy/calories; [2] (iv) very little difference between villages A–E; even though their water supply is not equally polluted/eq; no difference between village 50 km away for cancers; or mental disorders; mine not the cause of cancer/mental disorders; village D is polluted but no mental disorders; [3] (v) same number of people sampled/same proportion of population in each village; equal number of males/females; all ages represented; use exactly the same questionnaire; stratified random or systematic sampling/described; [3] (b) (i) measure an exact quantity of coal dust/make sure it is spread evenly; [1] (ii) growth is reduced – stems shorter; and leaves come out more slowly/less leaves; [2] (iii) flower production; seed production; length of leaves; size of leaves; number of stomata; thickness of stem; number of branches; life expectancy of plants; [2] (iv) less light to leaves/green parts; so less photosynthesis/molecules for growth; [2] (c) (i) yes: more species/biodiversity further away from source of dust; [1] (ii) south/west; more dust blown there; by prevailing wind; [2] (d) in favour: need to produce more electricity now; to help raise standard of living/GDP/improve services; no evidence of serious pollution; tree species will recover when mining finished; solves problem within the country; provides jobs; AVP against: some air pollution is inevitable; solution will not last long; poor quality of life for people living near mines; vegetation will take a long time to recover; does not provide many jobs; maintain biodiversity; AVP; [4] [Total: 25]
What you needed in this session
Cambridge’s own grade thresholds for 2013 Oct/Nov, Paper 4 · Variant 2. A higher threshold means an easier paper — the bar moves with how the cohort did.