Cambridge IGCSE Environmental Management 0680 — 2013 May/June Paper 2 · Variant 3
0680/23/M/J/13 · 80 marks · ≈90 min
The question paper and its mark scheme, free to read here and free to download. This is Cambridge’s own paper, exactly as it was sat.
Question paper16 pages

Mark scheme11 pages
Answers below. Sit the paper first if you are practising.
Paper as text
Question paper, page 1
This document consists of 14 printed pages and 2 blank pages. DC (LEG/JG) 65389/2 © UCLES 2013 [Turn over UNIVERSITY OF CAMBRIDGE INTERNATIONAL EXAMINATIONS International General Certificate of Secondary Education * 1 3 4 5 2 9 8 9 6 9 * ENVIRONMENTAL MANAGEMENT 0680/23 Paper 2 May/June 2013 1 hour 45 minutes Candidates answer on the Question Paper. Additional Materials: Ruler READ THESE INSTRUCTIONS FIRST Write your Centre number, candidate number and name on all the work you hand in. Write in dark blue or black pen. You may use a soft pencil for any diagrams, graphs or rough working. Do not use staples, paper clips, highlighters, glue or correction fluid. DO NOT WRITE IN ANY BARCODES. Electronic calculators may be used. Answer both questions. At the end of the examination, fasten all your work securely together. The number of marks is given in brackets [ ] at the end of each question or part question. For Examiner’s Use 1 2 Total
Question paper, page 2
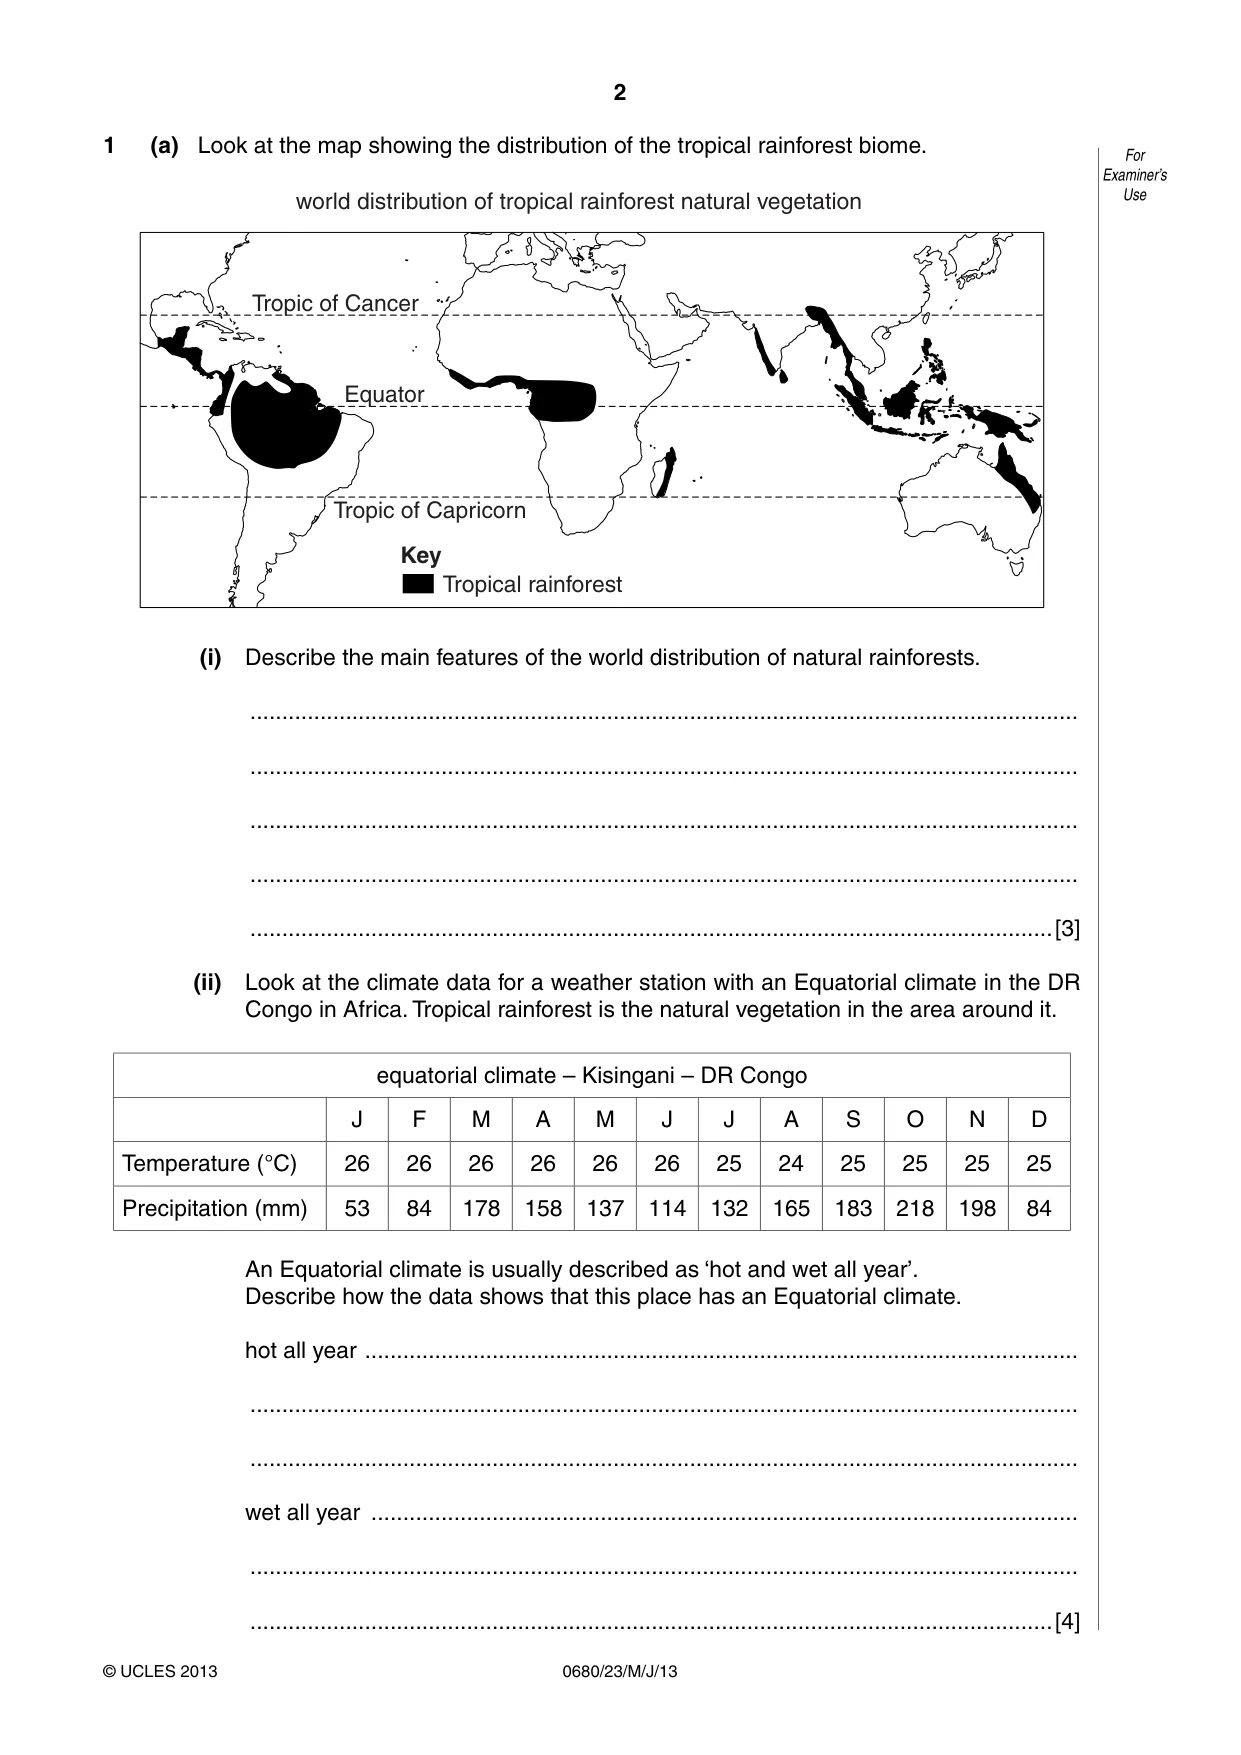
2 0680/23/M/J/13 © UCLES 2013 For Examiner’s Use 1 (a) Look at the map showing the distribution of the tropical rainforest biome. Equator Tropic of Cancer Tropic of Capricorn Key Tropical rainforest world distribution of tropical rainforest natural vegetation (i) Describe the main features of the world distribution of natural rainforests. … … … … …[3] (ii) Look at the climate data for a weather station with an Equatorial climate in the DR Congo in Africa. Tropical rainforest is the natural vegetation in the area around it. equatorial climate – Kisingani – DR Congo J F M A M J J A S O N D Temperature (°C) 26 26 26 26 26 26 25 24 25 25 25 25 Precipitation (mm) 53 84 178 158 137 114 132 165 183 218 198 84 An Equatorial climate is usually described as ‘hot and wet all year’. Describe how the data shows that this place has an Equatorial climate. hot all year … … … wet all year … … …[4]
Question paper, page 3
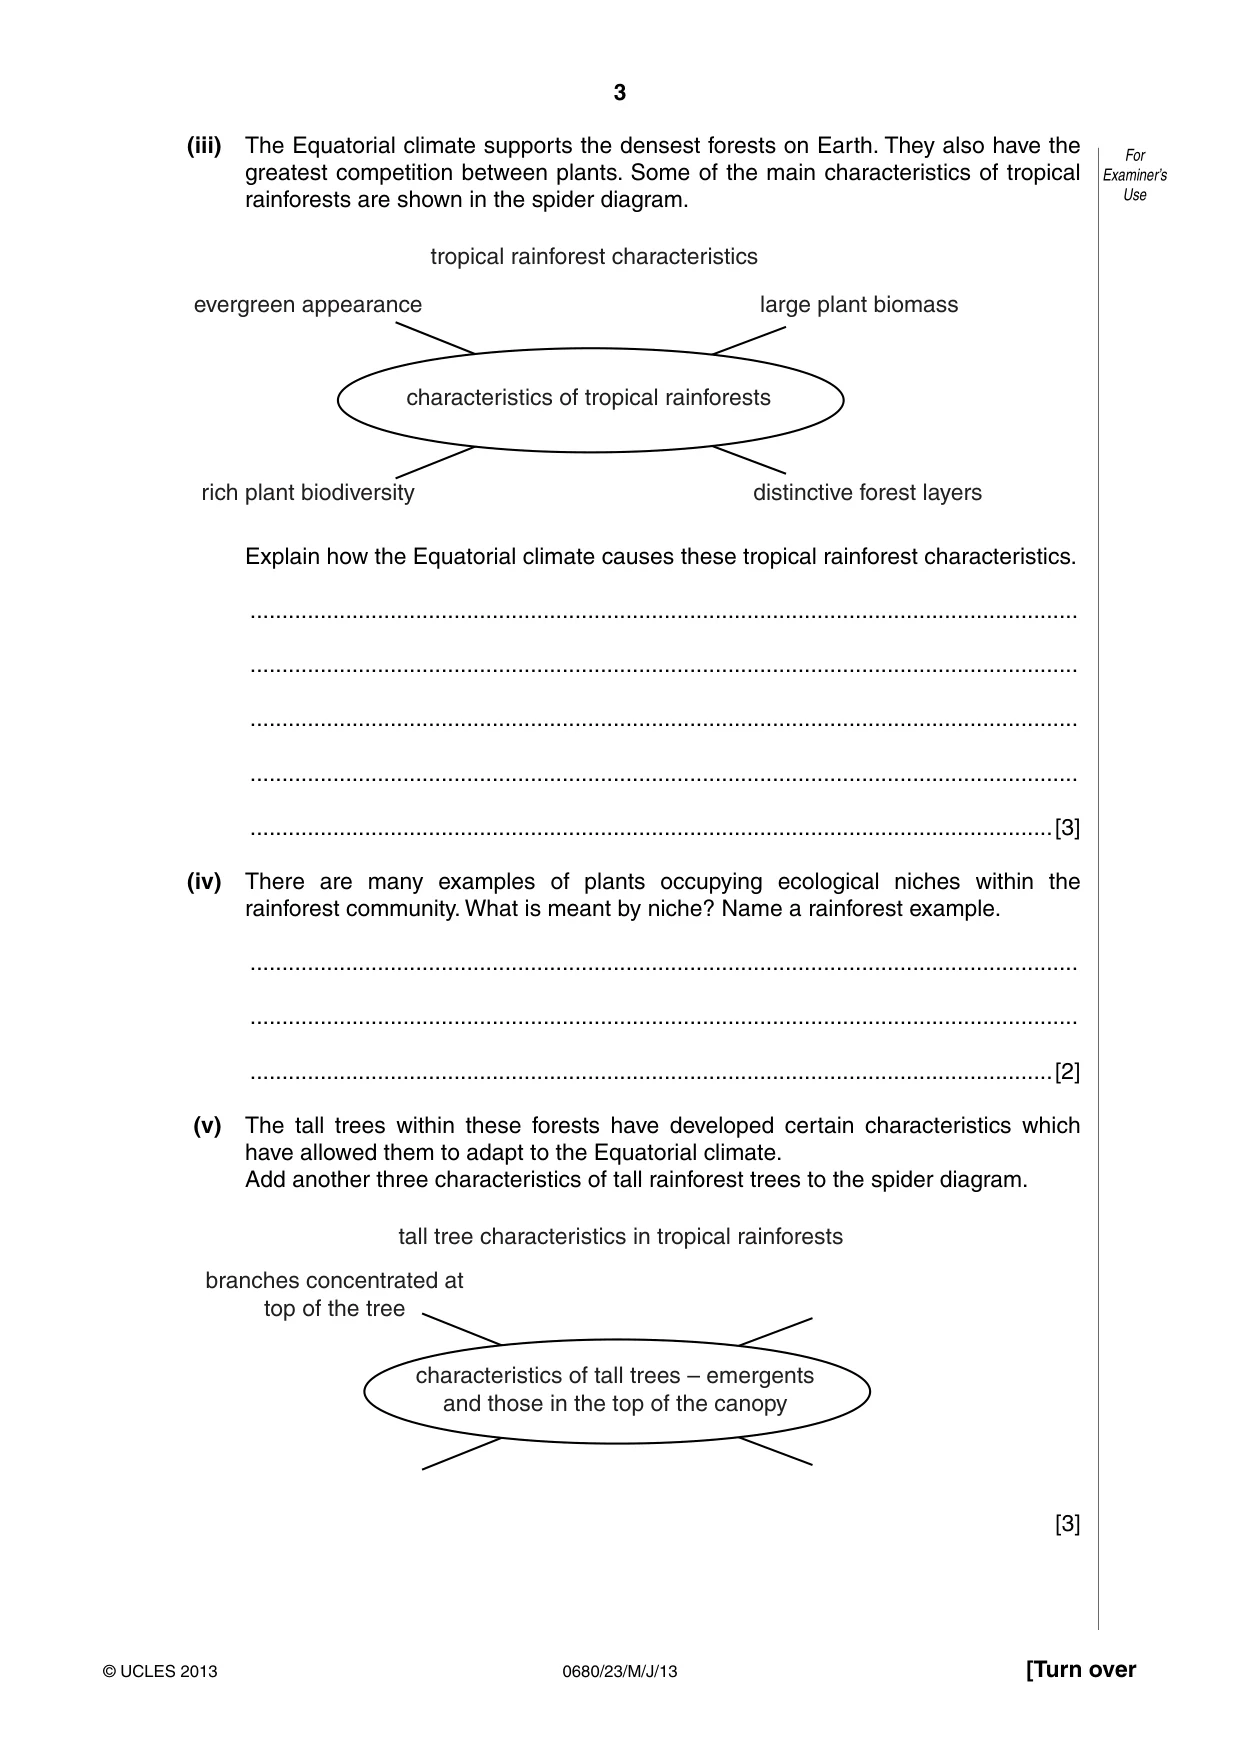
3 0680/23/M/J/13 © UCLES 2013 [Turn over For Examiner’s Use (iii) The Equatorial climate supports the densest forests on Earth. They also have the greatest competition between plants. Some of the main characteristics of tropical rainforests are shown in the spider diagram. evergreen appearance tropical rainforest characteristics large plant biomass rich plant biodiversity distinctive forest layers characteristics of tropical rainforests Explain how the Equatorial climate causes these tropical rainforest characteristics. … … … … …[3] (iv) There are many examples of plants occupying ecological niches within the rainforest community. What is meant by niche? Name a rainforest example. … … …[2] (v) The tall trees within these forests have developed certain characteristics which have allowed them to adapt to the Equatorial climate. Add another three characteristics of tall rainforest trees to the spider diagram. branches concentrated at top of the tree tall tree characteristics in tropical rainforests characteristics of tall trees – emergents and those in the top of the canopy [3]
Question paper, page 4
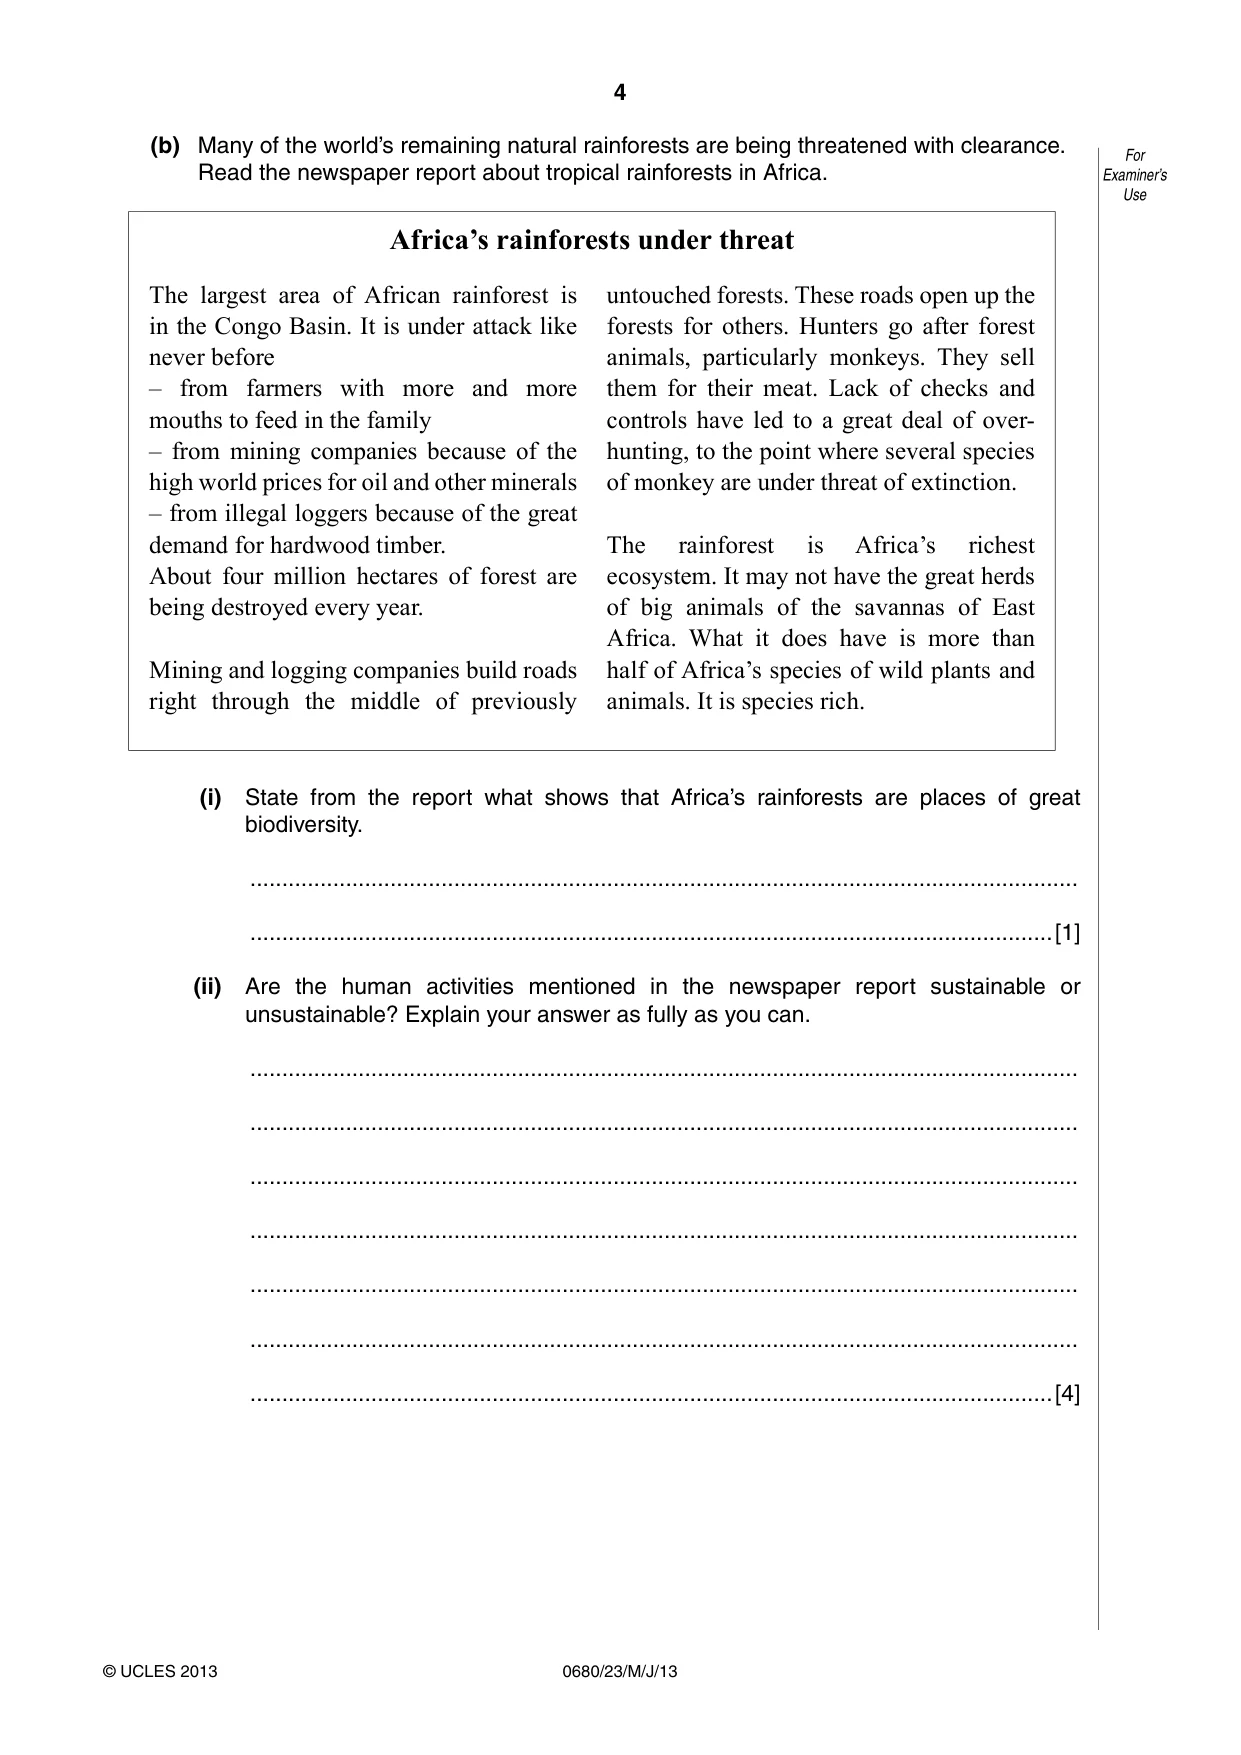
4 0680/23/M/J/13 © UCLES 2013 For Examiner’s Use (b) Many of the world’s remaining natural rainforests are being threatened with clearance. Read the newspaper report about tropical rainforests in Africa. Africa’s rainforests under threat The largest area of African rainforest is in the Congo Basin. It is under attack like never before – from farmers with more and more mouths to feed in the family – from mining companies because of the high world prices for oil and other minerals – from illegal loggers because of the great demand for hardwood timber. About four million hectares of forest are being destroyed every year. Mining and logging companies build roads right through the middle of previously untouched forests. These roads open up the forests for others. Hunters go after forest animals, particularly monkeys. They sell them for their meat. Lack of checks and controls have led to a great deal of over- hunting, to the point where several species of monkey are under threat of extinction. The rainforest is Africa’s richest ecosystem. It may not have the great herds of big animals of the savannas of East Africa. What it does have is more than half of Africa’s species of wild plants and animals. It is species rich. (i) State from the report what shows that Africa’s rainforests are places of great biodiversity. … …[1] (ii) Are the human activities mentioned in the newspaper report sustainable or unsustainable? Explain your answer as fully as you can. … … … … … … …[4]
Question paper, page 5
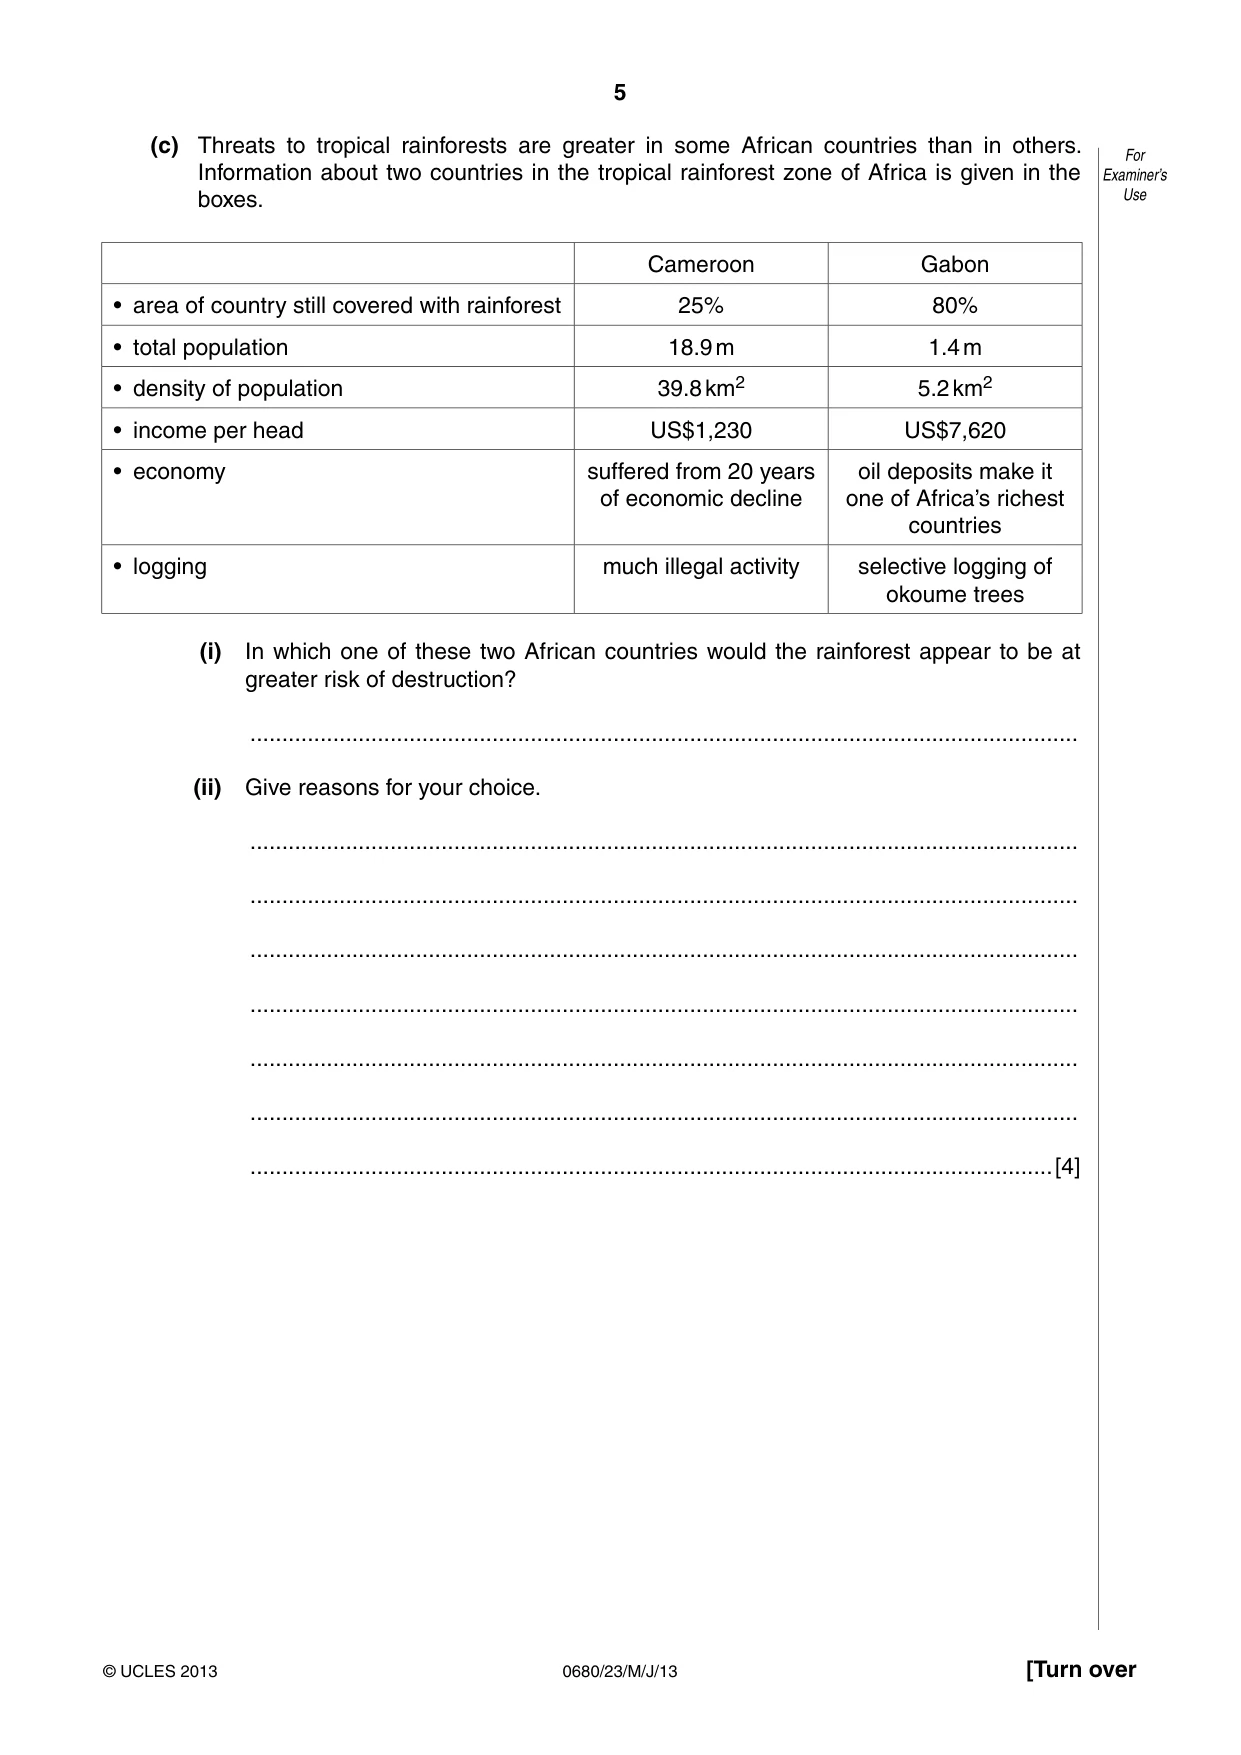
5 0680/23/M/J/13 © UCLES 2013 [Turn over For Examiner’s Use (c) Threats to tropical rainforests are greater in some African countries than in others. Information about two countries in the tropical rainforest zone of Africa is given in the boxes. Cameroon Gabon • area of country still covered with rainforest 25% 80% • total population 18.9 m 1.4 m • density of population 39.8 km2 5.2 km2 • income per head US$1,230 US$7,620 • economy suffered from 20 years of economic decline oil deposits make it one of Africa’s richest countries • logging much illegal activity selective logging of okoume trees (i) In which one of these two African countries would the rainforest appear to be at greater risk of destruction? … (ii) Give reasons for your choice. … … … … … … …[4]
Question paper, page 6
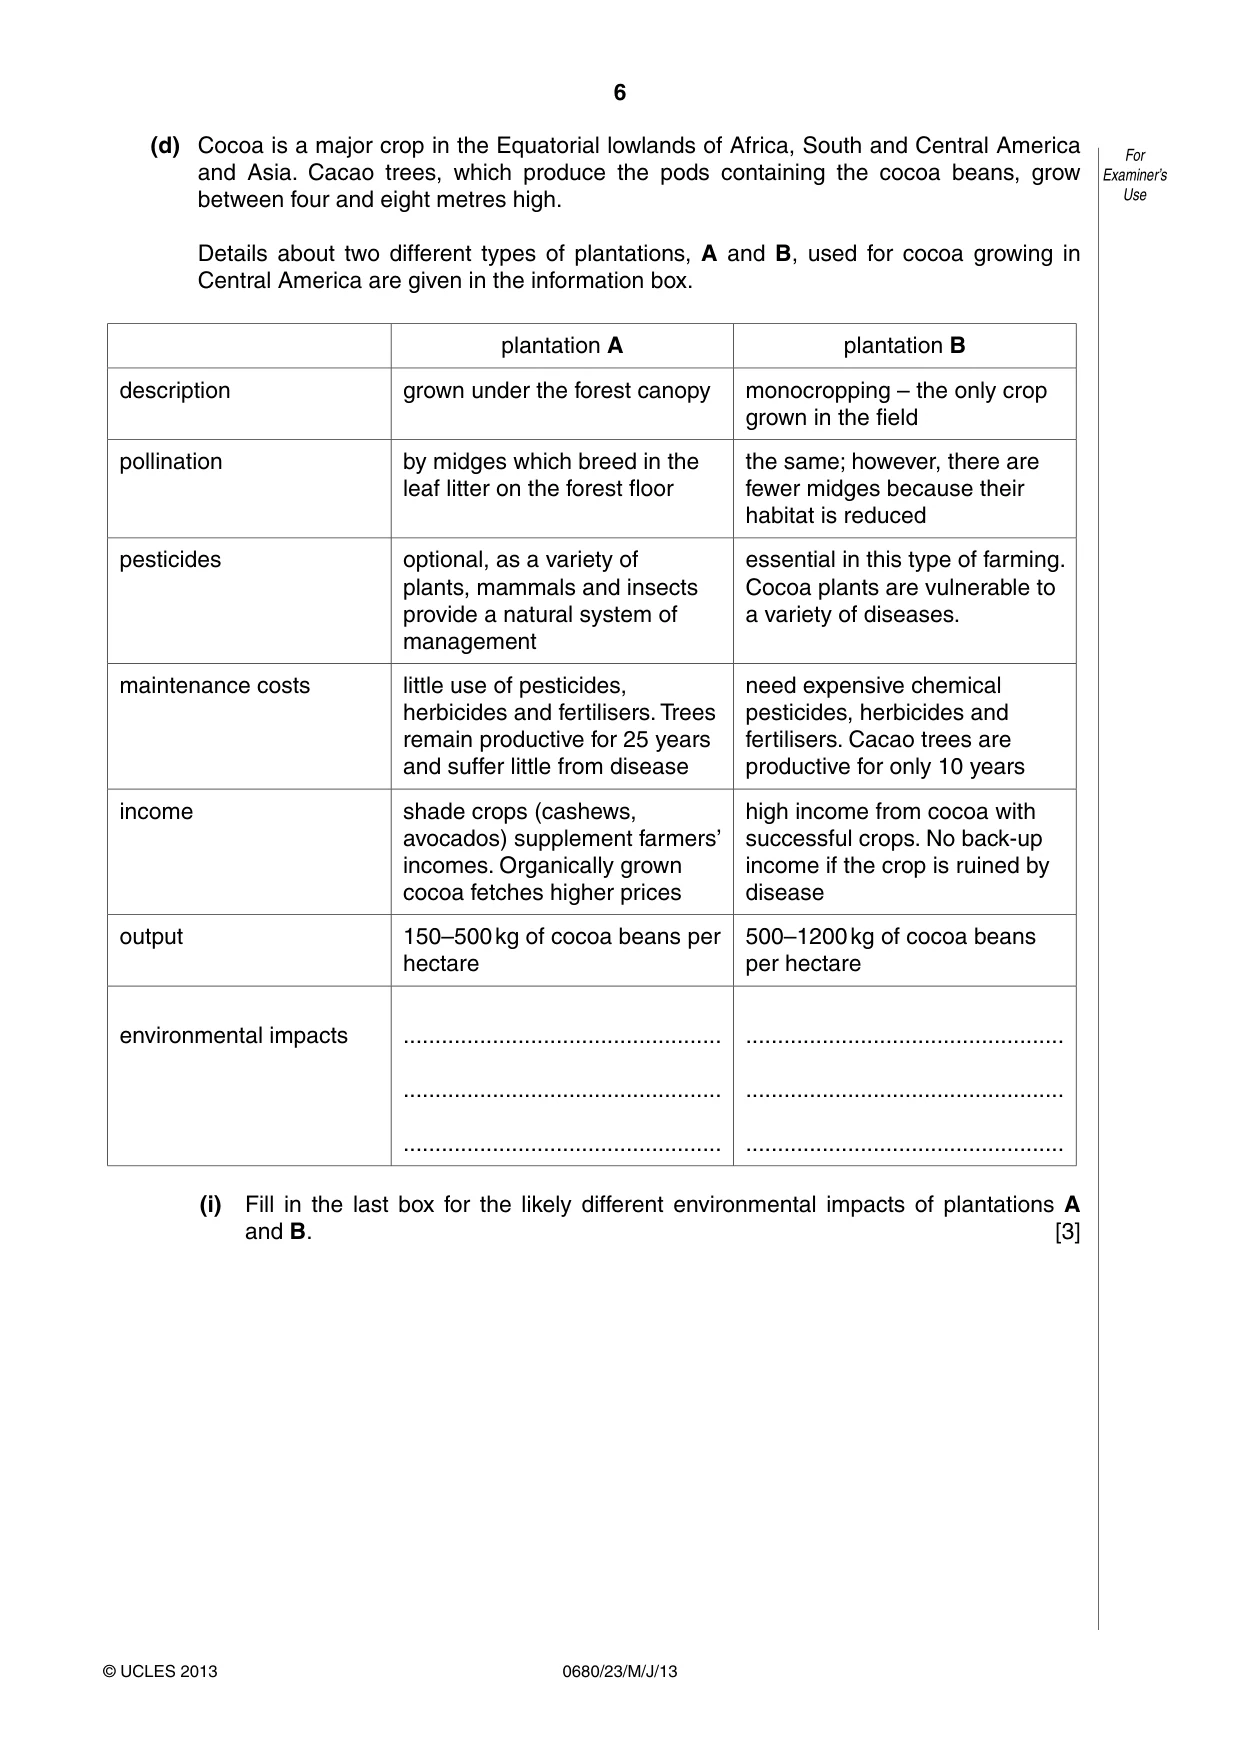
6 0680/23/M/J/13 © UCLES 2013 For Examiner’s Use (d) Cocoa is a major crop in the Equatorial lowlands of Africa, South and Central America and Asia. Cacao trees, which produce the pods containing the cocoa beans, grow between four and eight metres high. Details about two different types of plantations, A and B, used for cocoa growing in Central America are given in the information box. plantation A plantation B description grown under the forest canopy monocropping – the only crop grown in the field pollination by midges which breed in the leaf litter on the forest floor the same; however, there are fewer midges because their habitat is reduced pesticides optional, as a variety of plants, mammals and insects provide a natural system of management essential in this type of farming. Cocoa plants are vulnerable to a variety of diseases. maintenance costs little use of pesticides, herbicides and fertilisers. Trees remain productive for 25 years and suffer little from disease need expensive chemical pesticides, herbicides and fertilisers. Cacao trees are productive for only 10 years income shade crops (cashews, avocados) supplement farmers’ incomes. Organically grown cocoa fetches higher prices high income from cocoa with successful crops. No back-up income if the crop is ruined by disease output 150–500 kg of cocoa beans per hectare 500–1200 kg of cocoa beans per hectare environmental impacts … … … … … … (i) Fill in the last box for the likely different environmental impacts of plantations A and B. [3]
Question paper, page 7
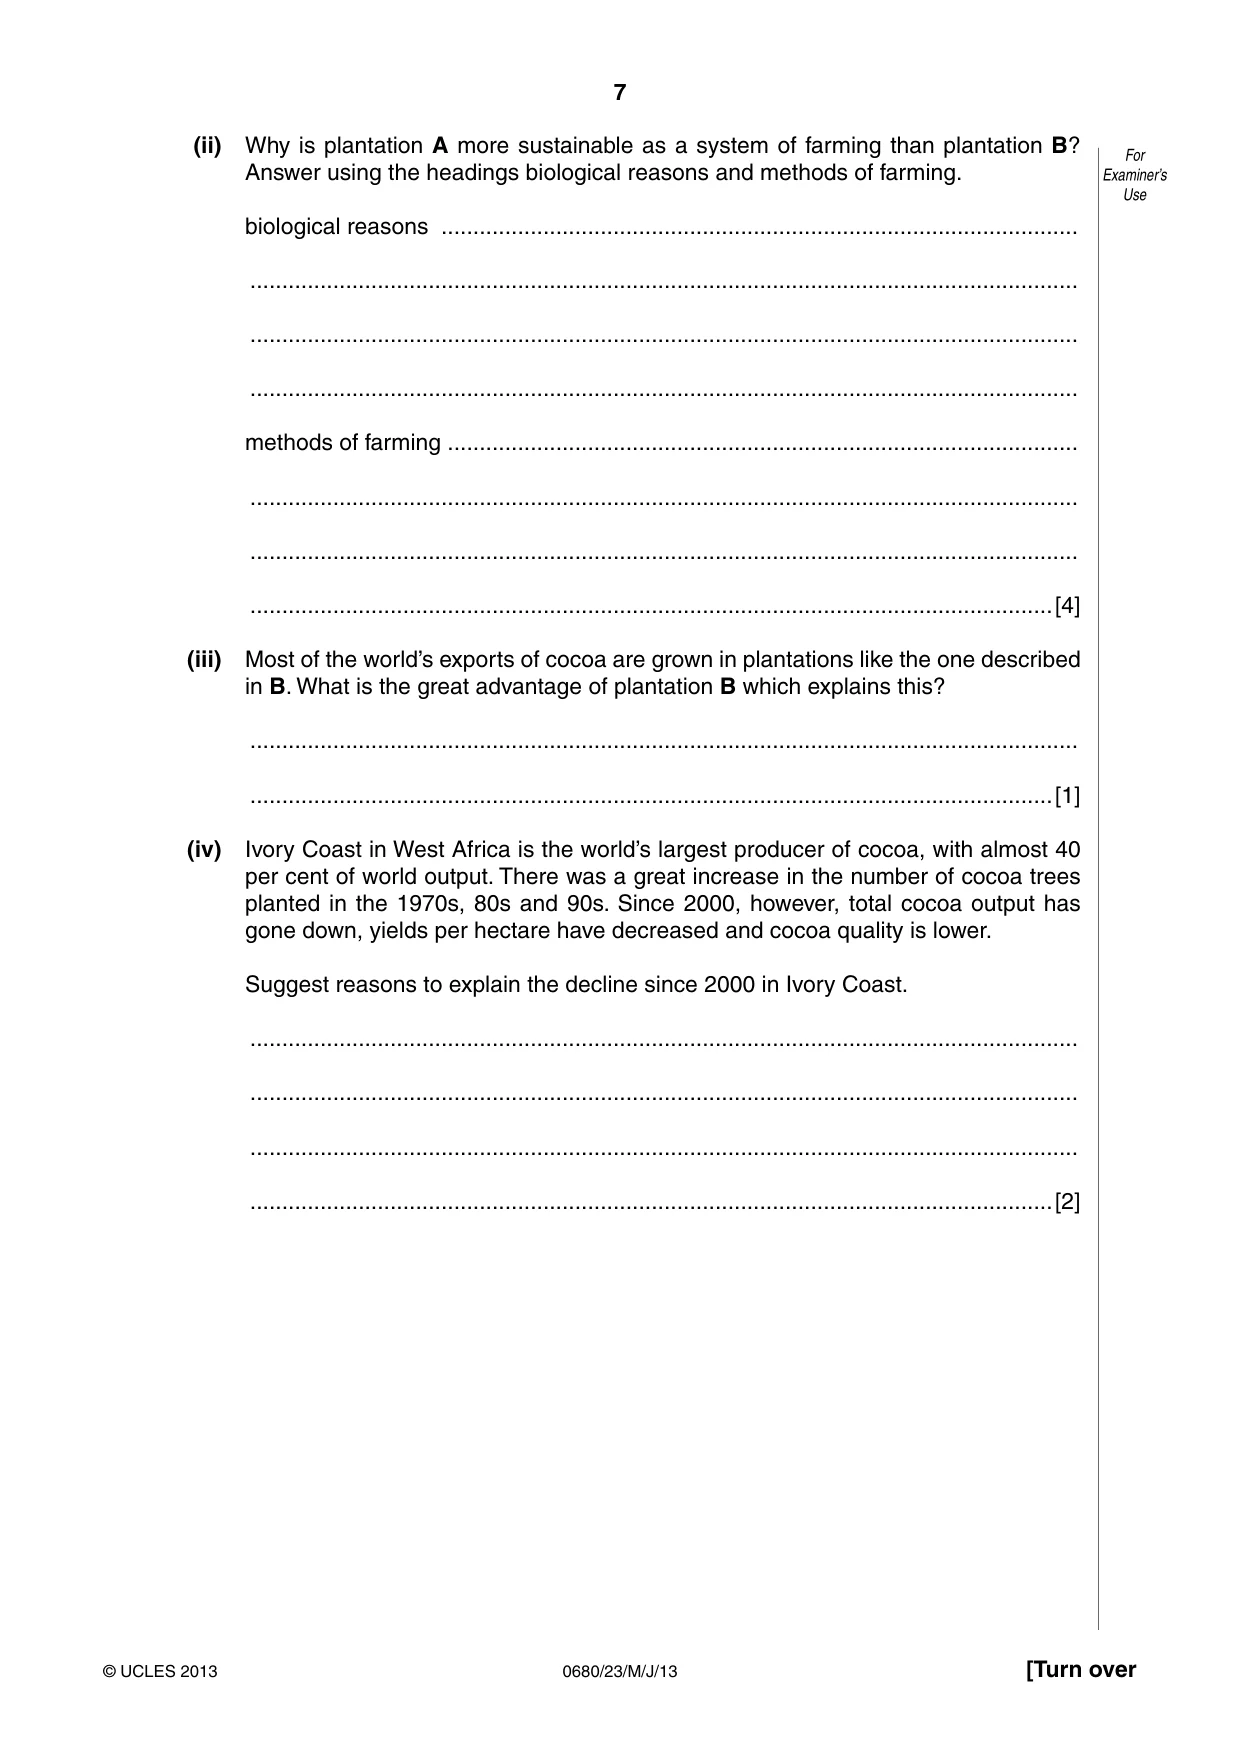
7 0680/23/M/J/13 © UCLES 2013 [Turn over For Examiner’s Use (ii) Why is plantation A more sustainable as a system of farming than plantation B? Answer using the headings biological reasons and methods of farming. biological reasons … … … … methods of farming … … … …[4] (iii) Most of the world’s exports of cocoa are grown in plantations like the one described in B. What is the great advantage of plantation B which explains this? … …[1] (iv) Ivory Coast in West Africa is the world’s largest producer of cocoa, with almost 40 per cent of world output. There was a great increase in the number of cocoa trees planted in the 1970s, 80s and 90s. Since 2000, however, total cocoa output has gone down, yields per hectare have decreased and cocoa quality is lower. Suggest reasons to explain the decline since 2000 in Ivory Coast. … … … …[2]
Question paper, page 8
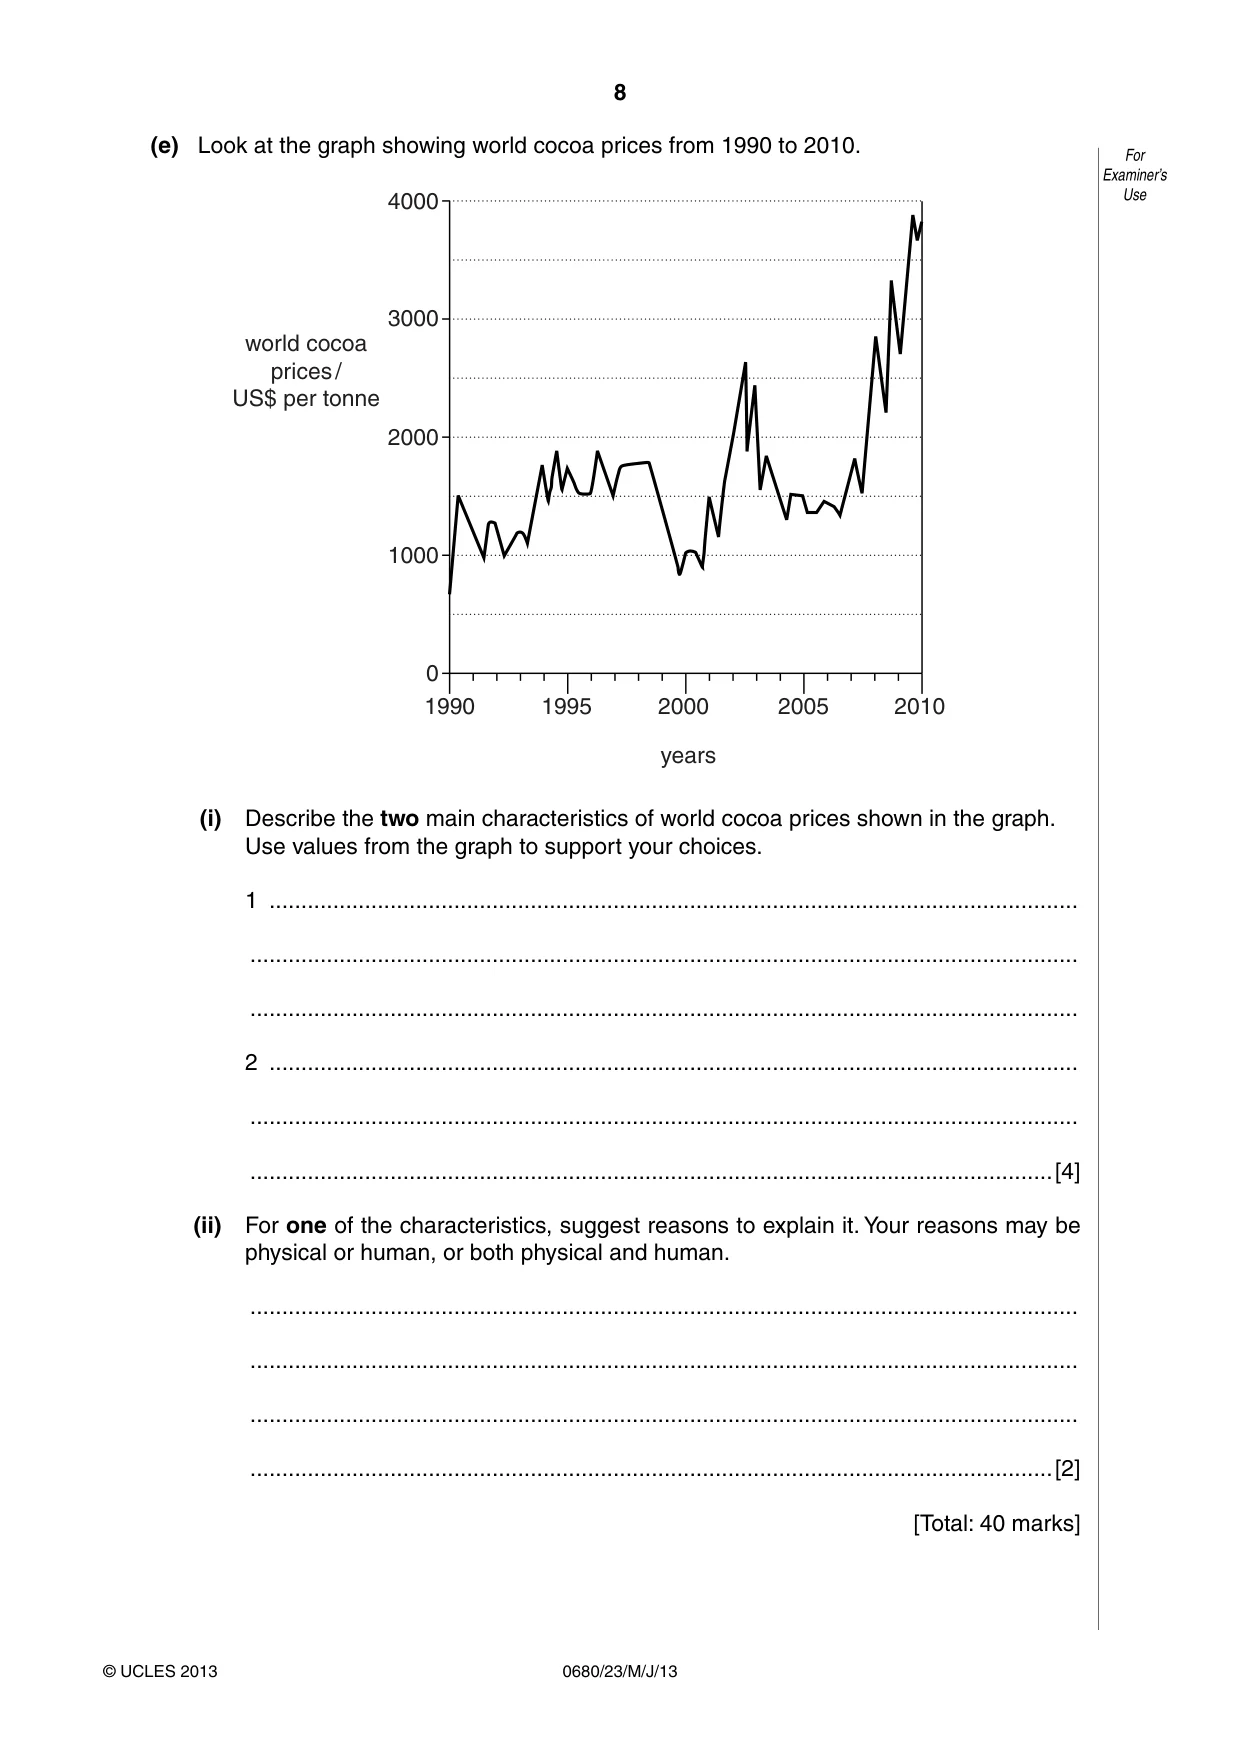
8 0680/23/M/J/13 © UCLES 2013 For Examiner’s Use (e) Look at the graph showing world cocoa prices from 1990 to 2010. 4000 3000 2000 1000 0 1990 1995 2000 2005 2010 years world cocoa prices / US$ per tonne (i) Describe the two main characteristics of world cocoa prices shown in the graph. Use values from the graph to support your choices. 1 … … … 2 … … …[4] (ii) For one of the characteristics, suggest reasons to explain it. Your reasons may be physical or human, or both physical and human. … … … …[2] [Total: 40 marks]
Question paper, page 9
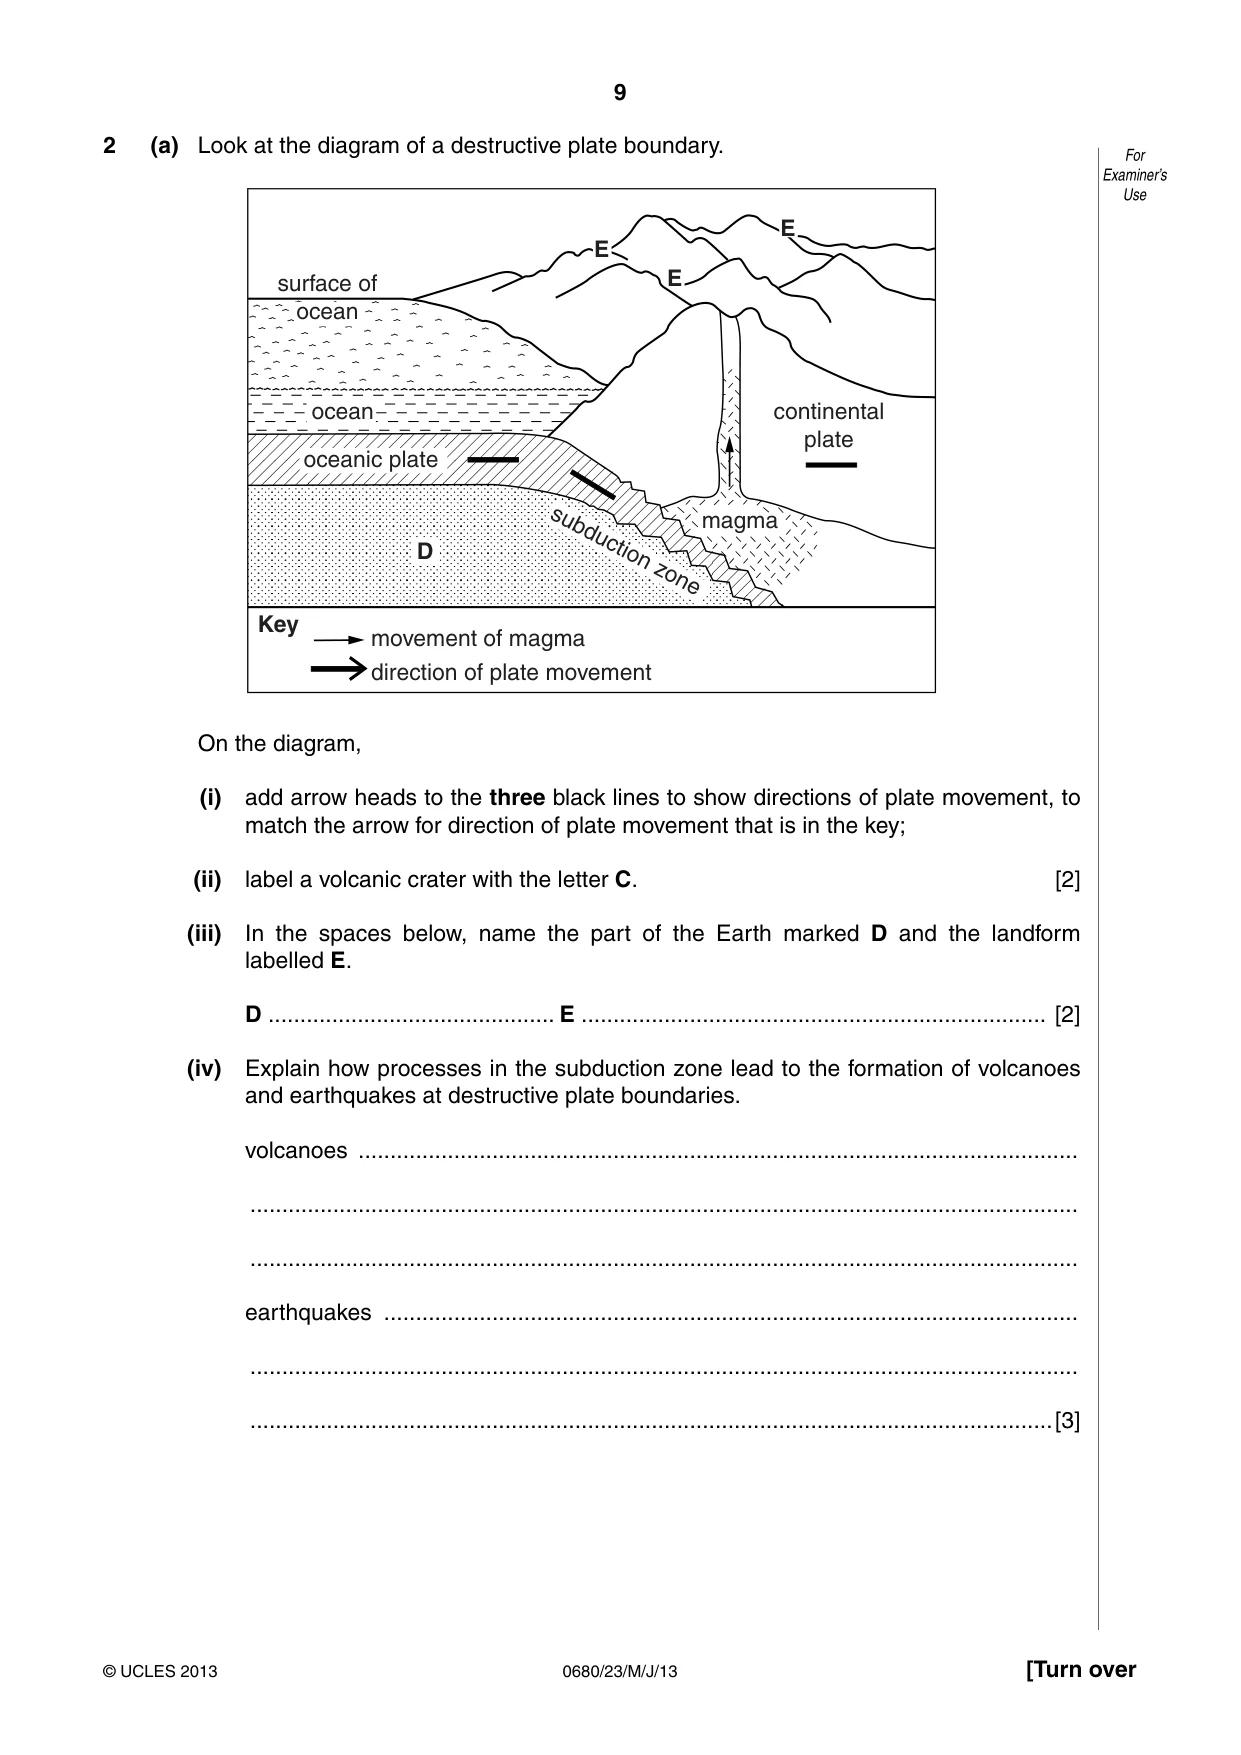
9 0680/23/M/J/13 © UCLES 2013 [Turn over For Examiner’s Use 2 (a) Look at the diagram of a destructive plate boundary. continental plate magma oceanic plate subduction zone D E E E Key movement of magma direction of plate movement ocean surface of ocean On the diagram, (i) add arrow heads to the three black lines to show directions of plate movement, to match the arrow for direction of plate movement that is in the key; (ii) label a volcanic crater with the letter C. [2] (iii) In the spaces below, name the part of the Earth marked D and the landform labelled E. D … E … [2] (iv) Explain how processes in the subduction zone lead to the formation of volcanoes and earthquakes at destructive plate boundaries. volcanoes … … … earthquakes … … …[3]
Question paper, page 10
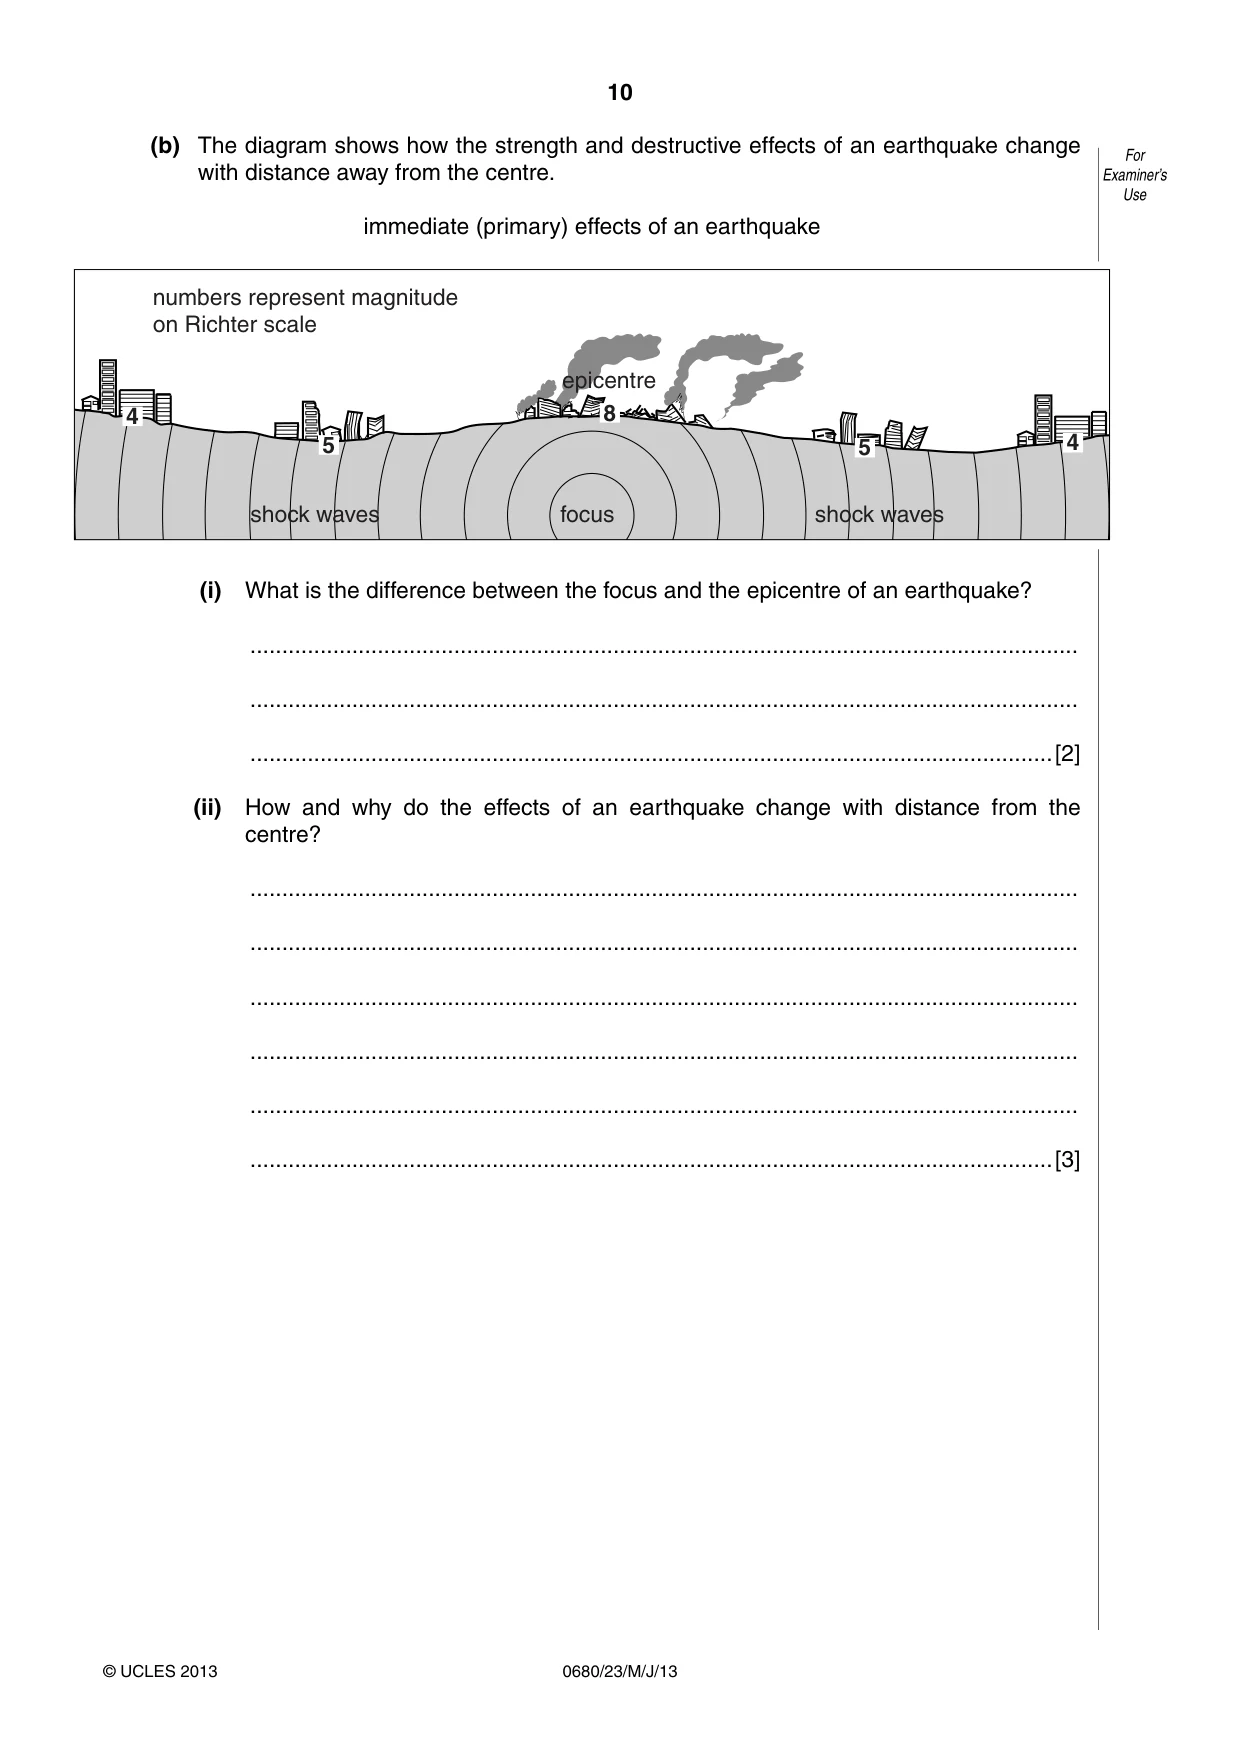
10 0680/23/M/J/13 © UCLES 2013 (b) The diagram shows how the strength and destructive effects of an earthquake change with distance away from the centre. immediate (primary) effects of an earthquake focus shock waves shock waves 4 5 5 4 8 numbers represent magnitude on Richter scale epicentre (i) What is the difference between the focus and the epicentre of an earthquake? … … …[2] (ii) How and why do the effects of an earthquake change with distance from the centre? … … … … … …[3] For Examiner’s Use
Question paper, page 11
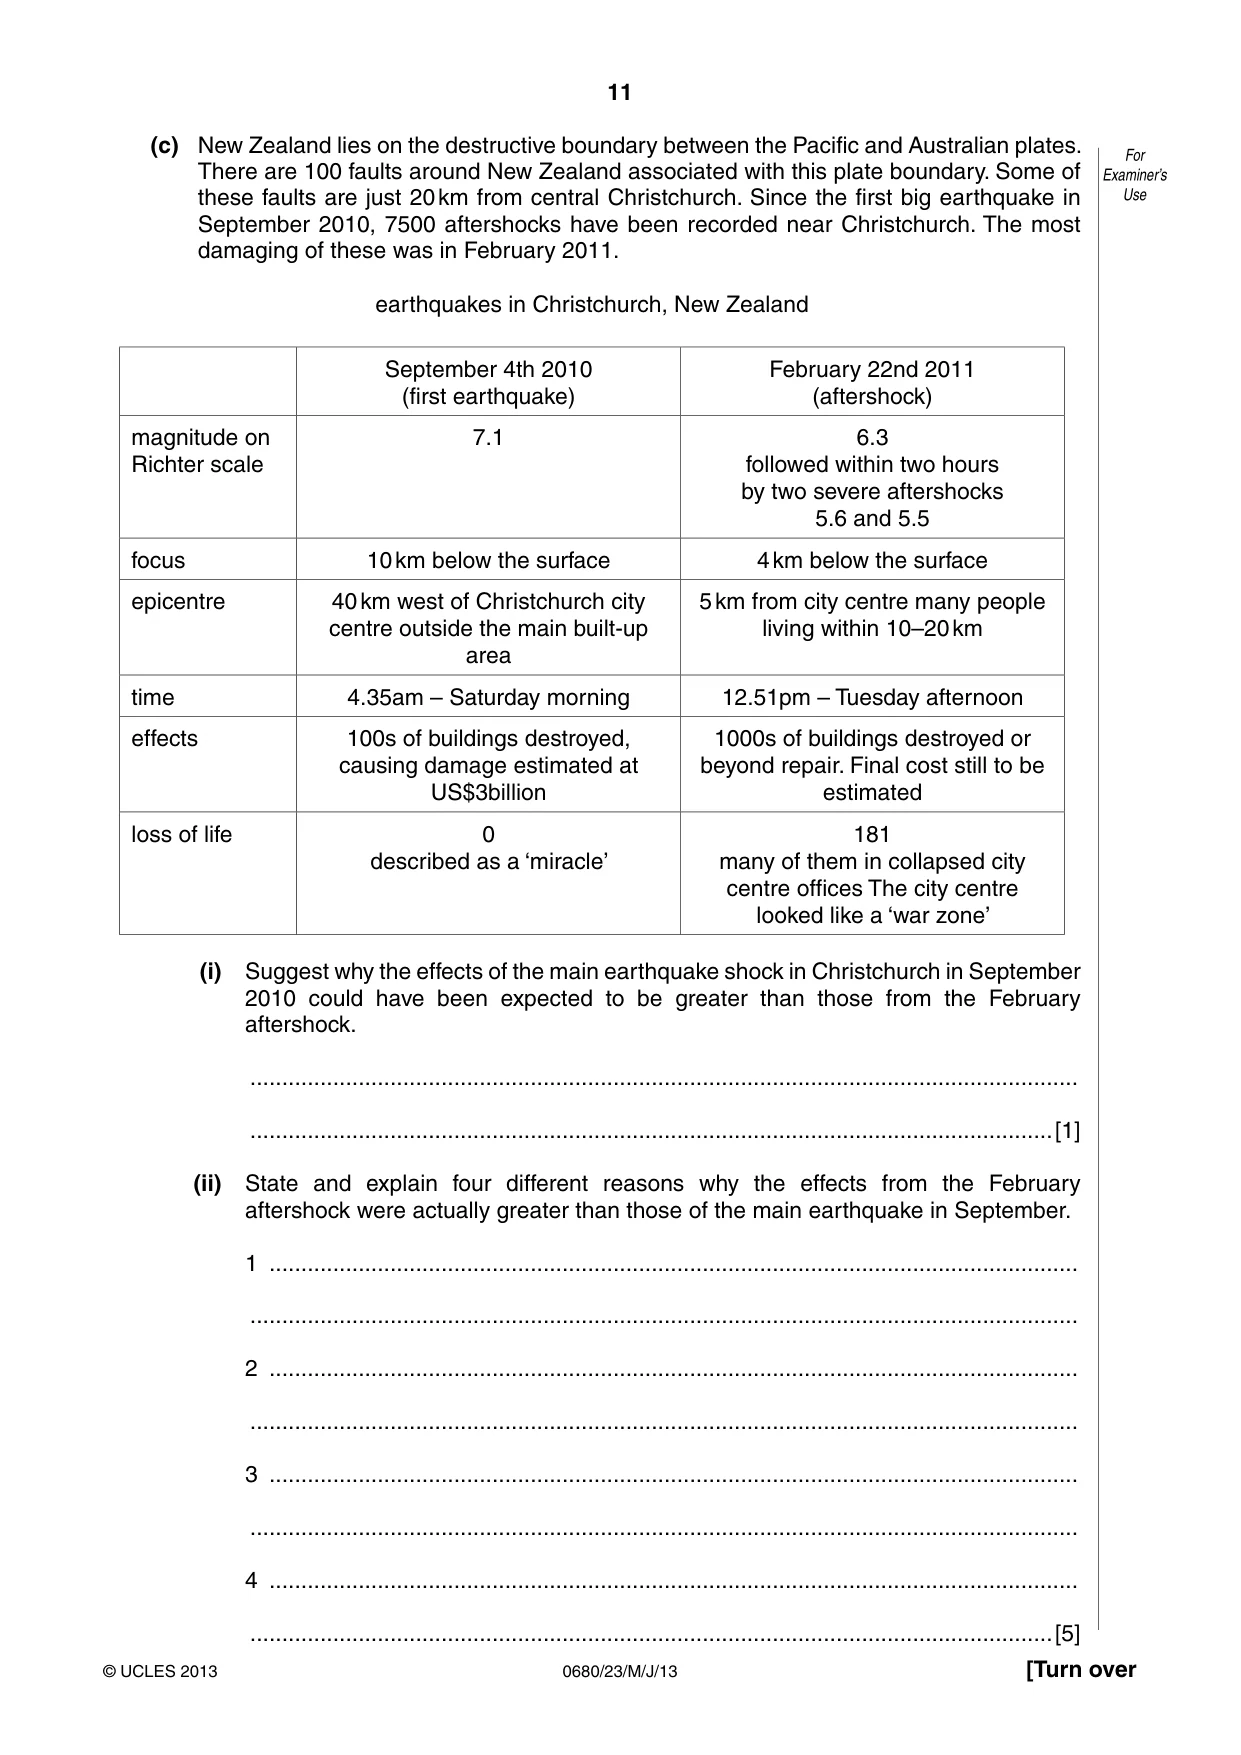
11 0680/23/M/J/13 © UCLES 2013 [Turn over For Examiner’s Use (c) New Zealand lies on the destructive boundary between the Pacific and Australian plates. There are 100 faults around New Zealand associated with this plate boundary. Some of these faults are just 20 km from central Christchurch. Since the first big earthquake in September 2010, 7500 aftershocks have been recorded near Christchurch. The most damaging of these was in February 2011. earthquakes in Christchurch, New Zealand September 4th 2010 (first earthquake) February 22nd 2011 (aftershock) magnitude on Richter scale 7.1 6.3 followed within two hours by two severe aftershocks 5.6 and 5.5 focus 10 km below the surface 4 km below the surface epicentre 40 km west of Christchurch city centre outside the main built-up area 5 km from city centre many people living within 10–20 km time 4.35am – Saturday morning 12.51pm – Tuesday afternoon effects 100s of buildings destroyed, causing damage estimated at US$3billion 1000s of buildings destroyed or beyond repair. Final cost still to be estimated loss of life 0 described as a ‘miracle’ 181 many of them in collapsed city centre offices The city centre looked like a ‘war zone’ (i) Suggest why the effects of the main earthquake shock in Christchurch in September 2010 could have been expected to be greater than those from the February aftershock. … …[1] (ii) State and explain four different reasons why the effects from the February aftershock were actually greater than those of the main earthquake in September. 1 … … 2 … … 3 … … 4 … …[5]
Question paper, page 12
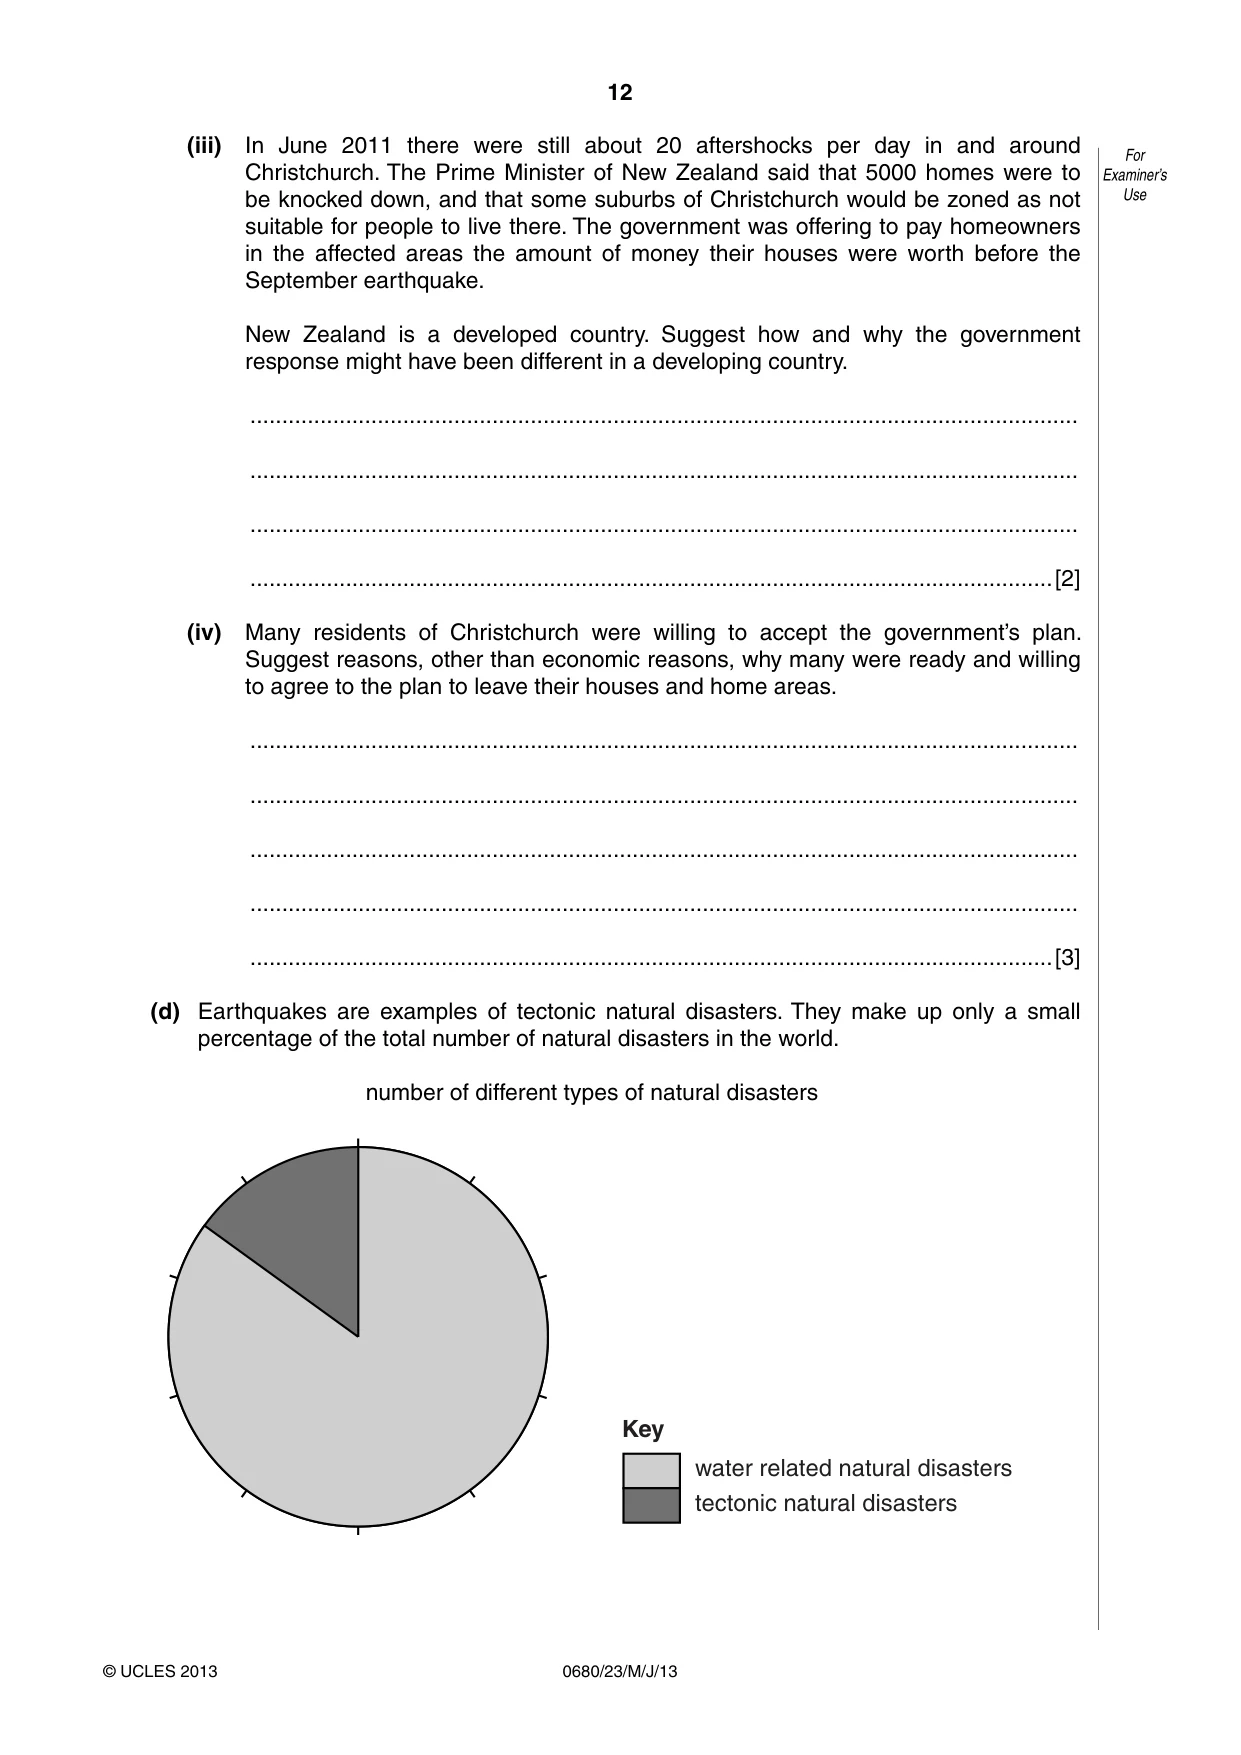
12 0680/23/M/J/13 © UCLES 2013 For Examiner’s Use (iii) In June 2011 there were still about 20 aftershocks per day in and around Christchurch. The Prime Minister of New Zealand said that 5000 homes were to be knocked down, and that some suburbs of Christchurch would be zoned as not suitable for people to live there. The government was offering to pay homeowners in the affected areas the amount of money their houses were worth before the September earthquake. New Zealand is a developed country. Suggest how and why the government response might have been different in a developing country. … … … …[2] (iv) Many residents of Christchurch were willing to accept the government’s plan. Suggest reasons, other than economic reasons, why many were ready and willing to agree to the plan to leave their houses and home areas. … … … … …[3] (d) Earthquakes are examples of tectonic natural disasters. They make up only a small percentage of the total number of natural disasters in the world. number of different types of natural disasters water related natural disasters tectonic natural disasters Key
Question paper, page 13
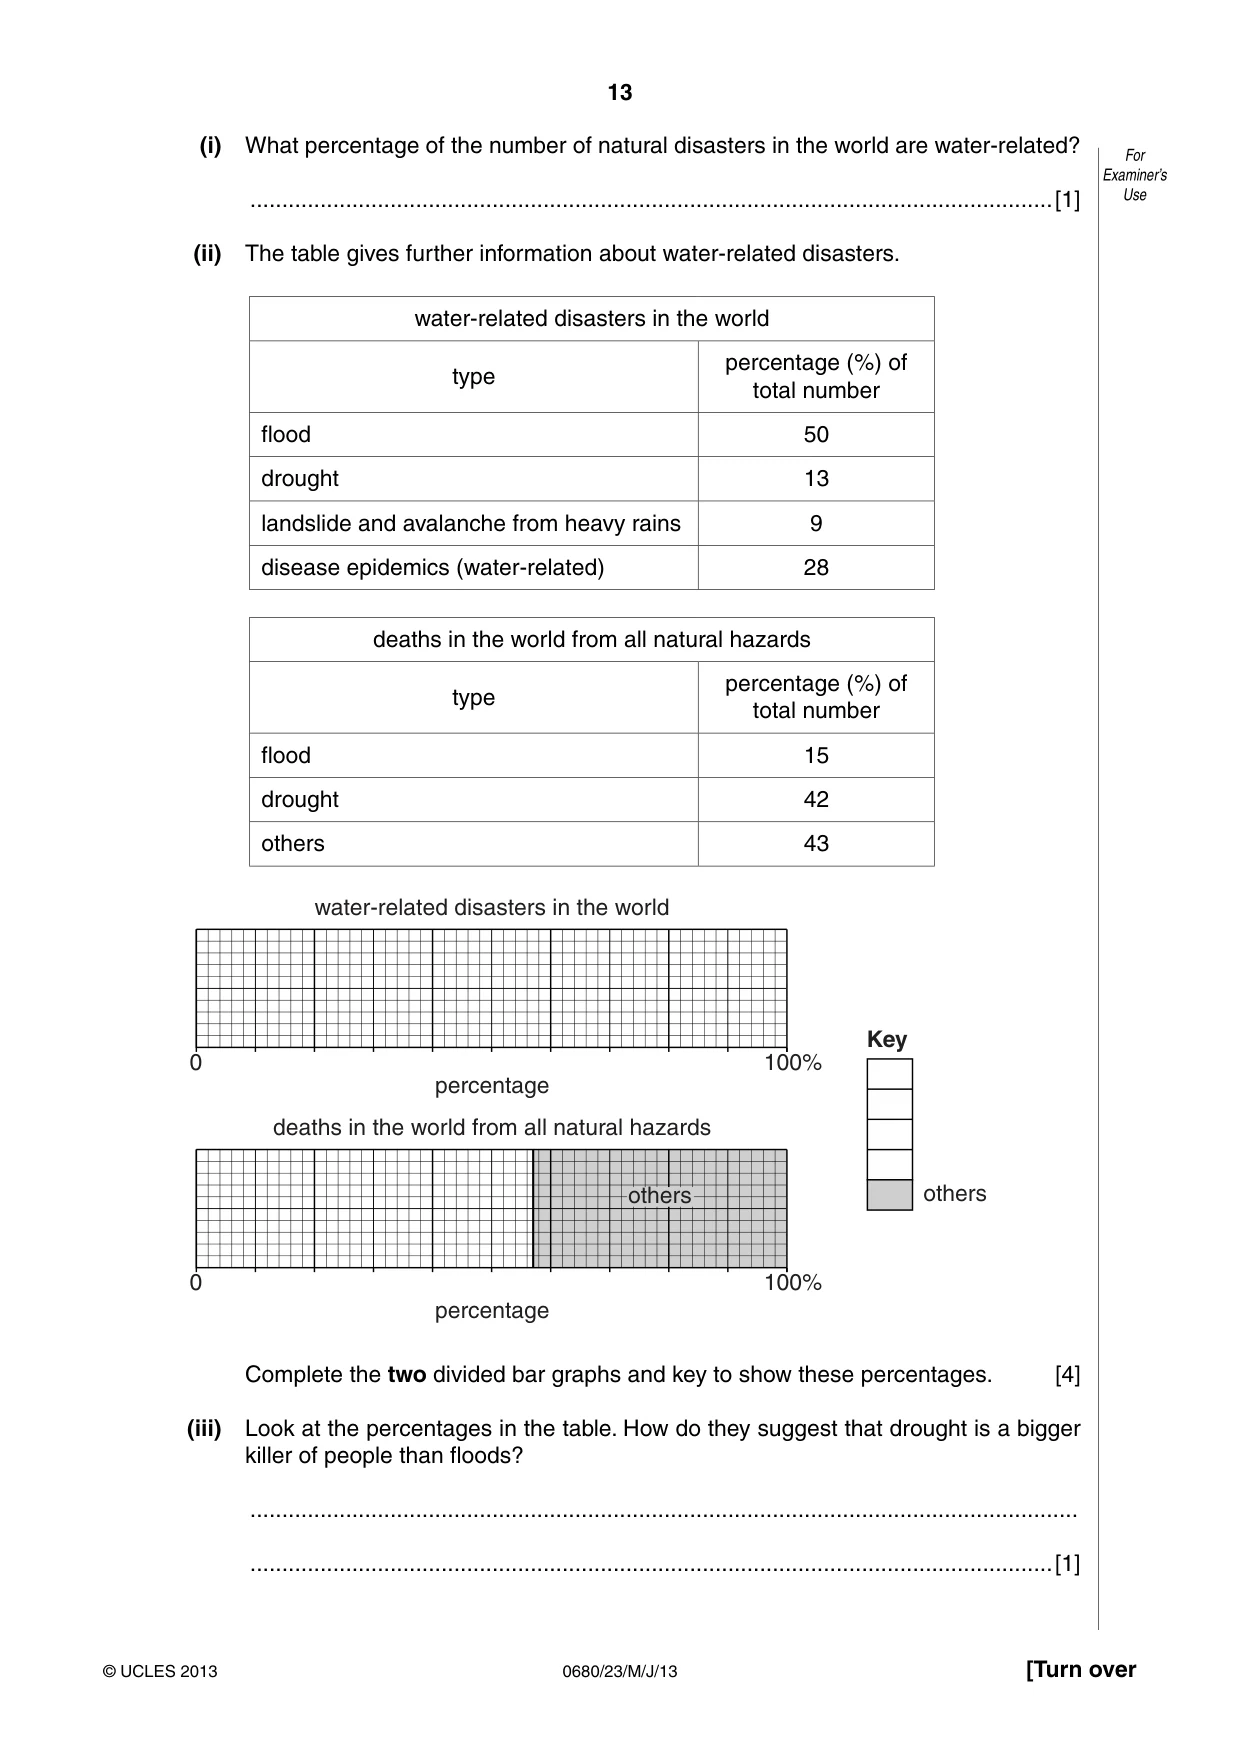
13 0680/23/M/J/13 © UCLES 2013 [Turn over For Examiner’s Use (i) What percentage of the number of natural disasters in the world are water-related? …[1] (ii) The table gives further information about water-related disasters. water-related disasters in the world type percentage (%) of total number flood 50 drought 13 landslide and avalanche from heavy rains 9 disease epidemics (water-related) 28 deaths in the world from all natural hazards type percentage (%) of total number flood 15 drought 42 others 43 0 100% water-related disasters in the world 0 100% deaths in the world from all natural hazards Key others others percentage percentage Complete the two divided bar graphs and key to show these percentages. [4] (iii) Look at the percentages in the table. How do they suggest that drought is a bigger killer of people than floods? … …[1]
Question paper, page 14
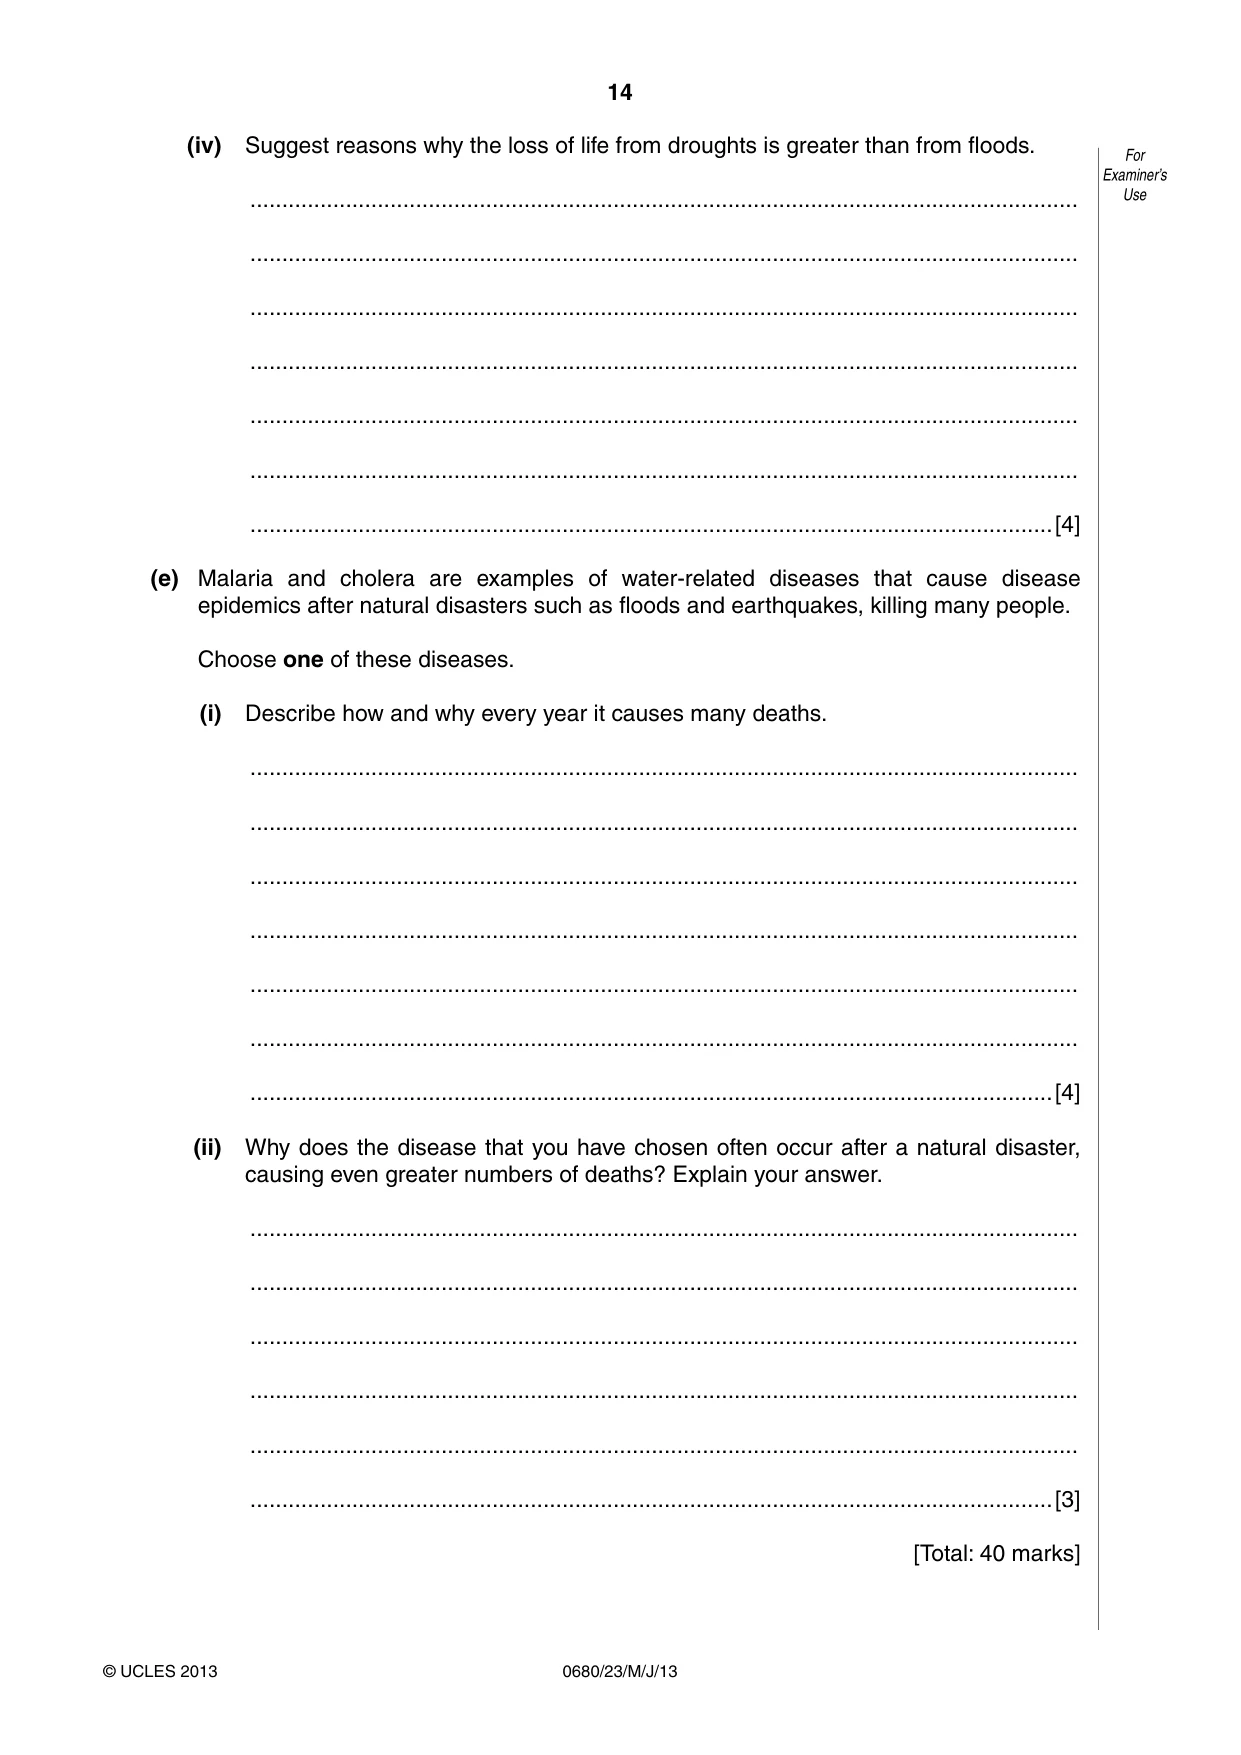
14 0680/23/M/J/13 © UCLES 2013 For Examiner’s Use (iv) Suggest reasons why the loss of life from droughts is greater than from floods. … … … … … … …[4] (e) Malaria and cholera are examples of water-related diseases that cause disease epidemics after natural disasters such as floods and earthquakes, killing many people. Choose one of these diseases. (i) Describe how and why every year it causes many deaths. … … … … … … …[4] (ii) Why does the disease that you have chosen often occur after a natural disaster, causing even greater numbers of deaths? Explain your answer. … … … … … …[3] [Total: 40 marks]
Question paper, page 15
15 0680/23/M/J/13 © UCLES 2013 BLANK PAGE
Question paper, page 16
16 0680/23/M/J/13 © UCLES 2013 Permission to reproduce items where third-party owned material protected by copyright is included has been sought and cleared where possible. Every reasonable effort has been made by the publisher (UCLES) to trace copyright holders, but if any items requiring clearance have unwittingly been included, the publisher will be pleased to make amends at the earliest possible opportunity. University of Cambridge International Examinations is part of the Cambridge Assessment Group. Cambridge Assessment is the brand name of University of Cambridge Local Examinations Syndicate (UCLES), which is itself a department of the University of Cambridge. BLANK PAGE
Mark scheme, page 1
CAMBRIDGE INTERNATIONAL EXAMINATIONS International General Certificate of Secondary Education MARK SCHEME for the May/June 2013 series 0680 ENVIRONMENTAL STUDIES 0680/23 Paper 2, maximum raw mark 80 This mark scheme is published as an aid to teachers and candidates, to indicate the requirements of the examination. It shows the basis on which Examiners were instructed to award marks. It does not indicate the details of the discussions that took place at an Examiners’ meeting before marking began, which would have considered the acceptability of alternative answers. Mark schemes should be read in conjunction with the question paper and the Principal Examiner Report for Teachers. Cambridge will not enter into discussions about these mark schemes. Cambridge is publishing the mark schemes for the May/June 2013 series for most IGCSE, GCE Advanced Level and Advanced Subsidiary Level components and some Ordinary Level components.
Mark scheme, page 2
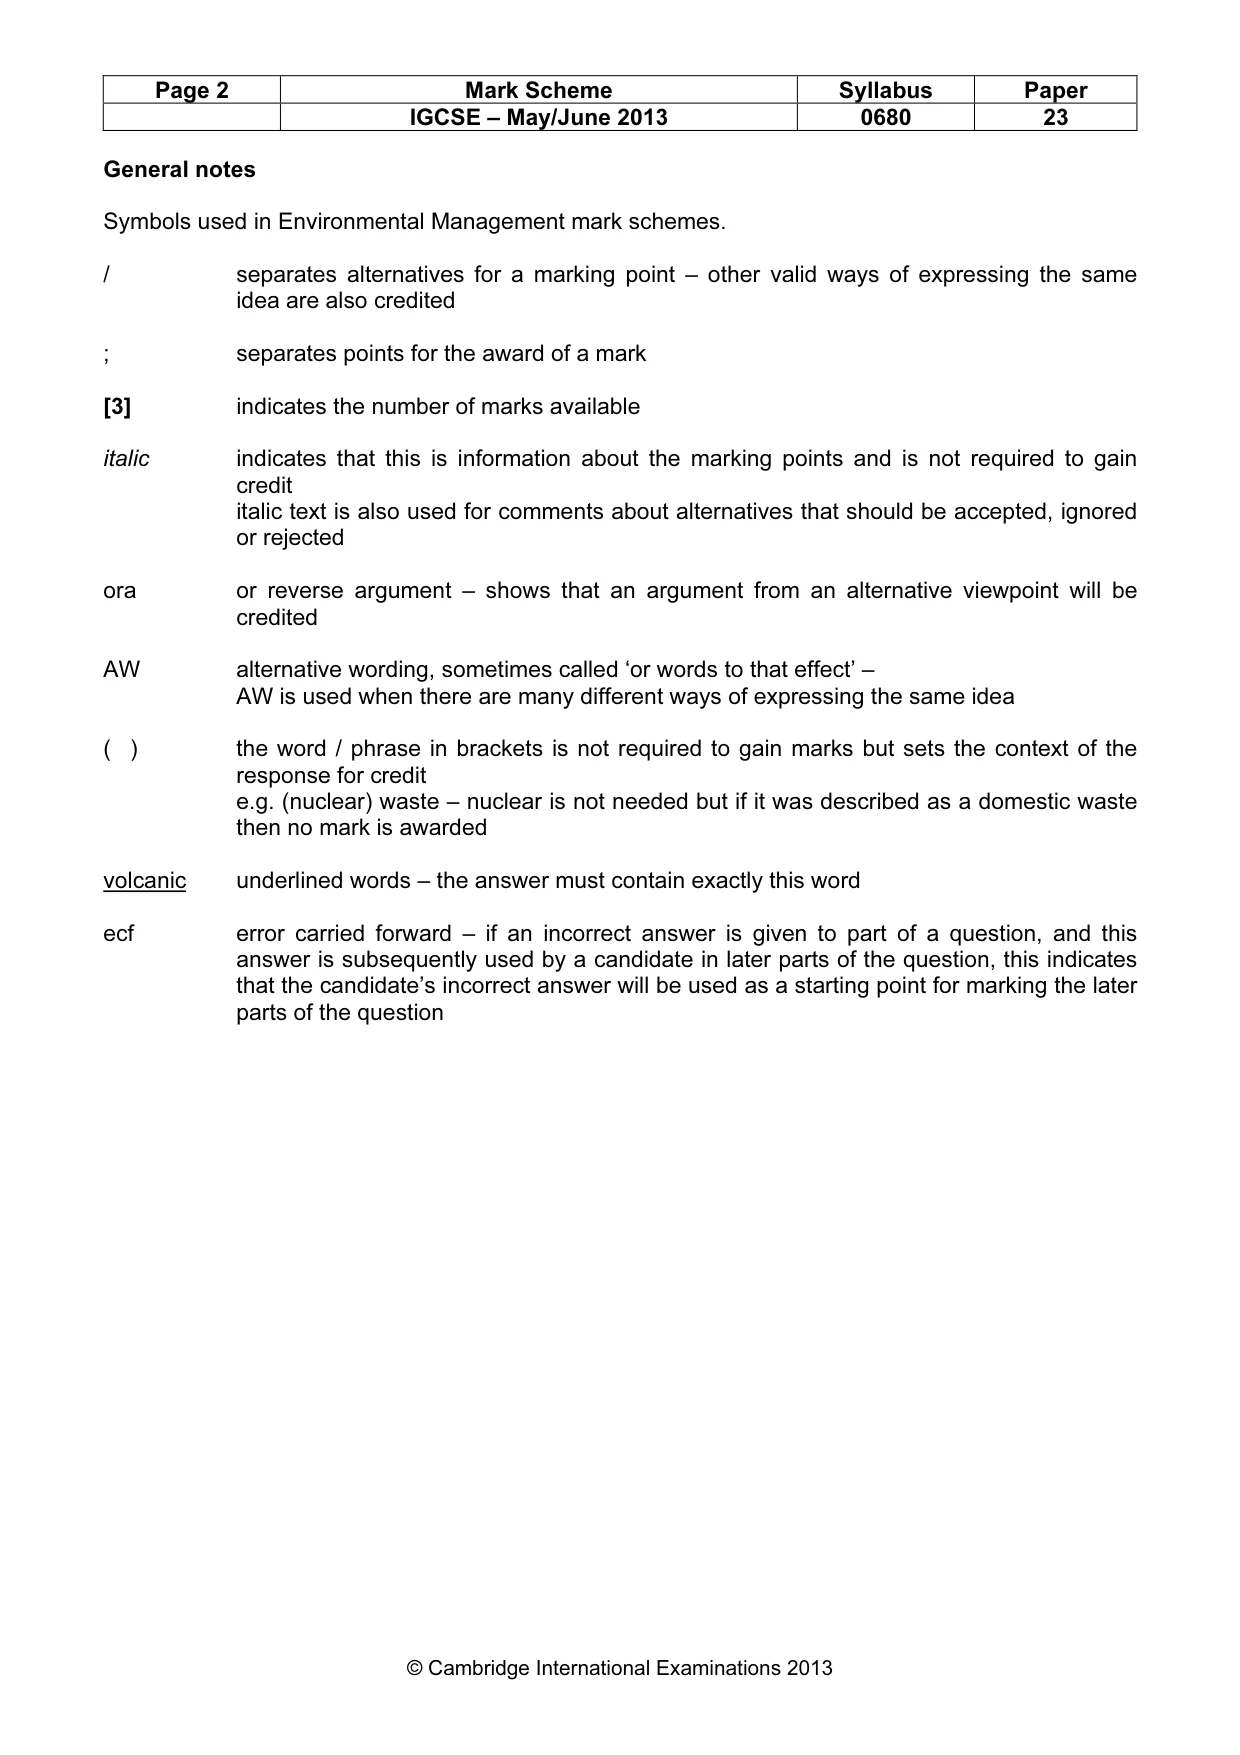
Page 2 Mark Scheme Syllabus Paper IGCSE – May/June 2013 0680 23 © Cambridge International Examinations 2013 General notes Symbols used in Environmental Management mark schemes. / separates alternatives for a marking point – other valid ways of expressing the same idea are also credited ; separates points for the award of a mark [3] indicates the number of marks available italic indicates that this is information about the marking points and is not required to gain credit italic text is also used for comments about alternatives that should be accepted, ignored or rejected ora or reverse argument – shows that an argument from an alternative viewpoint will be credited AW alternative wording, sometimes called ‘or words to that effect’ – AW is used when there are many different ways of expressing the same idea ( ) the word / phrase in brackets is not required to gain marks but sets the context of the response for credit e.g. (nuclear) waste – nuclear is not needed but if it was described as a domestic waste then no mark is awarded volcanic underlined words – the answer must contain exactly this word ecf error carried forward – if an incorrect answer is given to part of a question, and this answer is subsequently used by a candidate in later parts of the question, this indicates that the candidate’s incorrect answer will be used as a starting point for marking the later parts of the question
Mark scheme, page 3
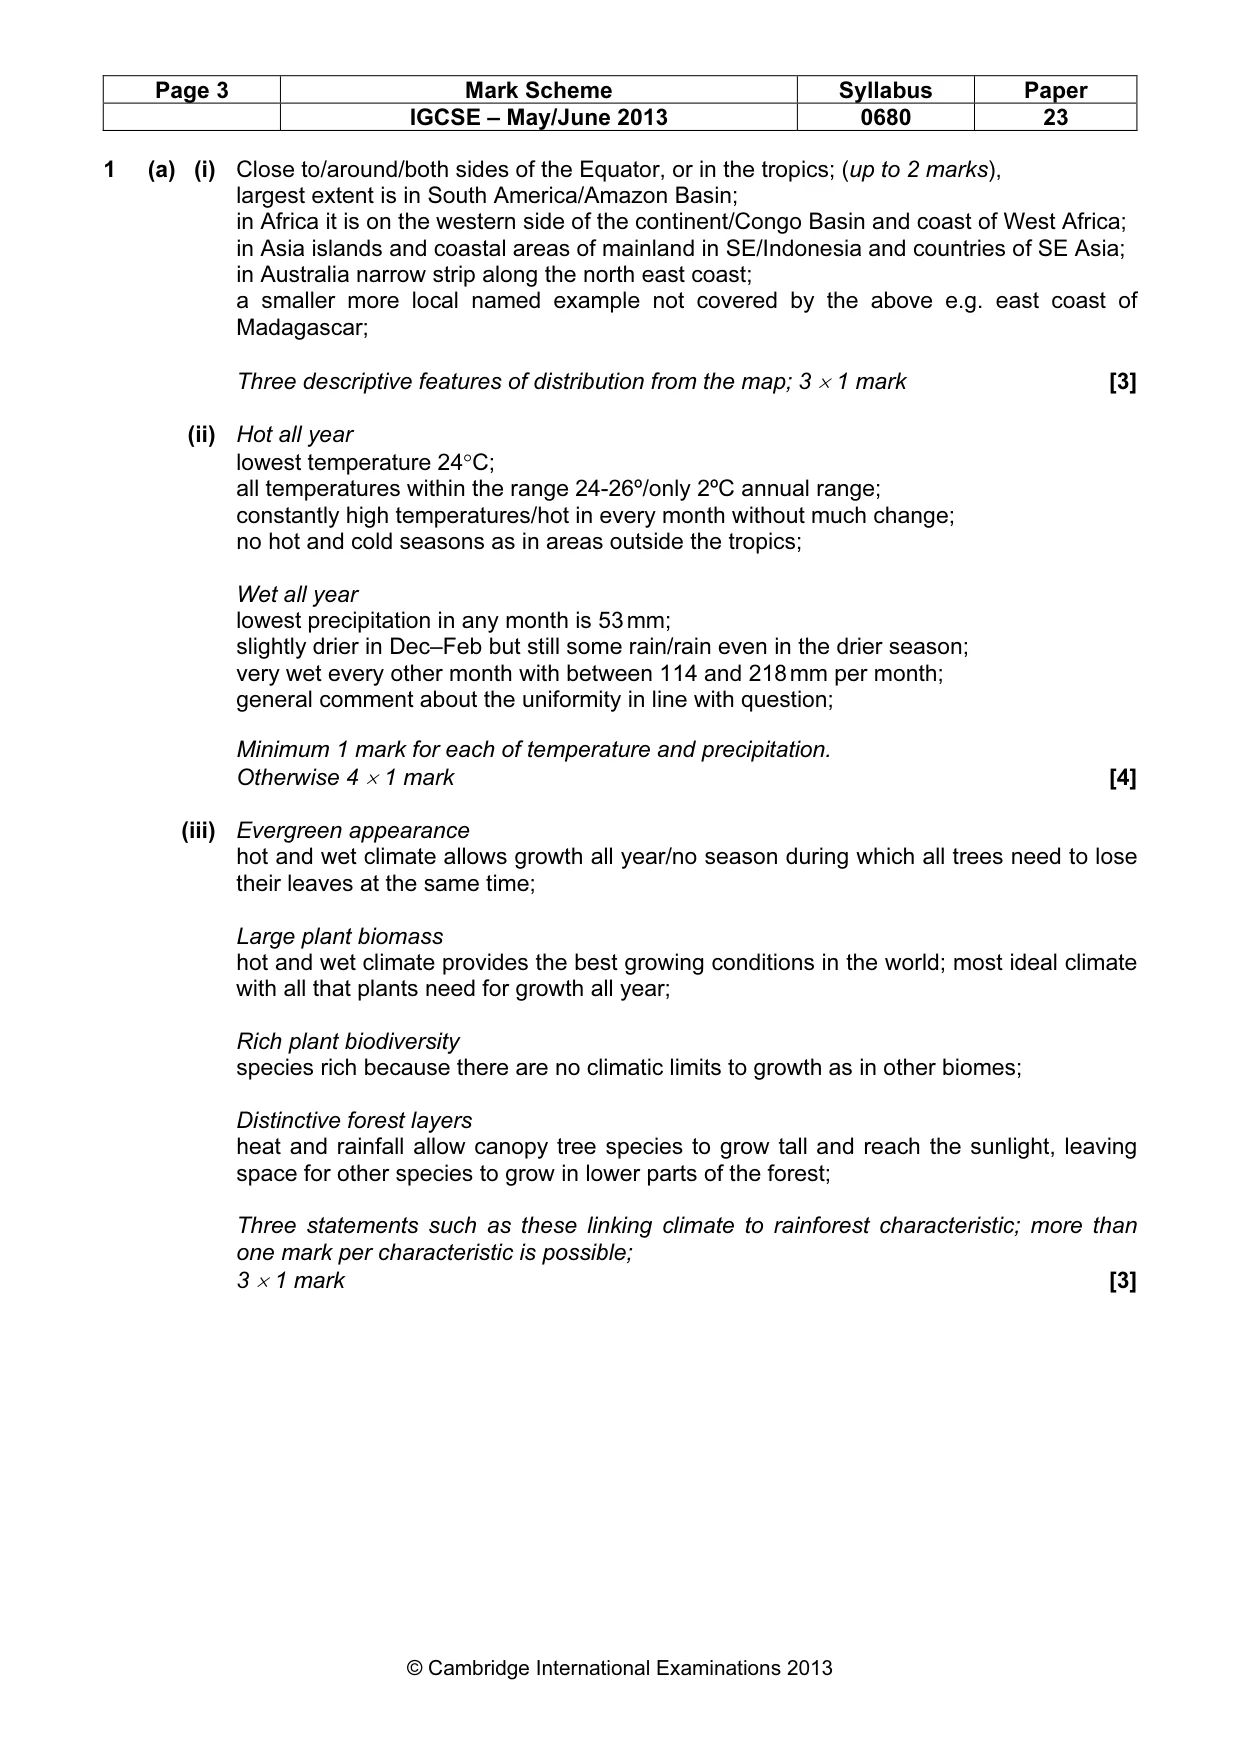
Page 3 Mark Scheme Syllabus Paper IGCSE – May/June 2013 0680 23 © Cambridge International Examinations 2013 1 (a) (i) Close to/around/both sides of the Equator, or in the tropics; (up to 2 marks), largest extent is in South America/Amazon Basin; in Africa it is on the western side of the continent/Congo Basin and coast of West Africa; in Asia islands and coastal areas of mainland in SE/Indonesia and countries of SE Asia; in Australia narrow strip along the north east coast; a smaller more local named example not covered by the above e.g. east coast of Madagascar; Three descriptive features of distribution from the map; 3 × 1 mark [3] (ii) Hot all year lowest temperature 24°C; all temperatures within the range 24-26º/only 2ºC annual range; constantly high temperatures/hot in every month without much change; no hot and cold seasons as in areas outside the tropics; Wet all year lowest precipitation in any month is 53 mm; slightly drier in Dec–Feb but still some rain/rain even in the drier season; very wet every other month with between 114 and 218 mm per month; general comment about the uniformity in line with question; Minimum 1 mark for each of temperature and precipitation. Otherwise 4 × 1 mark [4] (iii) Evergreen appearance hot and wet climate allows growth all year/no season during which all trees need to lose their leaves at the same time; Large plant biomass hot and wet climate provides the best growing conditions in the world; most ideal climate with all that plants need for growth all year; Rich plant biodiversity species rich because there are no climatic limits to growth as in other biomes; Distinctive forest layers heat and rainfall allow canopy tree species to grow tall and reach the sunlight, leaving space for other species to grow in lower parts of the forest; Three statements such as these linking climate to rainforest characteristic; more than one mark per characteristic is possible; 3 × 1 mark [3]
Mark scheme, page 4
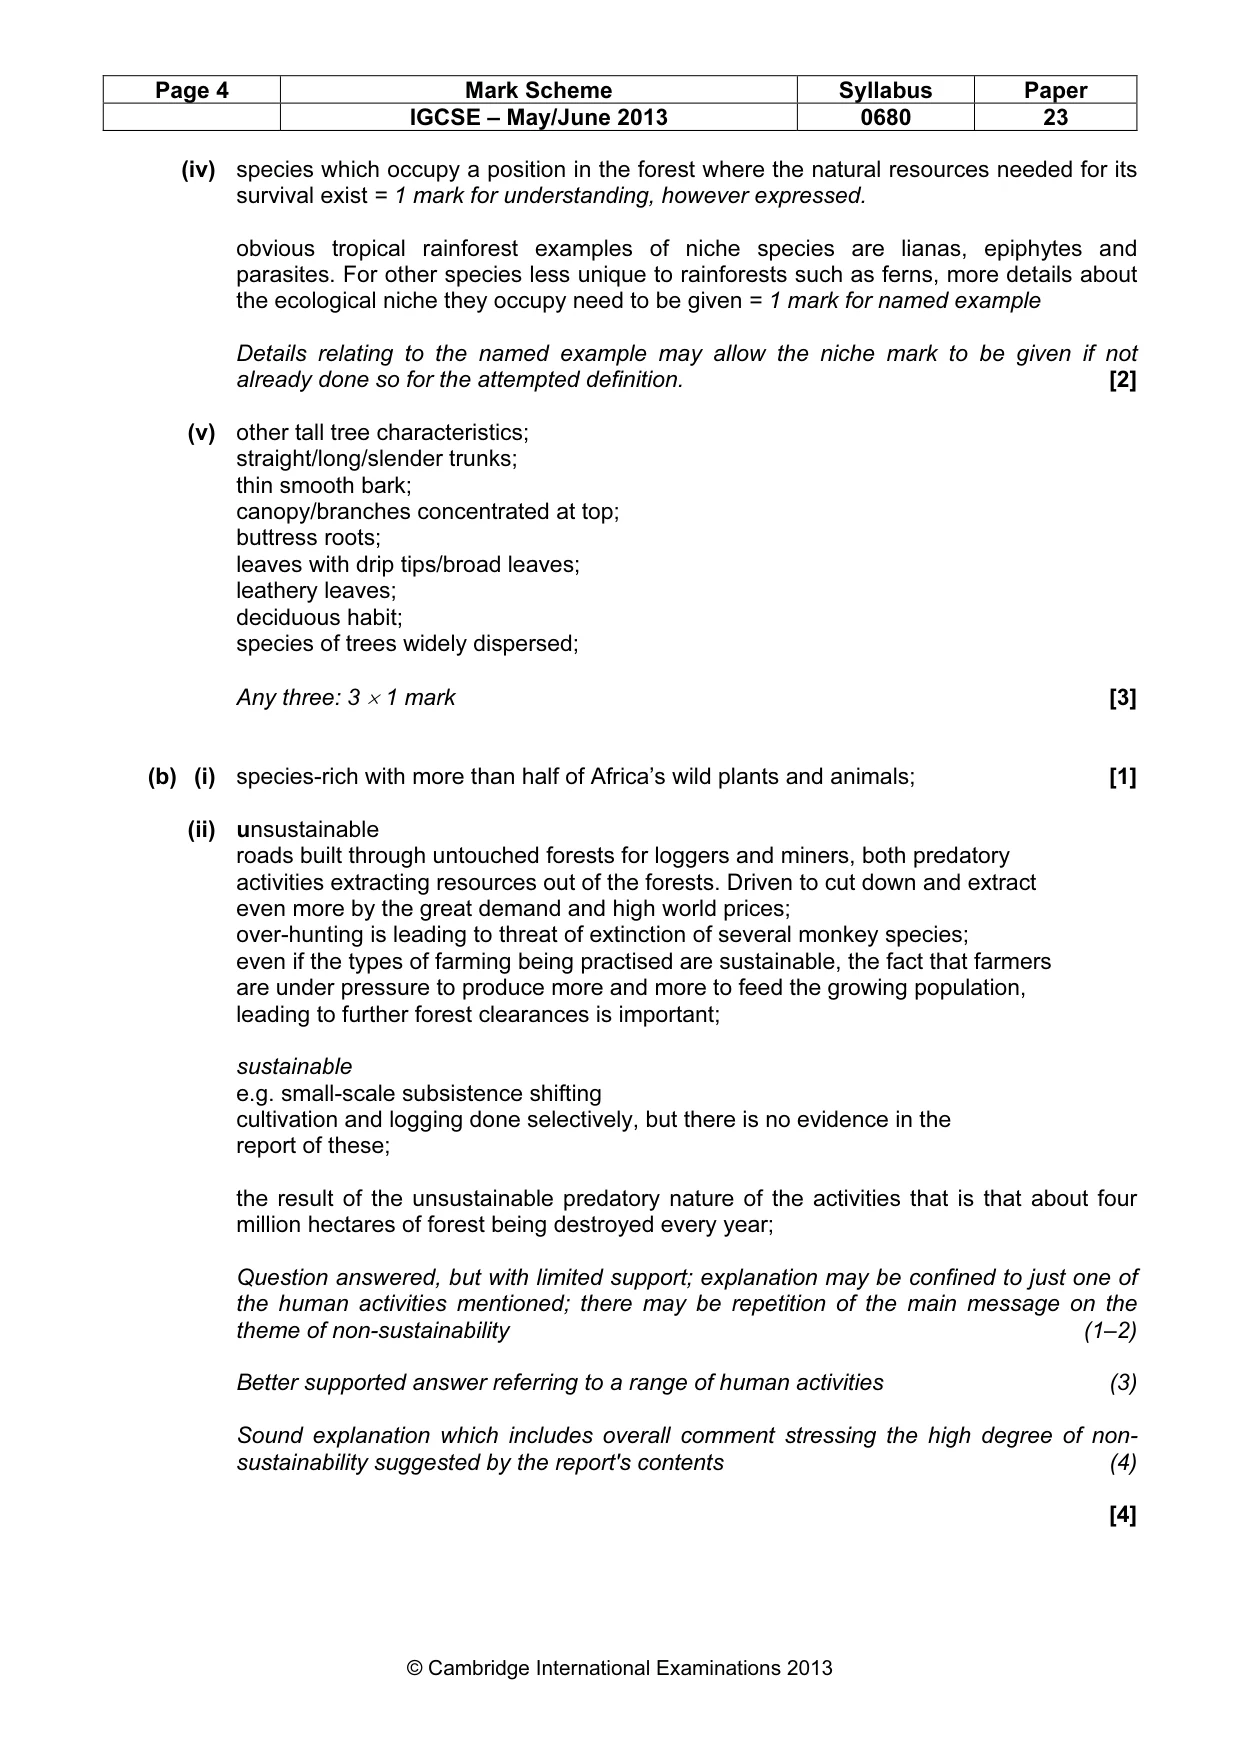
Page 4 Mark Scheme Syllabus Paper IGCSE – May/June 2013 0680 23 © Cambridge International Examinations 2013 (iv) species which occupy a position in the forest where the natural resources needed for its survival exist = 1 mark for understanding, however expressed. obvious tropical rainforest examples of niche species are lianas, epiphytes and parasites. For other species less unique to rainforests such as ferns, more details about the ecological niche they occupy need to be given = 1 mark for named example Details relating to the named example may allow the niche mark to be given if not already done so for the attempted definition. [2] (v) other tall tree characteristics; straight/long/slender trunks; thin smooth bark; canopy/branches concentrated at top; buttress roots; leaves with drip tips/broad leaves; leathery leaves; deciduous habit; species of trees widely dispersed; Any three: 3 × 1 mark [3] (b) (i) species-rich with more than half of Africa’s wild plants and animals; [1] (ii) unsustainable roads built through untouched forests for loggers and miners, both predatory activities extracting resources out of the forests. Driven to cut down and extract even more by the great demand and high world prices; over-hunting is leading to threat of extinction of several monkey species; even if the types of farming being practised are sustainable, the fact that farmers are under pressure to produce more and more to feed the growing population, leading to further forest clearances is important; sustainable e.g. small-scale subsistence shifting cultivation and logging done selectively, but there is no evidence in the report of these; the result of the unsustainable predatory nature of the activities that is that about four million hectares of forest being destroyed every year; Question answered, but with limited support; explanation may be confined to just one of the human activities mentioned; there may be repetition of the main message on the theme of non-sustainability (1–2) Better supported answer referring to a range of human activities (3) Sound explanation which includes overall comment stressing the high degree of non- sustainability suggested by the report's contents (4) [4]
Mark scheme, page 5
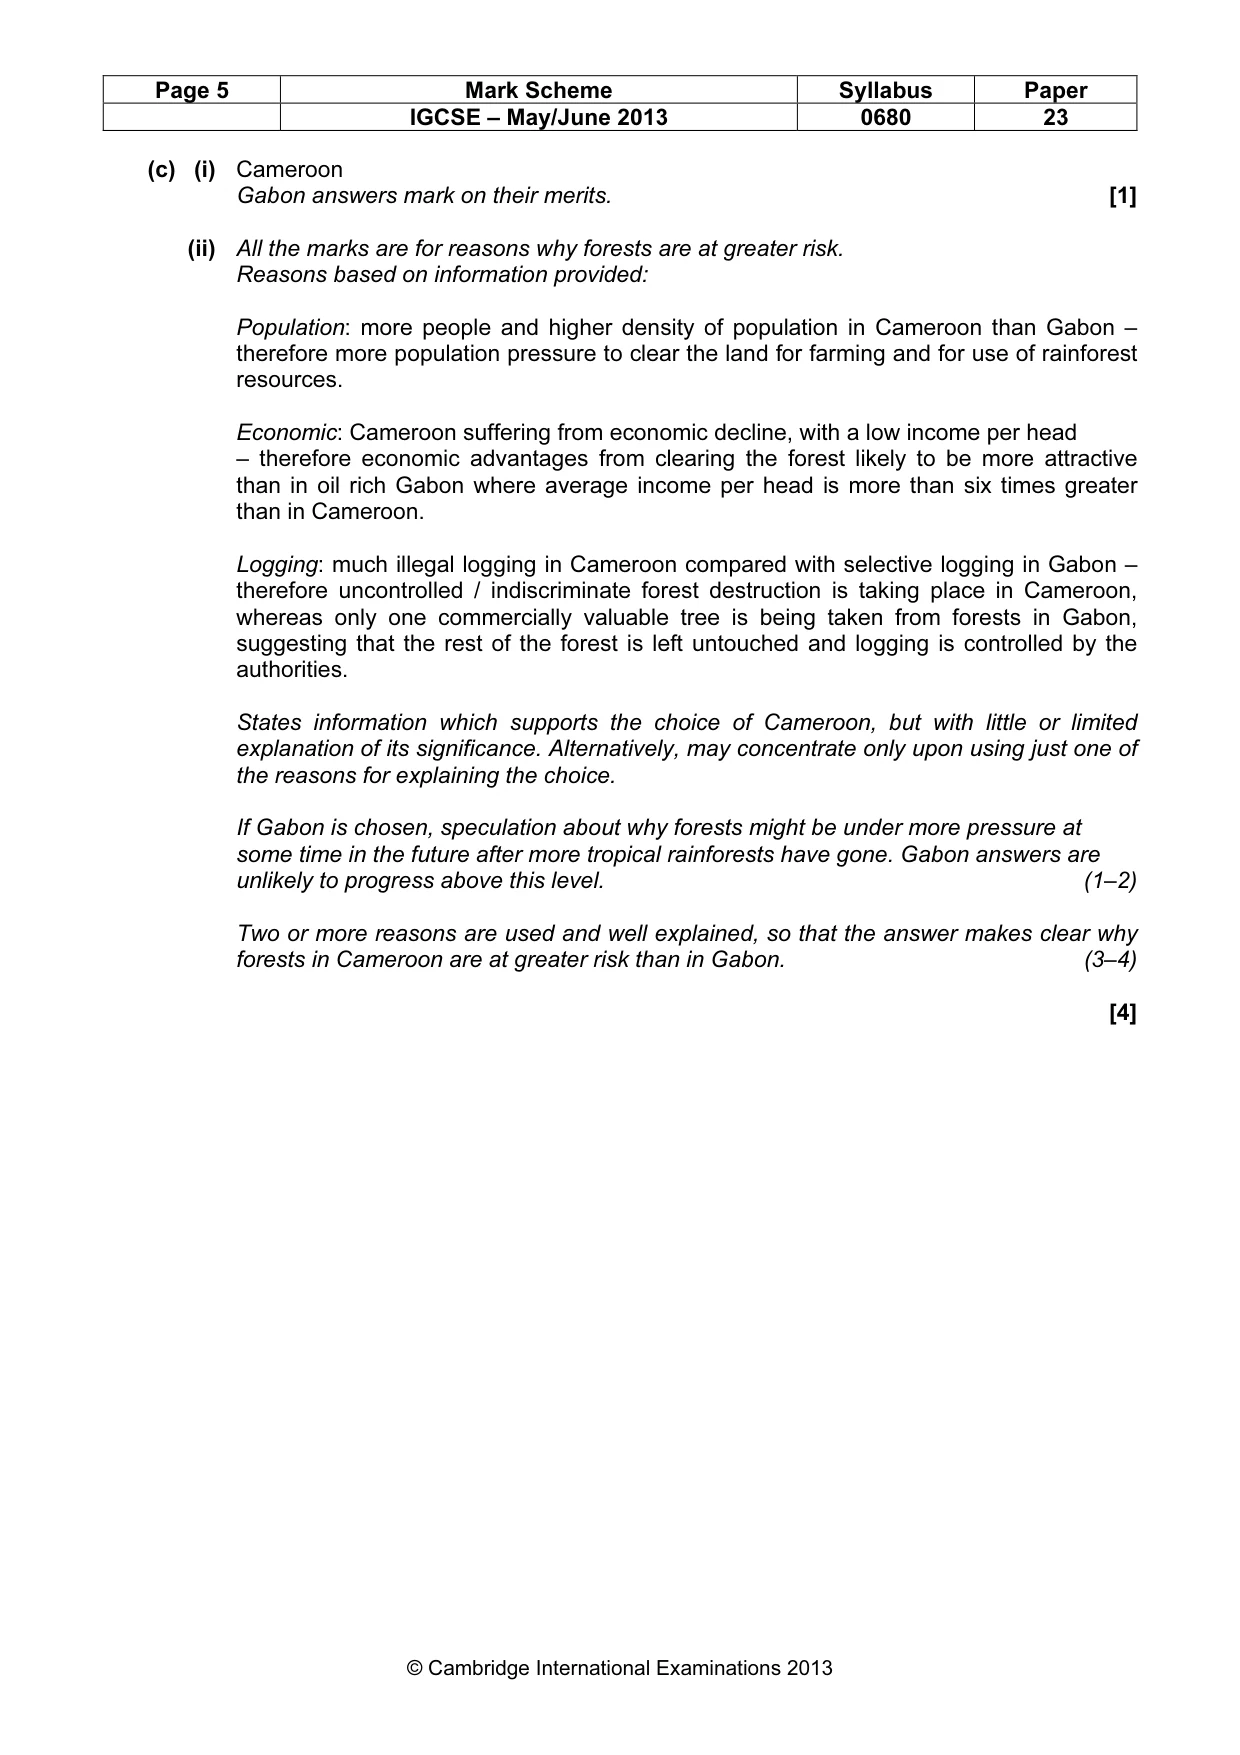
Page 5 Mark Scheme Syllabus Paper IGCSE – May/June 2013 0680 23 © Cambridge International Examinations 2013 (c) (i) Cameroon Gabon answers mark on their merits. [1] (ii) All the marks are for reasons why forests are at greater risk. Reasons based on information provided: Population: more people and higher density of population in Cameroon than Gabon – therefore more population pressure to clear the land for farming and for use of rainforest resources. Economic: Cameroon suffering from economic decline, with a low income per head – therefore economic advantages from clearing the forest likely to be more attractive than in oil rich Gabon where average income per head is more than six times greater than in Cameroon. Logging: much illegal logging in Cameroon compared with selective logging in Gabon – therefore uncontrolled / indiscriminate forest destruction is taking place in Cameroon, whereas only one commercially valuable tree is being taken from forests in Gabon, suggesting that the rest of the forest is left untouched and logging is controlled by the authorities. States information which supports the choice of Cameroon, but with little or limited explanation of its significance. Alternatively, may concentrate only upon using just one of the reasons for explaining the choice. If Gabon is chosen, speculation about why forests might be under more pressure at some time in the future after more tropical rainforests have gone. Gabon answers are unlikely to progress above this level. (1–2) Two or more reasons are used and well explained, so that the answer makes clear why forests in Cameroon are at greater risk than in Gabon. (3–4) [4]
Mark scheme, page 6
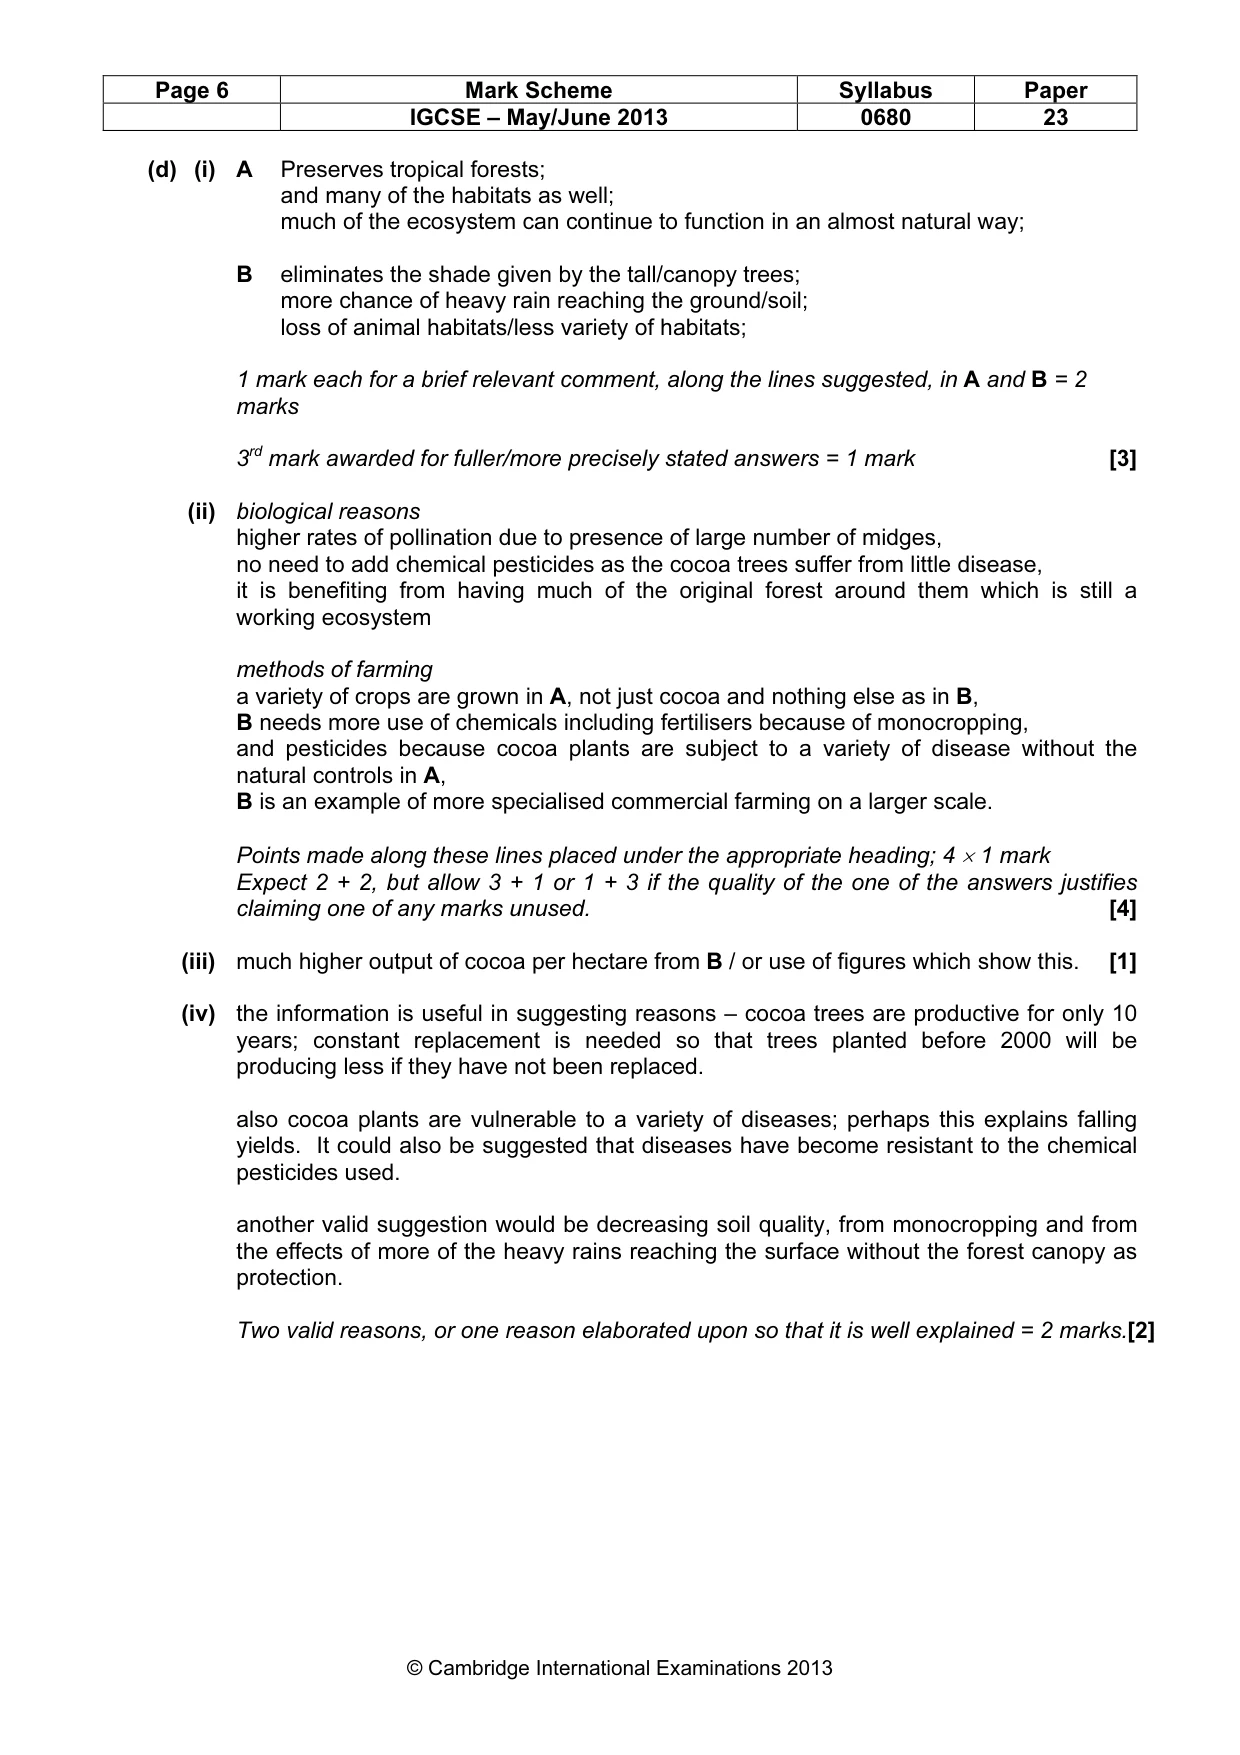
Page 6 Mark Scheme Syllabus Paper IGCSE – May/June 2013 0680 23 © Cambridge International Examinations 2013 (d) (i) A Preserves tropical forests; and many of the habitats as well; much of the ecosystem can continue to function in an almost natural way; B eliminates the shade given by the tall/canopy trees; more chance of heavy rain reaching the ground/soil; loss of animal habitats/less variety of habitats; 1 mark each for a brief relevant comment, along the lines suggested, in A and B = 2 marks 3rd mark awarded for fuller/more precisely stated answers = 1 mark [3] (ii) biological reasons higher rates of pollination due to presence of large number of midges, no need to add chemical pesticides as the cocoa trees suffer from little disease, it is benefiting from having much of the original forest around them which is still a working ecosystem methods of farming a variety of crops are grown in A, not just cocoa and nothing else as in B, B needs more use of chemicals including fertilisers because of monocropping, and pesticides because cocoa plants are subject to a variety of disease without the natural controls in A, B is an example of more specialised commercial farming on a larger scale. Points made along these lines placed under the appropriate heading; 4 × 1 mark Expect 2 + 2, but allow 3 + 1 or 1 + 3 if the quality of the one of the answers justifies claiming one of any marks unused. [4] (iii) much higher output of cocoa per hectare from B / or use of figures which show this. [1] (iv) the information is useful in suggesting reasons – cocoa trees are productive for only 10 years; constant replacement is needed so that trees planted before 2000 will be producing less if they have not been replaced. also cocoa plants are vulnerable to a variety of diseases; perhaps this explains falling yields. It could also be suggested that diseases have become resistant to the chemical pesticides used. another valid suggestion would be decreasing soil quality, from monocropping and from the effects of more of the heavy rains reaching the surface without the forest canopy as protection. Two valid reasons, or one reason elaborated upon so that it is well explained = 2 marks.[2]
Mark scheme, page 7
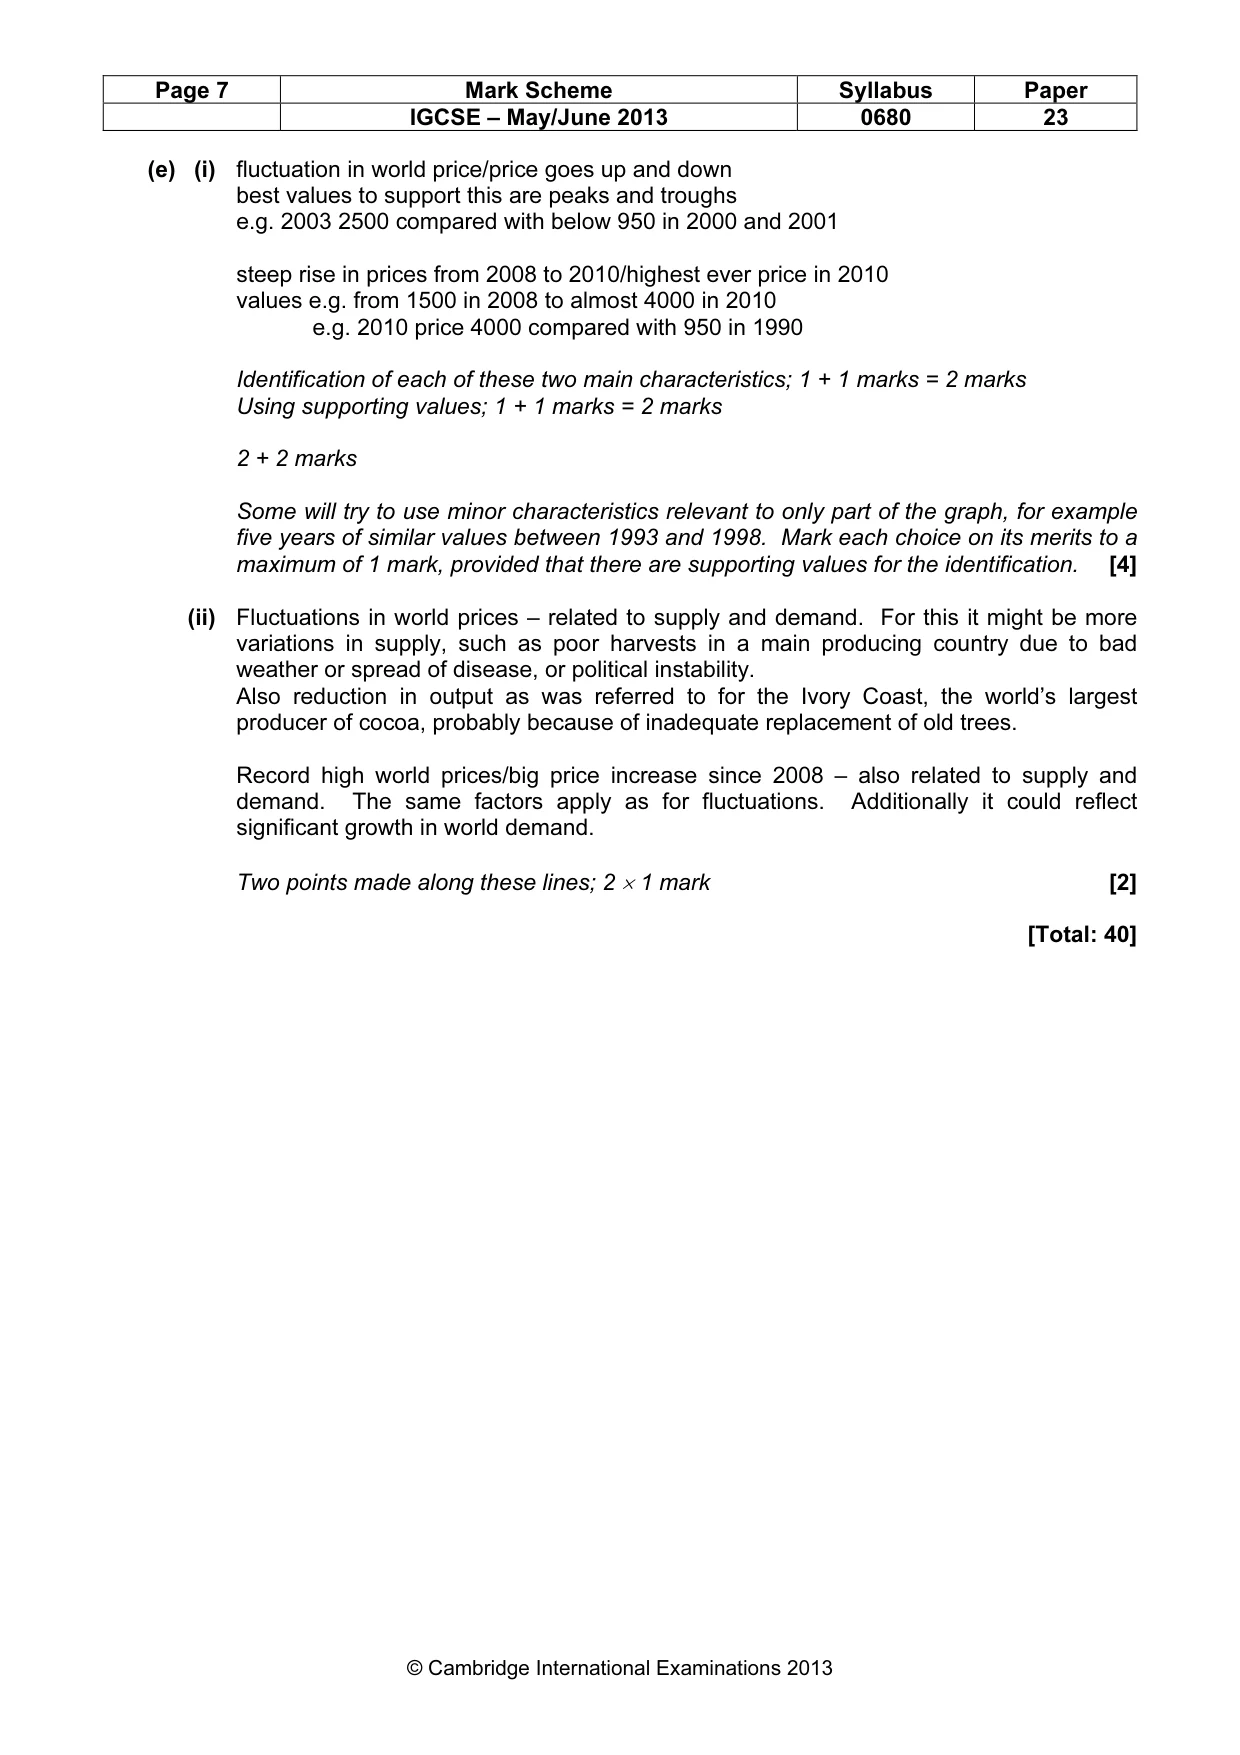
Page 7 Mark Scheme Syllabus Paper IGCSE – May/June 2013 0680 23 © Cambridge International Examinations 2013 (e) (i) fluctuation in world price/price goes up and down best values to support this are peaks and troughs e.g. 2003 2500 compared with below 950 in 2000 and 2001 steep rise in prices from 2008 to 2010/highest ever price in 2010 values e.g. from 1500 in 2008 to almost 4000 in 2010 e.g. 2010 price 4000 compared with 950 in 1990 Identification of each of these two main characteristics; 1 + 1 marks = 2 marks Using supporting values; 1 + 1 marks = 2 marks 2 + 2 marks Some will try to use minor characteristics relevant to only part of the graph, for example five years of similar values between 1993 and 1998. Mark each choice on its merits to a maximum of 1 mark, provided that there are supporting values for the identification. [4] (ii) Fluctuations in world prices – related to supply and demand. For this it might be more variations in supply, such as poor harvests in a main producing country due to bad weather or spread of disease, or political instability. Also reduction in output as was referred to for the Ivory Coast, the world’s largest producer of cocoa, probably because of inadequate replacement of old trees. Record high world prices/big price increase since 2008 – also related to supply and demand. The same factors apply as for fluctuations. Additionally it could reflect significant growth in world demand. Two points made along these lines; 2 × 1 mark [2] [Total: 40]
Mark scheme, page 8
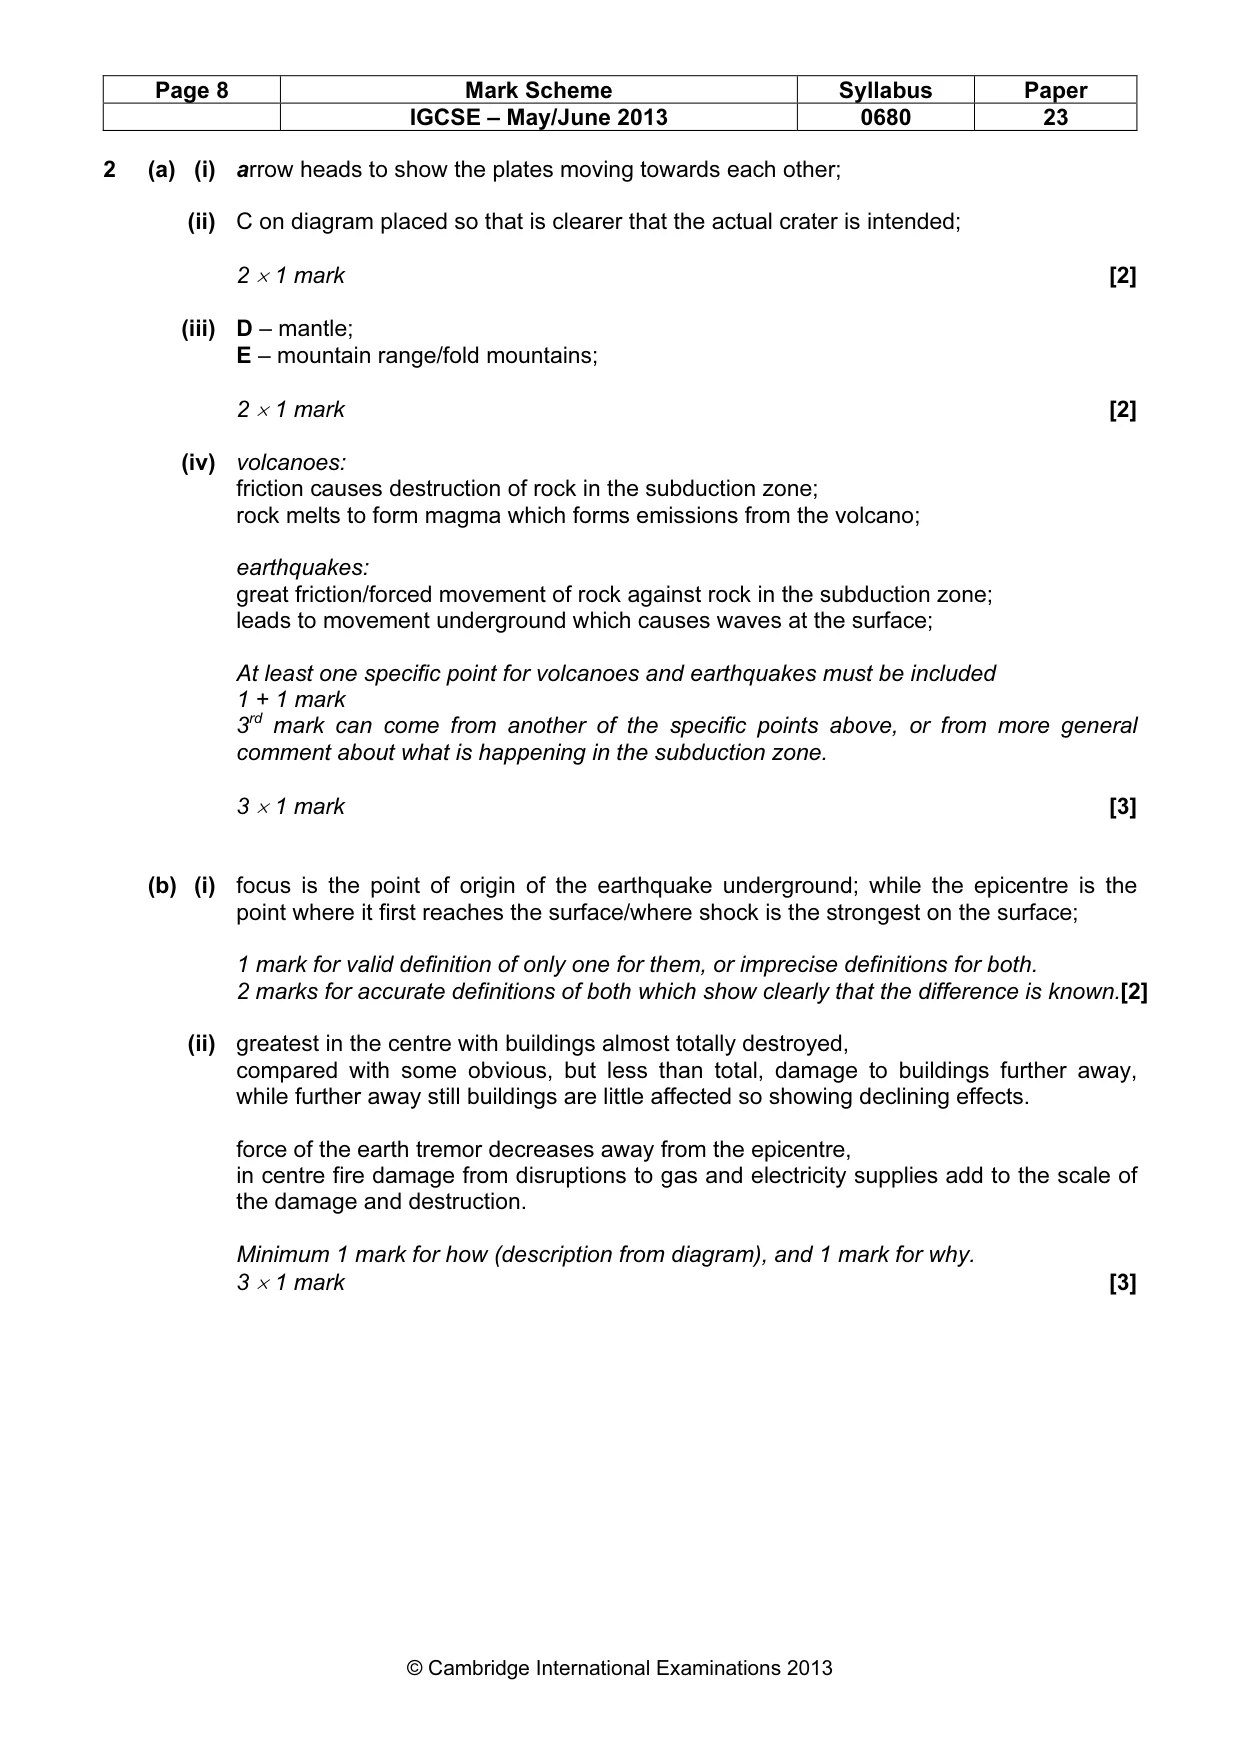
Page 8 Mark Scheme Syllabus Paper IGCSE – May/June 2013 0680 23 © Cambridge International Examinations 2013 2 (a) (i) arrow heads to show the plates moving towards each other; (ii) C on diagram placed so that is clearer that the actual crater is intended; 2 × 1 mark [2] (iii) D – mantle; E – mountain range/fold mountains; 2 × 1 mark [2] (iv) volcanoes: friction causes destruction of rock in the subduction zone; rock melts to form magma which forms emissions from the volcano; earthquakes: great friction/forced movement of rock against rock in the subduction zone; leads to movement underground which causes waves at the surface; At least one specific point for volcanoes and earthquakes must be included 1 + 1 mark 3rd mark can come from another of the specific points above, or from more general comment about what is happening in the subduction zone. 3 × 1 mark [3] (b) (i) focus is the point of origin of the earthquake underground; while the epicentre is the point where it first reaches the surface/where shock is the strongest on the surface; 1 mark for valid definition of only one for them, or imprecise definitions for both. 2 marks for accurate definitions of both which show clearly that the difference is known.[2] (ii) greatest in the centre with buildings almost totally destroyed, compared with some obvious, but less than total, damage to buildings further away, while further away still buildings are little affected so showing declining effects. force of the earth tremor decreases away from the epicentre, in centre fire damage from disruptions to gas and electricity supplies add to the scale of the damage and destruction. Minimum 1 mark for how (description from diagram), and 1 mark for why. 3 × 1 mark [3]
Mark scheme, page 9
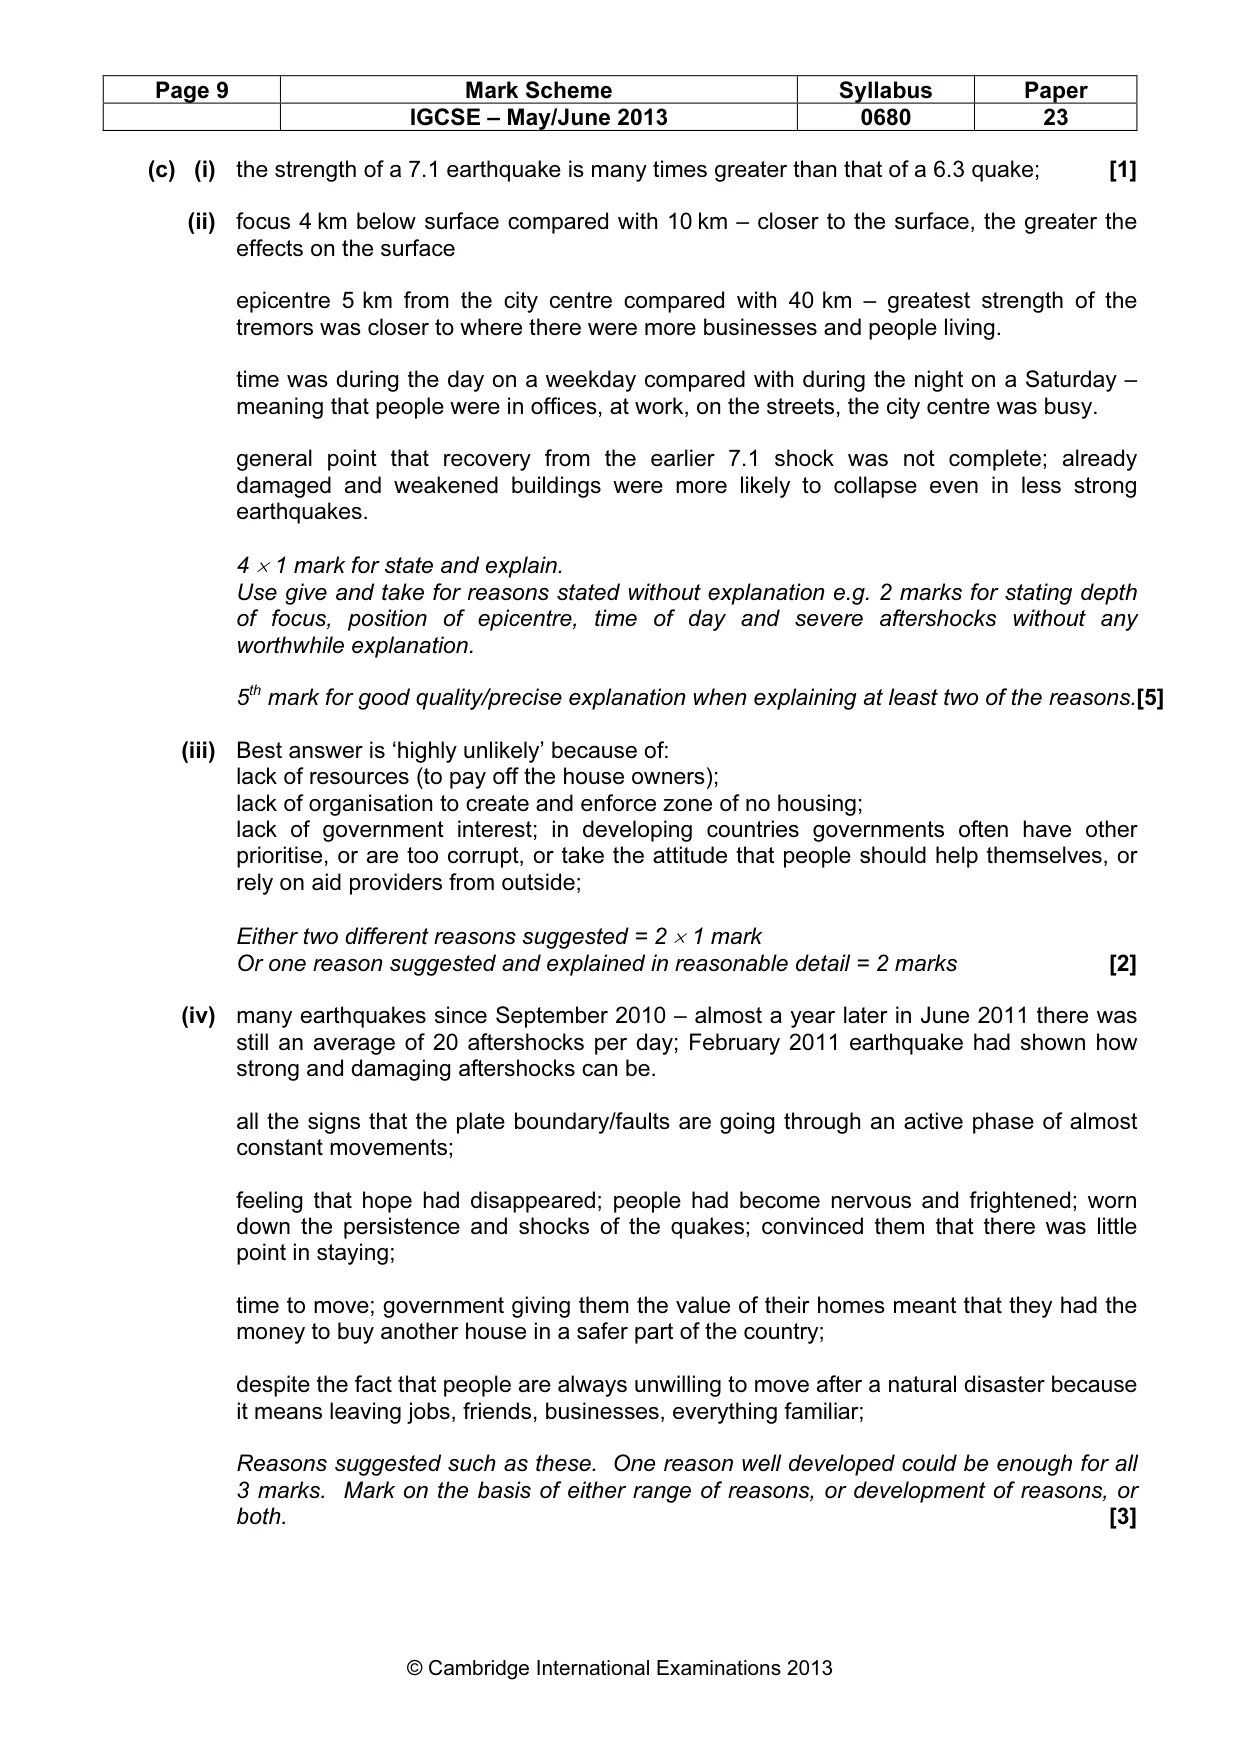
Page 9 Mark Scheme Syllabus Paper IGCSE – May/June 2013 0680 23 © Cambridge International Examinations 2013 (c) (i) the strength of a 7.1 earthquake is many times greater than that of a 6.3 quake; [1] (ii) focus 4 km below surface compared with 10 km – closer to the surface, the greater the effects on the surface epicentre 5 km from the city centre compared with 40 km – greatest strength of the tremors was closer to where there were more businesses and people living. time was during the day on a weekday compared with during the night on a Saturday – meaning that people were in offices, at work, on the streets, the city centre was busy. general point that recovery from the earlier 7.1 shock was not complete; already damaged and weakened buildings were more likely to collapse even in less strong earthquakes. 4 × 1 mark for state and explain. Use give and take for reasons stated without explanation e.g. 2 marks for stating depth of focus, position of epicentre, time of day and severe aftershocks without any worthwhile explanation. 5th mark for good quality/precise explanation when explaining at least two of the reasons.[5] (iii) Best answer is ‘highly unlikely’ because of: lack of resources (to pay off the house owners); lack of organisation to create and enforce zone of no housing; lack of government interest; in developing countries governments often have other prioritise, or are too corrupt, or take the attitude that people should help themselves, or rely on aid providers from outside; Either two different reasons suggested = 2 × 1 mark Or one reason suggested and explained in reasonable detail = 2 marks [2] (iv) many earthquakes since September 2010 – almost a year later in June 2011 there was still an average of 20 aftershocks per day; February 2011 earthquake had shown how strong and damaging aftershocks can be. all the signs that the plate boundary/faults are going through an active phase of almost constant movements; feeling that hope had disappeared; people had become nervous and frightened; worn down the persistence and shocks of the quakes; convinced them that there was little point in staying; time to move; government giving them the value of their homes meant that they had the money to buy another house in a safer part of the country; despite the fact that people are always unwilling to move after a natural disaster because it means leaving jobs, friends, businesses, everything familiar; Reasons suggested such as these. One reason well developed could be enough for all 3 marks. Mark on the basis of either range of reasons, or development of reasons, or both. [3]
Mark scheme, page 10
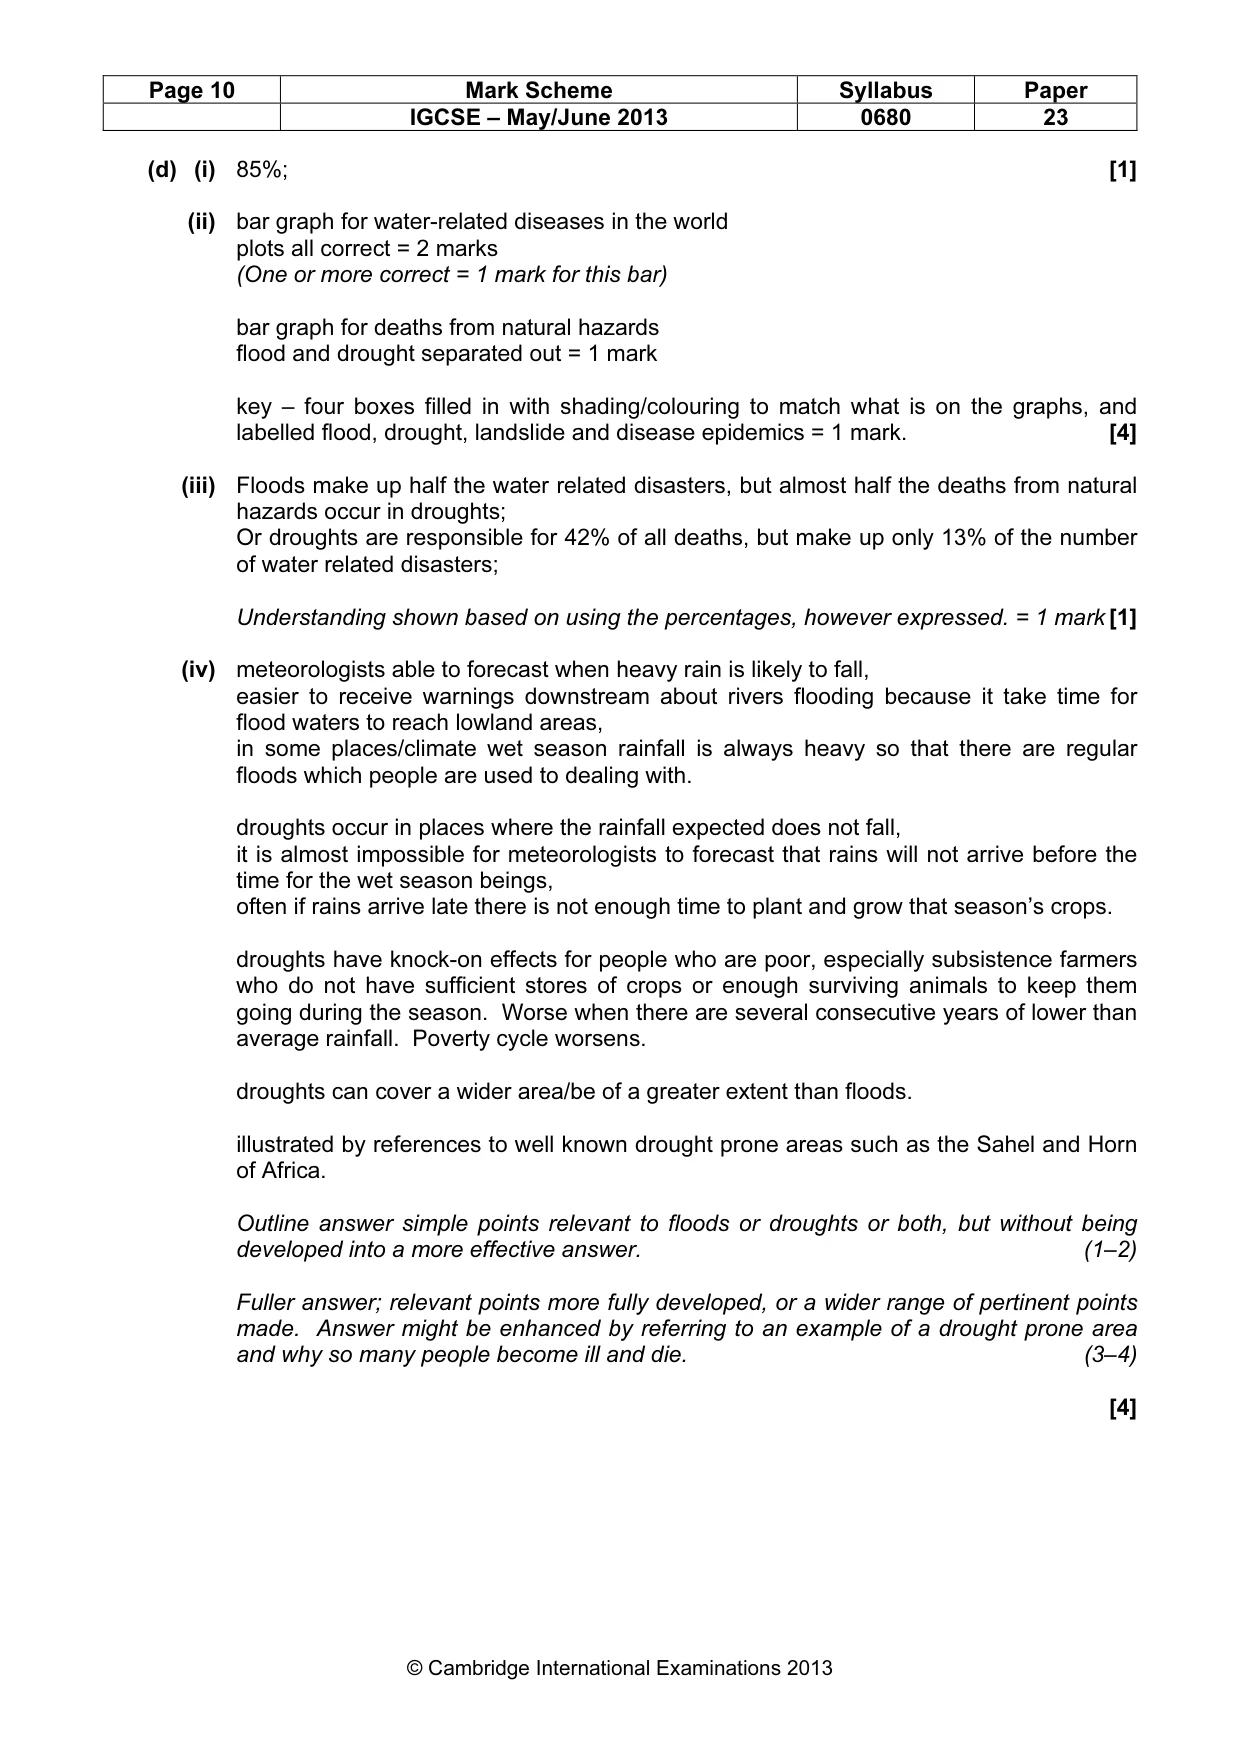
Page 10 Mark Scheme Syllabus Paper IGCSE – May/June 2013 0680 23 © Cambridge International Examinations 2013 (d) (i) 85%; [1] (ii) bar graph for water-related diseases in the world plots all correct = 2 marks (One or more correct = 1 mark for this bar) bar graph for deaths from natural hazards flood and drought separated out = 1 mark key – four boxes filled in with shading/colouring to match what is on the graphs, and labelled flood, drought, landslide and disease epidemics = 1 mark. [4] (iii) Floods make up half the water related disasters, but almost half the deaths from natural hazards occur in droughts; Or droughts are responsible for 42% of all deaths, but make up only 13% of the number of water related disasters; Understanding shown based on using the percentages, however expressed. = 1 mark [1] (iv) meteorologists able to forecast when heavy rain is likely to fall, easier to receive warnings downstream about rivers flooding because it take time for flood waters to reach lowland areas, in some places/climate wet season rainfall is always heavy so that there are regular floods which people are used to dealing with. droughts occur in places where the rainfall expected does not fall, it is almost impossible for meteorologists to forecast that rains will not arrive before the time for the wet season beings, often if rains arrive late there is not enough time to plant and grow that season’s crops. droughts have knock-on effects for people who are poor, especially subsistence farmers who do not have sufficient stores of crops or enough surviving animals to keep them going during the season. Worse when there are several consecutive years of lower than average rainfall. Poverty cycle worsens. droughts can cover a wider area/be of a greater extent than floods. illustrated by references to well known drought prone areas such as the Sahel and Horn of Africa. Outline answer simple points relevant to floods or droughts or both, but without being developed into a more effective answer. (1–2) Fuller answer; relevant points more fully developed, or a wider range of pertinent points made. Answer might be enhanced by referring to an example of a drought prone area and why so many people become ill and die. (3–4) [4]
Mark scheme, page 11
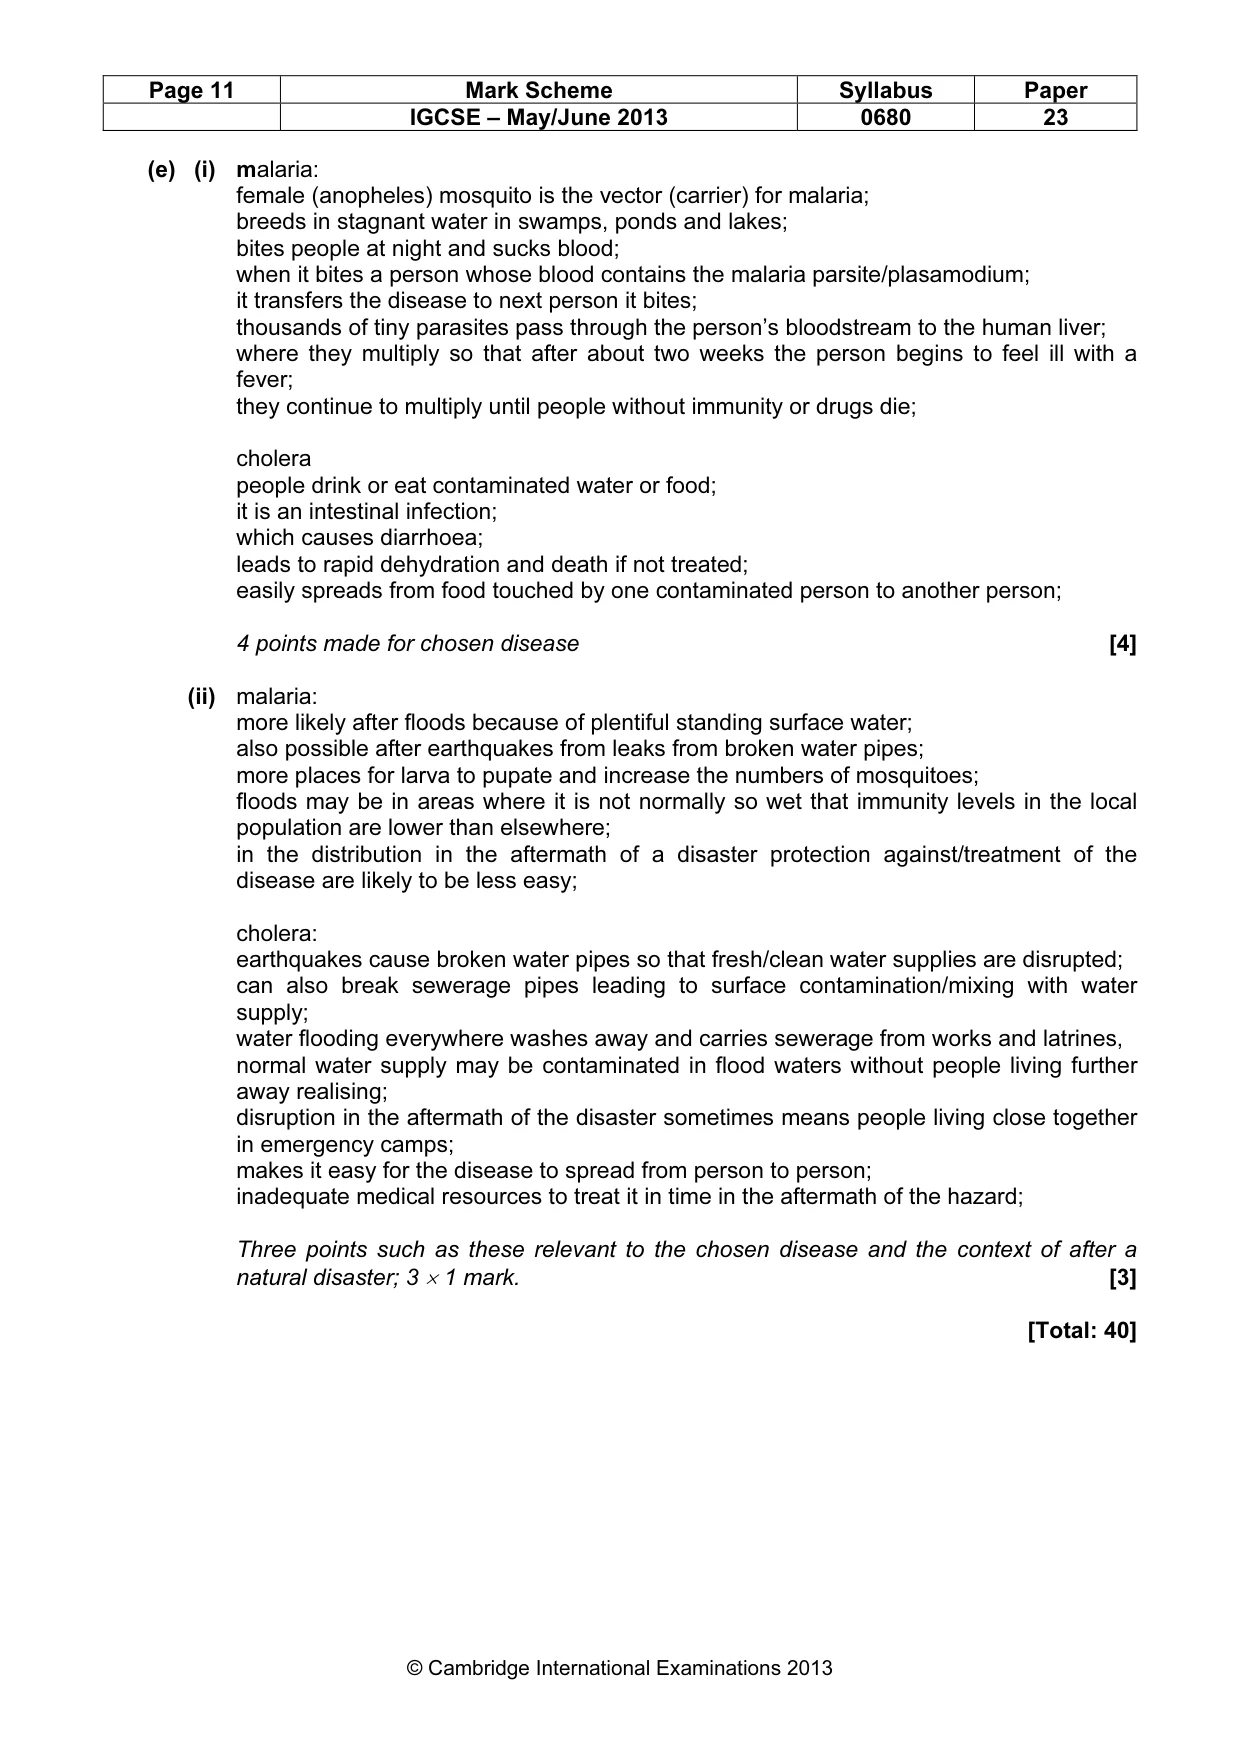
Page 11 Mark Scheme Syllabus Paper IGCSE – May/June 2013 0680 23 © Cambridge International Examinations 2013 (e) (i) malaria: female (anopheles) mosquito is the vector (carrier) for malaria; breeds in stagnant water in swamps, ponds and lakes; bites people at night and sucks blood; when it bites a person whose blood contains the malaria parsite/plasamodium; it transfers the disease to next person it bites; thousands of tiny parasites pass through the person’s bloodstream to the human liver; where they multiply so that after about two weeks the person begins to feel ill with a fever; they continue to multiply until people without immunity or drugs die; cholera people drink or eat contaminated water or food; it is an intestinal infection; which causes diarrhoea; leads to rapid dehydration and death if not treated; easily spreads from food touched by one contaminated person to another person; 4 points made for chosen disease [4] (ii) malaria: more likely after floods because of plentiful standing surface water; also possible after earthquakes from leaks from broken water pipes; more places for larva to pupate and increase the numbers of mosquitoes; floods may be in areas where it is not normally so wet that immunity levels in the local population are lower than elsewhere; in the distribution in the aftermath of a disaster protection against/treatment of the disease are likely to be less easy; cholera: earthquakes cause broken water pipes so that fresh/clean water supplies are disrupted; can also break sewerage pipes leading to surface contamination/mixing with water supply; water flooding everywhere washes away and carries sewerage from works and latrines, normal water supply may be contaminated in flood waters without people living further away realising; disruption in the aftermath of the disaster sometimes means people living close together in emergency camps; makes it easy for the disease to spread from person to person; inadequate medical resources to treat it in time in the aftermath of the hazard; Three points such as these relevant to the chosen disease and the context of after a natural disaster; 3 × 1 mark. [3] [Total: 40]
What you needed in this session
Cambridge’s own grade thresholds for 2013 May/June, Paper 2 · Variant 3. A higher threshold means an easier paper — the bar moves with how the cohort did.