Cambridge IGCSE Environmental Management 0680 — 2012 May/June Paper 4 · Variant 3
0680/43/M/J/12 · 60 marks · ≈68 min
The question paper and its mark scheme, free to read here and free to download. This is Cambridge’s own paper, exactly as it was sat.
Question paper16 pages
Mark scheme6 pages
Answers below. Sit the paper first if you are practising.
Paper as text
Question paper, page 1
This document consists of 15 printed pages and 1 blank page. DC (NF/SW) 57940 © UCLES 2012 [Turn over UNIVERSITY OF CAMBRIDGE INTERNATIONAL EXAMINATIONS International General Certificate of Secondary Education * 5 6 2 2 9 9 2 6 3 9 * ENVIRONMENTAL MANAGEMENT 0680/43 Alternative to Coursework May/June 2012 1 hour 30 minutes Candidates answer on the Question Paper. Additional Materials: Ruler READ THESE INSTRUCTIONS FIRST Write your Centre number, candidate number and name on all the work you hand in. Write in dark blue or black pen. You may use a soft pencil for any diagrams, graphs or rough working. Do not use staples, paper clips, highlighters, glue or correction fluid. DO NOT WRITE IN ANY BARCODES. Answer all questions. Study the appropriate Source materials before you start to write your answers. Credit will be given for appropriate selection and use of data in your answers and for relevant interpretation of these data. Suggestions for data sources are given in some questions. You may use the source data to draw diagrams and graphs or to do calculations to illustrate your answers. At the end of the examination, fasten all your work securely together. The number of marks is given in brackets [ ] at the end of each question or part question. For Examiner’s Use 1 2 3 Total www.XtremePapers.com
Question paper, page 2
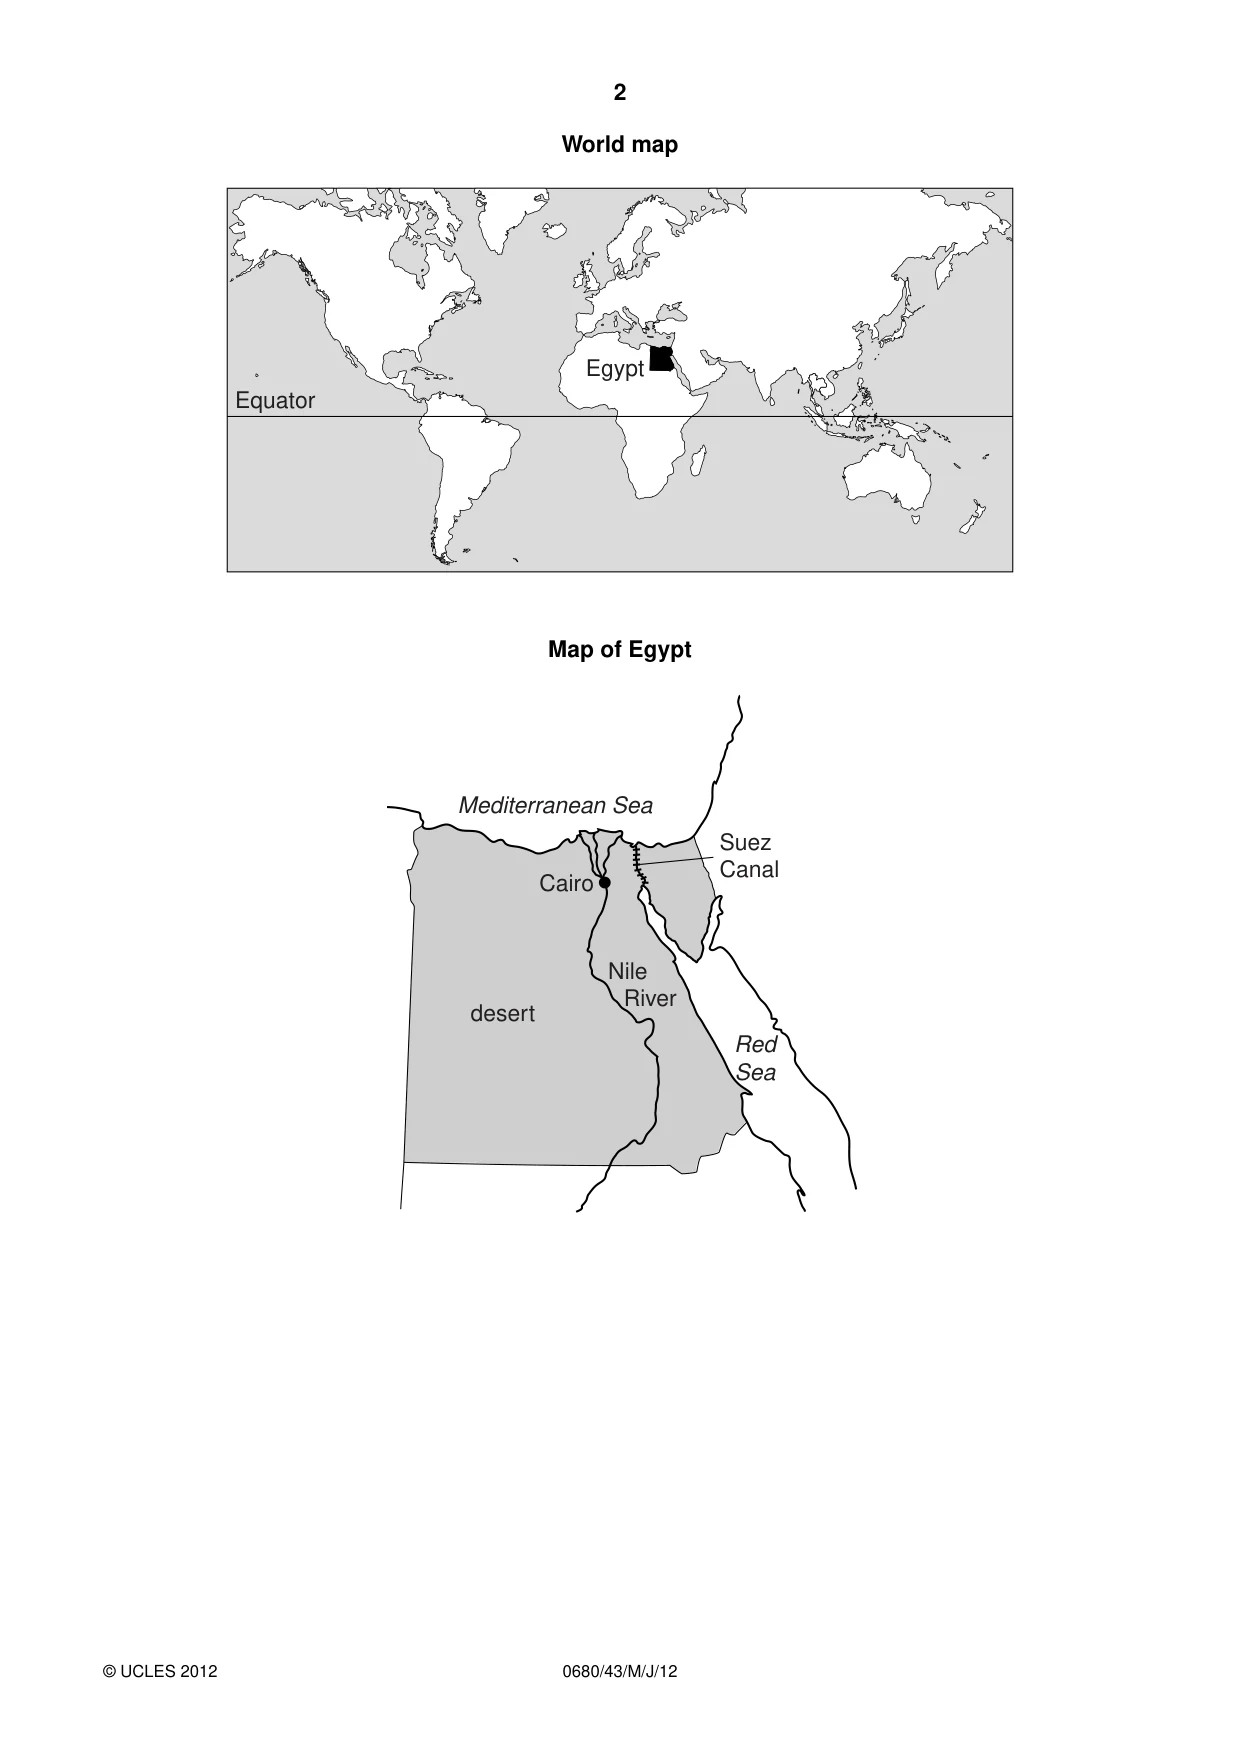
2 0680/43/M/J/12 © UCLES 2012 World map Equator Egypt Map of Egypt Cairo Suez Canal desert Nile River Red Sea Mediterranean Sea
Question paper, page 3
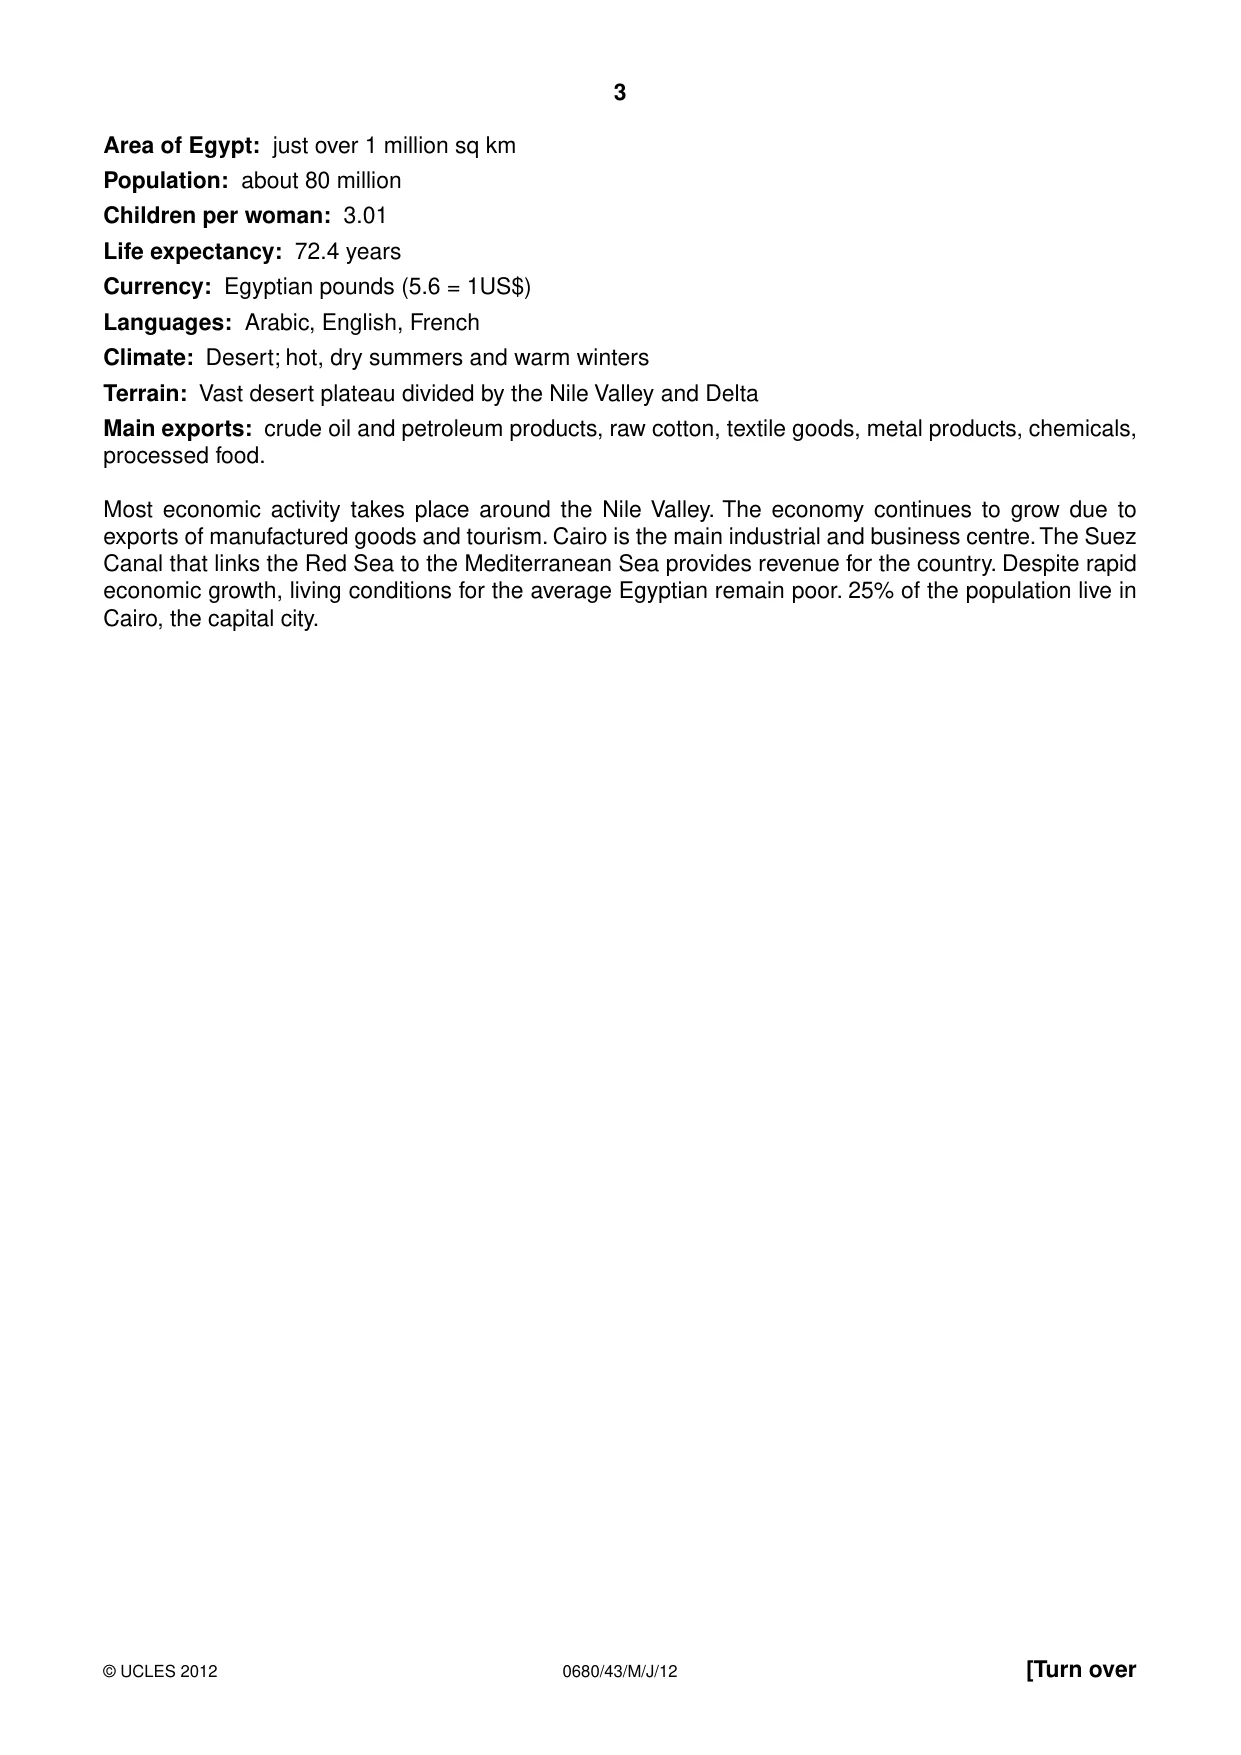
3 0680/43/M/J/12 © UCLES 2012 [Turn over Area of Egypt: just over 1 million sq km Population: about 80 million Children per woman: 3.01 Life expectancy: 72.4 years Currency: Egyptian pounds (5.6 = 1US$) Languages: Arabic, English, French Climate: Desert; hot, dry summers and warm winters Terrain: Vast desert plateau divided by the Nile Valley and Delta Main exports: crude oil and petroleum products, raw cotton, textile goods, metal products, chemicals, processed food. Most economic activity takes place around the Nile Valley. The economy continues to grow due to exports of manufactured goods and tourism. Cairo is the main industrial and business centre. The Suez Canal that links the Red Sea to the Mediterranean Sea provides revenue for the country. Despite rapid economic growth, living conditions for the average Egyptian remain poor. 25% of the population live in Cairo, the capital city.
Question paper, page 4
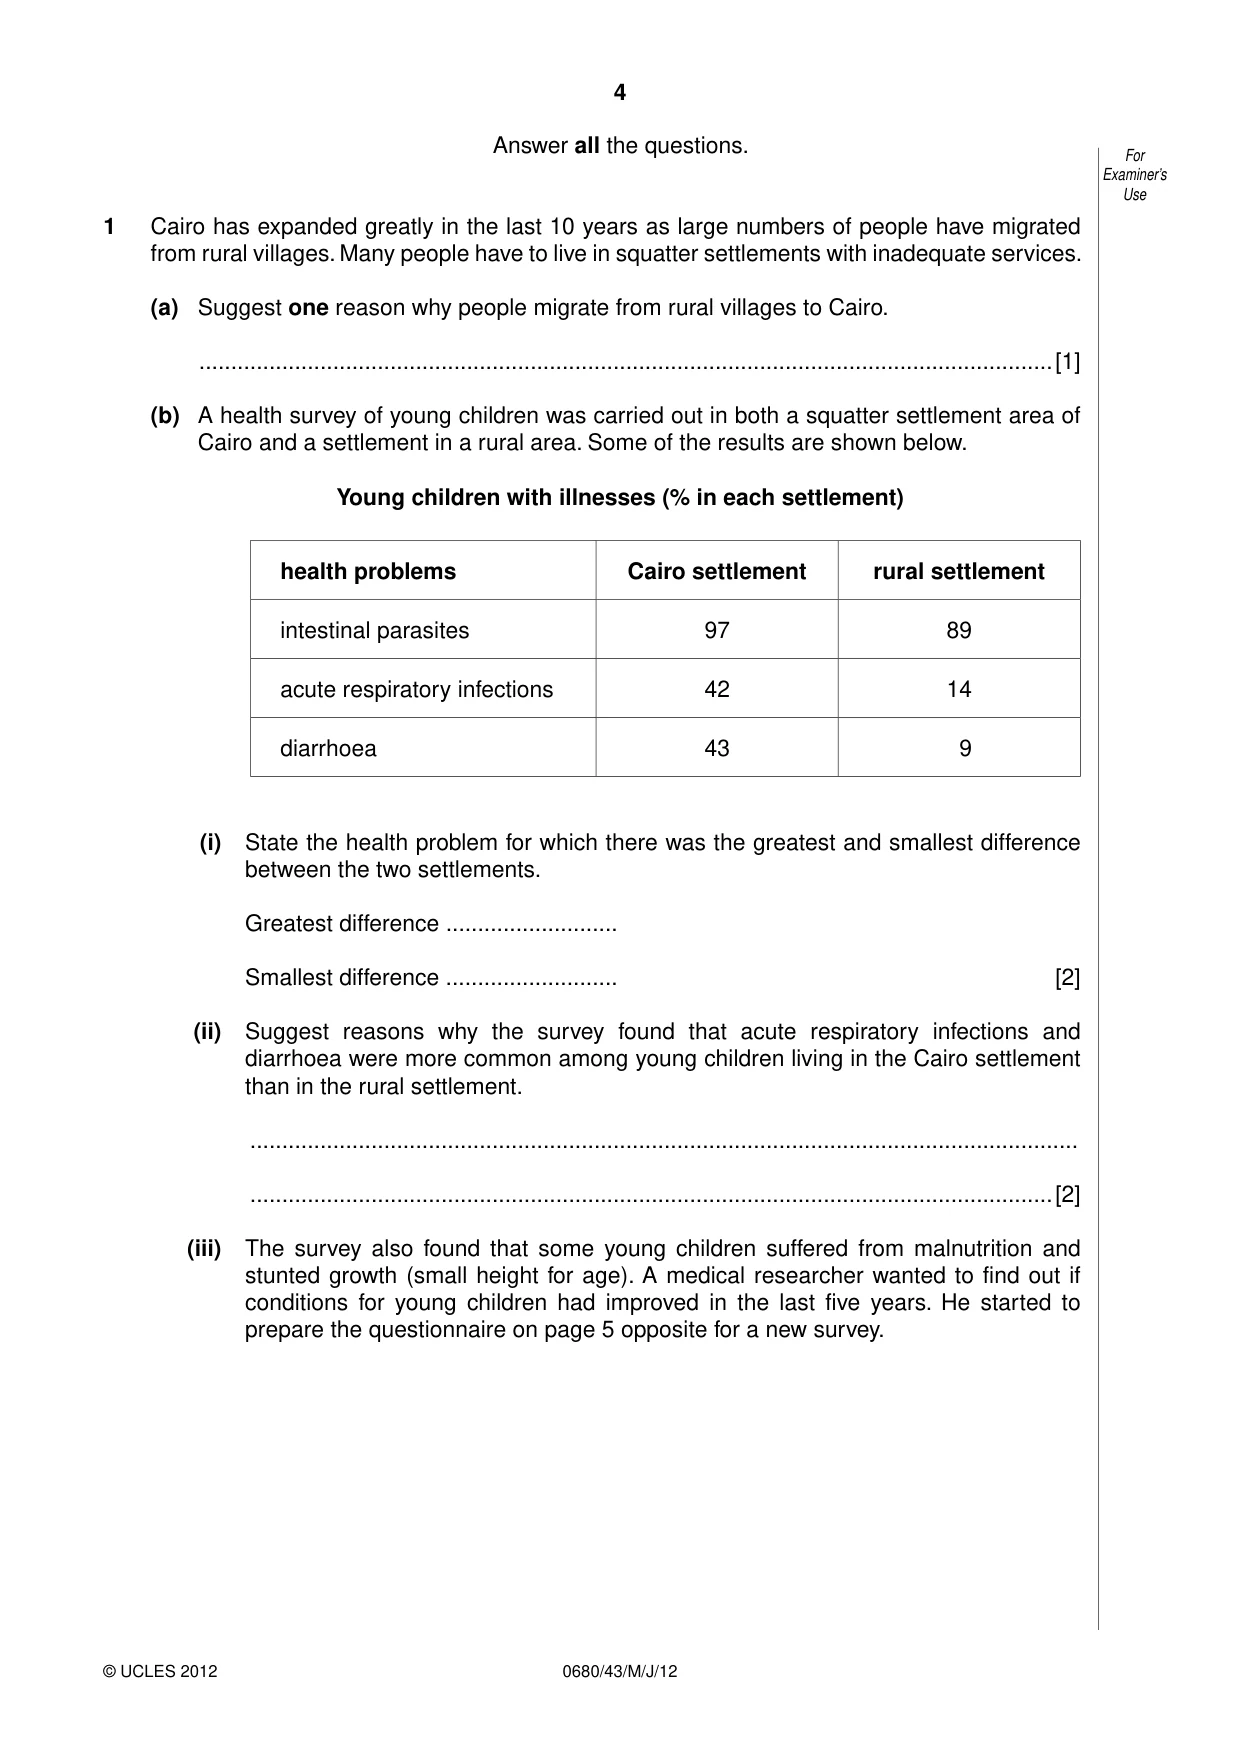
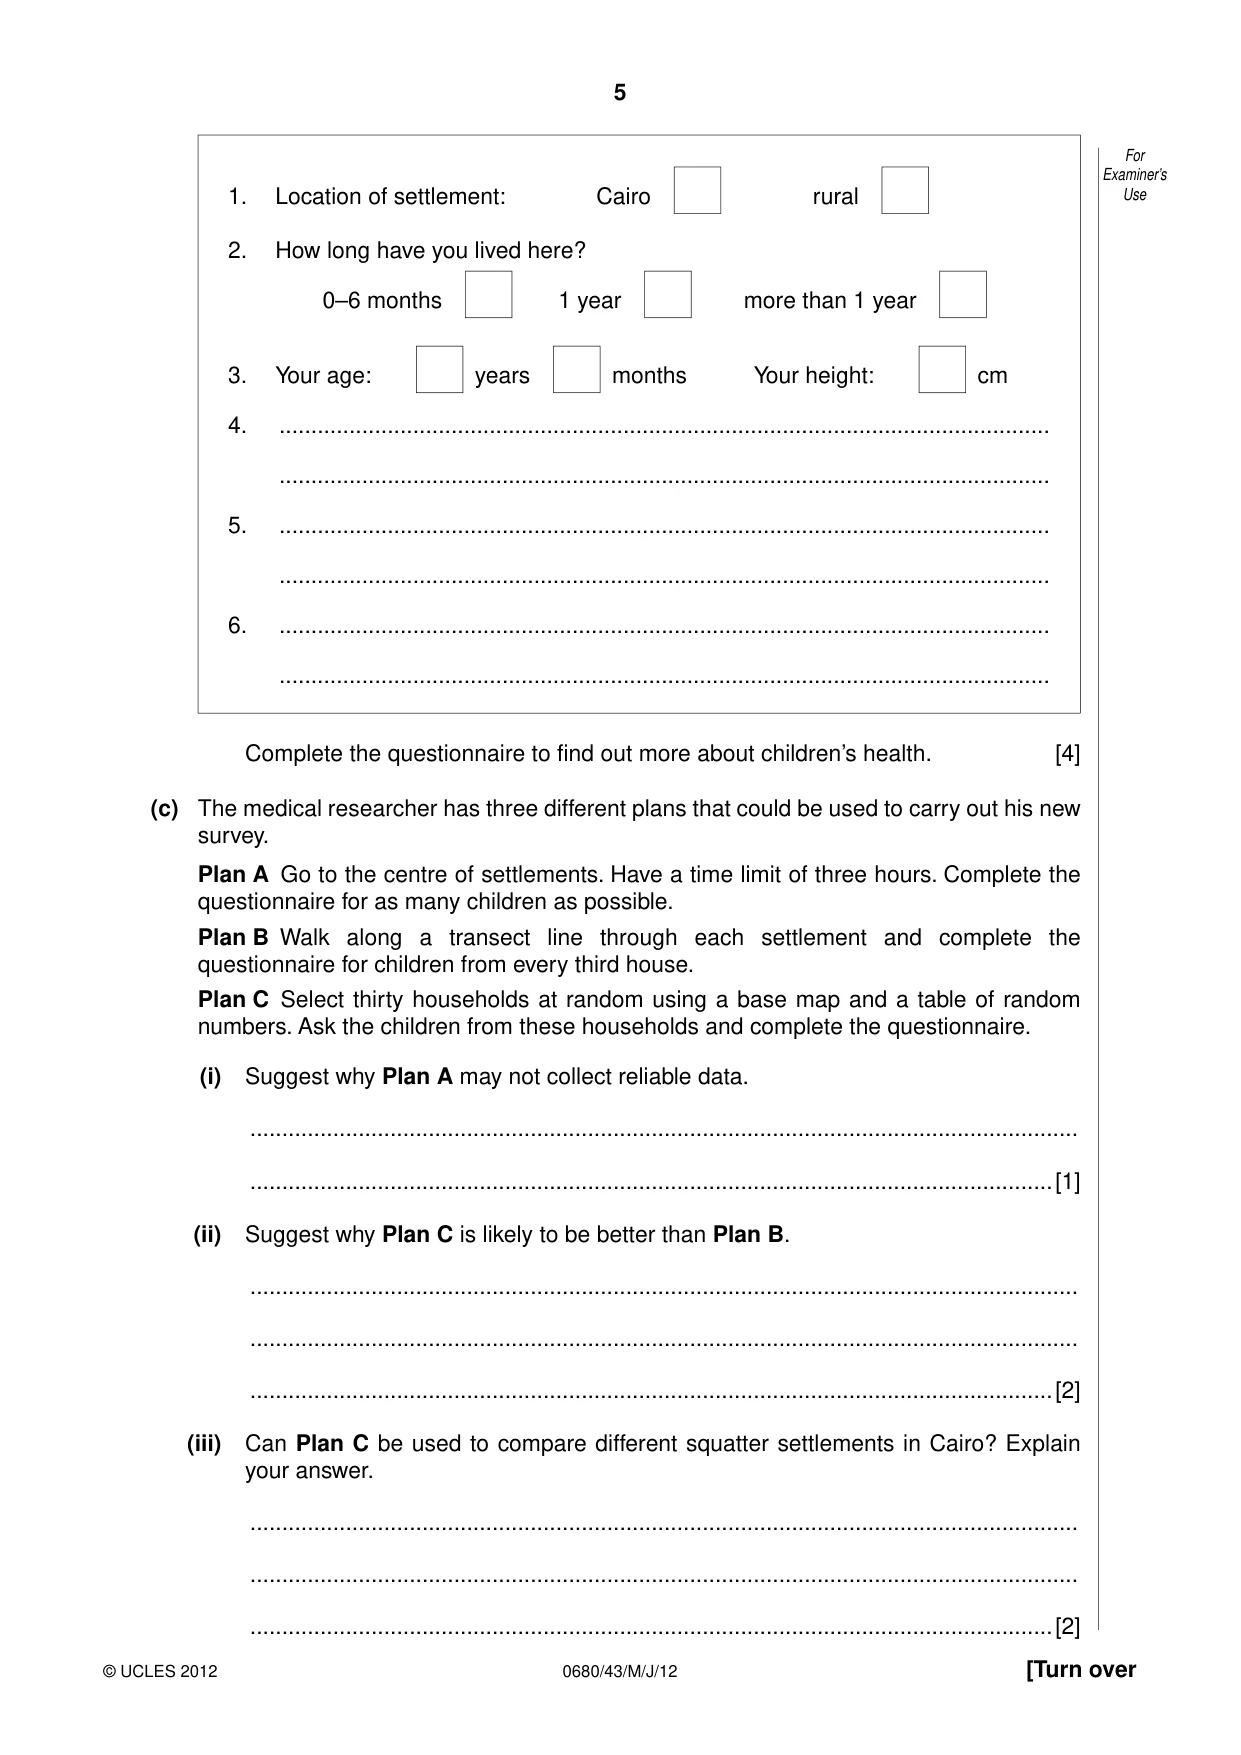
4 0680/43/M/J/12 © UCLES 2012 For Examiner’s Use Answer all the questions. 1 Cairo has expanded greatly in the last 10 years as large numbers of people have migrated from rural villages. Many people have to live in squatter settlements with inadequate services. (a) Suggest one reason why people migrate from rural villages to Cairo. …[1] (b) A health survey of young children was carried out in both a squatter settlement area of Cairo and a settlement in a rural area. Some of the results are shown below. Young children with illnesses (% in each settlement) health problems Cairo settlement rural settlement intestinal parasites 97 89 acute respiratory infections 42 14 diarrhoea 43 9 (i) State the health problem for which there was the greatest and smallest difference between the two settlements. Greatest difference … Smallest difference … [2] (ii) Suggest reasons why the survey found that acute respiratory infections and diarrhoea were more common among young children living in the Cairo settlement than in the rural settlement. … …[2] (iii) The survey also found that some young children suffered from malnutrition and stunted growth (small height for age). A medical researcher wanted to find out if conditions for young children had improved in the last five years. He started to prepare the questionnaire on page 5 opposite for a new survey.
Question paper, page 5
5 0680/43/M/J/12 © UCLES 2012 [Turn over For Examiner’s Use 1. Location of settlement: Cairo rural 2. How long have you lived here? 0–6 months 1 year more than 1 year 3. Your age: years months Your height: cm 4. … … 5. … … 6. … … Complete the questionnaire to find out more about children’s health. [4] (c) The medical researcher has three different plans that could be used to carry out his new survey. Plan A Go to the centre of settlements. Have a time limit of three hours. Complete the questionnaire for as many children as possible. Plan B Walk along a transect line through each settlement and complete the questionnaire for children from every third house. Plan C Select thirty households at random using a base map and a table of random numbers. Ask the children from these households and complete the questionnaire. (i) Suggest why Plan A may not collect reliable data. … …[1] (ii) Suggest why Plan C is likely to be better than Plan B. … … …[2] (iii) Can Plan C be used to compare different squatter settlements in Cairo? Explain your answer. … … …[2]
Question paper, page 6
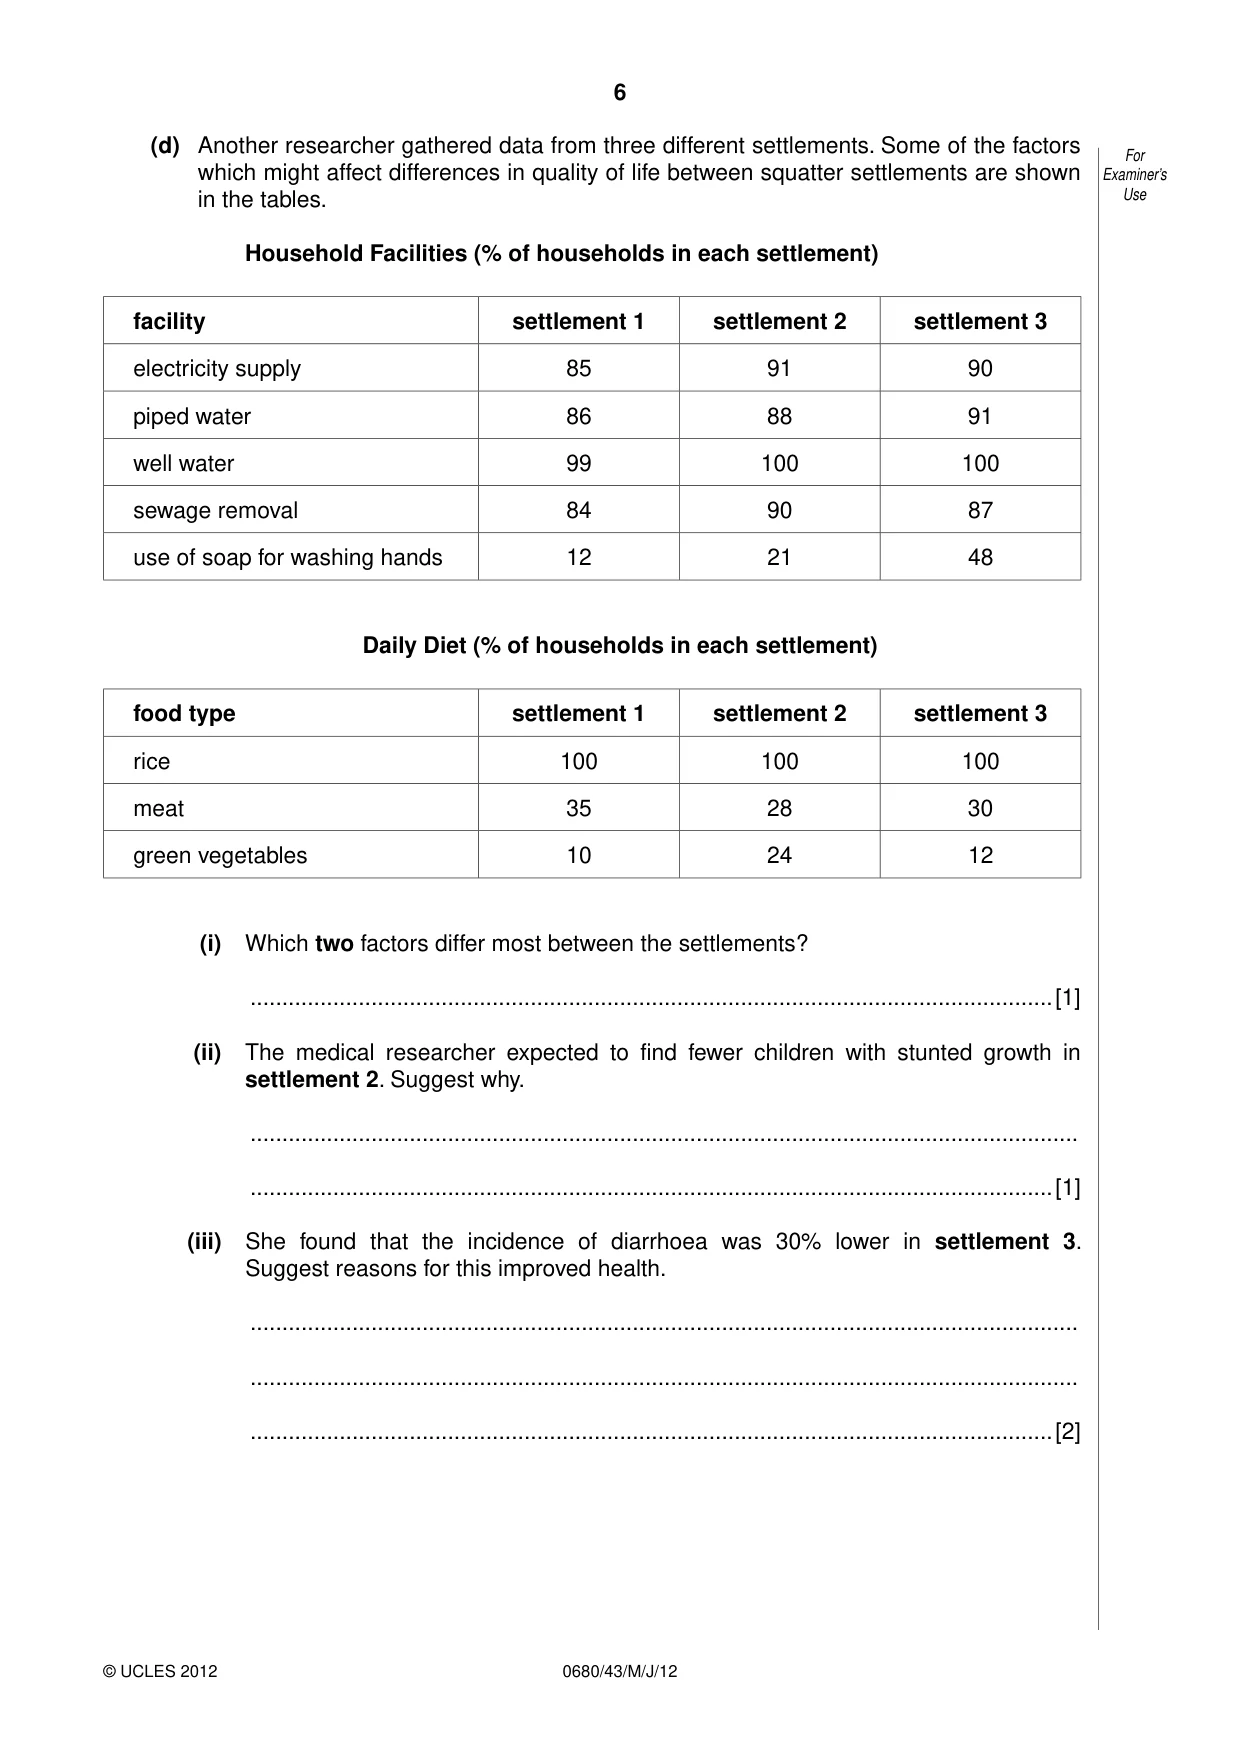
6 0680/43/M/J/12 © UCLES 2012 For Examiner’s Use (d) Another researcher gathered data from three different settlements. Some of the factors which might affect differences in quality of life between squatter settlements are shown in the tables. Household Facilities (% of households in each settlement) facility settlement 1 settlement 2 settlement 3 electricity supply 85 91 90 piped water 86 88 91 well water 99 100 100 sewage removal 84 90 87 use of soap for washing hands 12 21 48 Daily Diet (% of households in each settlement) food type settlement 1 settlement 2 settlement 3 rice 100 100 100 meat 35 28 30 green vegetables 10 24 12 (i) Which two factors differ most between the settlements? …[1] (ii) The medical researcher expected to find fewer children with stunted growth in settlement 2. Suggest why. … …[1] (iii) She found that the incidence of diarrhoea was 30% lower in settlement 3. Suggest reasons for this improved health. … … …[2]
Question paper, page 7
7 0680/43/M/J/12 © UCLES 2012 [Turn over For Examiner’s Use (e) Describe two ways the city authorities could improve the health of settlement dwellers. 1. … Reason … 2. … Reason …[3]
Question paper, page 8
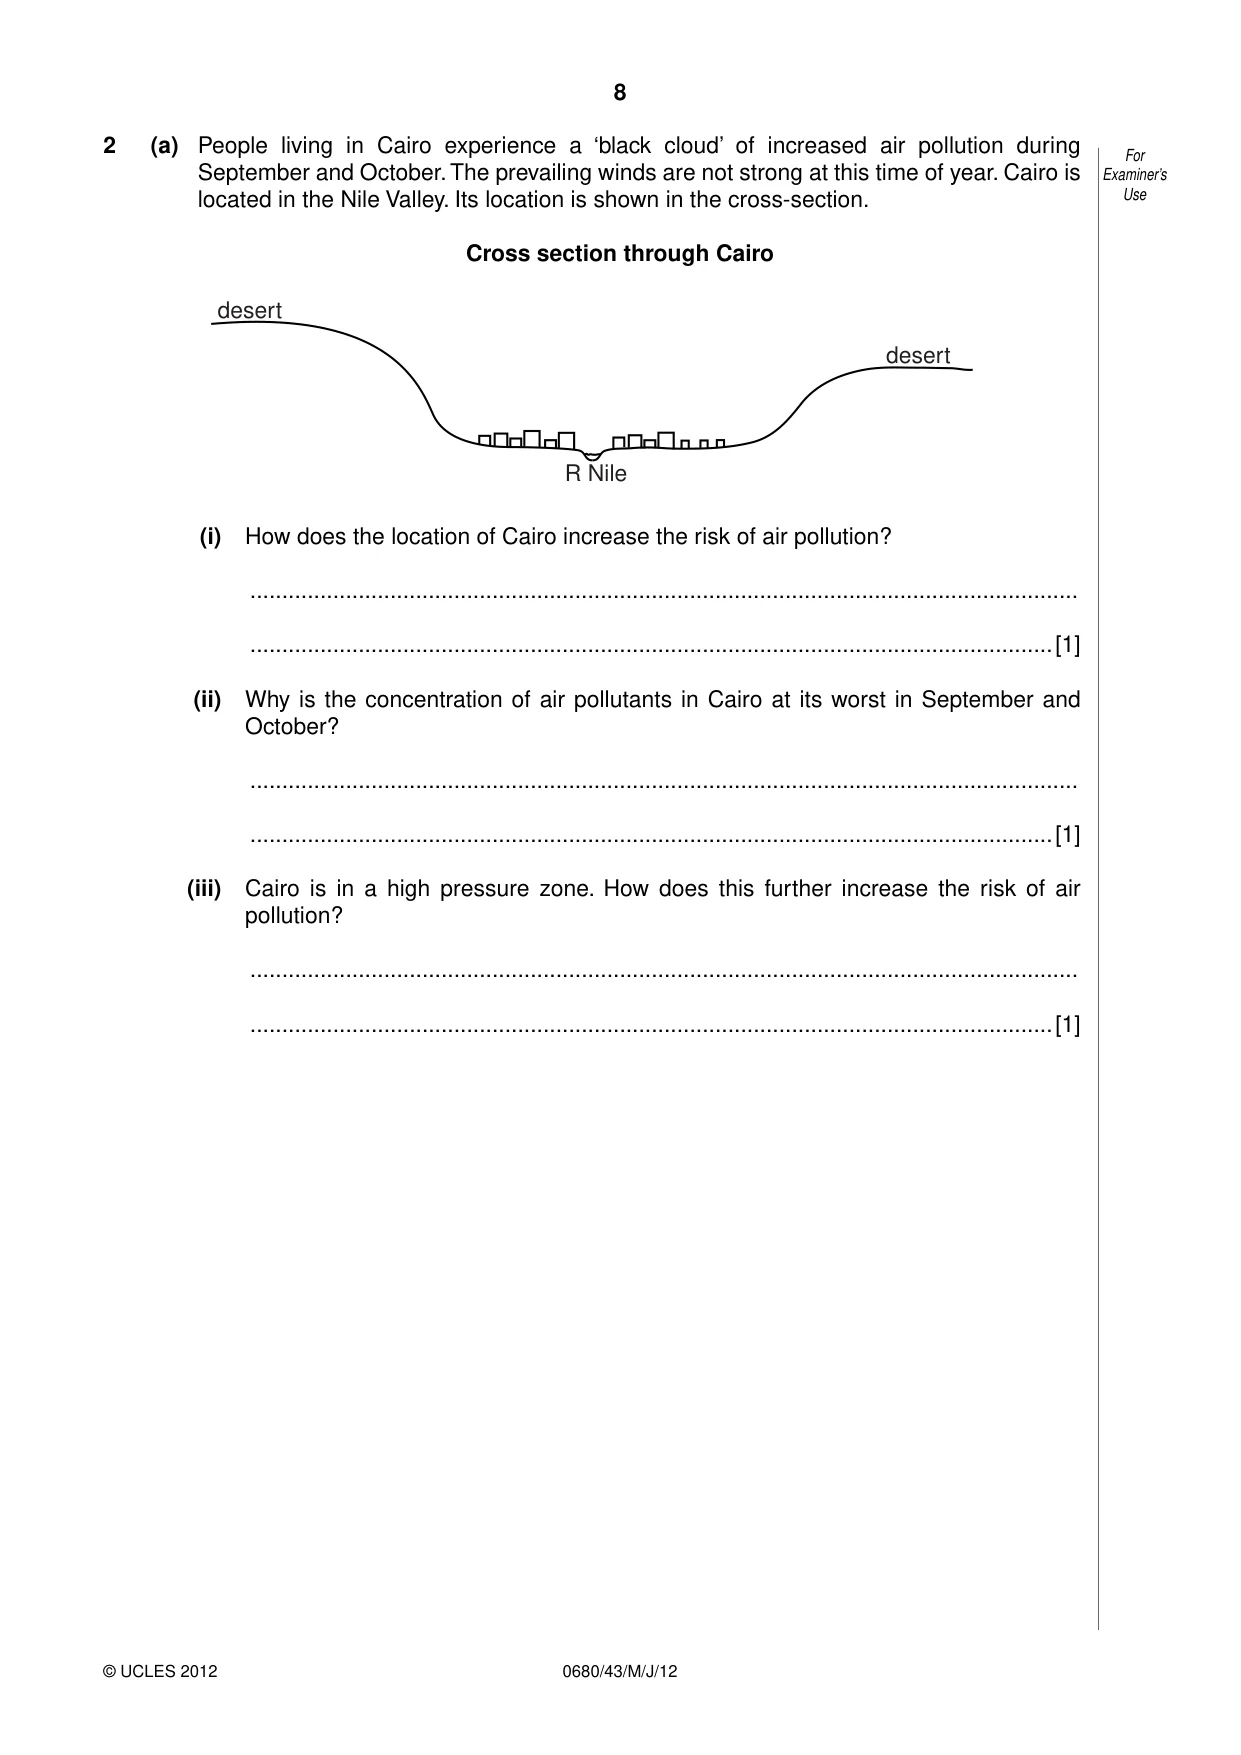
8 0680/43/M/J/12 © UCLES 2012 For Examiner’s Use 2 (a) People living in Cairo experience a ‘black cloud’ of increased air pollution during September and October. The prevailing winds are not strong at this time of year. Cairo is located in the Nile Valley. Its location is shown in the cross-section. Cross section through Cairo R Nile desert desert (i) How does the location of Cairo increase the risk of air pollution? … …[1] (ii) Why is the concentration of air pollutants in Cairo at its worst in September and October? … …[1] (iii) Cairo is in a high pressure zone. How does this further increase the risk of air pollution? … …[1]
Question paper, page 9
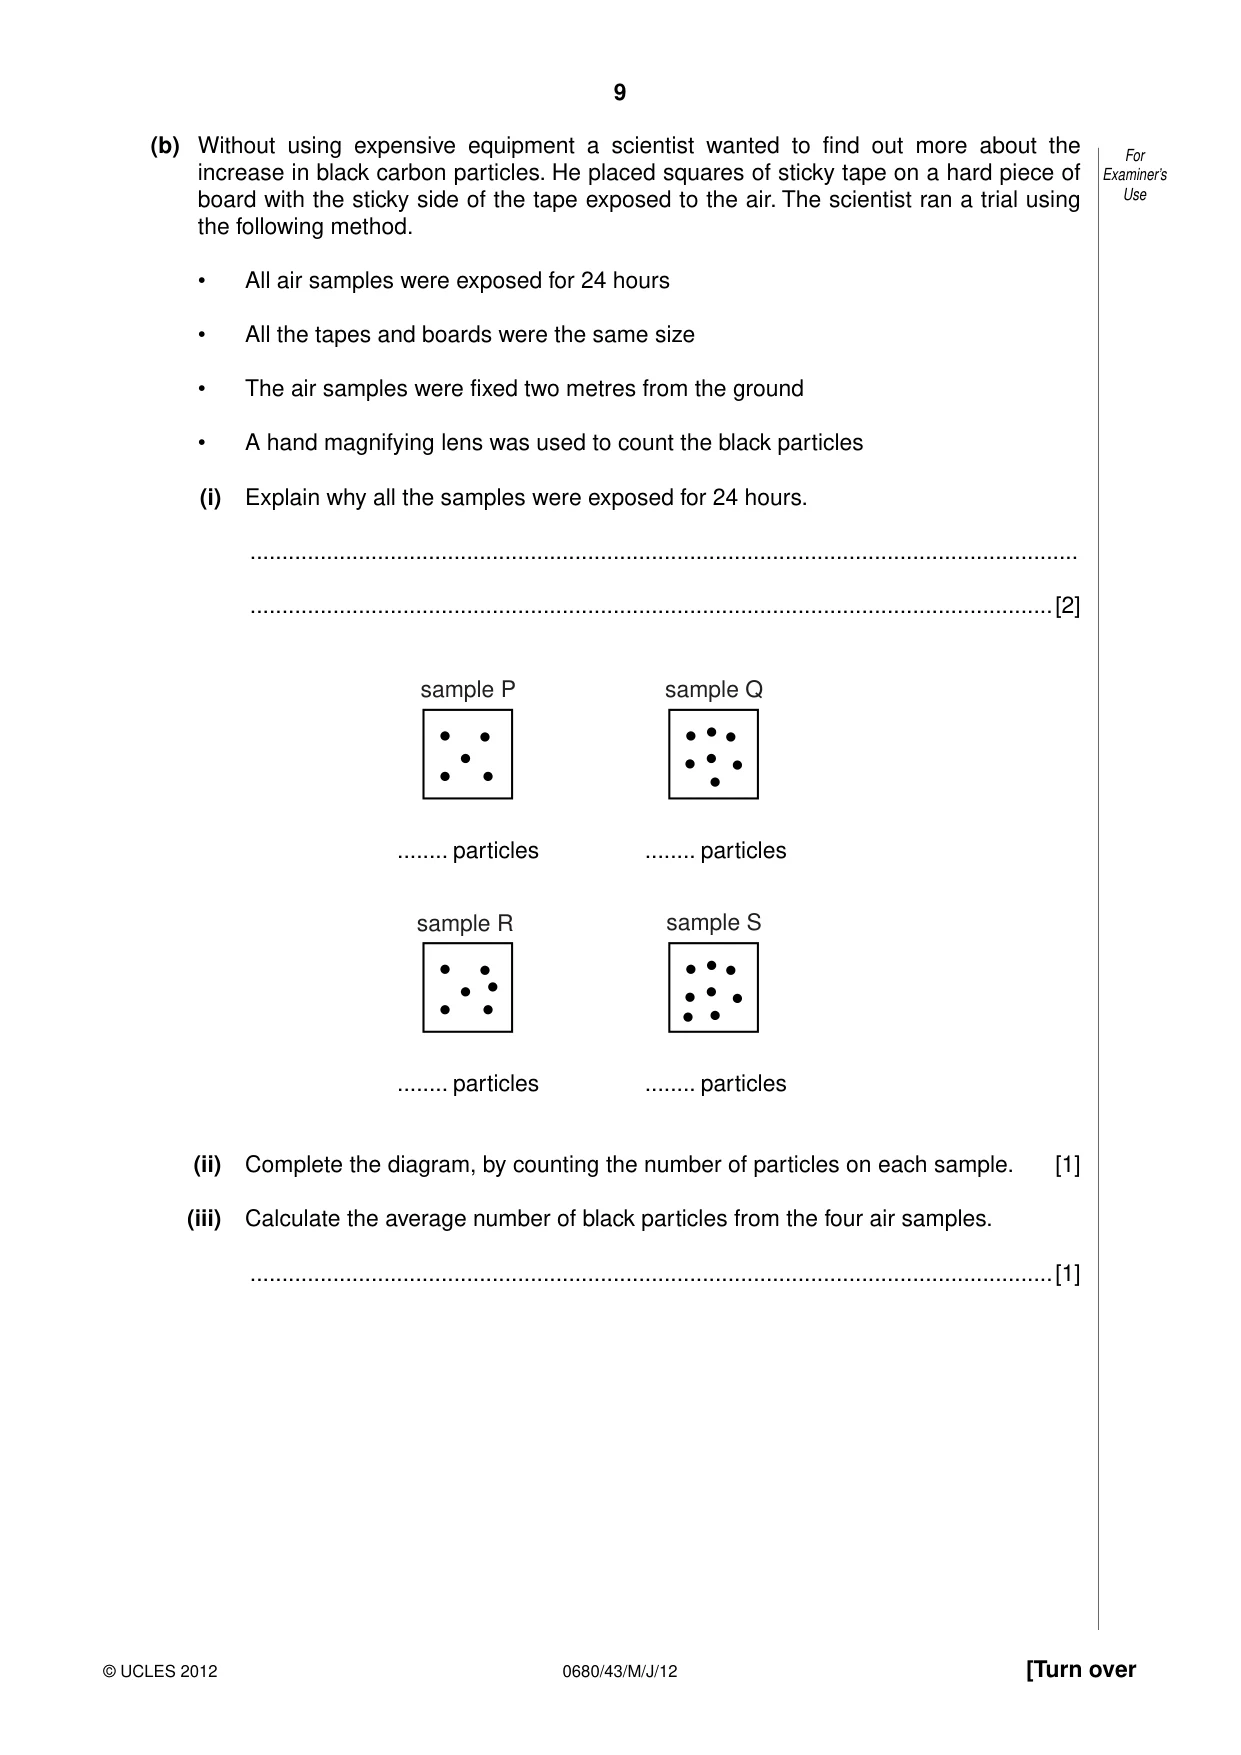
9 0680/43/M/J/12 © UCLES 2012 [Turn over For Examiner’s Use (b) Without using expensive equipment a scientist wanted to find out more about the increase in black carbon particles. He placed squares of sticky tape on a hard piece of board with the sticky side of the tape exposed to the air. The scientist ran a trial using the following method. • All air samples were exposed for 24 hours • All the tapes and boards were the same size • The air samples were fixed two metres from the ground • A hand magnifying lens was used to count the black particles (i) Explain why all the samples were exposed for 24 hours. … …[2] sample P sample Q sample R sample S … particles … particles … particles … particles (ii) Complete the diagram, by counting the number of particles on each sample. [1] (iii) Calculate the average number of black particles from the four air samples. …[1]
Question paper, page 10
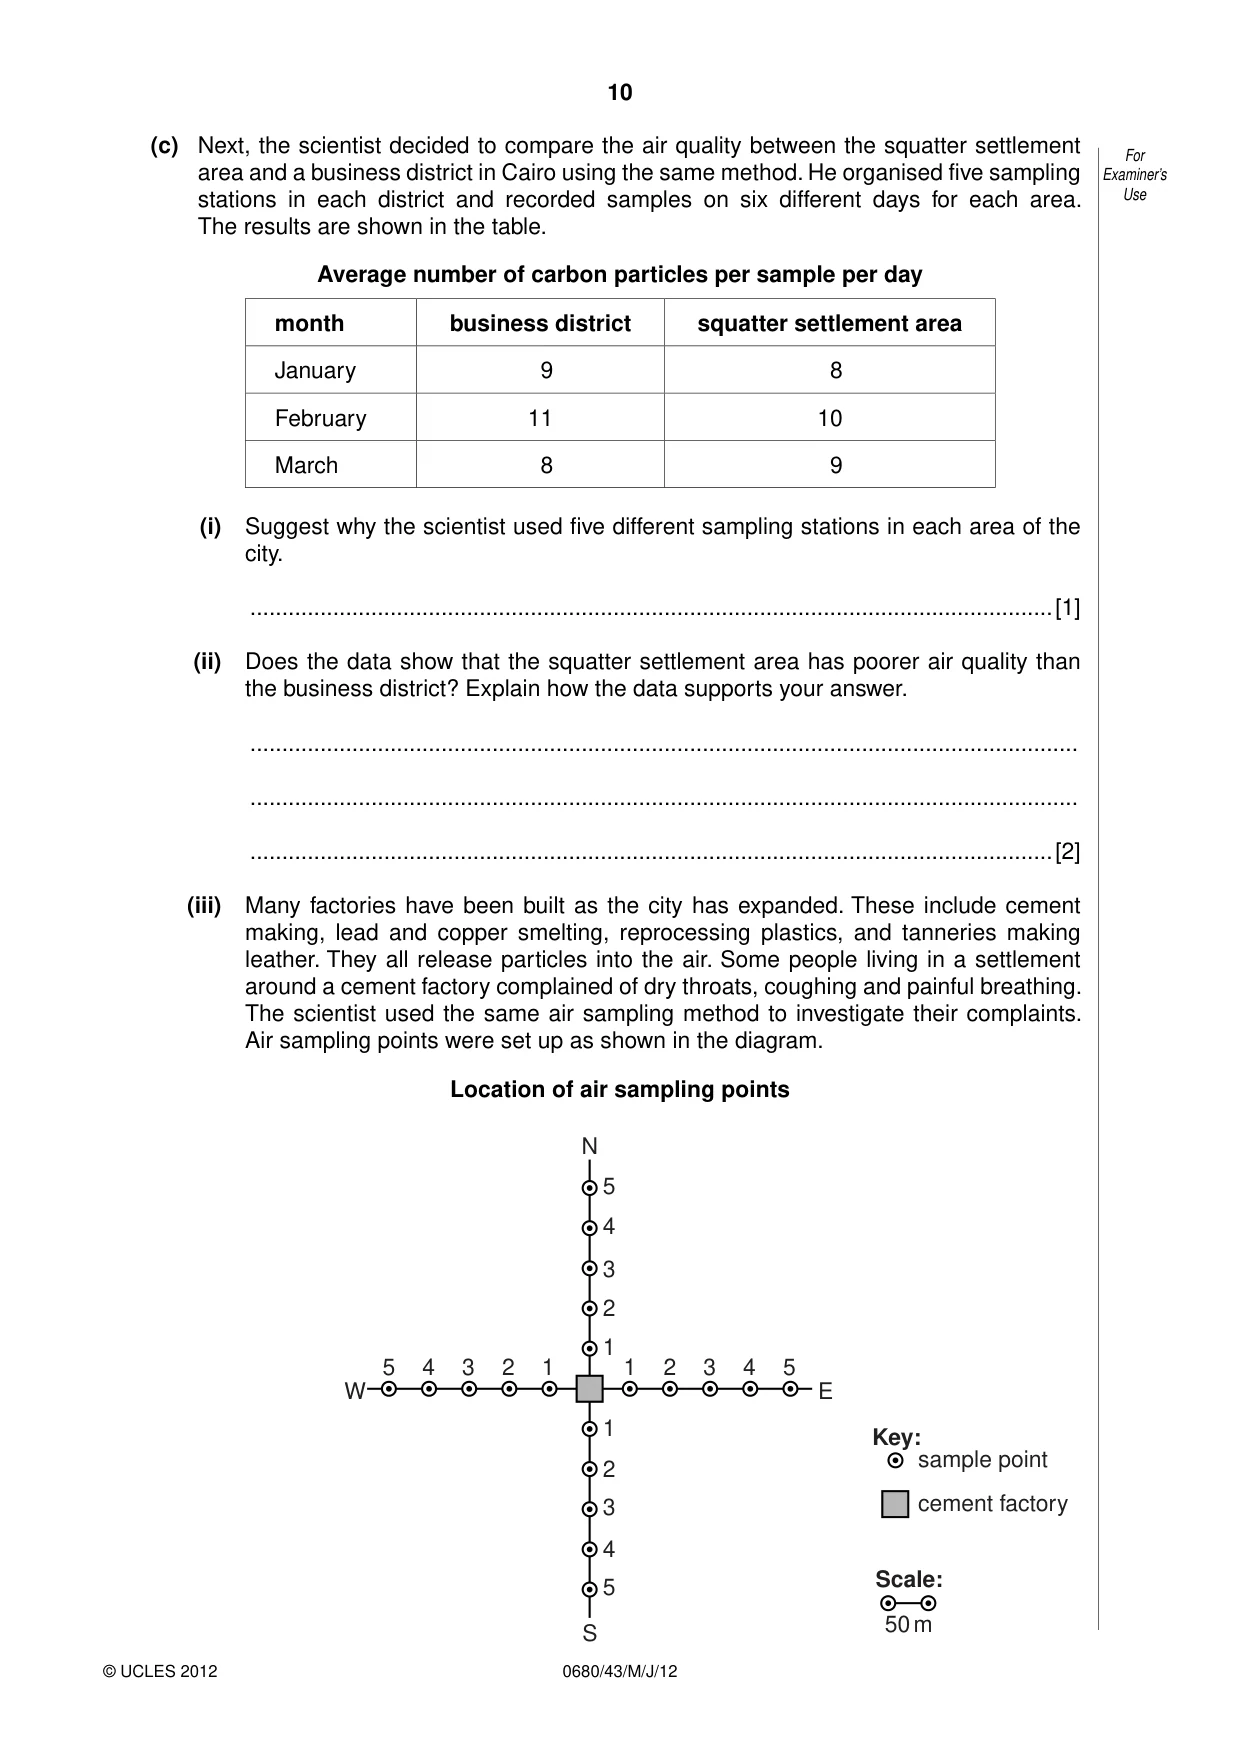
10 0680/43/M/J/12 © UCLES 2012 For Examiner’s Use (c) Next, the scientist decided to compare the air quality between the squatter settlement area and a business district in Cairo using the same method. He organised five sampling stations in each district and recorded samples on six different days for each area. The results are shown in the table. Average number of carbon particles per sample per day month business district squatter settlement area January 9 8 February 11 10 March 8 9 (i) Suggest why the scientist used five different sampling stations in each area of the city. …[1] (ii) Does the data show that the squatter settlement area has poorer air quality than the business district? Explain how the data supports your answer. … … …[2] (iii) Many factories have been built as the city has expanded. These include cement making, lead and copper smelting, reprocessing plastics, and tanneries making leather. They all release particles into the air. Some people living in a settlement around a cement factory complained of dry throats, coughing and painful breathing. The scientist used the same air sampling method to investigate their complaints. Air sampling points were set up as shown in the diagram. Location of air sampling points N W E S 50 m Scale: sample point cement factory Key: 5 4 3 2 1 1 1 2 3 4 5 5 4 3 2 1 2 3 4 5
Question paper, page 11
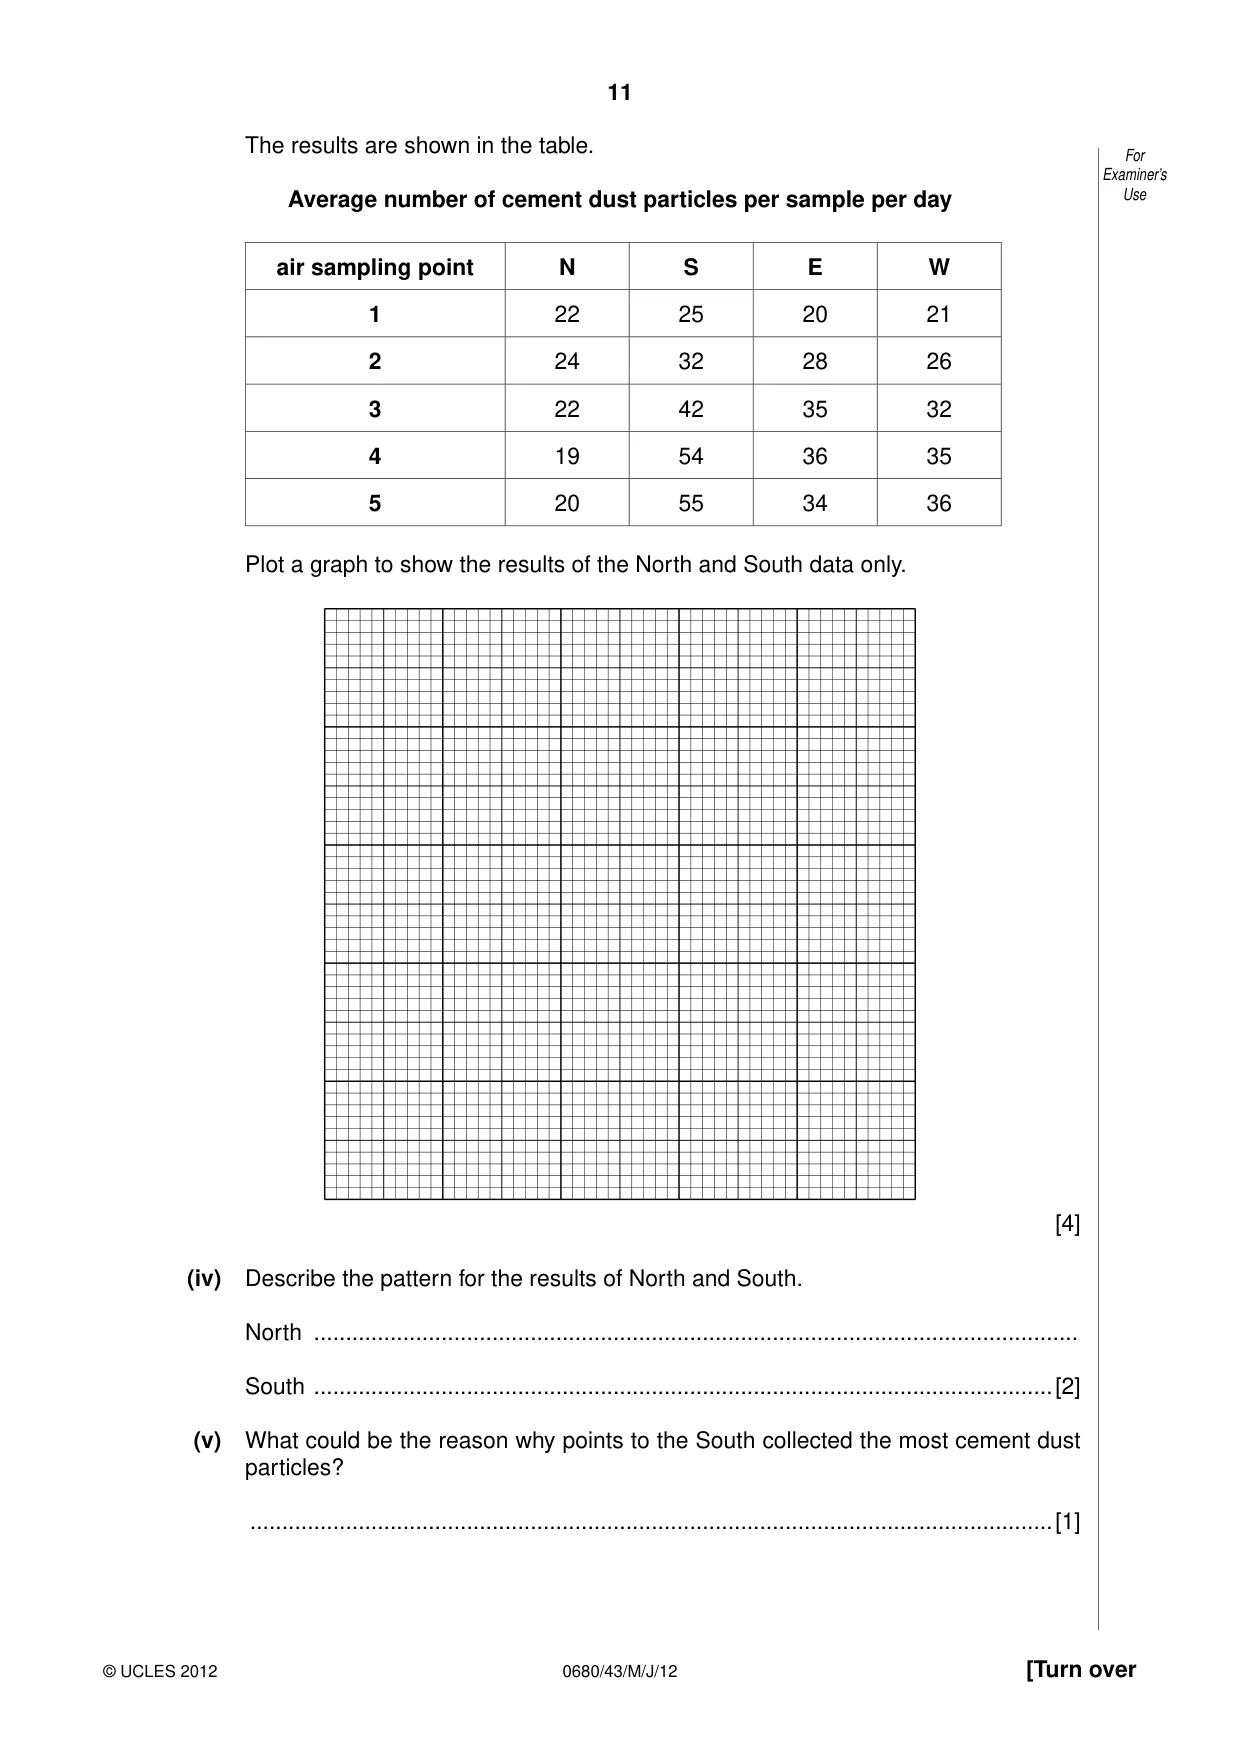
11 0680/43/M/J/12 © UCLES 2012 [Turn over For Examiner’s Use The results are shown in the table. Average number of cement dust particles per sample per day air sampling point N S E W 1 22 25 20 21 2 24 32 28 26 3 22 42 35 32 4 19 54 36 35 5 20 55 34 36 Plot a graph to show the results of the North and South data only. [4] (iv) Describe the pattern for the results of North and South. North … South …[2] (v) What could be the reason why points to the South collected the most cement dust particles? …[1]
Question paper, page 12
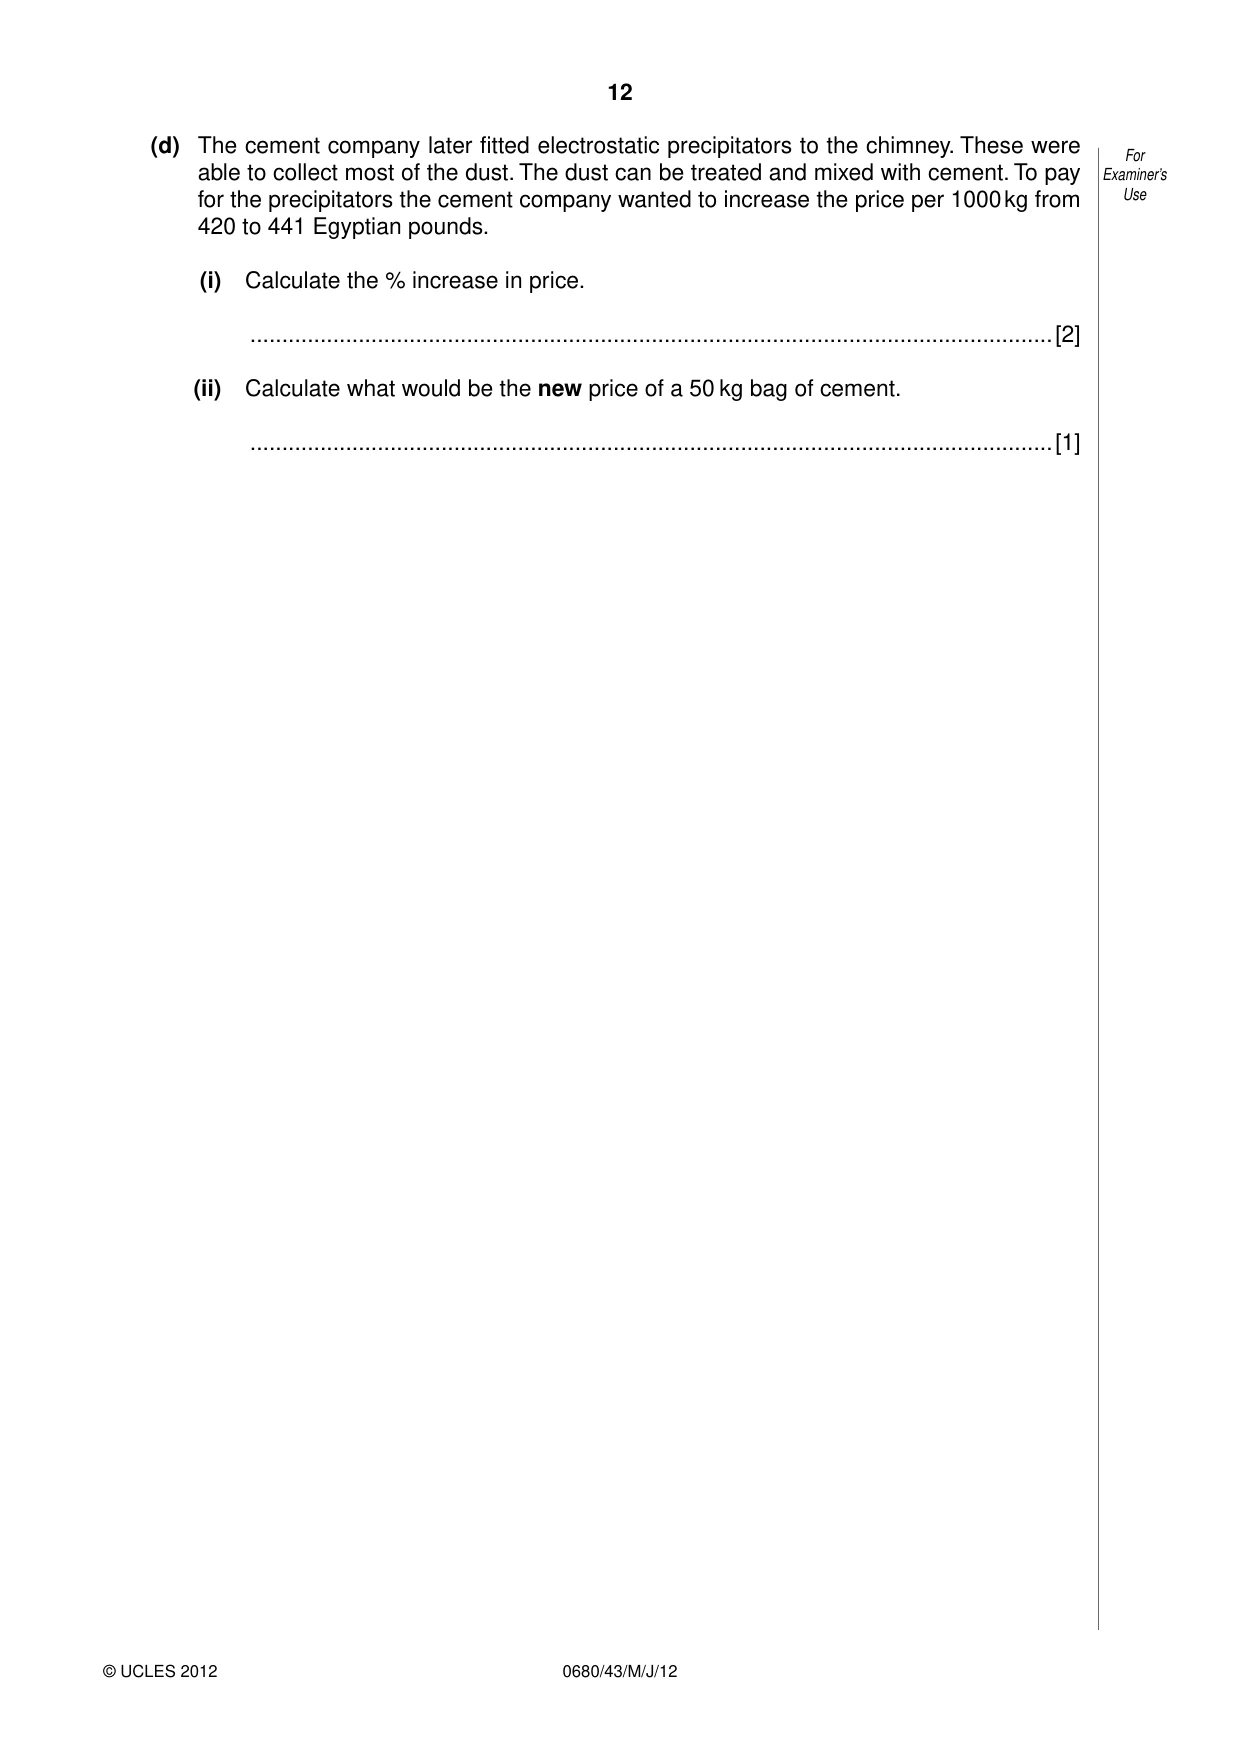
12 0680/43/M/J/12 © UCLES 2012 For Examiner’s Use (d) The cement company later fitted electrostatic precipitators to the chimney. These were able to collect most of the dust. The dust can be treated and mixed with cement. To pay for the precipitators the cement company wanted to increase the price per 1000 kg from 420 to 441 Egyptian pounds. (i) Calculate the % increase in price. …[2] (ii) Calculate what would be the new price of a 50 kg bag of cement. …[1]
Question paper, page 13
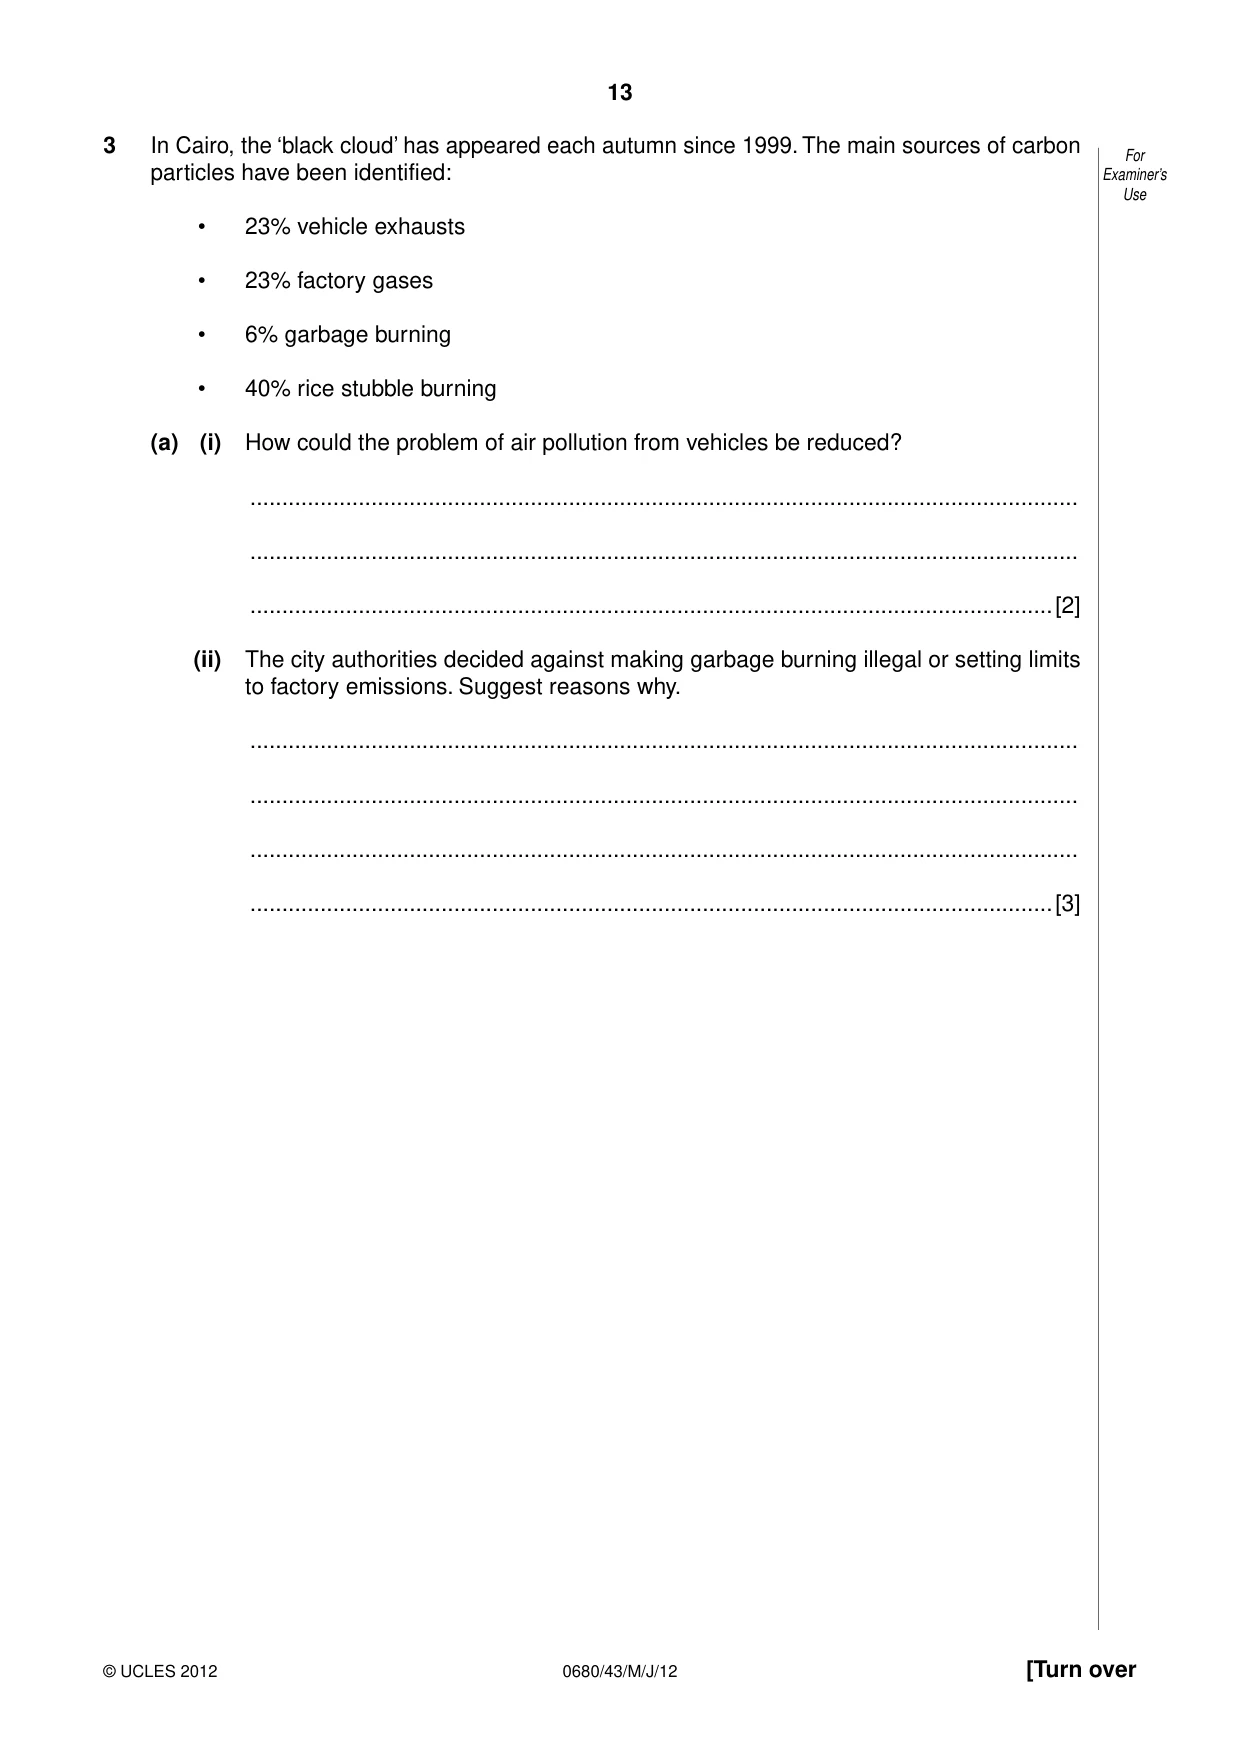
13 0680/43/M/J/12 © UCLES 2012 [Turn over For Examiner’s Use 3 In Cairo, the ‘black cloud’ has appeared each autumn since 1999. The main sources of carbon particles have been identified: • 23% vehicle exhausts • 23% factory gases • 6% garbage burning • 40% rice stubble burning (a) (i) How could the problem of air pollution from vehicles be reduced? … … …[2] (ii) The city authorities decided against making garbage burning illegal or setting limits to factory emissions. Suggest reasons why. … … … …[3]
Question paper, page 14
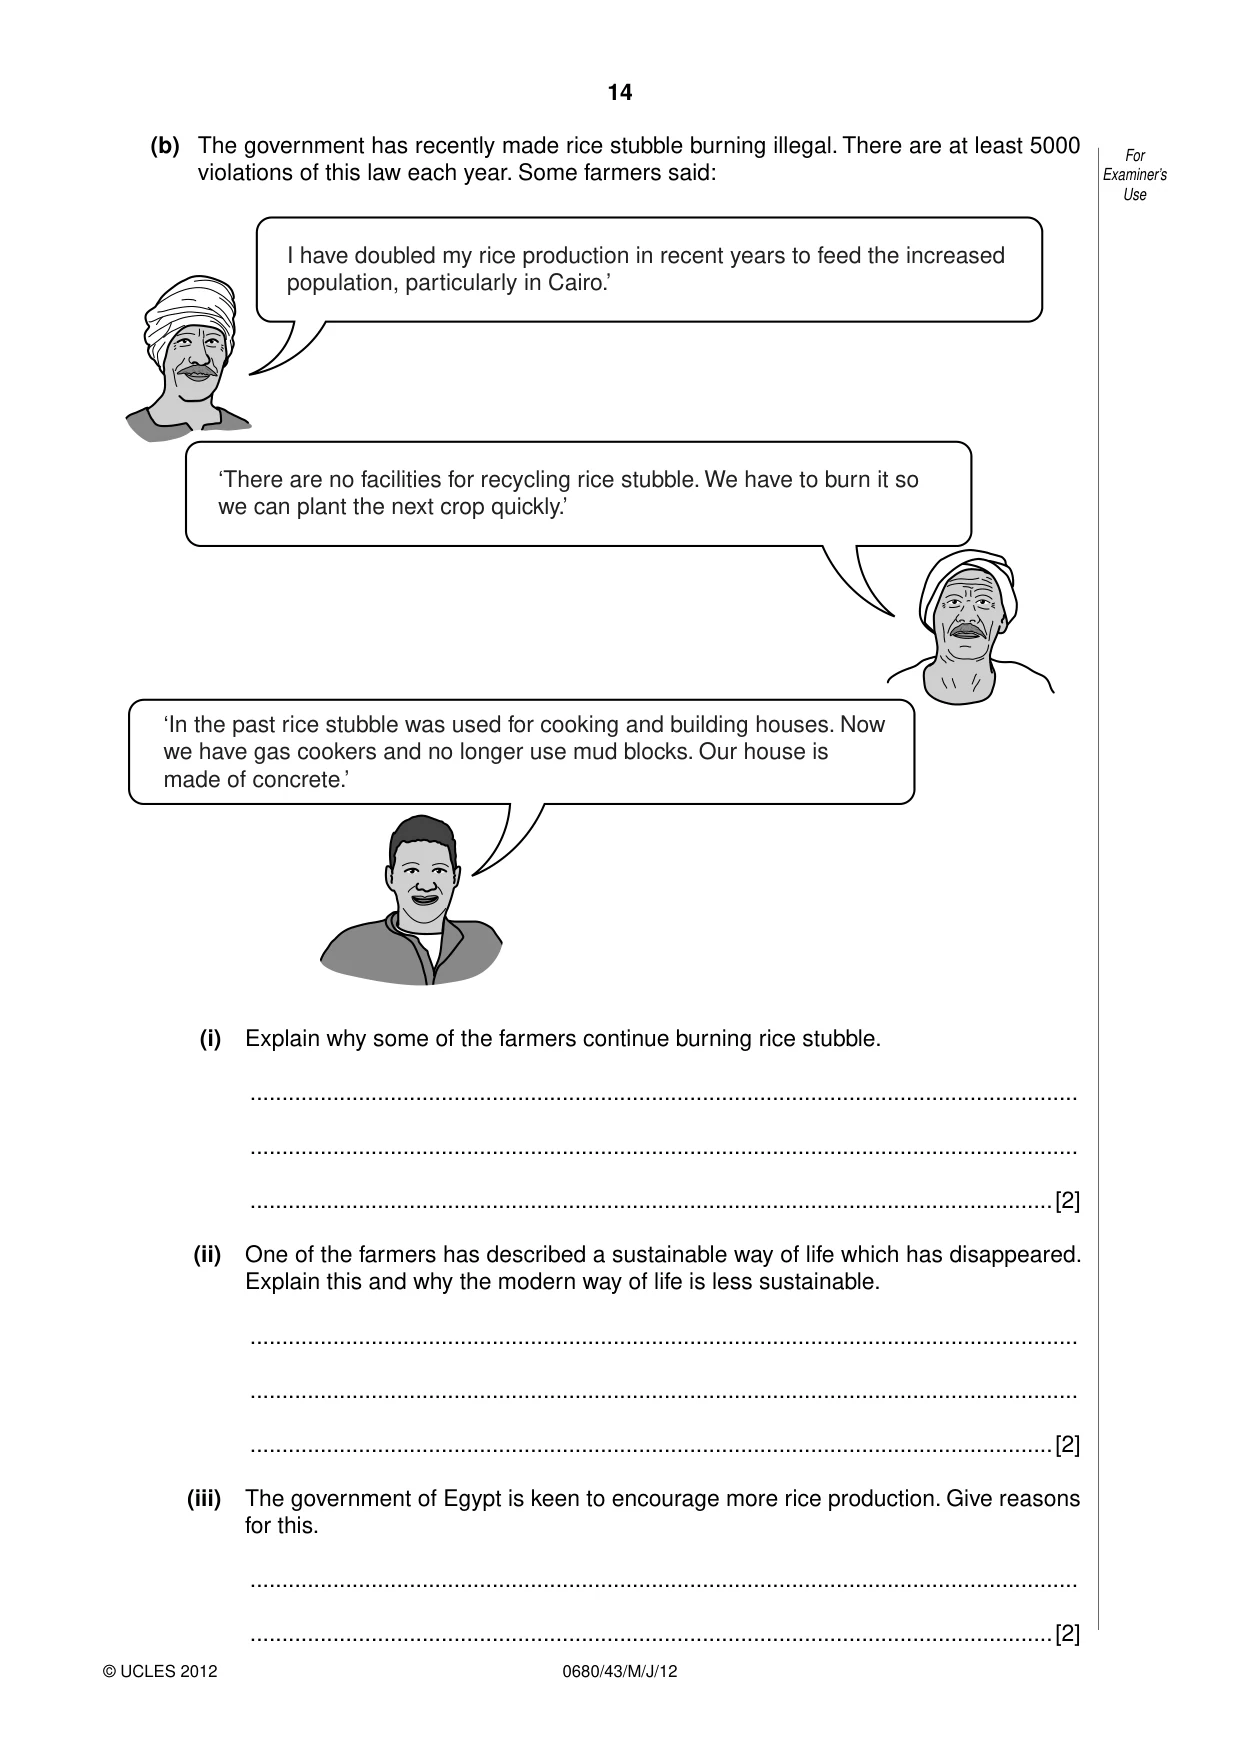
14 0680/43/M/J/12 © UCLES 2012 For Examiner’s Use (b) The government has recently made rice stubble burning illegal. There are at least 5000 violations of this law each year. Some farmers said: I have doubled my rice production in recent years to feed the increased population, particularly in Cairo.’ ‘There are no facilities for recycling rice stubble. We have to burn it so we can plant the next crop quickly.’ ‘In the past rice stubble was used for cooking and building houses. Now we have gas cookers and no longer use mud blocks. Our house is made of concrete.’ (i) Explain why some of the farmers continue burning rice stubble. … … …[2] (ii) One of the farmers has described a sustainable way of life which has disappeared. Explain this and why the modern way of life is less sustainable. … … …[2] (iii) The government of Egypt is keen to encourage more rice production. Give reasons for this. … …[2]
Question paper, page 15
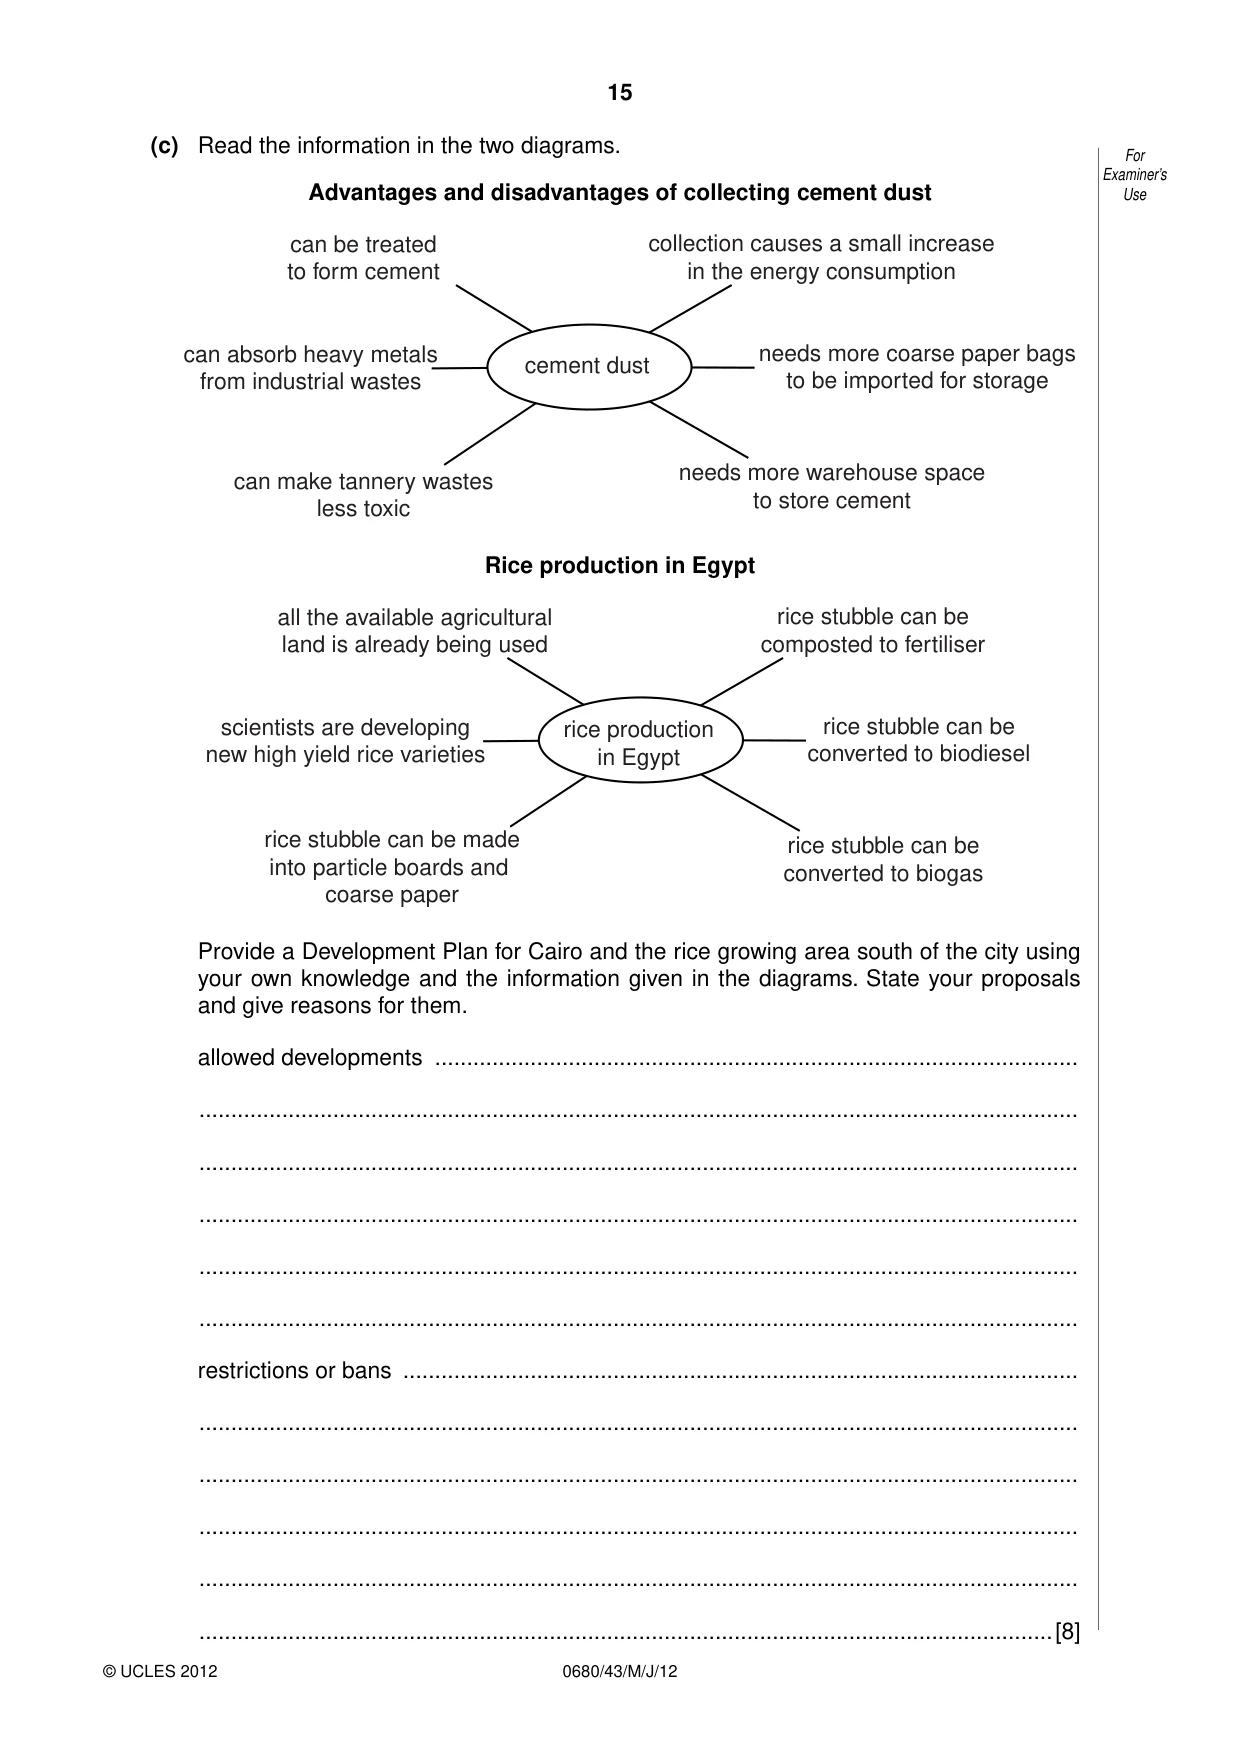
15 0680/43/M/J/12 © UCLES 2012 For Examiner’s Use (c) Read the information in the two diagrams. Advantages and disadvantages of collecting cement dust can be treated to form cement can absorb heavy metals from industrial wastes can make tannery wastes less toxic collection causes a small increase in the energy consumption needs more coarse paper bags to be imported for storage needs more warehouse space to store cement cement dust Rice production in Egypt all the available agricultural land is already being used scientists are developing new high yield rice varieties rice stubble can be made into particle boards and coarse paper rice stubble can be composted to fertiliser rice stubble can be converted to biodiesel rice stubble can be converted to biogas rice production in Egypt Provide a Development Plan for Cairo and the rice growing area south of the city using your own knowledge and the information given in the diagrams. State your proposals and give reasons for them. allowed developments … … … … … … restrictions or bans … … … … … …[8]
Question paper, page 16
16 0680/43/M/J/12 © UCLES 2012 Permission to reproduce items where third-party owned material protected by copyright is included has been sought and cleared where possible. Every reasonable effort has been made by the publisher (UCLES) to trace copyright holders, but if any items requiring clearance have unwittingly been included, the publisher will be pleased to make amends at the earliest possible opportunity. University of Cambridge International Examinations is part of the Cambridge Assessment Group. Cambridge Assessment is the brand name of University of Cambridge Local Examinations Syndicate (UCLES), which is itself a department of the University of Cambridge. BLANK PAGE
Mark scheme, page 1
UNIVERSITY OF CAMBRIDGE INTERNATIONAL EXAMINATIONS International General Certificate of Secondary Education MARK SCHEME for the May/June 2012 question paper for the guidance of teachers 0680 ENVIRONMENTAL MANAGEMENT 0680/43 Paper 4 (Alternative to Coursework), maximum raw mark 60 This mark scheme is published as an aid to teachers and candidates, to indicate the requirements of the examination. It shows the basis on which Examiners were instructed to award marks. It does not indicate the details of the discussions that took place at an Examiners’ meeting before marking began, which would have considered the acceptability of alternative answers. Mark schemes must be read in conjunction with the question papers and the report on the examination. • Cambridge will not enter into discussions or correspondence in connection with these mark schemes. Cambridge is publishing the mark schemes for the May/June 2012 question papers for most IGCSE, GCE Advanced Level and Advanced Subsidiary Level syllabuses and some Ordinary Level syllabuses. www.XtremePapers.com
Mark scheme, page 2
Page 2 Mark Scheme: Teachers’ version Syllabus Paper IGCSE – May/June 2012 0680 43 © University of Cambridge International Examinations 2012 General notes Symbols used in Environmental Management mark schemes. / separates alternatives for a marking point – other valid ways of expressing the same idea are also credited ; separates points for the award of a mark [3] indicates the number of marks available [max 3] the number shows the maximum number of marks available for the question where there are more marking points than total marks available [max 3] when part of the marks of a question must come from part of the mark scheme, this is indicated by non-bold marks showing the internal maxima for different parts of the question these non-bold marks are also used to show marks for bands where banded mark schemes are used italic indicates that this is information about the marking points and is not required to gain credit italic text is also used for comments about alternatives that should be accepted, ignored or rejected ora or reverse argument – shows that an argument from an alternative viewpoint will be credited AW alternative wording, sometimes called ‘or words to that effect’ – AW is used when there are many different ways of expressing the same idea ( ) the word / phrase in brackets is not required to gain marks but sets the context of the response for credit e.g. (nuclear) waste – nuclear is not needed but if it was described as a domestic waste then no mark is awarded volcanic underlined words – the answer must contain exactly this word ecf error carried forward – if an incorrect answer is given to part of a question, and this answer is subsequently used by a candidate in later parts of the question, this indicates that the candidate’s incorrect answer will be used as a starting point for marking the later parts of the question
Mark scheme, page 3
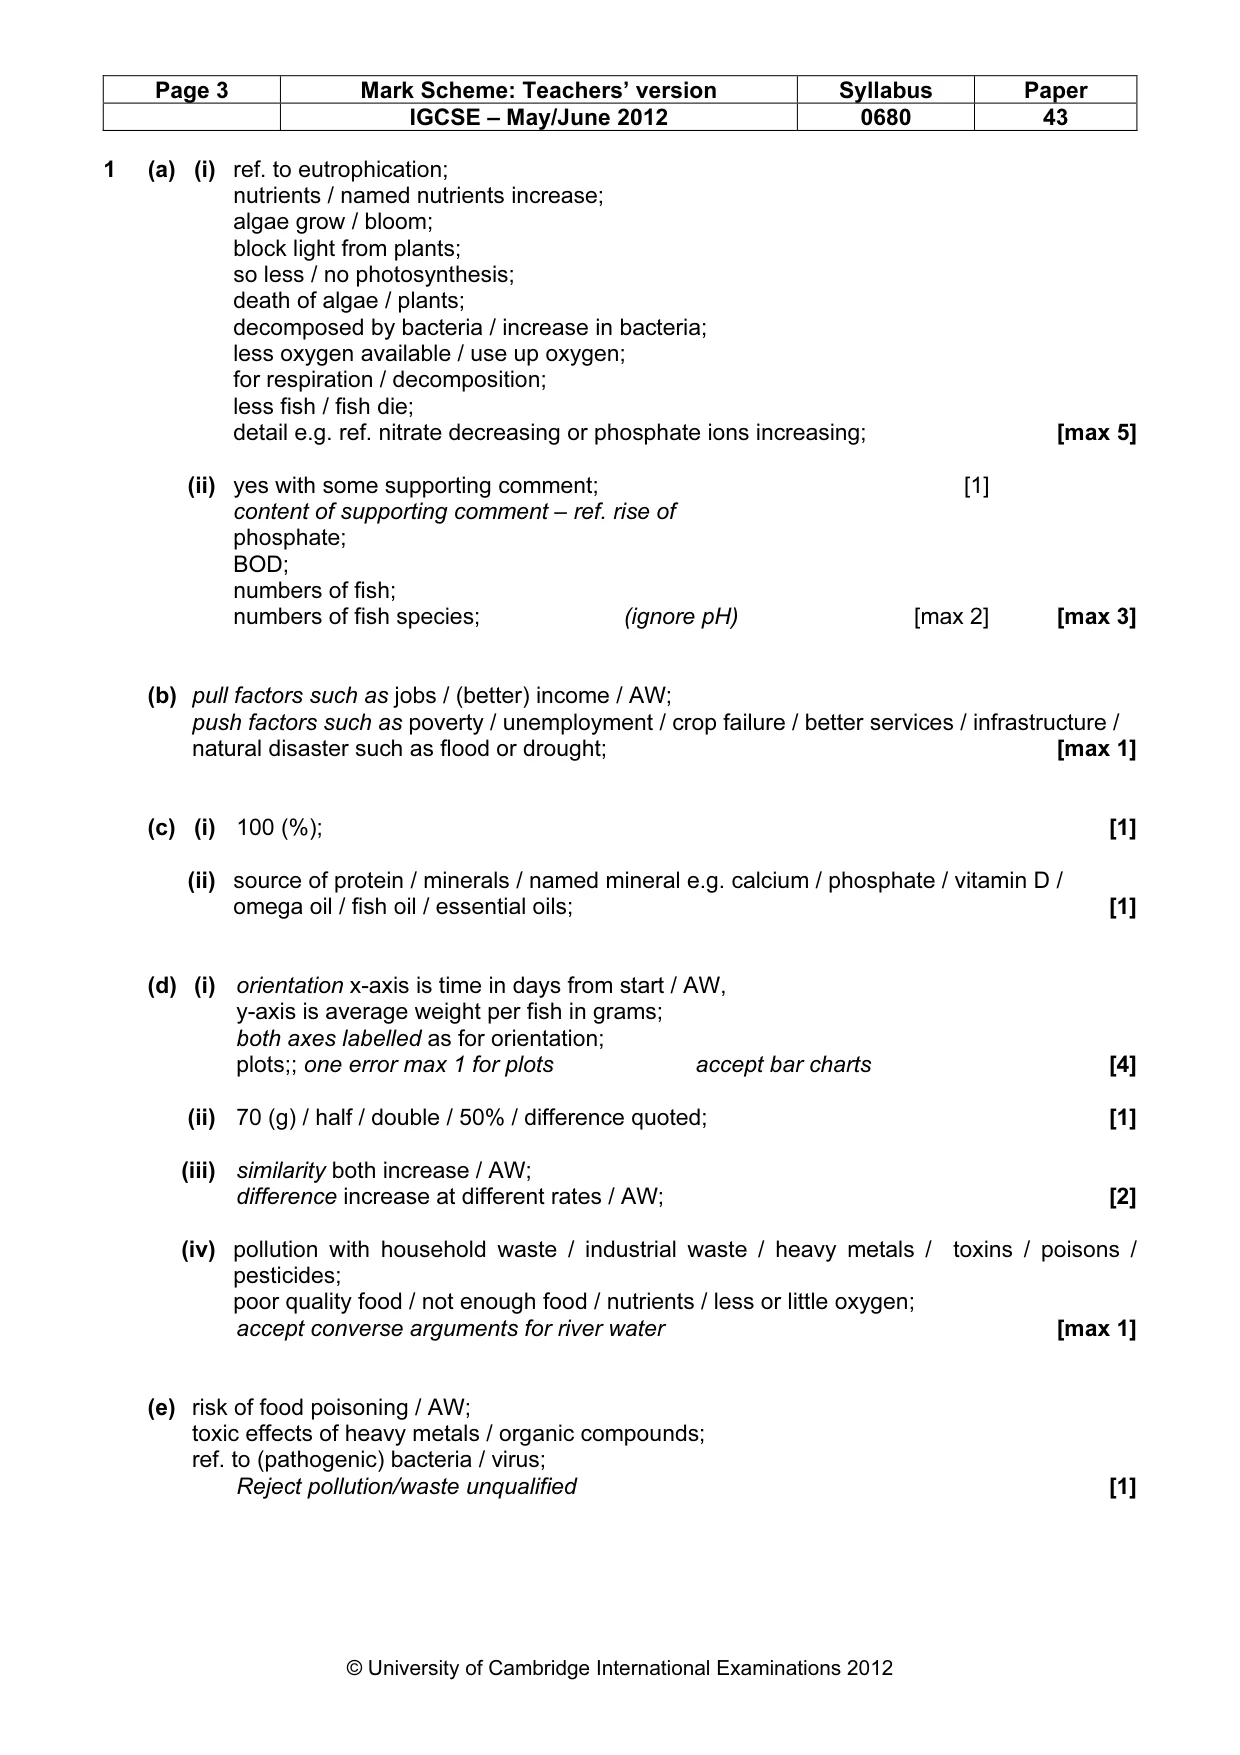
Page 3 Mark Scheme: Teachers’ version Syllabus Paper IGCSE – May/June 2012 0680 43 © University of Cambridge International Examinations 2012 1 (a) (i) ref. to eutrophication; nutrients / named nutrients increase; algae grow / bloom; block light from plants; so less / no photosynthesis; death of algae / plants; decomposed by bacteria / increase in bacteria; less oxygen available / use up oxygen; for respiration / decomposition; less fish / fish die; detail e.g. ref. nitrate decreasing or phosphate ions increasing; [max 5] (ii) yes with some supporting comment; [1] content of supporting comment – ref. rise of phosphate; BOD; numbers of fish; numbers of fish species; (ignore pH) [max 2] [max 3] (b) pull factors such as jobs / (better) income / AW; push factors such as poverty / unemployment / crop failure / better services / infrastructure / natural disaster such as flood or drought; [max 1] (c) (i) 100 (%); [1] (ii) source of protein / minerals / named mineral e.g. calcium / phosphate / vitamin D / omega oil / fish oil / essential oils; [1] (d) (i) orientation x-axis is time in days from start / AW, y-axis is average weight per fish in grams; both axes labelled as for orientation; plots;; one error max 1 for plots accept bar charts [4] (ii) 70 (g) / half / double / 50% / difference quoted; [1] (iii) similarity both increase / AW; difference increase at different rates / AW; [2] (iv) pollution with household waste / industrial waste / heavy metals / toxins / poisons / pesticides; poor quality food / not enough food / nutrients / less or little oxygen; accept converse arguments for river water [max 1] (e) risk of food poisoning / AW; toxic effects of heavy metals / organic compounds; ref. to (pathogenic) bacteria / virus; Reject pollution/waste unqualified [1]
Mark scheme, page 4
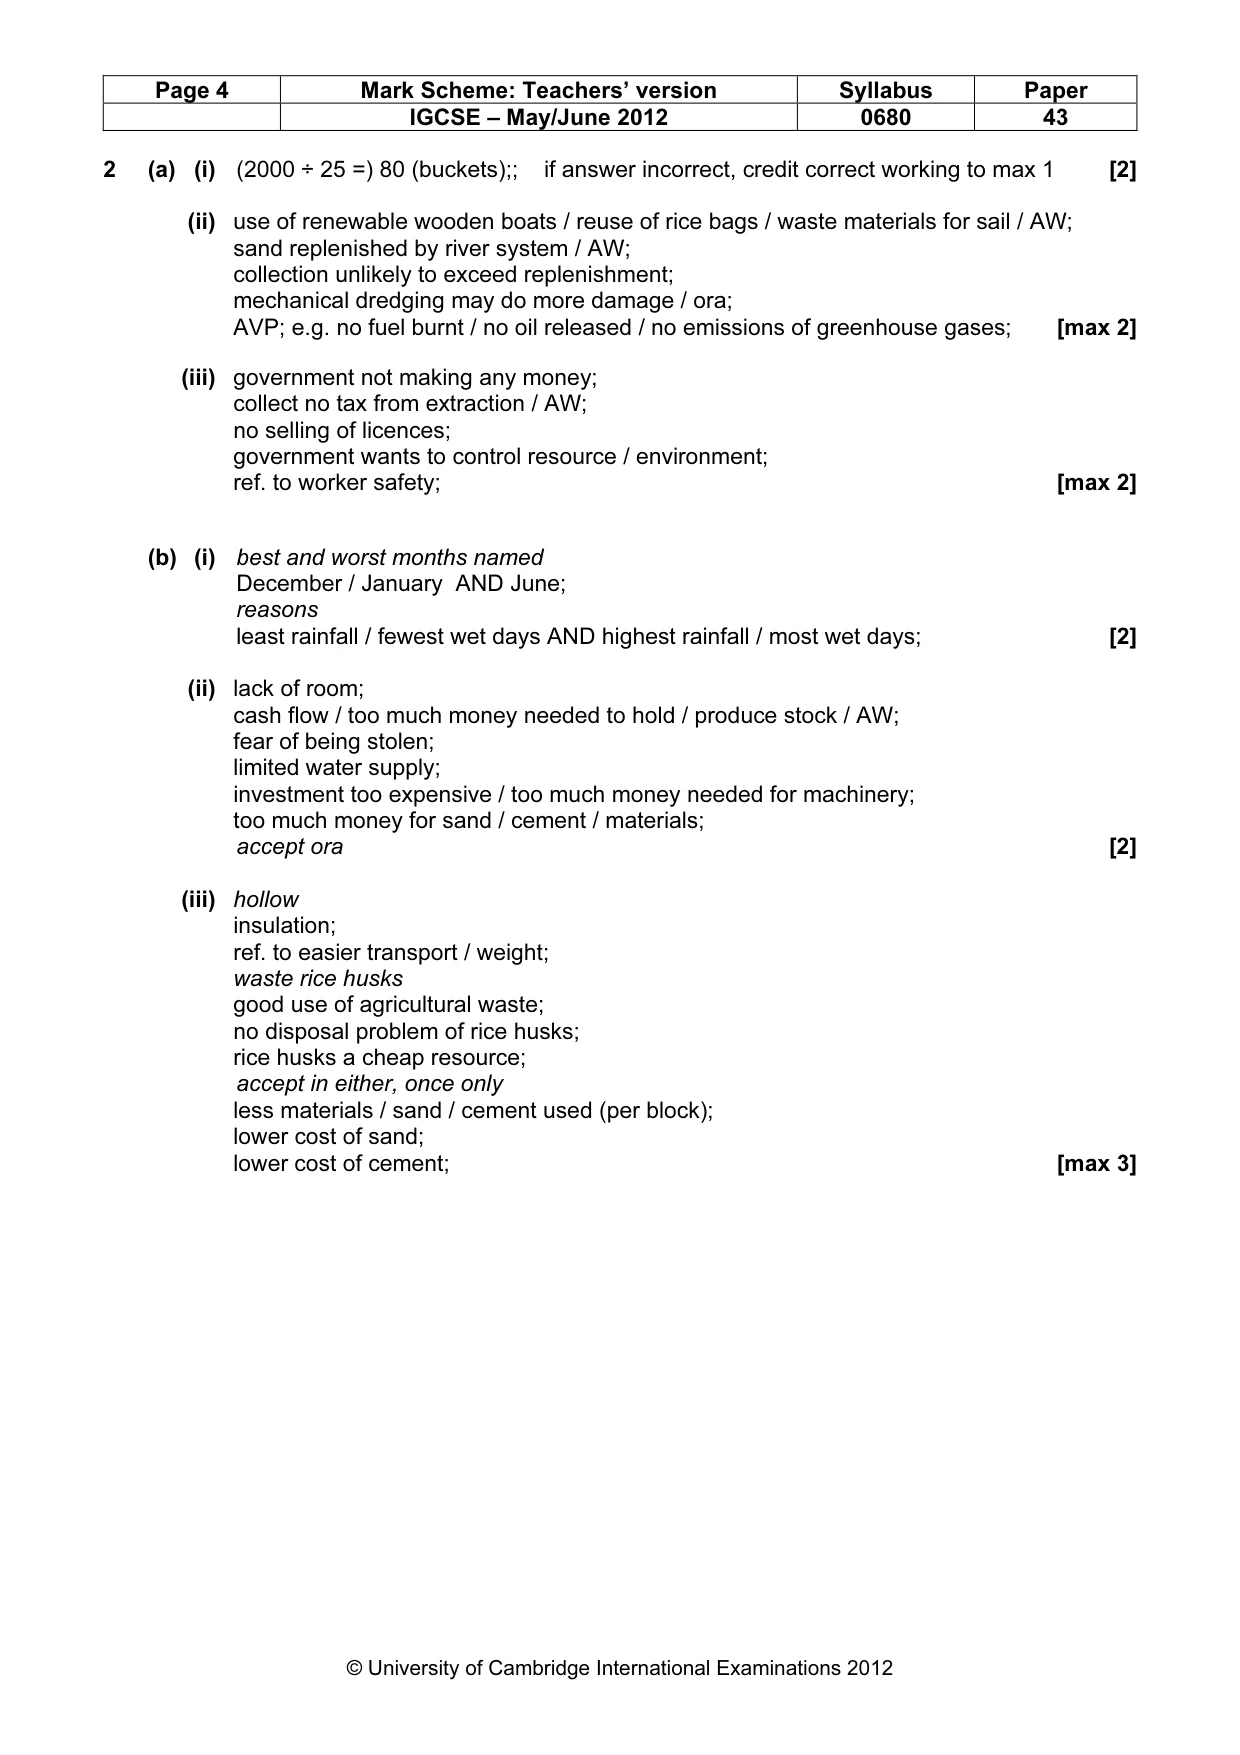
Page 4 Mark Scheme: Teachers’ version Syllabus Paper IGCSE – May/June 2012 0680 43 © University of Cambridge International Examinations 2012 2 (a) (i) (2000 ÷ 25 =) 80 (buckets);; if answer incorrect, credit correct working to max 1 [2] (ii) use of renewable wooden boats / reuse of rice bags / waste materials for sail / AW; sand replenished by river system / AW; collection unlikely to exceed replenishment; mechanical dredging may do more damage / ora; AVP; e.g. no fuel burnt / no oil released / no emissions of greenhouse gases; [max 2] (iii) government not making any money; collect no tax from extraction / AW; no selling of licences; government wants to control resource / environment; ref. to worker safety; [max 2] (b) (i) best and worst months named December / January AND June; reasons least rainfall / fewest wet days AND highest rainfall / most wet days; [2] (ii) lack of room; cash flow / too much money needed to hold / produce stock / AW; fear of being stolen; limited water supply; investment too expensive / too much money needed for machinery; too much money for sand / cement / materials; accept ora [2] (iii) hollow insulation; ref. to easier transport / weight; waste rice husks good use of agricultural waste; no disposal problem of rice husks; rice husks a cheap resource; accept in either, once only less materials / sand / cement used (per block); lower cost of sand; lower cost of cement; [max 3]
Mark scheme, page 5
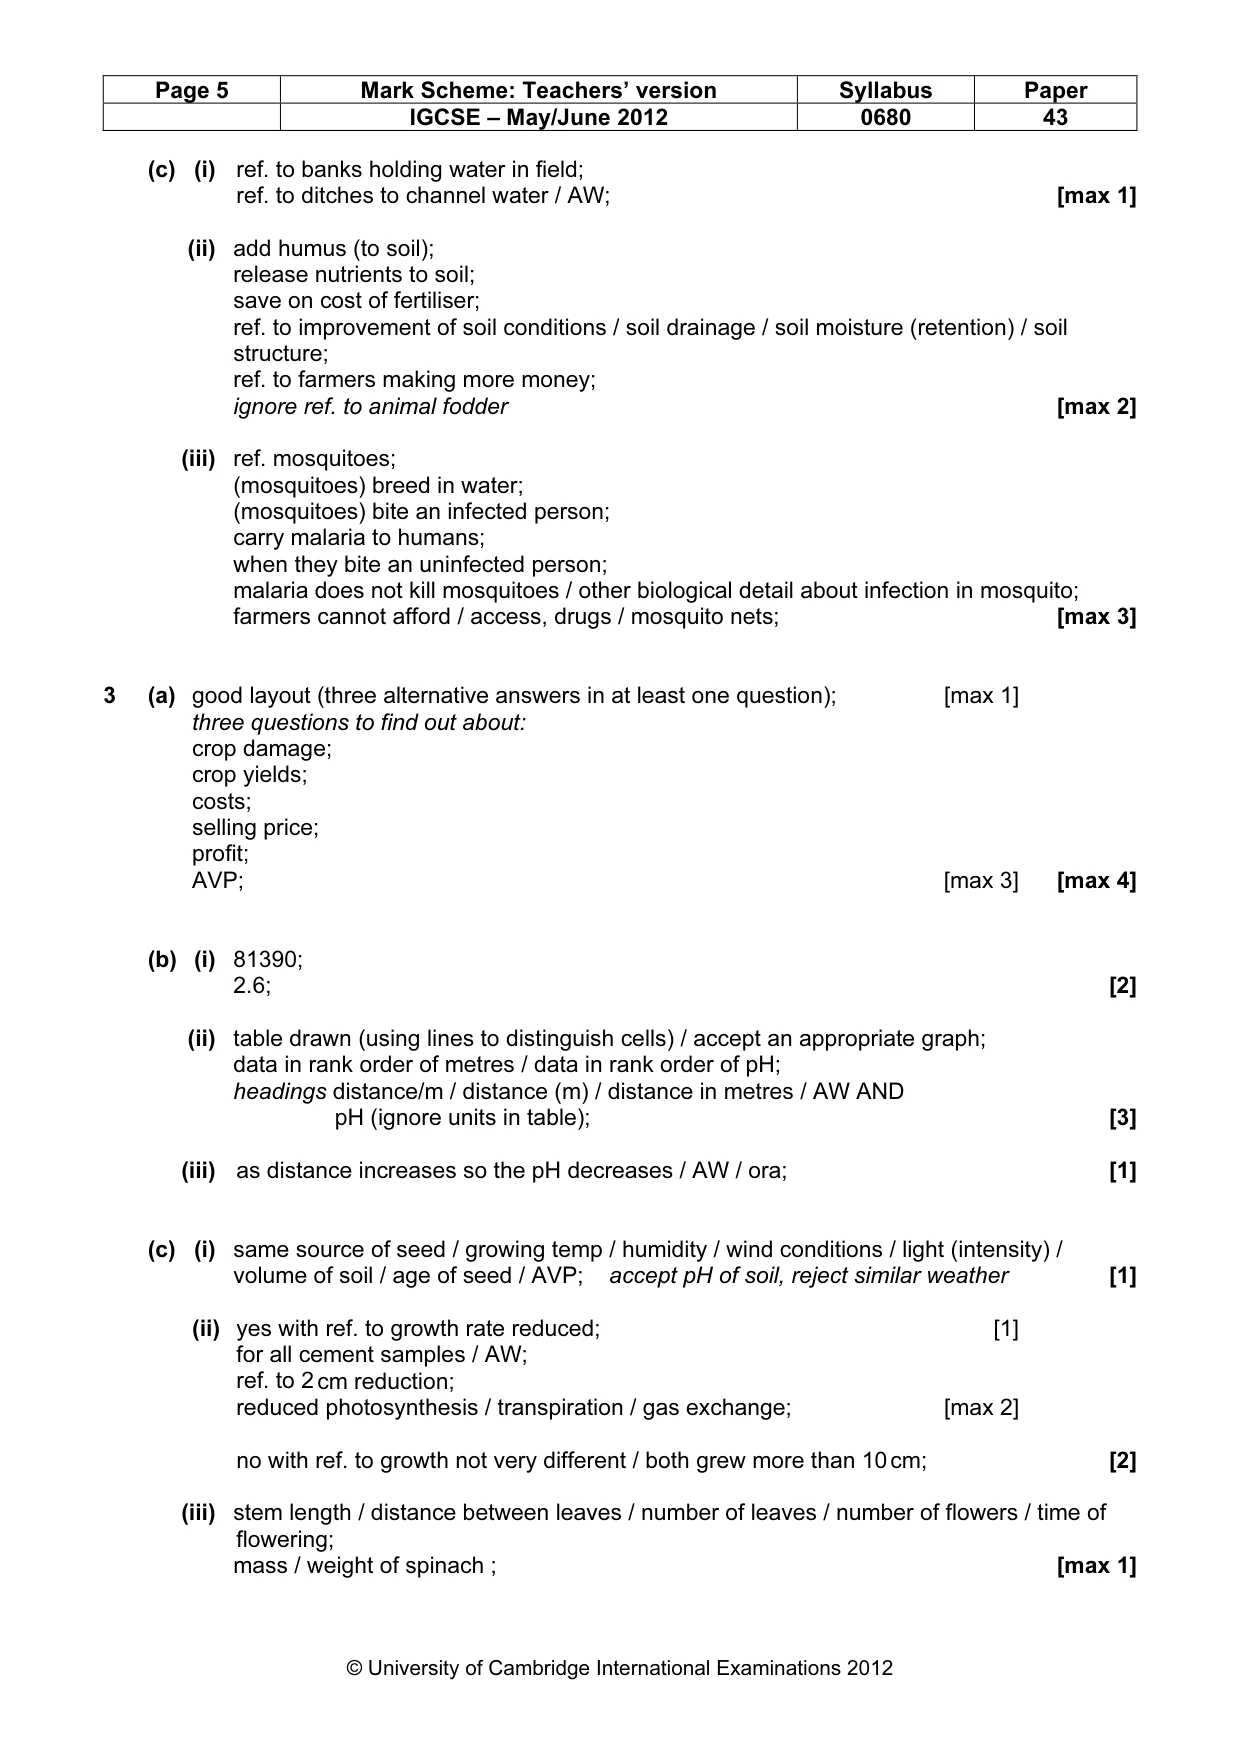
Page 5 Mark Scheme: Teachers’ version Syllabus Paper IGCSE – May/June 2012 0680 43 © University of Cambridge International Examinations 2012 (c) (i) ref. to banks holding water in field; ref. to ditches to channel water / AW; [max 1] (ii) add humus (to soil); release nutrients to soil; save on cost of fertiliser; ref. to improvement of soil conditions / soil drainage / soil moisture (retention) / soil structure; ref. to farmers making more money; ignore ref. to animal fodder [max 2] (iii) ref. mosquitoes; (mosquitoes) breed in water; (mosquitoes) bite an infected person; carry malaria to humans; when they bite an uninfected person; malaria does not kill mosquitoes / other biological detail about infection in mosquito; farmers cannot afford / access, drugs / mosquito nets; [max 3] 3 (a) good layout (three alternative answers in at least one question); [max 1] three questions to find out about: crop damage; crop yields; costs; selling price; profit; AVP; [max 3] [max 4] (b) (i) 81390; 2.6; [2] (ii) table drawn (using lines to distinguish cells) / accept an appropriate graph; data in rank order of metres / data in rank order of pH; headings distance/m / distance (m) / distance in metres / AW AND pH (ignore units in table); [3] (iii) as distance increases so the pH decreases / AW / ora; [1] (c) (i) same source of seed / growing temp / humidity / wind conditions / light (intensity) / volume of soil / age of seed / AVP; accept pH of soil, reject similar weather [1] (ii) yes with ref. to growth rate reduced; [1] for all cement samples / AW; ref. to 2 cm reduction; reduced photosynthesis / transpiration / gas exchange; [max 2] no with ref. to growth not very different / both grew more than 10 cm; [2] (iii) stem length / distance between leaves / number of leaves / number of flowers / time of flowering; mass / weight of spinach ; [max 1]
Mark scheme, page 6
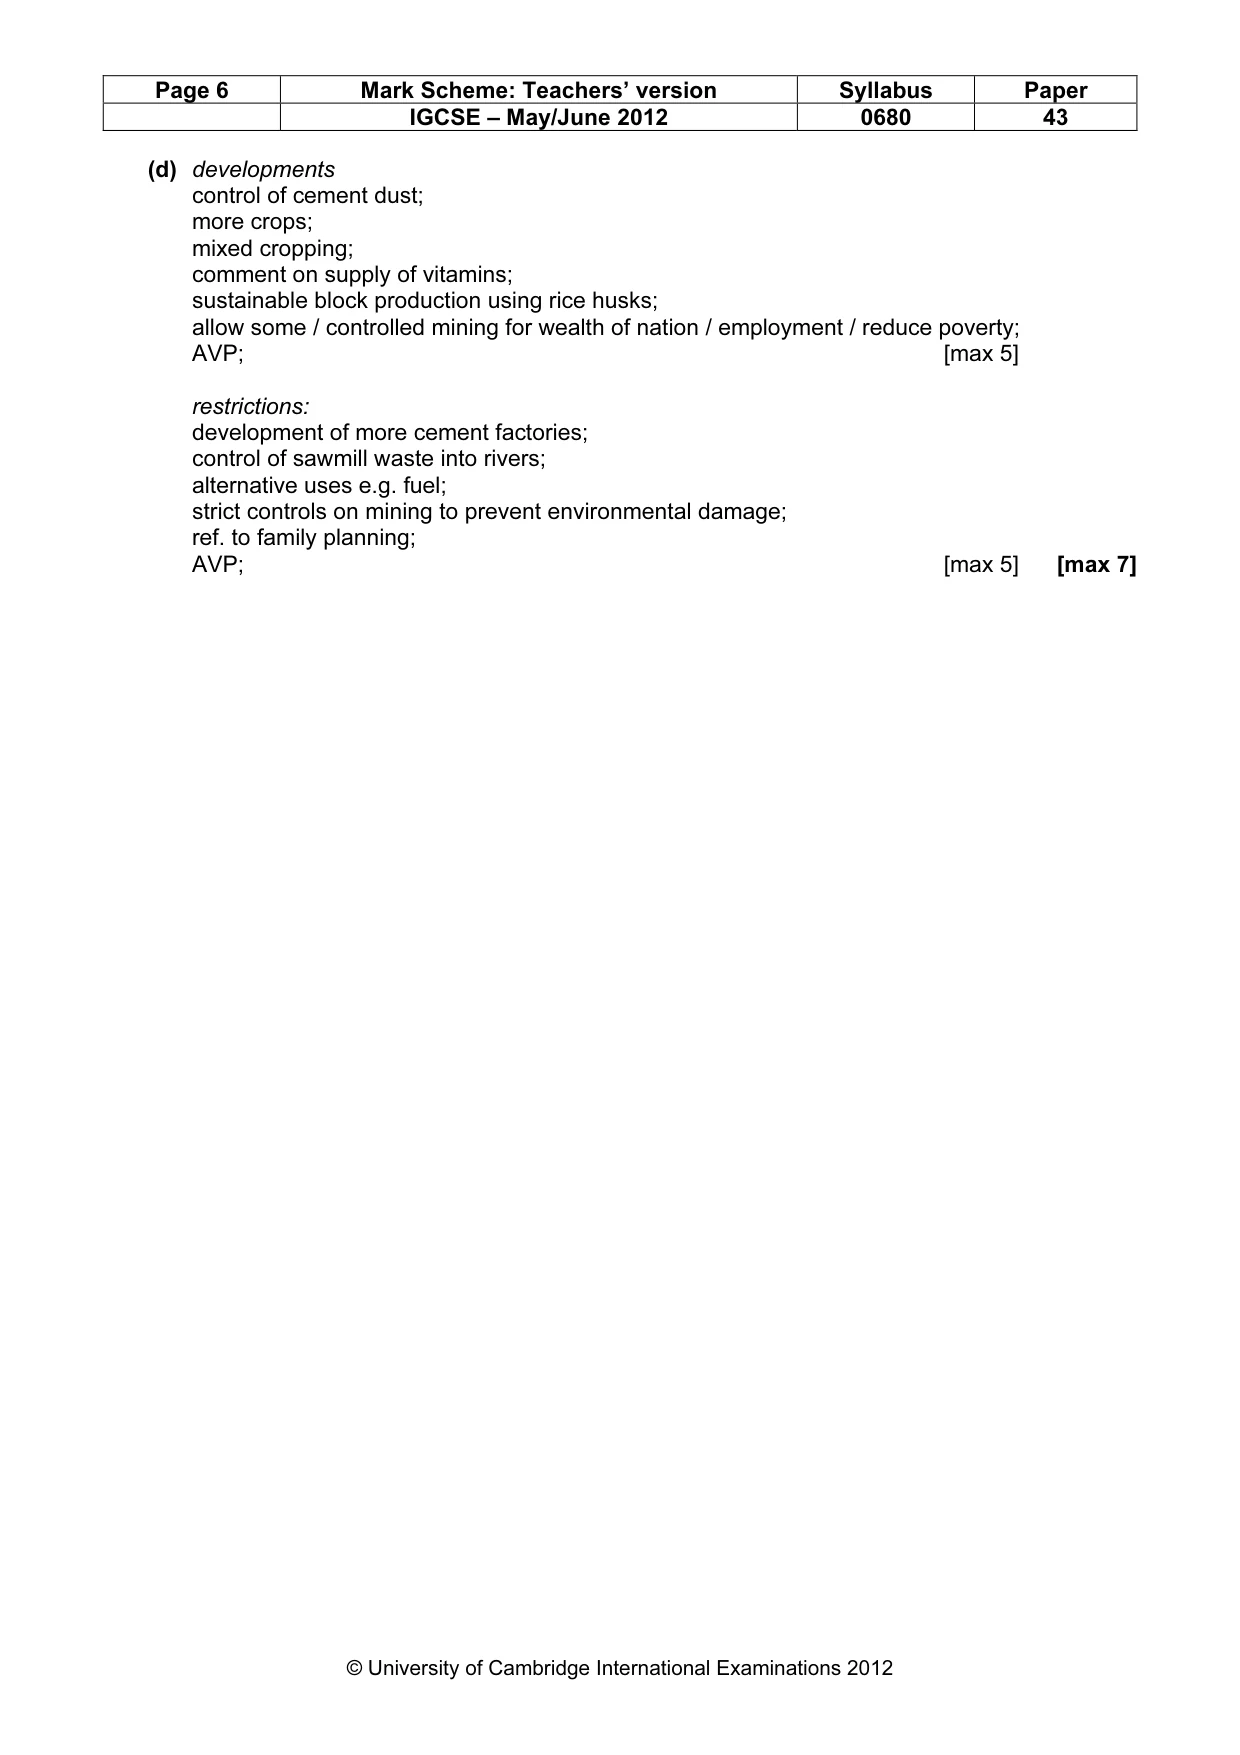
Page 6 Mark Scheme: Teachers’ version Syllabus Paper IGCSE – May/June 2012 0680 43 © University of Cambridge International Examinations 2012 (d) developments control of cement dust; more crops; mixed cropping; comment on supply of vitamins; sustainable block production using rice husks; allow some / controlled mining for wealth of nation / employment / reduce poverty; AVP; [max 5] restrictions: development of more cement factories; control of sawmill waste into rivers; alternative uses e.g. fuel; strict controls on mining to prevent environmental damage; ref. to family planning; AVP; [max 5] [max 7]
What you needed in this session
Cambridge’s own grade thresholds for 2012 May/June, Paper 4 · Variant 3. A higher threshold means an easier paper — the bar moves with how the cohort did.