Cambridge IGCSE Environmental Management 0680 — 2012 May/June Paper 2 · Variant 3
0680/23/M/J/12 · 80 marks · ≈90 min
The question paper and its mark scheme, free to read here and free to download. This is Cambridge’s own paper, exactly as it was sat.
Question paper20 pages
Mark scheme8 pages
Answers below. Sit the paper first if you are practising.
Paper as text
Question paper, page 1
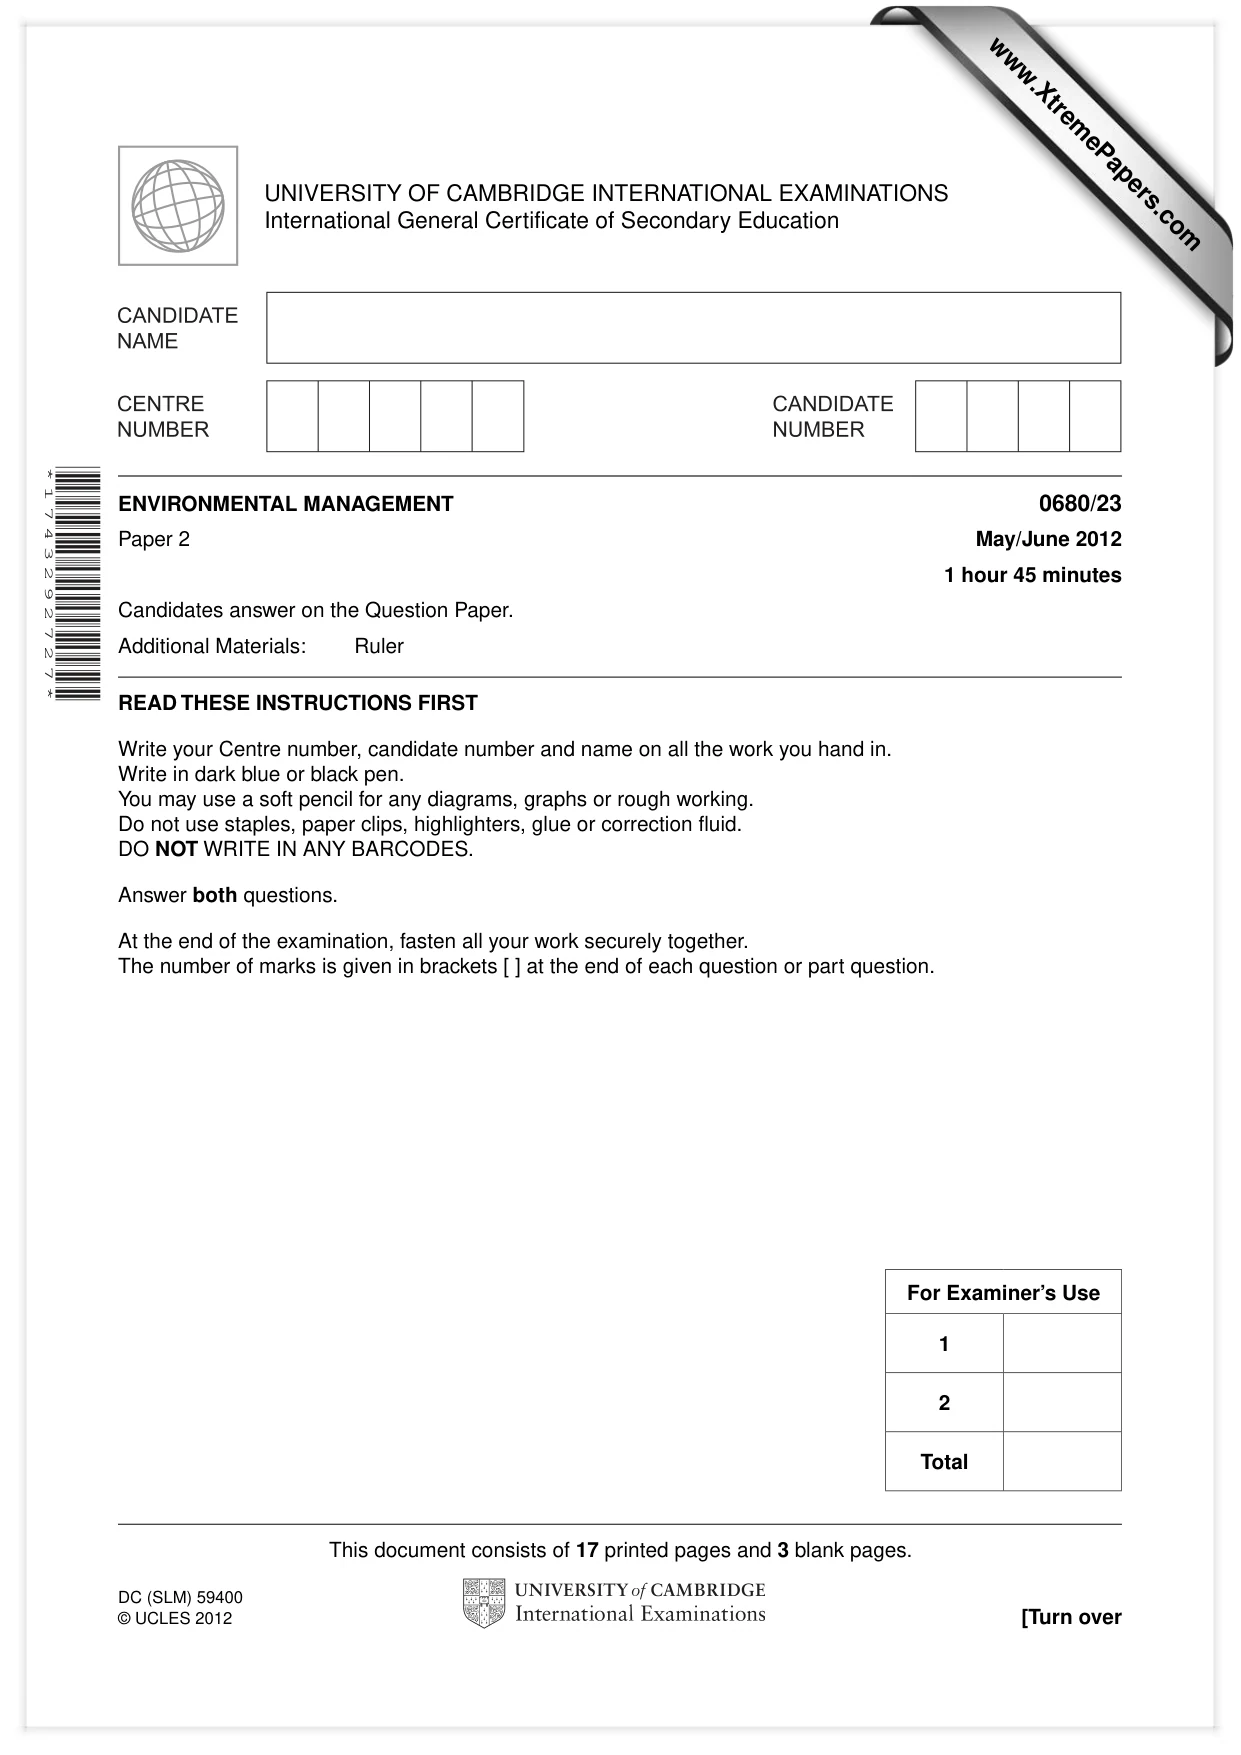
This document consists of 17 printed pages and 3 blank pages. DC (SLM) 59400 © UCLES 2012 [Turn over UNIVERSITY OF CAMBRIDGE INTERNATIONAL EXAMINATIONS International General Certificate of Secondary Education * 1 7 4 3 2 9 2 7 2 7 * ENVIRONMENTAL MANAGEMENT 0680/23 Paper 2 May/June 2012 1 hour 45 minutes Candidates answer on the Question Paper. Additional Materials: Ruler READ THESE INSTRUCTIONS FIRST Write your Centre number, candidate number and name on all the work you hand in. Write in dark blue or black pen. You may use a soft pencil for any diagrams, graphs or rough working. Do not use staples, paper clips, highlighters, glue or correction fluid. DO NOT WRITE IN ANY BARCODES. Answer both questions. At the end of the examination, fasten all your work securely together. The number of marks is given in brackets [ ] at the end of each question or part question. For Examiner’s Use 1 2 Total www.XtremePapers.com
Question paper, page 2
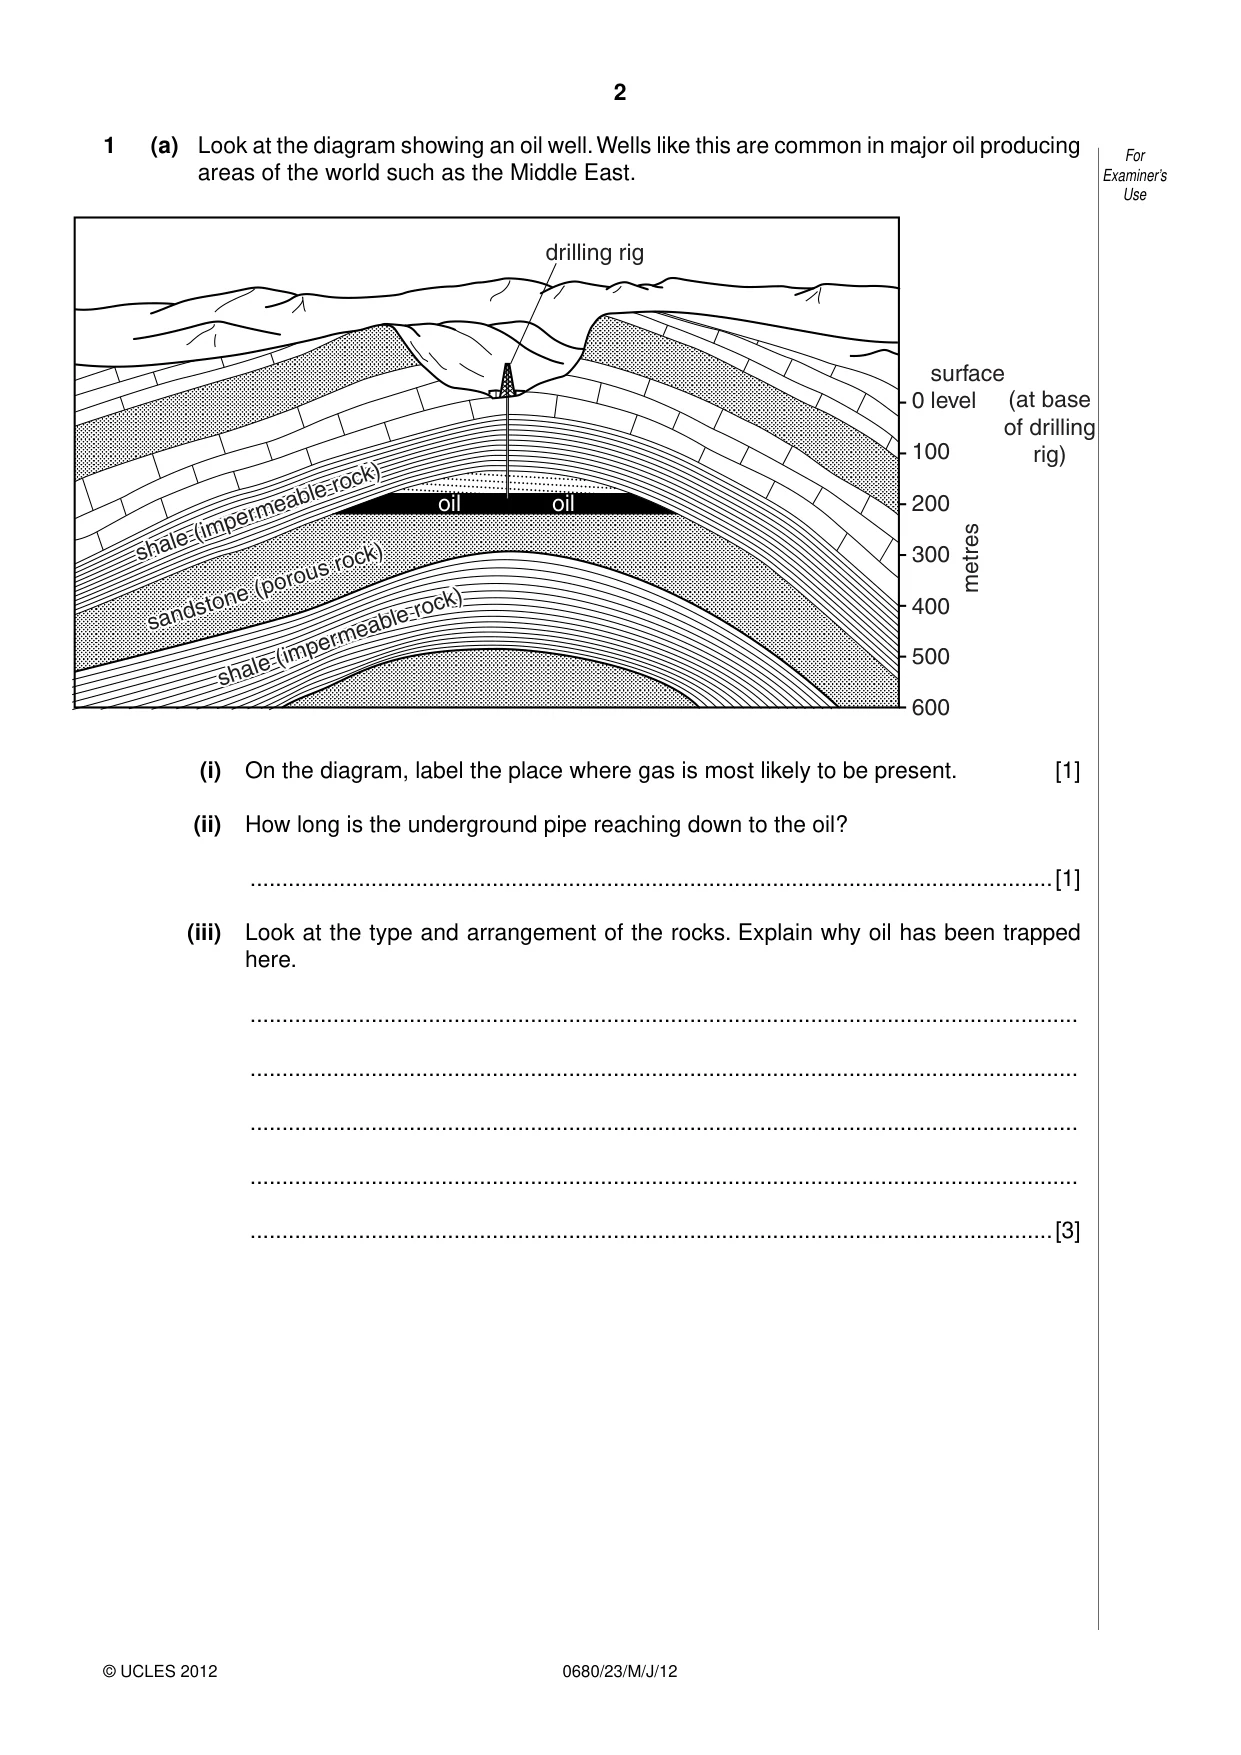
2 0680/23/M/J/12 © UCLES 2012 For Examiner’s Use 1 (a) Look at the diagram showing an oil well. Wells like this are common in major oil producing areas of the world such as the Middle East. oil oil shale (impermeable rock) shale (impermeable rock) sandstone (porous rock) drilling rig 0 surface level (at base of drilling rig) 100 200 300 metres 400 500 600 (i) On the diagram, label the place where gas is most likely to be present. [1] (ii) How long is the underground pipe reaching down to the oil? …[1] (iii) Look at the type and arrangement of the rocks. Explain why oil has been trapped here. … … … … …[3]
Question paper, page 3
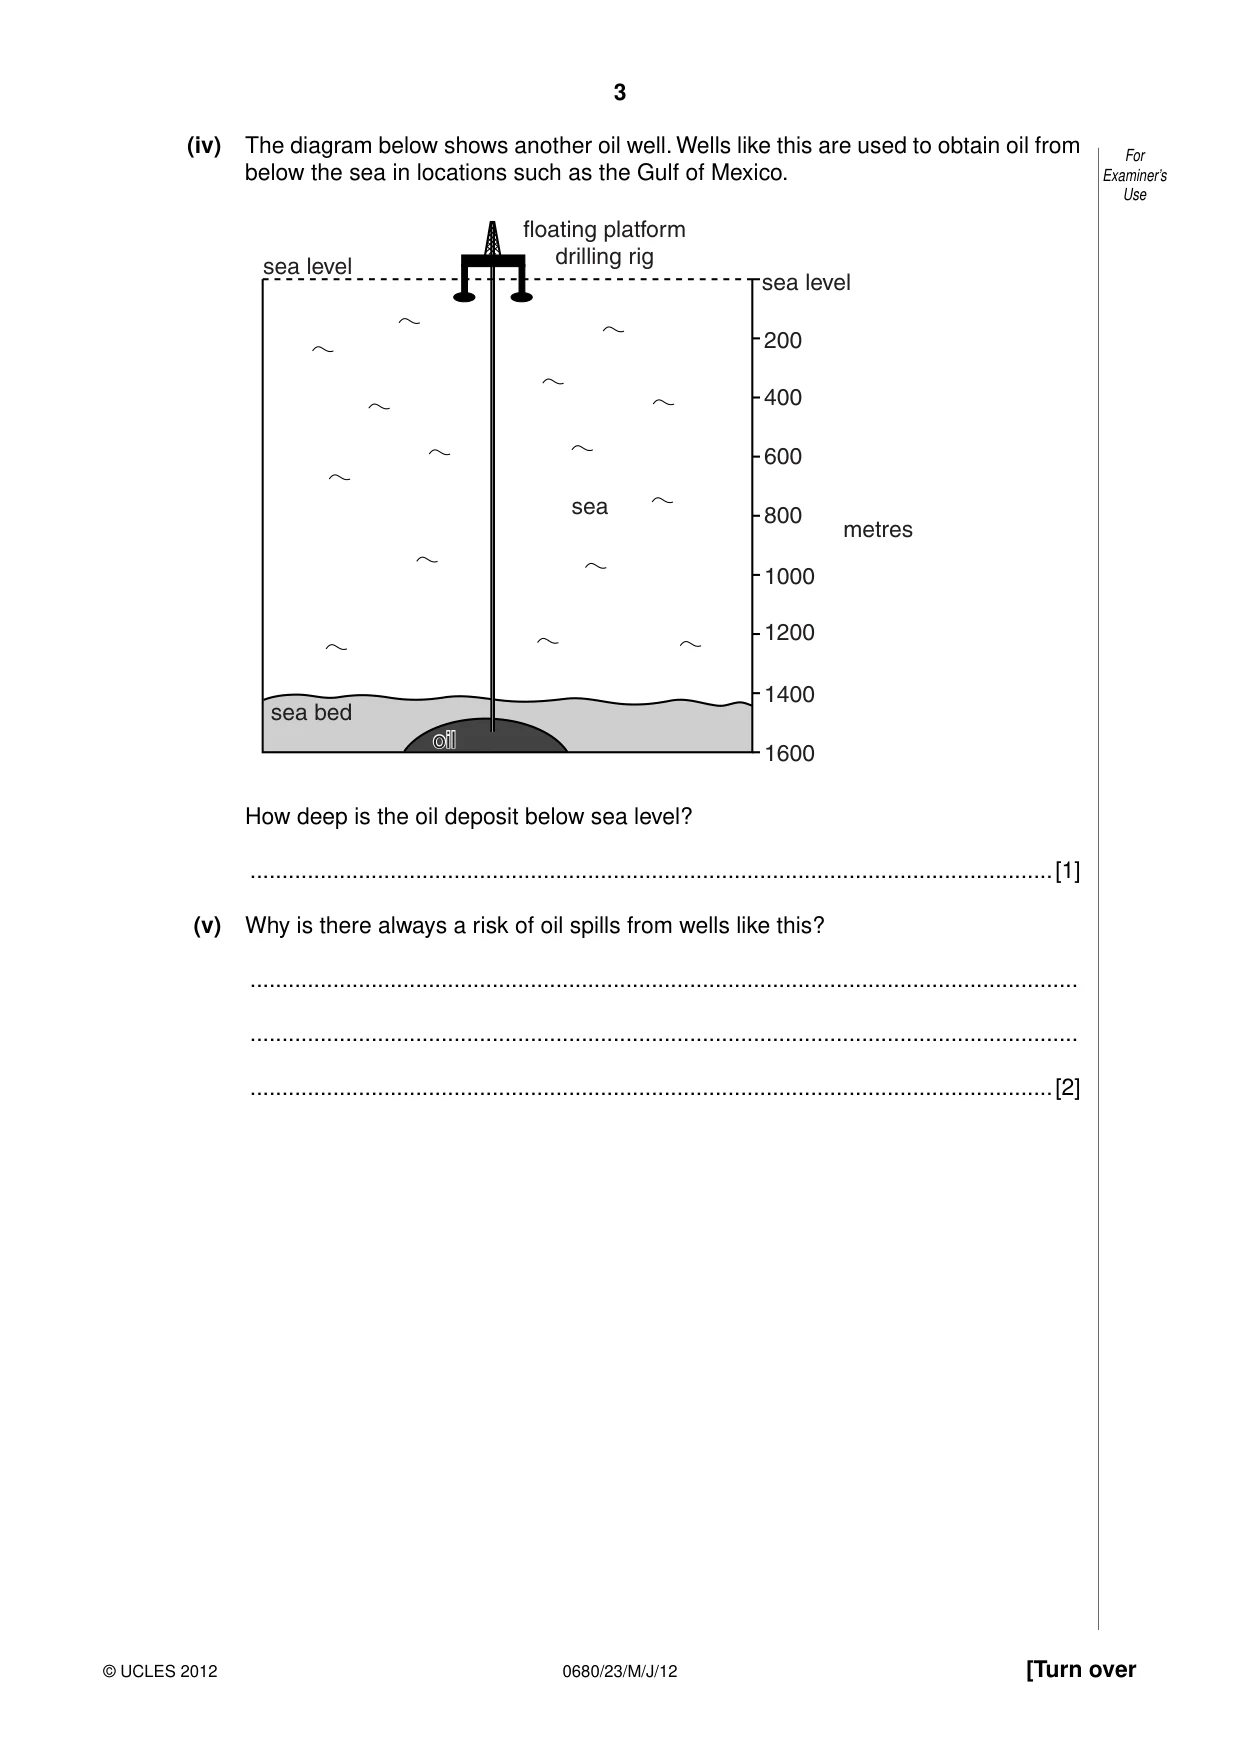
3 0680/23/M/J/12 © UCLES 2012 [Turn over For Examiner’s Use (iv) The diagram below shows another oil well. Wells like this are used to obtain oil from below the sea in locations such as the Gulf of Mexico. 1600 1400 1200 1000 metres 800 600 400 200 sea level floating platform drilling rig sea sea level sea bed oil How deep is the oil deposit below sea level? …[1] (v) Why is there always a risk of oil spills from wells like this? … … …[2]
Question paper, page 4
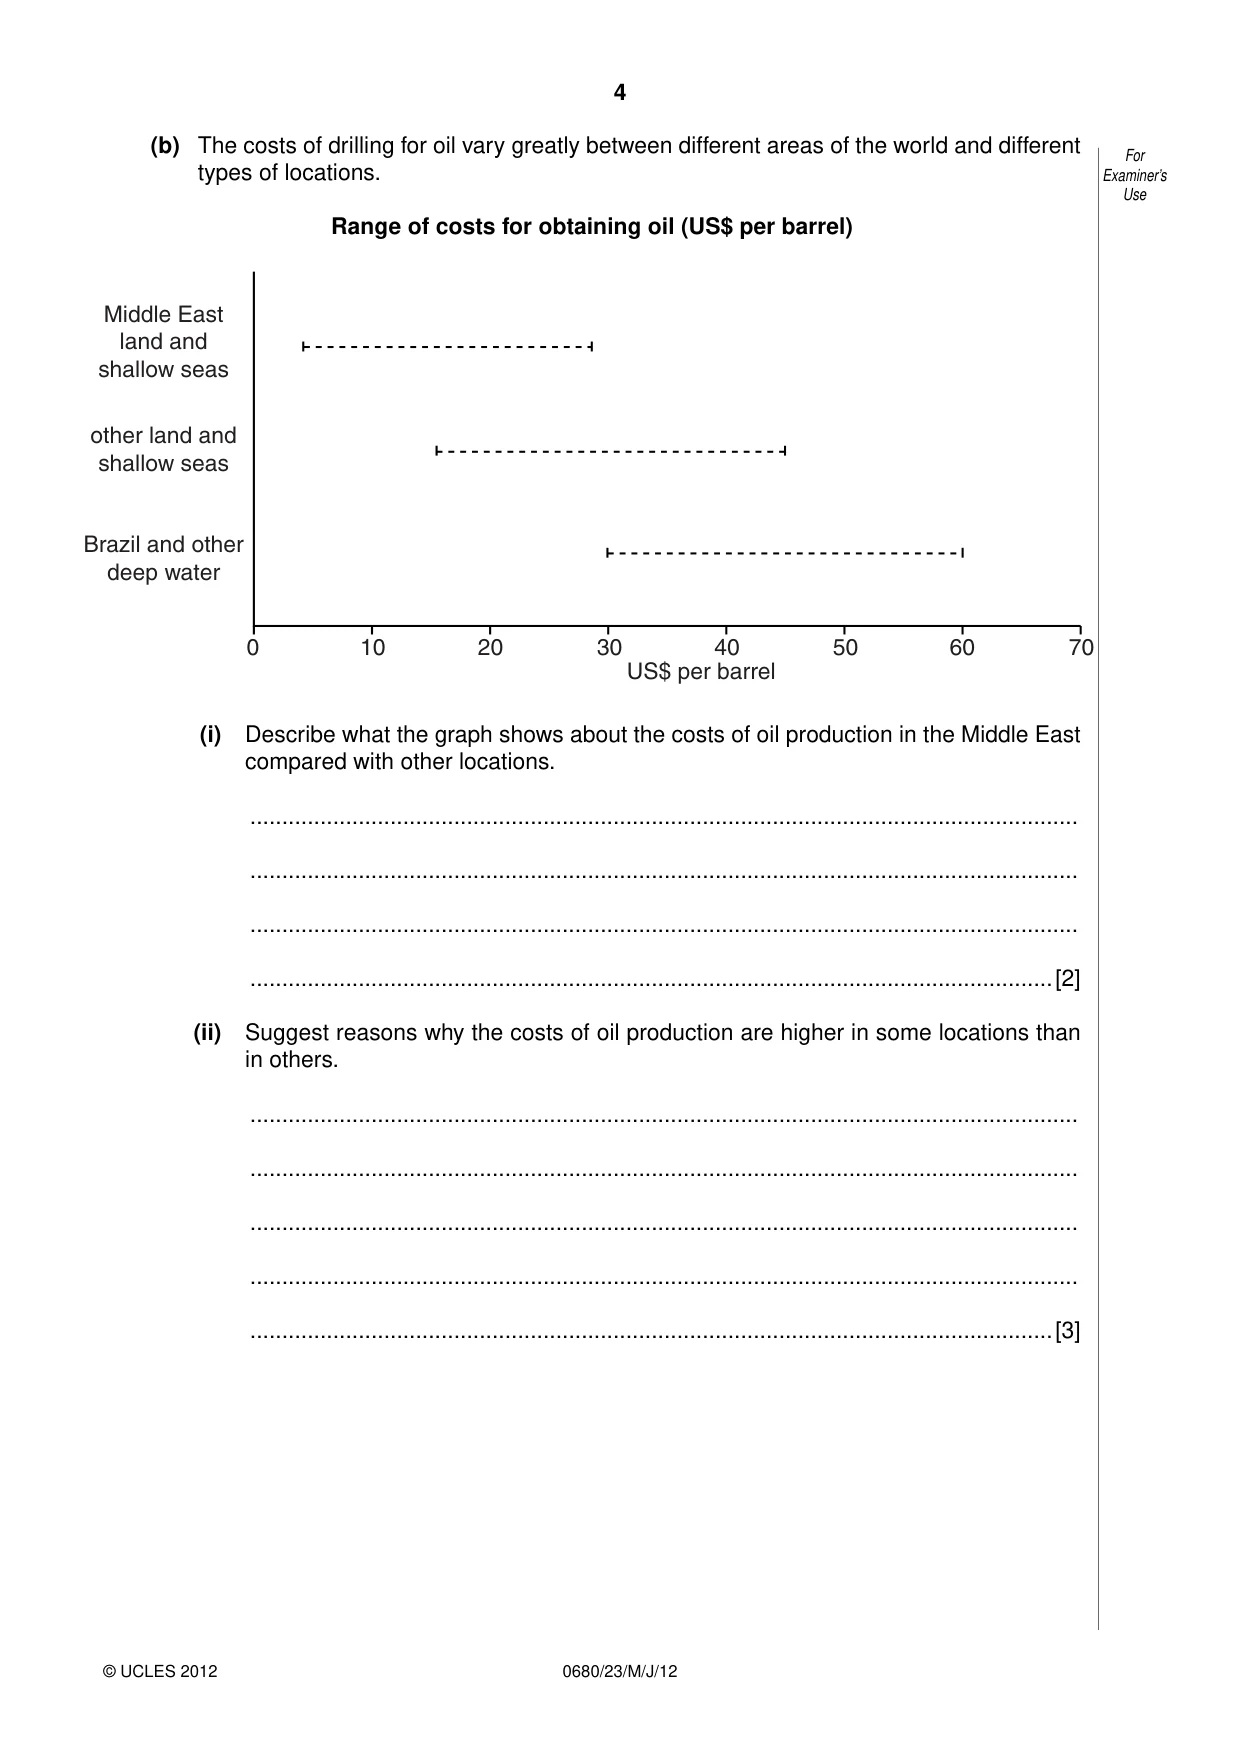
4 0680/23/M/J/12 © UCLES 2012 For Examiner’s Use (b) The costs of drilling for oil vary greatly between different areas of the world and different types of locations. Range of costs for obtaining oil (US$ per barrel) 0 10 20 30 40 US$ per barrel 50 60 70 Middle East land and shallow seas other land and shallow seas Brazil and other deep water (i) Describe what the graph shows about the costs of oil production in the Middle East compared with other locations. … … … …[2] (ii) Suggest reasons why the costs of oil production are higher in some locations than in others. … … … … …[3]
Question paper, page 5
5 0680/23/M/J/12 © UCLES 2012 [Turn over BLANK PAGE
Question paper, page 6
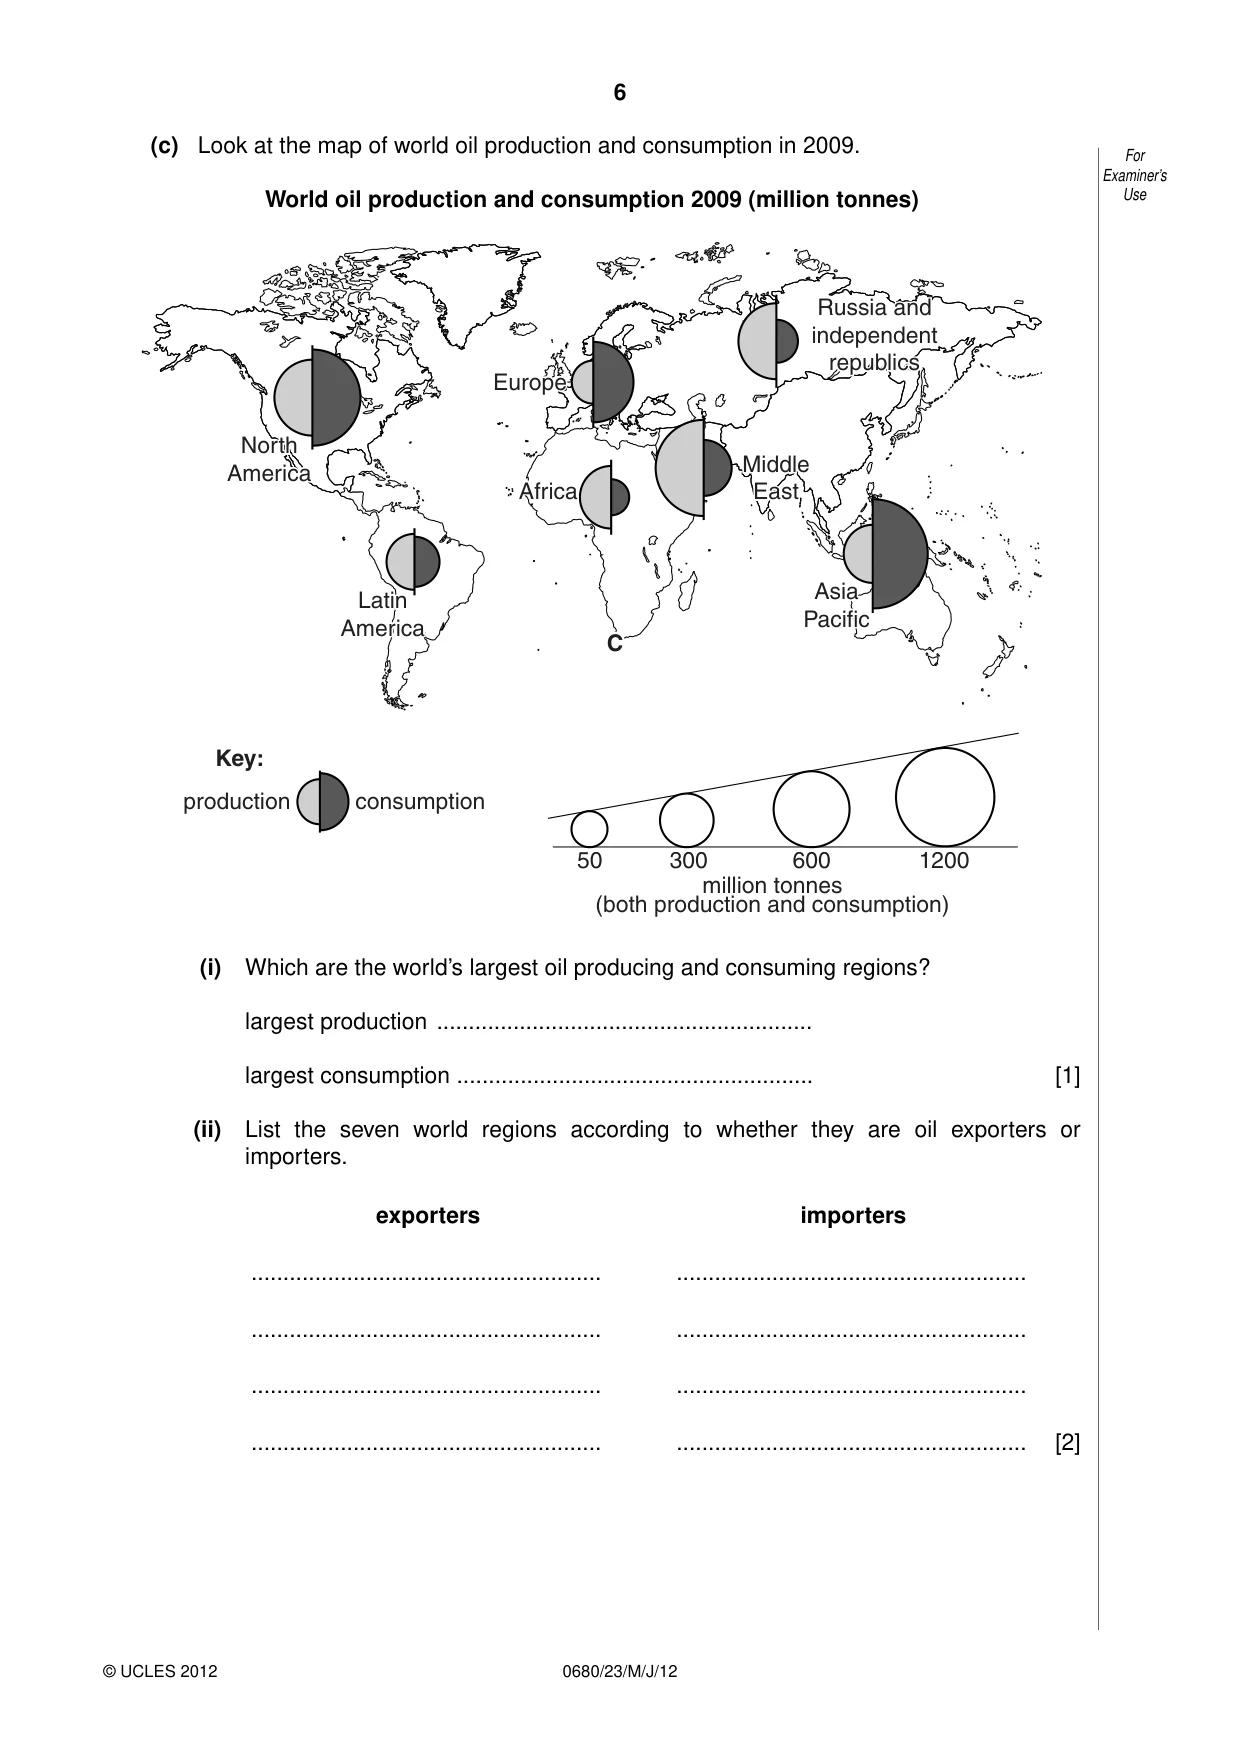
6 0680/23/M/J/12 © UCLES 2012 For Examiner’s Use (c) Look at the map of world oil production and consumption in 2009. World oil production and consumption 2009 (million tonnes) Europe Russia and independent republics Asia Pacific Africa Middle East North America Latin America Key: C consumption 50 300 600 million tonnes (both production and consumption) 1200 production (i) Which are the world’s largest oil producing and consuming regions? largest production … largest consumption … [1] (ii) List the seven world regions according to whether they are oil exporters or importers. exporters importers [2] … … … … … … … …
Question paper, page 7
7 0680/23/M/J/12 © UCLES 2012 [Turn over For Examiner’s Use (iii) Why is world trade in oil so great? … … … … …[3] (iv) Many large supertankers carrying up to 500 000 tonnes of crude oil follow the Cape route around South Africa (marked C on the world map). Explain why this is one of the world’s busiest tanker routes. … … … …[2]
Question paper, page 8
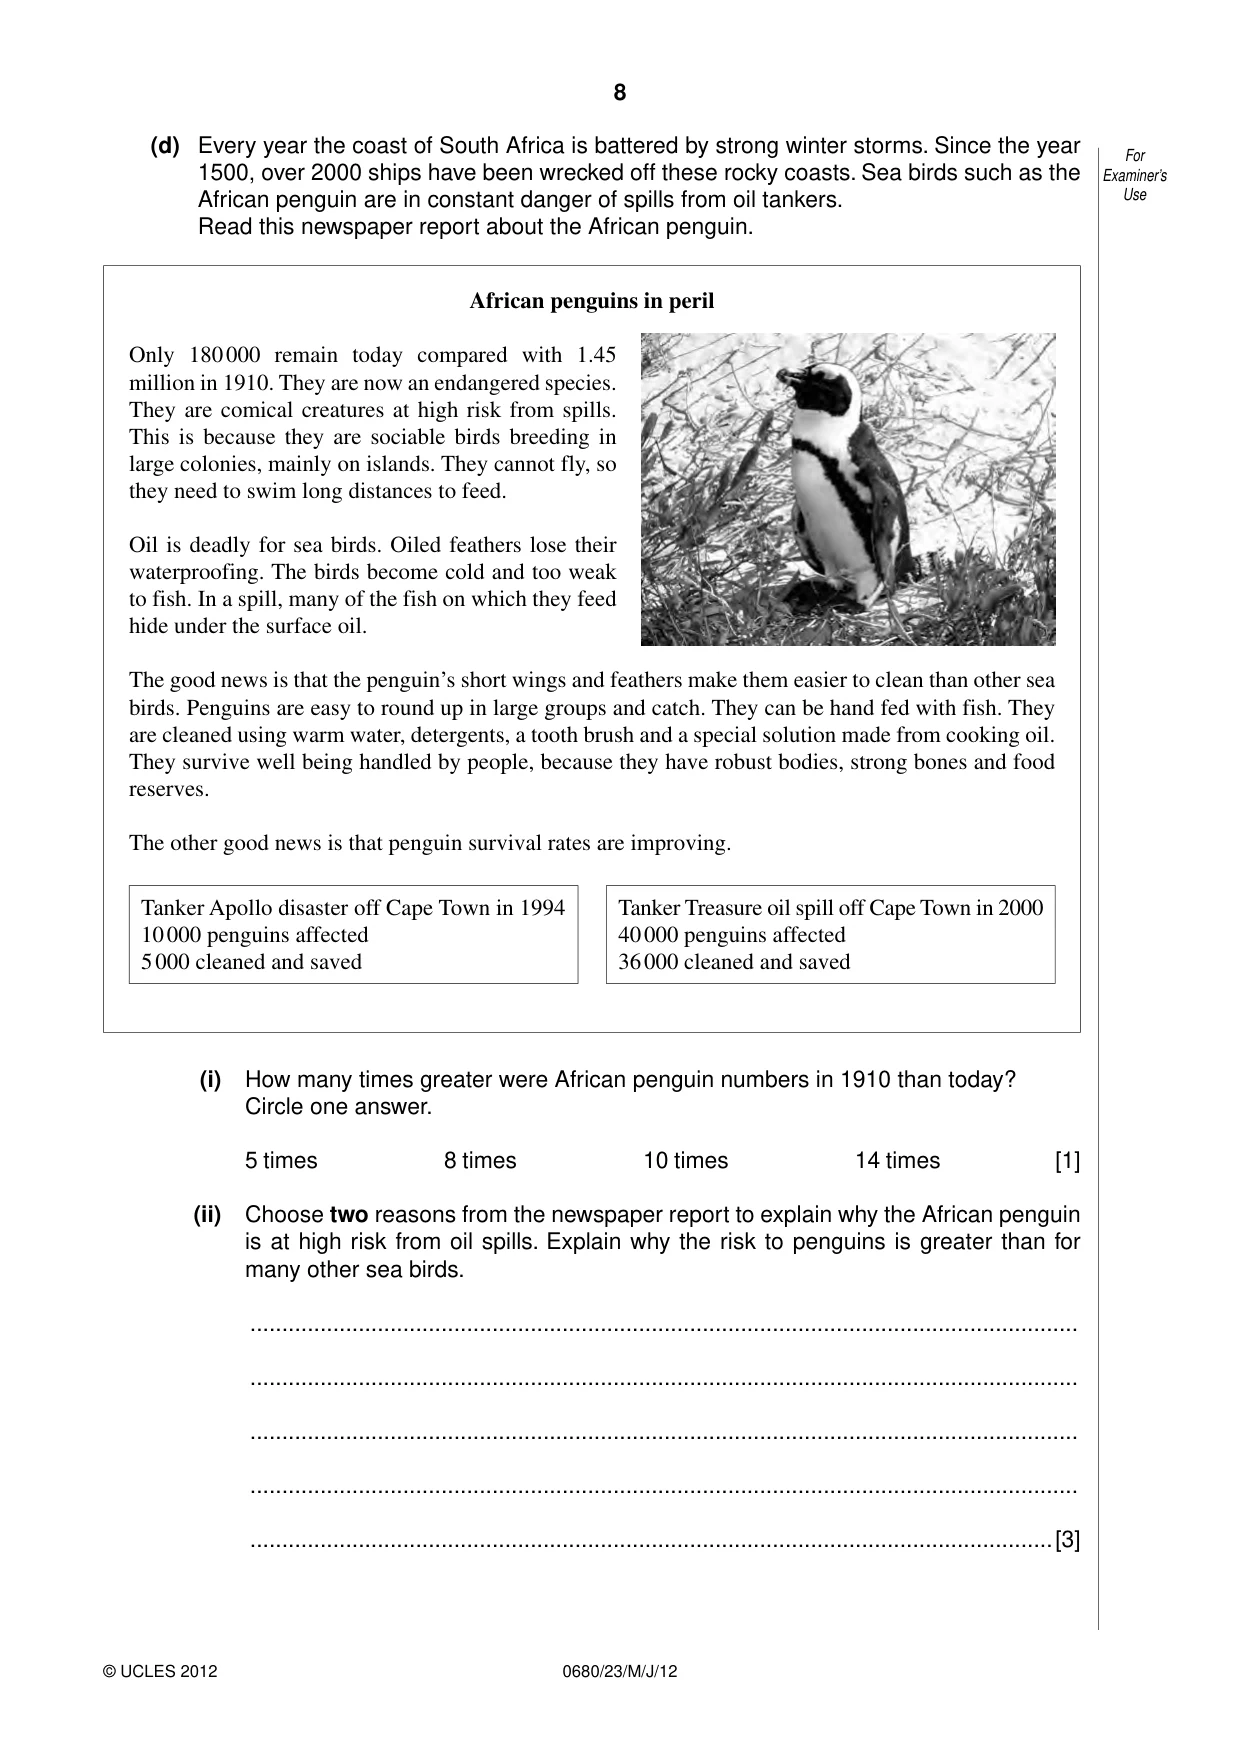
8 0680/23/M/J/12 © UCLES 2012 For Examiner’s Use (d) Every year the coast of South Africa is battered by strong winter storms. Since the year 1500, over 2000 ships have been wrecked off these rocky coasts. Sea birds such as the African penguin are in constant danger of spills from oil tankers. Read this newspaper report about the African penguin. African penguins in peril Only 180 000 remain today compared with 1.45 million in 1910. They are now an endangered species. They are comical creatures at high risk from spills. This is because they are sociable birds breeding in large colonies, mainly on islands. They cannot fly, so they need to swim long distances to feed. Oil is deadly for sea birds. Oiled feathers lose their waterproofing. The birds become cold and too weak to fish. In a spill, many of the fish on which they feed hide under the surface oil. The good news is that the penguin’s short wings and feathers make them easier to clean than other sea birds. Penguins are easy to round up in large groups and catch. They can be hand fed with fish. They are cleaned using warm water, detergents, a tooth brush and a special solution made from cooking oil. They survive well being handled by people, because they have robust bodies, strong bones and food reserves. The other good news is that penguin survival rates are improving. Tanker Apollo disaster off Cape Town in 1994 10 000 penguins affected 5 000 cleaned and saved Tanker Treasure oil spill off Cape Town in 2000 40 000 penguins affected 36 000 cleaned and saved (i) How many times greater were African penguin numbers in 1910 than today? Circle one answer. 5 times 8 times 10 times 14 times [1] (ii) Choose two reasons from the newspaper report to explain why the African penguin is at high risk from oil spills. Explain why the risk to penguins is greater than for many other sea birds. … … … … …[3]
Question paper, page 9
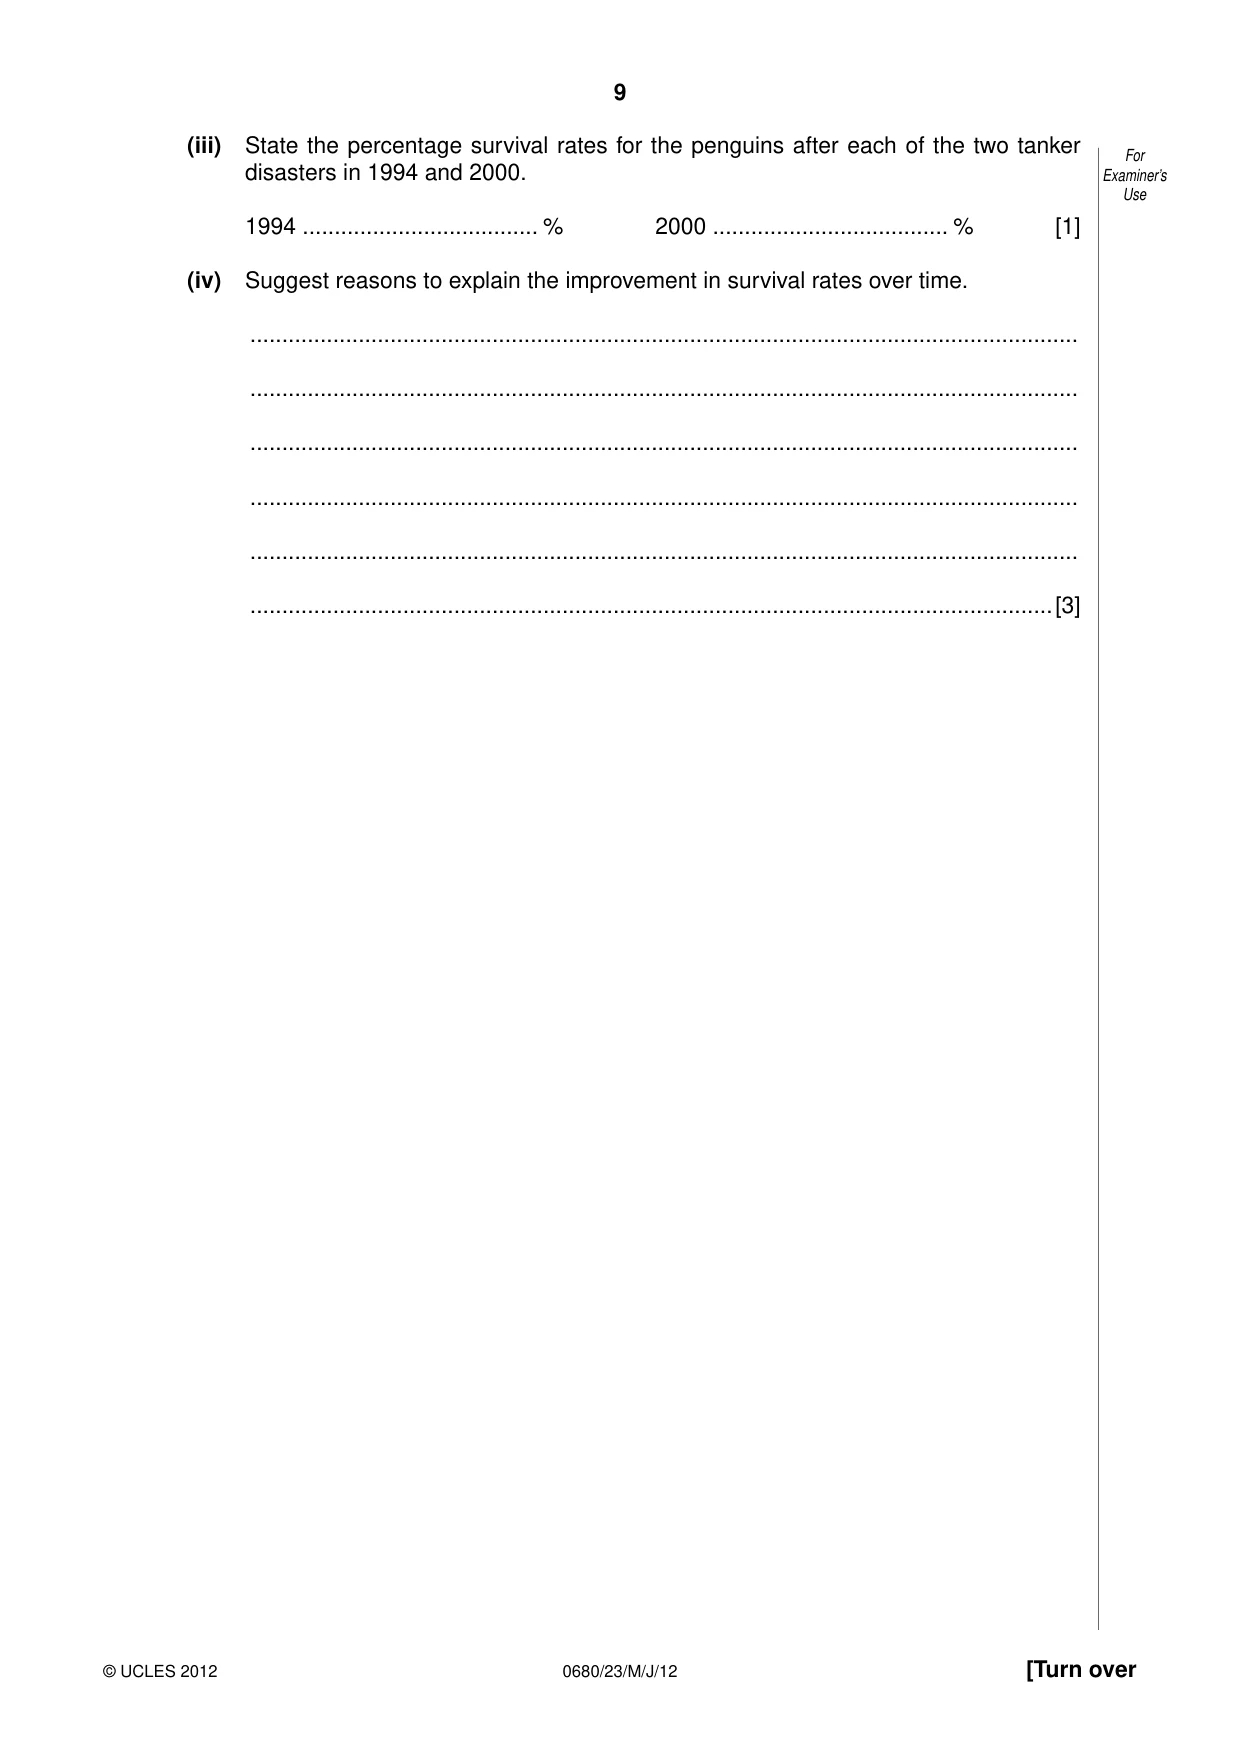
9 0680/23/M/J/12 © UCLES 2012 [Turn over For Examiner’s Use (iii) State the percentage survival rates for the penguins after each of the two tanker disasters in 1994 and 2000. 1994 … % 2000 … % [1] (iv) Suggest reasons to explain the improvement in survival rates over time. … … … … … …[3]
Question paper, page 10
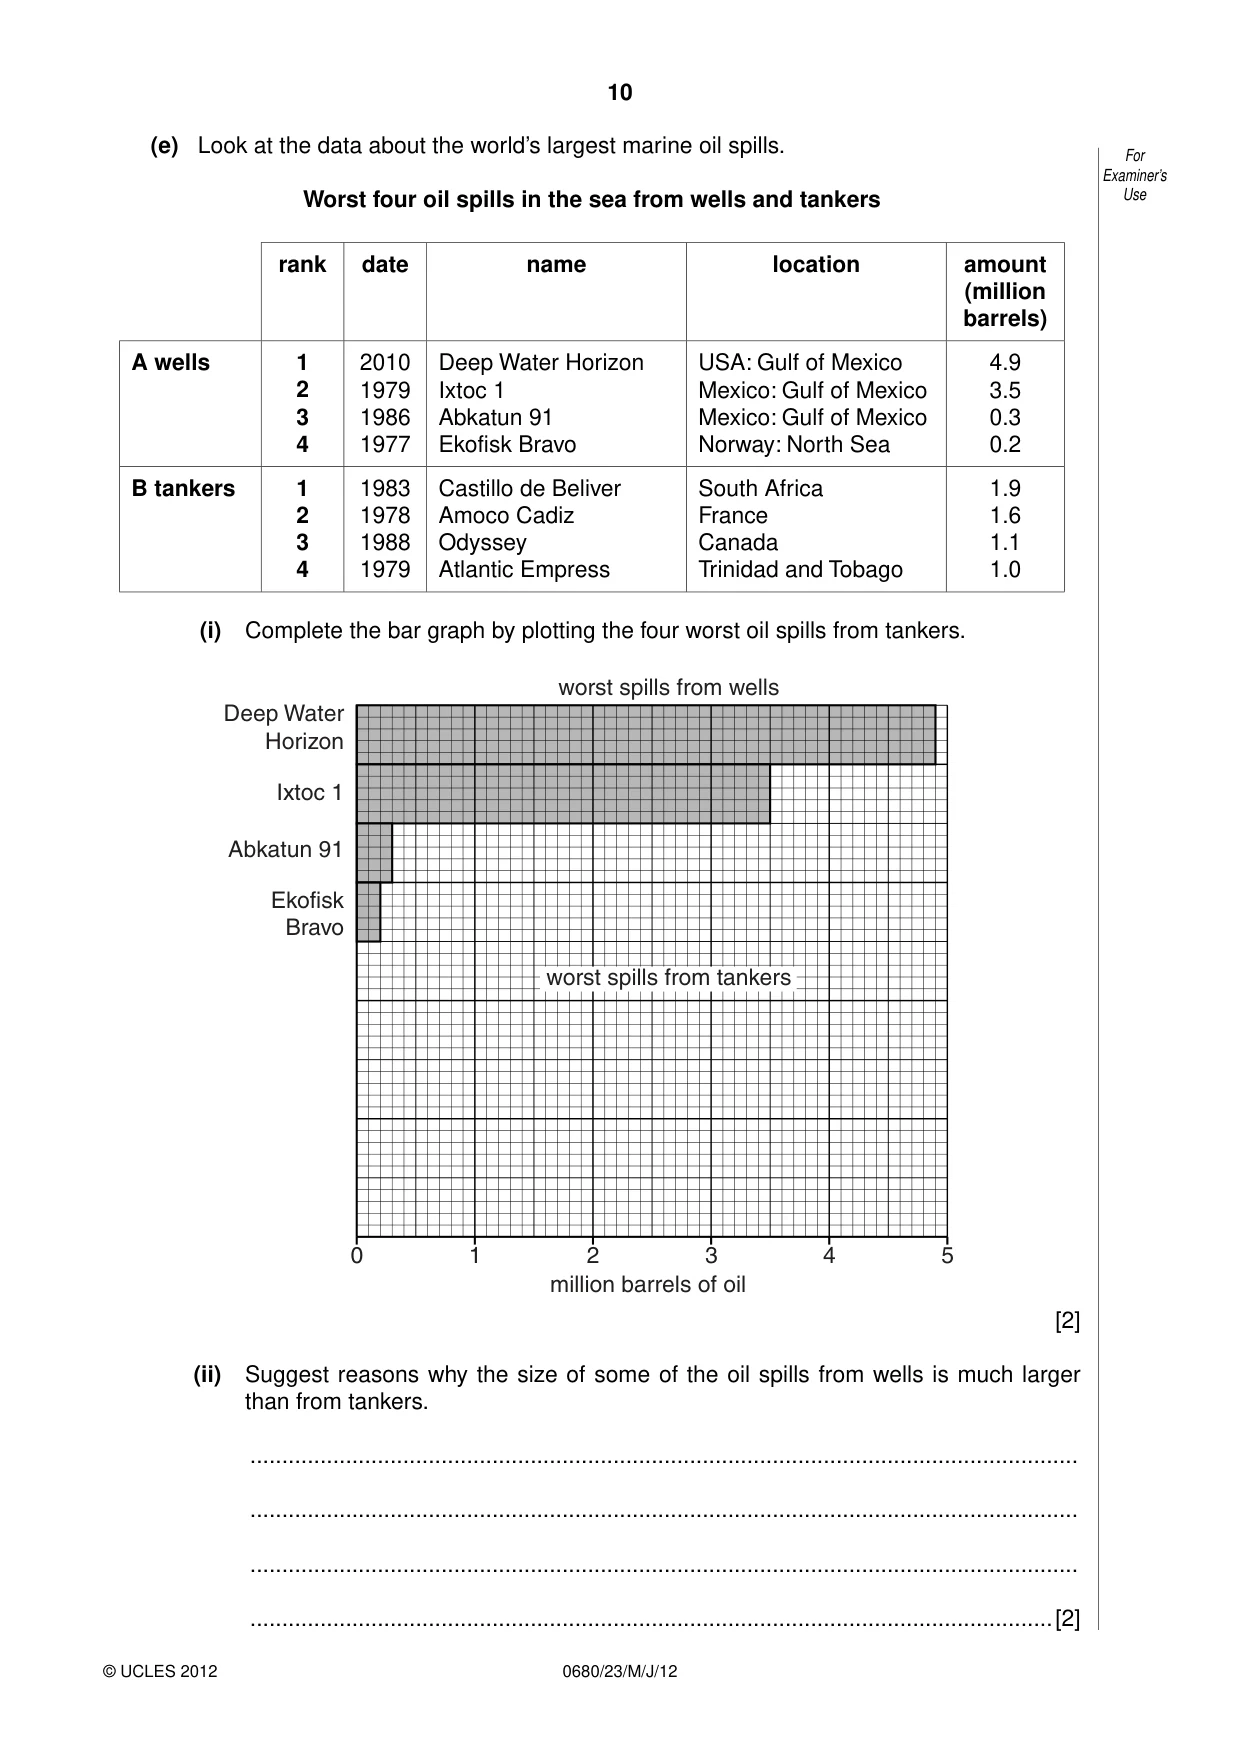
10 0680/23/M/J/12 © UCLES 2012 For Examiner’s Use (e) Look at the data about the world’s largest marine oil spills. Worst four oil spills in the sea from wells and tankers rank date name location amount (million barrels) A wells 1 2 3 4 2010 1979 1986 1977 Deep Water Horizon Ixtoc 1 Abkatun 91 Ekofisk Bravo USA: Gulf of Mexico Mexico: Gulf of Mexico Mexico: Gulf of Mexico Norway: North Sea 4.9 3.5 0.3 0.2 B tankers 1 2 3 4 1983 1978 1988 1979 Castillo de Beliver Amoco Cadiz Odyssey Atlantic Empress South Africa France Canada Trinidad and Tobago 1.9 1.6 1.1 1.0 (i) Complete the bar graph by plotting the four worst oil spills from tankers. 0 1 2 3 million barrels of oil 4 5 Deep Water Horizon worst spills from wells Ixtoc 1 Abkatun 91 Ekofisk Bravo worst spills from tankers [2] (ii) Suggest reasons why the size of some of the oil spills from wells is much larger than from tankers. … … … …[2]
Question paper, page 11
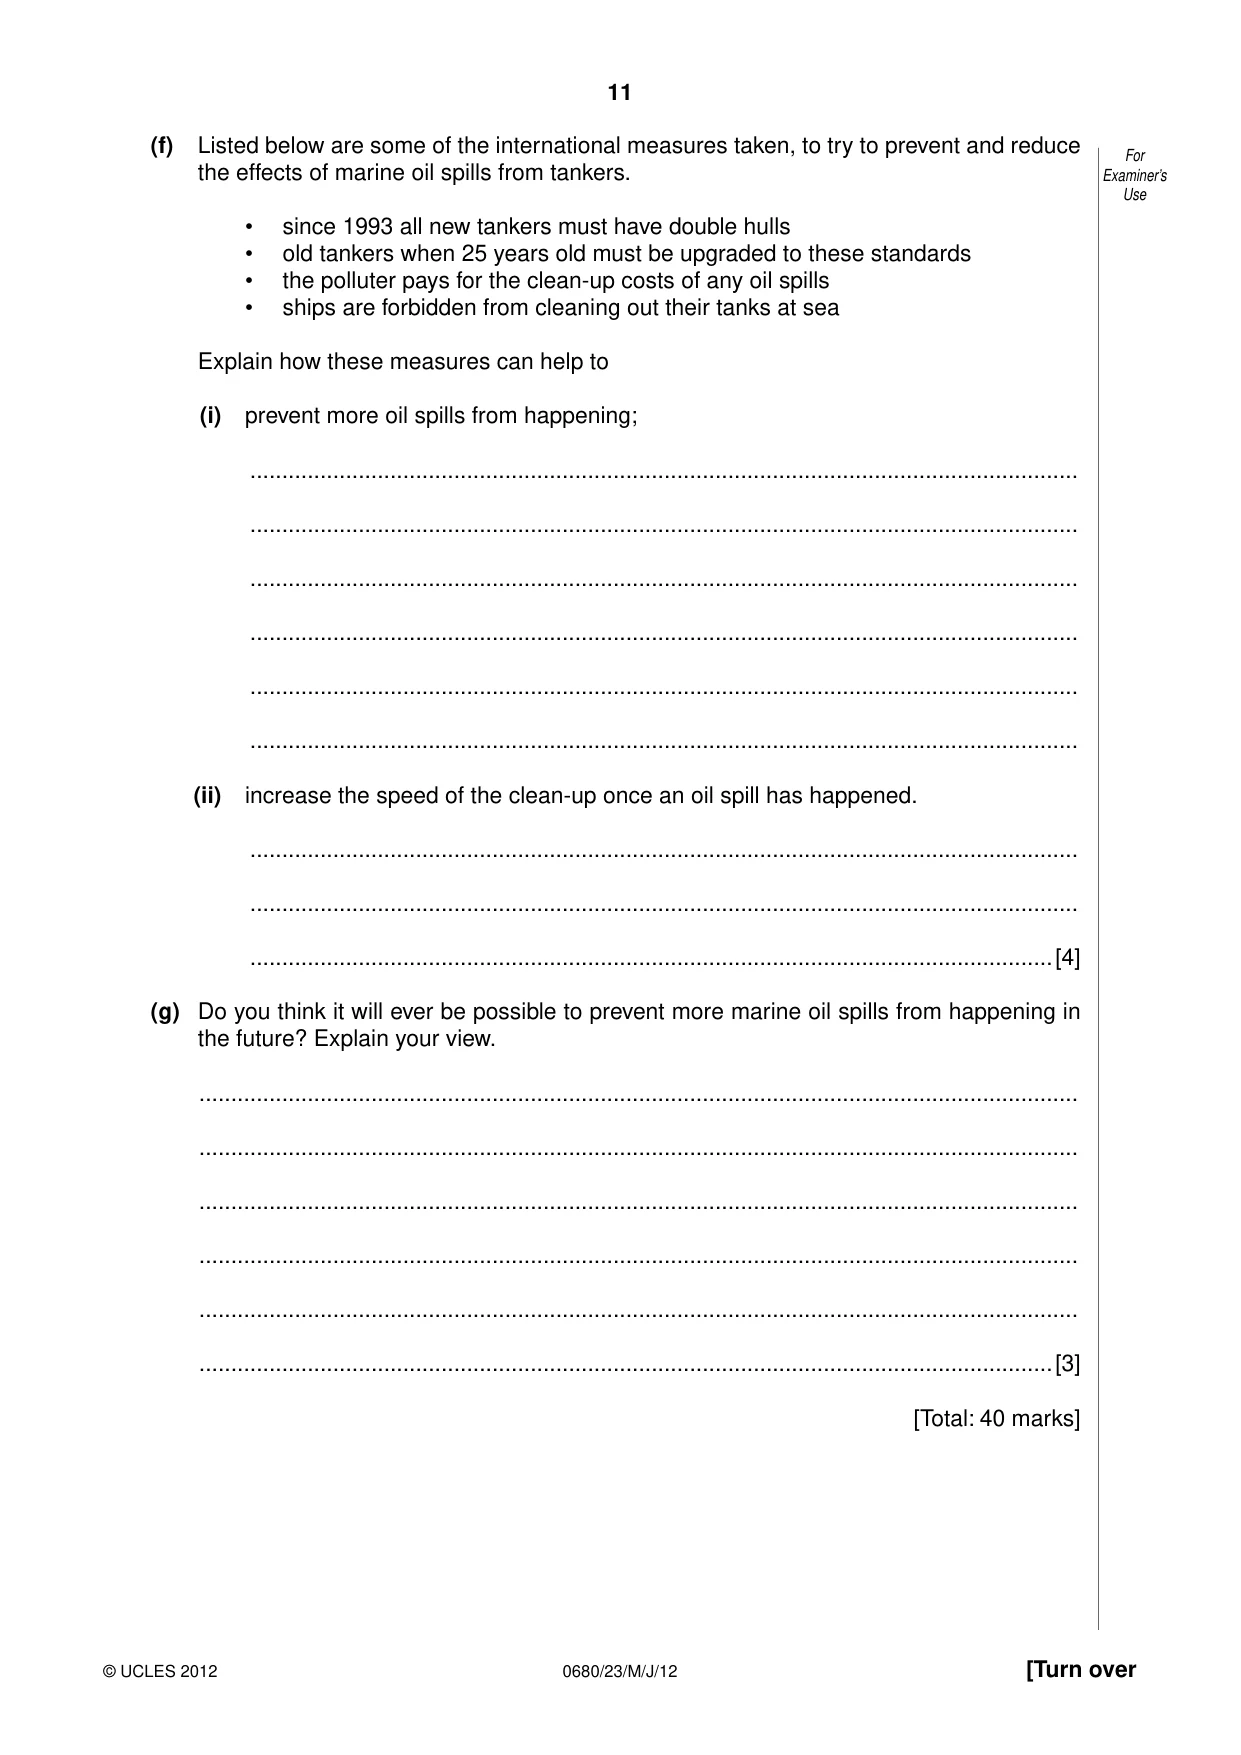
11 0680/23/M/J/12 © UCLES 2012 [Turn over For Examiner’s Use (f) Listed below are some of the international measures taken, to try to prevent and reduce the effects of marine oil spills from tankers. • since 1993 all new tankers must have double hulls • old tankers when 25 years old must be upgraded to these standards • the polluter pays for the clean-up costs of any oil spills • ships are forbidden from cleaning out their tanks at sea Explain how these measures can help to (i) prevent more oil spills from happening; … … … … … … (ii) increase the speed of the clean-up once an oil spill has happened. … … …[4] (g) Do you think it will ever be possible to prevent more marine oil spills from happening in the future? Explain your view. … … … … … …[3] [Total: 40 marks]
Question paper, page 12
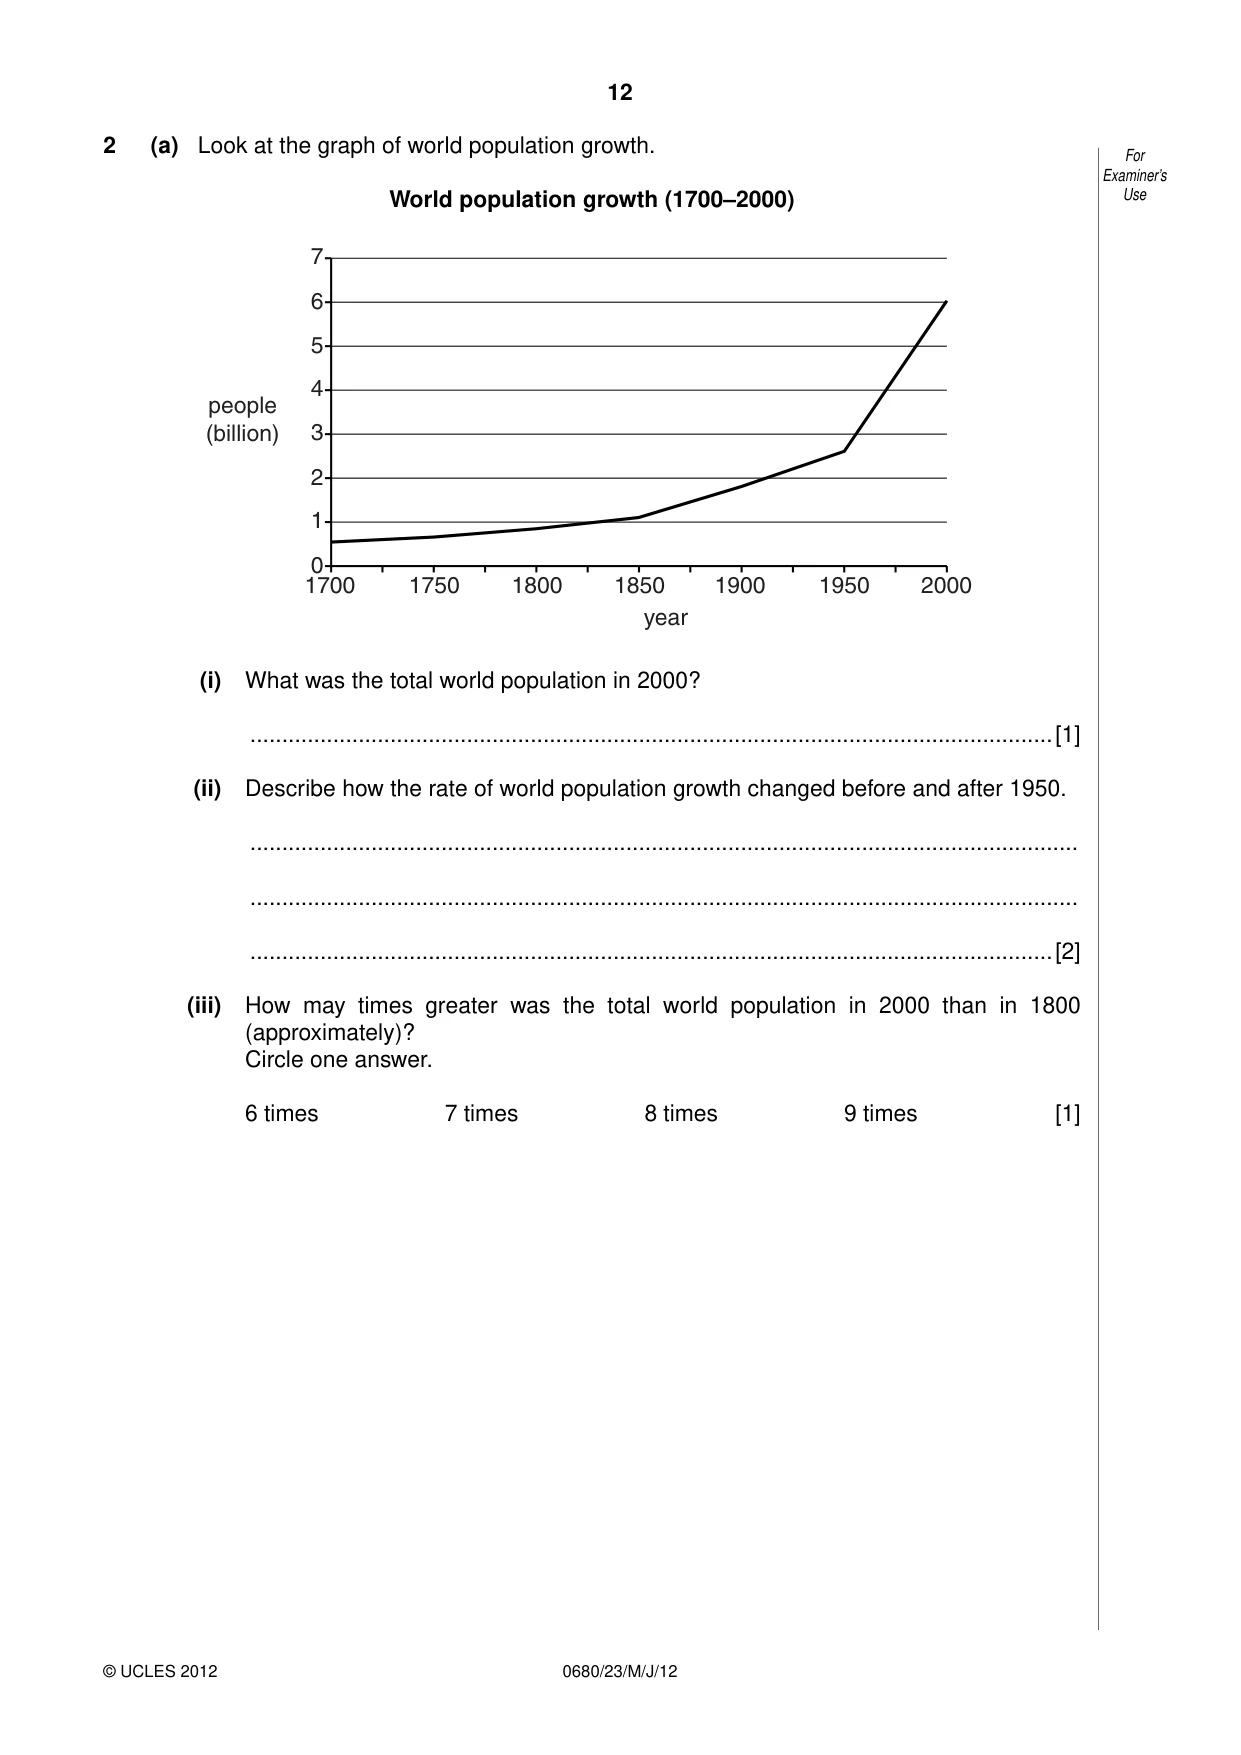
12 0680/23/M/J/12 © UCLES 2012 For Examiner’s Use 2 (a) Look at the graph of world population growth. World population growth (1700–2000) 7 6 5 4 3 2 1 0 1700 1750 1800 1850 year people (billion) 1900 1950 2000 (i) What was the total world population in 2000? …[1] (ii) Describe how the rate of world population growth changed before and after 1950. … … …[2] (iii) How may times greater was the total world population in 2000 than in 1800 (approximately)? Circle one answer. 6 times 7 times 8 times 9 times [1]
Question paper, page 13
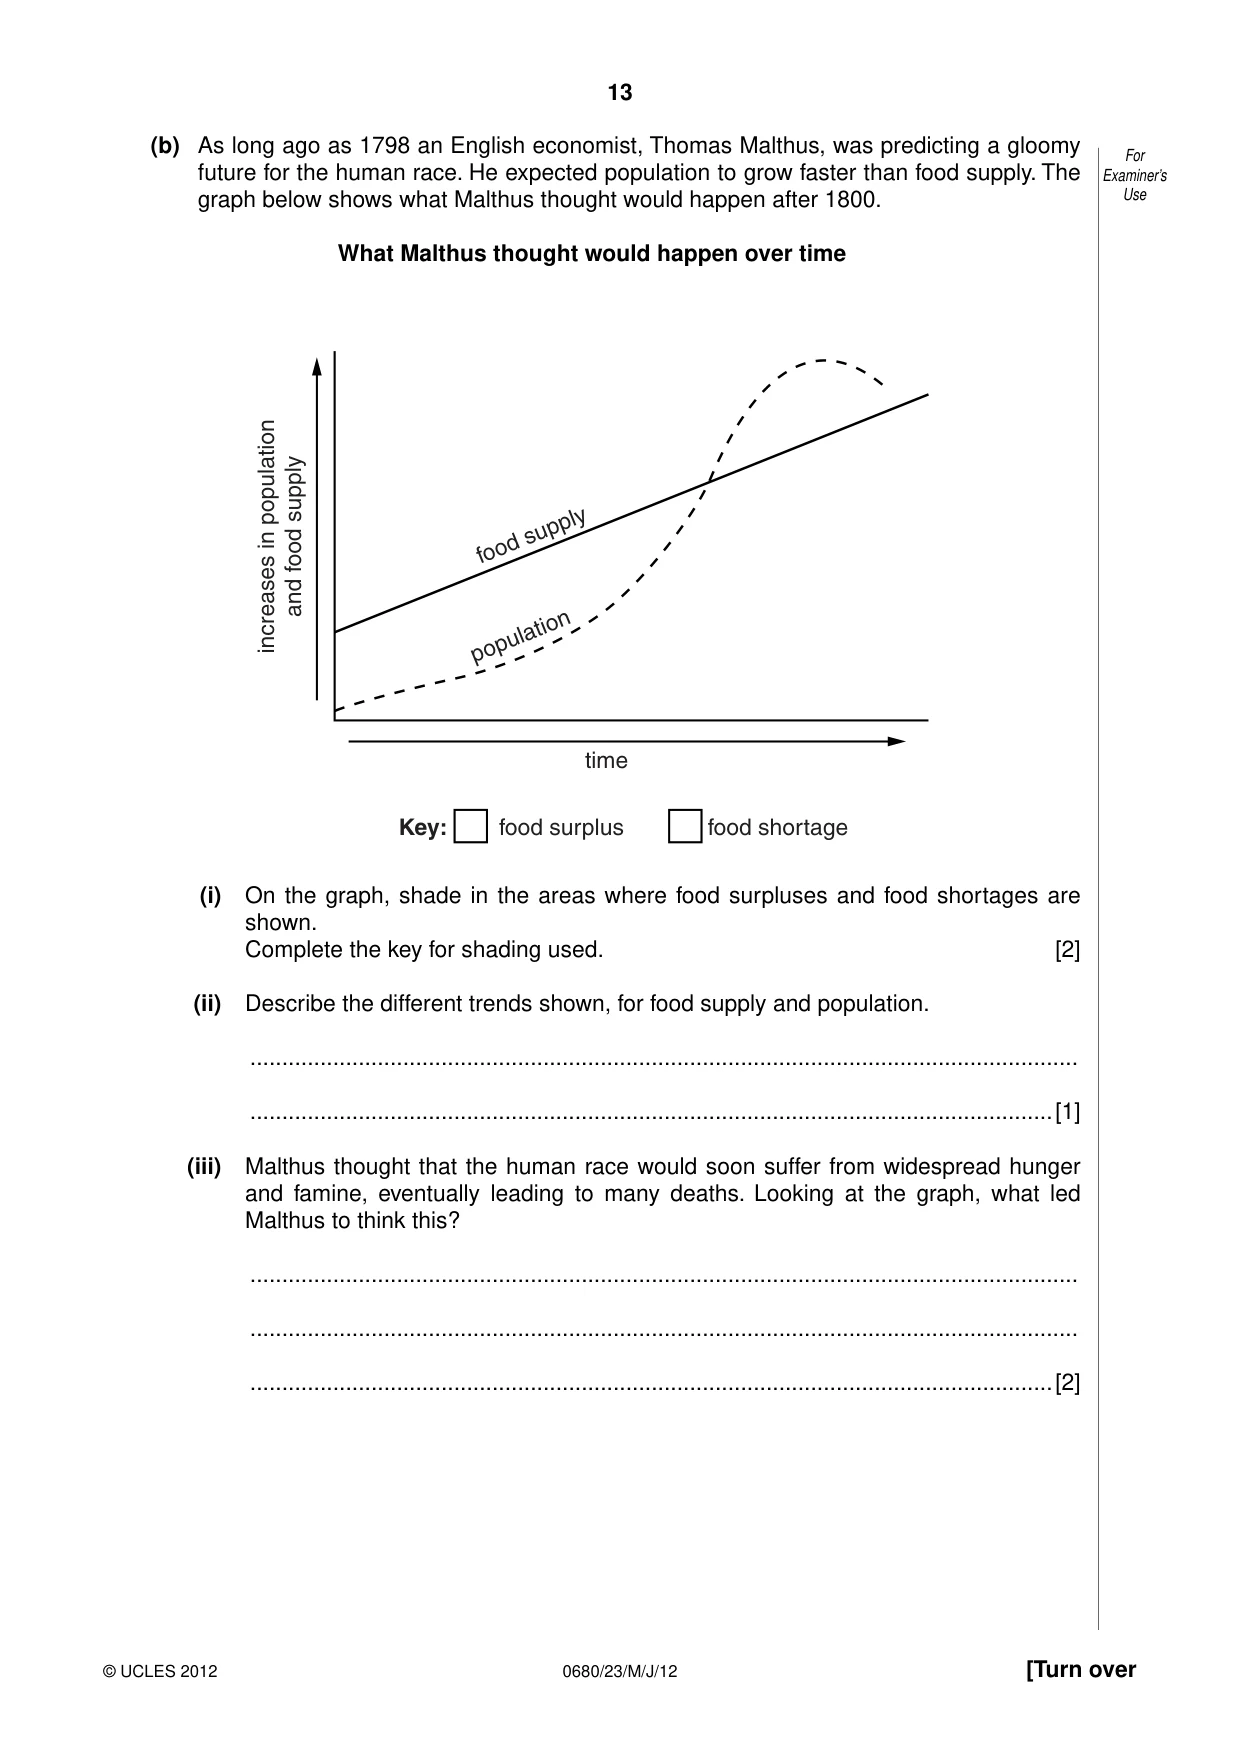
13 0680/23/M/J/12 © UCLES 2012 [Turn over For Examiner’s Use (b) As long ago as 1798 an English economist, Thomas Malthus, was predicting a gloomy future for the human race. He expected population to grow faster than food supply. The graph below shows what Malthus thought would happen after 1800. What Malthus thought would happen over time time food supply population increases in population and food supply food surplus Key: food shortage (i) On the graph, shade in the areas where food surpluses and food shortages are shown. Complete the key for shading used. [2] (ii) Describe the different trends shown, for food supply and population. … …[1] (iii) Malthus thought that the human race would soon suffer from widespread hunger and famine, eventually leading to many deaths. Looking at the graph, what led Malthus to think this? … … …[2]
Question paper, page 14
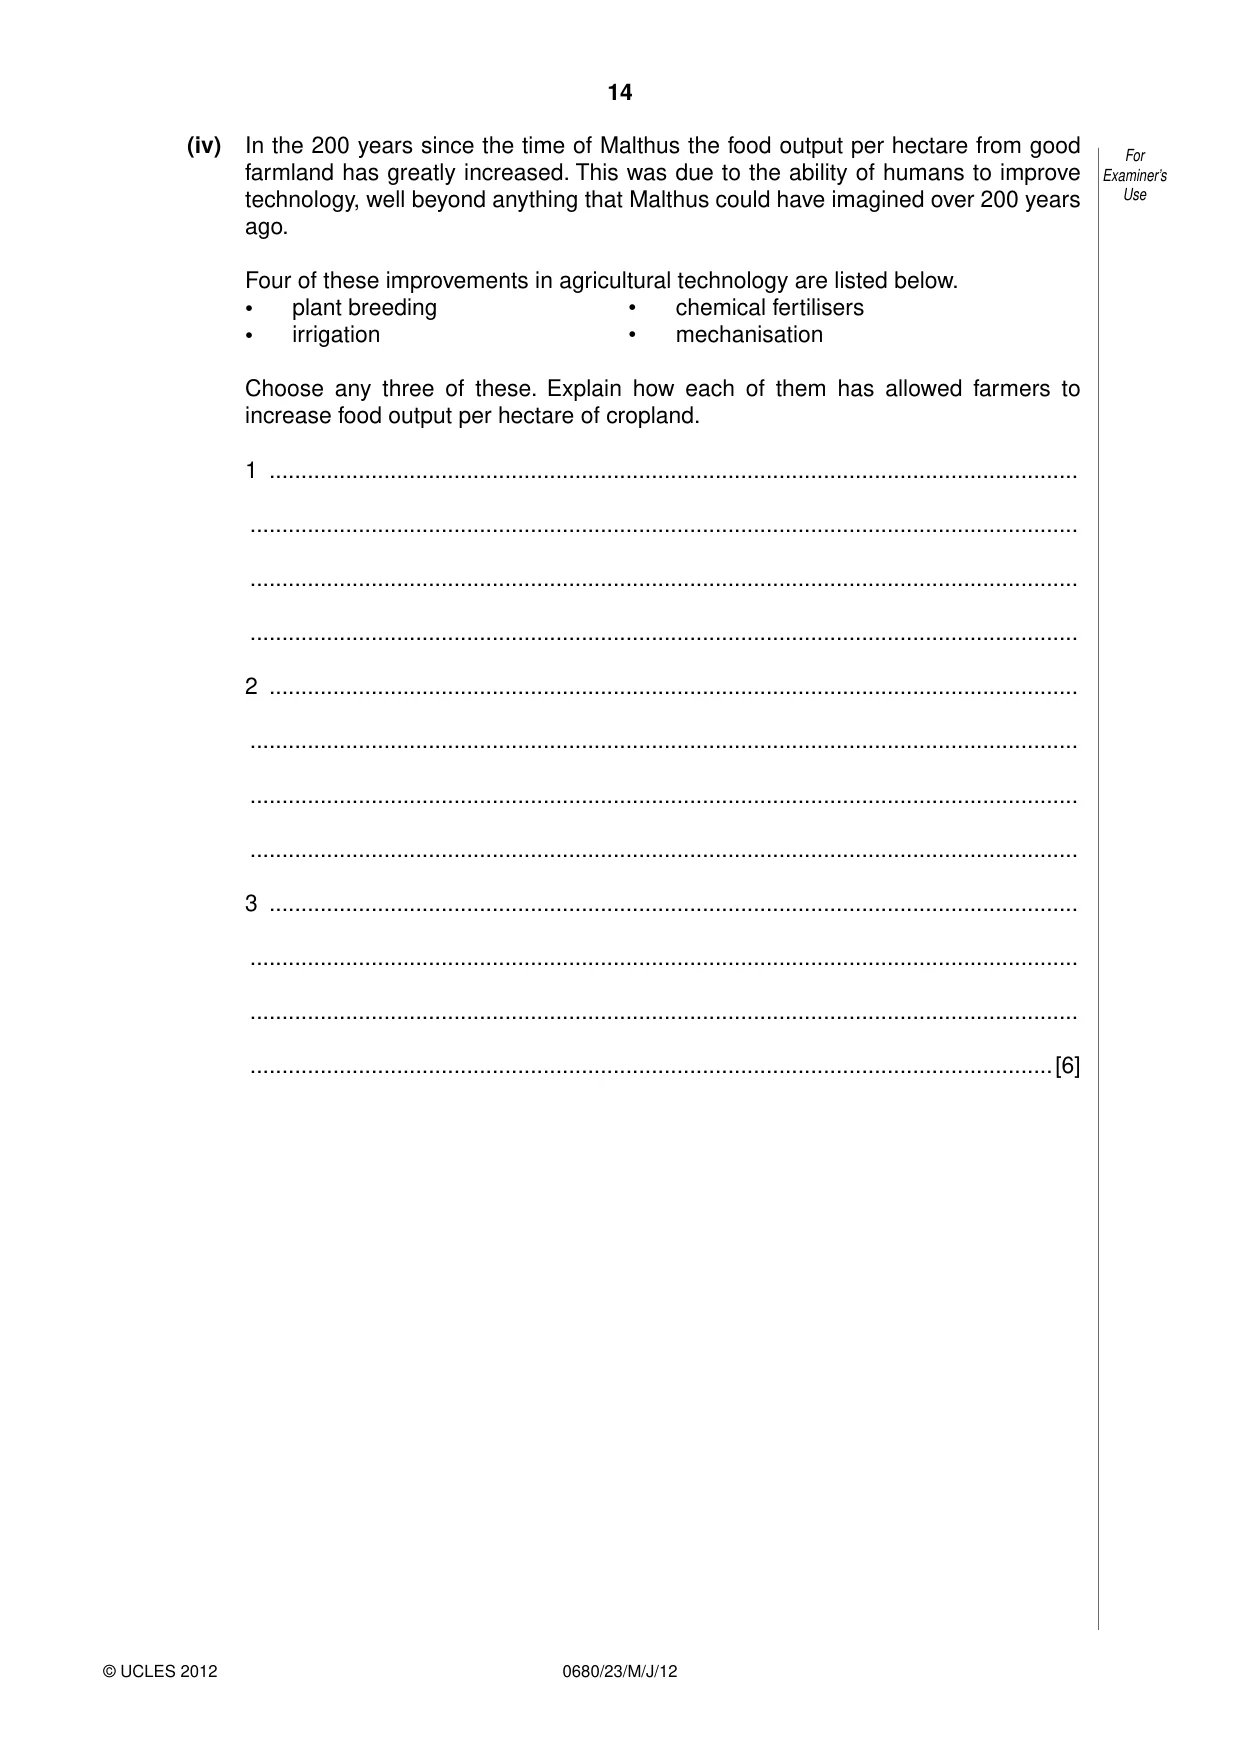
14 0680/23/M/J/12 © UCLES 2012 For Examiner’s Use (iv) In the 200 years since the time of Malthus the food output per hectare from good farmland has greatly increased. This was due to the ability of humans to improve technology, well beyond anything that Malthus could have imagined over 200 years ago. Four of these improvements in agricultural technology are listed below. • plant breeding • chemical fertilisers • irrigation • mechanisation Choose any three of these. Explain how each of them has allowed farmers to increase food output per hectare of cropland. 1 … … … … 2 … … … … 3 … … … …[6]
Question paper, page 15
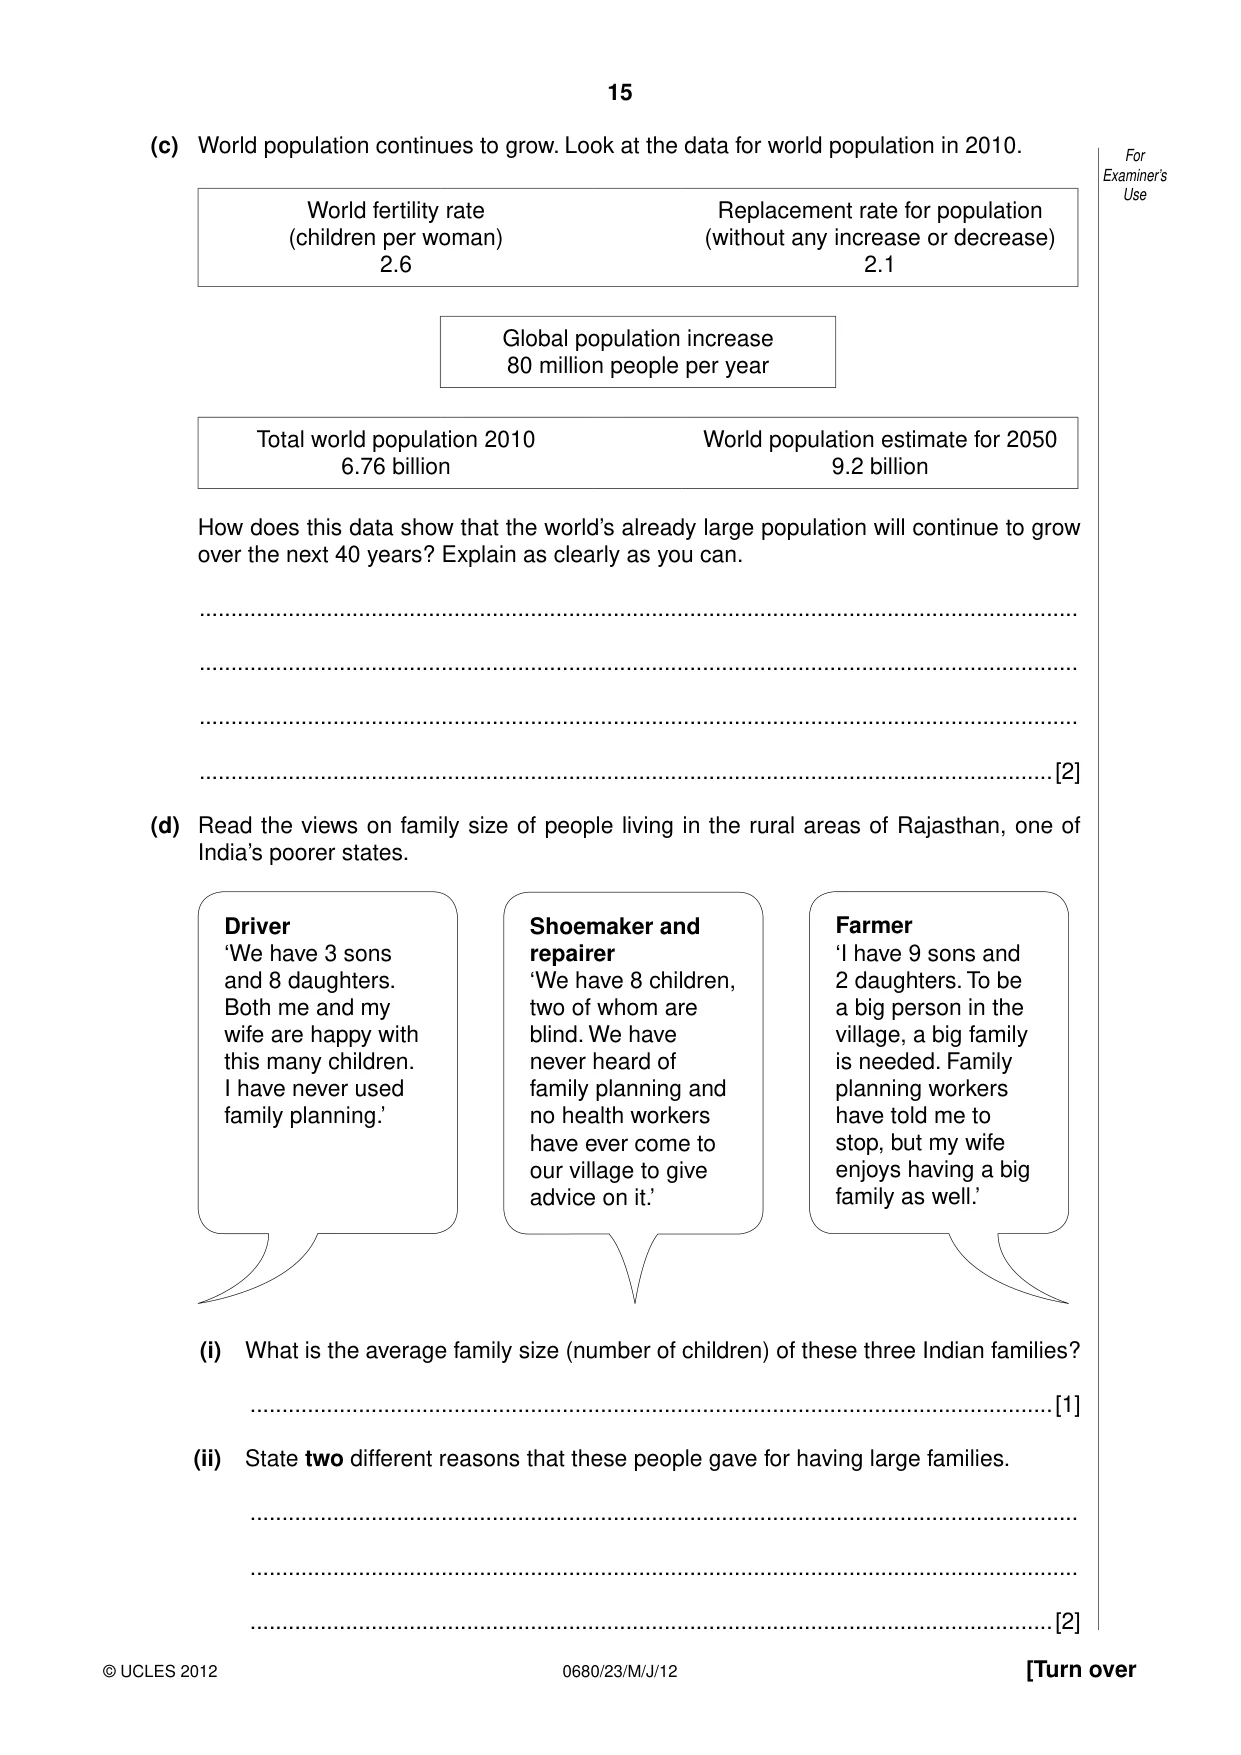
15 0680/23/M/J/12 © UCLES 2012 [Turn over For Examiner’s Use (c) World population continues to grow. Look at the data for world population in 2010. World fertility rate (children per woman) 2.6 Replacement rate for population (without any increase or decrease) 2.1 Global population increase 80 million people per year Total world population 2010 6.76 billion World population estimate for 2050 9.2 billion How does this data show that the world’s already large population will continue to grow over the next 40 years? Explain as clearly as you can. … … … …[2] (d) Read the views on family size of people living in the rural areas of Rajasthan, one of India’s poorer states. Driver ‘We have 3 sons and 8 daughters. Both me and my wife are happy with this many children. I have never used family planning.’ Shoemaker and repairer ‘We have 8 children, two of whom are blind. We have never heard of family planning and no health workers have ever come to our village to give advice on it.’ Farmer ‘I have 9 sons and 2 daughters. To be a big person in the village, a big family is needed. Family planning workers have told me to stop, but my wife enjoys having a big family as well.’ (i) What is the average family size (number of children) of these three Indian families? …[1] (ii) State two different reasons that these people gave for having large families. … … …[2]
Question paper, page 16
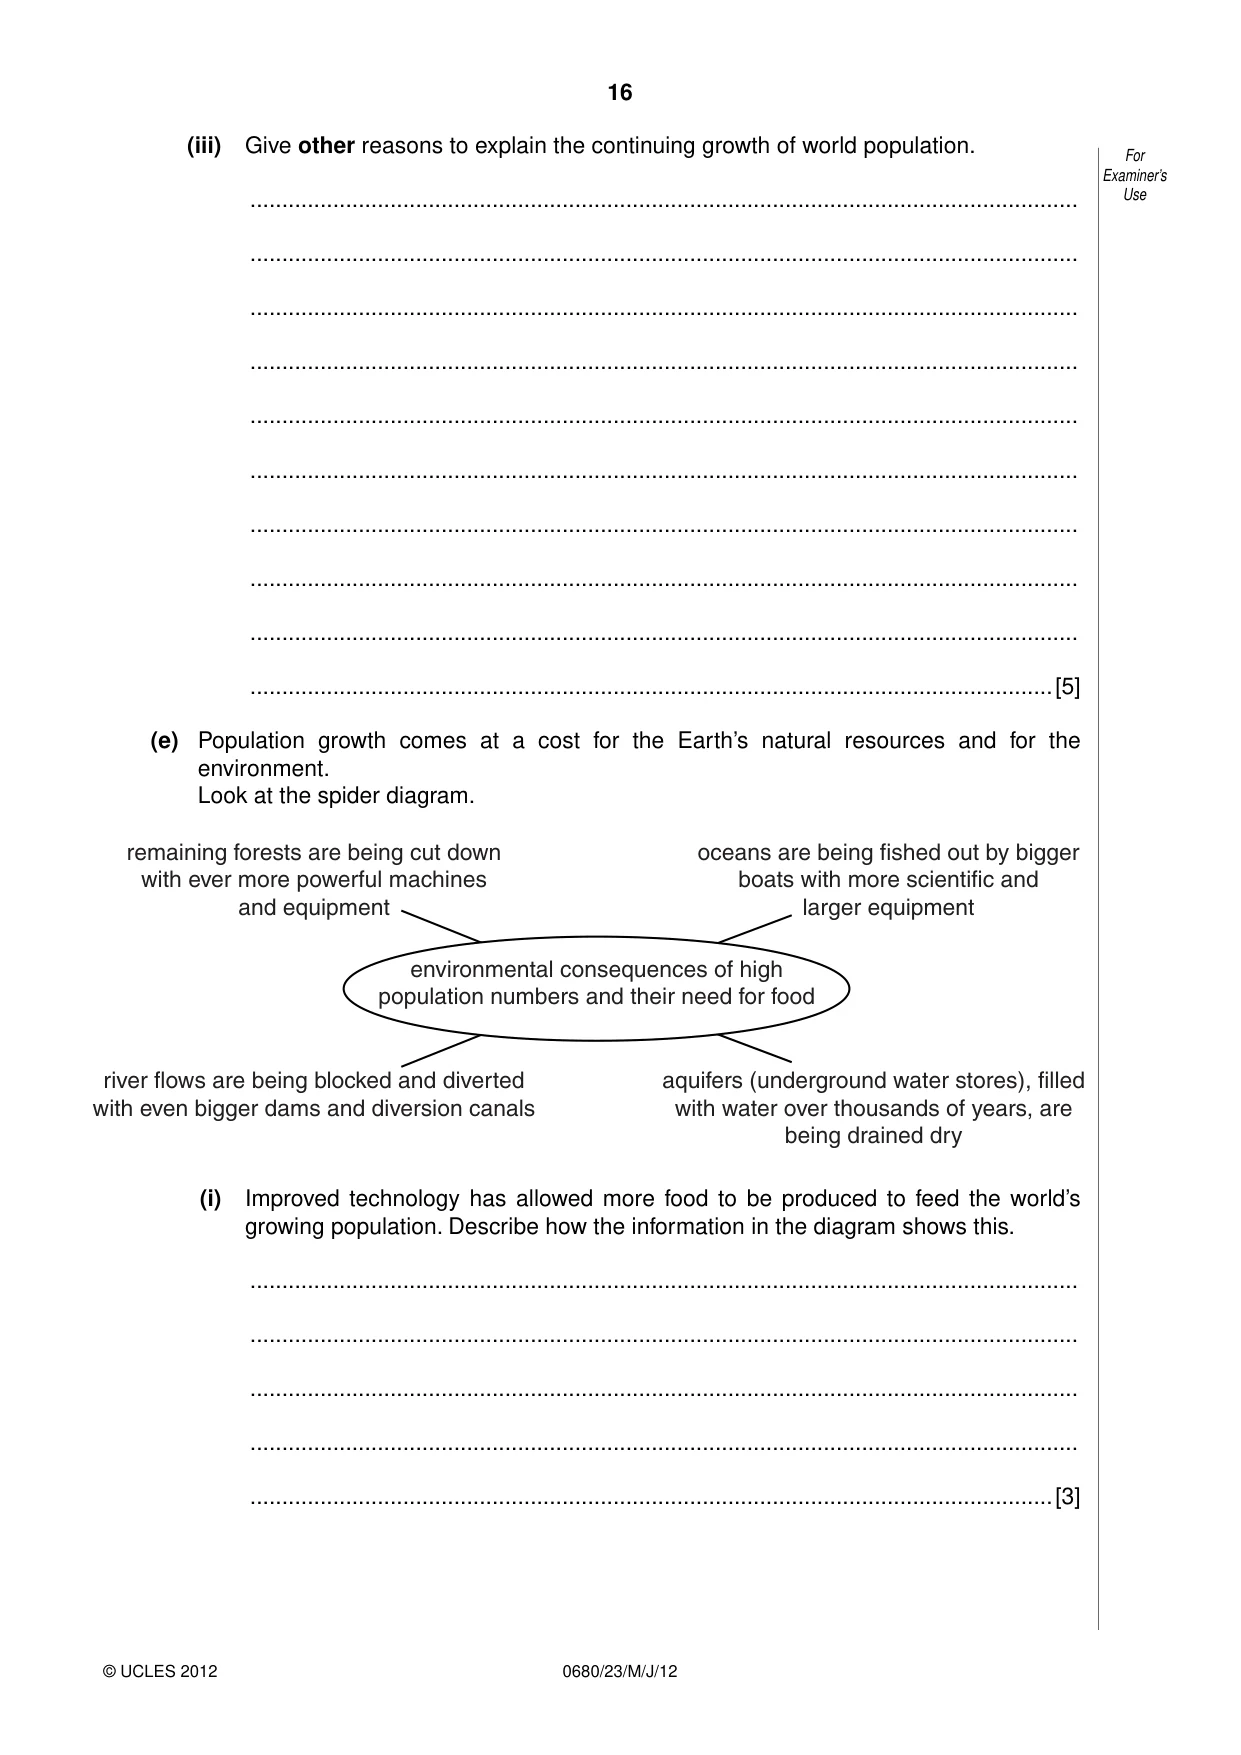
16 0680/23/M/J/12 © UCLES 2012 For Examiner’s Use (iii) Give other reasons to explain the continuing growth of world population. … … … … … … … … … …[5] (e) Population growth comes at a cost for the Earth’s natural resources and for the environment. Look at the spider diagram. remaining forests are being cut down with ever more powerful machines and equipment oceans are being fished out by bigger boats with more scientific and larger equipment river flows are being blocked and diverted with even bigger dams and diversion canals aquifers (underground water stores), filled with water over thousands of years, are being drained dry environmental consequences of high population numbers and their need for food (i) Improved technology has allowed more food to be produced to feed the world’s growing population. Describe how the information in the diagram shows this. … … … … …[3]
Question paper, page 17
17 0680/23/M/J/12 © UCLES 2012 [Turn over For Examiner’s Use (ii) Why are the human actions and activities mentioned in the diagram unsustainable in the long-term? Explain as fully as you can. … … … … … … … … … …[5] (iii) Choose any two of the actions and activities named in the diagram. Describe how each one can be done in a more sustainable way, taking more account of the needs of future generations of people. 1 … … … … 2 … … … …[4]
Question paper, page 18
18 0680/23/M/J/12 © UCLES 2012 For Examiner’s Use (f) Could the gloomy view of Malthus in 1798 that the human race will suffer from widespread hunger, famine and deaths come true within the next 40 years – more than 200 years after he made his prediction? What do you think? Explain your views about this. … … … … … …[3] [Total: 40 marks]
Question paper, page 19
19 0680/23/M/J/12 © UCLES 2012 BLANK PAGE
Question paper, page 20
20 0680/23/M/J/12 © UCLES 2012 Copyright Acknowledgements: Question 1d Photograph M Fretwell © UCLES. Permission to reproduce items where third-party owned material protected by copyright is included has been sought and cleared where possible. Every reasonable effort has been made by the publisher (UCLES) to trace copyright holders, but if any items requiring clearance have unwittingly been included, the publisher will be pleased to make amends at the earliest possible opportunity. University of Cambridge International Examinations is part of the Cambridge Assessment Group. Cambridge Assessment is the brand name of University of Cambridge Local Examinations Syndicate (UCLES), which is itself a department of the University of Cambridge. BLANK PAGE
Mark scheme, page 1
UNIVERSITY OF CAMBRIDGE INTERNATIONAL EXAMINATIONS International General Certificate of Secondary Education MARK SCHEME for the May/June 2012 question paper for the guidance of teachers 0680 ENVIRONMENTAL MANAGEMENT 0680/23 Paper 2, maximum raw mark 80 This mark scheme is published as an aid to teachers and candidates, to indicate the requirements of the examination. It shows the basis on which Examiners were instructed to award marks. It does not indicate the details of the discussions that took place at an Examiners’ meeting before marking began, which would have considered the acceptability of alternative answers. Mark schemes must be read in conjunction with the question papers and the report on the examination. • Cambridge will not enter into discussions or correspondence in connection with these mark schemes. Cambridge is publishing the mark schemes for the May/June 2012 question papers for most IGCSE, GCE Advanced Level and Advanced Subsidiary Level syllabuses and some Ordinary Level syllabuses. www.XtremePapers.com
Mark scheme, page 2
Page 2 Mark Scheme: Teachers’ version Syllabus Paper IGCSE – May/June 2012 0680 23 © University of Cambridge International Examinations 2012 General notes Symbols used in Environmental Management mark schemes. / separates alternatives for a marking point – other valid ways of expressing the same idea are also credited ; separates points for the award of a mark [3] indicates the number of marks available [max 3] the number shows the maximum number of marks available for the question where there are more marking points than total marks available [max 3] when part of the marks of a question must come from part of the mark scheme, this is indicated by non-bold marks showing the internal maxima for different parts of the question these non-bold marks are also used to show marks for bands where banded mark schemes are used italic indicates that this is information about the marking points and is not required to gain credit italic text is also used for comments about alternatives that should be accepted, ignored or rejected ora or reverse argument – shows that an argument from an alternative viewpoint will be credited AW alternative wording, sometimes called ‘or words to that effect’ – AW is used when there are many different ways of expressing the same idea ( ) the word / phrase in brackets is not required to gain marks but sets the context of the response for credit e.g. (nuclear) waste – nuclear is not needed but if it was described as a domestic waste then no mark is awarded volcanic underlined words – the answer must contain exactly this word ecf error carried forward – if an incorrect answer is given to part of a question, and this answer is subsequently used by a candidate in later parts of the question, this indicates that the candidate’s incorrect answer will be used as a starting point for marking the later parts of the question
Mark scheme, page 3
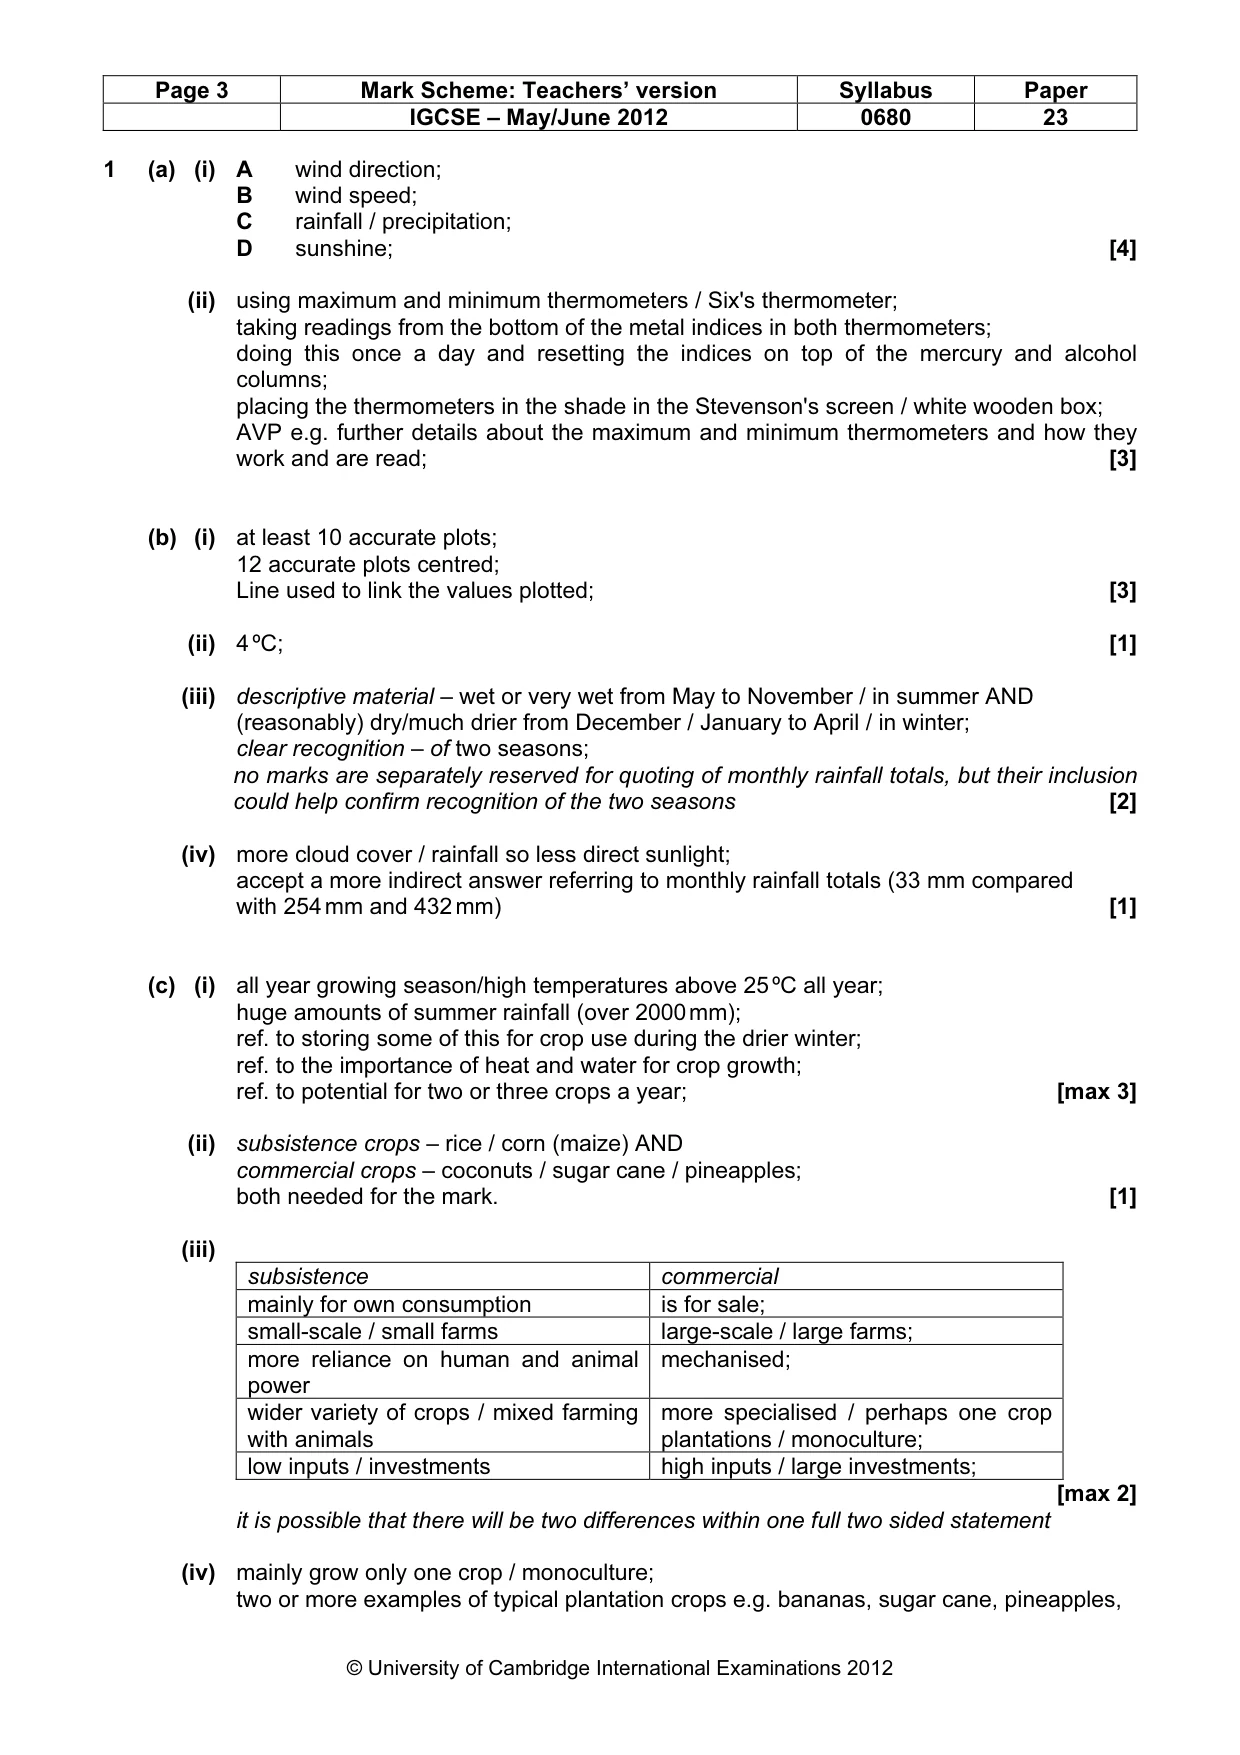
Page 3 Mark Scheme: Teachers’ version Syllabus Paper IGCSE – May/June 2012 0680 23 © University of Cambridge International Examinations 2012 1 (a) (i) A wind direction; B wind speed; C rainfall / precipitation; D sunshine; [4] (ii) using maximum and minimum thermometers / Six's thermometer; taking readings from the bottom of the metal indices in both thermometers; doing this once a day and resetting the indices on top of the mercury and alcohol columns; placing the thermometers in the shade in the Stevenson's screen / white wooden box; AVP e.g. further details about the maximum and minimum thermometers and how they work and are read; [3] (b) (i) at least 10 accurate plots; 12 accurate plots centred; Line used to link the values plotted; [3] (ii) 4 ºC; [1] (iii) descriptive material – wet or very wet from May to November / in summer AND (reasonably) dry/much drier from December / January to April / in winter; clear recognition – of two seasons; no marks are separately reserved for quoting of monthly rainfall totals, but their inclusion could help confirm recognition of the two seasons [2] (iv) more cloud cover / rainfall so less direct sunlight; accept a more indirect answer referring to monthly rainfall totals (33 mm compared with 254 mm and 432 mm) [1] (c) (i) all year growing season/high temperatures above 25 ºC all year; huge amounts of summer rainfall (over 2000 mm); ref. to storing some of this for crop use during the drier winter; ref. to the importance of heat and water for crop growth; ref. to potential for two or three crops a year; [max 3] (ii) subsistence crops – rice / corn (maize) AND commercial crops – coconuts / sugar cane / pineapples; both needed for the mark. [1] (iii) subsistence commercial mainly for own consumption is for sale; small-scale / small farms large-scale / large farms; more reliance on human and animal power mechanised; wider variety of crops / mixed farming with animals more specialised / perhaps one crop plantations / monoculture; low inputs / investments high inputs / large investments; [max 2] it is possible that there will be two differences within one full two sided statement (iv) mainly grow only one crop / monoculture; two or more examples of typical plantation crops e.g. bananas, sugar cane, pineapples,
Mark scheme, page 4
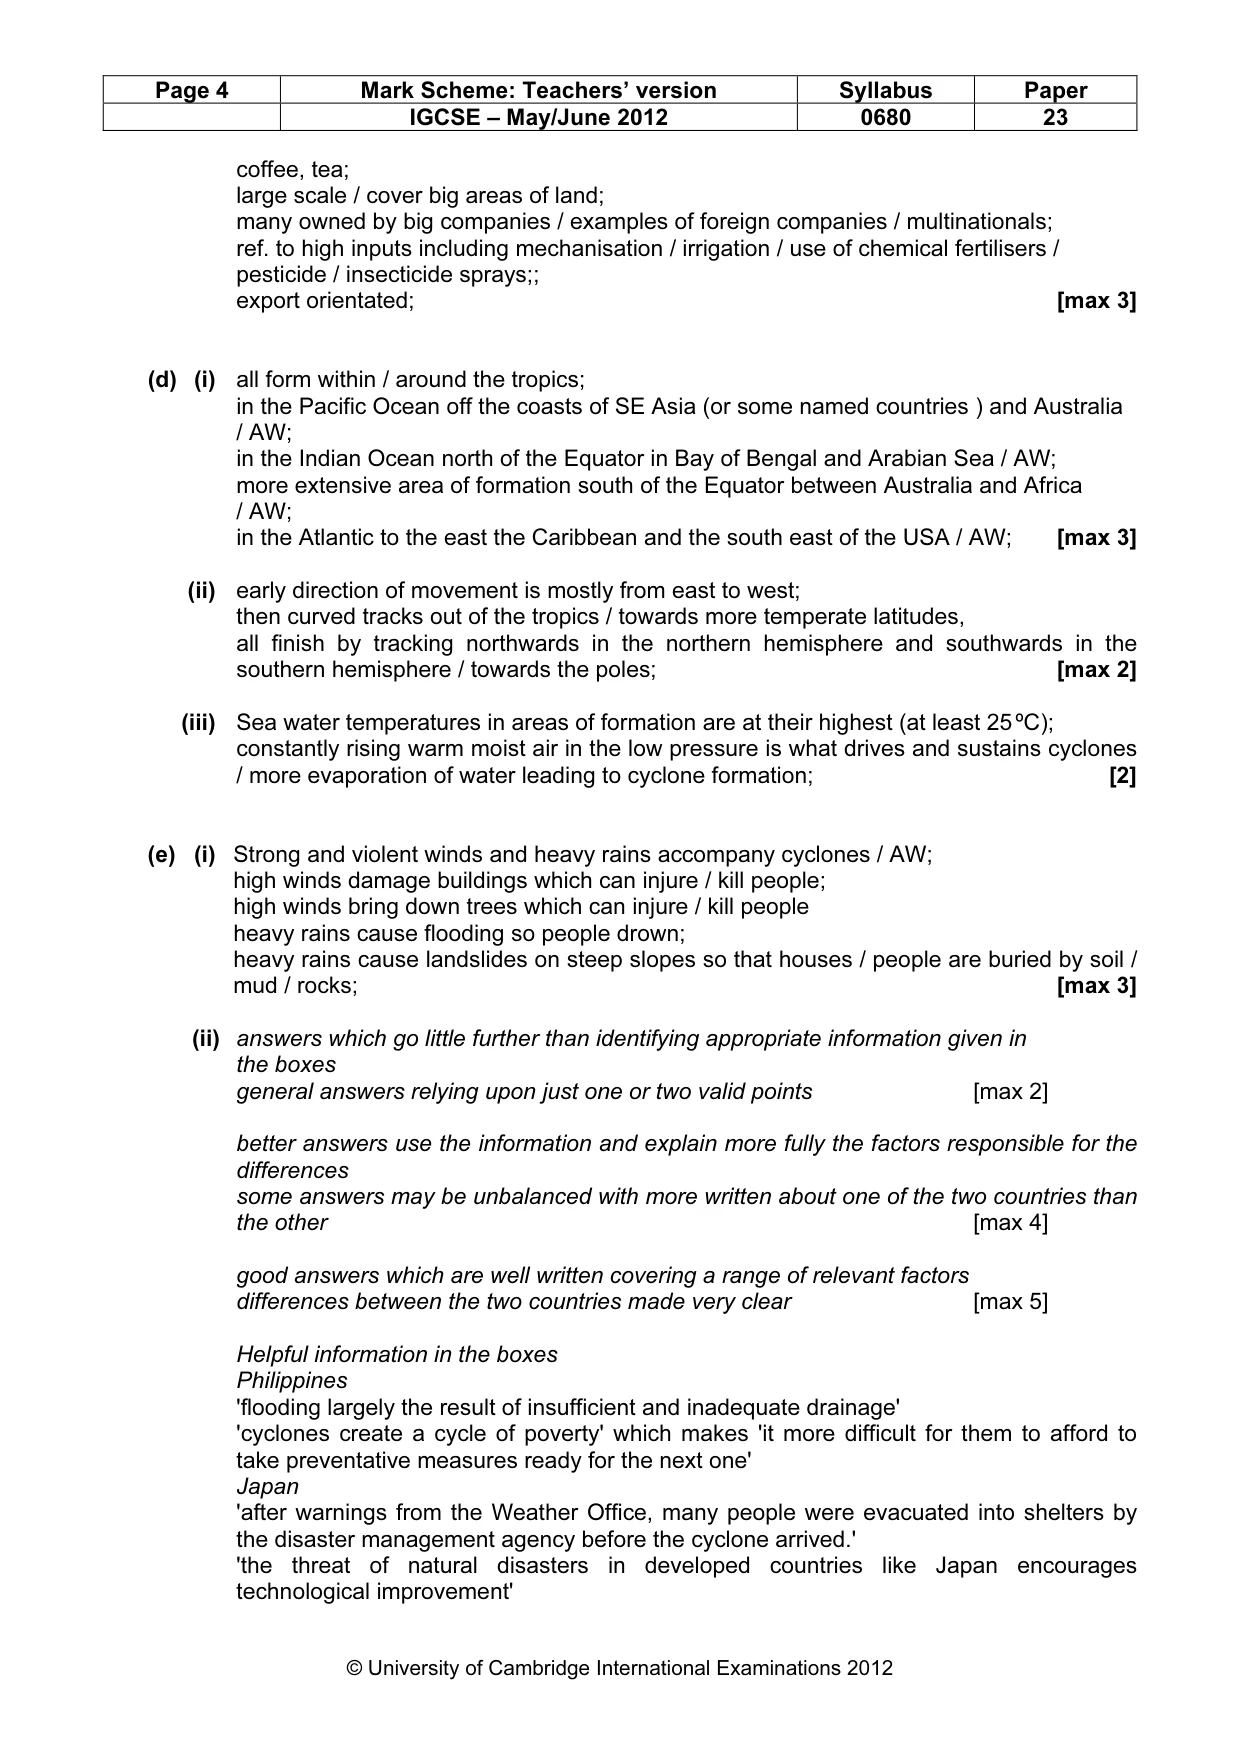
Page 4 Mark Scheme: Teachers’ version Syllabus Paper IGCSE – May/June 2012 0680 23 © University of Cambridge International Examinations 2012 coffee, tea; large scale / cover big areas of land; many owned by big companies / examples of foreign companies / multinationals; ref. to high inputs including mechanisation / irrigation / use of chemical fertilisers / pesticide / insecticide sprays;; export orientated; [max 3] (d) (i) all form within / around the tropics; in the Pacific Ocean off the coasts of SE Asia (or some named countries ) and Australia / AW; in the Indian Ocean north of the Equator in Bay of Bengal and Arabian Sea / AW; more extensive area of formation south of the Equator between Australia and Africa / AW; in the Atlantic to the east the Caribbean and the south east of the USA / AW; [max 3] (ii) early direction of movement is mostly from east to west; then curved tracks out of the tropics / towards more temperate latitudes, all finish by tracking northwards in the northern hemisphere and southwards in the southern hemisphere / towards the poles; [max 2] (iii) Sea water temperatures in areas of formation are at their highest (at least 25 ºC); constantly rising warm moist air in the low pressure is what drives and sustains cyclones / more evaporation of water leading to cyclone formation; [2] (e) (i) Strong and violent winds and heavy rains accompany cyclones / AW; high winds damage buildings which can injure / kill people; high winds bring down trees which can injure / kill people heavy rains cause flooding so people drown; heavy rains cause landslides on steep slopes so that houses / people are buried by soil / mud / rocks; [max 3] (ii) answers which go little further than identifying appropriate information given in the boxes general answers relying upon just one or two valid points [max 2] better answers use the information and explain more fully the factors responsible for the differences some answers may be unbalanced with more written about one of the two countries than the other [max 4] good answers which are well written covering a range of relevant factors differences between the two countries made very clear [max 5] Helpful information in the boxes Philippines 'flooding largely the result of insufficient and inadequate drainage' 'cyclones create a cycle of poverty' which makes 'it more difficult for them to afford to take preventative measures ready for the next one' Japan 'after warnings from the Weather Office, many people were evacuated into shelters by the disaster management agency before the cyclone arrived.' 'the threat of natural disasters in developed countries like Japan encourages technological improvement'
Mark scheme, page 5
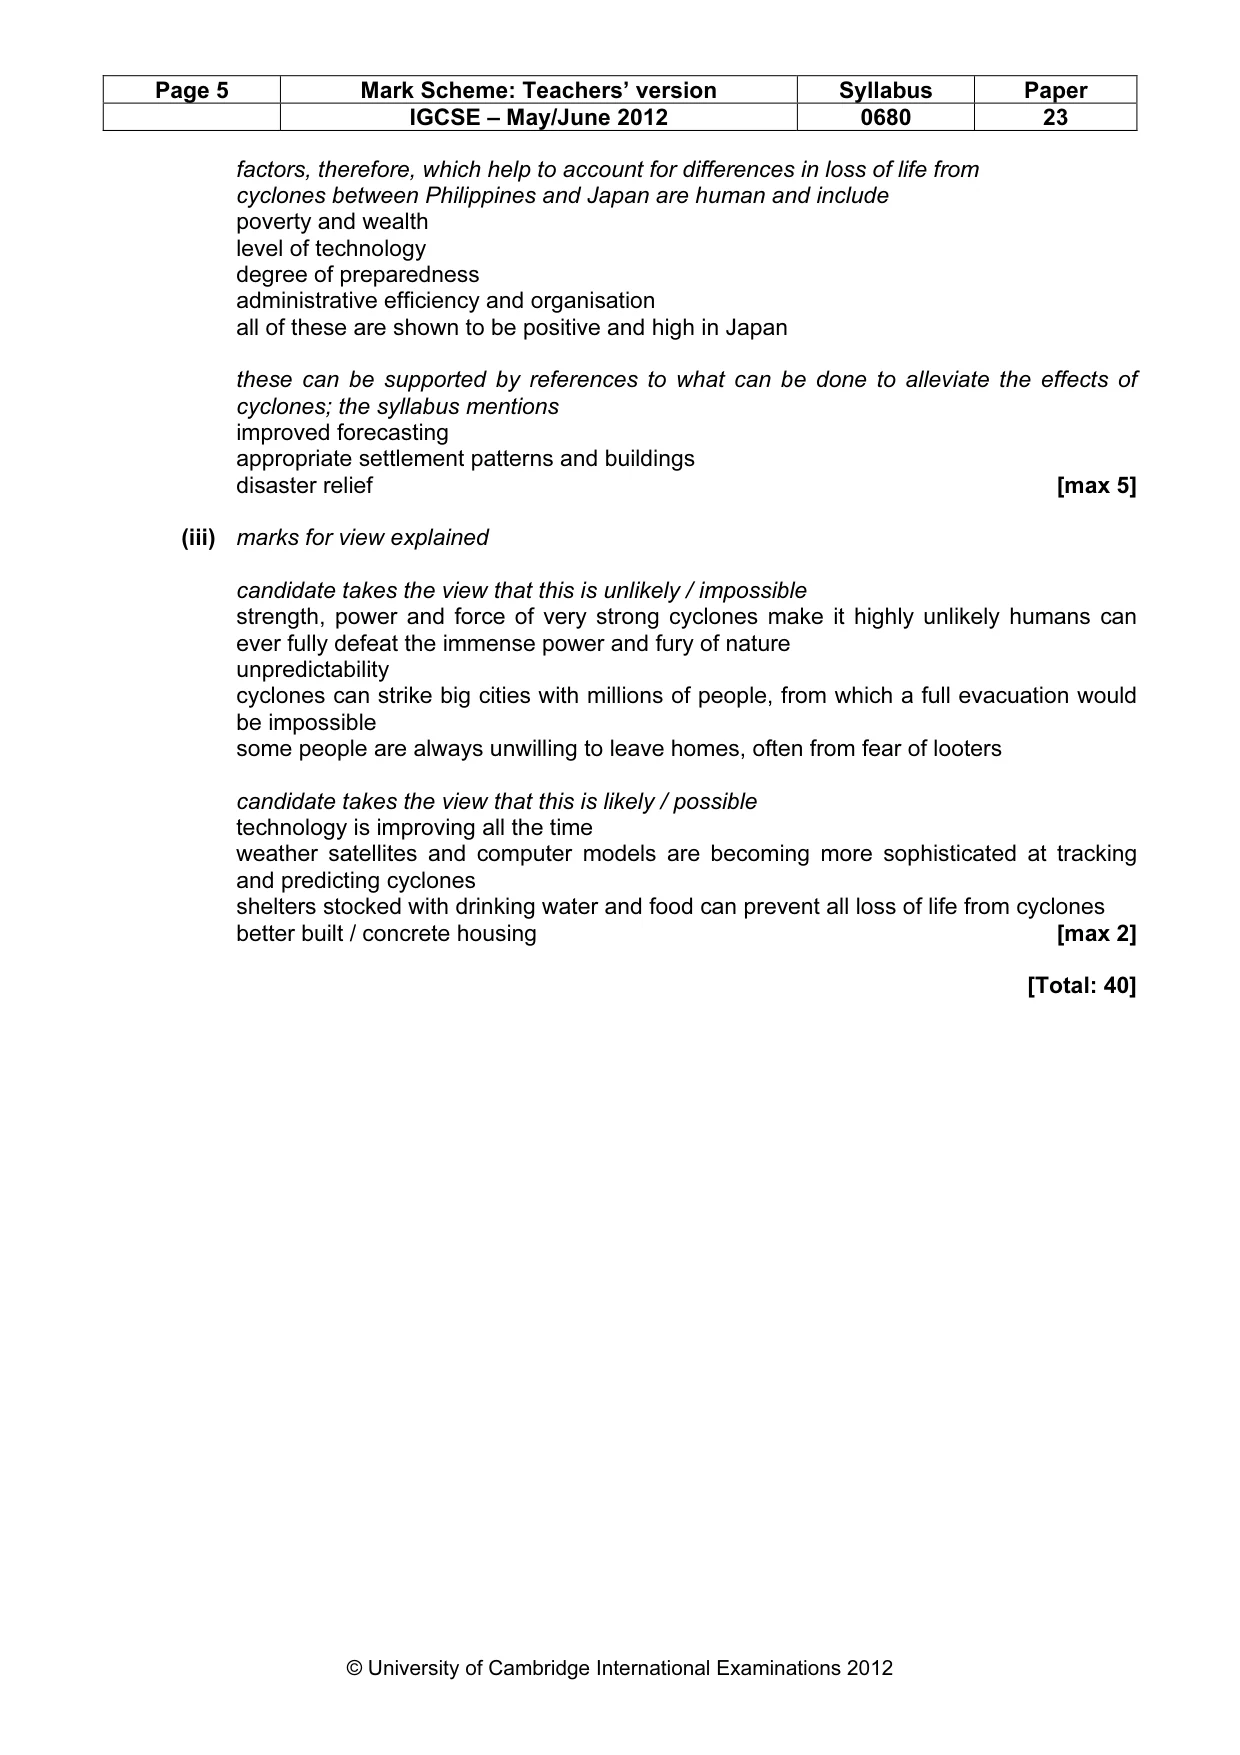
Page 5 Mark Scheme: Teachers’ version Syllabus Paper IGCSE – May/June 2012 0680 23 © University of Cambridge International Examinations 2012 factors, therefore, which help to account for differences in loss of life from cyclones between Philippines and Japan are human and include poverty and wealth level of technology degree of preparedness administrative efficiency and organisation all of these are shown to be positive and high in Japan these can be supported by references to what can be done to alleviate the effects of cyclones; the syllabus mentions improved forecasting appropriate settlement patterns and buildings disaster relief [max 5] (iii) marks for view explained candidate takes the view that this is unlikely / impossible strength, power and force of very strong cyclones make it highly unlikely humans can ever fully defeat the immense power and fury of nature unpredictability cyclones can strike big cities with millions of people, from which a full evacuation would be impossible some people are always unwilling to leave homes, often from fear of looters candidate takes the view that this is likely / possible technology is improving all the time weather satellites and computer models are becoming more sophisticated at tracking and predicting cyclones shelters stocked with drinking water and food can prevent all loss of life from cyclones better built / concrete housing [max 2] [Total: 40]
Mark scheme, page 6
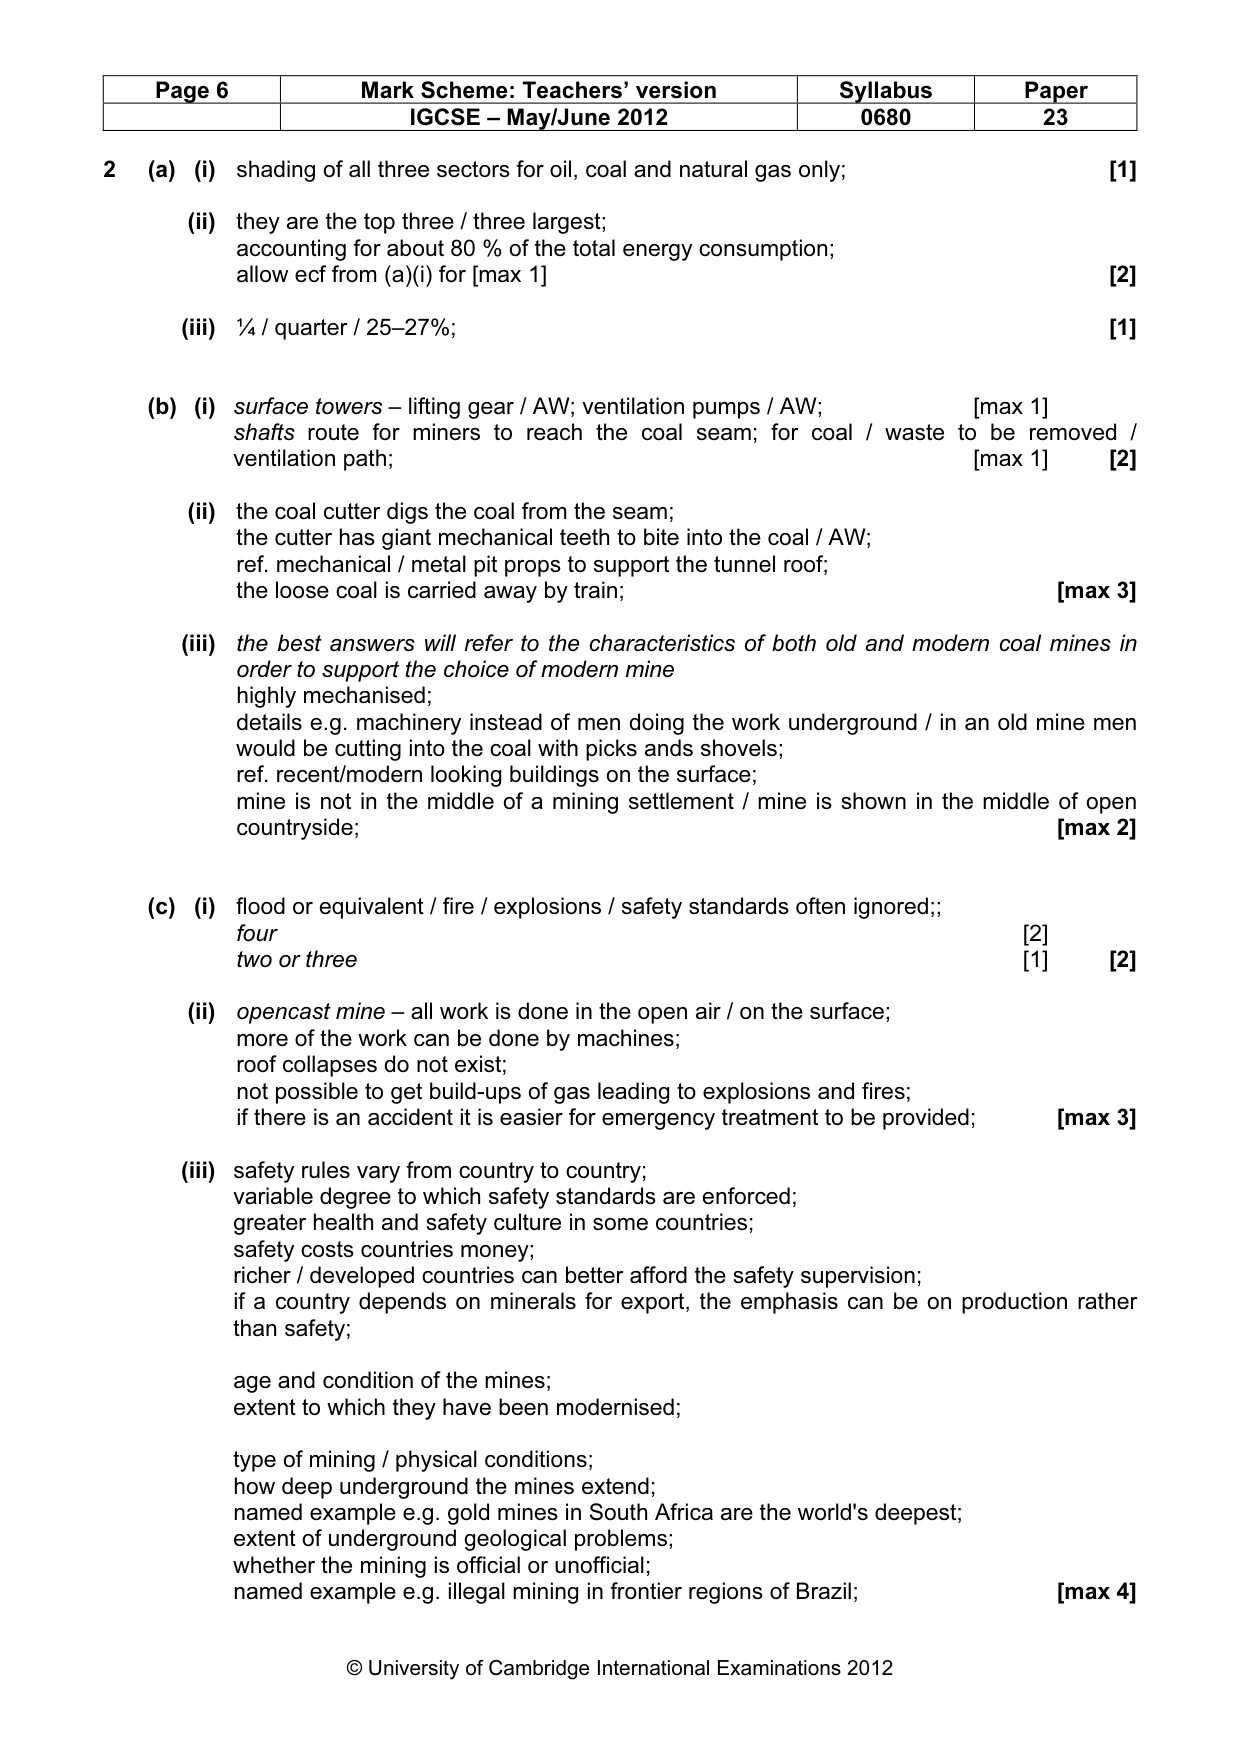
Page 6 Mark Scheme: Teachers’ version Syllabus Paper IGCSE – May/June 2012 0680 23 © University of Cambridge International Examinations 2012 2 (a) (i) shading of all three sectors for oil, coal and natural gas only; [1] (ii) they are the top three / three largest; accounting for about 80 % of the total energy consumption; allow ecf from (a)(i) for [max 1] [2] (iii) ¼ / quarter / 25–27%; [1] (b) (i) surface towers – lifting gear / AW; ventilation pumps / AW; [max 1] shafts route for miners to reach the coal seam; for coal / waste to be removed / ventilation path; [max 1] [2] (ii) the coal cutter digs the coal from the seam; the cutter has giant mechanical teeth to bite into the coal / AW; ref. mechanical / metal pit props to support the tunnel roof; the loose coal is carried away by train; [max 3] (iii) the best answers will refer to the characteristics of both old and modern coal mines in order to support the choice of modern mine highly mechanised; details e.g. machinery instead of men doing the work underground / in an old mine men would be cutting into the coal with picks ands shovels; ref. recent/modern looking buildings on the surface; mine is not in the middle of a mining settlement / mine is shown in the middle of open countryside; [max 2] (c) (i) flood or equivalent / fire / explosions / safety standards often ignored;; four [2] two or three [1] [2] (ii) opencast mine – all work is done in the open air / on the surface; more of the work can be done by machines; roof collapses do not exist; not possible to get build-ups of gas leading to explosions and fires; if there is an accident it is easier for emergency treatment to be provided; [max 3] (iii) safety rules vary from country to country; variable degree to which safety standards are enforced; greater health and safety culture in some countries; safety costs countries money; richer / developed countries can better afford the safety supervision; if a country depends on minerals for export, the emphasis can be on production rather than safety; age and condition of the mines; extent to which they have been modernised; type of mining / physical conditions; how deep underground the mines extend; named example e.g. gold mines in South Africa are the world's deepest; extent of underground geological problems; whether the mining is official or unofficial; named example e.g. illegal mining in frontier regions of Brazil; [max 4]
Mark scheme, page 7
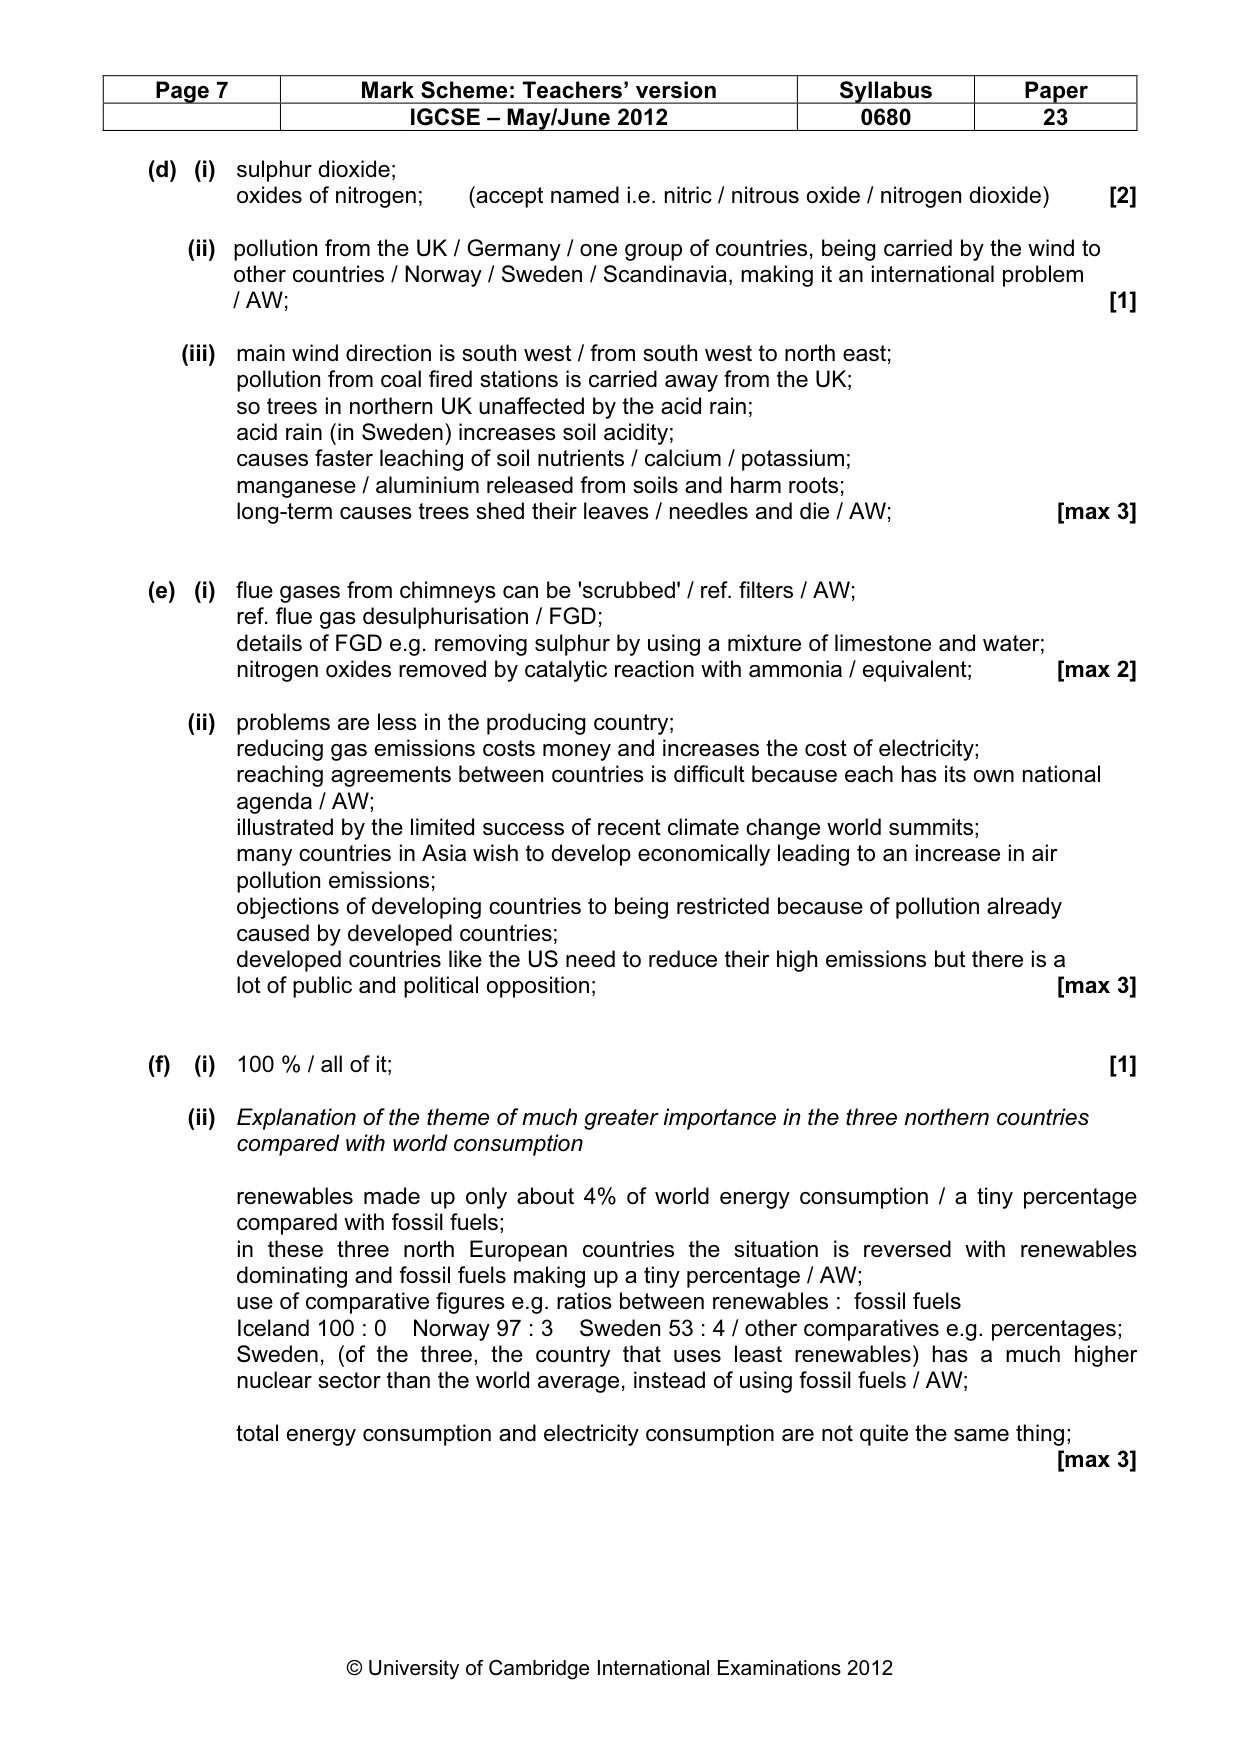
Page 7 Mark Scheme: Teachers’ version Syllabus Paper IGCSE – May/June 2012 0680 23 © University of Cambridge International Examinations 2012 (d) (i) sulphur dioxide; oxides of nitrogen; (accept named i.e. nitric / nitrous oxide / nitrogen dioxide) [2] (ii) pollution from the UK / Germany / one group of countries, being carried by the wind to other countries / Norway / Sweden / Scandinavia, making it an international problem / AW; [1] (iii) main wind direction is south west / from south west to north east; pollution from coal fired stations is carried away from the UK; so trees in northern UK unaffected by the acid rain; acid rain (in Sweden) increases soil acidity; causes faster leaching of soil nutrients / calcium / potassium; manganese / aluminium released from soils and harm roots; long-term causes trees shed their leaves / needles and die / AW; [max 3] (e) (i) flue gases from chimneys can be 'scrubbed' / ref. filters / AW; ref. flue gas desulphurisation / FGD; details of FGD e.g. removing sulphur by using a mixture of limestone and water; nitrogen oxides removed by catalytic reaction with ammonia / equivalent; [max 2] (ii) problems are less in the producing country; reducing gas emissions costs money and increases the cost of electricity; reaching agreements between countries is difficult because each has its own national agenda / AW; illustrated by the limited success of recent climate change world summits; many countries in Asia wish to develop economically leading to an increase in air pollution emissions; objections of developing countries to being restricted because of pollution already caused by developed countries; developed countries like the US need to reduce their high emissions but there is a lot of public and political opposition; [max 3] (f) (i) 100 % / all of it; [1] (ii) Explanation of the theme of much greater importance in the three northern countries compared with world consumption renewables made up only about 4% of world energy consumption / a tiny percentage compared with fossil fuels; in these three north European countries the situation is reversed with renewables dominating and fossil fuels making up a tiny percentage / AW; use of comparative figures e.g. ratios between renewables : fossil fuels Iceland 100 : 0 Norway 97 : 3 Sweden 53 : 4 / other comparatives e.g. percentages; Sweden, (of the three, the country that uses least renewables) has a much higher nuclear sector than the world average, instead of using fossil fuels / AW; total energy consumption and electricity consumption are not quite the same thing; [max 3]
Mark scheme, page 8
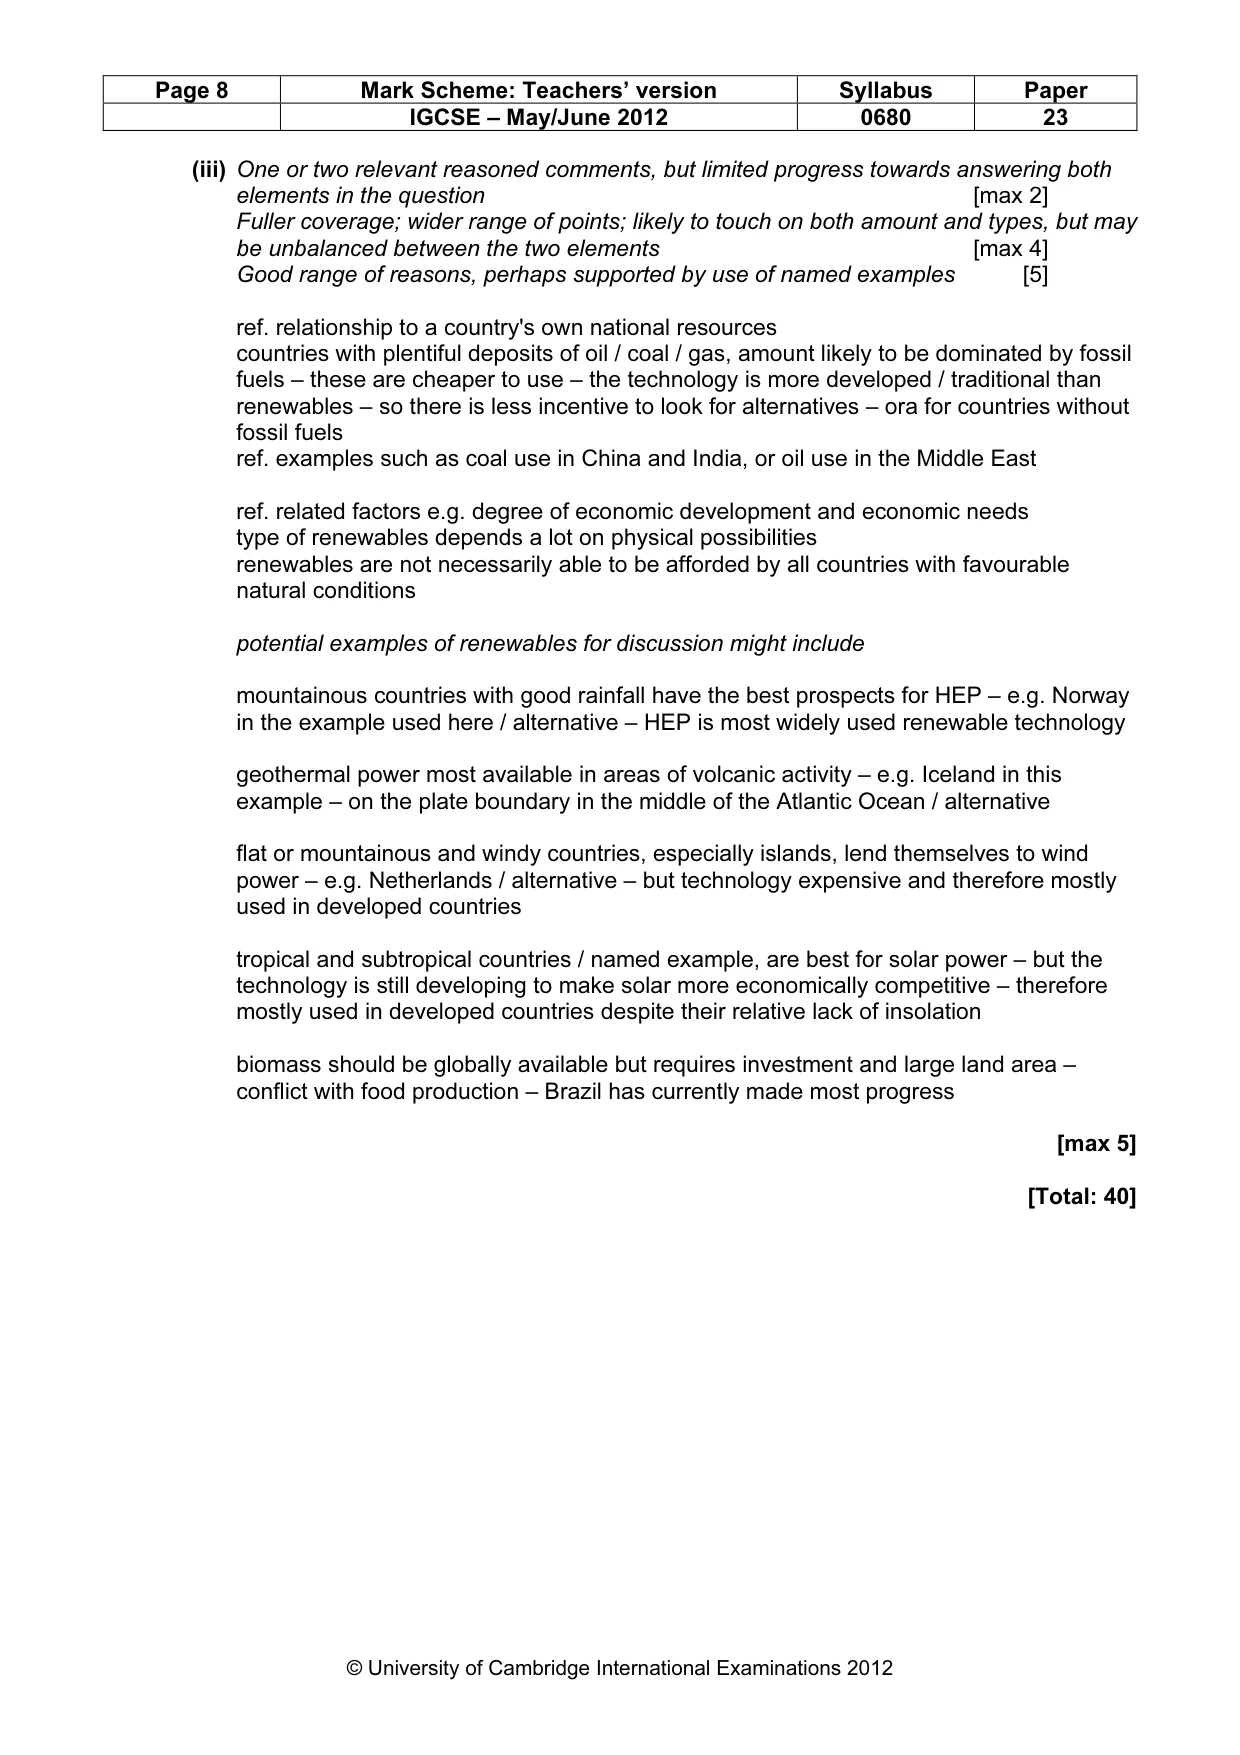
Page 8 Mark Scheme: Teachers’ version Syllabus Paper IGCSE – May/June 2012 0680 23 © University of Cambridge International Examinations 2012 (iii) One or two relevant reasoned comments, but limited progress towards answering both elements in the question [max 2] Fuller coverage; wider range of points; likely to touch on both amount and types, but may be unbalanced between the two elements [max 4] Good range of reasons, perhaps supported by use of named examples [5] ref. relationship to a country's own national resources countries with plentiful deposits of oil / coal / gas, amount likely to be dominated by fossil fuels – these are cheaper to use – the technology is more developed / traditional than renewables – so there is less incentive to look for alternatives – ora for countries without fossil fuels ref. examples such as coal use in China and India, or oil use in the Middle East ref. related factors e.g. degree of economic development and economic needs type of renewables depends a lot on physical possibilities renewables are not necessarily able to be afforded by all countries with favourable natural conditions potential examples of renewables for discussion might include mountainous countries with good rainfall have the best prospects for HEP – e.g. Norway in the example used here / alternative – HEP is most widely used renewable technology geothermal power most available in areas of volcanic activity – e.g. Iceland in this example – on the plate boundary in the middle of the Atlantic Ocean / alternative flat or mountainous and windy countries, especially islands, lend themselves to wind power – e.g. Netherlands / alternative – but technology expensive and therefore mostly used in developed countries tropical and subtropical countries / named example, are best for solar power – but the technology is still developing to make solar more economically competitive – therefore mostly used in developed countries despite their relative lack of insolation biomass should be globally available but requires investment and large land area – conflict with food production – Brazil has currently made most progress [max 5] [Total: 40]
What you needed in this session
Cambridge’s own grade thresholds for 2012 May/June, Paper 2 · Variant 3. A higher threshold means an easier paper — the bar moves with how the cohort did.