Cambridge IGCSE Environmental Management 0680 — 2012 May/June Paper 2 · Variant 1
0680/21/M/J/12 · 80 marks · ≈90 min
The question paper and its mark scheme, free to read here and free to download. This is Cambridge’s own paper, exactly as it was sat.
Question paper20 pages
Mark scheme9 pages
Answers below. Sit the paper first if you are practising.
Paper as text
Question paper, page 1
This document consists of 17 printed pages and 3 blank pages. DC (RW/SW) 48003/4 © UCLES 2012 [Turn over UNIVERSITY OF CAMBRIDGE INTERNATIONAL EXAMINATIONS International General Certificate of Secondary Education * 9 6 8 2 4 0 2 1 9 4 * ENVIRONMENTAL MANAGEMENT 0680/21 Paper 2 May/June 2012 1 hour 45 minutes Candidates answer on the Question Paper. Additional Materials: Ruler READ THESE INSTRUCTIONS FIRST Write your Centre number, candidate number and name on all the work you hand in. Write in dark blue or black pen. You may use a soft pencil for any diagrams, graphs or rough working. Do not use staples, paper clips, highlighters, glue or correction fluid. DO NOT WRITE IN ANY BARCODES. Answer both questions. At the end of the examination, fasten all your work securely together. The number of marks is given in brackets [ ] at the end of each question or part question. For Examiner’s Use 1 2 Total www.XtremePapers.com
Question paper, page 2
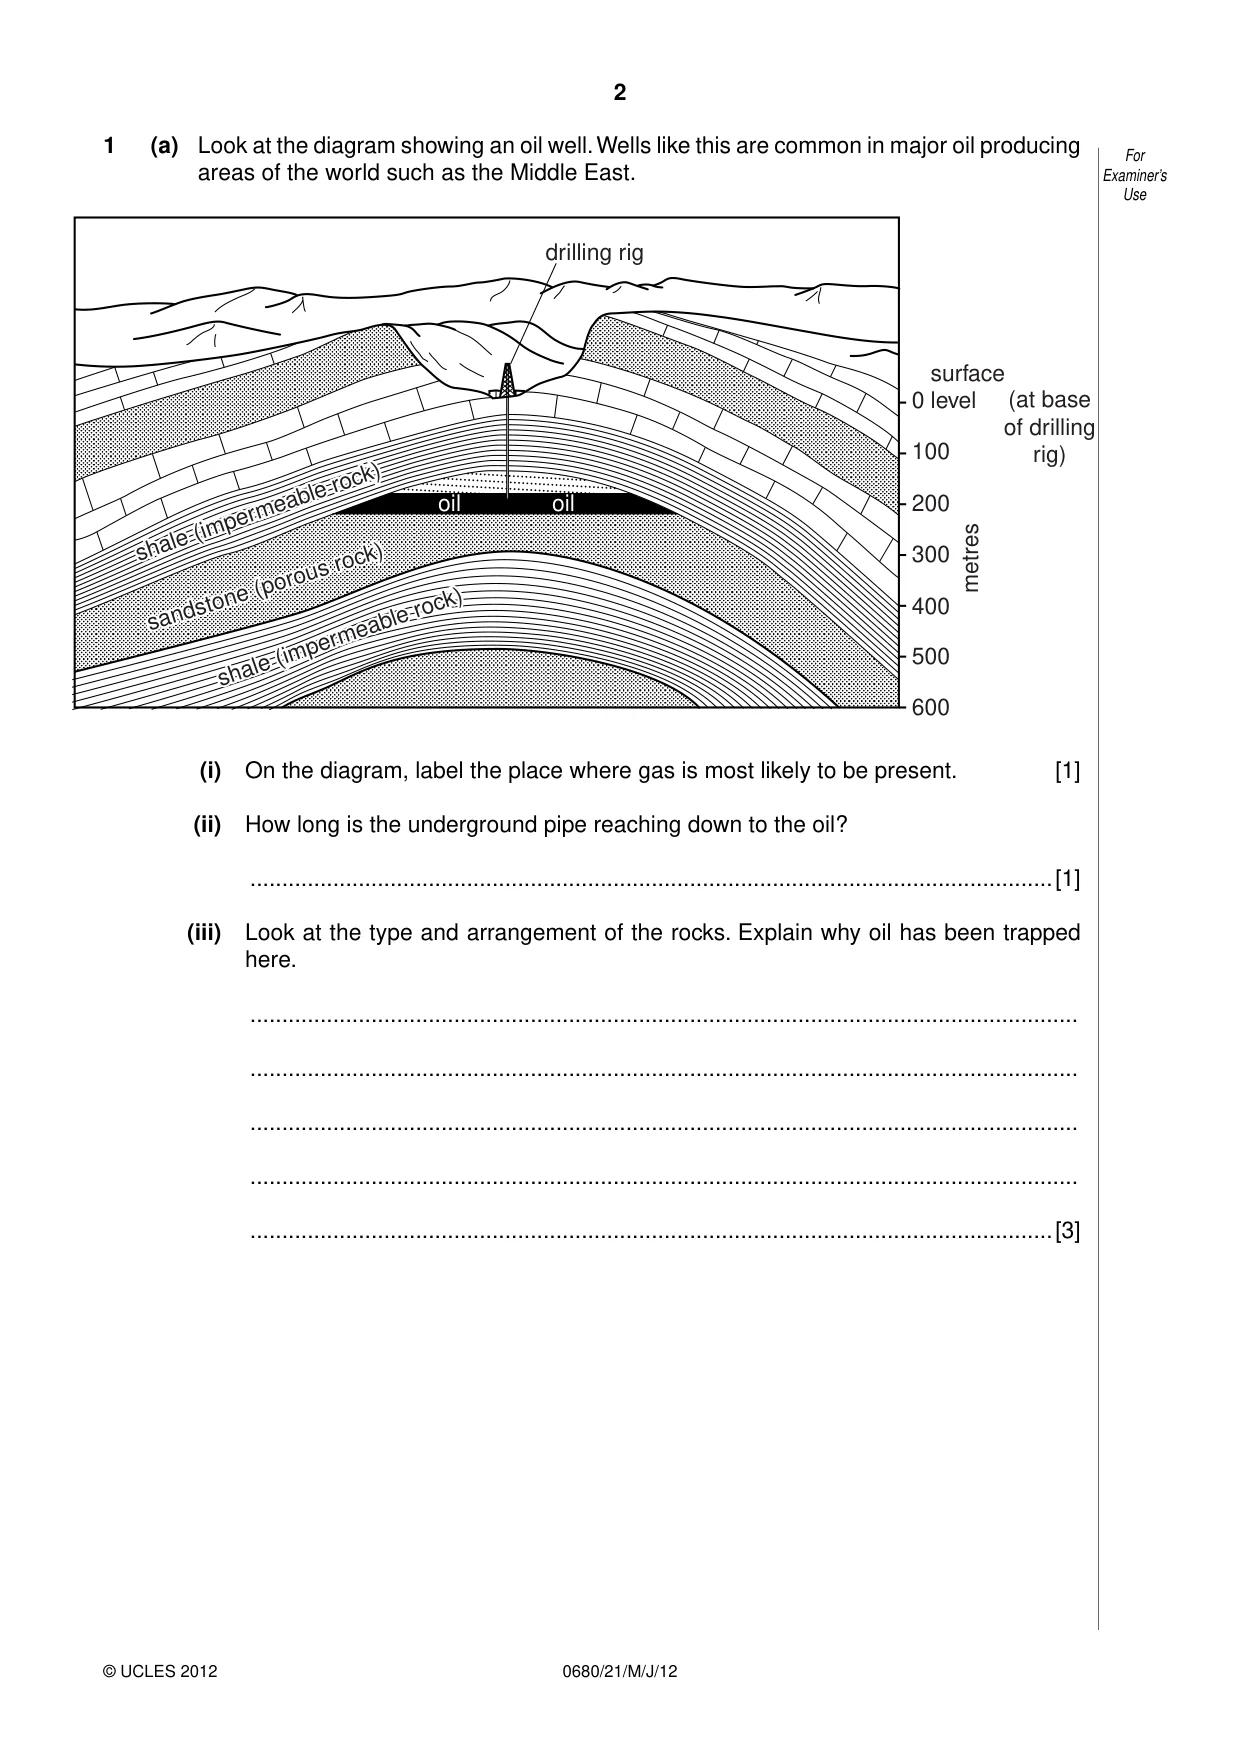
2 0680/21/M/J/12 © UCLES 2012 For Examiner’s Use 1 (a) Look at the diagram showing an oil well. Wells like this are common in major oil producing areas of the world such as the Middle East. oil oil shale (impermeable rock) shale (impermeable rock) sandstone (porous rock) drilling rig 0 surface level (at base of drilling rig) 100 200 300 metres 400 500 600 (i) On the diagram, label the place where gas is most likely to be present. [1] (ii) How long is the underground pipe reaching down to the oil? …[1] (iii) Look at the type and arrangement of the rocks. Explain why oil has been trapped here. … … … … …[3]
Question paper, page 3
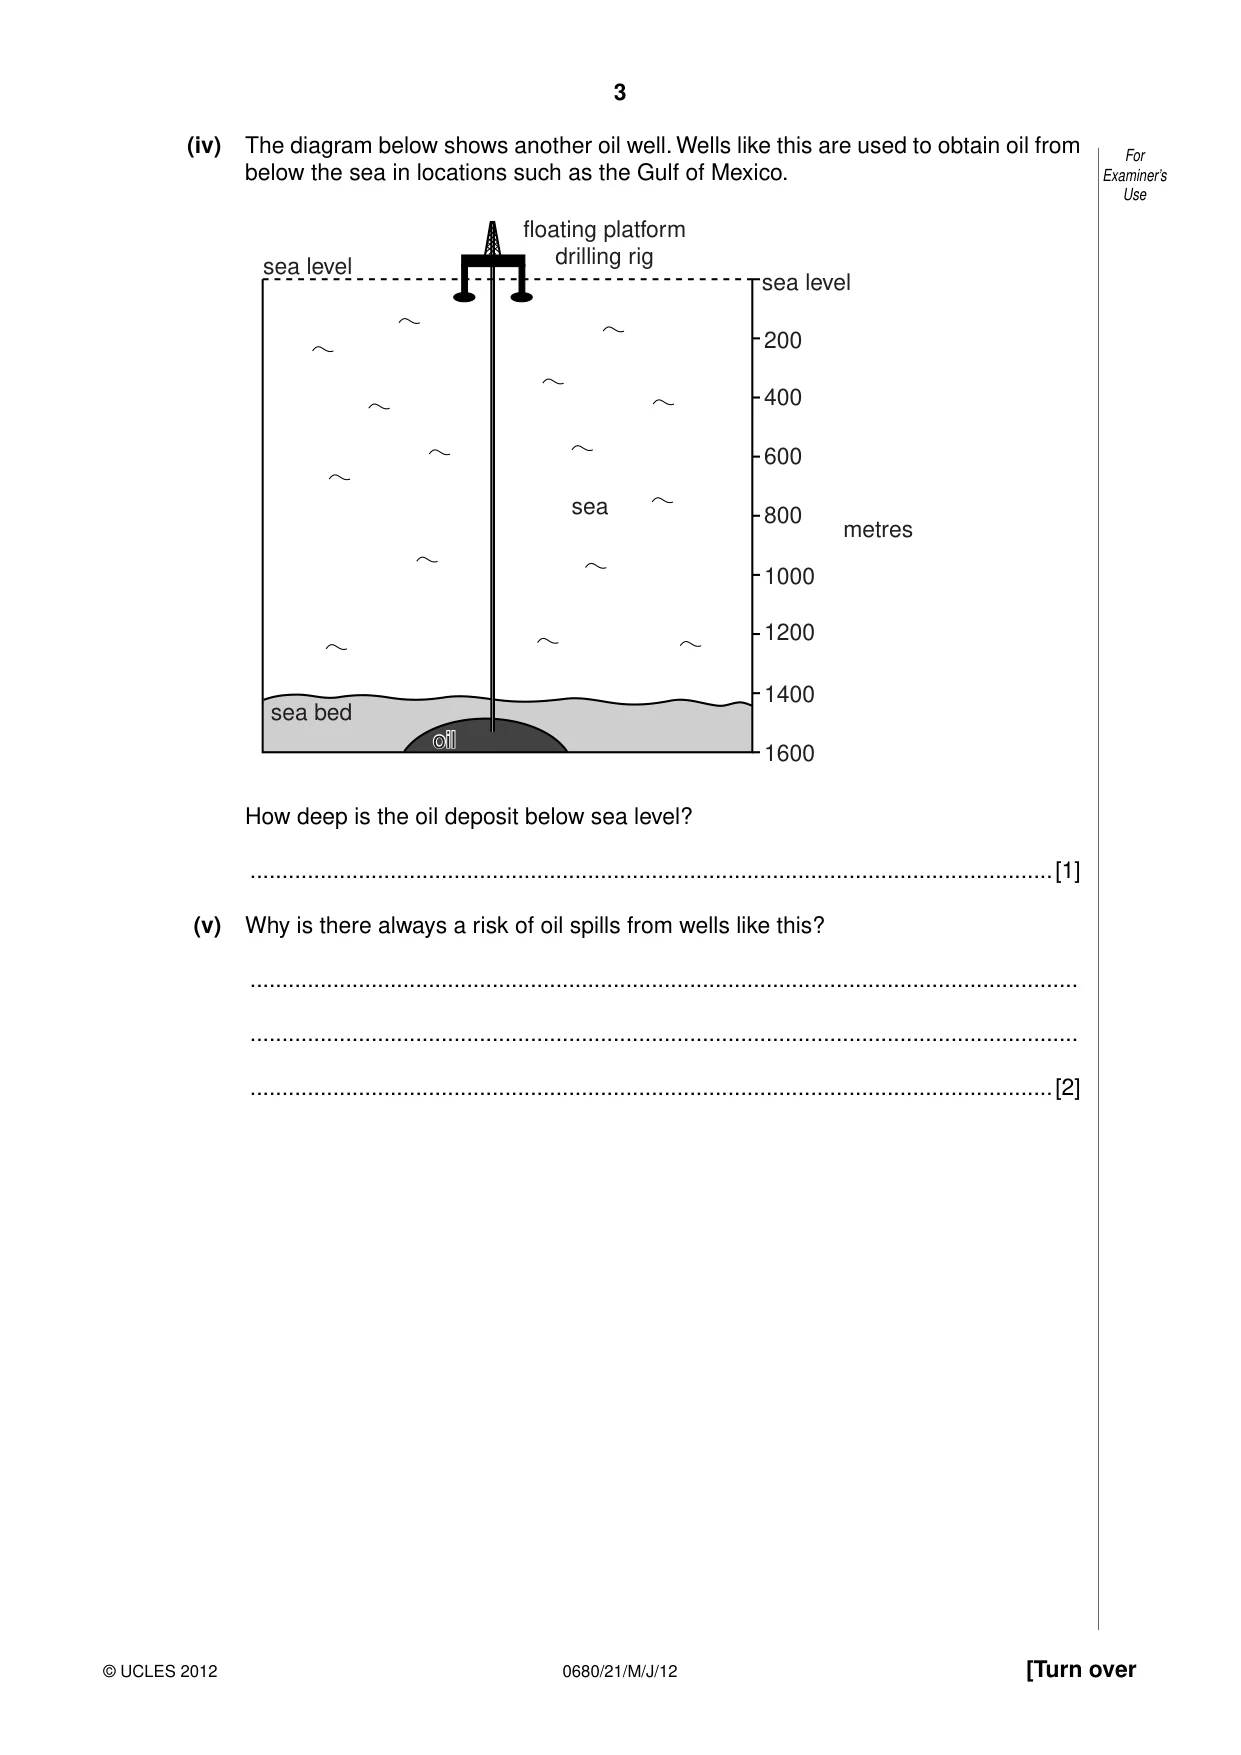
3 0680/21/M/J/12 © UCLES 2012 [Turn over For Examiner’s Use (iv) The diagram below shows another oil well. Wells like this are used to obtain oil from below the sea in locations such as the Gulf of Mexico. 1600 1400 1200 1000 metres 800 600 400 200 sea level floating platform drilling rig sea sea level sea bed oil How deep is the oil deposit below sea level? …[1] (v) Why is there always a risk of oil spills from wells like this? … … …[2]
Question paper, page 4
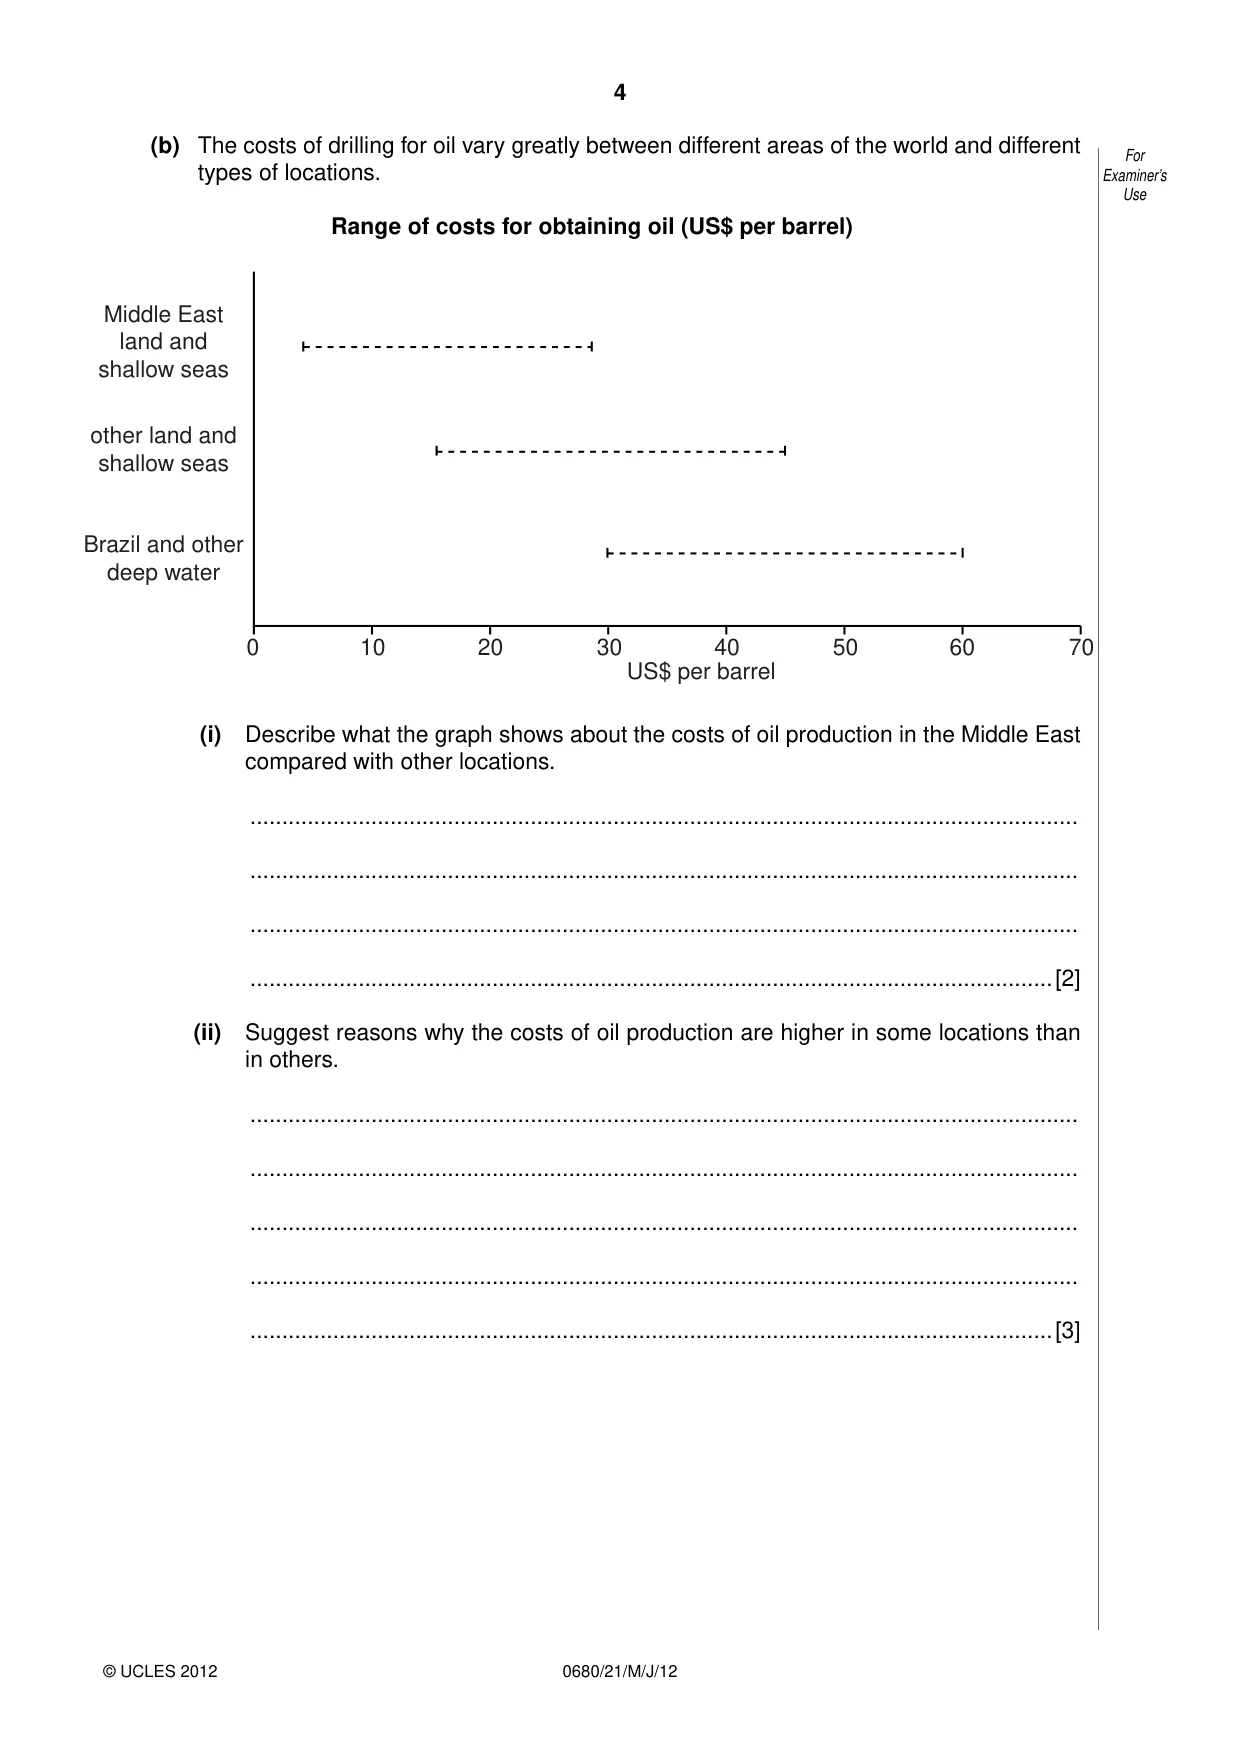
4 0680/21/M/J/12 © UCLES 2012 For Examiner’s Use (b) The costs of drilling for oil vary greatly between different areas of the world and different types of locations. Range of costs for obtaining oil (US$ per barrel) 0 10 20 30 40 US$ per barrel 50 60 70 Middle East land and shallow seas other land and shallow seas Brazil and other deep water (i) Describe what the graph shows about the costs of oil production in the Middle East compared with other locations. … … … …[2] (ii) Suggest reasons why the costs of oil production are higher in some locations than in others. … … … … …[3]
Question paper, page 5
5 0680/21/M/J/12 © UCLES 2012 [Turn over BLANK PAGE
Question paper, page 6
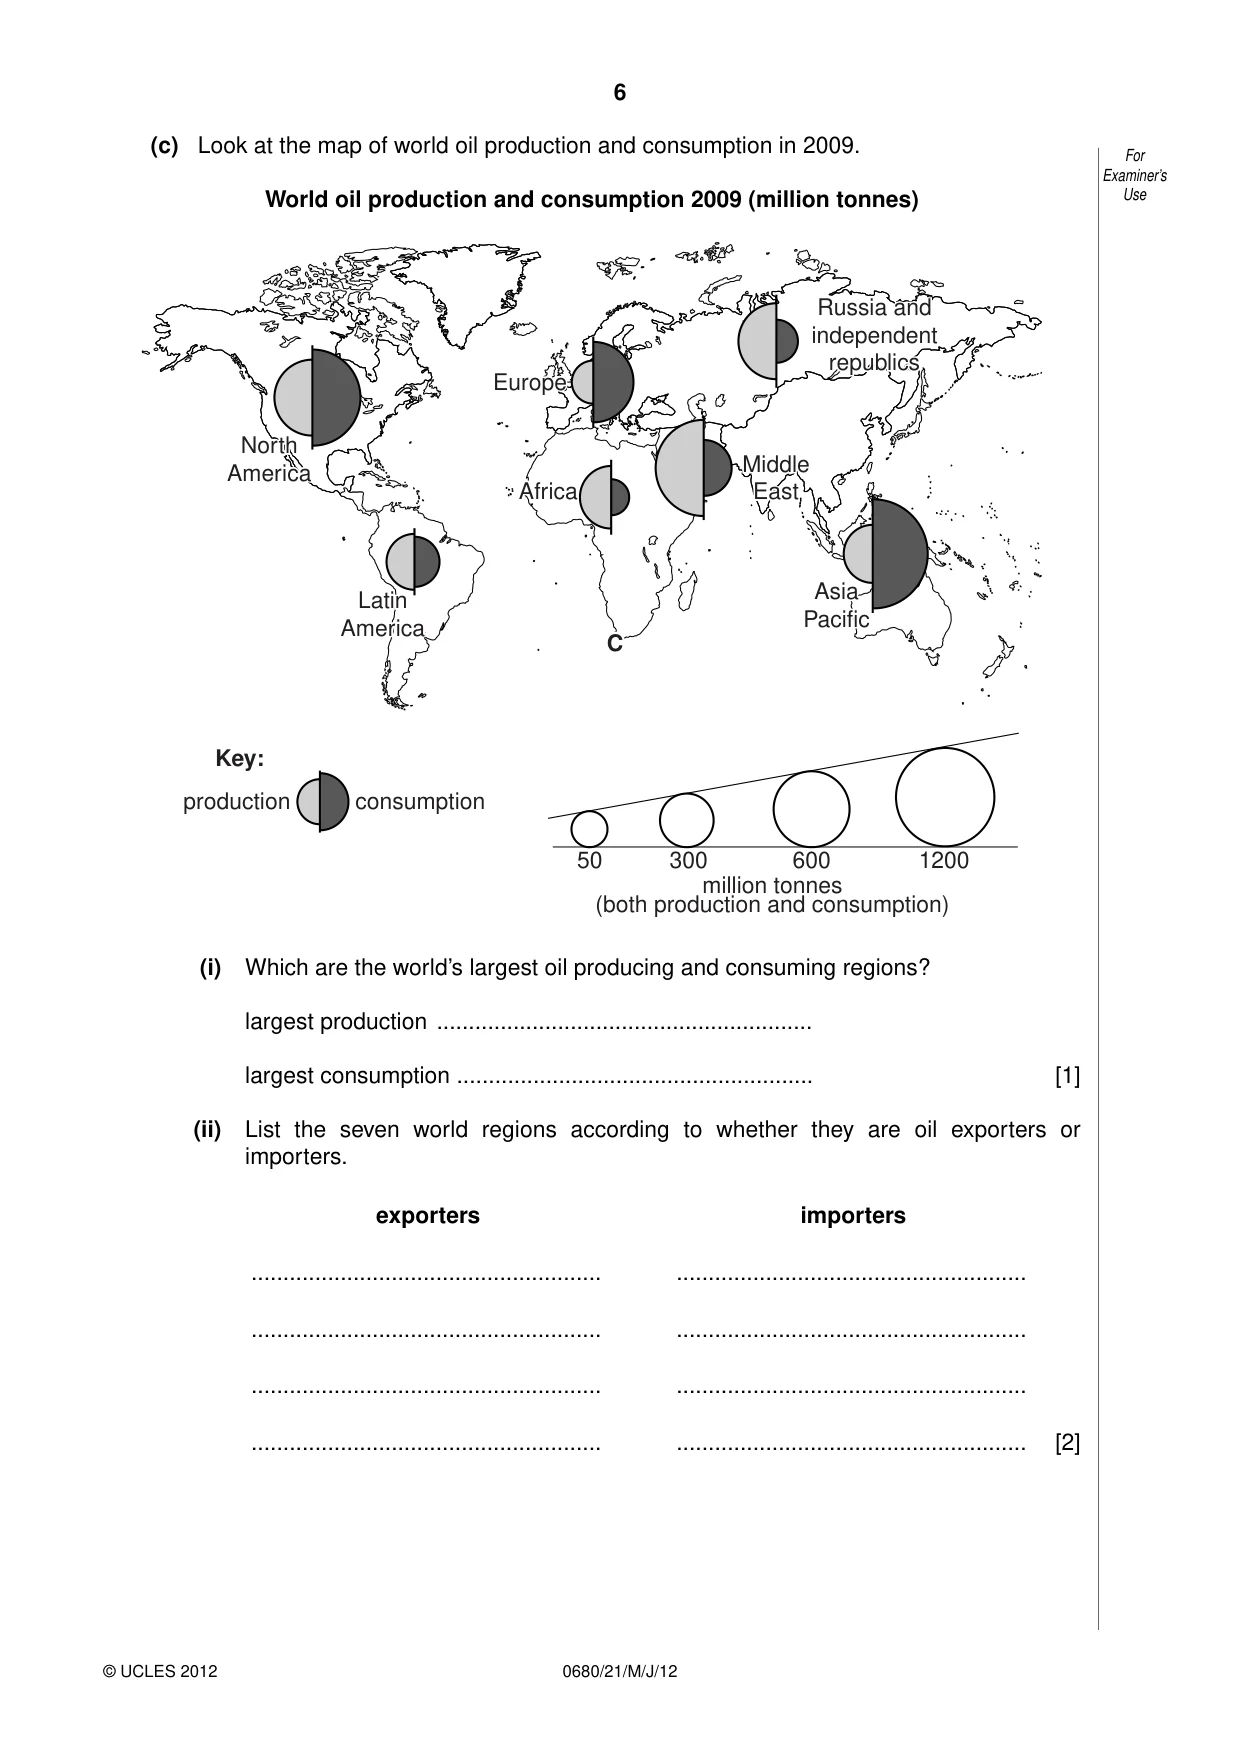
6 0680/21/M/J/12 © UCLES 2012 For Examiner’s Use (c) Look at the map of world oil production and consumption in 2009. World oil production and consumption 2009 (million tonnes) Europe Russia and independent republics Asia Pacific Africa Middle East North America Latin America Key: C consumption 50 300 600 million tonnes (both production and consumption) 1200 production (i) Which are the world’s largest oil producing and consuming regions? largest production … largest consumption … [1] (ii) List the seven world regions according to whether they are oil exporters or importers. exporters importers [2] … … … … … … … …
Question paper, page 7
7 0680/21/M/J/12 © UCLES 2012 [Turn over For Examiner’s Use (iii) Why is world trade in oil so great? … … … … …[3] (iv) Many large supertankers carrying up to 500 000 tonnes of crude oil follow the Cape route around South Africa (marked C on the world map). Explain why this is one of the world’s busiest tanker routes. … … … …[2]
Question paper, page 8
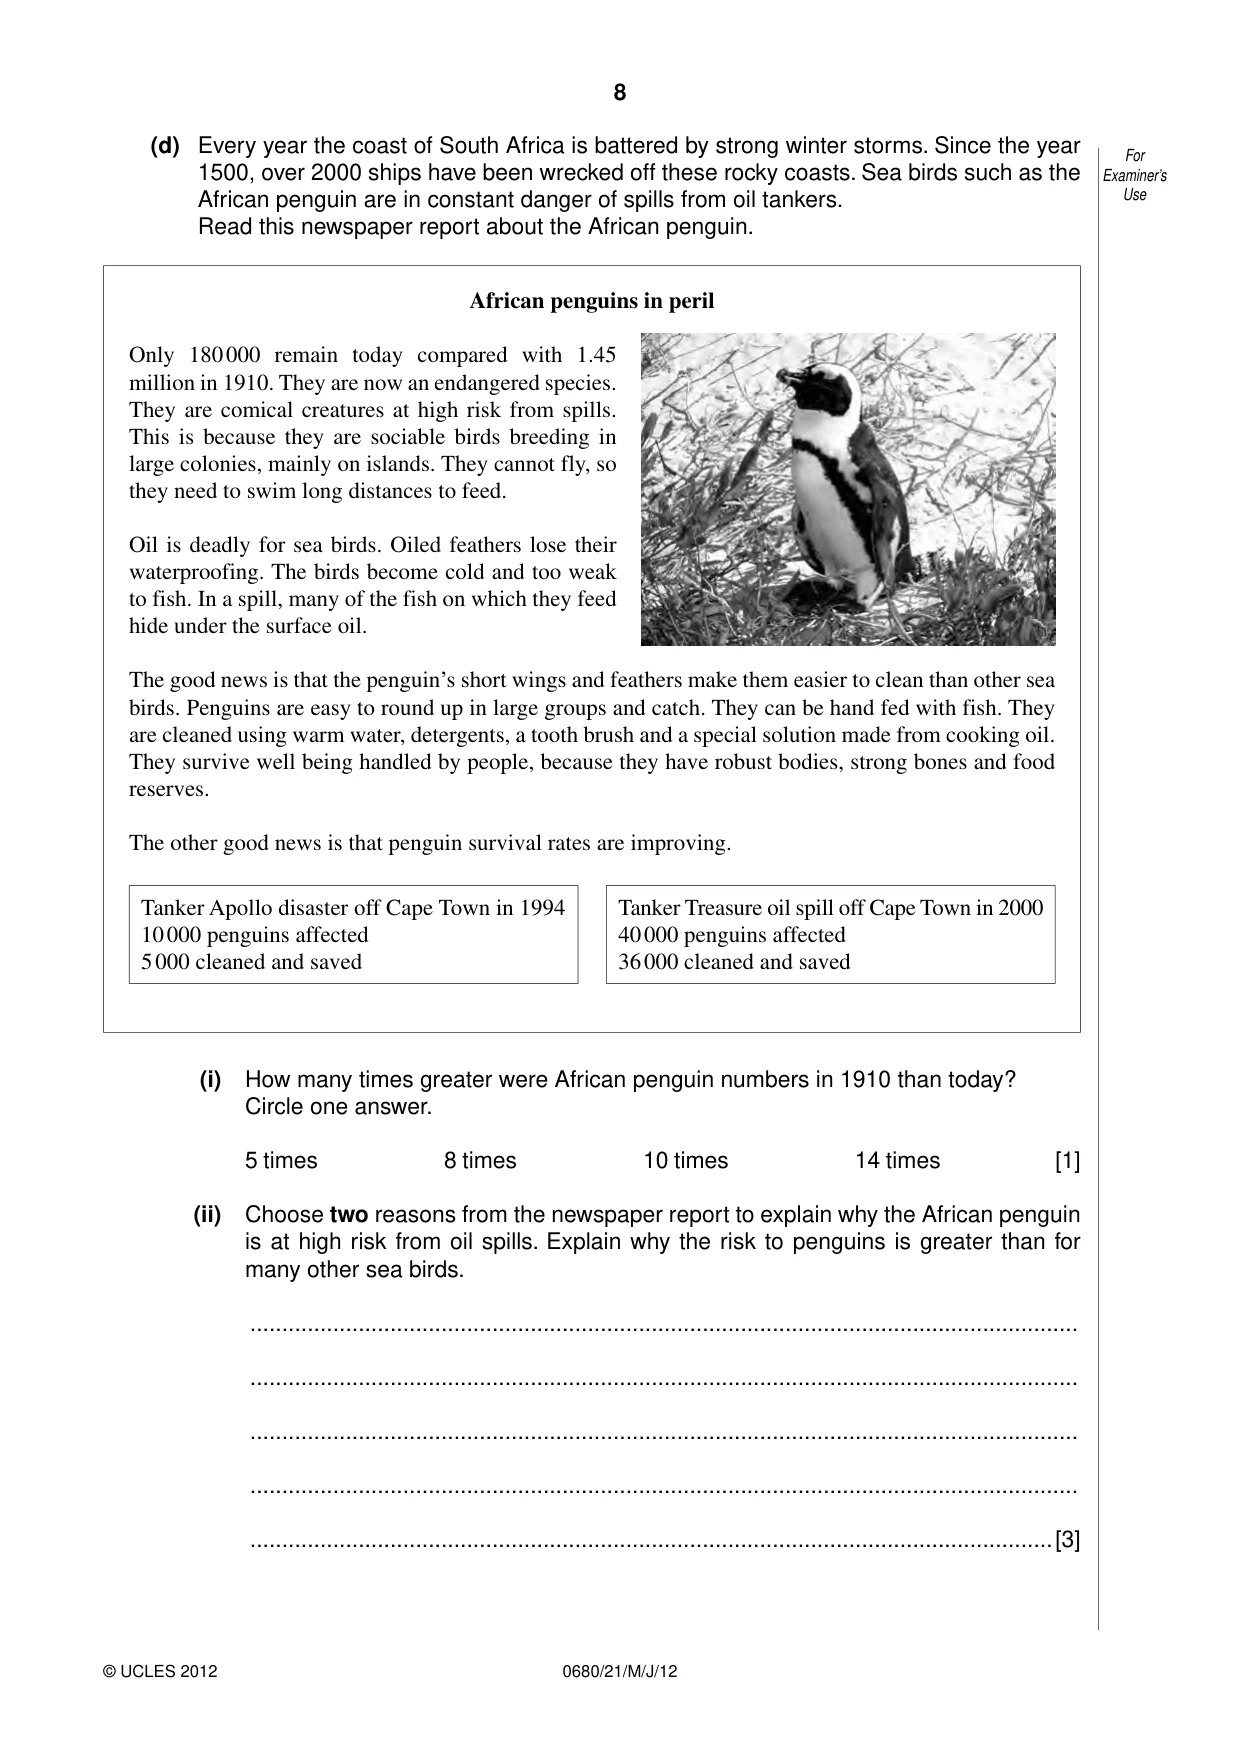
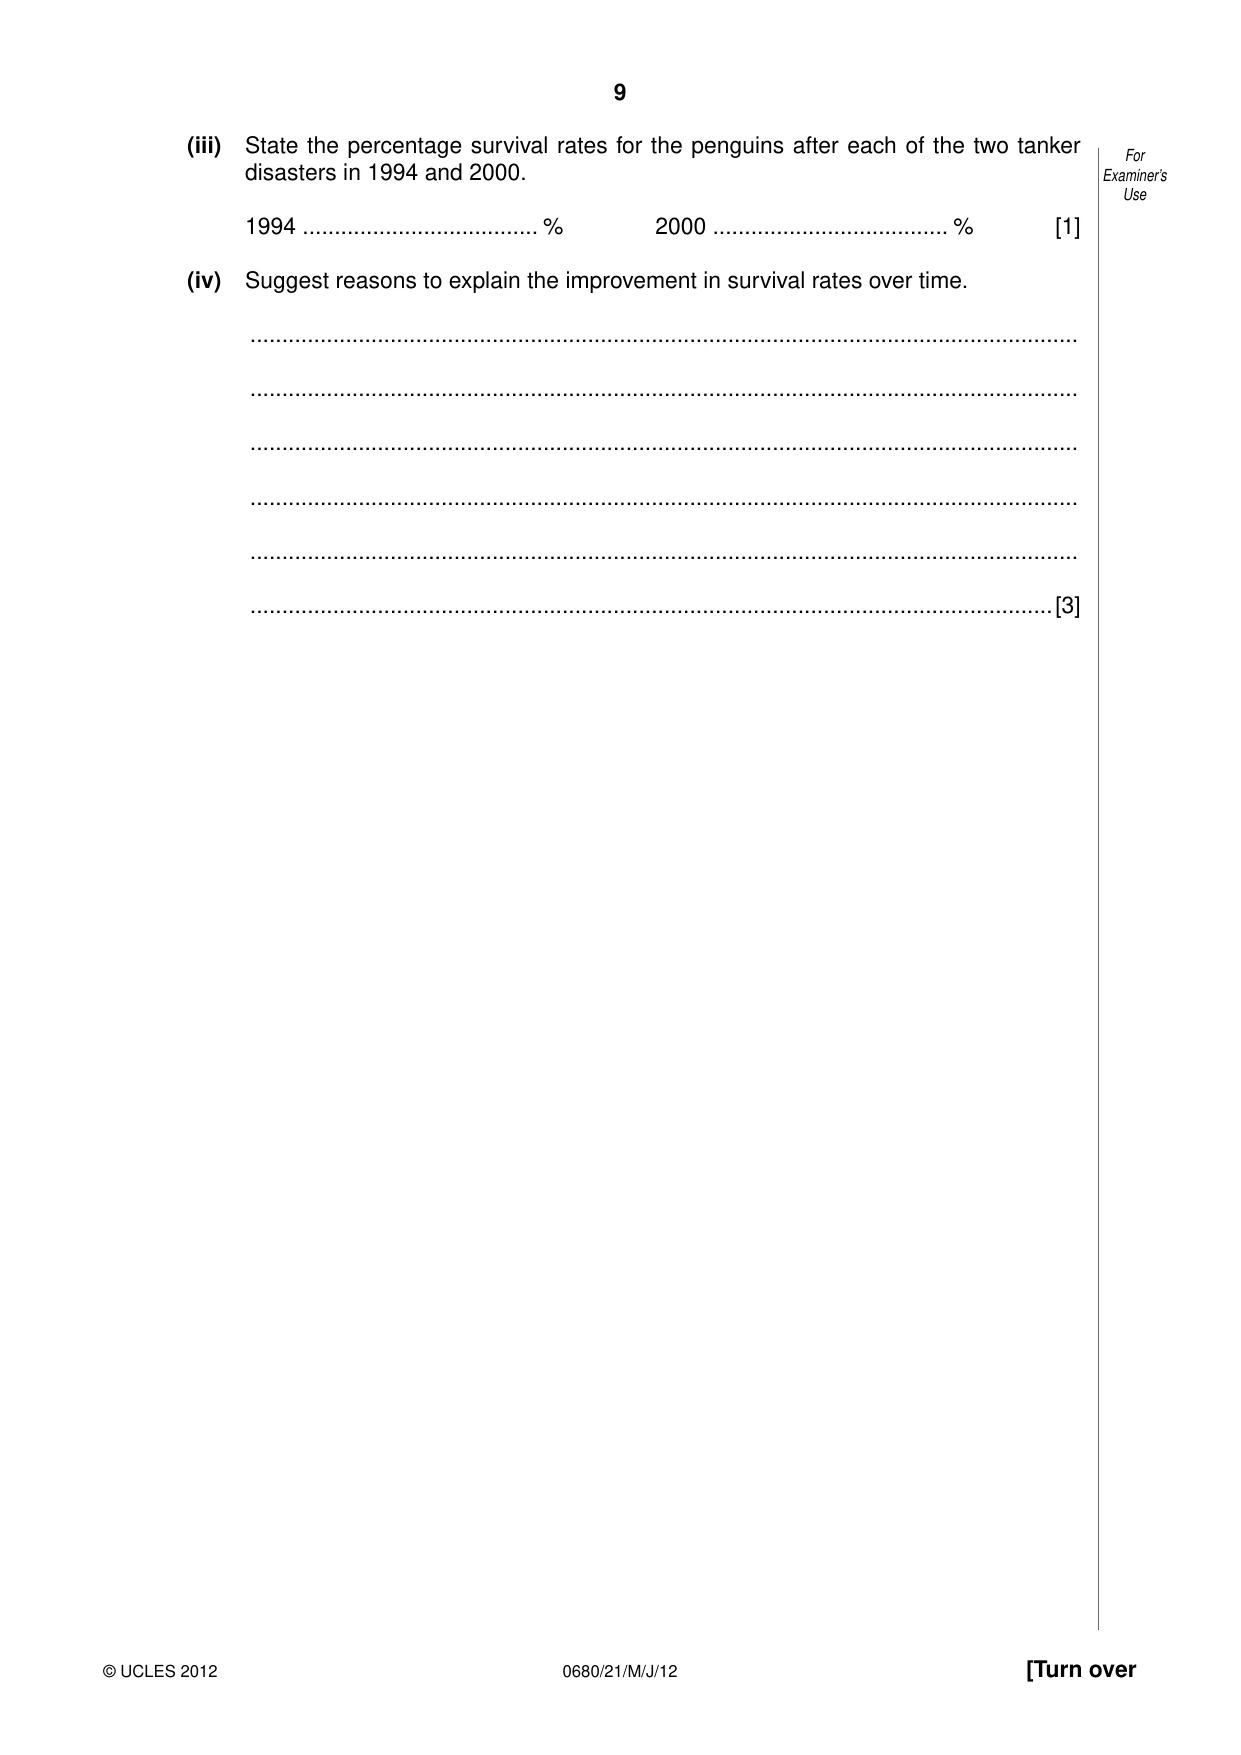
8 0680/21/M/J/12 © UCLES 2012 For Examiner’s Use (d) Every year the coast of South Africa is battered by strong winter storms. Since the year 1500, over 2000 ships have been wrecked off these rocky coasts. Sea birds such as the African penguin are in constant danger of spills from oil tankers. Read this newspaper report about the African penguin. African penguins in peril Only 180 000 remain today compared with 1.45 million in 1910. They are now an endangered species. They are comical creatures at high risk from spills. This is because they are sociable birds breeding in large colonies, mainly on islands. They cannot fly, so they need to swim long distances to feed. Oil is deadly for sea birds. Oiled feathers lose their waterproofing. The birds become cold and too weak to fish. In a spill, many of the fish on which they feed hide under the surface oil. The good news is that the penguin’s short wings and feathers make them easier to clean than other sea birds. Penguins are easy to round up in large groups and catch. They can be hand fed with fish. They are cleaned using warm water, detergents, a tooth brush and a special solution made from cooking oil. They survive well being handled by people, because they have robust bodies, strong bones and food reserves. The other good news is that penguin survival rates are improving. Tanker Apollo disaster off Cape Town in 1994 10 000 penguins affected 5 000 cleaned and saved Tanker Treasure oil spill off Cape Town in 2000 40 000 penguins affected 36 000 cleaned and saved (i) How many times greater were African penguin numbers in 1910 than today? Circle one answer. 5 times 8 times 10 times 14 times [1] (ii) Choose two reasons from the newspaper report to explain why the African penguin is at high risk from oil spills. Explain why the risk to penguins is greater than for many other sea birds. … … … … …[3]
Question paper, page 9
9 0680/21/M/J/12 © UCLES 2012 [Turn over For Examiner’s Use (iii) State the percentage survival rates for the penguins after each of the two tanker disasters in 1994 and 2000. 1994 … % 2000 … % [1] (iv) Suggest reasons to explain the improvement in survival rates over time. … … … … … …[3]
Question paper, page 10
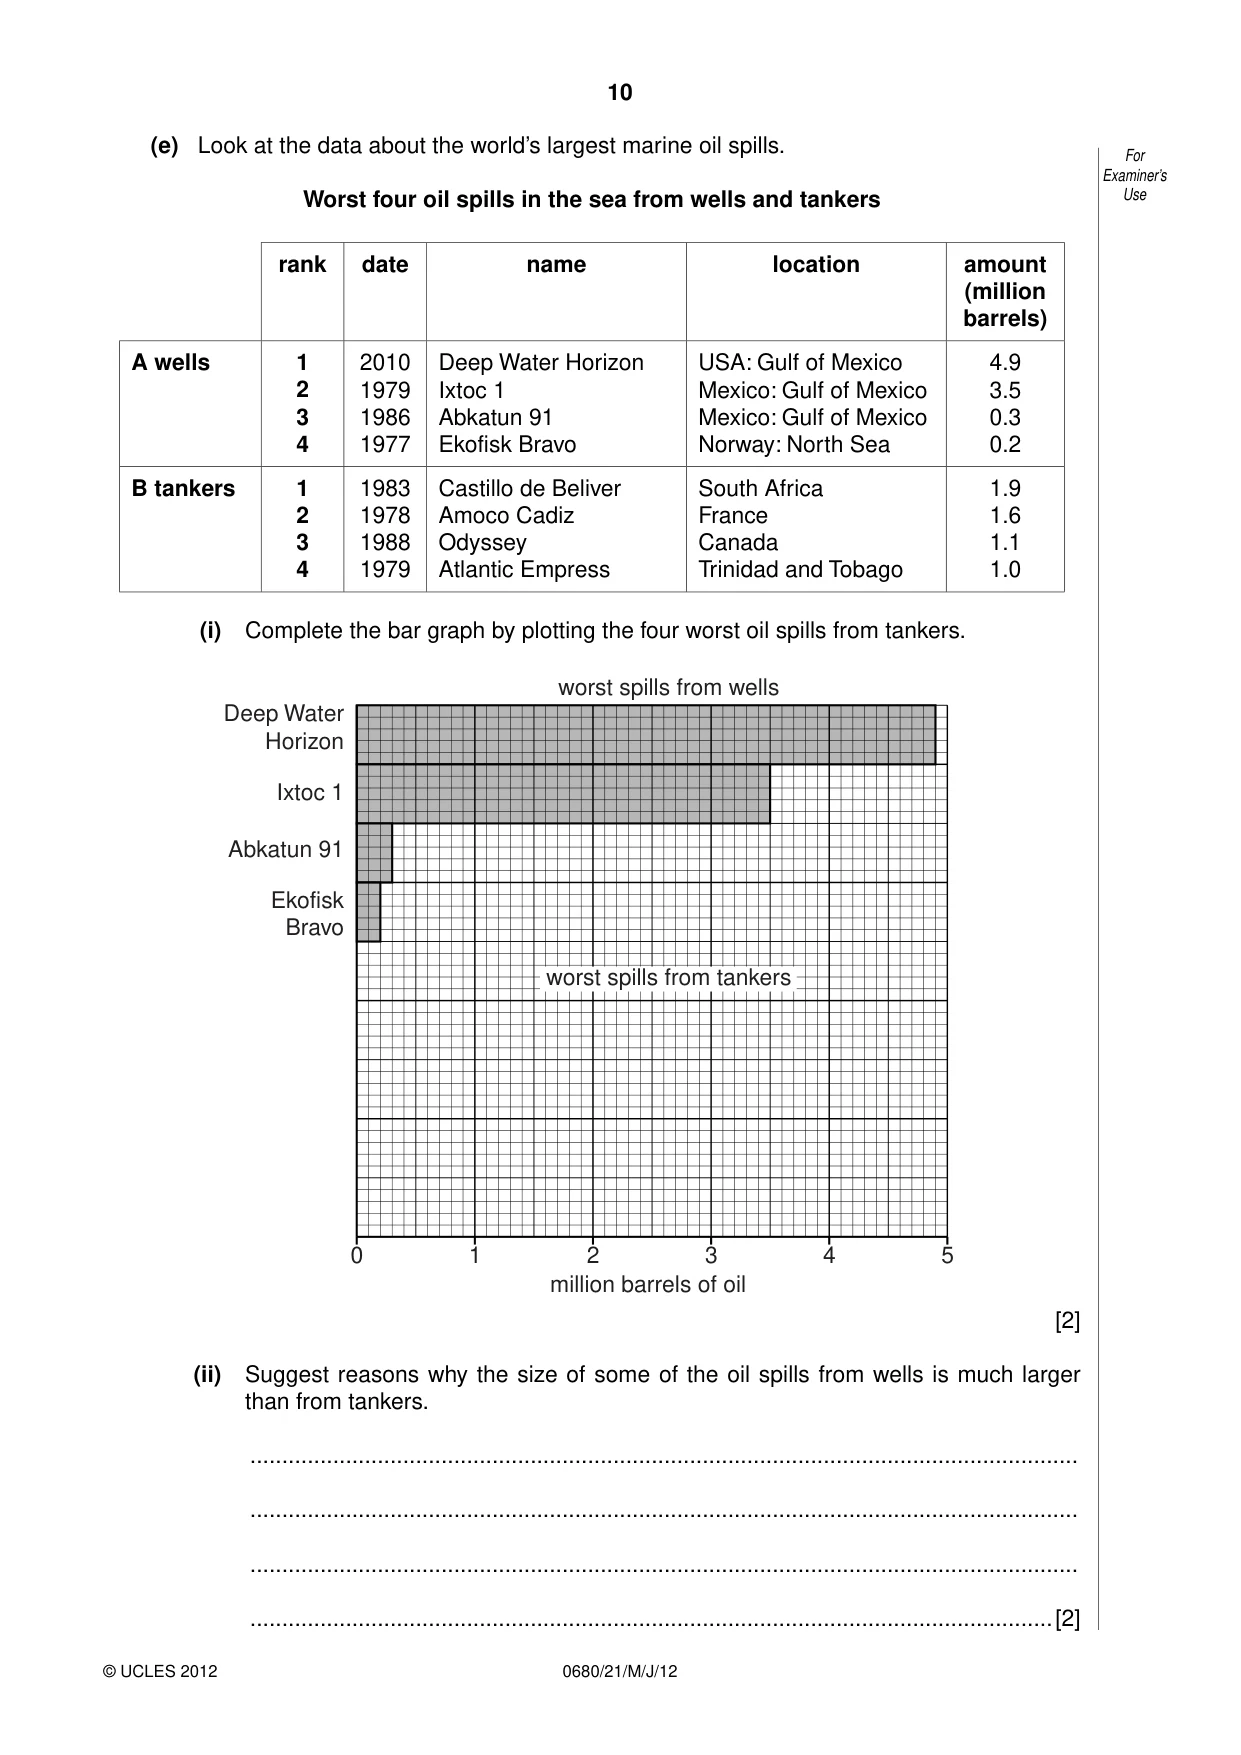
10 0680/21/M/J/12 © UCLES 2012 For Examiner’s Use (e) Look at the data about the world’s largest marine oil spills. Worst four oil spills in the sea from wells and tankers rank date name location amount (million barrels) A wells 1 2 3 4 2010 1979 1986 1977 Deep Water Horizon Ixtoc 1 Abkatun 91 Ekofisk Bravo USA: Gulf of Mexico Mexico: Gulf of Mexico Mexico: Gulf of Mexico Norway: North Sea 4.9 3.5 0.3 0.2 B tankers 1 2 3 4 1983 1978 1988 1979 Castillo de Beliver Amoco Cadiz Odyssey Atlantic Empress South Africa France Canada Trinidad and Tobago 1.9 1.6 1.1 1.0 (i) Complete the bar graph by plotting the four worst oil spills from tankers. 0 1 2 3 million barrels of oil 4 5 Deep Water Horizon worst spills from wells Ixtoc 1 Abkatun 91 Ekofisk Bravo worst spills from tankers [2] (ii) Suggest reasons why the size of some of the oil spills from wells is much larger than from tankers. … … … …[2]
Question paper, page 11
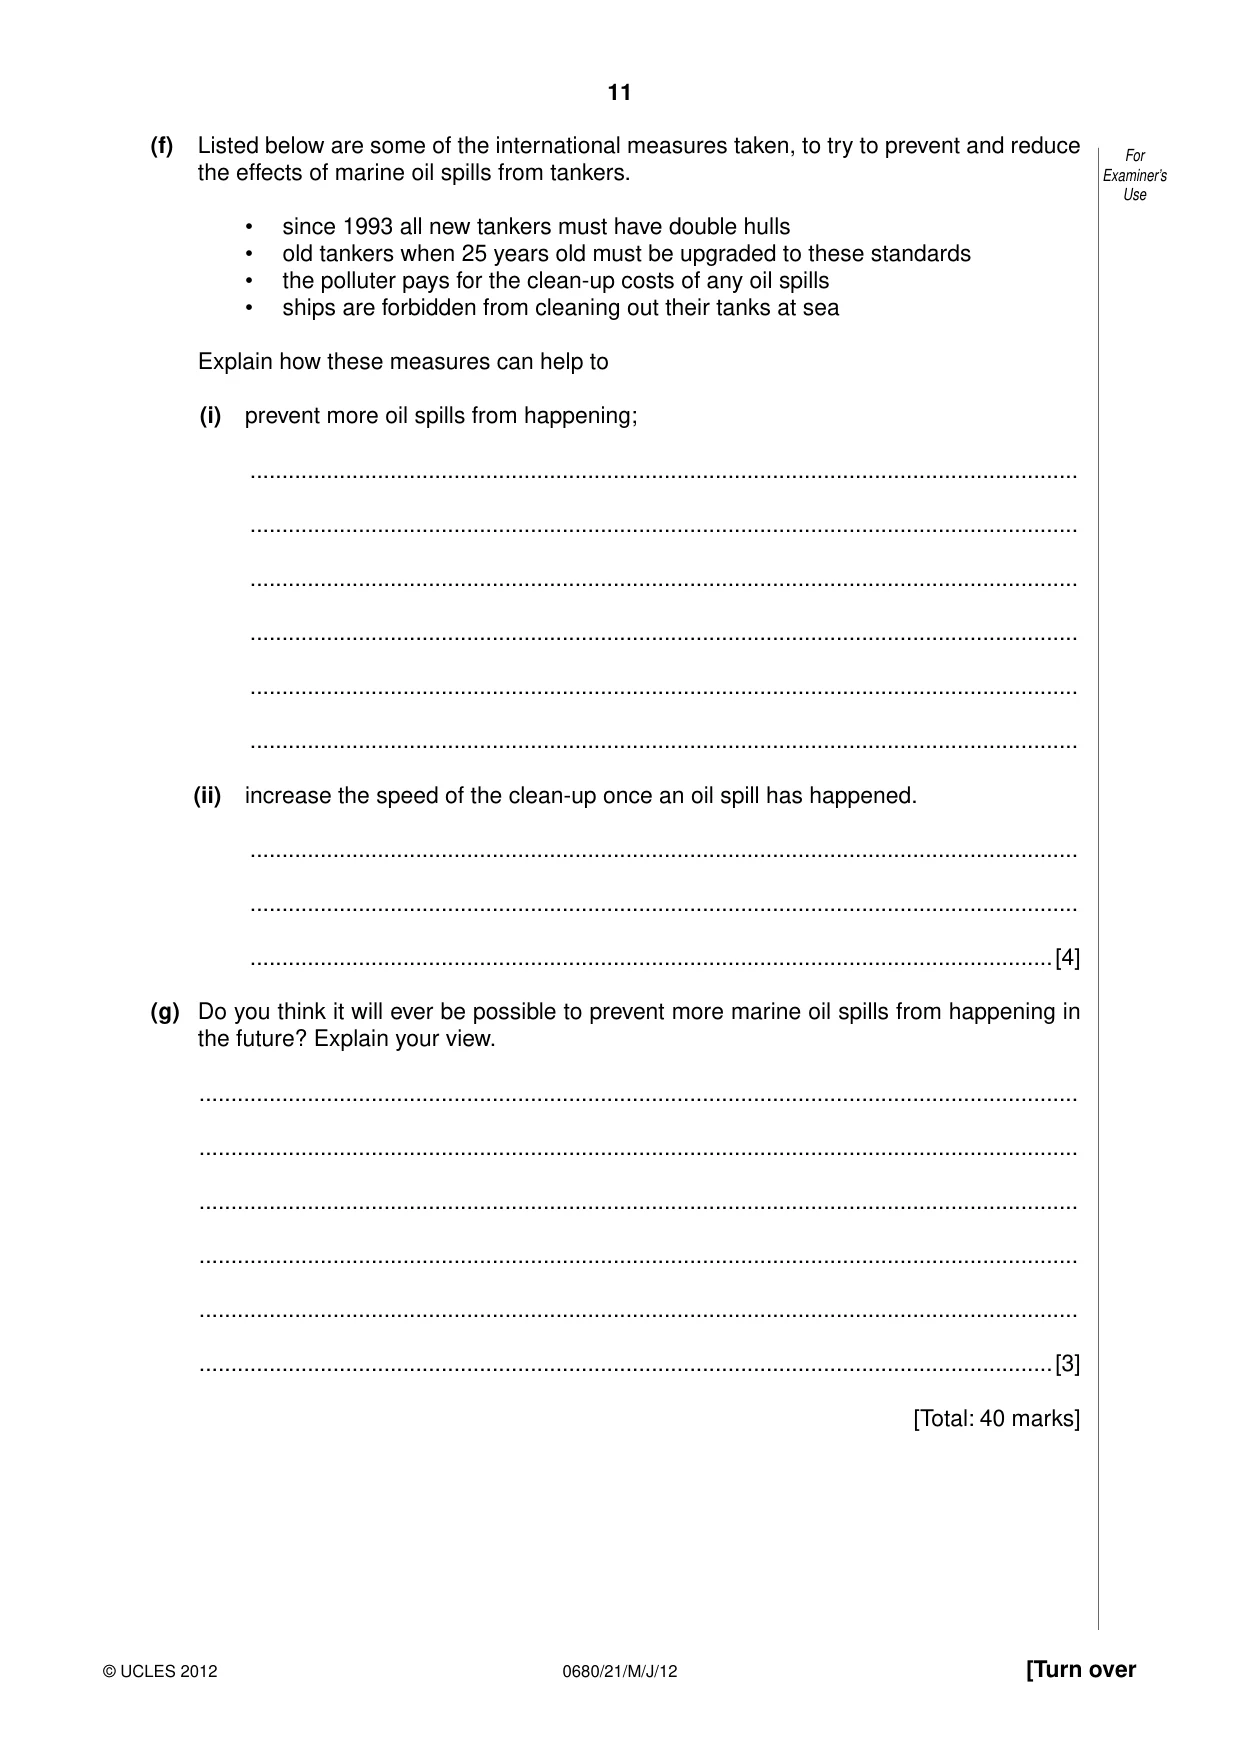
11 0680/21/M/J/12 © UCLES 2012 [Turn over For Examiner’s Use (f) Listed below are some of the international measures taken, to try to prevent and reduce the effects of marine oil spills from tankers. • since 1993 all new tankers must have double hulls • old tankers when 25 years old must be upgraded to these standards • the polluter pays for the clean-up costs of any oil spills • ships are forbidden from cleaning out their tanks at sea Explain how these measures can help to (i) prevent more oil spills from happening; … … … … … … (ii) increase the speed of the clean-up once an oil spill has happened. … … …[4] (g) Do you think it will ever be possible to prevent more marine oil spills from happening in the future? Explain your view. … … … … … …[3] [Total: 40 marks]
Question paper, page 12
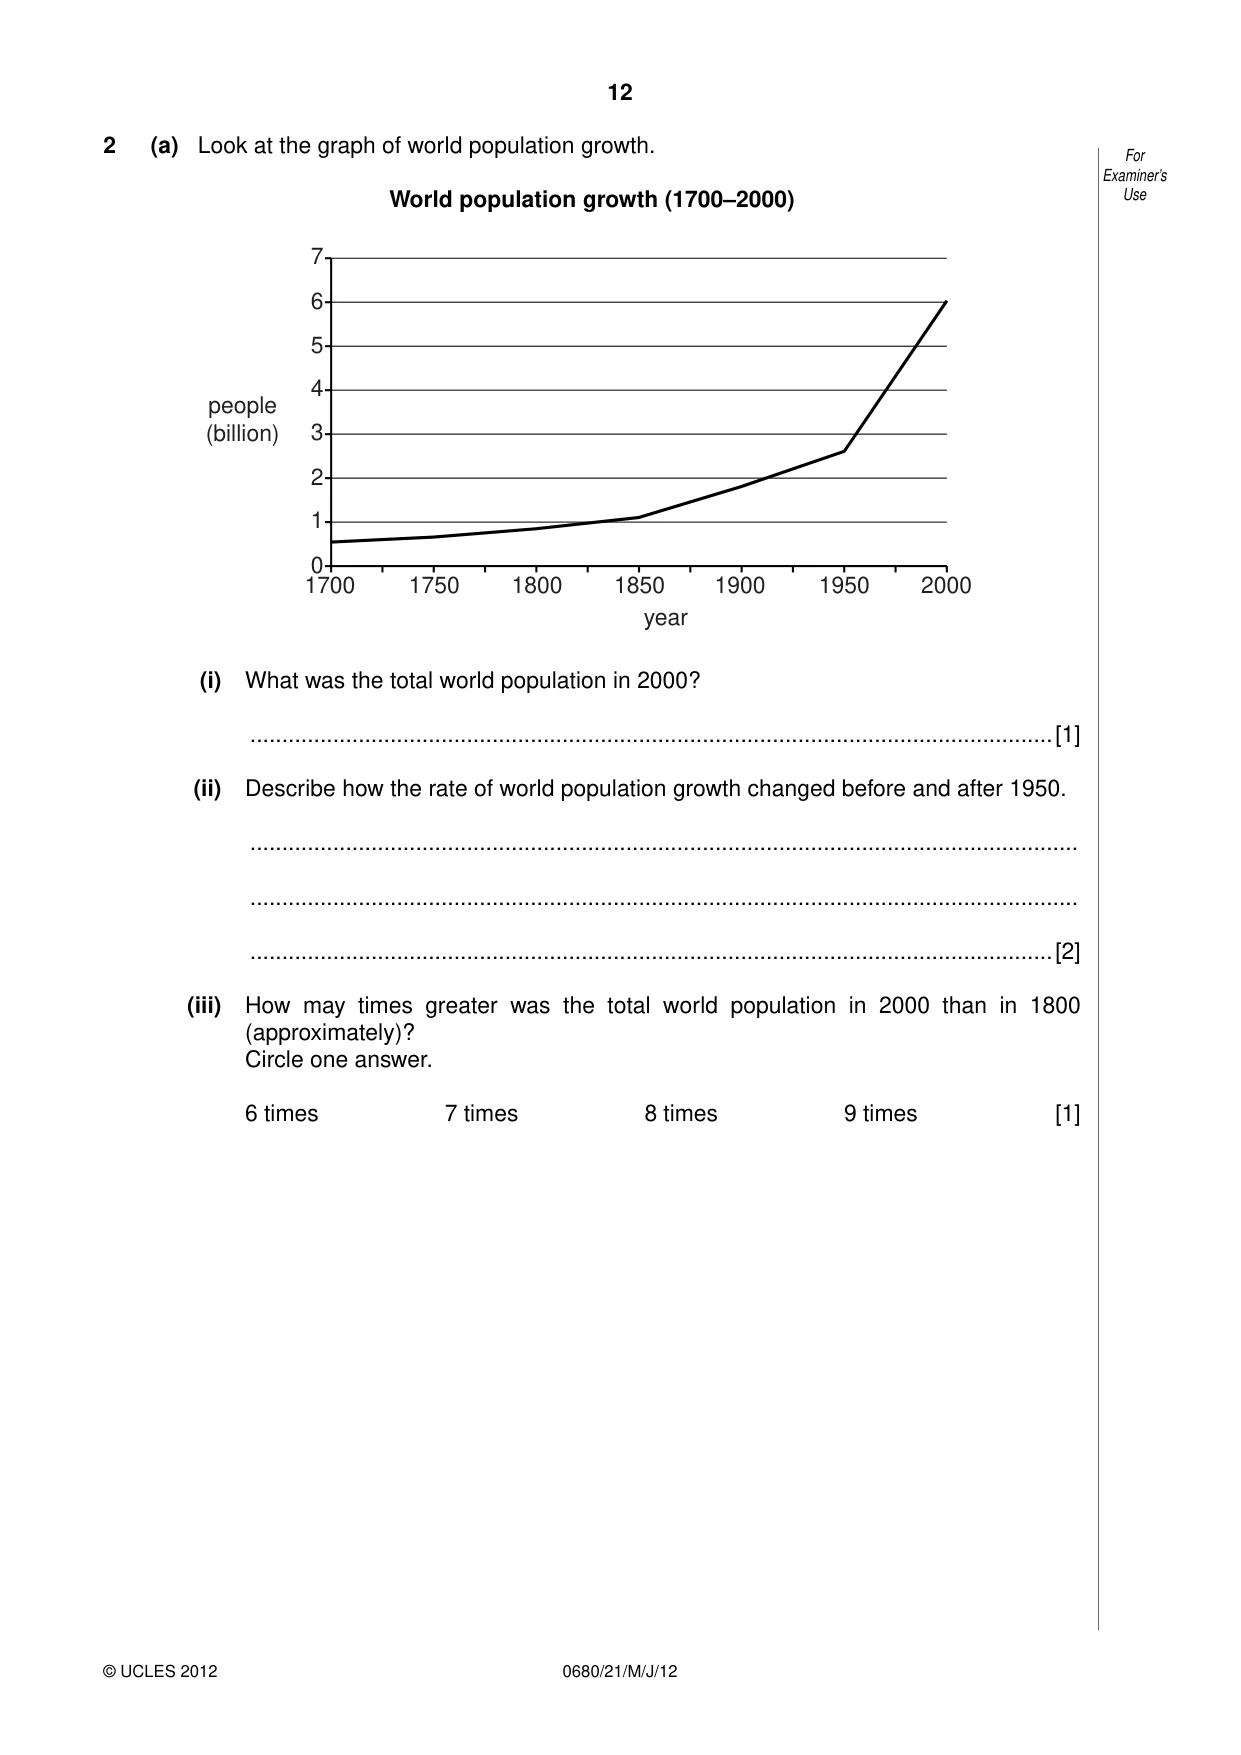
12 0680/21/M/J/12 © UCLES 2012 For Examiner’s Use 2 (a) Look at the graph of world population growth. World population growth (1700–2000) 7 6 5 4 3 2 1 0 1700 1750 1800 1850 year people (billion) 1900 1950 2000 (i) What was the total world population in 2000? …[1] (ii) Describe how the rate of world population growth changed before and after 1950. … … …[2] (iii) How may times greater was the total world population in 2000 than in 1800 (approximately)? Circle one answer. 6 times 7 times 8 times 9 times [1]
Question paper, page 13
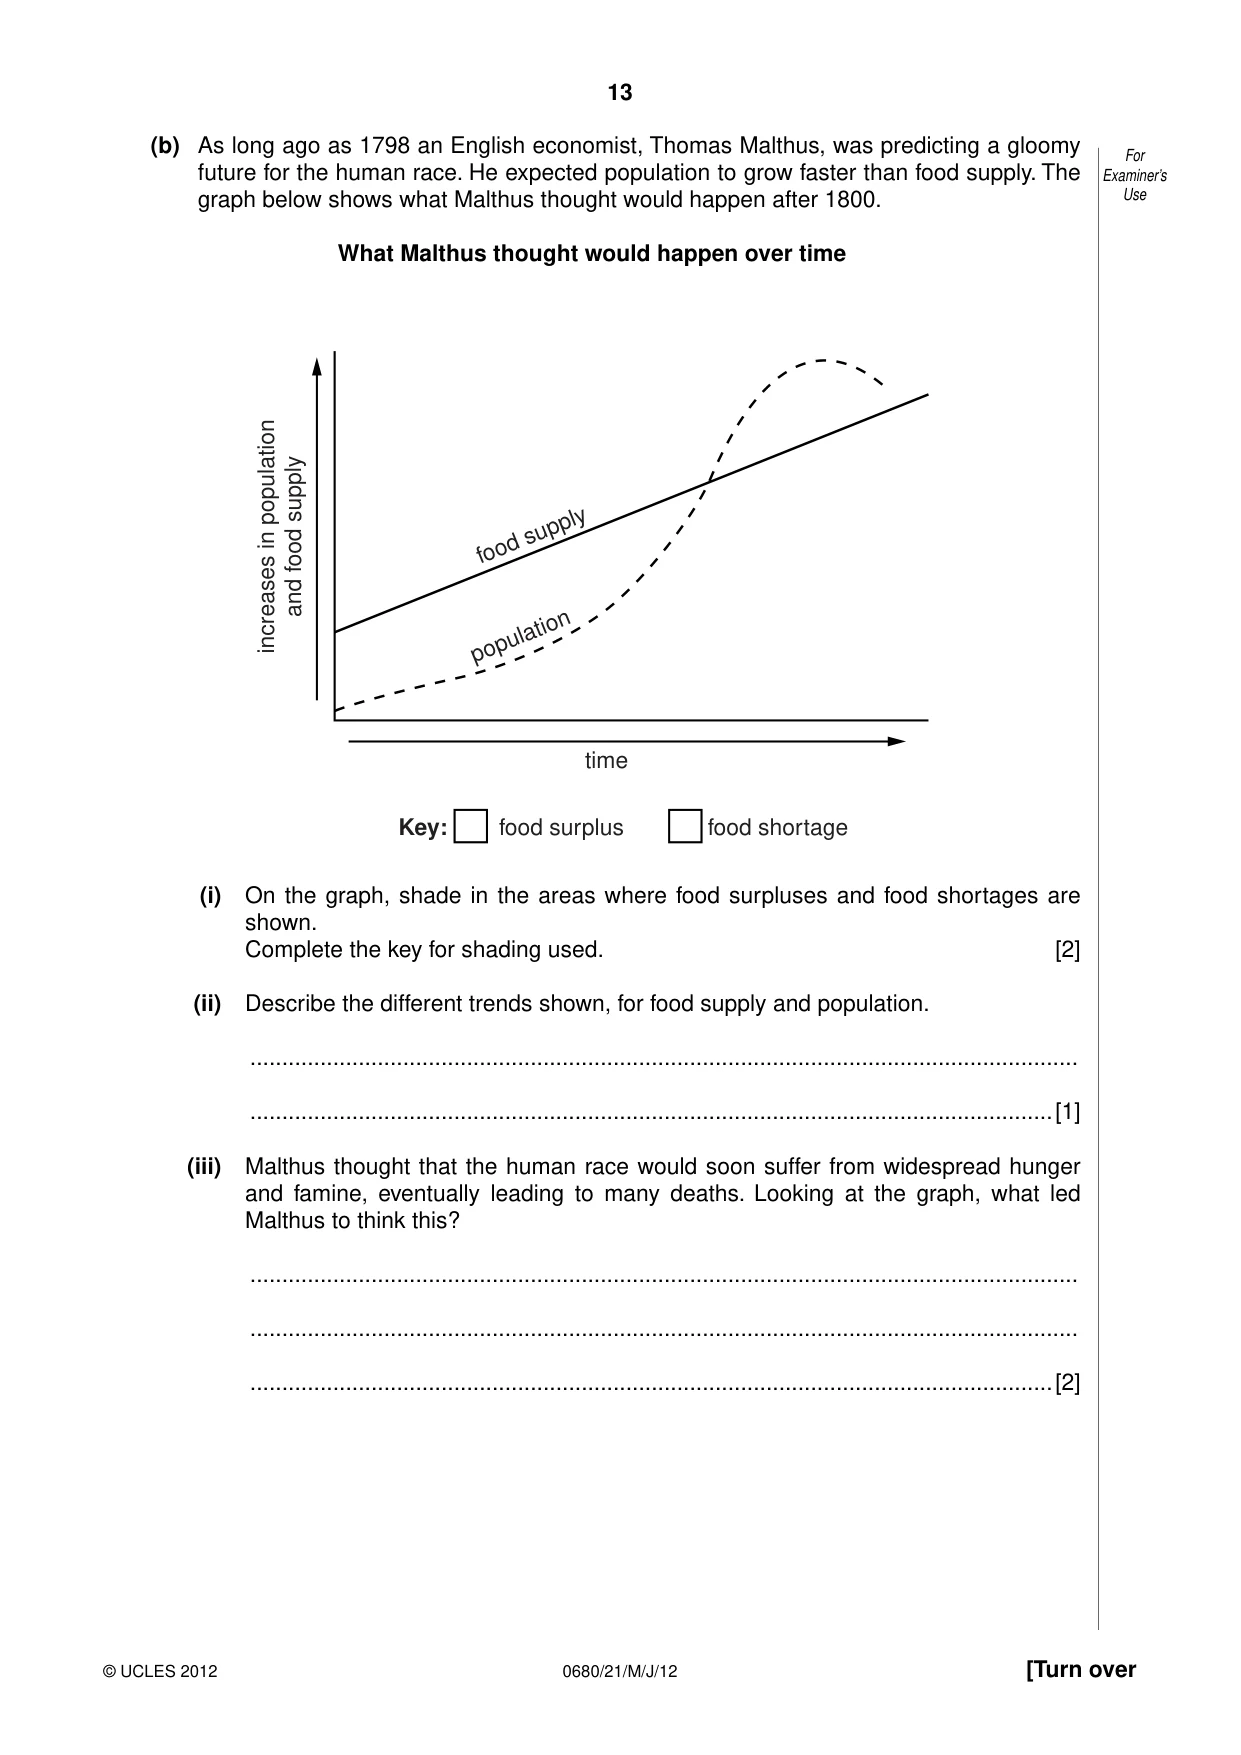
13 0680/21/M/J/12 © UCLES 2012 [Turn over For Examiner’s Use (b) As long ago as 1798 an English economist, Thomas Malthus, was predicting a gloomy future for the human race. He expected population to grow faster than food supply. The graph below shows what Malthus thought would happen after 1800. What Malthus thought would happen over time time food supply population increases in population and food supply food surplus Key: food shortage (i) On the graph, shade in the areas where food surpluses and food shortages are shown. Complete the key for shading used. [2] (ii) Describe the different trends shown, for food supply and population. … …[1] (iii) Malthus thought that the human race would soon suffer from widespread hunger and famine, eventually leading to many deaths. Looking at the graph, what led Malthus to think this? … … …[2]
Question paper, page 14
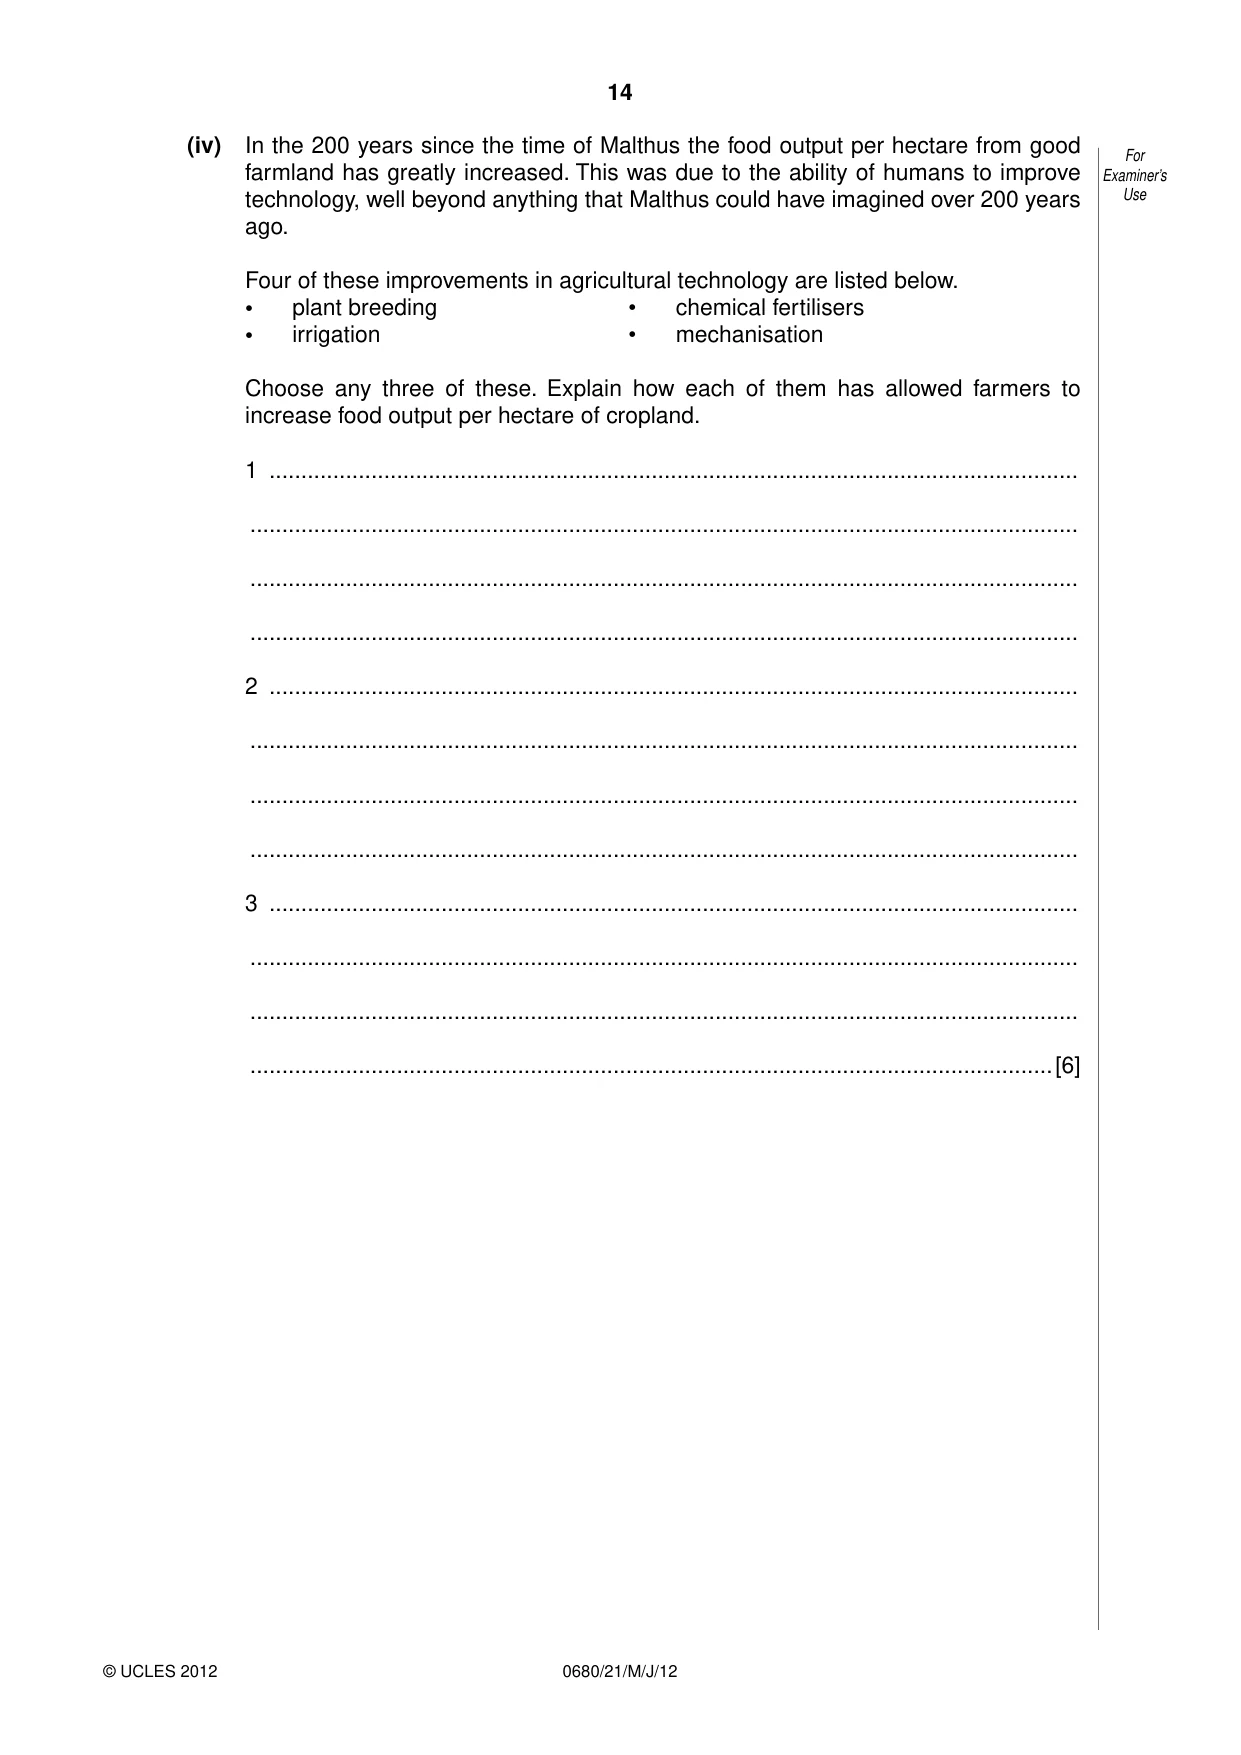
14 0680/21/M/J/12 © UCLES 2012 For Examiner’s Use (iv) In the 200 years since the time of Malthus the food output per hectare from good farmland has greatly increased. This was due to the ability of humans to improve technology, well beyond anything that Malthus could have imagined over 200 years ago. Four of these improvements in agricultural technology are listed below. • plant breeding • chemical fertilisers • irrigation • mechanisation Choose any three of these. Explain how each of them has allowed farmers to increase food output per hectare of cropland. 1 … … … … 2 … … … … 3 … … … …[6]
Question paper, page 15
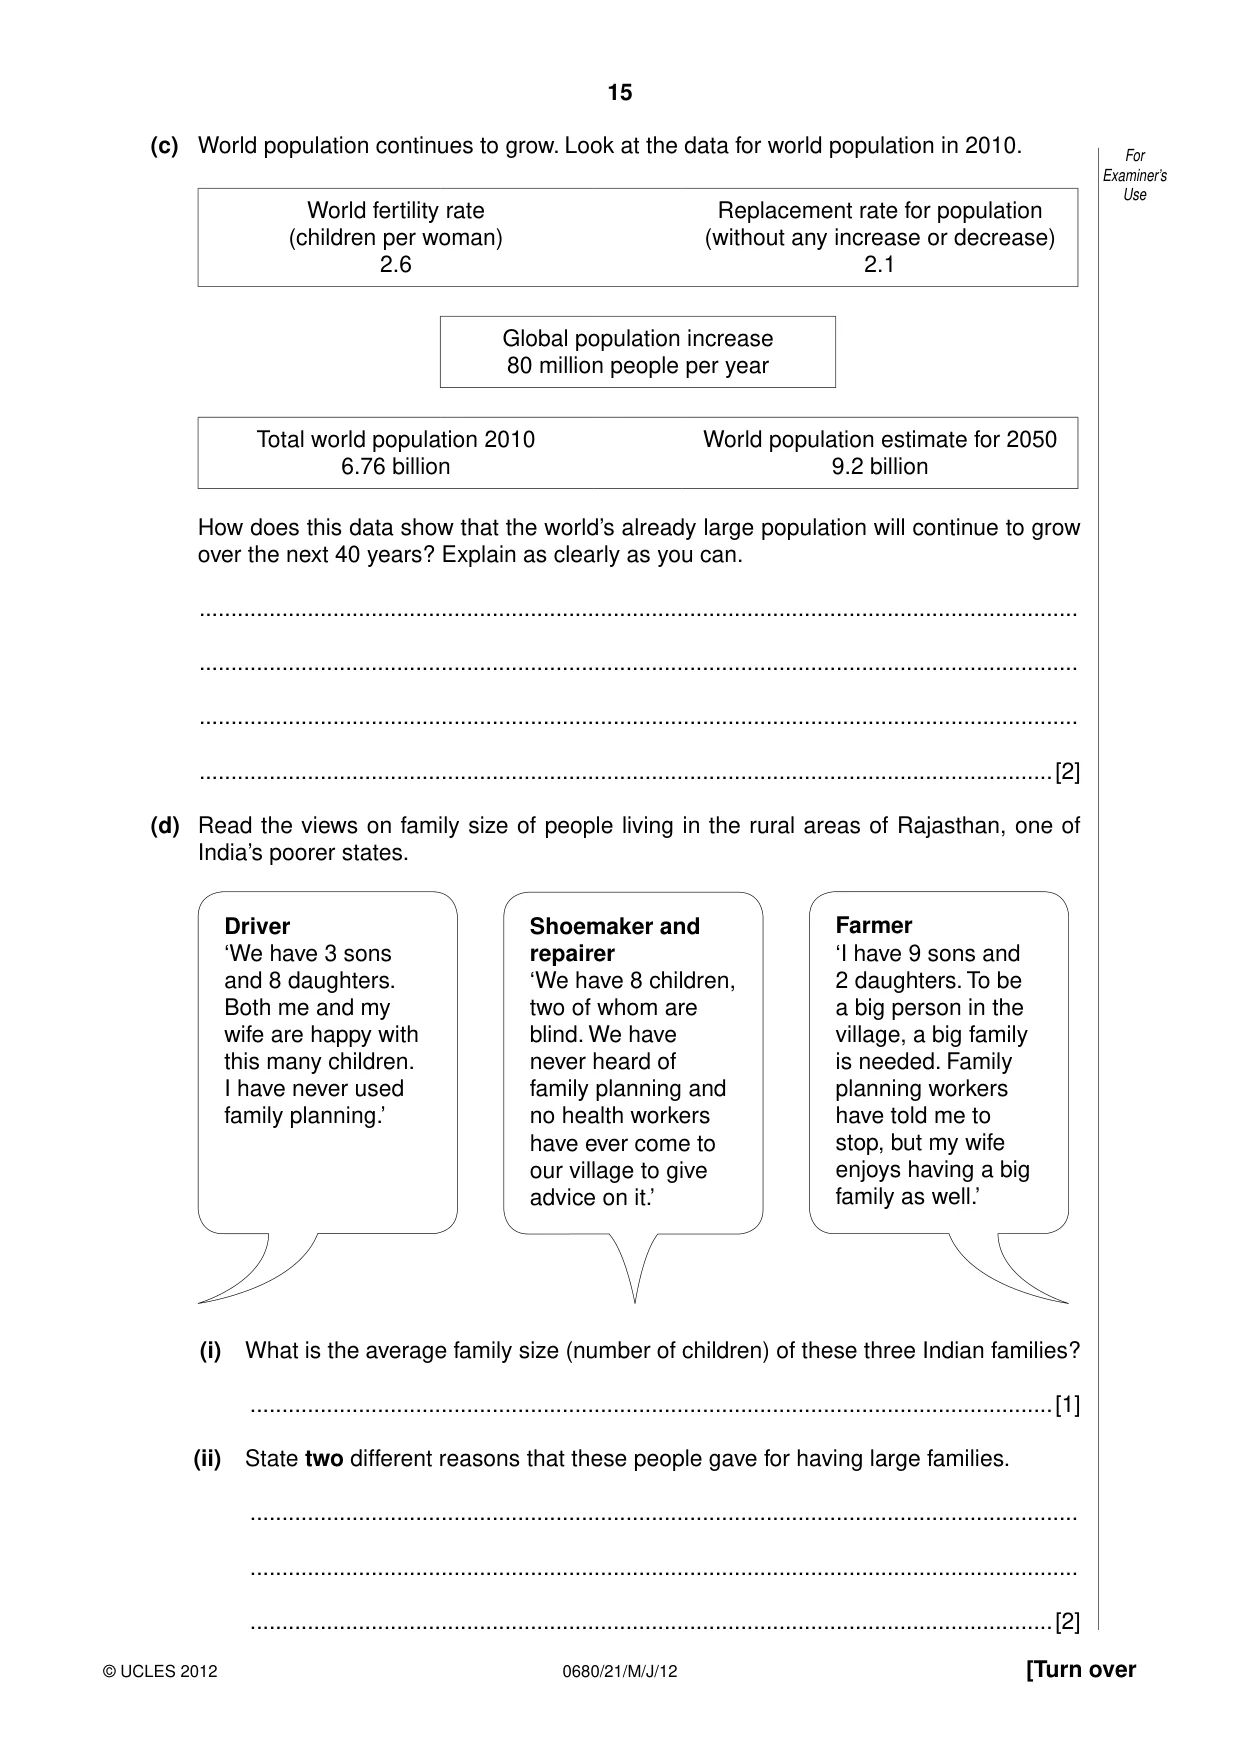
15 0680/21/M/J/12 © UCLES 2012 [Turn over For Examiner’s Use (c) World population continues to grow. Look at the data for world population in 2010. World fertility rate (children per woman) 2.6 Replacement rate for population (without any increase or decrease) 2.1 Global population increase 80 million people per year Total world population 2010 6.76 billion World population estimate for 2050 9.2 billion How does this data show that the world’s already large population will continue to grow over the next 40 years? Explain as clearly as you can. … … … …[2] (d) Read the views on family size of people living in the rural areas of Rajasthan, one of India’s poorer states. Driver ‘We have 3 sons and 8 daughters. Both me and my wife are happy with this many children. I have never used family planning.’ Shoemaker and repairer ‘We have 8 children, two of whom are blind. We have never heard of family planning and no health workers have ever come to our village to give advice on it.’ Farmer ‘I have 9 sons and 2 daughters. To be a big person in the village, a big family is needed. Family planning workers have told me to stop, but my wife enjoys having a big family as well.’ (i) What is the average family size (number of children) of these three Indian families? …[1] (ii) State two different reasons that these people gave for having large families. … … …[2]
Question paper, page 16
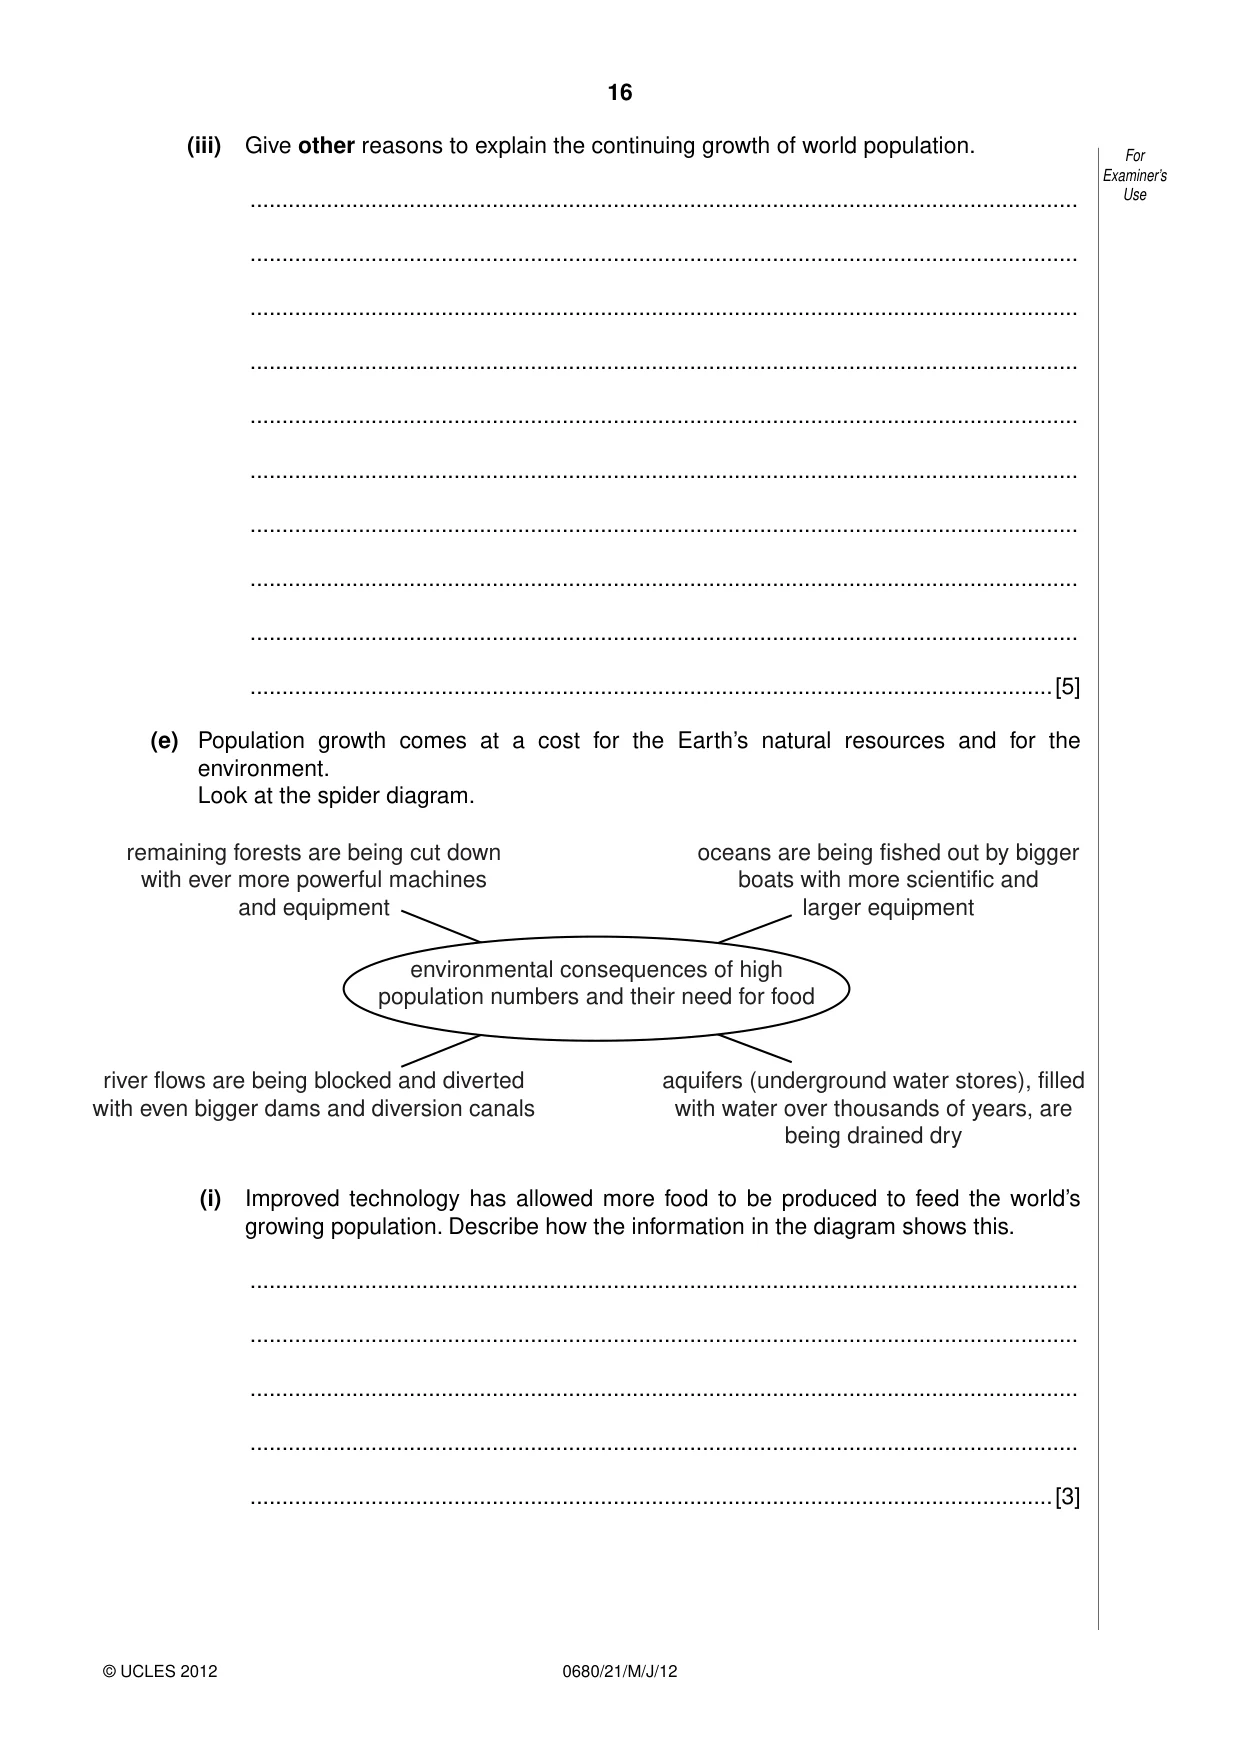
16 0680/21/M/J/12 © UCLES 2012 For Examiner’s Use (iii) Give other reasons to explain the continuing growth of world population. … … … … … … … … … …[5] (e) Population growth comes at a cost for the Earth’s natural resources and for the environment. Look at the spider diagram. remaining forests are being cut down with ever more powerful machines and equipment oceans are being fished out by bigger boats with more scientific and larger equipment river flows are being blocked and diverted with even bigger dams and diversion canals aquifers (underground water stores), filled with water over thousands of years, are being drained dry environmental consequences of high population numbers and their need for food (i) Improved technology has allowed more food to be produced to feed the world’s growing population. Describe how the information in the diagram shows this. … … … … …[3]
Question paper, page 17
17 0680/21/M/J/12 © UCLES 2012 [Turn over For Examiner’s Use (ii) Why are the human actions and activities mentioned in the diagram unsustainable in the long-term? Explain as fully as you can. … … … … … … … … … …[5] (iii) Choose any two of the actions and activities named in the diagram. Describe how each one can be done in a more sustainable way, taking more account of the needs of future generations of people. 1 … … … … 2 … … … …[4]
Question paper, page 18
18 0680/21/M/J/12 © UCLES 2012 For Examiner’s Use (f) Could the gloomy view of Malthus in 1798 that the human race will suffer from widespread hunger, famine and deaths come true within the next 40 years – more than 200 years after he made his prediction? What do you think? Explain your views about this. … … … … … …[3] [Total: 40 marks]
Question paper, page 19
19 0680/21/M/J/12 © UCLES 2012 BLANK PAGE
Question paper, page 20
20 0680/21/M/J/12 © UCLES 2012 Copyright Acknowledgements: Question 1d Photograph M Fretwell © UCLES. Permission to reproduce items where third-party owned material protected by copyright is included has been sought and cleared where possible. Every reasonable effort has been made by the publisher (UCLES) to trace copyright holders, but if any items requiring clearance have unwittingly been included, the publisher will be pleased to make amends at the earliest possible opportunity. University of Cambridge International Examinations is part of the Cambridge Assessment Group. Cambridge Assessment is the brand name of University of Cambridge Local Examinations Syndicate (UCLES), which is itself a department of the University of Cambridge. BLANK PAGE
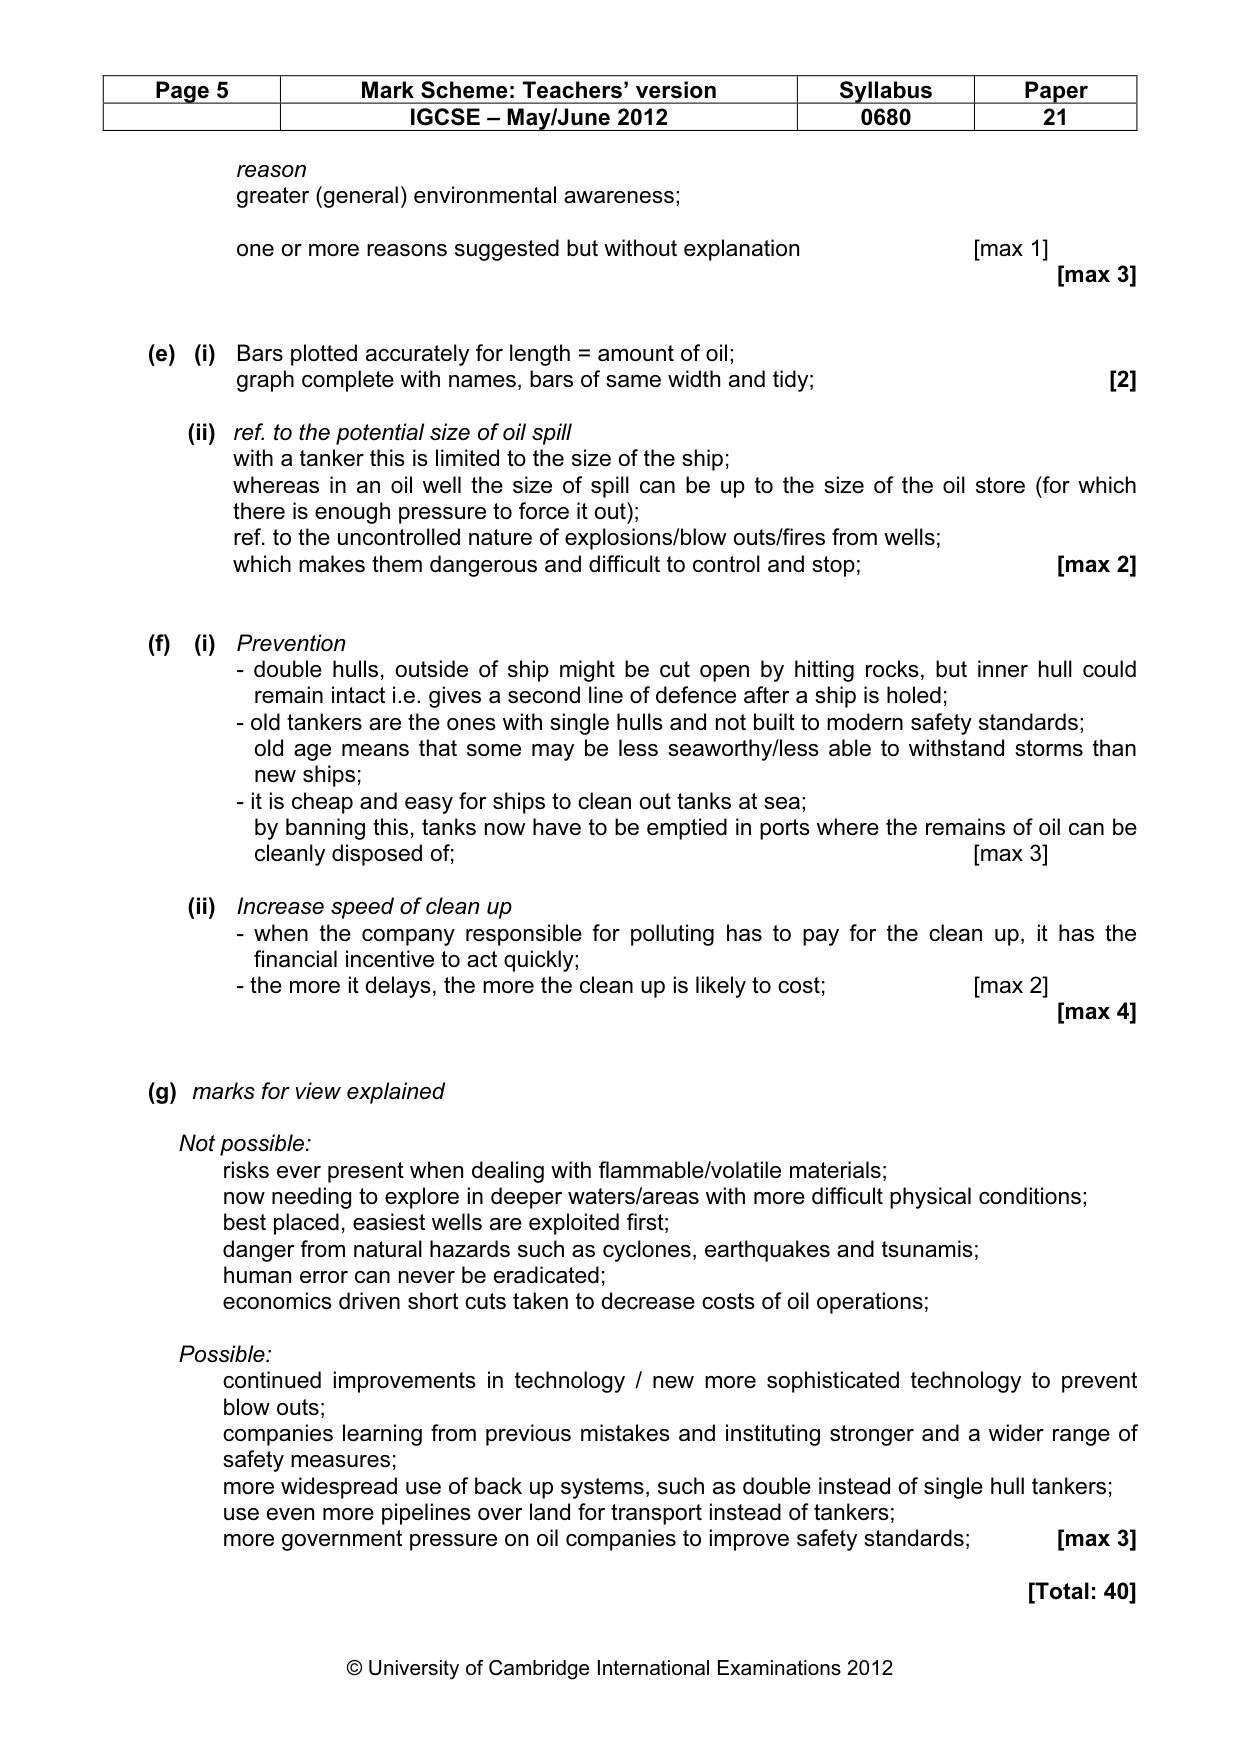
Mark scheme, page 1
UNIVERSITY OF CAMBRIDGE INTERNATIONAL EXAMINATIONS International General Certificate of Secondary Education MARK SCHEME for the May/June 2012 question paper for the guidance of teachers 0680 ENVIRONMENTAL MANAGEMENT 0680/21 Paper 2, maximum raw mark 80 This mark scheme is published as an aid to teachers and candidates, to indicate the requirements of the examination. It shows the basis on which Examiners were instructed to award marks. It does not indicate the details of the discussions that took place at an Examiners’ meeting before marking began, which would have considered the acceptability of alternative answers. Mark schemes must be read in conjunction with the question papers and the report on the examination. • Cambridge will not enter into discussions or correspondence in connection with these mark schemes. Cambridge is publishing the mark schemes for the May/June 2012 question papers for most IGCSE, GCE Advanced Level and Advanced Subsidiary Level syllabuses and some Ordinary Level syllabuses. www.XtremePapers.com
Mark scheme, page 2
Page 2 Mark Scheme: Teachers’ version Syllabus Paper IGCSE – May/June 2012 0680 21 © University of Cambridge International Examinations 2012 General notes Symbols used in Environmental Management mark schemes. / separates alternatives for a marking point – other valid ways of expressing the same idea are also credited ; separates points for the award of a mark [3] indicates the number of marks available [max 3] the number shows the maximum number of marks available for the question where there are more marking points than total marks available [max 3] when part of the marks of a question must come from part of the mark scheme, this is indicated by non-bold marks showing the internal maxima for different parts of the question these non-bold marks are also used to show marks for bands where banded mark schemes are used italic indicates that this is information about the marking points and is not required to gain credit italic text is also used for comments about alternatives that should be accepted, ignored or rejected ora or reverse argument – shows that an argument from an alternative viewpoint will be credited AW alternative wording, sometimes called ‘or words to that effect’ – AW is used when there are many different ways of expressing the same idea ( ) the word / phrase in brackets is not required to gain marks but sets the context of the response for credit e.g. (nuclear) waste – nuclear is not needed but if it was described as a domestic waste then no mark is awarded volcanic underlined words – the answer must contain exactly this word ecf error carried forward – if an incorrect answer is given to part of a question, and this answer is subsequently used by a candidate in later parts of the question, this indicates that the candidate’s incorrect answer will be used as a starting point for marking the later parts of the question
Mark scheme, page 3
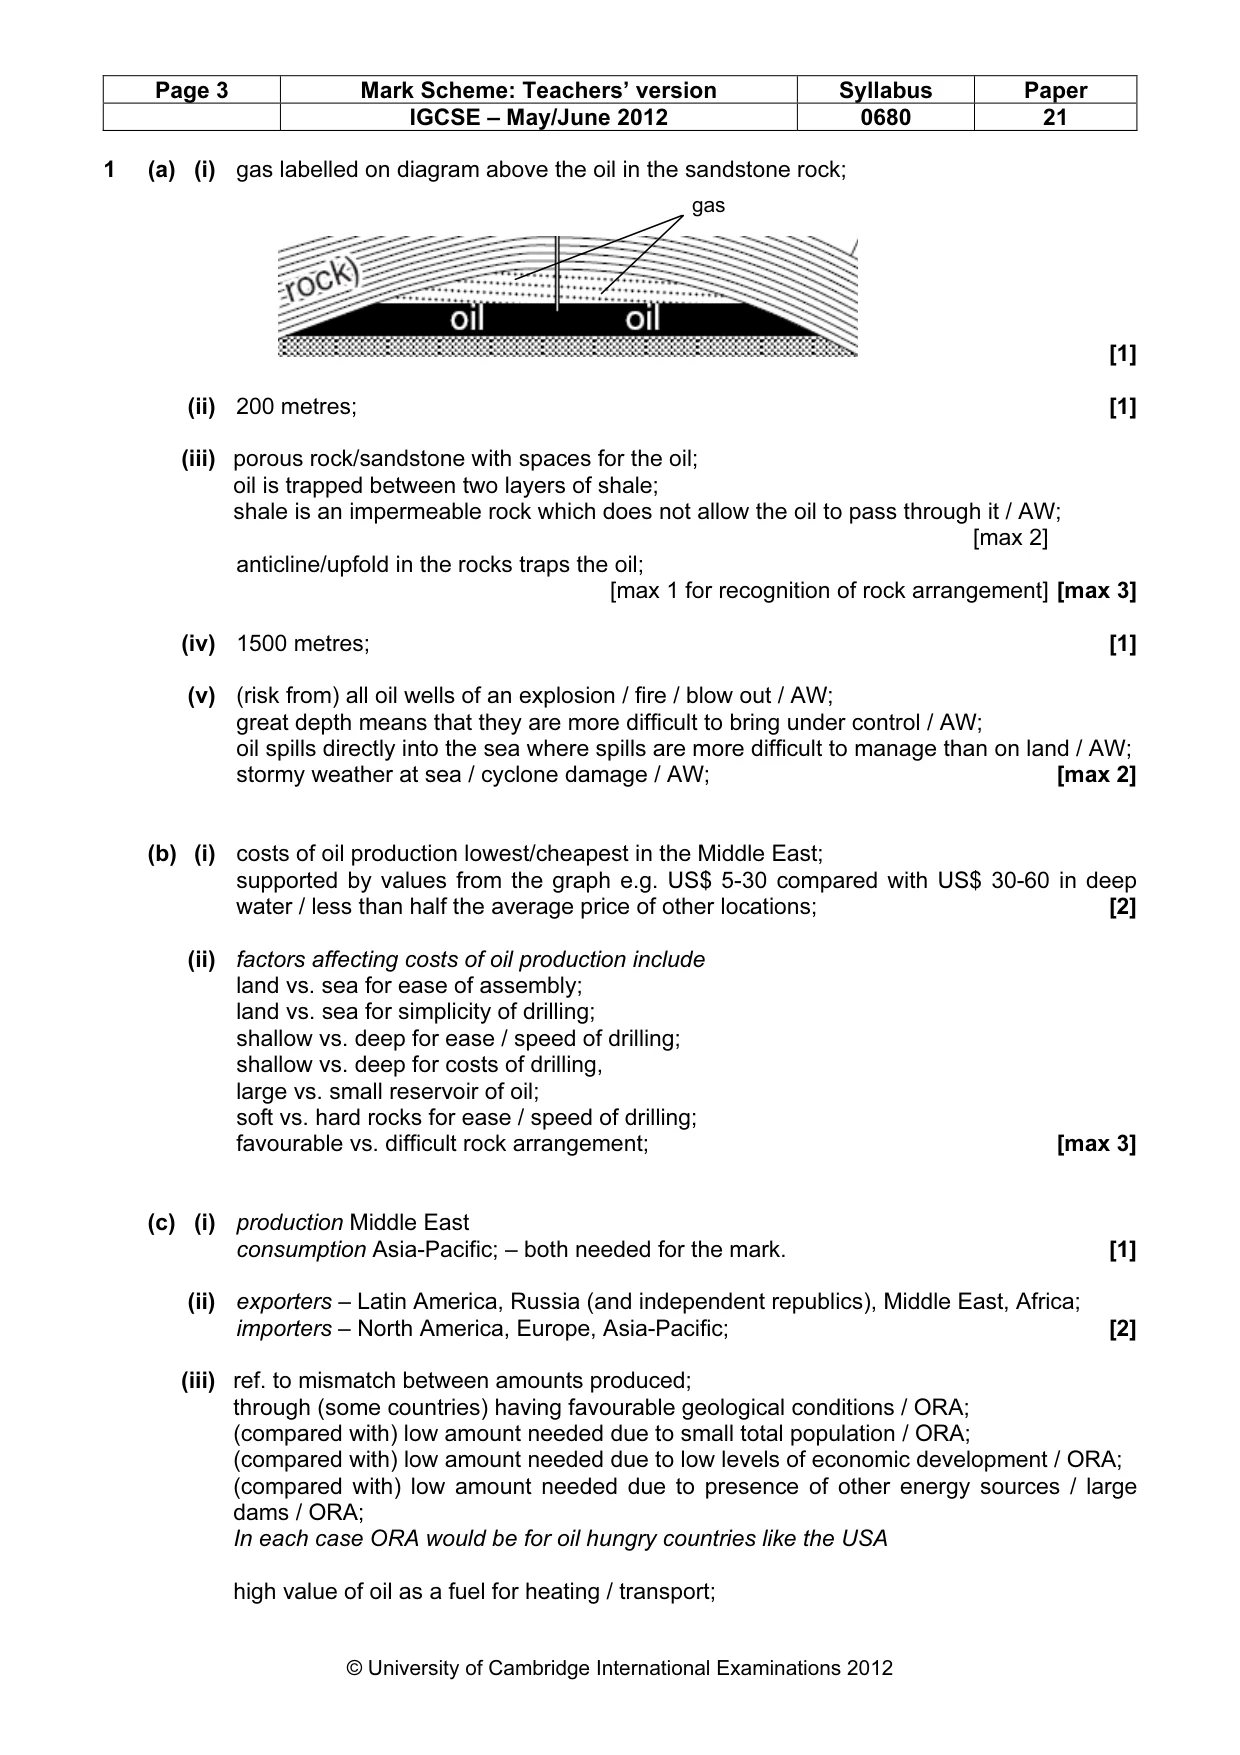
Page 3 Mark Scheme: Teachers’ version Syllabus Paper IGCSE – May/June 2012 0680 21 © University of Cambridge International Examinations 2012 1 (a) (i) gas labelled on diagram above the oil in the sandstone rock; [1] (ii) 200 metres; [1] (iii) porous rock/sandstone with spaces for the oil; oil is trapped between two layers of shale; shale is an impermeable rock which does not allow the oil to pass through it / AW; [max 2] anticline/upfold in the rocks traps the oil; [max 1 for recognition of rock arrangement] [max 3] (iv) 1500 metres; [1] (v) (risk from) all oil wells of an explosion / fire / blow out / AW; great depth means that they are more difficult to bring under control / AW; oil spills directly into the sea where spills are more difficult to manage than on land / AW; stormy weather at sea / cyclone damage / AW; [max 2] (b) (i) costs of oil production lowest/cheapest in the Middle East; supported by values from the graph e.g. US$ 5-30 compared with US$ 30-60 in deep water / less than half the average price of other locations; [2] (ii) factors affecting costs of oil production include land vs. sea for ease of assembly; land vs. sea for simplicity of drilling; shallow vs. deep for ease / speed of drilling; shallow vs. deep for costs of drilling, large vs. small reservoir of oil; soft vs. hard rocks for ease / speed of drilling; favourable vs. difficult rock arrangement; [max 3] (c) (i) production Middle East consumption Asia-Pacific; – both needed for the mark. [1] (ii) exporters – Latin America, Russia (and independent republics), Middle East, Africa; importers – North America, Europe, Asia-Pacific; [2] (iii) ref. to mismatch between amounts produced; through (some countries) having favourable geological conditions / ORA; (compared with) low amount needed due to small total population / ORA; (compared with) low amount needed due to low levels of economic development / ORA; (compared with) low amount needed due to presence of other energy sources / large dams / ORA; In each case ORA would be for oil hungry countries like the USA high value of oil as a fuel for heating / transport; gas
Mark scheme, page 4
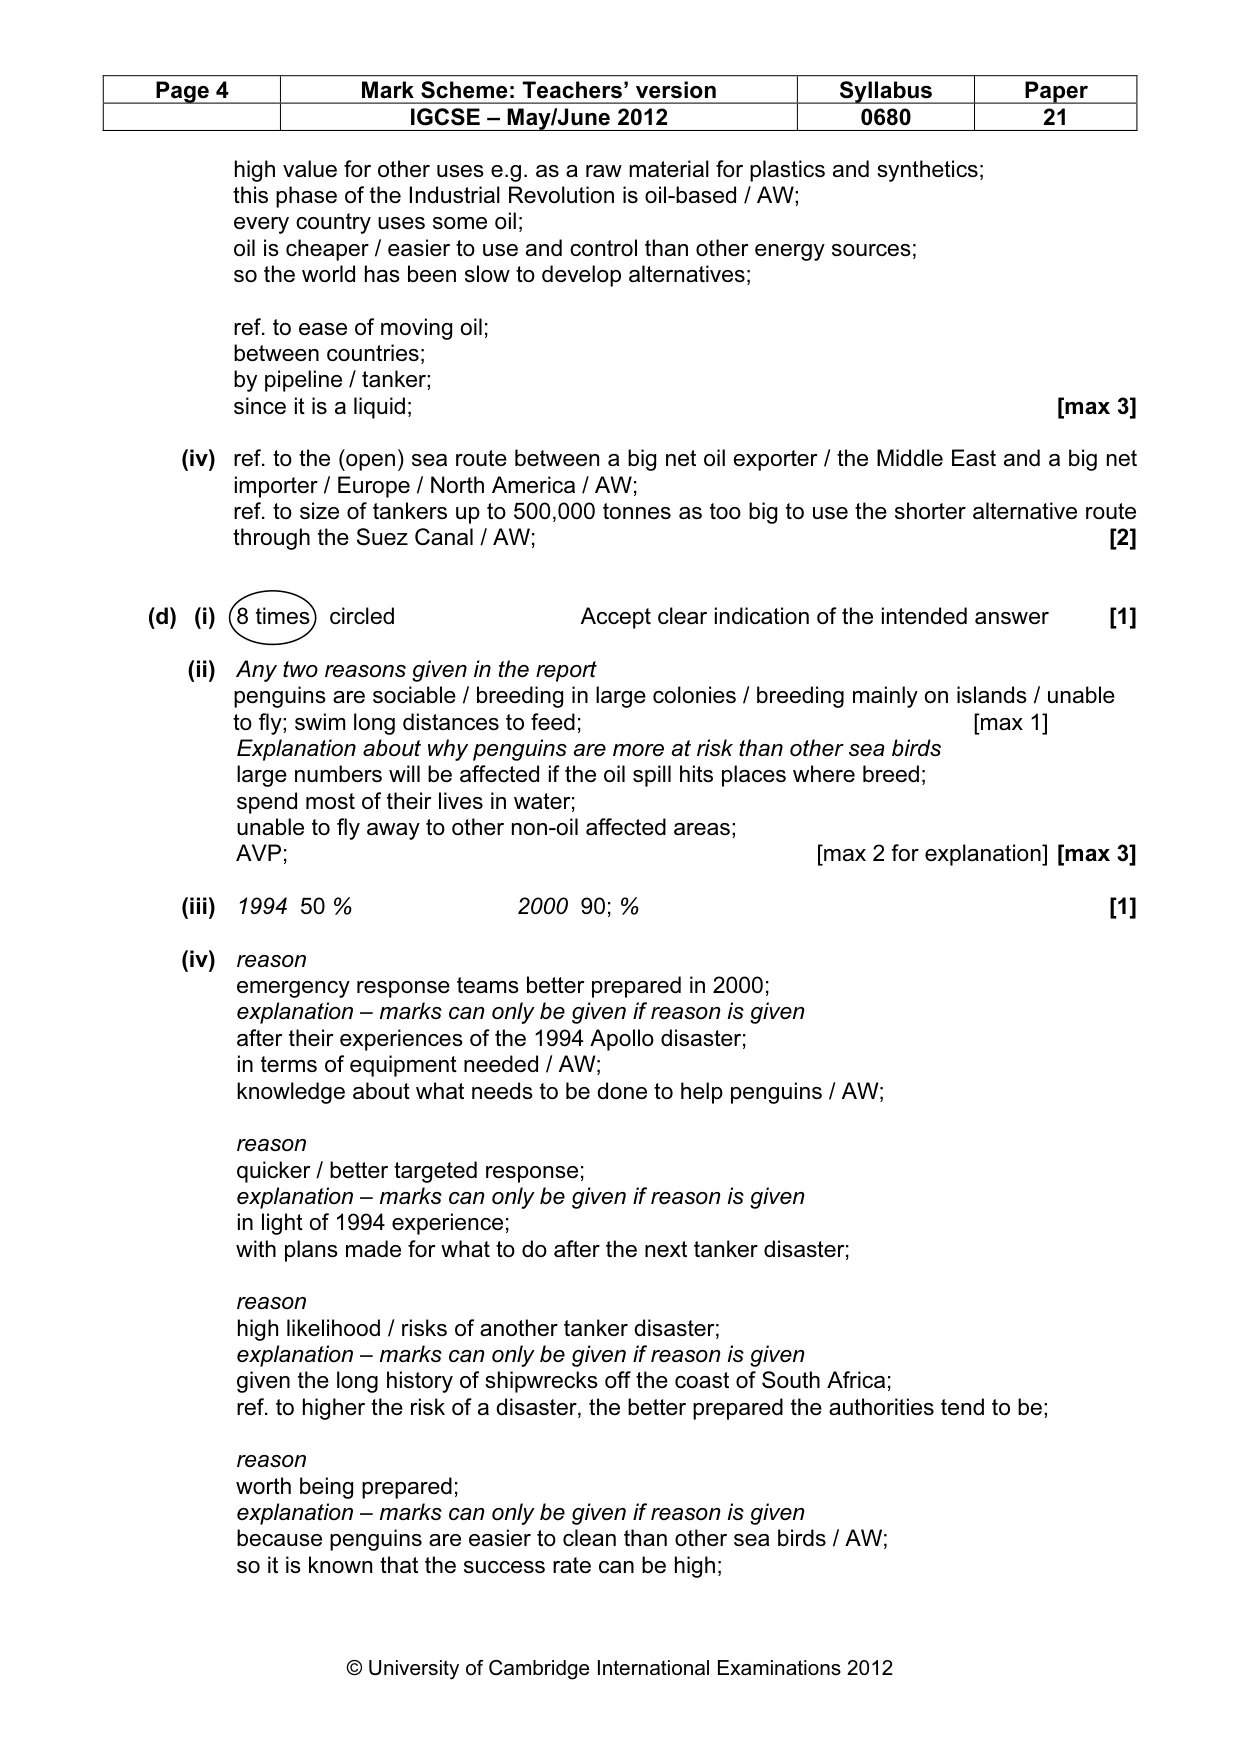
Page 4 Mark Scheme: Teachers’ version Syllabus Paper IGCSE – May/June 2012 0680 21 © University of Cambridge International Examinations 2012 high value for other uses e.g. as a raw material for plastics and synthetics; this phase of the Industrial Revolution is oil-based / AW; every country uses some oil; oil is cheaper / easier to use and control than other energy sources; so the world has been slow to develop alternatives; ref. to ease of moving oil; between countries; by pipeline / tanker; since it is a liquid; [max 3] (iv) ref. to the (open) sea route between a big net oil exporter / the Middle East and a big net importer / Europe / North America / AW; ref. to size of tankers up to 500,000 tonnes as too big to use the shorter alternative route through the Suez Canal / AW; [2] (d) (i) 8 times circled Accept clear indication of the intended answer [1] (ii) Any two reasons given in the report penguins are sociable / breeding in large colonies / breeding mainly on islands / unable to fly; swim long distances to feed; [max 1] Explanation about why penguins are more at risk than other sea birds large numbers will be affected if the oil spill hits places where breed; spend most of their lives in water; unable to fly away to other non-oil affected areas; AVP; [max 2 for explanation] [max 3] (iii) 1994 50 % 2000 90; % [1] (iv) reason emergency response teams better prepared in 2000; explanation – marks can only be given if reason is given after their experiences of the 1994 Apollo disaster; in terms of equipment needed / AW; knowledge about what needs to be done to help penguins / AW; reason quicker / better targeted response; explanation – marks can only be given if reason is given in light of 1994 experience; with plans made for what to do after the next tanker disaster; reason high likelihood / risks of another tanker disaster; explanation – marks can only be given if reason is given given the long history of shipwrecks off the coast of South Africa; ref. to higher the risk of a disaster, the better prepared the authorities tend to be; reason worth being prepared; explanation – marks can only be given if reason is given because penguins are easier to clean than other sea birds / AW; so it is known that the success rate can be high;
Mark scheme, page 5
Page 5 Mark Scheme: Teachers’ version Syllabus Paper IGCSE – May/June 2012 0680 21 © University of Cambridge International Examinations 2012 reason greater (general) environmental awareness; one or more reasons suggested but without explanation [max 1] [max 3] (e) (i) Bars plotted accurately for length = amount of oil; graph complete with names, bars of same width and tidy; [2] (ii) ref. to the potential size of oil spill with a tanker this is limited to the size of the ship; whereas in an oil well the size of spill can be up to the size of the oil store (for which there is enough pressure to force it out); ref. to the uncontrolled nature of explosions/blow outs/fires from wells; which makes them dangerous and difficult to control and stop; [max 2] (f) (i) Prevention - double hulls, outside of ship might be cut open by hitting rocks, but inner hull could remain intact i.e. gives a second line of defence after a ship is holed; - old tankers are the ones with single hulls and not built to modern safety standards; old age means that some may be less seaworthy/less able to withstand storms than new ships; - it is cheap and easy for ships to clean out tanks at sea; by banning this, tanks now have to be emptied in ports where the remains of oil can be cleanly disposed of; [max 3] (ii) Increase speed of clean up - when the company responsible for polluting has to pay for the clean up, it has the financial incentive to act quickly; - the more it delays, the more the clean up is likely to cost; [max 2] [max 4] (g) marks for view explained Not possible: risks ever present when dealing with flammable/volatile materials; now needing to explore in deeper waters/areas with more difficult physical conditions; best placed, easiest wells are exploited first; danger from natural hazards such as cyclones, earthquakes and tsunamis; human error can never be eradicated; economics driven short cuts taken to decrease costs of oil operations; Possible: continued improvements in technology / new more sophisticated technology to prevent blow outs; companies learning from previous mistakes and instituting stronger and a wider range of safety measures; more widespread use of back up systems, such as double instead of single hull tankers; use even more pipelines over land for transport instead of tankers; more government pressure on oil companies to improve safety standards; [max 3] [Total: 40]
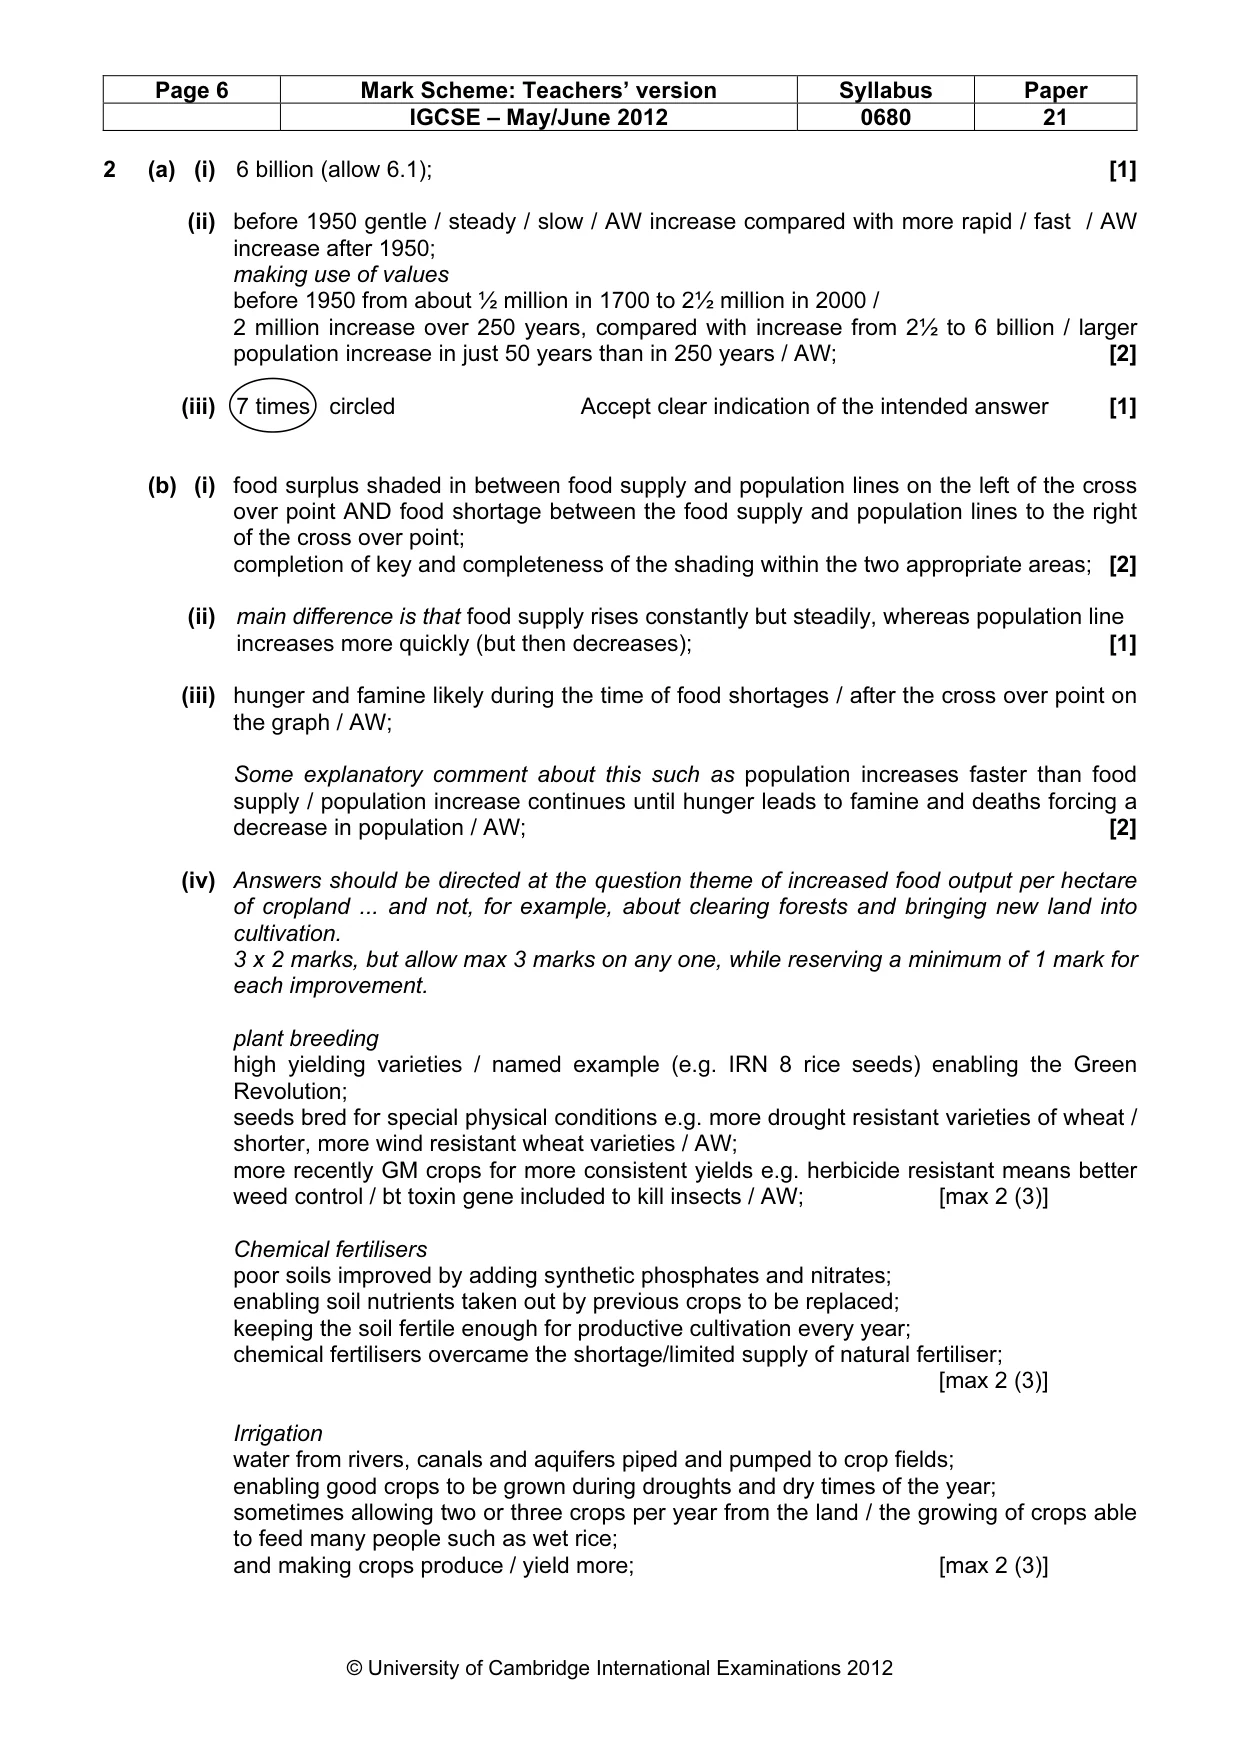
Mark scheme, page 6
Page 6 Mark Scheme: Teachers’ version Syllabus Paper IGCSE – May/June 2012 0680 21 © University of Cambridge International Examinations 2012 2 (a) (i) 6 billion (allow 6.1); [1] (ii) before 1950 gentle / steady / slow / AW increase compared with more rapid / fast / AW increase after 1950; making use of values before 1950 from about ½ million in 1700 to 2½ million in 2000 / 2 million increase over 250 years, compared with increase from 2½ to 6 billion / larger population increase in just 50 years than in 250 years / AW; [2] (iii) 7 times circled Accept clear indication of the intended answer [1] (b) (i) food surplus shaded in between food supply and population lines on the left of the cross over point AND food shortage between the food supply and population lines to the right of the cross over point; completion of key and completeness of the shading within the two appropriate areas; [2] (ii) main difference is that food supply rises constantly but steadily, whereas population line increases more quickly (but then decreases); [1] (iii) hunger and famine likely during the time of food shortages / after the cross over point on the graph / AW; Some explanatory comment about this such as population increases faster than food supply / population increase continues until hunger leads to famine and deaths forcing a decrease in population / AW; [2] (iv) Answers should be directed at the question theme of increased food output per hectare of cropland ... and not, for example, about clearing forests and bringing new land into cultivation. 3 x 2 marks, but allow max 3 marks on any one, while reserving a minimum of 1 mark for each improvement. plant breeding high yielding varieties / named example (e.g. IRN 8 rice seeds) enabling the Green Revolution; seeds bred for special physical conditions e.g. more drought resistant varieties of wheat / shorter, more wind resistant wheat varieties / AW; more recently GM crops for more consistent yields e.g. herbicide resistant means better weed control / bt toxin gene included to kill insects / AW; [max 2 (3)] Chemical fertilisers poor soils improved by adding synthetic phosphates and nitrates; enabling soil nutrients taken out by previous crops to be replaced; keeping the soil fertile enough for productive cultivation every year; chemical fertilisers overcame the shortage/limited supply of natural fertiliser; [max 2 (3)] Irrigation water from rivers, canals and aquifers piped and pumped to crop fields; enabling good crops to be grown during droughts and dry times of the year; sometimes allowing two or three crops per year from the land / the growing of crops able to feed many people such as wet rice; and making crops produce / yield more; [max 2 (3)]
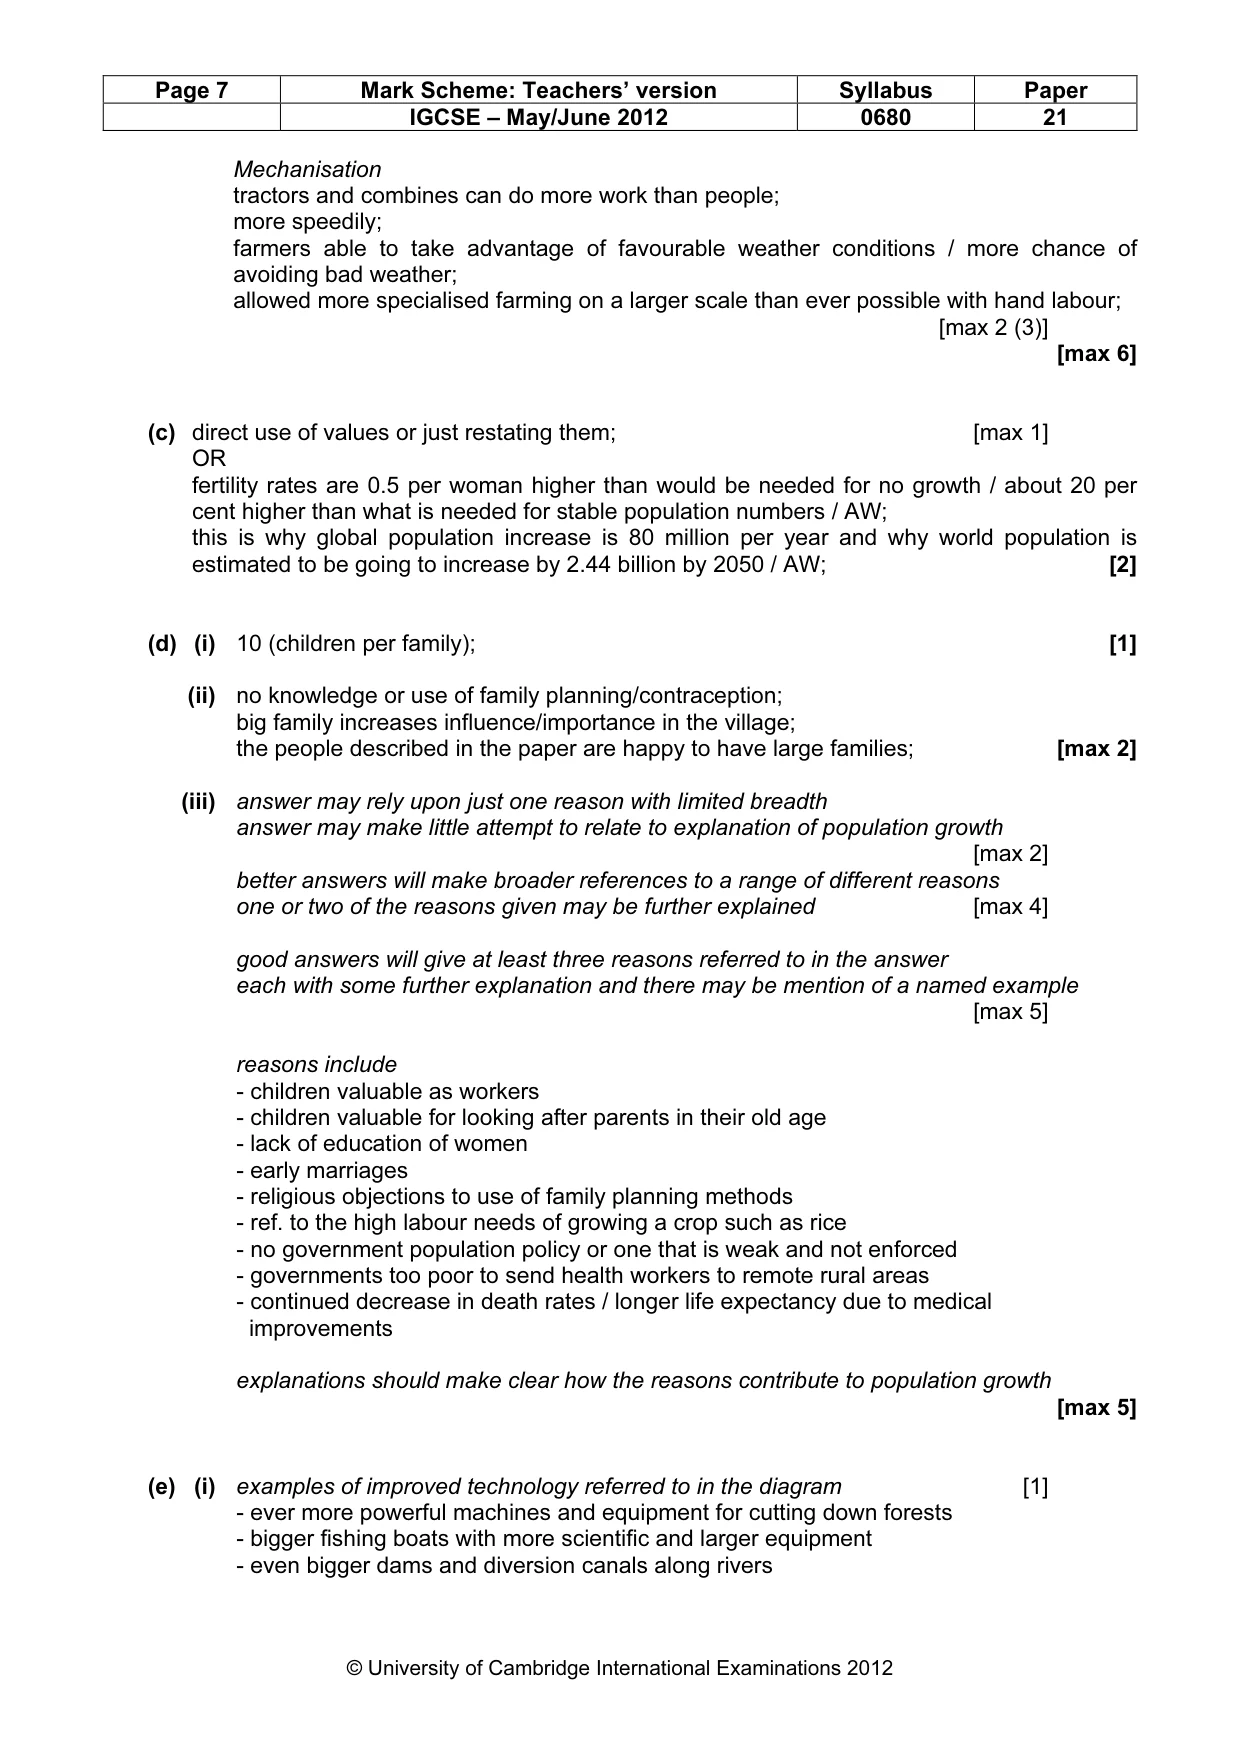
Mark scheme, page 7
Page 7 Mark Scheme: Teachers’ version Syllabus Paper IGCSE – May/June 2012 0680 21 © University of Cambridge International Examinations 2012 Mechanisation tractors and combines can do more work than people; more speedily; farmers able to take advantage of favourable weather conditions / more chance of avoiding bad weather; allowed more specialised farming on a larger scale than ever possible with hand labour; [max 2 (3)] [max 6] (c) direct use of values or just restating them; [max 1] OR fertility rates are 0.5 per woman higher than would be needed for no growth / about 20 per cent higher than what is needed for stable population numbers / AW; this is why global population increase is 80 million per year and why world population is estimated to be going to increase by 2.44 billion by 2050 / AW; [2] (d) (i) 10 (children per family); [1] (ii) no knowledge or use of family planning/contraception; big family increases influence/importance in the village; the people described in the paper are happy to have large families; [max 2] (iii) answer may rely upon just one reason with limited breadth answer may make little attempt to relate to explanation of population growth [max 2] better answers will make broader references to a range of different reasons one or two of the reasons given may be further explained [max 4] good answers will give at least three reasons referred to in the answer each with some further explanation and there may be mention of a named example [max 5] reasons include - children valuable as workers - children valuable for looking after parents in their old age - lack of education of women - early marriages - religious objections to use of family planning methods - ref. to the high labour needs of growing a crop such as rice - no government population policy or one that is weak and not enforced - governments too poor to send health workers to remote rural areas - continued decrease in death rates / longer life expectancy due to medical improvements explanations should make clear how the reasons contribute to population growth [max 5] (e) (i) examples of improved technology referred to in the diagram [1] - ever more powerful machines and equipment for cutting down forests - bigger fishing boats with more scientific and larger equipment - even bigger dams and diversion canals along rivers
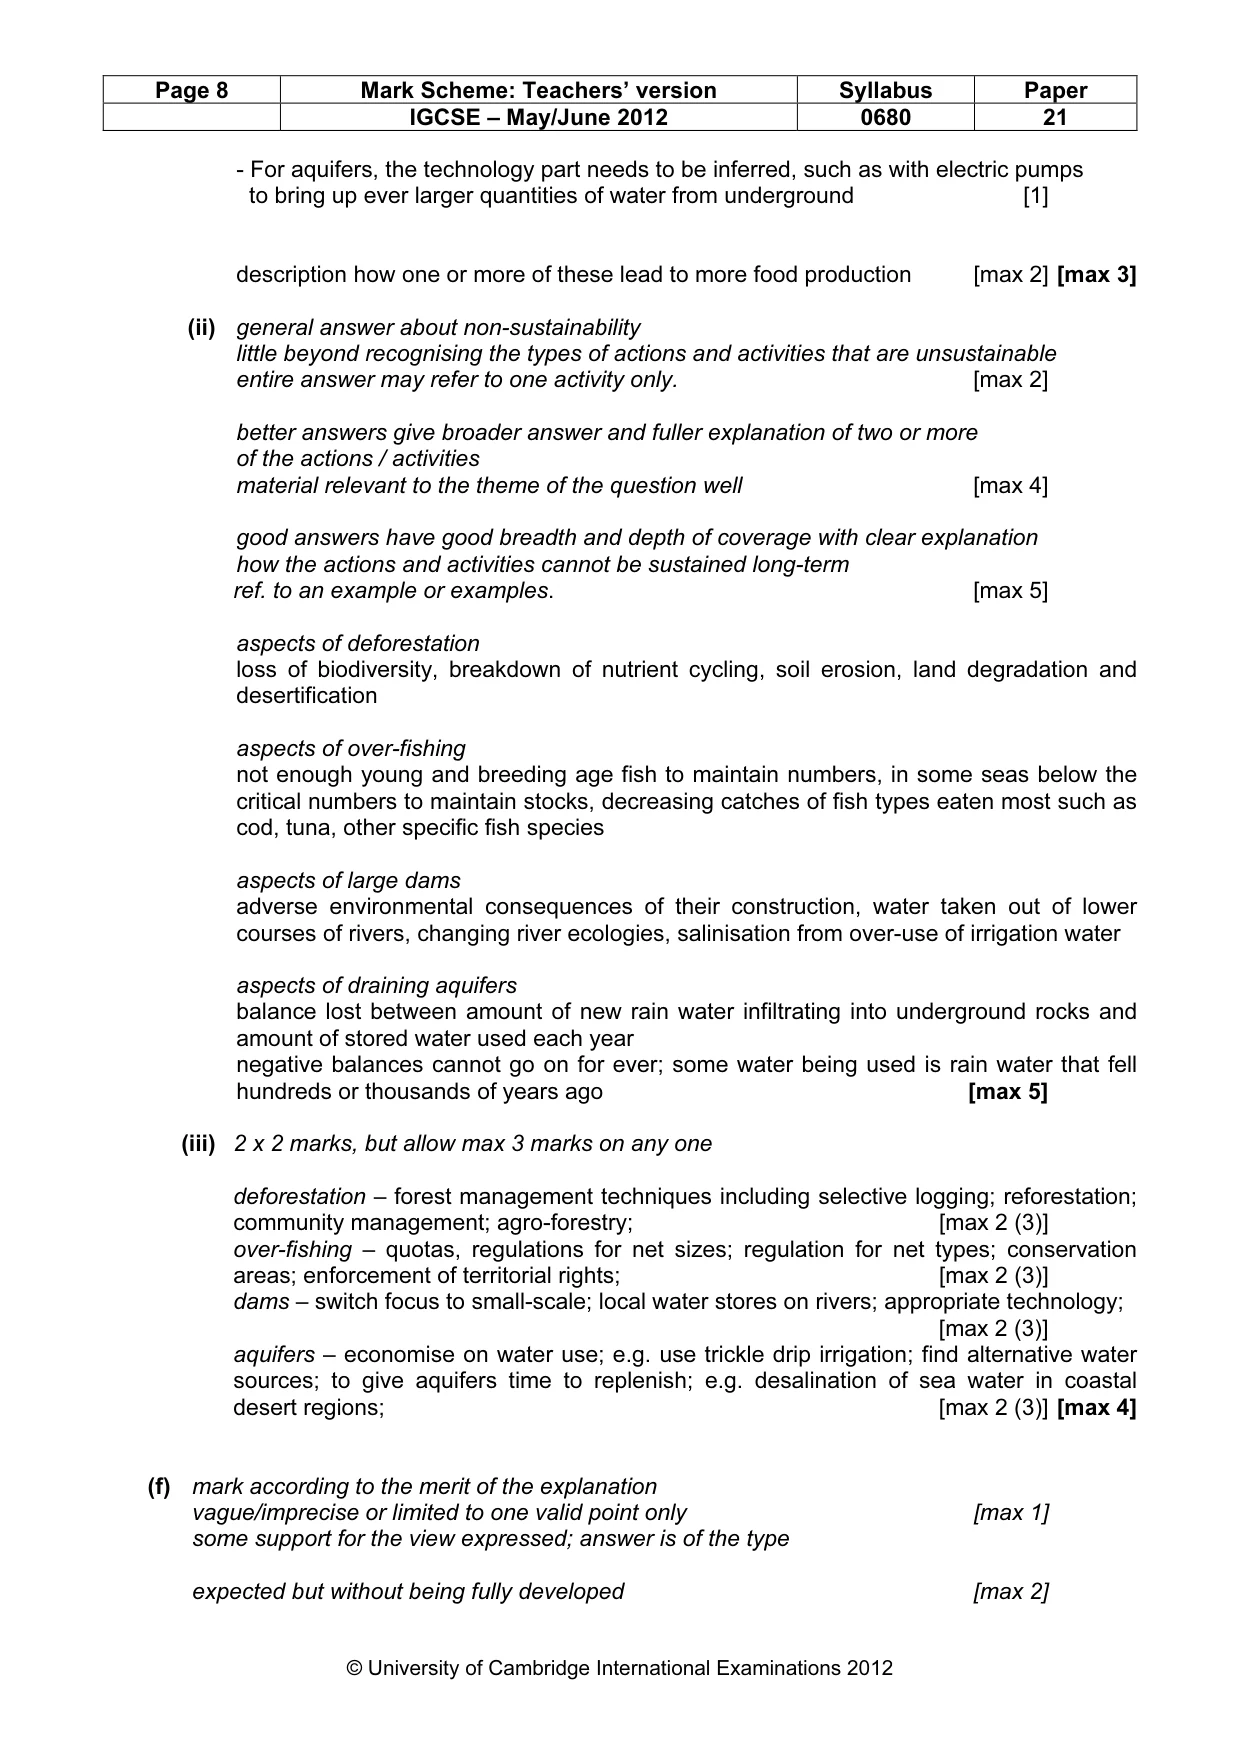
Mark scheme, page 8
Page 8 Mark Scheme: Teachers’ version Syllabus Paper IGCSE – May/June 2012 0680 21 © University of Cambridge International Examinations 2012 - For aquifers, the technology part needs to be inferred, such as with electric pumps to bring up ever larger quantities of water from underground [1] description how one or more of these lead to more food production [max 2] [max 3] (ii) general answer about non-sustainability little beyond recognising the types of actions and activities that are unsustainable entire answer may refer to one activity only. [max 2] better answers give broader answer and fuller explanation of two or more of the actions / activities material relevant to the theme of the question well [max 4] good answers have good breadth and depth of coverage with clear explanation how the actions and activities cannot be sustained long-term ref. to an example or examples. [max 5] aspects of deforestation loss of biodiversity, breakdown of nutrient cycling, soil erosion, land degradation and desertification aspects of over-fishing not enough young and breeding age fish to maintain numbers, in some seas below the critical numbers to maintain stocks, decreasing catches of fish types eaten most such as cod, tuna, other specific fish species aspects of large dams adverse environmental consequences of their construction, water taken out of lower courses of rivers, changing river ecologies, salinisation from over-use of irrigation water aspects of draining aquifers balance lost between amount of new rain water infiltrating into underground rocks and amount of stored water used each year negative balances cannot go on for ever; some water being used is rain water that fell hundreds or thousands of years ago [max 5] (iii) 2 x 2 marks, but allow max 3 marks on any one deforestation – forest management techniques including selective logging; reforestation; community management; agro-forestry; [max 2 (3)] over-fishing – quotas, regulations for net sizes; regulation for net types; conservation areas; enforcement of territorial rights; [max 2 (3)] dams – switch focus to small-scale; local water stores on rivers; appropriate technology; [max 2 (3)] aquifers – economise on water use; e.g. use trickle drip irrigation; find alternative water sources; to give aquifers time to replenish; e.g. desalination of sea water in coastal desert regions; [max 2 (3)] [max 4] (f) mark according to the merit of the explanation vague/imprecise or limited to one valid point only [max 1] some support for the view expressed; answer is of the type expected but without being fully developed [max 2]
Mark scheme, page 9
Page 9 Mark Scheme: Teachers’ version Syllabus Paper IGCSE – May/June 2012 0680 21 © University of Cambridge International Examinations 2012 valid points made to support the view expressed. reference to a named example will help [max 3] candidate argues for gloomy Malthusian view to come true ... points that might be made in support - examples of deaths from hunger and famine already widespread in some countries, especially those in the drought belt / Sahel in Africa, such as Niger which has high population increase and repeated famine - some say that current climate change is leading to more drought and storms reducing farm output, and that it will only get worse - each year people over-consume the Earth's natural resources; the deficit, made worse by continually increasing populations, cannot go on for ever - critical water shortages already exist in some countries, without which crop growing cannot be maintained at its current output - plentiful and increasing evidence for land degradation - no signs in some countries that population increases are going to stop; the world is full of young people soon to reach marrying age candidate argues against the gloomy Malthusian view ... points that might be made in support - over last 200 years new technology has large kept food supply ahead of population increases; no reason why should not continue to do so - hopes for increased food output from new scientifically developed GM crops - technology exists to bring new areas into cultivation, extending further areas of settlement as deserts are reclaimed and rainforests are cleared - even though some suffer from malnutrition, the world still produces more than enough food to feed everyone; the problem is that it is not always available where needed [max 3] [Total: 40]
What you needed in this session
Cambridge’s own grade thresholds for 2012 May/June, Paper 2 · Variant 1. A higher threshold means an easier paper — the bar moves with how the cohort did.