Cambridge IGCSE Environmental Management 0680 — 2011 Oct/Nov Paper 2 · Variant 3
0680/23/O/N/11 · 80 marks · ≈90 min
The question paper and its mark scheme, free to read here and free to download. This is Cambridge’s own paper, exactly as it was sat.
Question paper20 pages


Mark scheme8 pages
Answers below. Sit the paper first if you are practising.
Paper as text
Question paper, page 1
This document consists of 17 printed pages and 3 blank pages. DC (NF/DJ) 47567 © UCLES 2011 [Turn over UNIVERSITY OF CAMBRIDGE INTERNATIONAL EXAMINATIONS International General Certificate of Secondary Education * 5 2 3 4 1 2 0 0 5 5 * ENVIRONMENTAL MANAGEMENT 0680/23 Paper 2 October/November 2011 1 hour 45 minutes Candidates answer on the Question Paper. Additional Materials: Ruler READ THESE INSTRUCTIONS FIRST Write your Centre number, candidate number and name on all the work you hand in. Write in dark blue or black pen. You may use a soft pencil for any diagrams, graphs or rough working. Do not use staples, paper clips, highlighters, glue or correction fluid. DO NOT WRITE IN ANY BARCODES. Answer both questions. At the end of the examination, fasten all your work securely together. The number of marks is given in brackets [ ] at the end of each question or part question. For Examiner’s Use 1 2 Total www.XtremePapers.com
Question paper, page 2
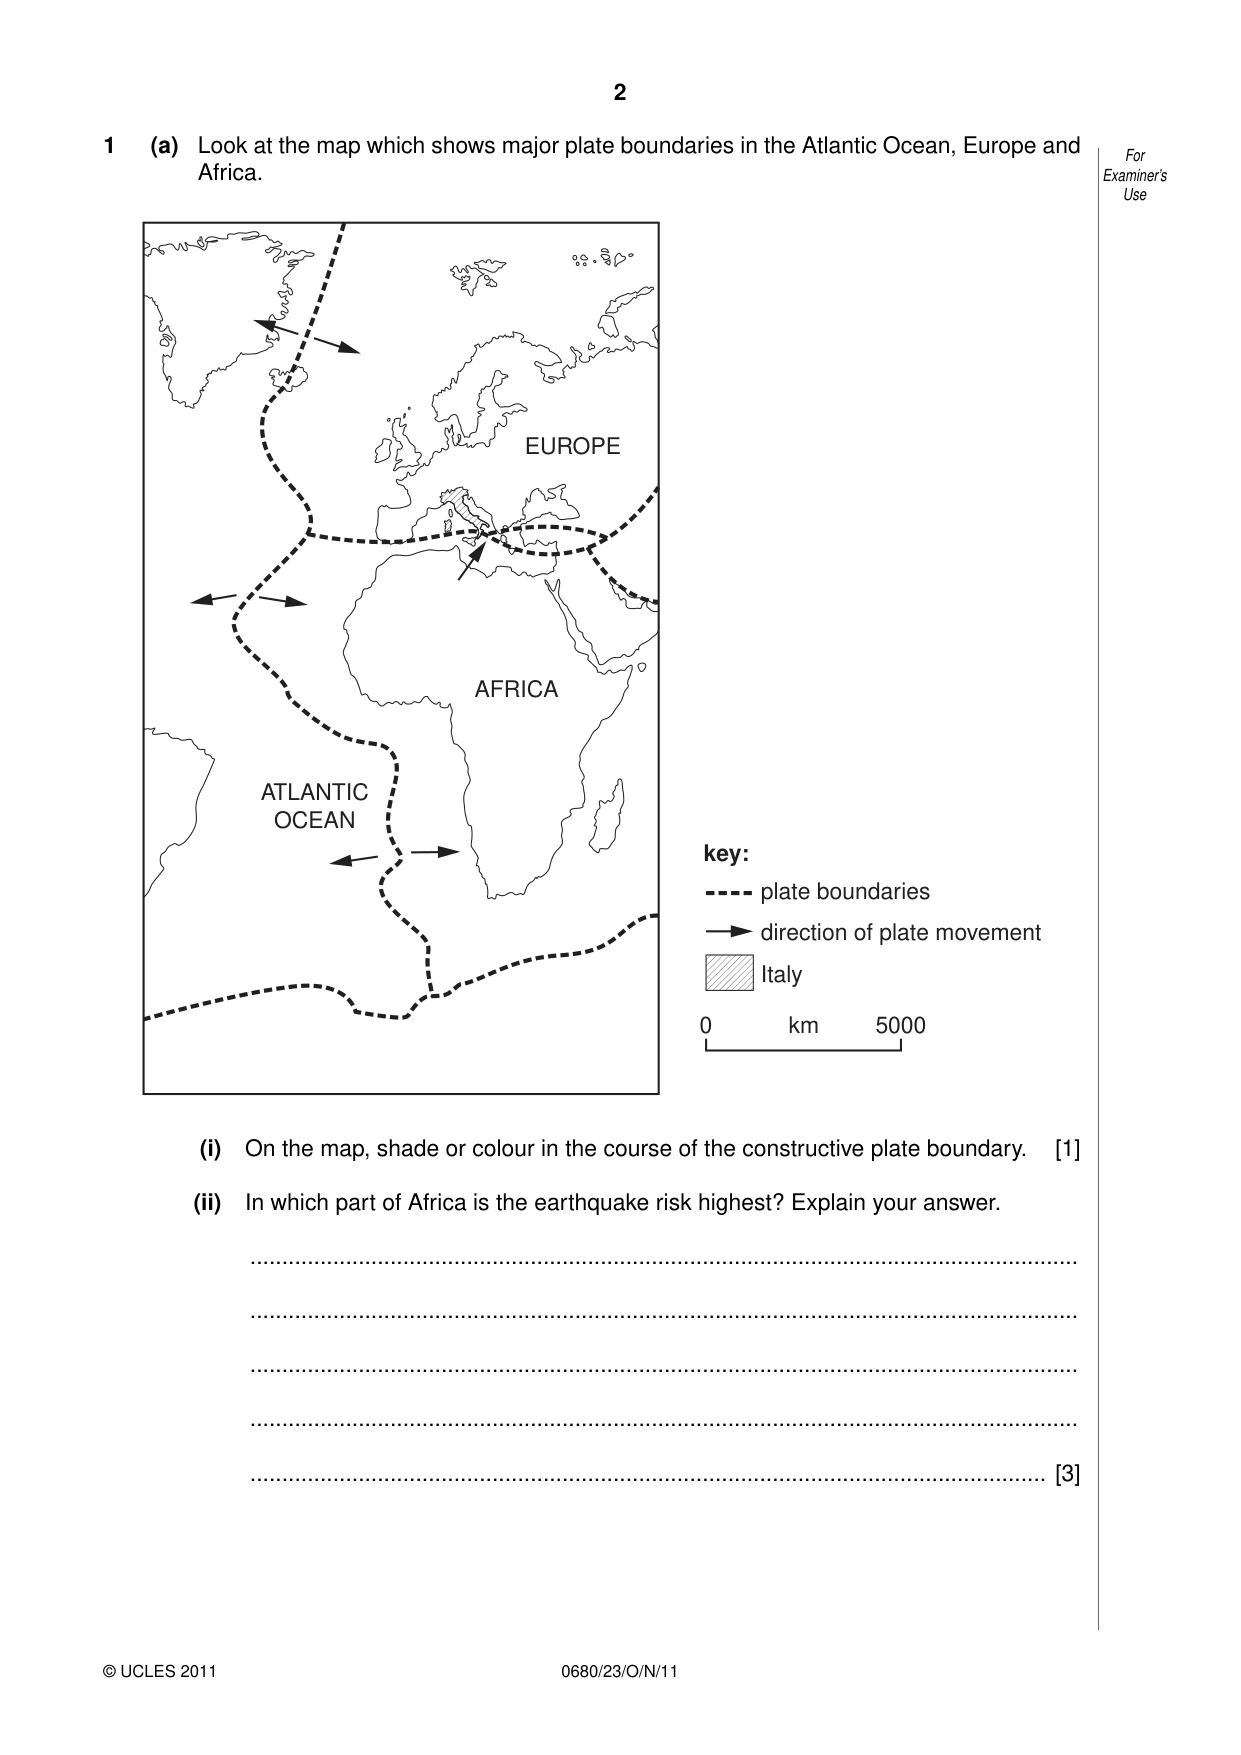
2 0680/23/O/N/11 © UCLES 2011 For Examiner’s Use 1 (a) Look at the map which shows major plate boundaries in the Atlantic Ocean, Europe and Africa. EUROPE AFRICA ATLANTIC OCEAN key: plate boundaries direction of plate movement Italy 0 5000 km (i) On the map, shade or colour in the course of the constructive plate boundary. [1] (ii) In which part of Africa is the earthquake risk highest? Explain your answer. … … … … … [3]
Question paper, page 3
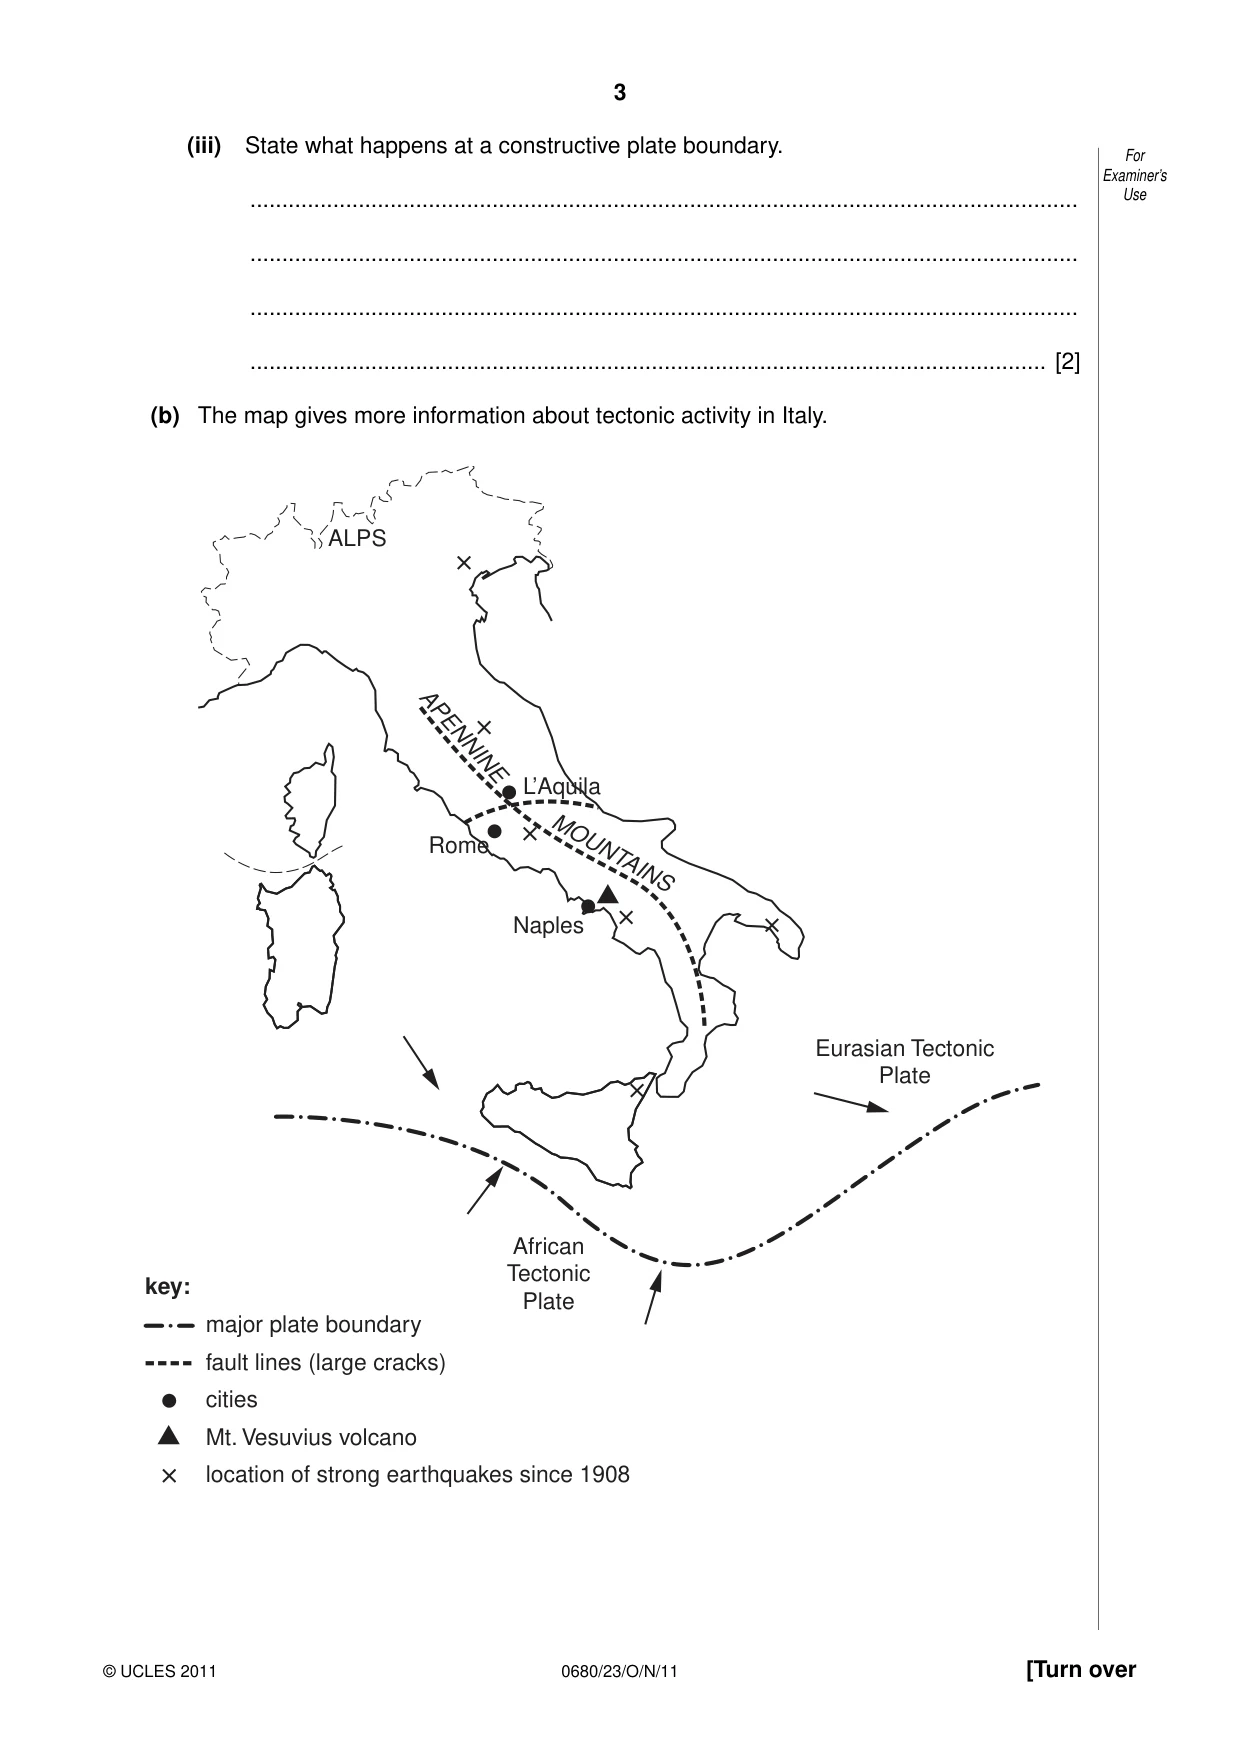
3 0680/23/O/N/11 © UCLES 2011 [Turn over For Examiner’s Use (iii) State what happens at a constructive plate boundary. … … … … [2] (b) The map gives more information about tectonic activity in Italy. ALPS L’Aquila Rome Naples African Tectonic Plate Eurasian Tectonic Plate APENNINE MOUNTAINS major plate boundary fault lines (large cracks) cities Mt. Vesuvius volcano location of strong earthquakes since 1908 key:
Question paper, page 4
4 0680/23/O/N/11 © UCLES 2011 For Examiner’s Use (i) From the map, state the evidence which shows that the earthquake risk is high in many areas of Italy. … … … … … [3] (ii) Describe how earthquakes can cause great loss of life both immediately after the main earthquake shock, and in the following days and weeks. … … … … … … … … [4] (c) The most recent of the strong earthquakes marked on the map of Italy was centred in the city of L’Aquila. (i) Why was the earthquake risk near L’Aquila particularly high? … … [1]
Question paper, page 5
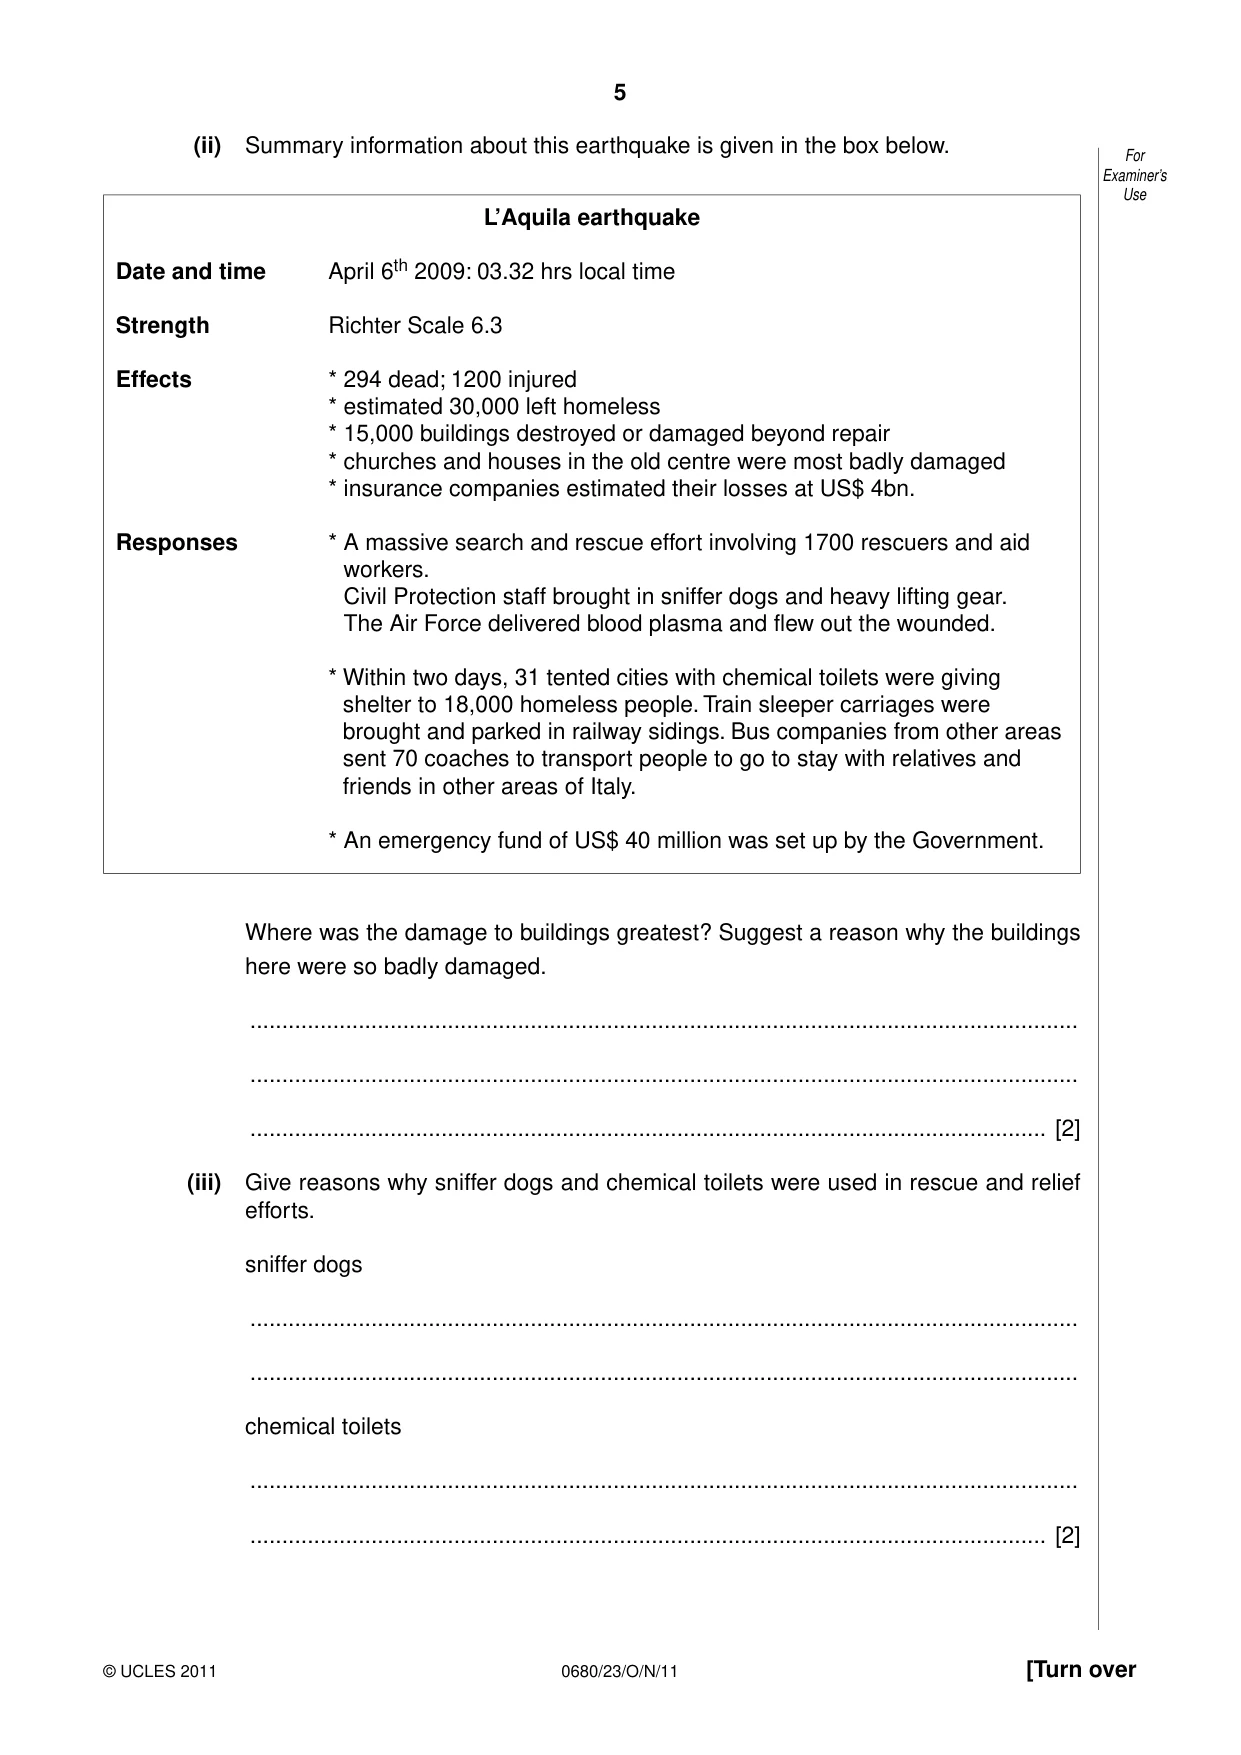
5 0680/23/O/N/11 © UCLES 2011 [Turn over For Examiner’s Use (ii) Summary information about this earthquake is given in the box below. L’Aquila earthquake Date and time April 6th 2009: 03.32 hrs local time Strength Richter Scale 6.3 Effects * 294 dead; 1200 injured * estimated 30,000 left homeless * 15,000 buildings destroyed or damaged beyond repair * churches and houses in the old centre were most badly damaged * insurance companies estimated their losses at US$ 4bn. Responses * A massive search and rescue effort involving 1700 rescuers and aid workers. Civil Protection staff brought in sniffer dogs and heavy lifting gear. The Air Force delivered blood plasma and flew out the wounded. * Within two days, 31 tented cities with chemical toilets were giving shelter to 18,000 homeless people. Train sleeper carriages were brought and parked in railway sidings. Bus companies from other areas sent 70 coaches to transport people to go to stay with relatives and friends in other areas of Italy. * An emergency fund of US$ 40 million was set up by the Government. Where was the damage to buildings greatest? Suggest a reason why the buildings here were so badly damaged. … … … [2] (iii) Give reasons why sniffer dogs and chemical toilets were used in rescue and relief efforts. sniffer dogs … … chemical toilets … … [2]
Question paper, page 6
6 0680/23/O/N/11 © UCLES 2011 For Examiner’s Use (iv) Italy is a developed country. Were the effects of the earthquake and peoples’ responses to it more like those of a developed or developing country? With the help of the information given, explain as fully as you can. … … … … … … … … [4]
Question paper, page 7
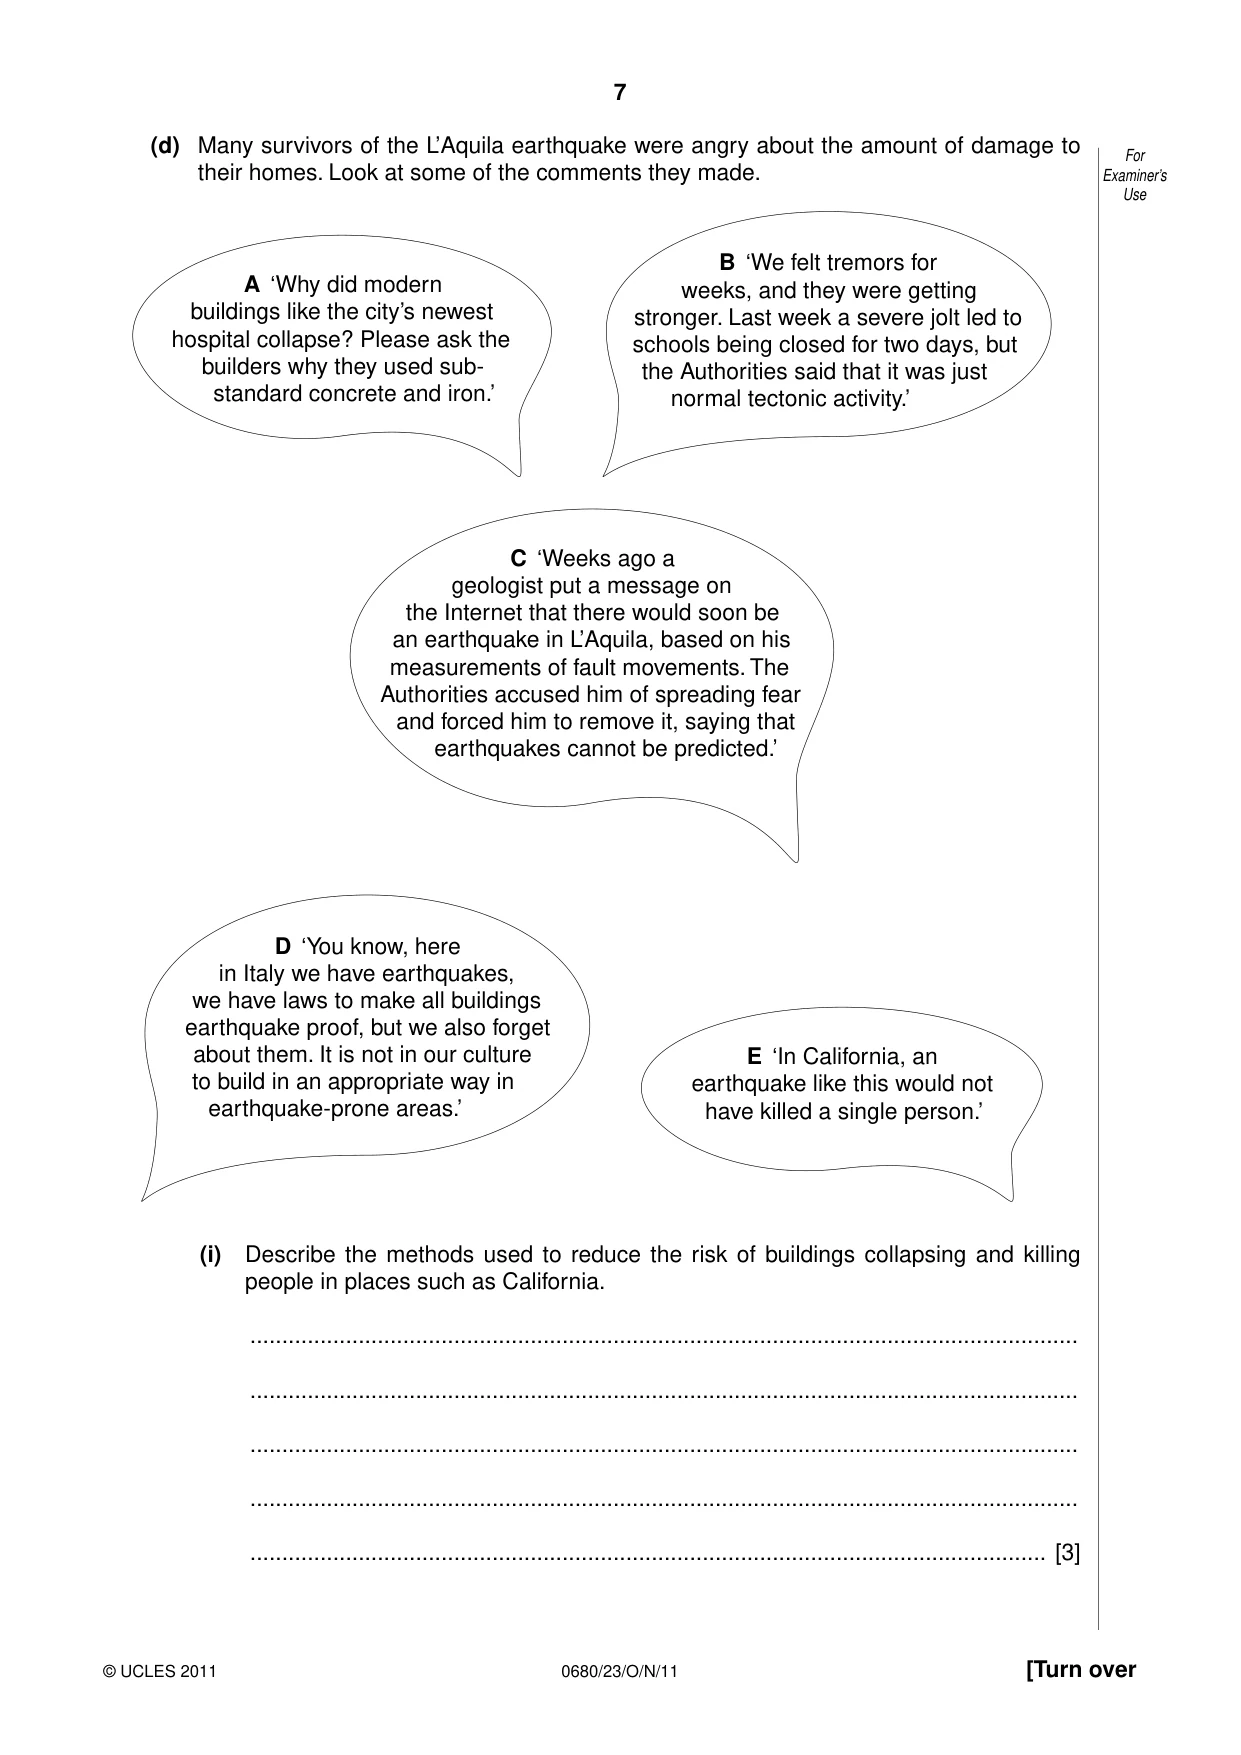
7 0680/23/O/N/11 © UCLES 2011 [Turn over For Examiner’s Use (d) Many survivors of the L’Aquila earthquake were angry about the amount of damage to their homes. Look at some of the comments they made. A ‘Why did modern buildings like the city’s newest hospital collapse? Please ask the builders why they used sub- standard concrete and iron.’ B ‘We felt tremors for weeks, and they were getting stronger. Last week a severe jolt led to schools being closed for two days, but the Authorities said that it was just normal tectonic activity.’ C ‘Weeks ago a geologist put a message on the Internet that there would soon be an earthquake in L’Aquila, based on his measurements of fault movements. The Authorities accused him of spreading fear and forced him to remove it, saying that earthquakes cannot be predicted.’ D ‘You know, here in Italy we have earthquakes, we have laws to make all buildings earthquake proof, but we also forget about them. It is not in our culture to build in an appropriate way in earthquake-prone areas.’ E ‘In California, an earthquake like this would not have killed a single person.’ (i) Describe the methods used to reduce the risk of buildings collapsing and killing people in places such as California. … … … … … [3]
Question paper, page 8
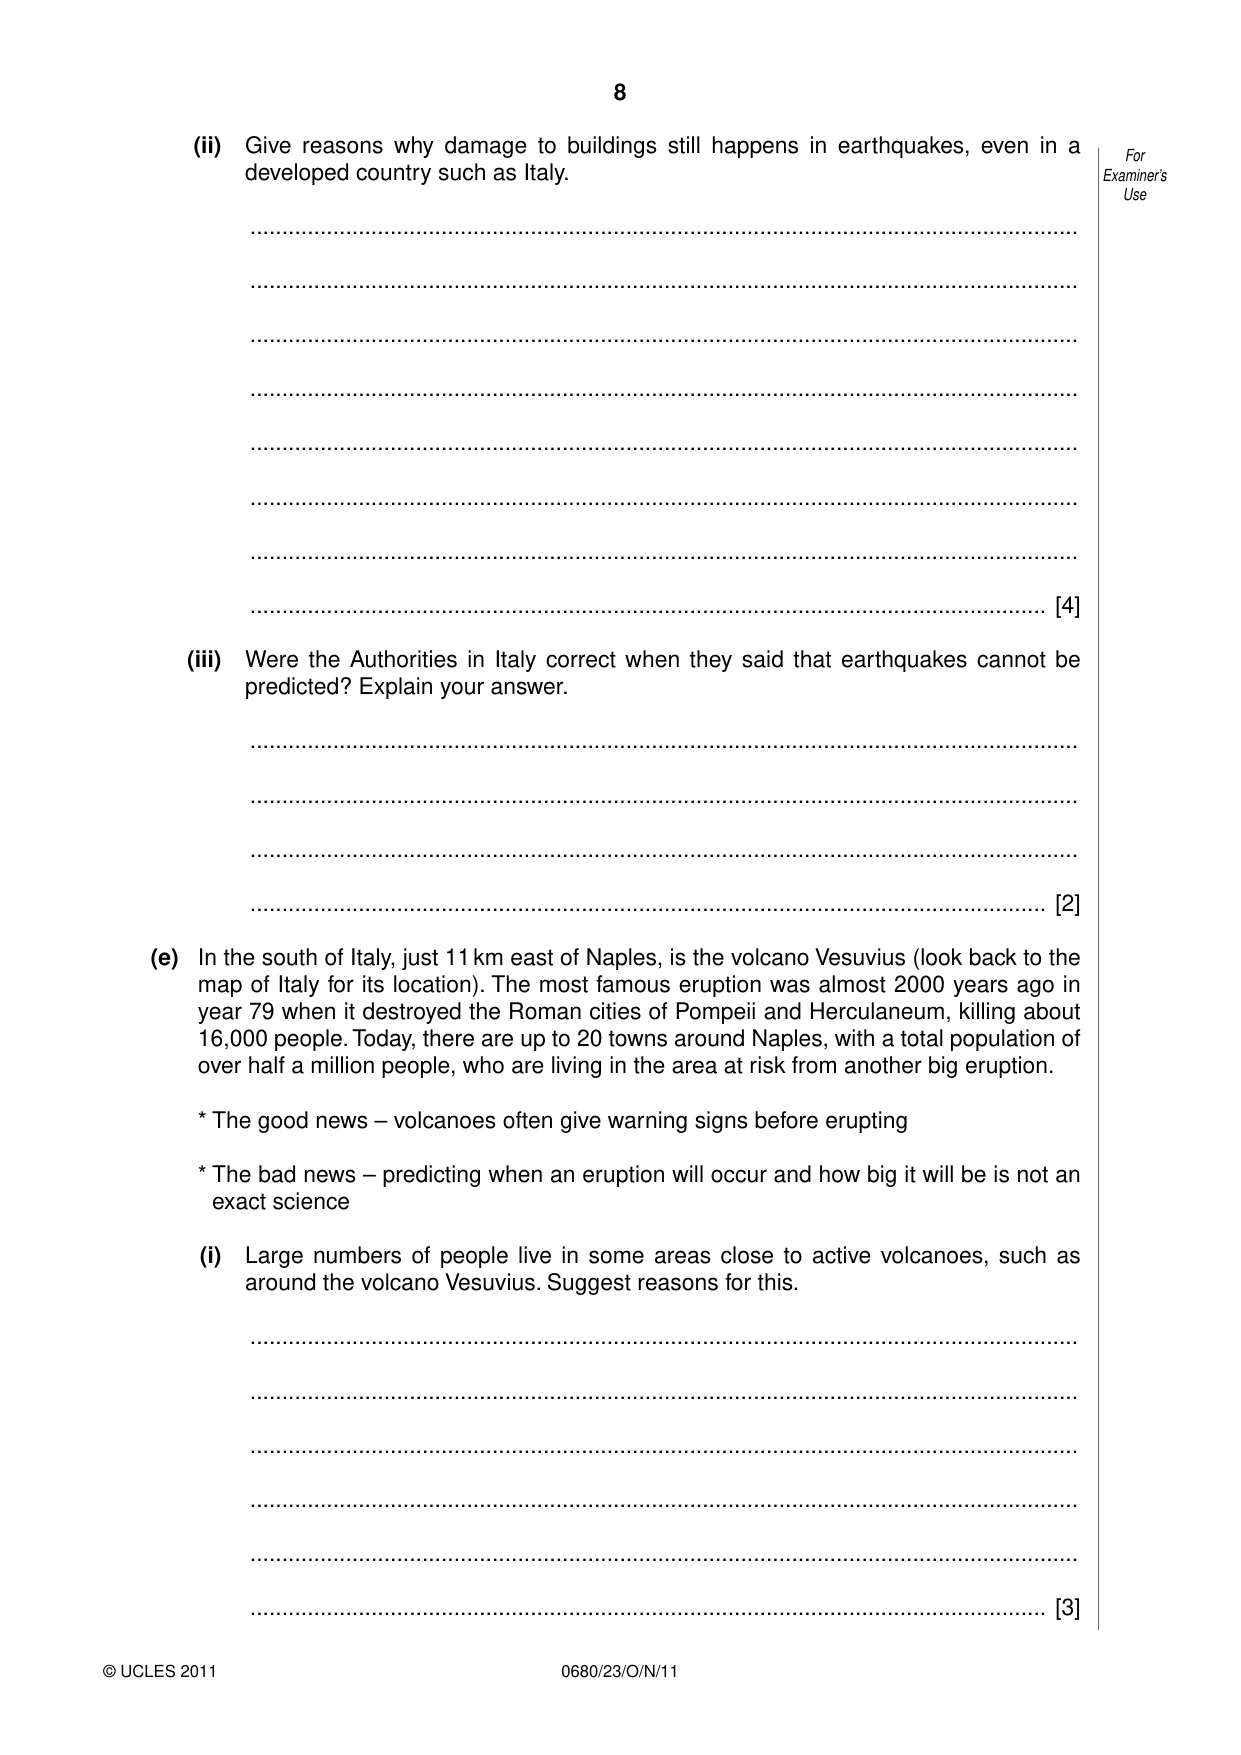
8 0680/23/O/N/11 © UCLES 2011 For Examiner’s Use (ii) Give reasons why damage to buildings still happens in earthquakes, even in a developed country such as Italy. … … … … … … … … [4] (iii) Were the Authorities in Italy correct when they said that earthquakes cannot be predicted? Explain your answer. … … … … [2] (e) In the south of Italy, just 11 km east of Naples, is the volcano Vesuvius (look back to the map of Italy for its location). The most famous eruption was almost 2000 years ago in year 79 when it destroyed the Roman cities of Pompeii and Herculaneum, killing about 16,000 people. Today, there are up to 20 towns around Naples, with a total population of over half a million people, who are living in the area at risk from another big eruption. * The good news – volcanoes often give warning signs before erupting * The bad news – predicting when an eruption will occur and how big it will be is not an exact science (i) Large numbers of people live in some areas close to active volcanoes, such as around the volcano Vesuvius. Suggest reasons for this. … … … … … … [3]
Question paper, page 9
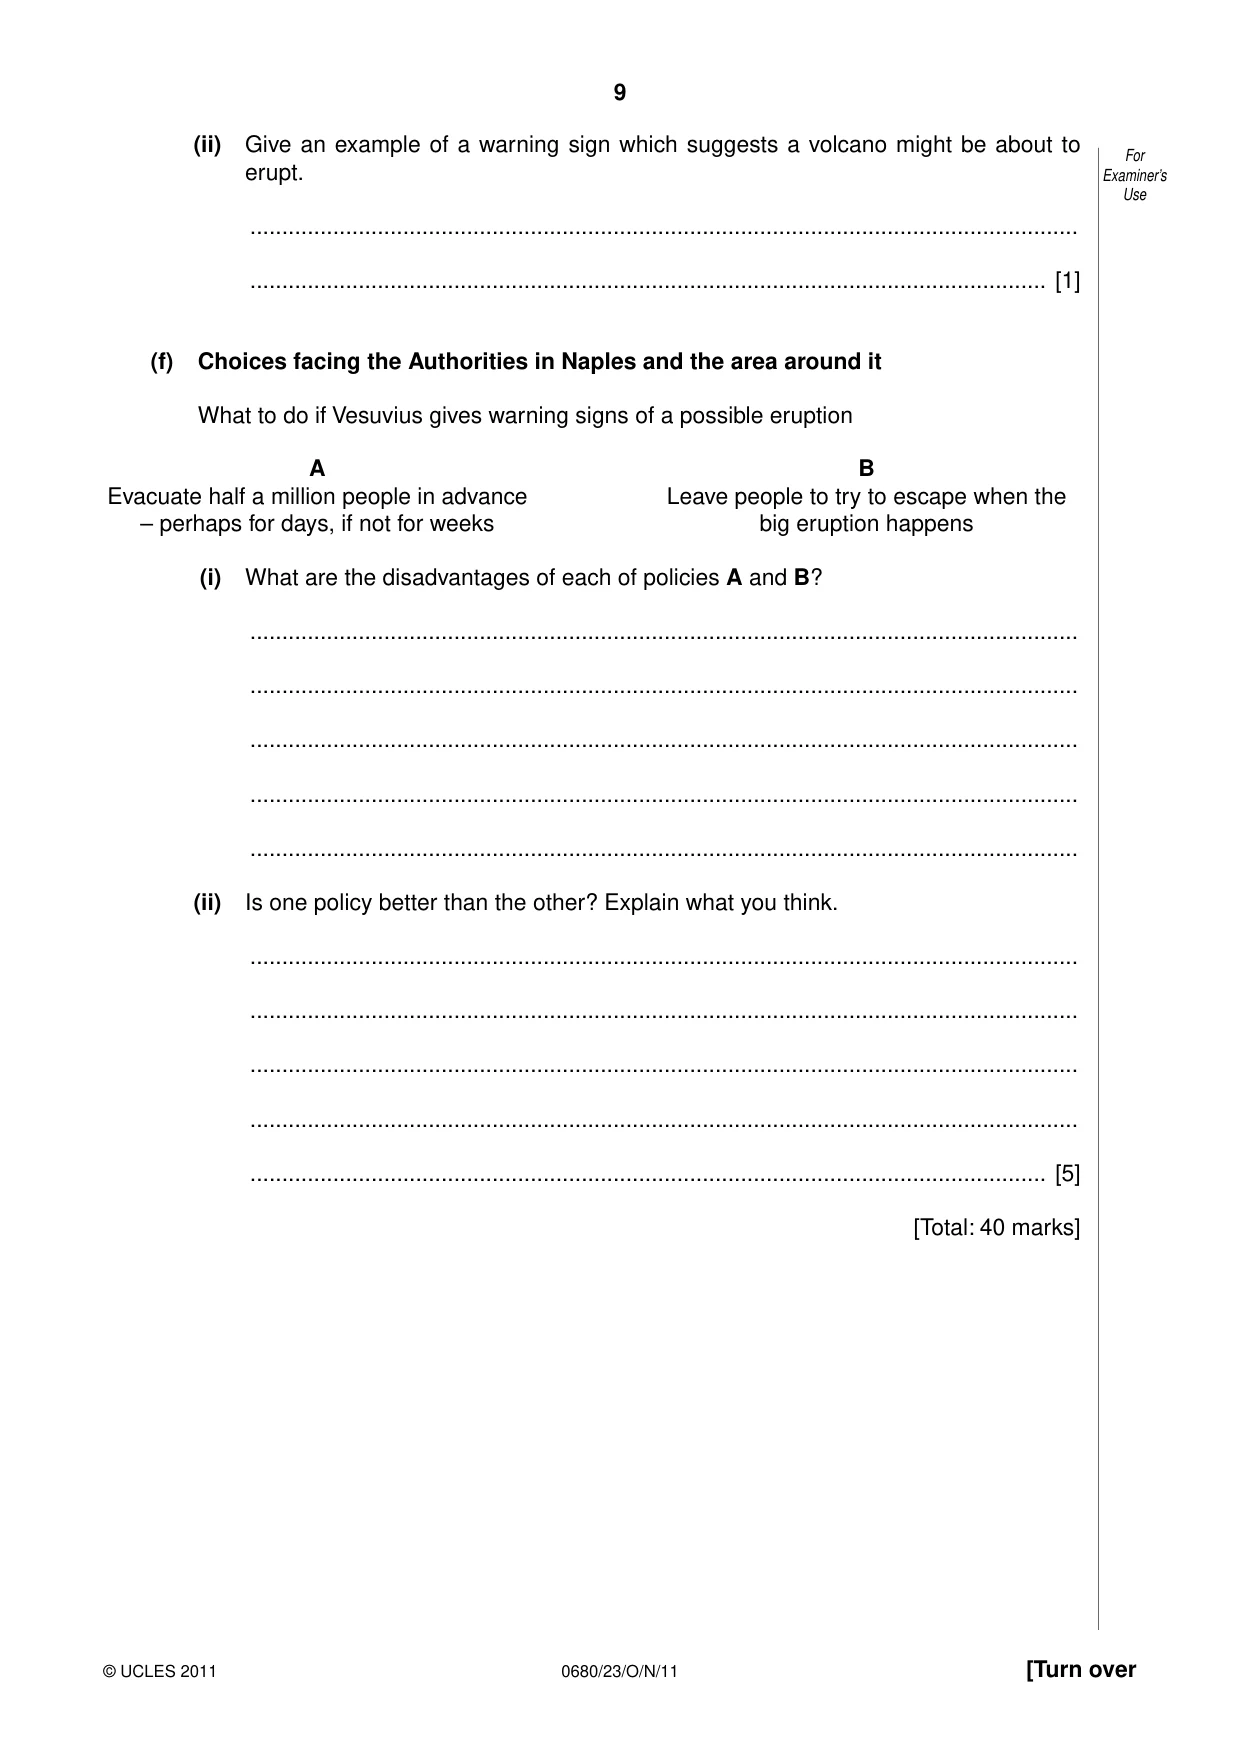
9 0680/23/O/N/11 © UCLES 2011 [Turn over For Examiner’s Use (ii) Give an example of a warning sign which suggests a volcano might be about to erupt. … … [1] (f) Choices facing the Authorities in Naples and the area around it What to do if Vesuvius gives warning signs of a possible eruption A Evacuate half a million people in advance – perhaps for days, if not for weeks B Leave people to try to escape when the big eruption happens (i) What are the disadvantages of each of policies A and B? … … … … … (ii) Is one policy better than the other? Explain what you think. … … … … … [5] [Total: 40 marks]
Question paper, page 10
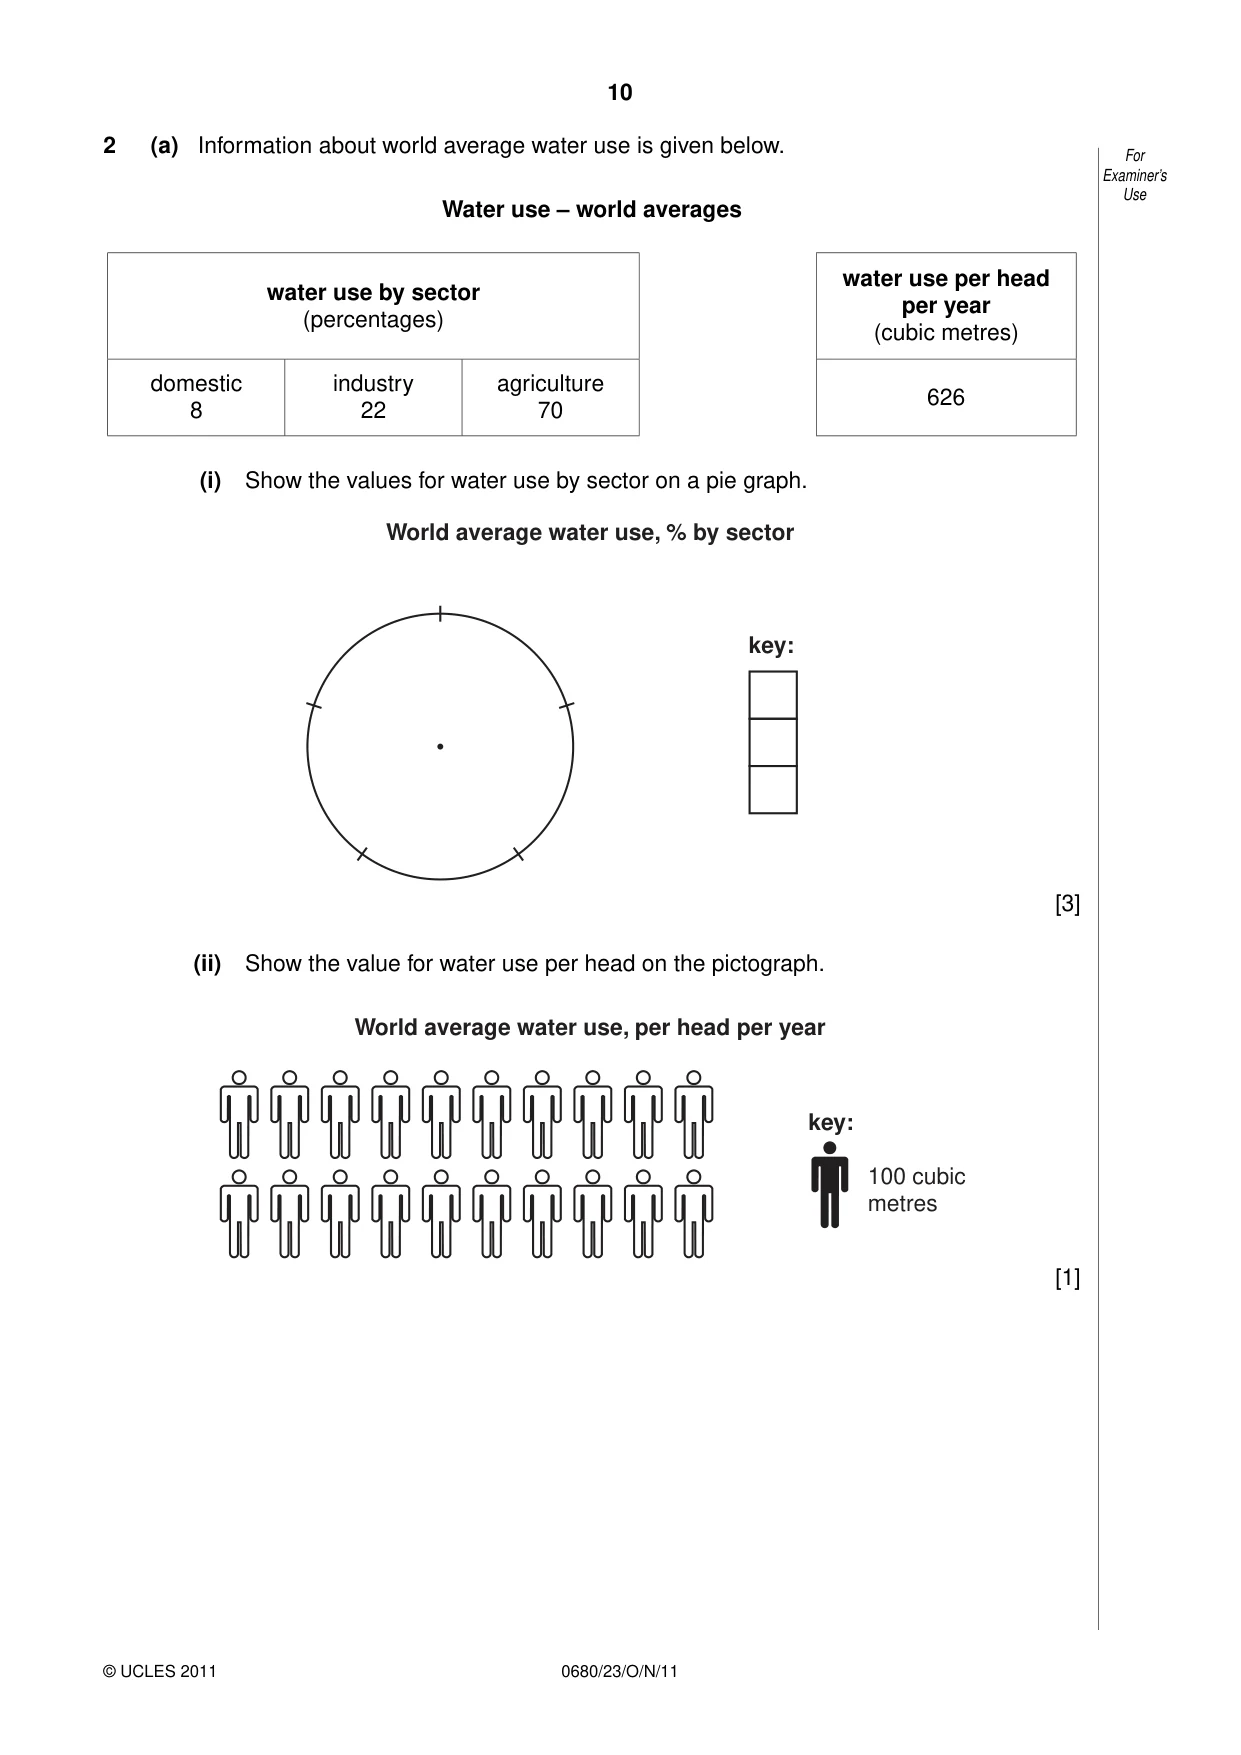
10 0680/23/O/N/11 © UCLES 2011 For Examiner’s Use 2 (a) Information about world average water use is given below. Water use – world averages water use by sector (percentages) water use per head per year (cubic metres) domestic 8 industry 22 agriculture 70 626 (i) Show the values for water use by sector on a pie graph. World average water use, % by sector key: [3] (ii) Show the value for water use per head on the pictograph. World average water use, per head per year key: 100 cubic metres [1]
Question paper, page 11
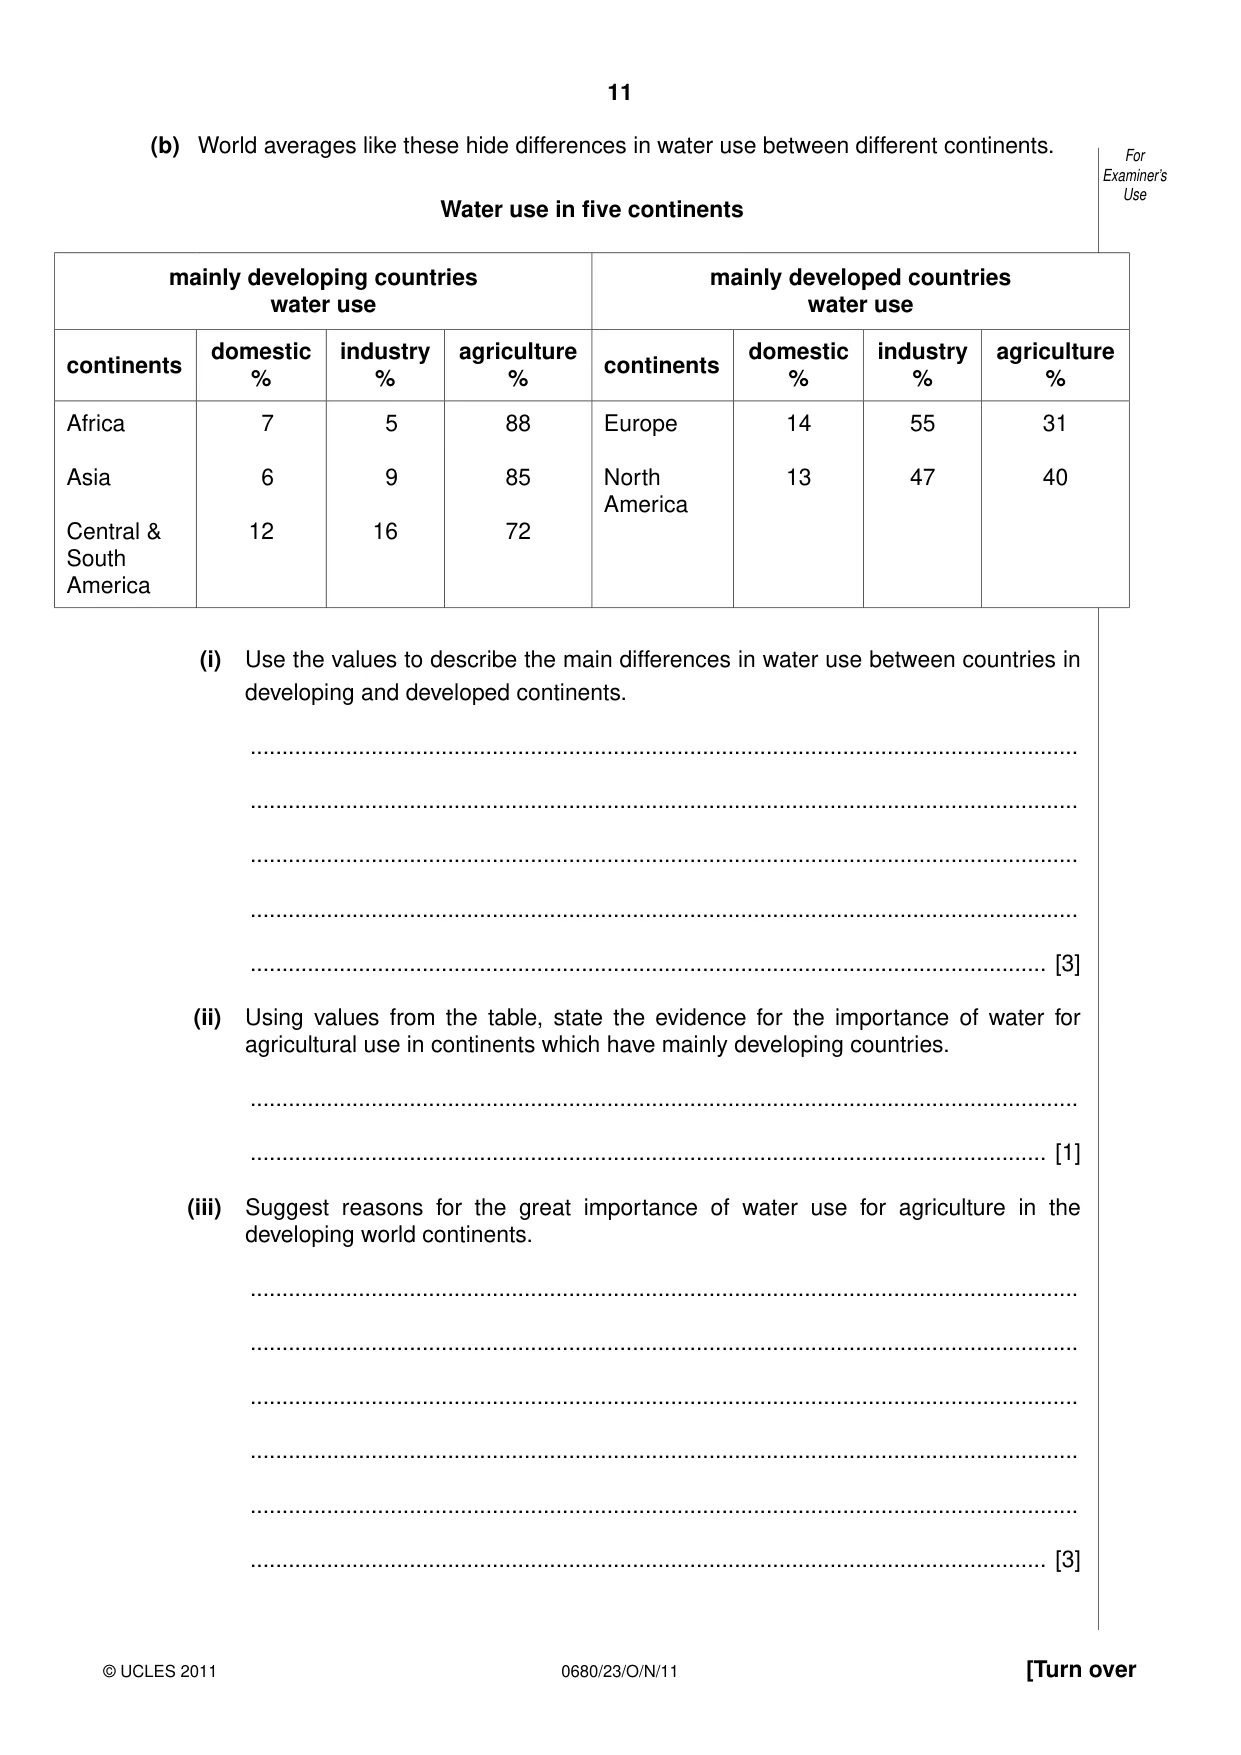
11 0680/23/O/N/11 © UCLES 2011 [Turn over For Examiner’s Use (b) World averages like these hide differences in water use between different continents. Water use in five continents mainly developing countries water use mainly developed countries water use continents domestic % industry % agriculture % continents domestic % industry % agriculture % Africa Asia Central & South America 7 6 12 5 9 16 88 85 72 Europe North America 14 13 55 47 31 40 (i) Use the values to describe the main differences in water use between countries in developing and developed continents. … … … … … [3] (ii) Using values from the table, state the evidence for the importance of water for agricultural use in continents which have mainly developing countries. … … [1] (iii) Suggest reasons for the great importance of water use for agriculture in the developing world continents. … … … … … … [3]
Question paper, page 12
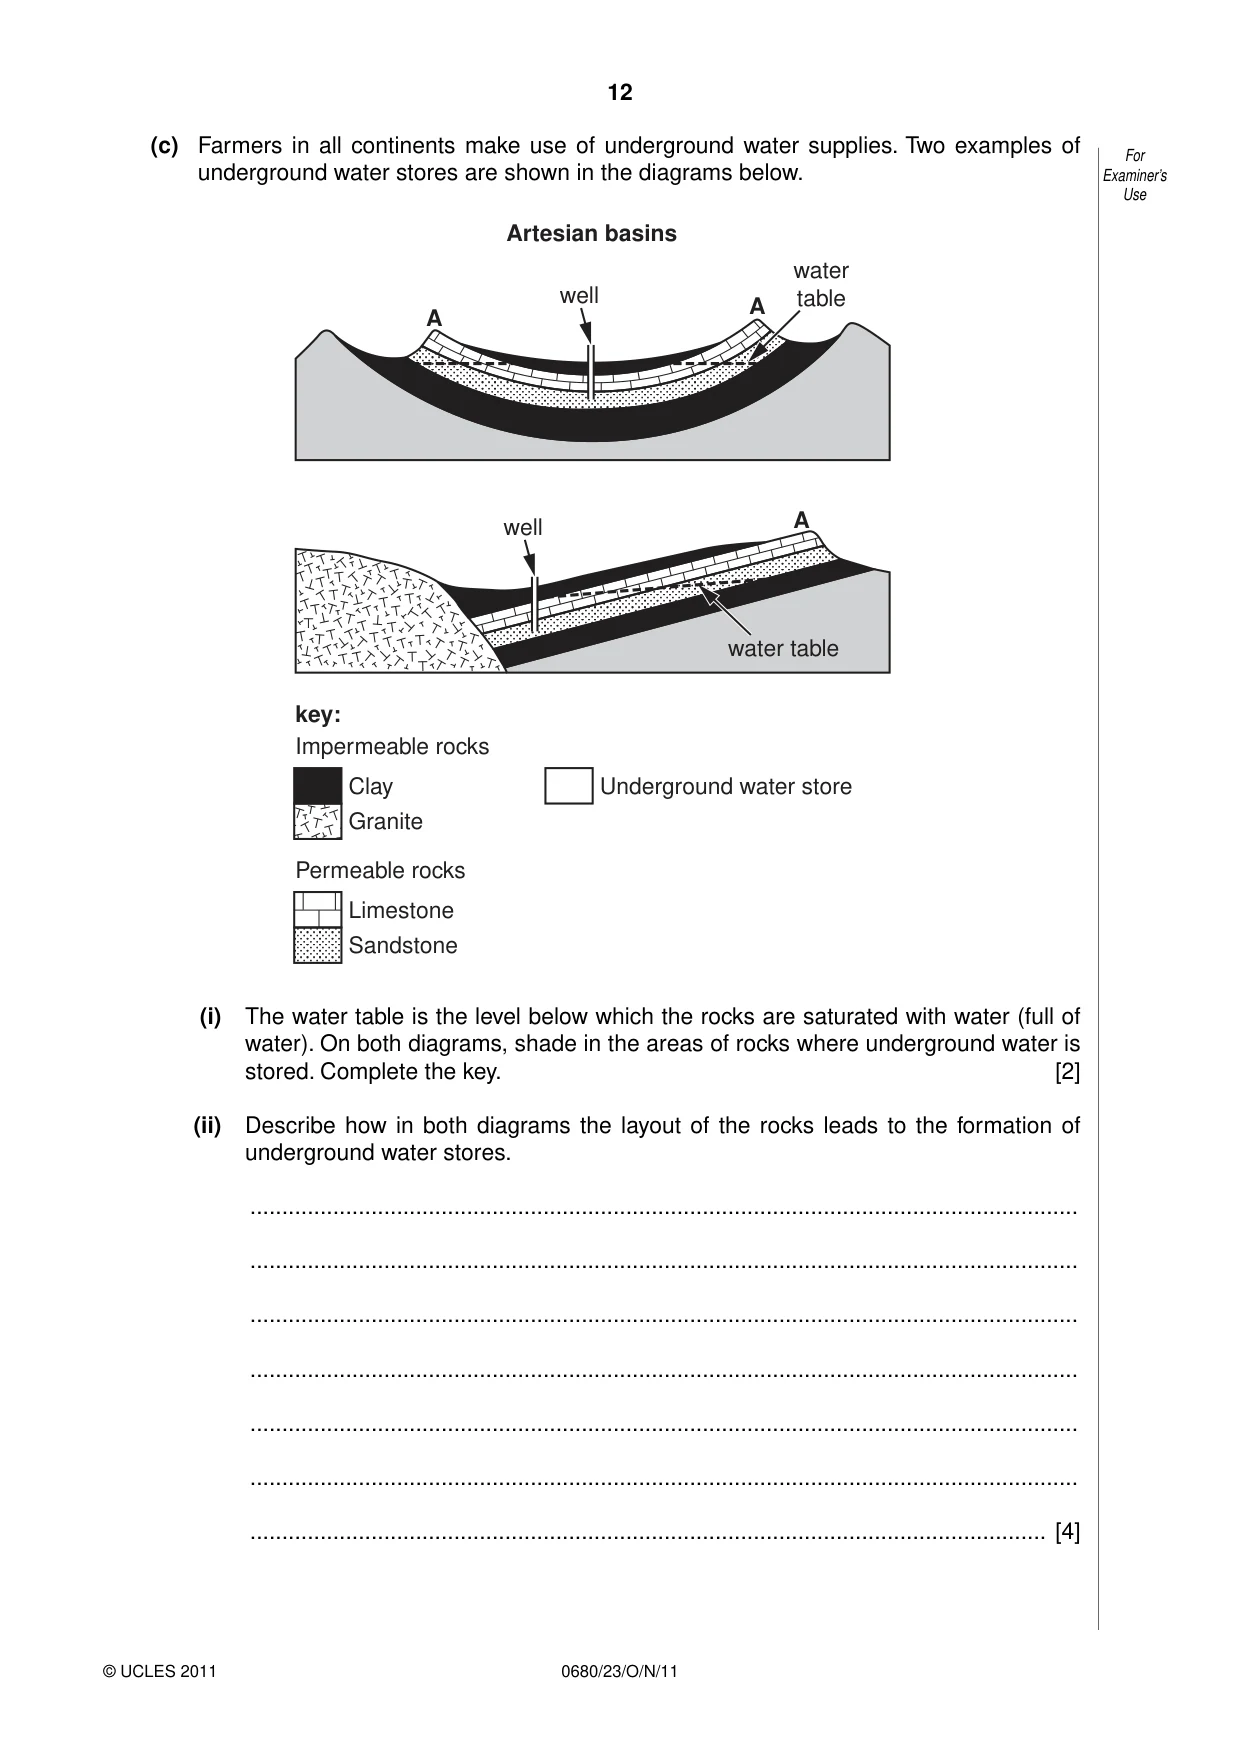
12 0680/23/O/N/11 © UCLES 2011 For Examiner’s Use (c) Farmers in all continents make use of underground water supplies. Two examples of underground water stores are shown in the diagrams below. well A A water table A well key: Impermeable rocks Clay Granite water table Underground water store Permeable rocks Limestone Sandstone Artesian basins (i) The water table is the level below which the rocks are saturated with water (full of water). On both diagrams, shade in the areas of rocks where underground water is stored. Complete the key. [2] (ii) Describe how in both diagrams the layout of the rocks leads to the formation of underground water stores. … … … … … … … [4]
Question paper, page 13
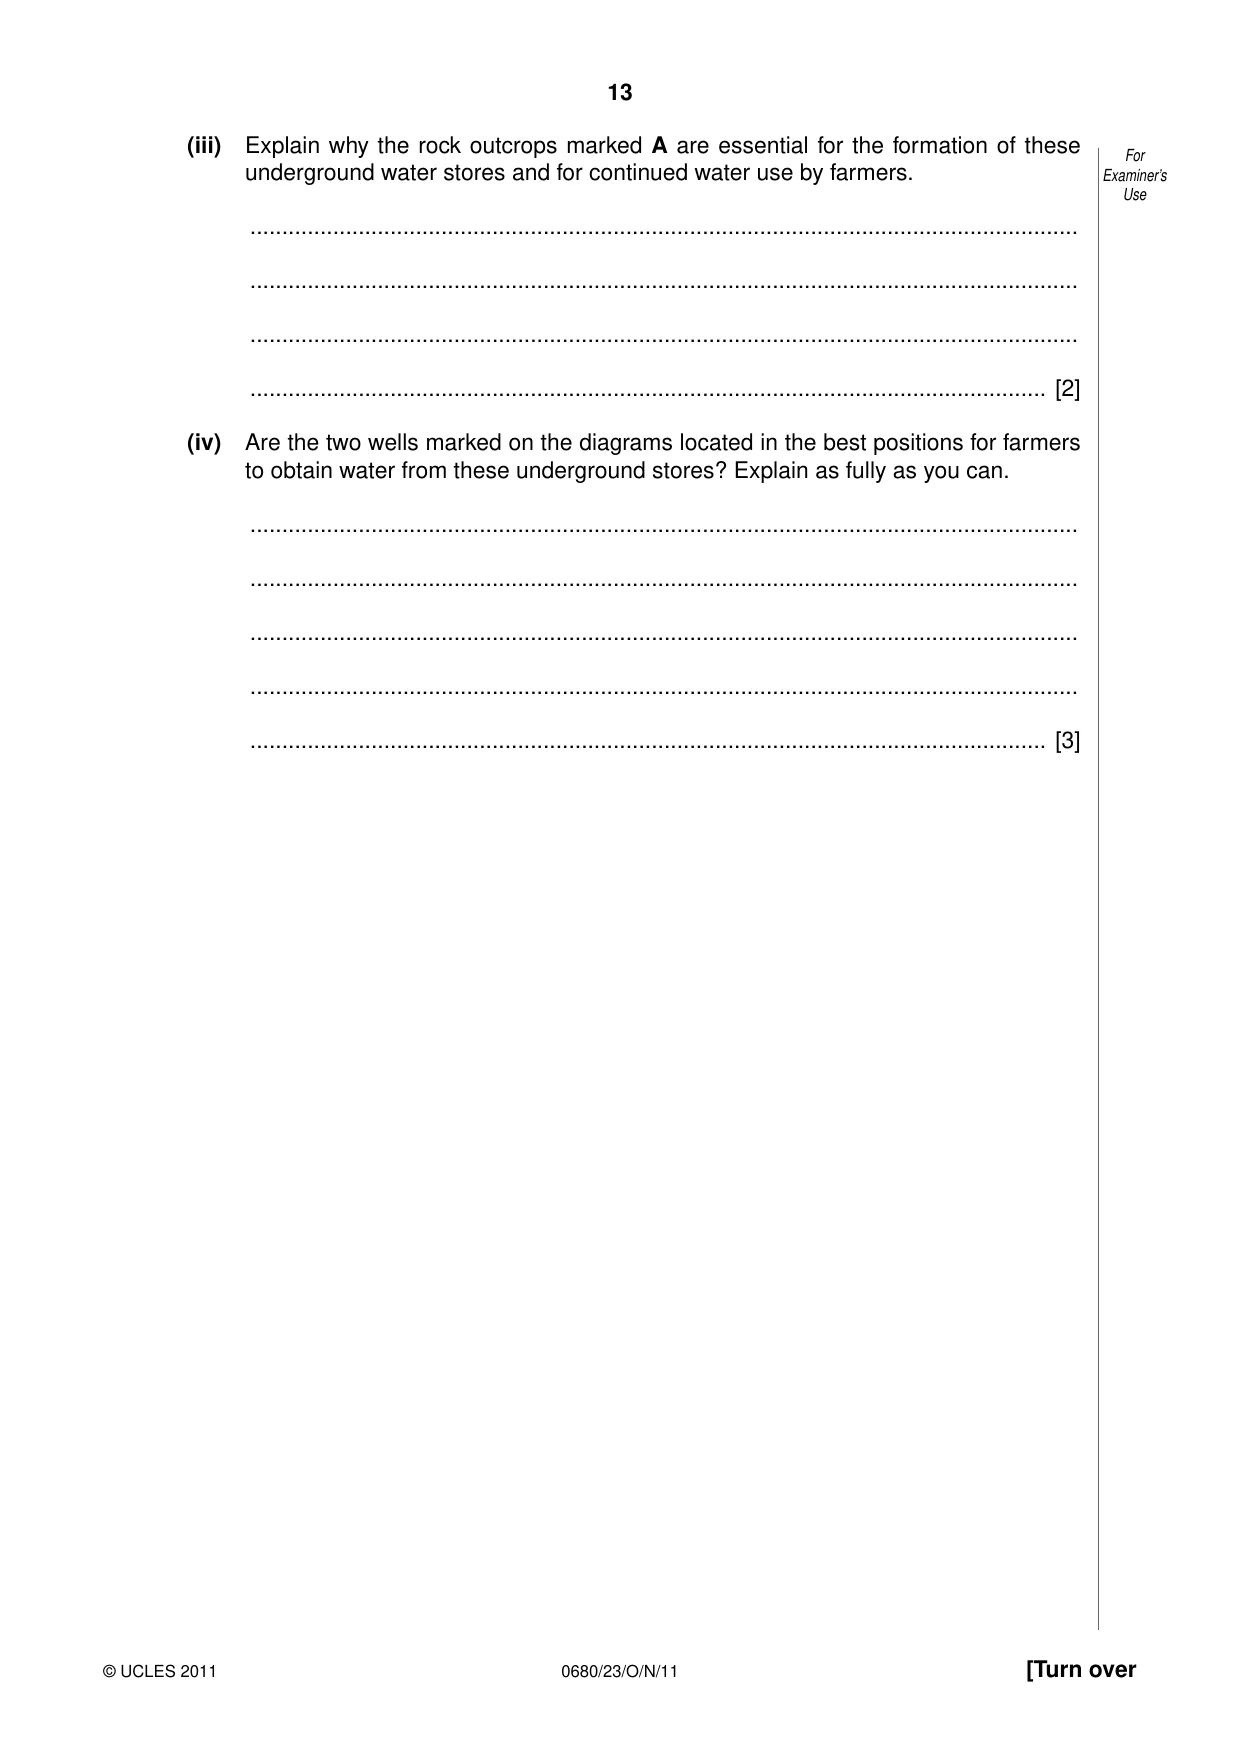
13 0680/23/O/N/11 © UCLES 2011 [Turn over For Examiner’s Use (iii) Explain why the rock outcrops marked A are essential for the formation of these underground water stores and for continued water use by farmers. … … … … [2] (iv) Are the two wells marked on the diagrams located in the best positions for farmers to obtain water from these underground stores? Explain as fully as you can. … … … … … [3]
Question paper, page 14
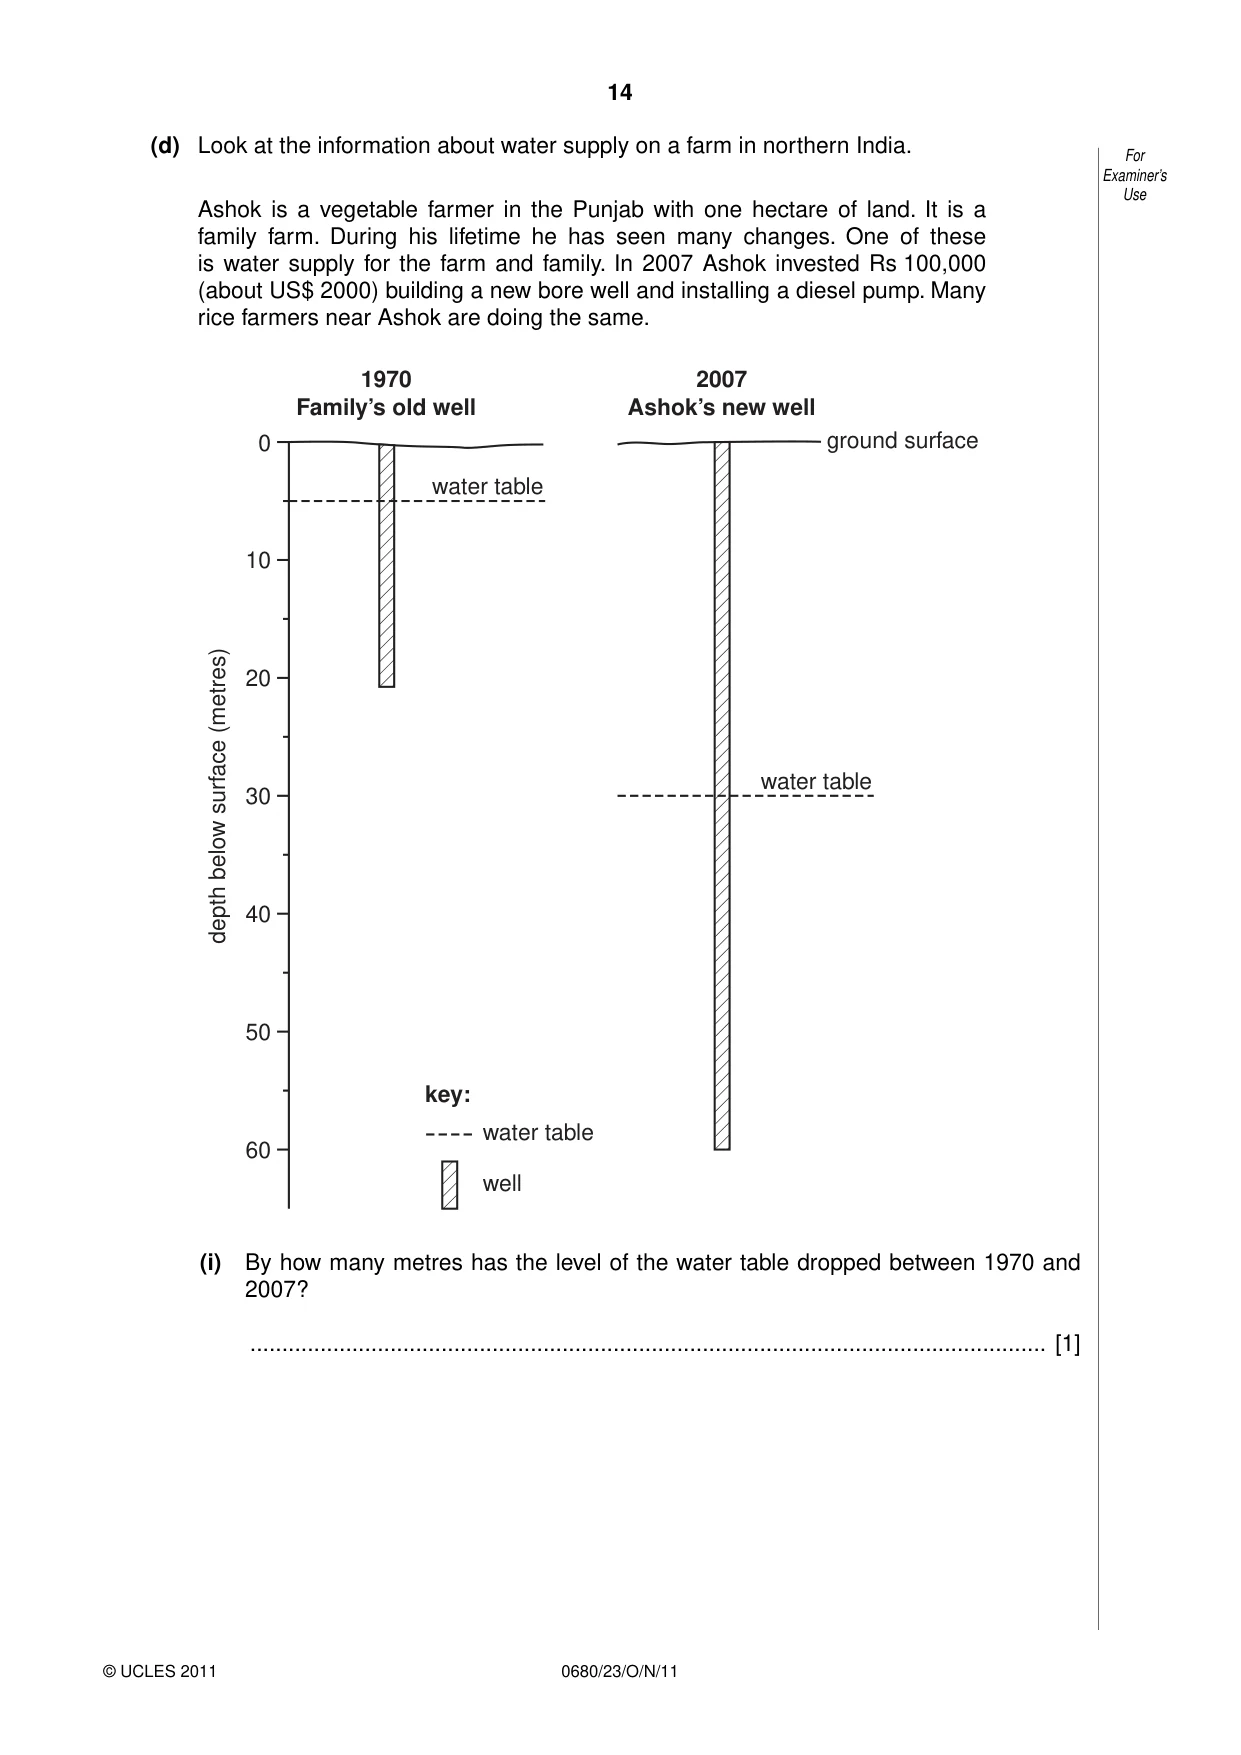
14 0680/23/O/N/11 © UCLES 2011 For Examiner’s Use (d) Look at the information about water supply on a farm in northern India. Ashok is a vegetable farmer in the Punjab with one hectare of land. It is a family farm. During his lifetime he has seen many changes. One of these is water supply for the farm and family. In 2007 Ashok invested Rs 100,000 (about US$ 2000) building a new bore well and installing a diesel pump. Many rice farmers near Ashok are doing the same. 0 1970 Family’s old well 10 20 30 40 50 60 2007 Ashok’s new well water table water table water table well ground surface depth below surface (metres) key: (i) By how many metres has the level of the water table dropped between 1970 and 2007? … [1]
Question paper, page 15
15 0680/23/O/N/11 © UCLES 2011 [Turn over For Examiner’s Use (ii) Why has the cost of obtaining underground water increased greatly for Ashok and other farmers in this area? … … … … [2] (iii) Is this an example of sustainable or unsustainable use of underground water supplies? Explain your answer. … … … … [2] (e) In summer 2009 the monsoon rains in many parts of India were poor, well below average. Water levels in many reservoirs fell to 11 per cent of total storage capacity, compared with expected water levels of about 26 per cent at this time of year. One way of increasing water storage in countries such as India is by building new dams. (i) State the physical conditions needed for building a large dam and reservoir. … … … … … … [3]
Question paper, page 16
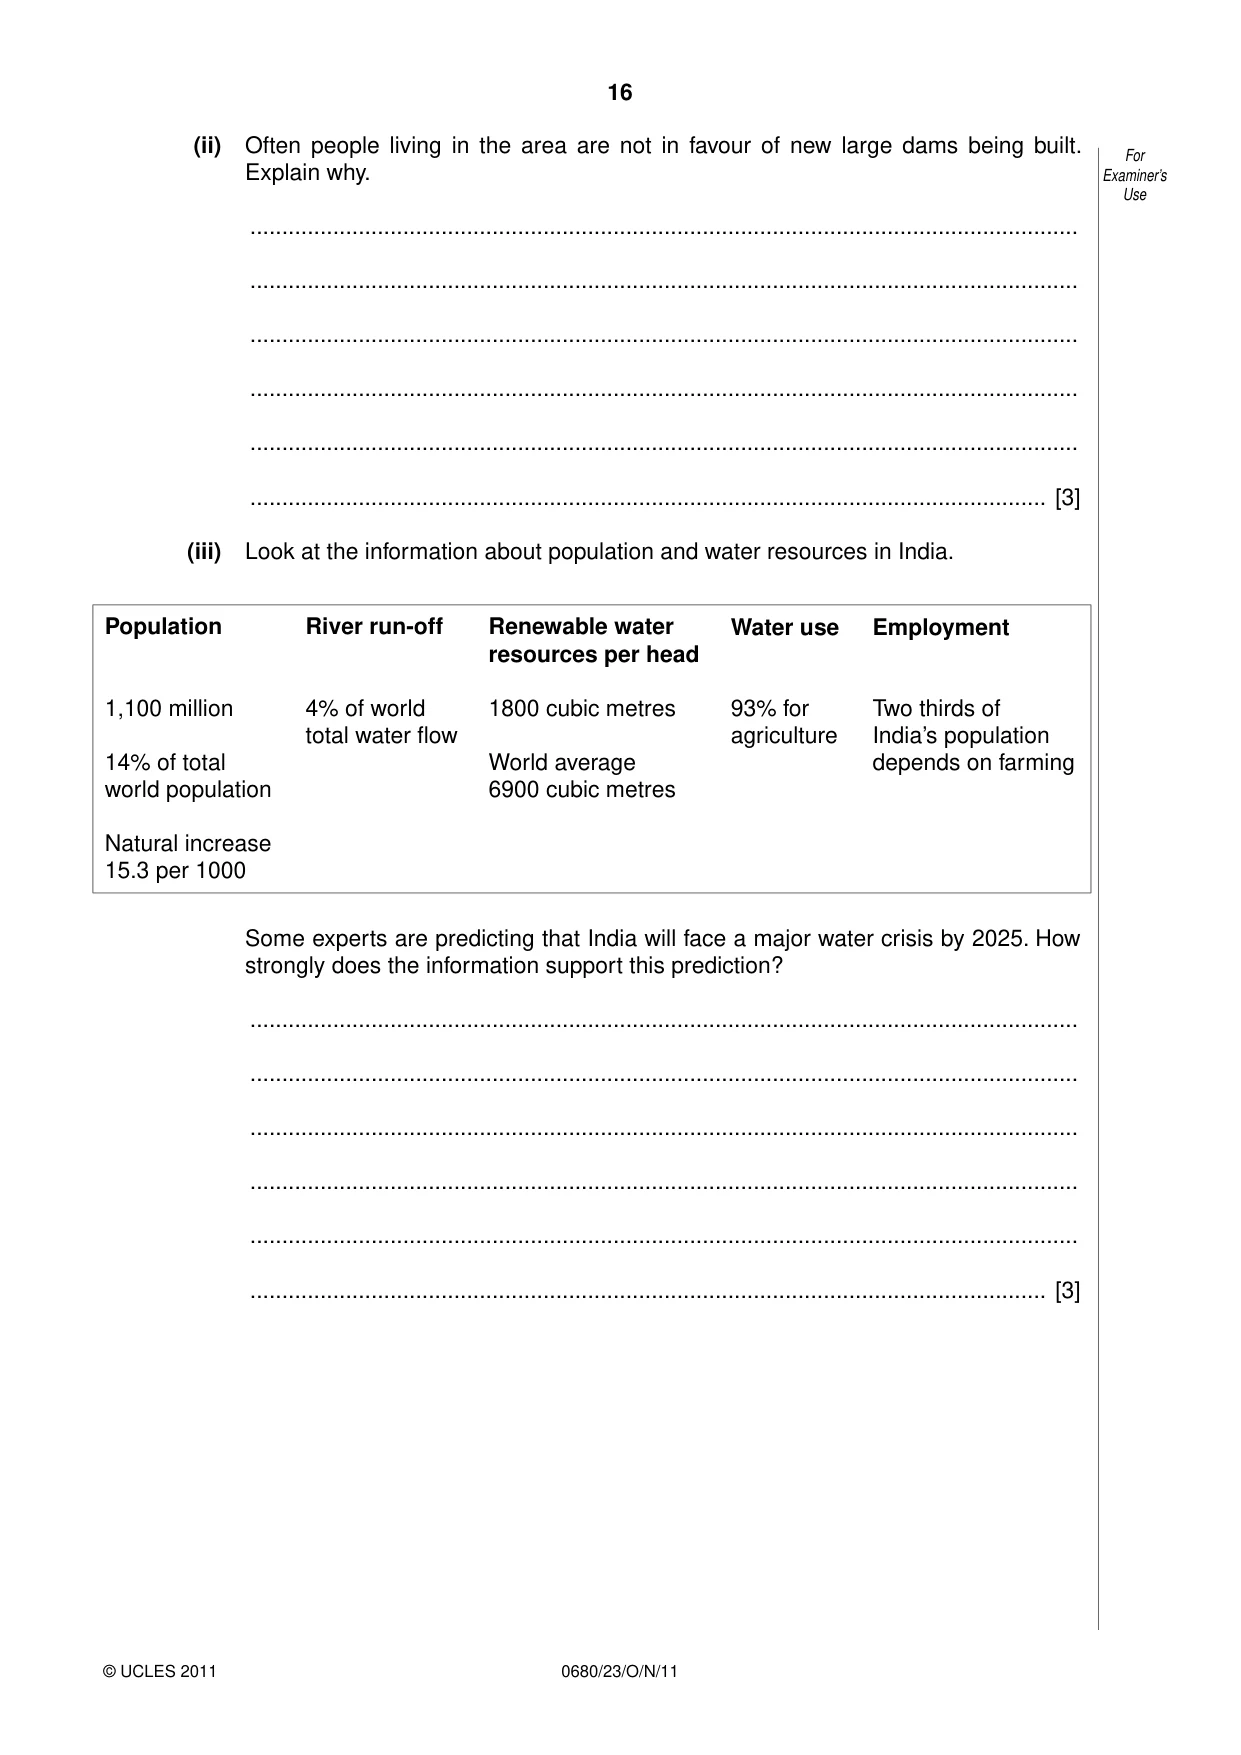
16 0680/23/O/N/11 © UCLES 2011 For Examiner’s Use (ii) Often people living in the area are not in favour of new large dams being built. Explain why. … … … … … … [3] (iii) Look at the information about population and water resources in India. Population 1,100 million 14% of total world population Natural increase 15.3 per 1000 River run-off 4% of world total water flow Renewable water resources per head 1800 cubic metres World average 6900 cubic metres Water use 93% for agriculture Employment Two thirds of India’s population depends on farming Some experts are predicting that India will face a major water crisis by 2025. How strongly does the information support this prediction? … … … … … … [3]
Question paper, page 17
17 0680/23/O/N/11 © UCLES 2011 For Examiner’s Use (iv) Describe what farmers can do to reduce water use while trying to maintain levels of food output from their farms. … … … … … … … … [4] [Total: 40 marks]
Question paper, page 18
18 0680/23/O/N/11 © UCLES 2011 BLANK PAGE
Question paper, page 19
19 0680/23/O/N/11 © UCLES 2011 BLANK PAGE
Question paper, page 20
20 0680/23/O/N/11 © UCLES 2011 Permission to reproduce items where third-party owned material protected by copyright is included has been sought and cleared where possible. Every reasonable effort has been made by the publisher (UCLES) to trace copyright holders, but if any items requiring clearance have unwittingly been included, the publisher will be pleased to make amends at the earliest possible opportunity. University of Cambridge International Examinations is part of the Cambridge Assessment Group. Cambridge Assessment is the brand name of University of Cambridge Local Examinations Syndicate (UCLES), which is itself a department of the University of Cambridge. BLANK PAGE
Mark scheme, page 1
UNIVERSITY OF CAMBRIDGE INTERNATIONAL EXAMINATIONS International General Certificate of Secondary Education MARK SCHEME for the October/November 2011 question paper for the guidance of teachers 0680 ENVIRONMENTAL MANAGEMENT 0680/23 Paper 2, maximum raw mark 80 This mark scheme is published as an aid to teachers and candidates, to indicate the requirements of the examination. It shows the basis on which Examiners were instructed to award marks. It does not indicate the details of the discussions that took place at an Examiners’ meeting before marking began, which would have considered the acceptability of alternative answers. Mark schemes must be read in conjunction with the question papers and the report on the examination. • Cambridge will not enter into discussions or correspondence in connection with these mark schemes. Cambridge is publishing the mark schemes for the October/November 2011 question papers for most IGCSE, GCE Advanced Level and Advanced Subsidiary Level syllabuses and some Ordinary Level syllabuses. www.XtremePapers.com
Mark scheme, page 2
Page 2 Mark Scheme: Teachers’ version Syllabus Paper IGCSE – October/November 2011 0680 23 © University of Cambridge International Examinations 2011 1 (a) (i) attempt to shade or colour in the plate boundary in the middle of the Atlantic Ocean.; [1] (ii) in the north / countries next to the Mediterranean Sea; closest to the destructive plate boundary; further information about what happens at destructive boundaries to cause earthquakes; most of Africa located in the middle of the plates away from activity zones; Three points made along these lines. 3 @ 1 mark [3] (iii) magma from the mantle reaches the surface; in the crack / fault / space between plates as they move apart; builds up mountain ranges / forms volcanoes / rift valleys; new rocks / new land formed (hence the name constructive); Two points like these showing understanding and no confusion with destructive. 2 @ 1 mark [2] (b) (i) direct map evidence relevant to the answer – to the south is the major plate boundary where Eurasian and African plates meet; fault lines run north-south and east-west through the Apennine mountains; locations shown for six major earthquakes since 1908 / in the last 100 years; shown in most parts of Italy / widespread throughout the country; Three relevant statements like these. 3 @ 1 mark [3] (ii) immediately after the main shock – people hit by falling debris from collapsing buildings, bridges etc.; people trapped alive but unable to be rescued under weight of fallen debris; fires spread due to explosions from gas pipes / damage to electrical wires; mud flows / landslides triggered off engulfing houses / villages / all in their path; out at sea trigger off tsunamis which destroy low lying coastal regions; in the following days and weeks – further after shocks may cause already weakened structure to collapse; spread of diseases from disruption of water supplies / sewage systems; examples of water related diseases leading to epidemics such as cholera, typhoid; inadequate food / relief operations outside major urban areas; Four points such as these. Minimum one mark for each of immediate and following. 4 @ 1 mark [4] (c) (i) at the place where north/south and east/west fault lines cross; [1] (ii) where – the old centre of L'Aquila; why – old buildings either frail because of their age or unlikely to have been built using techniques to make buildings earthquake-proof; 2 @ 1 mark [2]
Mark scheme, page 3
Page 3 Mark Scheme: Teachers’ version Syllabus Paper IGCSE – October/November 2011 0680 23 © University of Cambridge International Examinations 2011 (iii) sniffer dogs – to smell people still alive but trapped under the debris, so that rescuers know where to concentrate efforts; chemical toilets – to reduce the risk of the spread of disease, high with so many people (18 000) concentrated in one place; One mark for each. [2] (iv) Responses to earthquake are much more like those of a developed country – • massive scale of the search and rescue operation, ready with what was needed for an earthquake such as sniffer dogs, heavy lifting gear, blood plasma and planes • great scale of relief operations, for as many as 18,000 people; accommodation, and transport elsewhere, soon provided • government could afford to set an emergency fund as big as US$40 million. Comment – all of these suggest what would be expected from a developed country, ready and prepared, which had the organisation / infrastructure and money to put plans into effect. Indications could be given about how things would be different in developing countries. Effects of earthquake – possible to argue that these were sufficiently severe for a 6.3 earthquake to be more like those expected in a developing country. Mainly direct use of information about responses, with minimum of comment in terms of likelihood for developing and developed countries, or an entirely developing country answer with support = 1 or 2 marks. Information selected forms the basis for comment, well directed towards differences between developed and developing world earthquake responses (i.e. the theme of the question) = 3 or 4 marks. [4] (d) (i) steel structures within the frame of the building for reinforcement; damping and bracing systems to help absorb shocks; foundation piles made out of alternate layers of steel and rubber for flexibility; tall skyscrapers built in pyramid-like shapes; use of high quality steel and building materials; existence of building regulations which are enforced; Three points made along these lines. 3 @ 1 mark [3]
Mark scheme, page 4
Page 4 Mark Scheme: Teachers’ version Syllabus Paper IGCSE – October/November 2011 0680 23 © University of Cambridge International Examinations 2011 (ii) Can have all the know-how about making buildings earthquake-proof, but unless they are put into practice by builders and monitored by the authorities, people will try to save money, because earthquake-proof methods involve extra costs of construction. This is why with side by side buildings, one collapses, the other remains standing, all due to human nature and greed. One comment suggests that doing things by the rules is not the norm, even in a developed country like Italy. People believing that it won't happen to them is a common human attitude. Some earthquakes can be so strong, especially those above 7.5 magnitude, that some damage will occur anyway, even in places with well constructed buildings. Also buildings directly on fault lines where the ground opens up / splits apart stand less chance of surviving big movements. Many old buildings still exist in developed world cities; these may have been weakened by age or previous earth movements. Although buildings are well constructed, they may not have been effectively zoned from other land uses, e.g. industrial units like oil refineries which explode / catch fire, which spreads to affect them. Reasons used such as these; reward elaboration and answer development. At least two different reasons needed for answers worth more than three marks. [4] (iii) points that can be made: • it is impossible to predict exact location / time / strength of an earthquake • sometimes light shocks relieve the tension of movement along the faults and no major quake occurs; in this example they seemed to indicate something bigger was going to happen but who knows? • however, it is possible to predict places at high risk of a major earthquake like L'Aquila, which is perhaps why the Italian rescue and relief authorities were prepared. Marks for explanation rather than candidate opinion. Well explained / good understanding = 2 marks. Some explanation, but not full or clear enough for both marks = 1 mark. [2] (e) (i) likely reasons and possible elaborations: • fertile soils; lava / ash constantly being weathered to release new minerals; • mineral deposits such as sulphur; • tourist potential: hot springs, mud pools; special attractions such as preserved old Roman cities; • geothermal power; industrial potential for smelting metals; Reasons stated and elaborated on along these lines. Fertile soils is the most important. Generally a minimum of two reasons needed for full marks, but a well elaborated and exampled ‘soil’ answer might be worth all three marks. [3] (ii) warning signs such as: temperature increases in and around the cone; increased emissions of steam and gases from cone / top of volcano; small earthquake shocks felt in surrounding areas; Any one. [1]
Mark scheme, page 5
Page 5 Mark Scheme: Teachers’ version Syllabus Paper IGCSE – October/November 2011 0680 23 © University of Cambridge International Examinations 2011 (f) (i) Disadvantages of Policy A – could go to enormous cost / create massive disruption to normal life, all for nothing. Houses etc. left behind might be looted. Getting people to cooperate before an event is very difficult. Can the expense and inconvenience be justified just by warning signs, not a definite prediction? Disadvantages of Policy B – half a million people is too many to move within hours, and to provide rescue and relief services (numbers can be compared with the 18 000 homeless in L'Aquila earthquake). (ii) Policy A – it should save lives and stop a repeat of the massive losses of life that resulted after the eruption in year 79. Loss of life could be much greater with half a million people now living here. Policy B – only responding after the known event, and can prepare for evacuation with practice drills and education / increasing awareness of residents in the area. Mark both parts together. Briefly stated advantages and disadvantages. View about which one is better weakly explained, whatever the view = 1–3 marks. At least one advantage clearly stated for each of policies A and B. View clear and well supported with explanation = 4–5 marks. [5] [Total: 40] 2 (a) (i) Accurate plot of pie graph = 2 marks. Only one (or two) sectors correct = 1 mark. Key completed to match pie graph = 1 mark. [3] (ii) 6 figures, or 6 figures and about one quarter of another, filled in = 1 mark. [1] (b) (i) differences – • main water use: developing continents agriculture, developed industry; • more domestic consumption in developed although size of difference between developed and developing is less marked than for agriculture; • significantly greater industry use in developed than developing; Two differences = 2 marks. Supporting and relevant use of values for at least one of them = 1 mark. [3] (ii) for example in Africa and Asia only up to 15% of water is consumed in other sectors or similar; Any use of values for the three continents together, or for one individual continent, which emphasises dominance of use for agriculture for 1 mark. [1] (iii) many people / more than half workforce in many countries are farmers; most are subsistence farmers needing to feed big / increasing families; need to grow two or more crops per year including one in the dry season; some of the developing continents have large desert areas (e.g. Sahara in Africa); economies of many developing countries rely on export of crops to developed world; population pressure / droughts increasing the need to use more irrigation water; any named examples which support points mentioned above; Three points made along these lines. 3 @ 1 mark [3]
Mark scheme, page 6
Page 6 Mark Scheme: Teachers’ version Syllabus Paper IGCSE – October/November 2011 0680 23 © University of Cambridge International Examinations 2011 (c) (i) Attempt to shade in the areas of sandstone and limestone below the indicated water table levels on both diagrams = 1 mark. Shading / colouring used on diagrams shown in the box in the key, provided that some part of the shading on the diagram matches question need = 1 mark. [2] (ii) Permeable rocks (limestone and sandstone) are surrounded by impermeable rocks (clay, and clay and granite) / permeable have impermeable rocks above and below them, significance of this explained such as water stored in the spaces in permeable rocks cannot escape because of layers of rocks which do not allow water to pass through. Layers of permeable rock outcrop on the surface so that they can be filled with rainwater, perhaps a suggestion that they are higher / upland areas likely to receive more rainfall. Rocks are downfolded or slope at an angle allowing rainwater to flow deeper underground through the spaces (until trapped by impermeable layers). One mark for identifying a way in which the rock lay out favours water store formation. Further mark (or possibly marks) for describing more fully how for each one. Any combination of one and two mark answers about lay out up to four marks. [4] (iii) it is the only way that the permeable layers can be filled up / replenished; elsewhere rainwater falling on the impermeable rocks will runoff over surface; so water table levels would keep falling with use without this new rainwater; Understood and clearly explained = 2 marks. Some understanding without a full explanation = 1 mark. [2] (iv) The general answer is yes – so all the marks are for explanation. yes because: at the deepest water point in the rock in the centre of the downfold; almost at deepest point in the second diagram but not too deep; well would need to be longer / deeper if sunk at the end of permeable layer; water taken out will flow down to bottom / will stay below the water table longest; relatively shallow wells in relation to amount / reliability of water supply obtained; Points made along these lines. 3 @ 1 mark [3] (d) (i) 25 metres; [1] (ii) new well is 40 metres deeper than the old well; more expensive to construct (100 000 rupees spent in 2007); also more costly to obtain the water out of the well because of its depth which is why a diesel pump needed to be installed; Two explanatory points along these lines demonstrating understanding. [2]
Mark scheme, page 7
Page 7 Mark Scheme: Teachers’ version Syllabus Paper IGCSE – October/November 2011 0680 23 © University of Cambridge International Examinations 2011 (iii) Most of the evidence points towards unsustainable: • having to go deeper and deeper to reach water supplies suggesting rate of water use is greater than rate of replenishment = basic answer • if many other rice farmers are doing the same, then how long will the new well last? • there could also be comment about the high water needs of growing a crop such as rice. An answer of sustainable can achieve at best 1 mark for comment on the great depth which might provide enough water for at least the next generation. Answer clearly explained showing understanding = 2 marks. Some, but not full, explanation for chosen answer = 1 mark. [2] (e) (i) relief – narrow, deep, steep sided valley is ideal, often found in the mountains, natural lake present; climate – wet, high total rainfall, heavy rainfall, melting ice / snow for surface runoff / low rates of evaporation; river – large river with a much water from its many tributaries; Three physical advantages stated – all three could be for relief or climate. 3 @ 1 mark [3] (ii) best farmland / houses / villages found on valley floor which will be flooded; economic disadvantages such as loss of best farmland / livelihoods; social disadvantages such as forced movement / break-up of communities; promises about new homes, farms etc. not always kept; dam and its water supply are often of no advantage to people living nearby; Accept other possible lines of answering provided that they relate to local people, e.g. loss of ecosystems for human use but not for wildlife or broader environmental concerns. Three points made along these lines. 3 @ 1 mark [3] (iii) information capable of being used to support the prediction: India for its population size is not water rich (14.5% of world population compared with only 4% of world total water flows); another statistic which reflects this is that it has only about a quarter of the renewable water resources per head compared with the world average; yet its water use at 93% for agriculture is higher than all the previously quoted sector percentages for continents at the start of the question; and the bulk of its population which continues to increase relies on farming; Strong case made with appropriate comment for indicated prediction strength = 3 marks. Less strong case but still with appropriate comment = 2 marks. Reliance on information given without meaningful comment = 1 mark. [3]
Mark scheme, page 8
Page 8 Mark Scheme: Teachers’ version Syllabus Paper IGCSE – October/November 2011 0680 23 © University of Cambridge International Examinations 2011 (iv) one way is use of irrigation methods that consume less water such as trickle drip and clay pot – With further details can be worth up to 3 marks. another is to change to crops which need less water, e.g. from rice towards other cereals or dry rice, or to use seeds which need less water to grow, e.g. drought GM varieties – Well described up to 3 marks. use some dry farming techniques so that available water can be spread to cultivate crops over a wider area – With further details up to 3 marks. Mark other suggestions about ways on their merit, provided that they match question needs – some may only be worth only up to 2 marks. Breadth from two ways needed for four marks. Point mark for ways and information about them up to three marks per way. [4] [Total: 40]
What you needed in this session
Cambridge’s own grade thresholds for 2011 Oct/Nov, Paper 2 · Variant 3. A higher threshold means an easier paper — the bar moves with how the cohort did.