Cambridge IGCSE Environmental Management 0680 — 2010 May/June Paper 4 · Variant 2
0680/42/M/J/10 · 60 marks · ≈68 min
The question paper and its mark scheme, free to read here and free to download. This is Cambridge’s own paper, exactly as it was sat.
Question paper16 pages




Mark scheme4 pages
Answers below. Sit the paper first if you are practising.
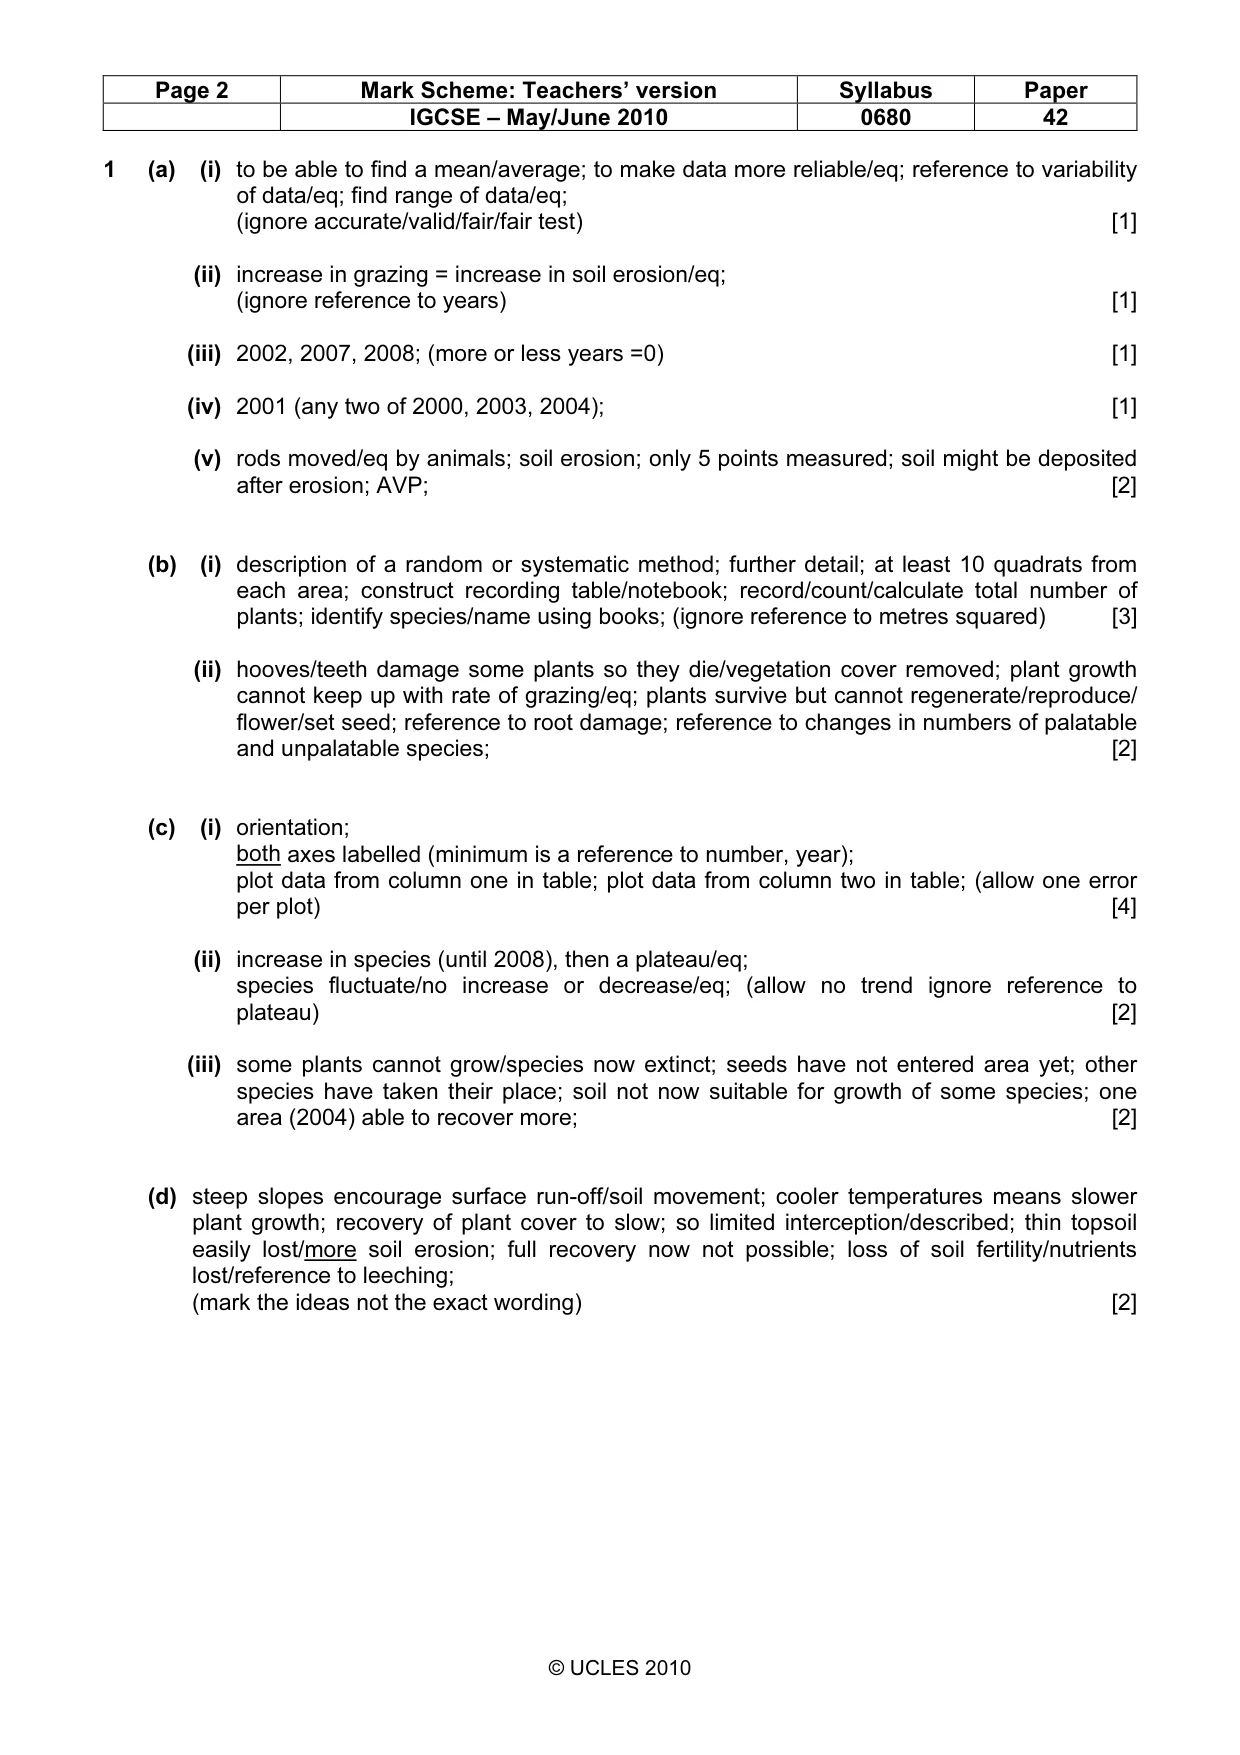
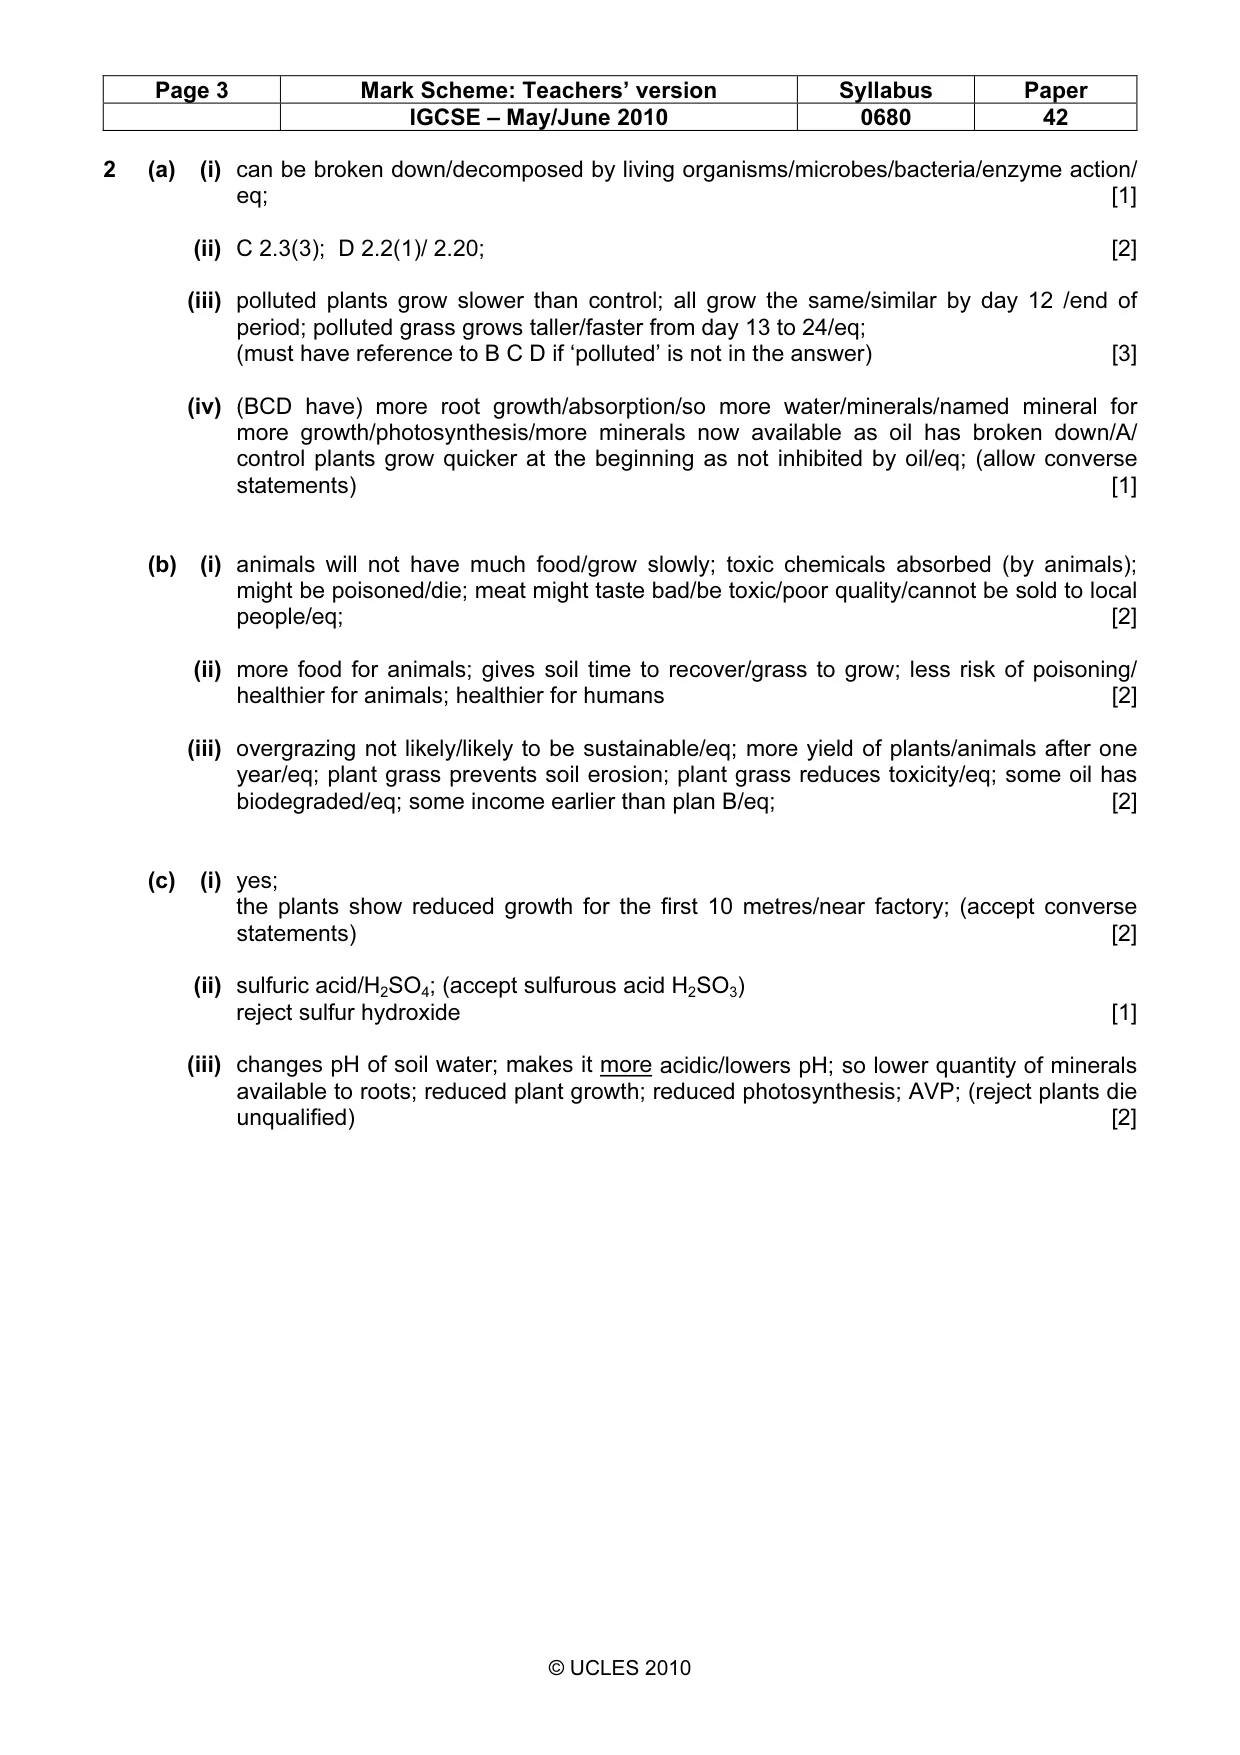
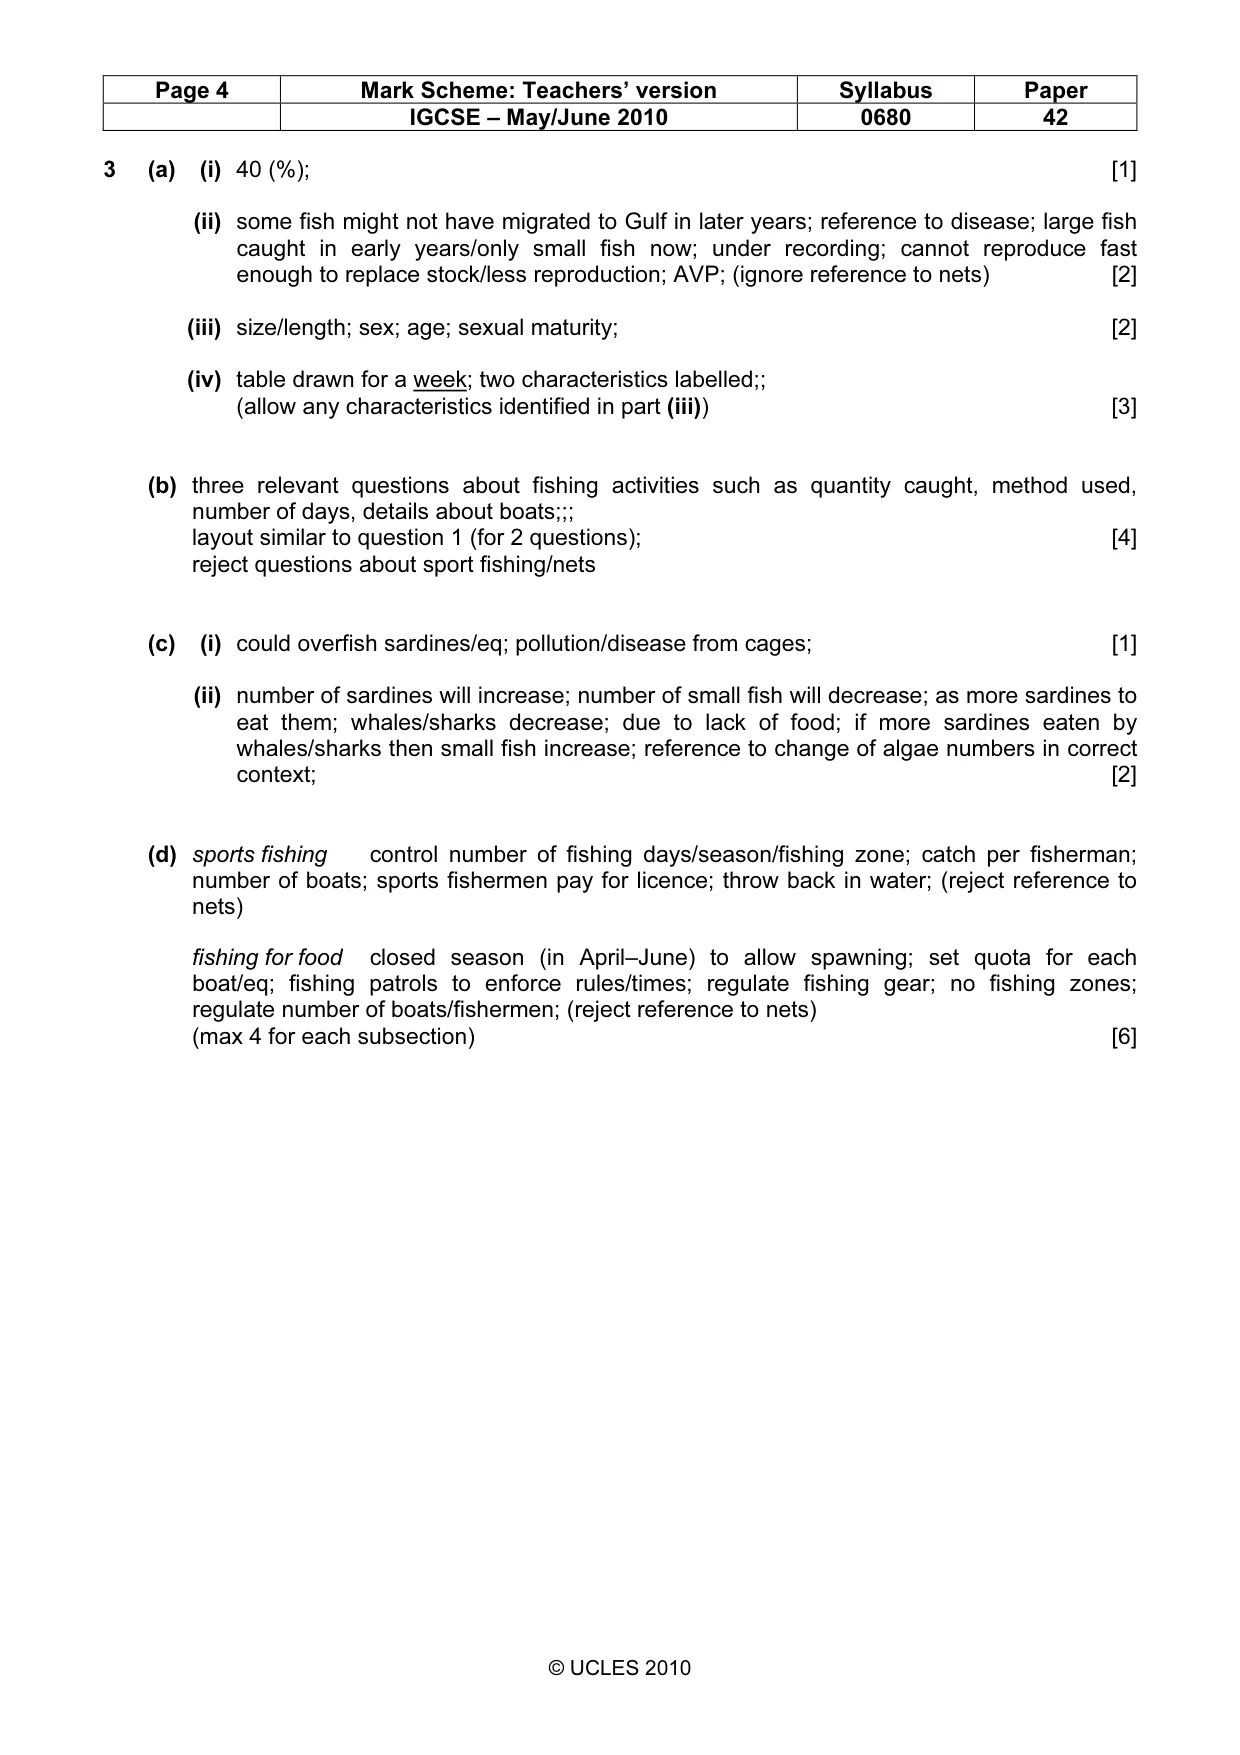
Paper as text
Question paper, page 1
This document consists of 14 printed pages and 2 blank pages. DC (CW/SW) 22534/3 © UCLES 2010 [Turn over UNIVERSITY OF CAMBRIDGE INTERNATIONAL EXAMINATIONS International General Certificate of Secondary Education READ THESE INSTRUCTIONS FIRST Write your Centre number, candidate number and name on all the work you hand in. Write in dark blue or black pen. You may use a soft pencil for any diagrams, graphs or rough working. Do not use staples, paper clips, highlighters, glue or correction fluid. DO NOT WRITE IN ANY BARCODES. Answer all questions. Study the appropriate Source materials before you start to write your answers. Credit will be given for appropriate selection and use of data in your answers and for relevant interpretation of these data. Suggestions for data sources are given in some questions. You may use the source data to draw diagrams and graphs or to do calculations to illustrate your answers. At the end of the examination, fasten all your work securely together. The number of marks is given in brackets [ ] at the end of each question or part question. * 4 7 0 4 8 8 3 6 8 8 * ENVIRONMENTAL MANAGEMENT 0680/42 Alternative to Coursework May/June 2010 1 hour 30 minutes Candidates answer on the Question Paper. Additional Materials: Ruler For Examiner’s Use www.XtremePapers.com
Question paper, page 2
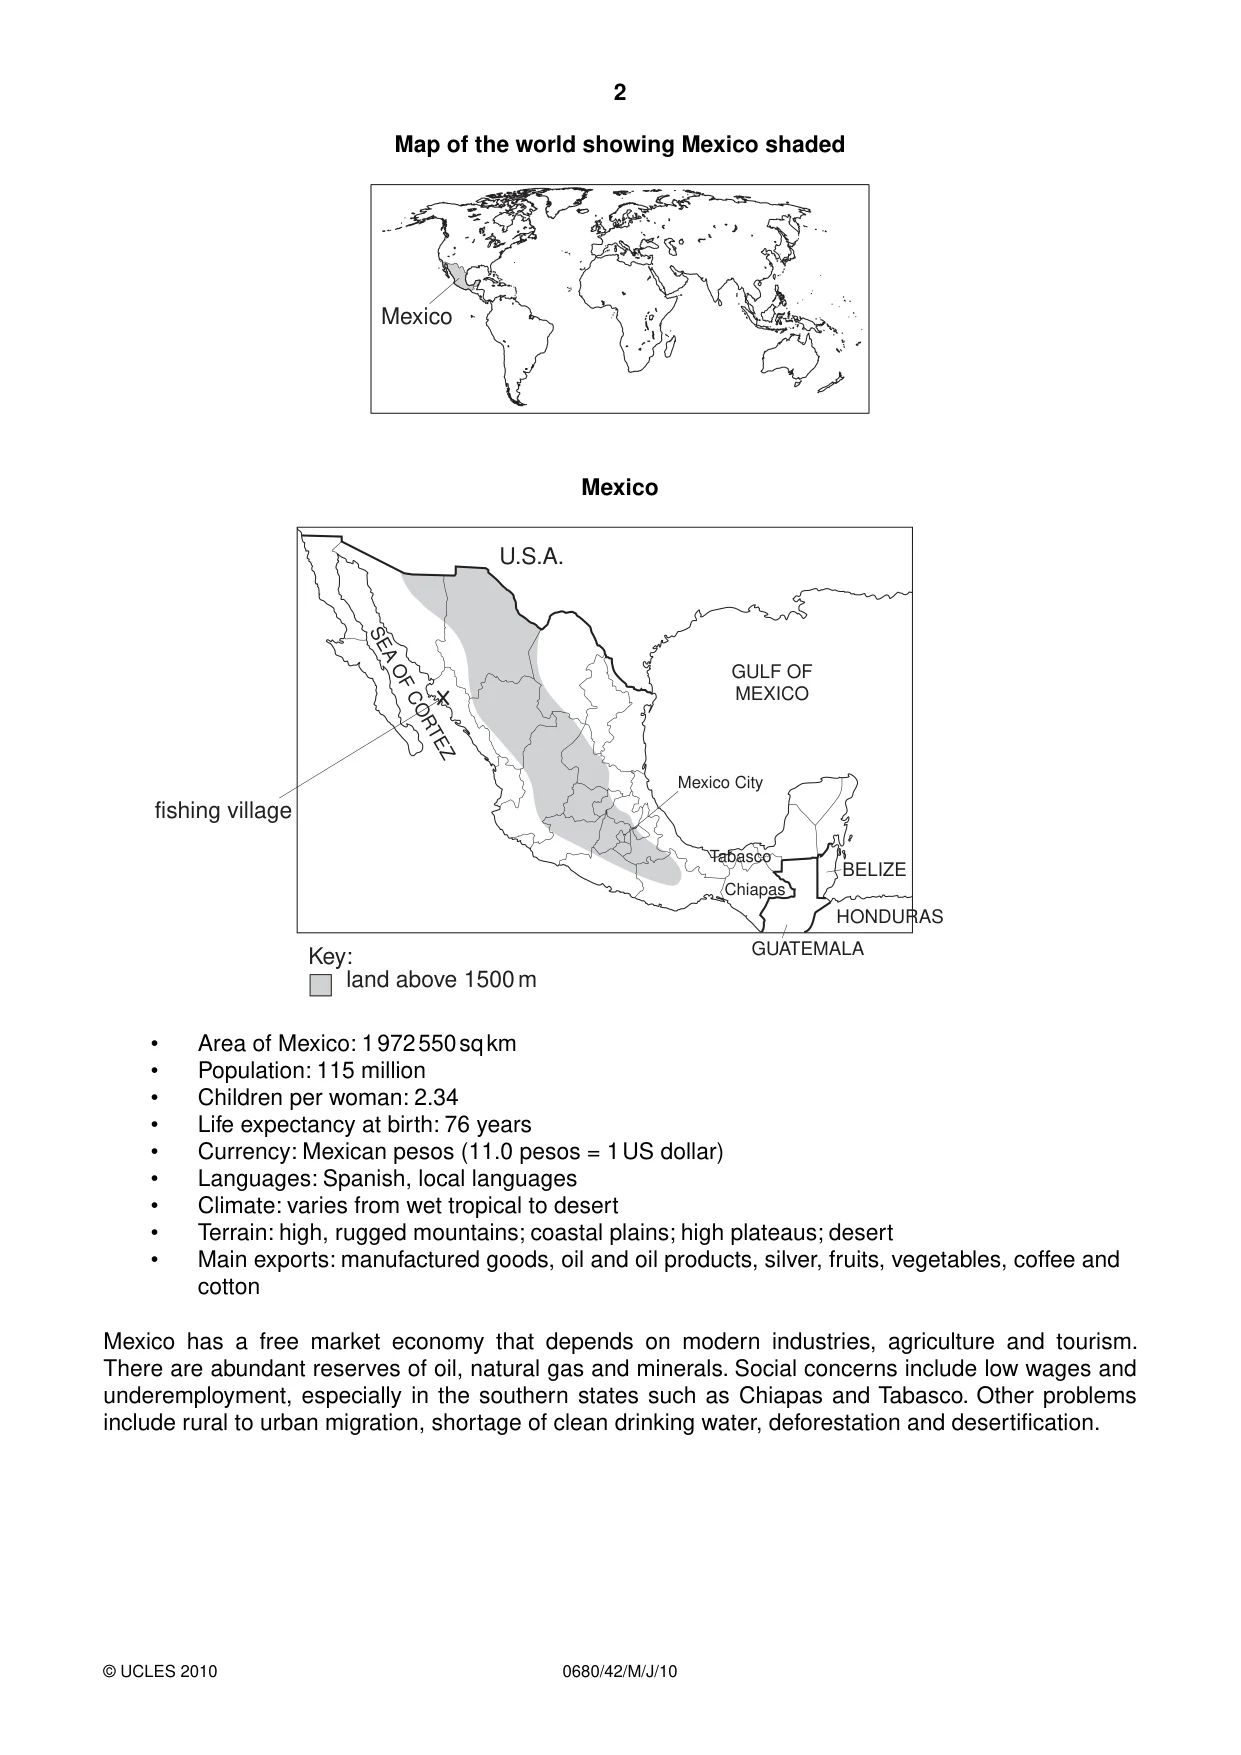
2 0680/42/M/J/10 © UCLES 2010 Map of the world showing Mexico shaded Mexico Mexico U.S.A. GUATEMALA HONDURAS BELIZE fishing village GULF OF MEXICO SEA OF CORTEZ Tabasco Mexico City Chiapas land above 1500 m Key: • Area of Mexico: 1 972 550 sq km • Population: 115 million • Children per woman: 2.34 • Life expectancy at birth: 76 years • Currency: Mexican pesos (11.0 pesos = 1 US dollar) • Languages: Spanish, local languages • Climate: varies from wet tropical to desert • Terrain: high, rugged mountains; coastal plains; high plateaus; desert • Main exports: manufactured goods, oil and oil products, silver, fruits, vegetables, coffee and cotton Mexico has a free market economy that depends on modern industries, agriculture and tourism. There are abundant reserves of oil, natural gas and minerals. Social concerns include low wages and underemployment, especially in the southern states such as Chiapas and Tabasco. Other problems include rural to urban migration, shortage of clean drinking water, deforestation and desertification.
Question paper, page 3
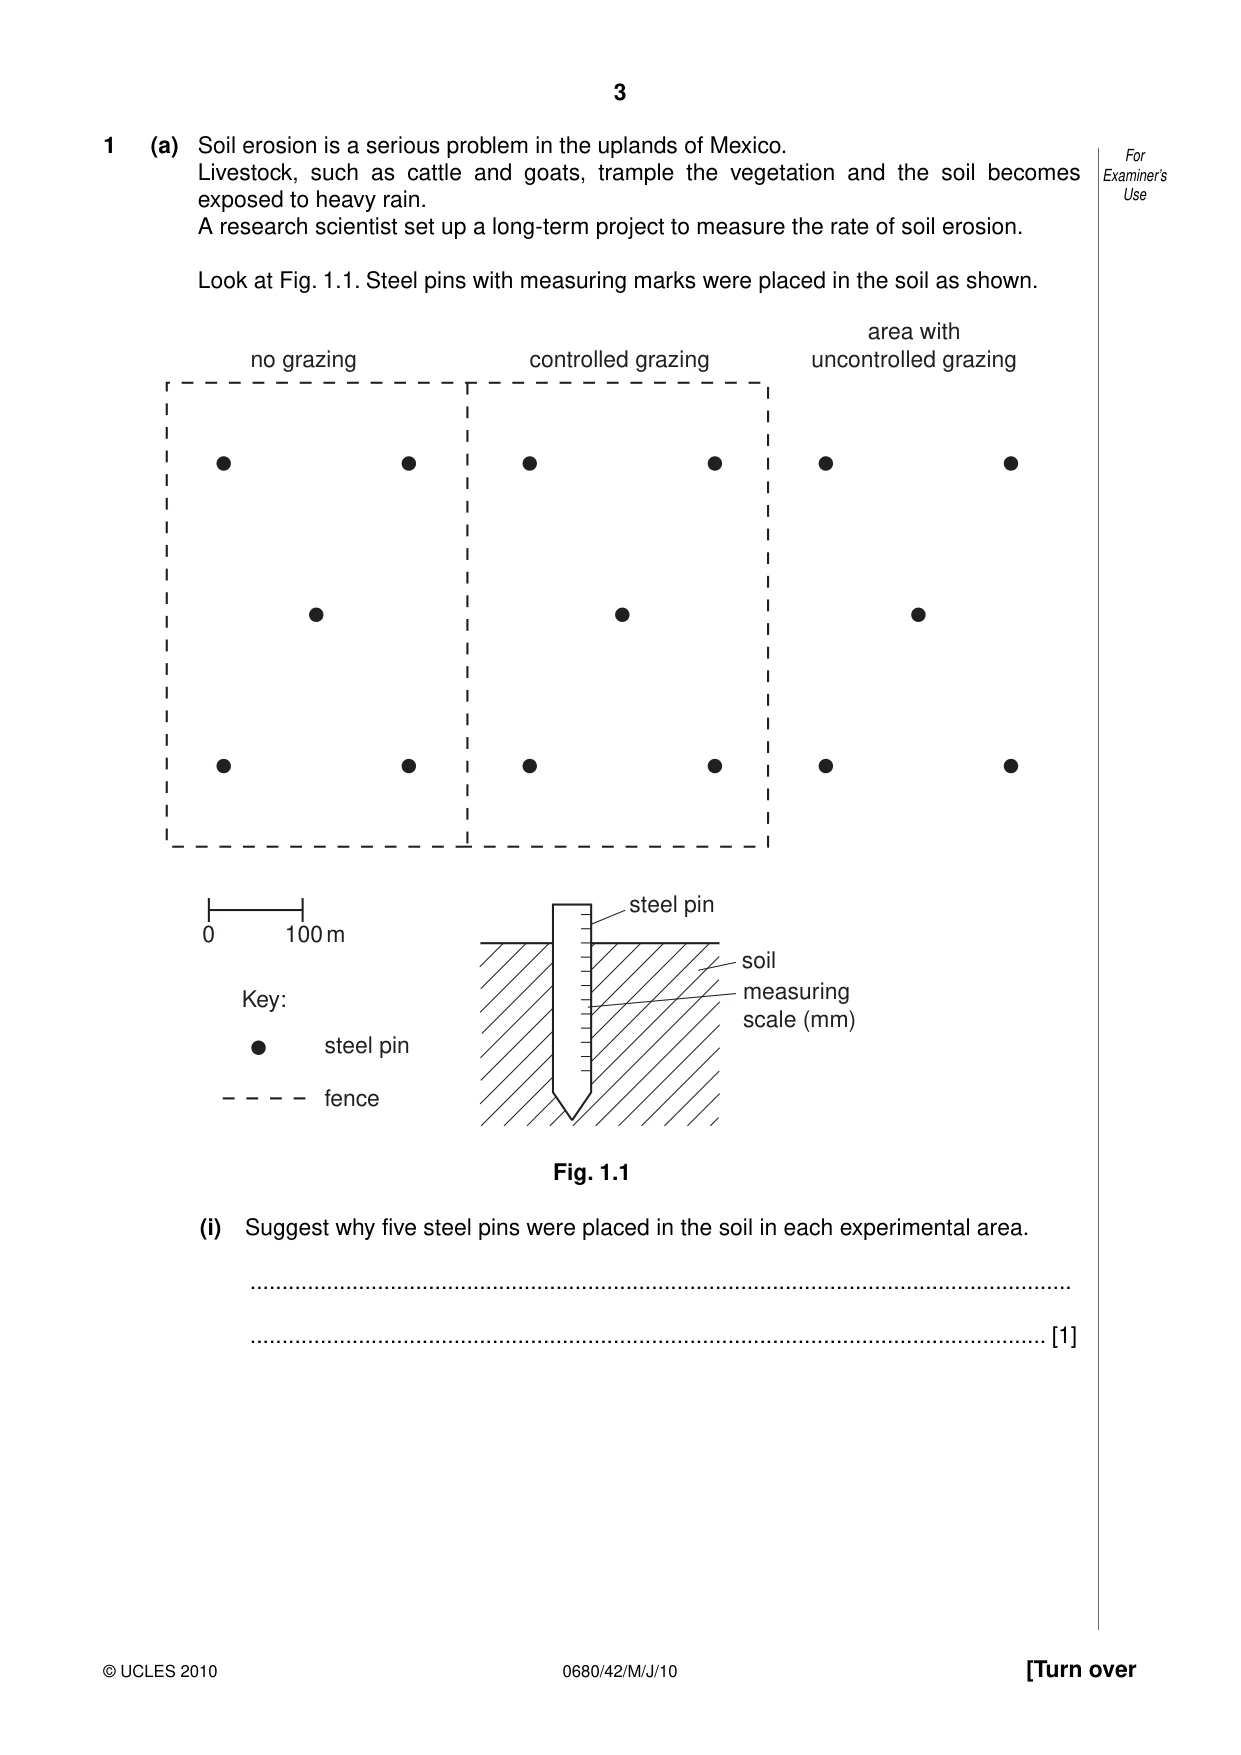
3 0680/42/M/J/10 © UCLES 2010 [Turn over For Examiner’s Use 1 (a) Soil erosion is a serious problem in the uplands of Mexico. Livestock, such as cattle and goats, trample the vegetation and the soil becomes exposed to heavy rain. A research scientist set up a long-term project to measure the rate of soil erosion. Look at Fig. 1.1. Steel pins with measuring marks were placed in the soil as shown. 0 100 m no grazing controlled grazing area with uncontrolled grazing steel pin Key: fence steel pin soil measuring scale (mm) Fig. 1.1 (i) Suggest why five steel pins were placed in the soil in each experimental area. … … [1]
Question paper, page 4
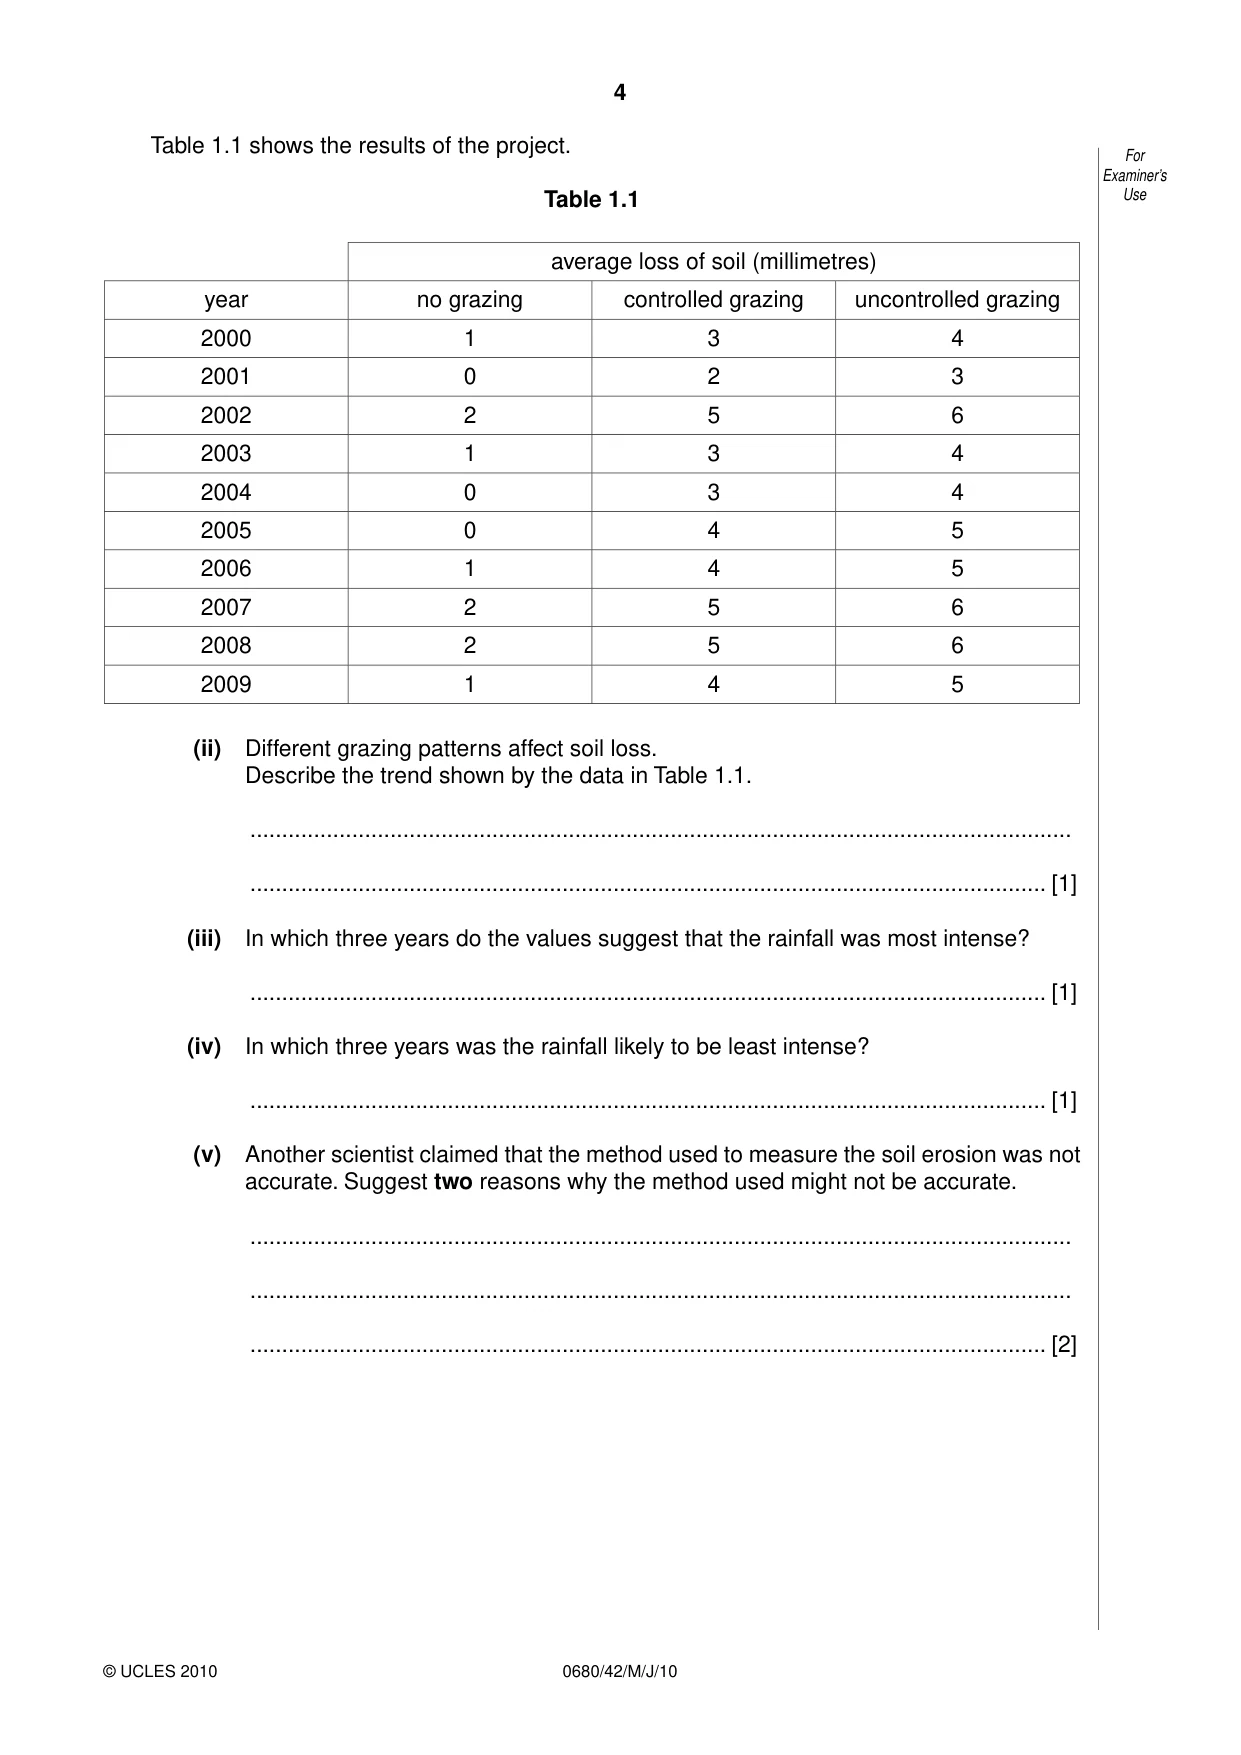
4 0680/42/M/J/10 © UCLES 2010 For Examiner’s Use Table 1.1 shows the results of the project. Table 1.1 average loss of soil (millimetres) year no grazing controlled grazing uncontrolled grazing 2000 1 3 4 2001 0 2 3 2002 2 5 6 2003 1 3 4 2004 0 3 4 2005 0 4 5 2006 1 4 5 2007 2 5 6 2008 2 5 6 2009 1 4 5 (ii) Different grazing patterns affect soil loss. Describe the trend shown by the data in Table 1.1. … … [1] (iii) In which three years do the values suggest that the rainfall was most intense? … [1] (iv) In which three years was the rainfall likely to be least intense? … [1] (v) Another scientist claimed that the method used to measure the soil erosion was not accurate. Suggest two reasons why the method used might not be accurate. … … … [2]
Question paper, page 5
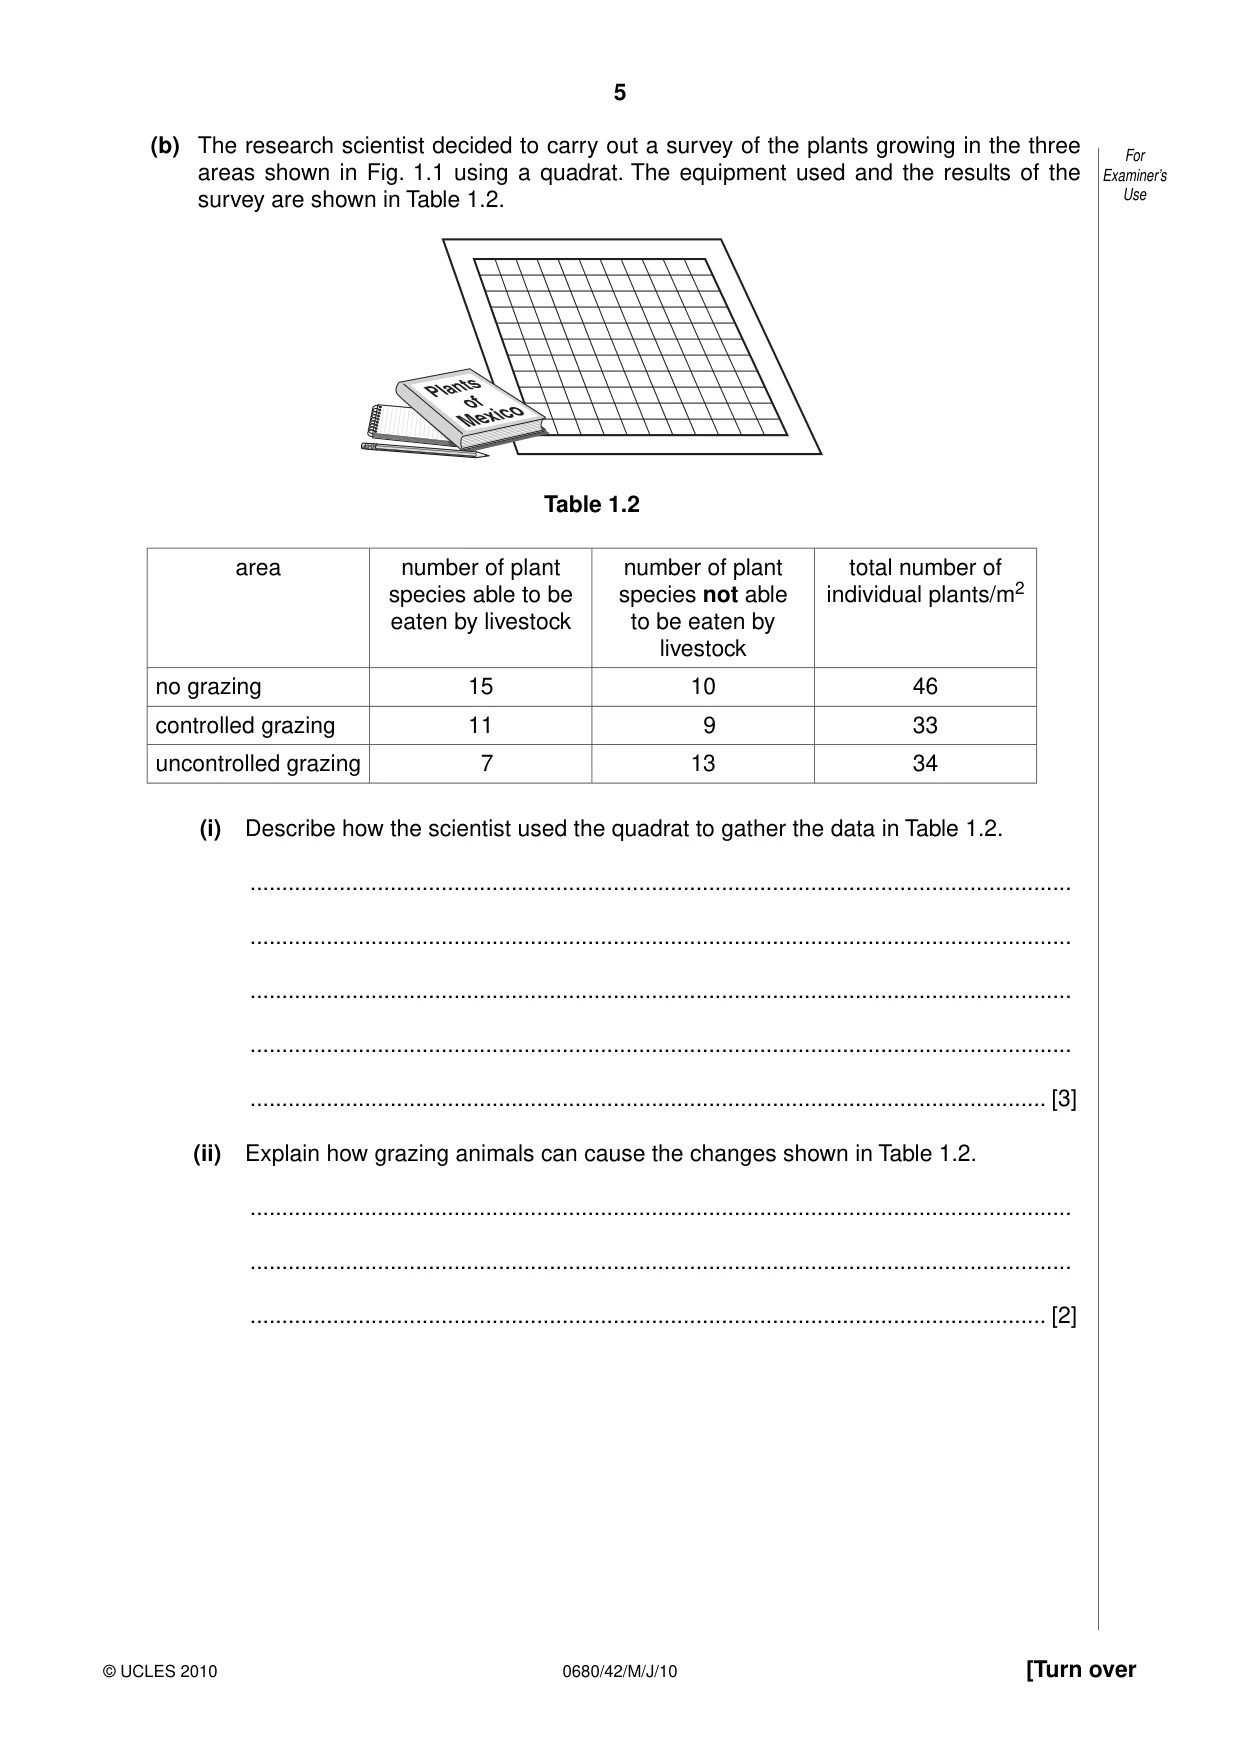
5 0680/42/M/J/10 © UCLES 2010 [Turn over For Examiner’s Use (b) The research scientist decided to carry out a survey of the plants growing in the three areas shown in Fig. 1.1 using a quadrat. The equipment used and the results of the survey are shown in Table 1.2. Table 1.2 area number of plant species able to be eaten by livestock number of plant species not able to be eaten by livestock total number of individual plants/m2 no grazing 15 10 46 controlled grazing 11 9 33 uncontrolled grazing 7 13 34 (i) Describe how the scientist used the quadrat to gather the data in Table 1.2. … … … … … [3] (ii) Explain how grazing animals can cause the changes shown in Table 1.2. … … … [2]
Question paper, page 6
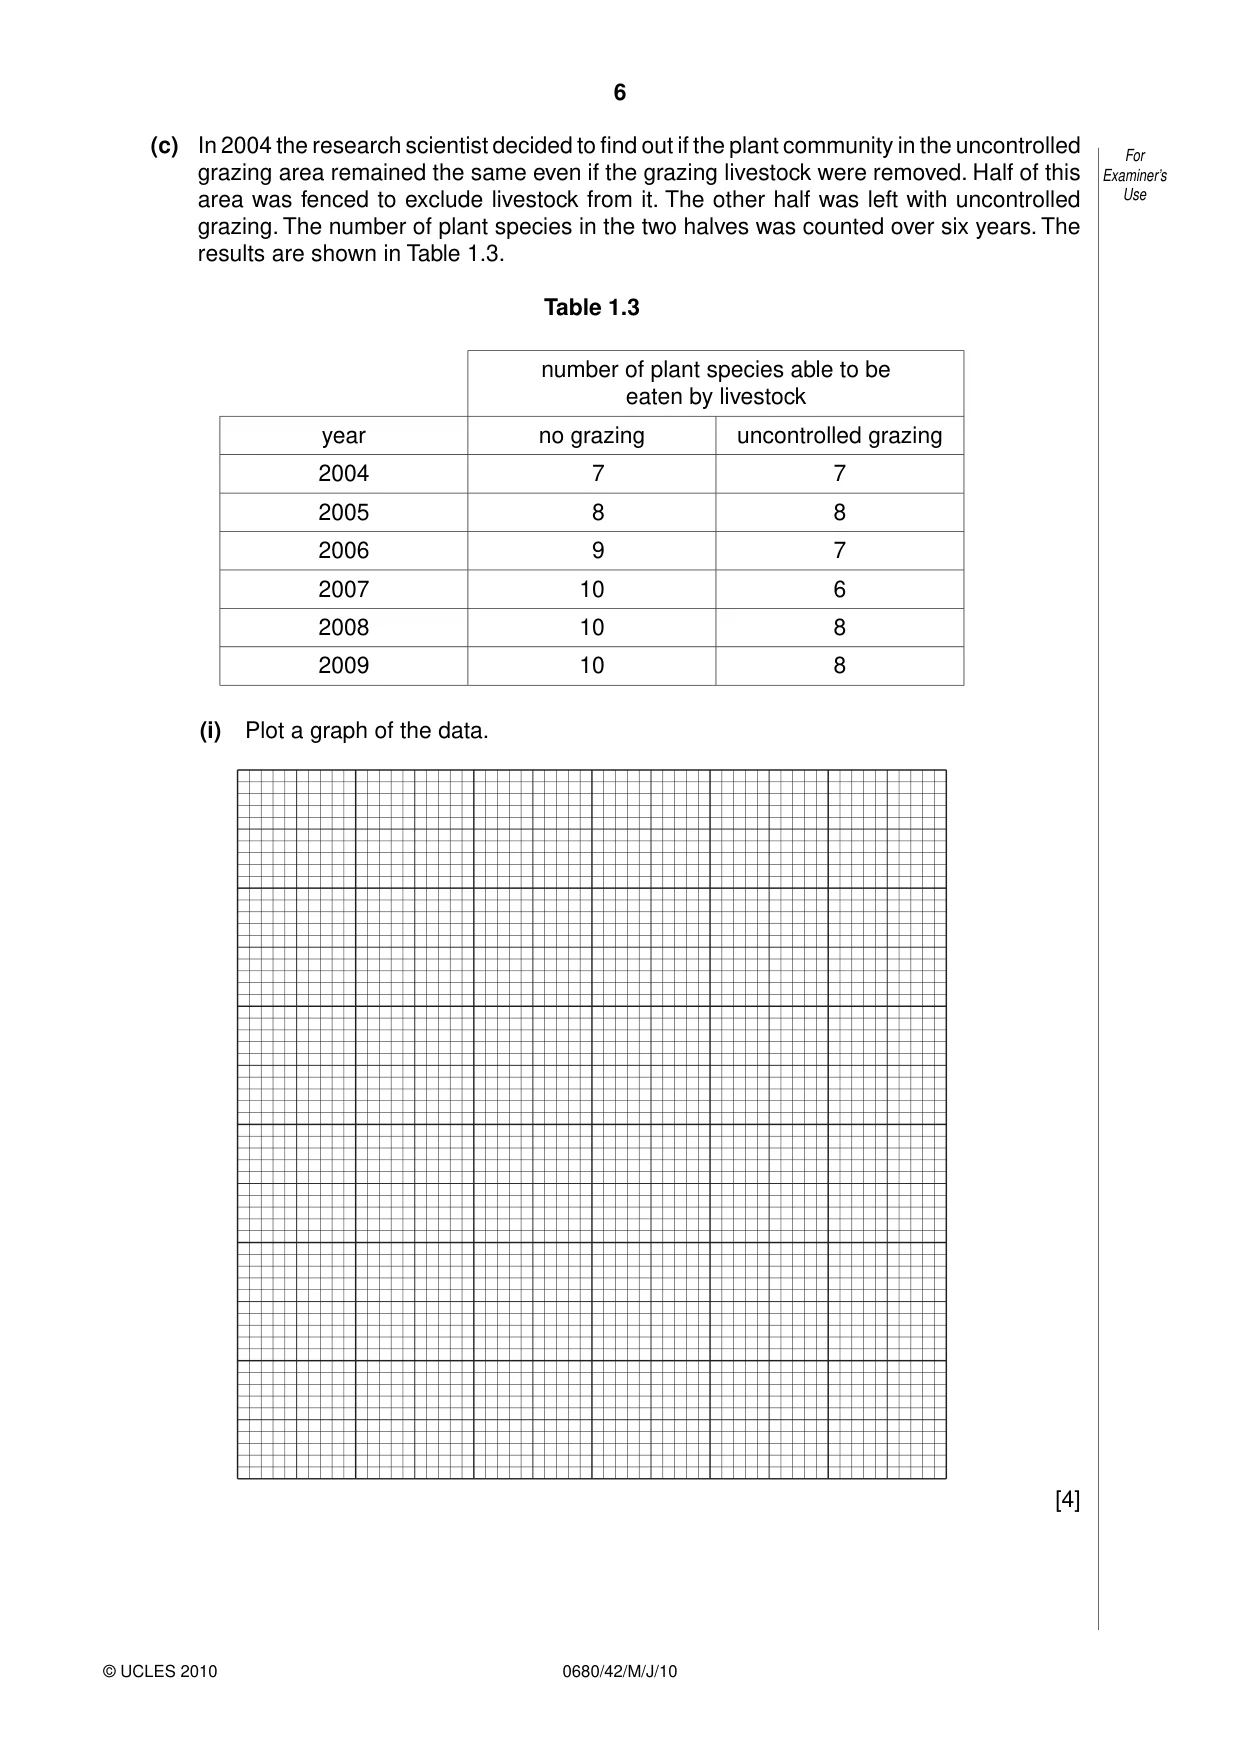
6 0680/42/M/J/10 © UCLES 2010 For Examiner’s Use (c) In 2004 the research scientist decided to find out if the plant community in the uncontrolled grazing area remained the same even if the grazing livestock were removed. Half of this area was fenced to exclude livestock from it. The other half was left with uncontrolled grazing. The number of plant species in the two halves was counted over six years. The results are shown in Table 1.3. Table 1.3 number of plant species able to be eaten by livestock year no grazing uncontrolled grazing 2004 7 7 2005 8 8 2006 9 7 2007 10 6 2008 10 8 2009 10 8 (i) Plot a graph of the data. [4]
Question paper, page 7
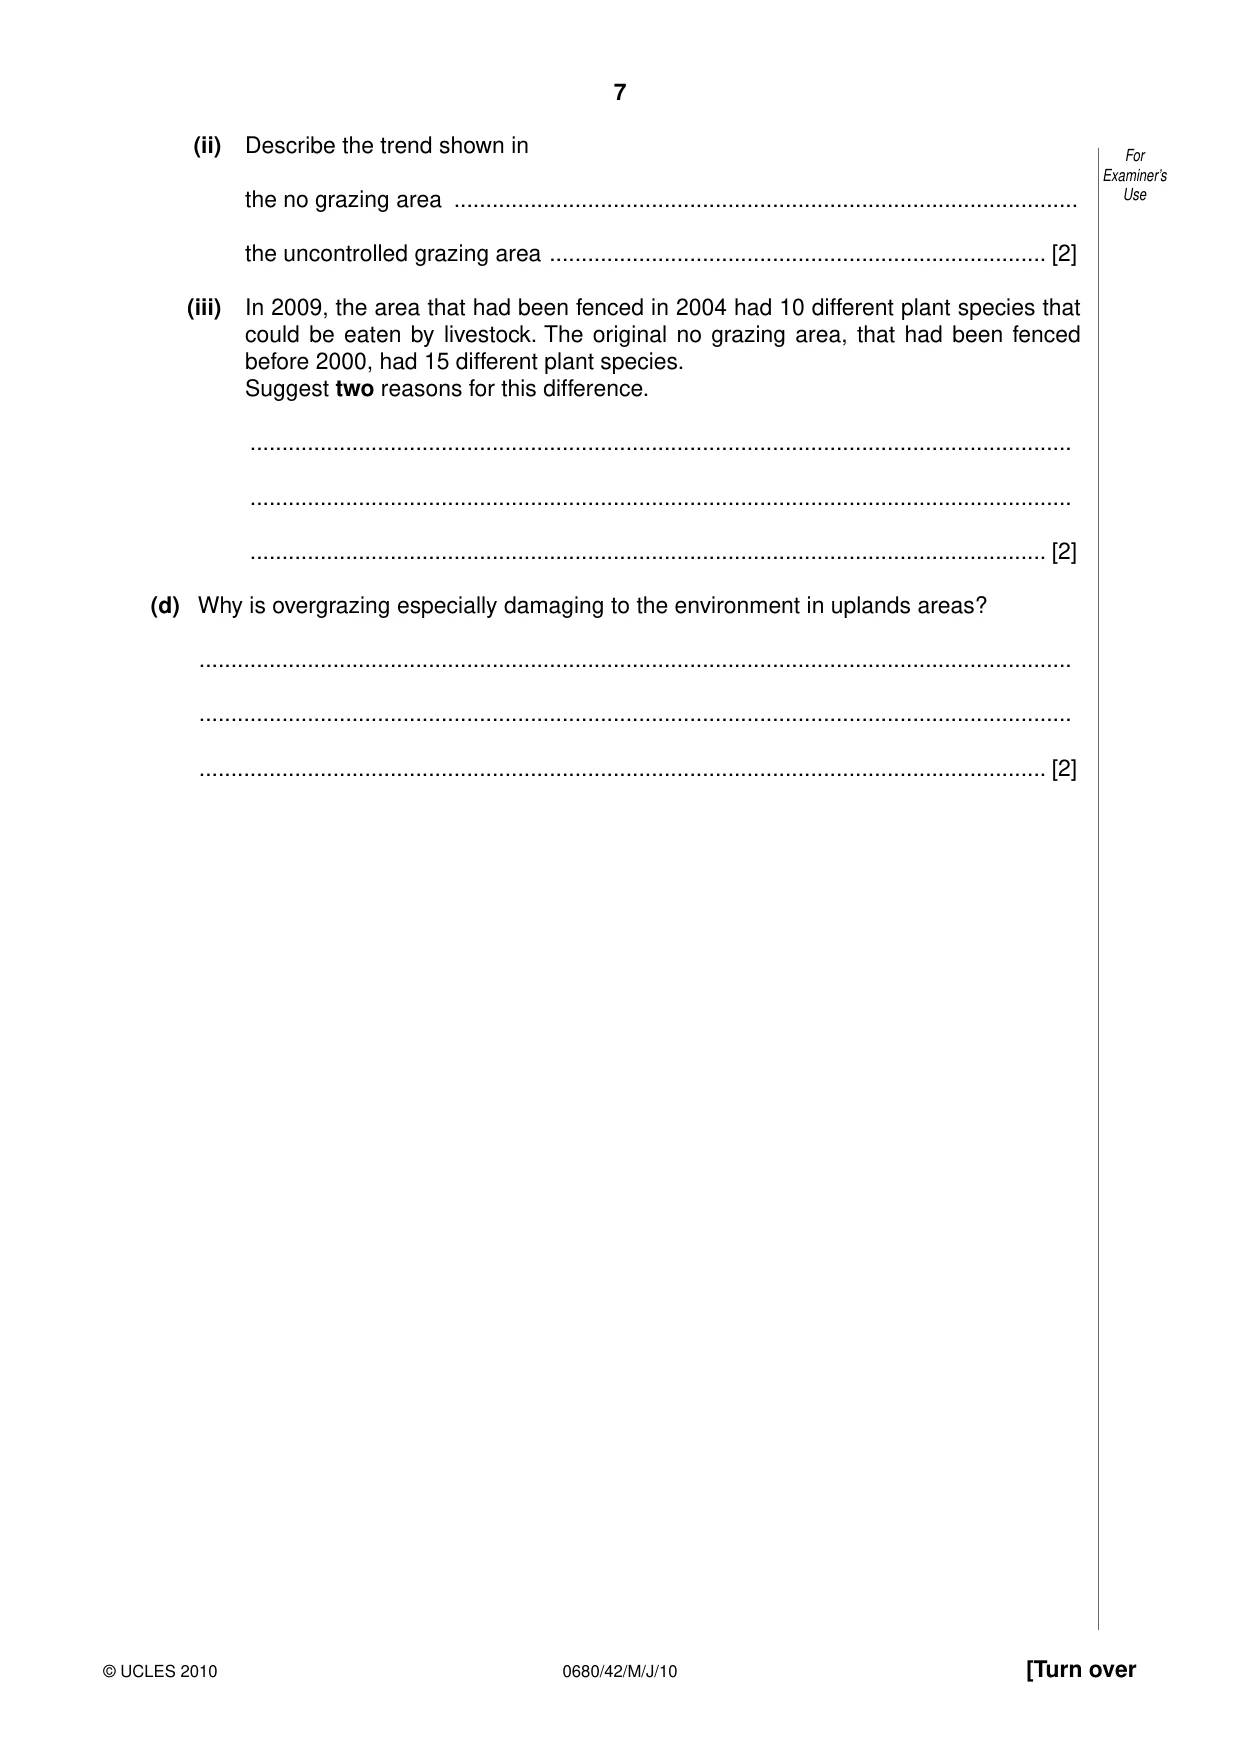
7 0680/42/M/J/10 © UCLES 2010 [Turn over For Examiner’s Use (ii) Describe the trend shown in the no grazing area … the uncontrolled grazing area … [2] (iii) In 2009, the area that had been fenced in 2004 had 10 different plant species that could be eaten by livestock. The original no grazing area, that had been fenced before 2000, had 15 different plant species. Suggest two reasons for this difference. … … … [2] (d) Why is overgrazing especially damaging to the environment in uplands areas? … … … [2]
Question paper, page 8
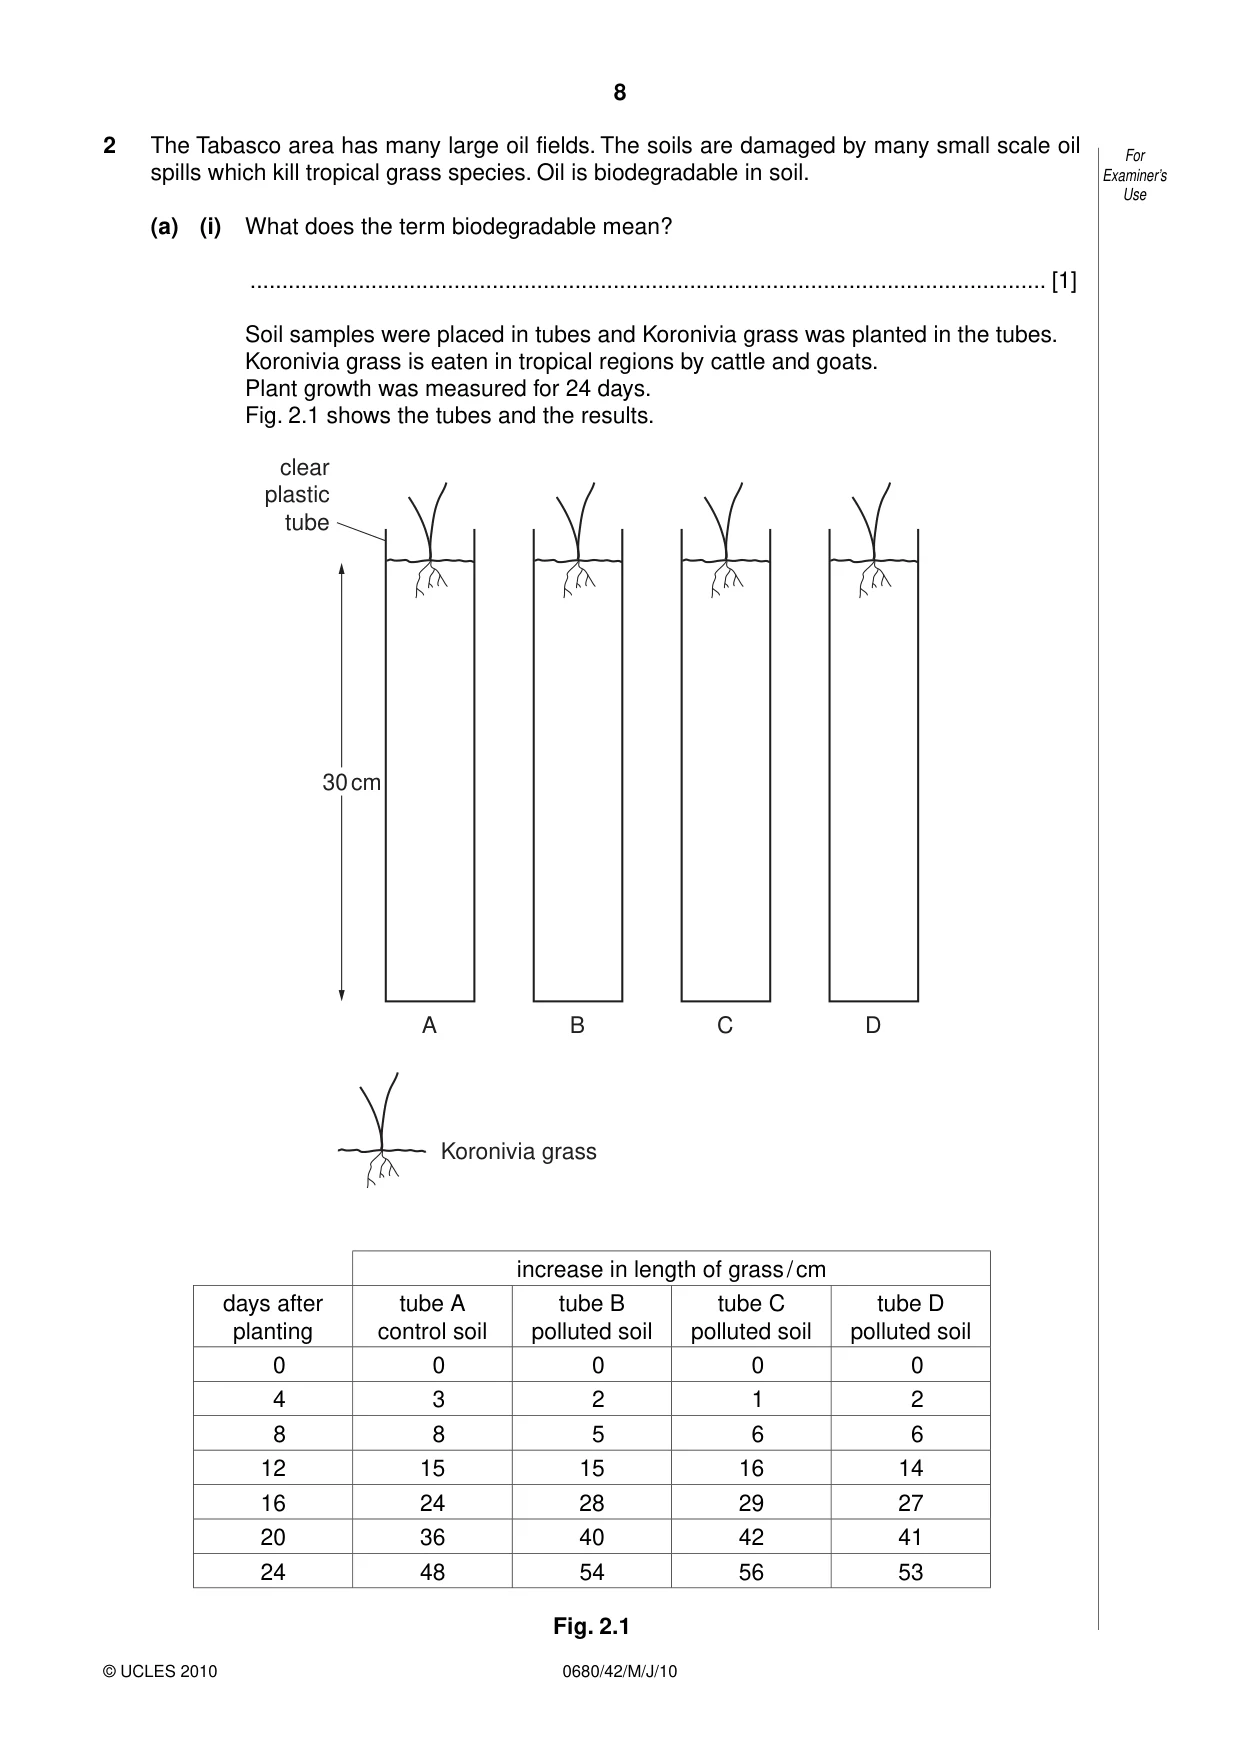
8 0680/42/M/J/10 © UCLES 2010 For Examiner’s Use 2 The Tabasco area has many large oil fields. The soils are damaged by many small scale oil spills which kill tropical grass species. Oil is biodegradable in soil. (a) (i) What does the term biodegradable mean? … [1] Soil samples were placed in tubes and Koronivia grass was planted in the tubes. Koronivia grass is eaten in tropical regions by cattle and goats. Plant growth was measured for 24 days. Fig. 2.1 shows the tubes and the results. 30 cm clear plastic tube A Koronivia grass B C D increase in length of grass / cm days after planting tube A control soil tube B polluted soil tube C polluted soil tube D polluted soil 0 0 0 0 0 4 3 2 1 2 8 8 5 6 6 12 15 15 16 14 16 24 28 29 27 20 36 40 42 41 24 48 54 56 53 Fig. 2.1
Question paper, page 9
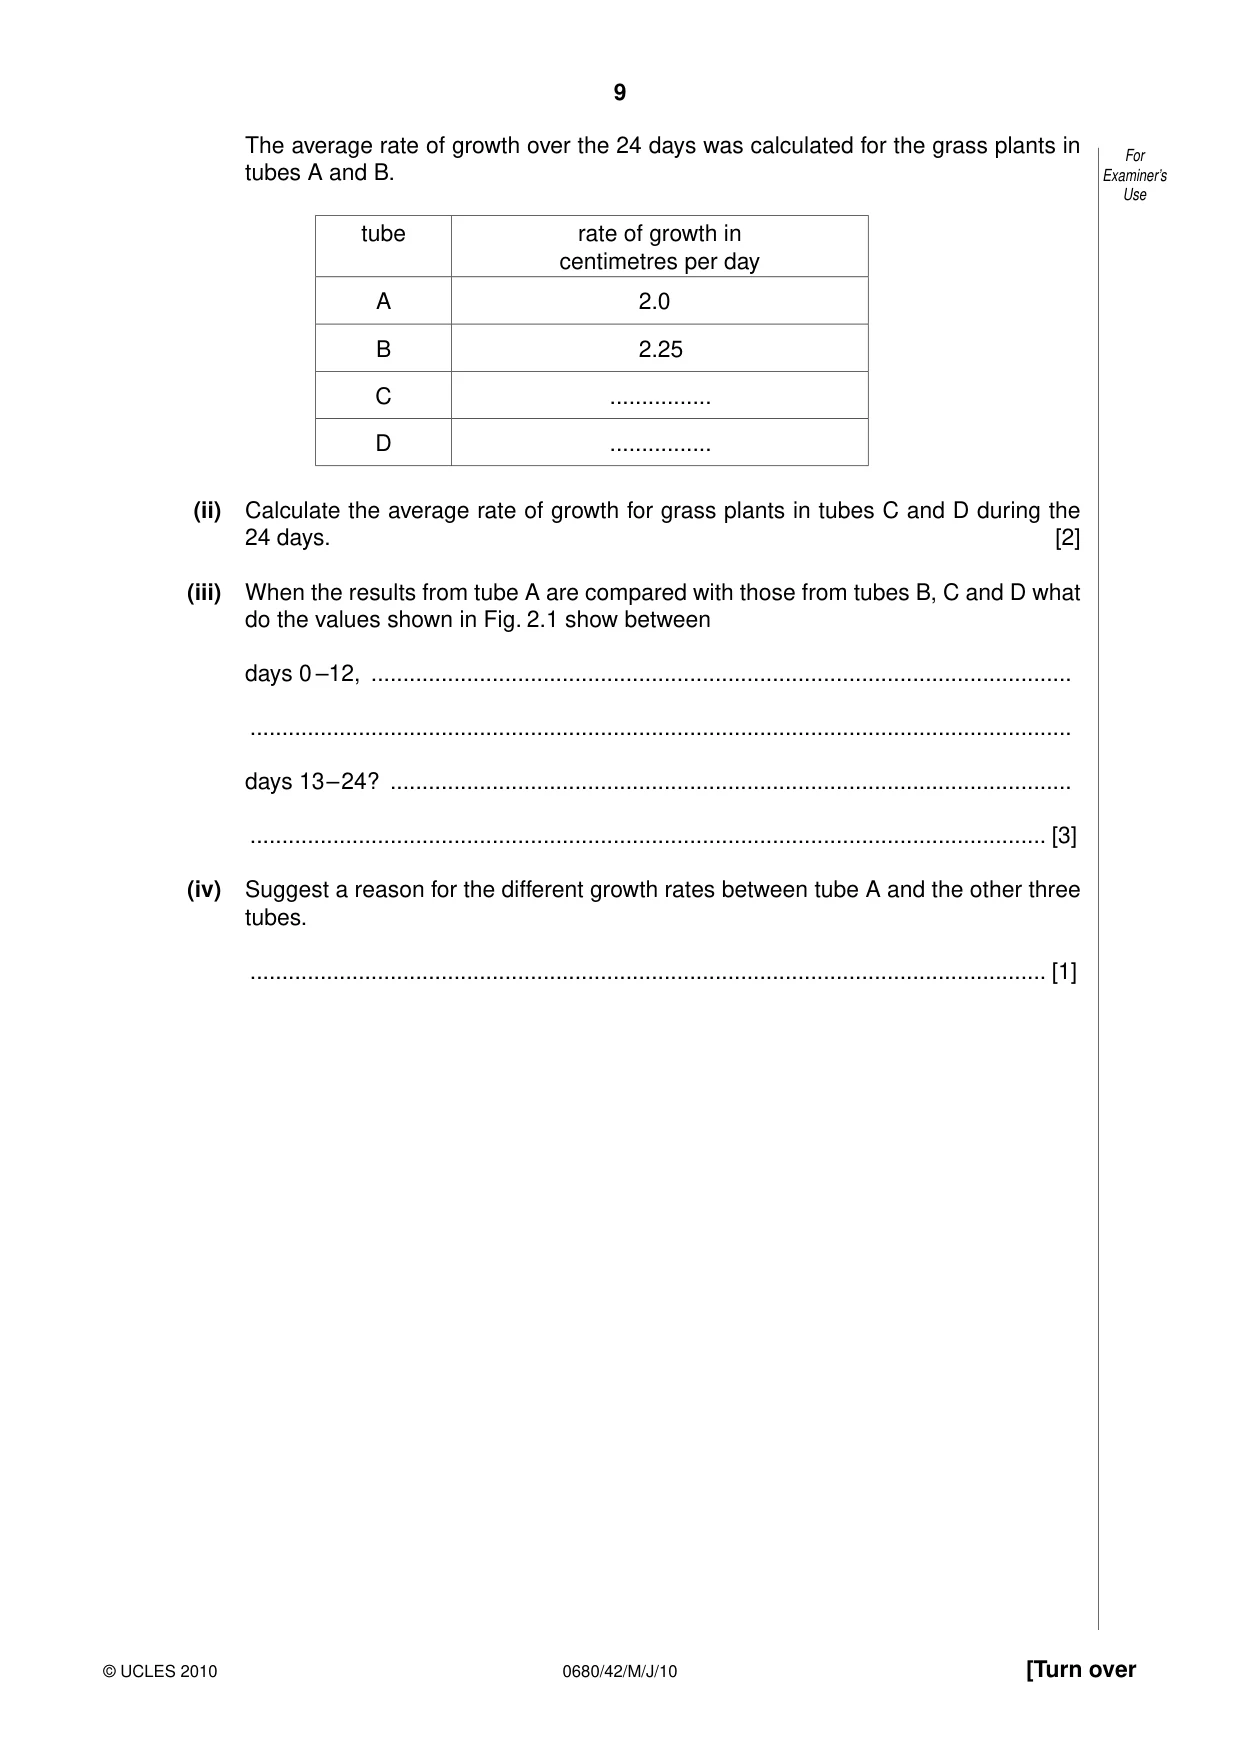
9 0680/42/M/J/10 © UCLES 2010 [Turn over For Examiner’s Use The average rate of growth over the 24 days was calculated for the grass plants in tubes A and B. tube rate of growth in centimetres per day A 2.0 B 2.25 C … D … (ii) Calculate the average rate of growth for grass plants in tubes C and D during the 24 days. [2] (iii) When the results from tube A are compared with those from tubes B, C and D what do the values shown in Fig. 2.1 show between days 0 –12, … … days 13 – 24? … … [3] (iv) Suggest a reason for the different growth rates between tube A and the other three tubes. … [1]
Question paper, page 10
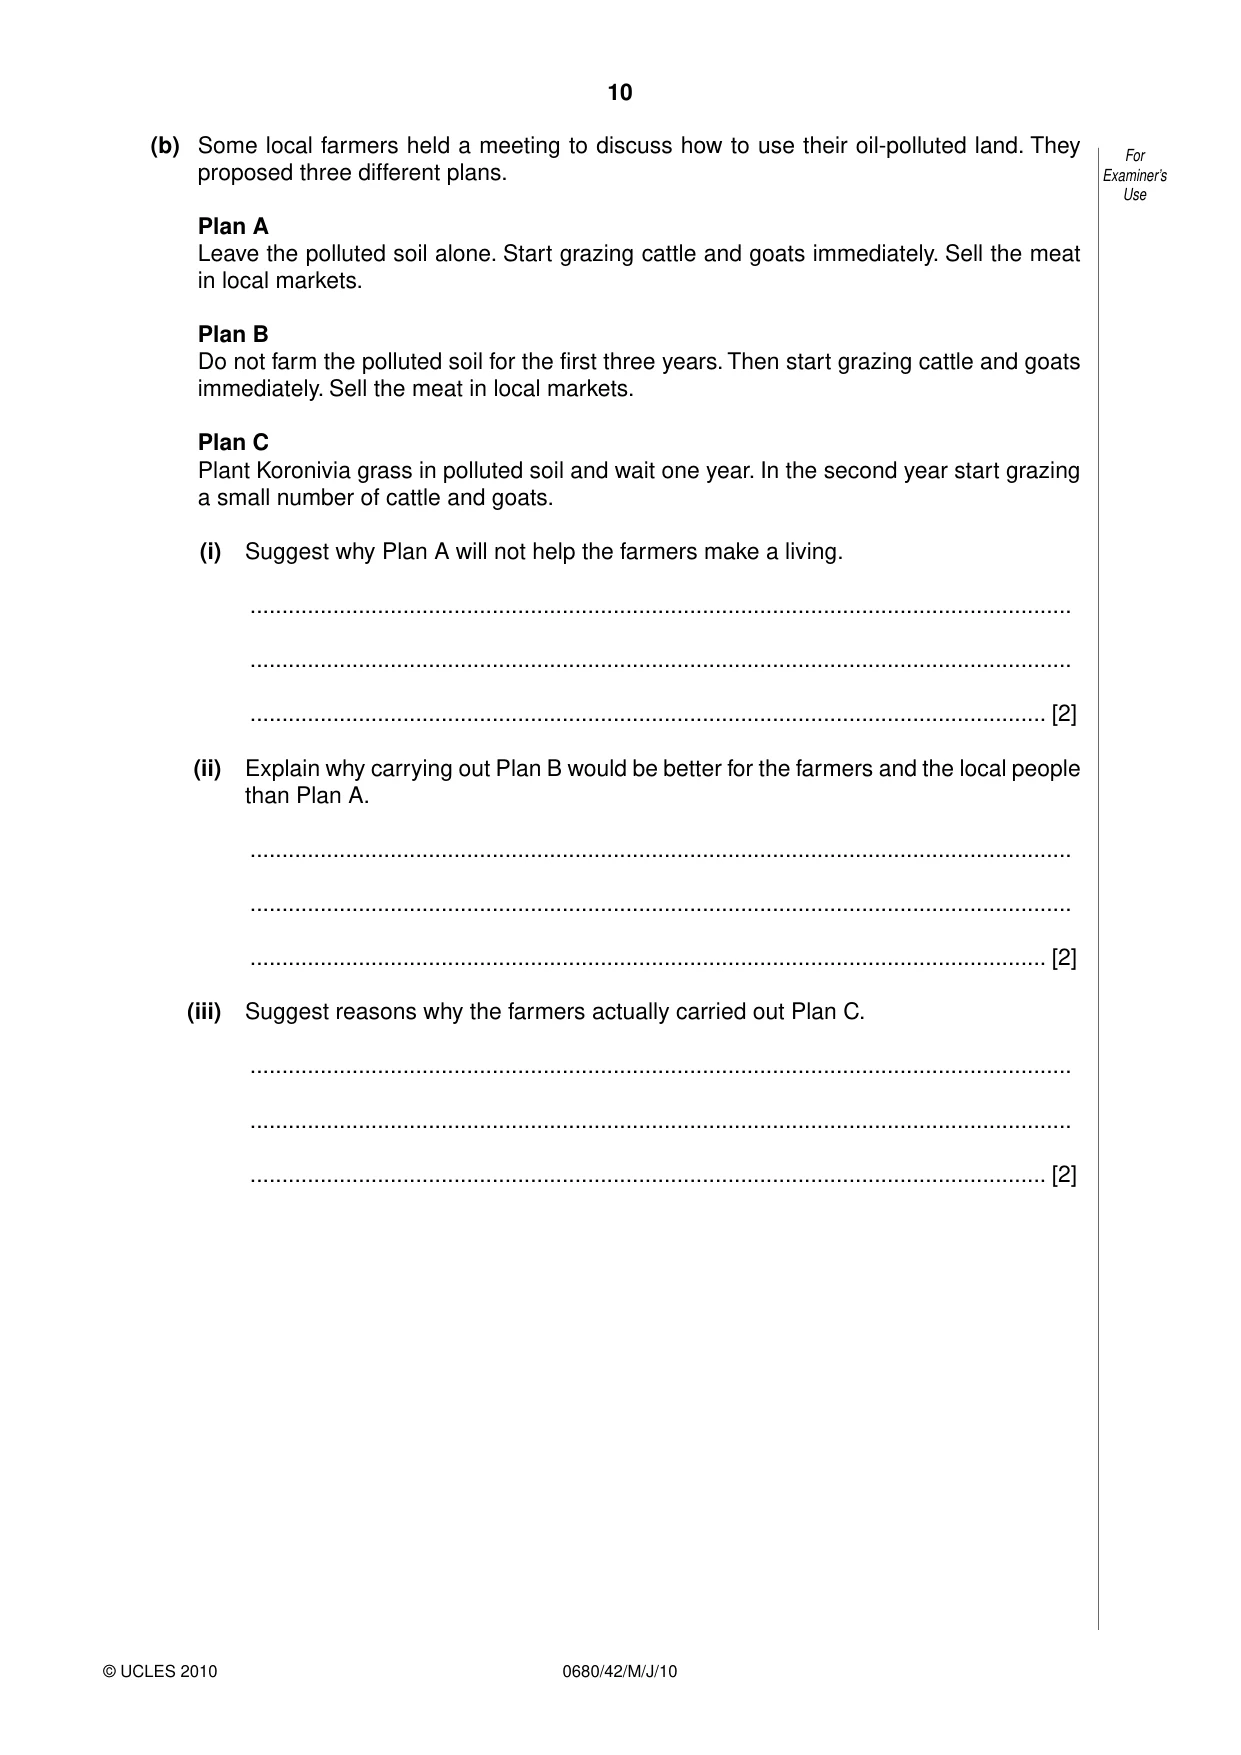
10 0680/42/M/J/10 © UCLES 2010 For Examiner’s Use (b) Some local farmers held a meeting to discuss how to use their oil-polluted land. They proposed three different plans. Plan A Leave the polluted soil alone. Start grazing cattle and goats immediately. Sell the meat in local markets. Plan B Do not farm the polluted soil for the first three years. Then start grazing cattle and goats immediately. Sell the meat in local markets. Plan C Plant Koronivia grass in polluted soil and wait one year. In the second year start grazing a small number of cattle and goats. (i) Suggest why Plan A will not help the farmers make a living. … … … [2] (ii) Explain why carrying out Plan B would be better for the farmers and the local people than Plan A. … … … [2] (iii) Suggest reasons why the farmers actually carried out Plan C. … … … [2]
Question paper, page 11
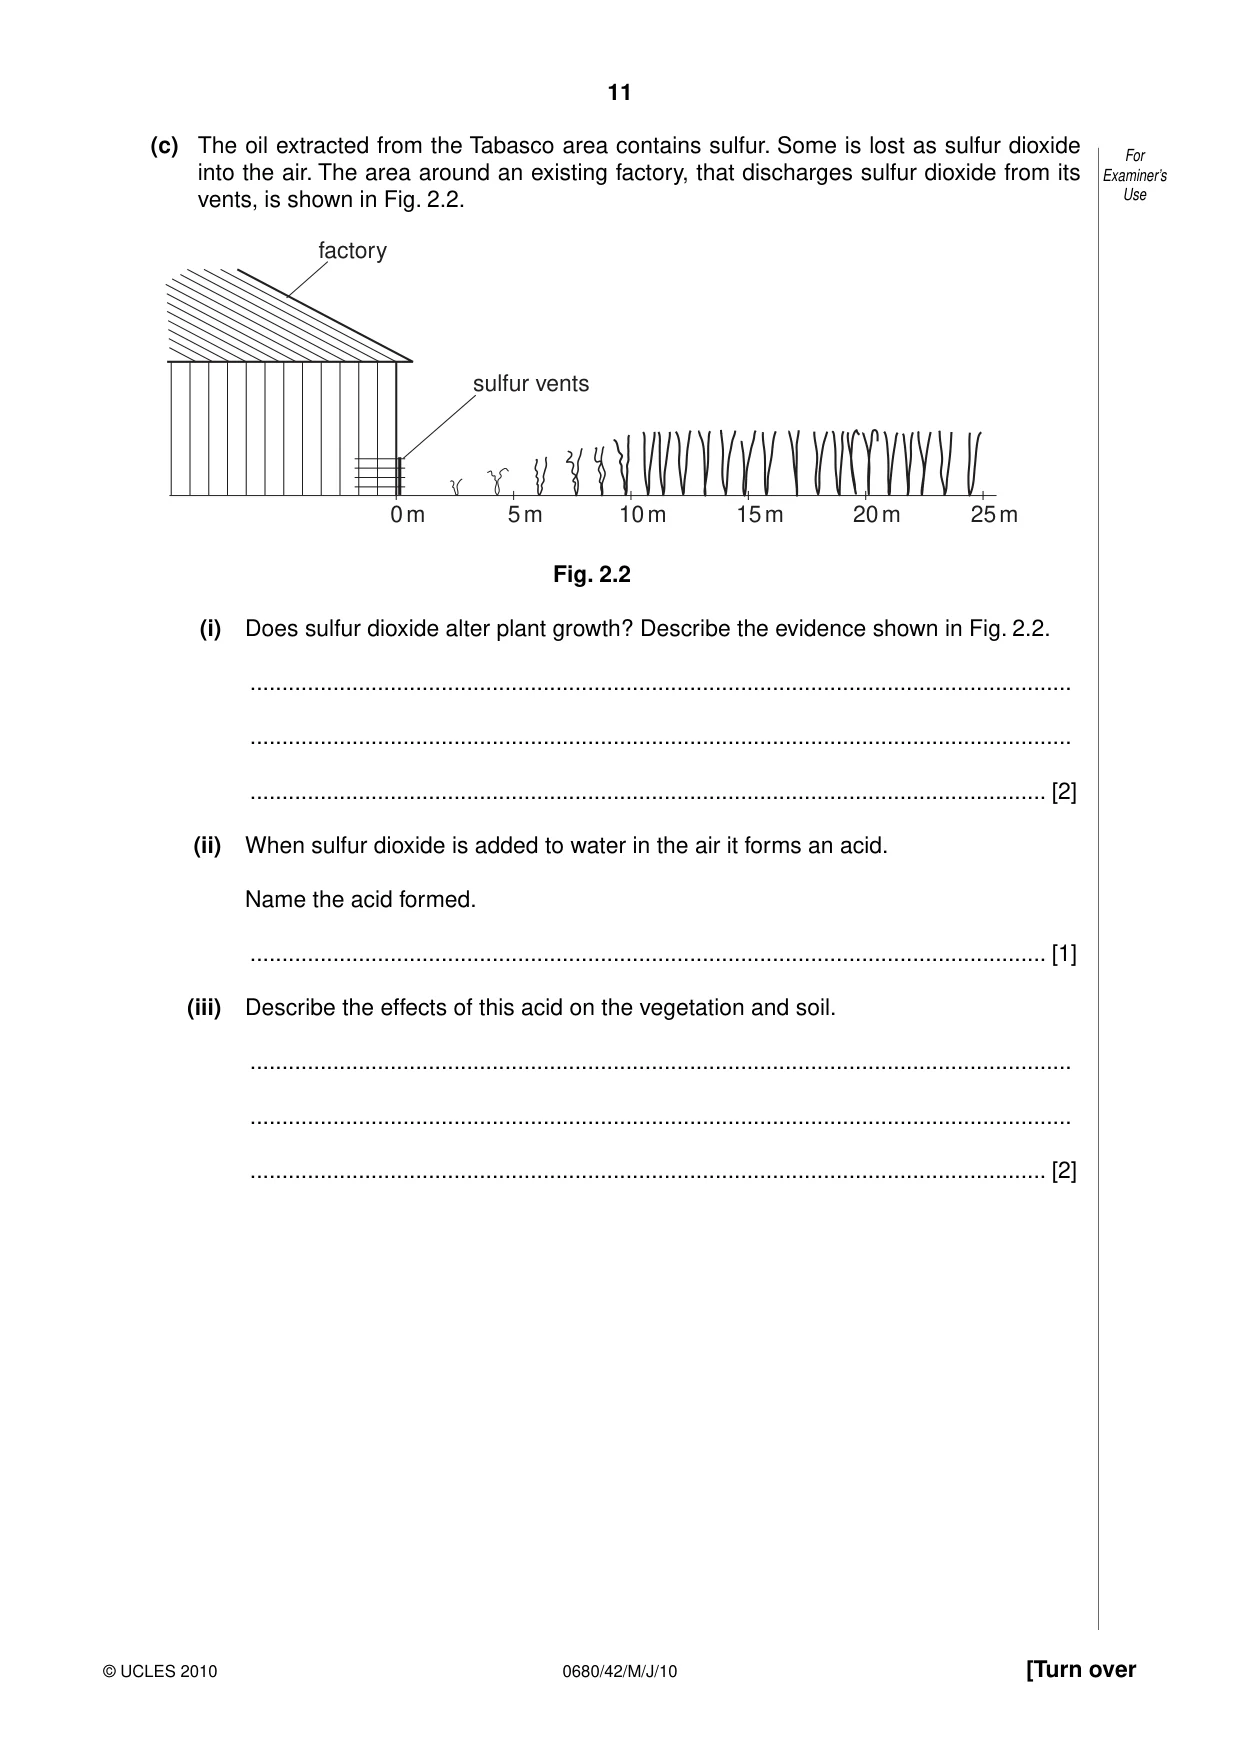
11 0680/42/M/J/10 © UCLES 2010 [Turn over For Examiner’s Use (c) The oil extracted from the Tabasco area contains sulfur. Some is lost as sulfur dioxide into the air. The area around an existing factory, that discharges sulfur dioxide from its vents, is shown in Fig. 2.2. 0 m 5 m 10 m 15 m 20 m 25 m sulfur vents factory Fig. 2.2 (i) Does sulfur dioxide alter plant growth? Describe the evidence shown in Fig. 2.2. … … … [2] (ii) When sulfur dioxide is added to water in the air it forms an acid. Name the acid formed. … [1] (iii) Describe the effects of this acid on the vegetation and soil. … … … [2]
Question paper, page 12
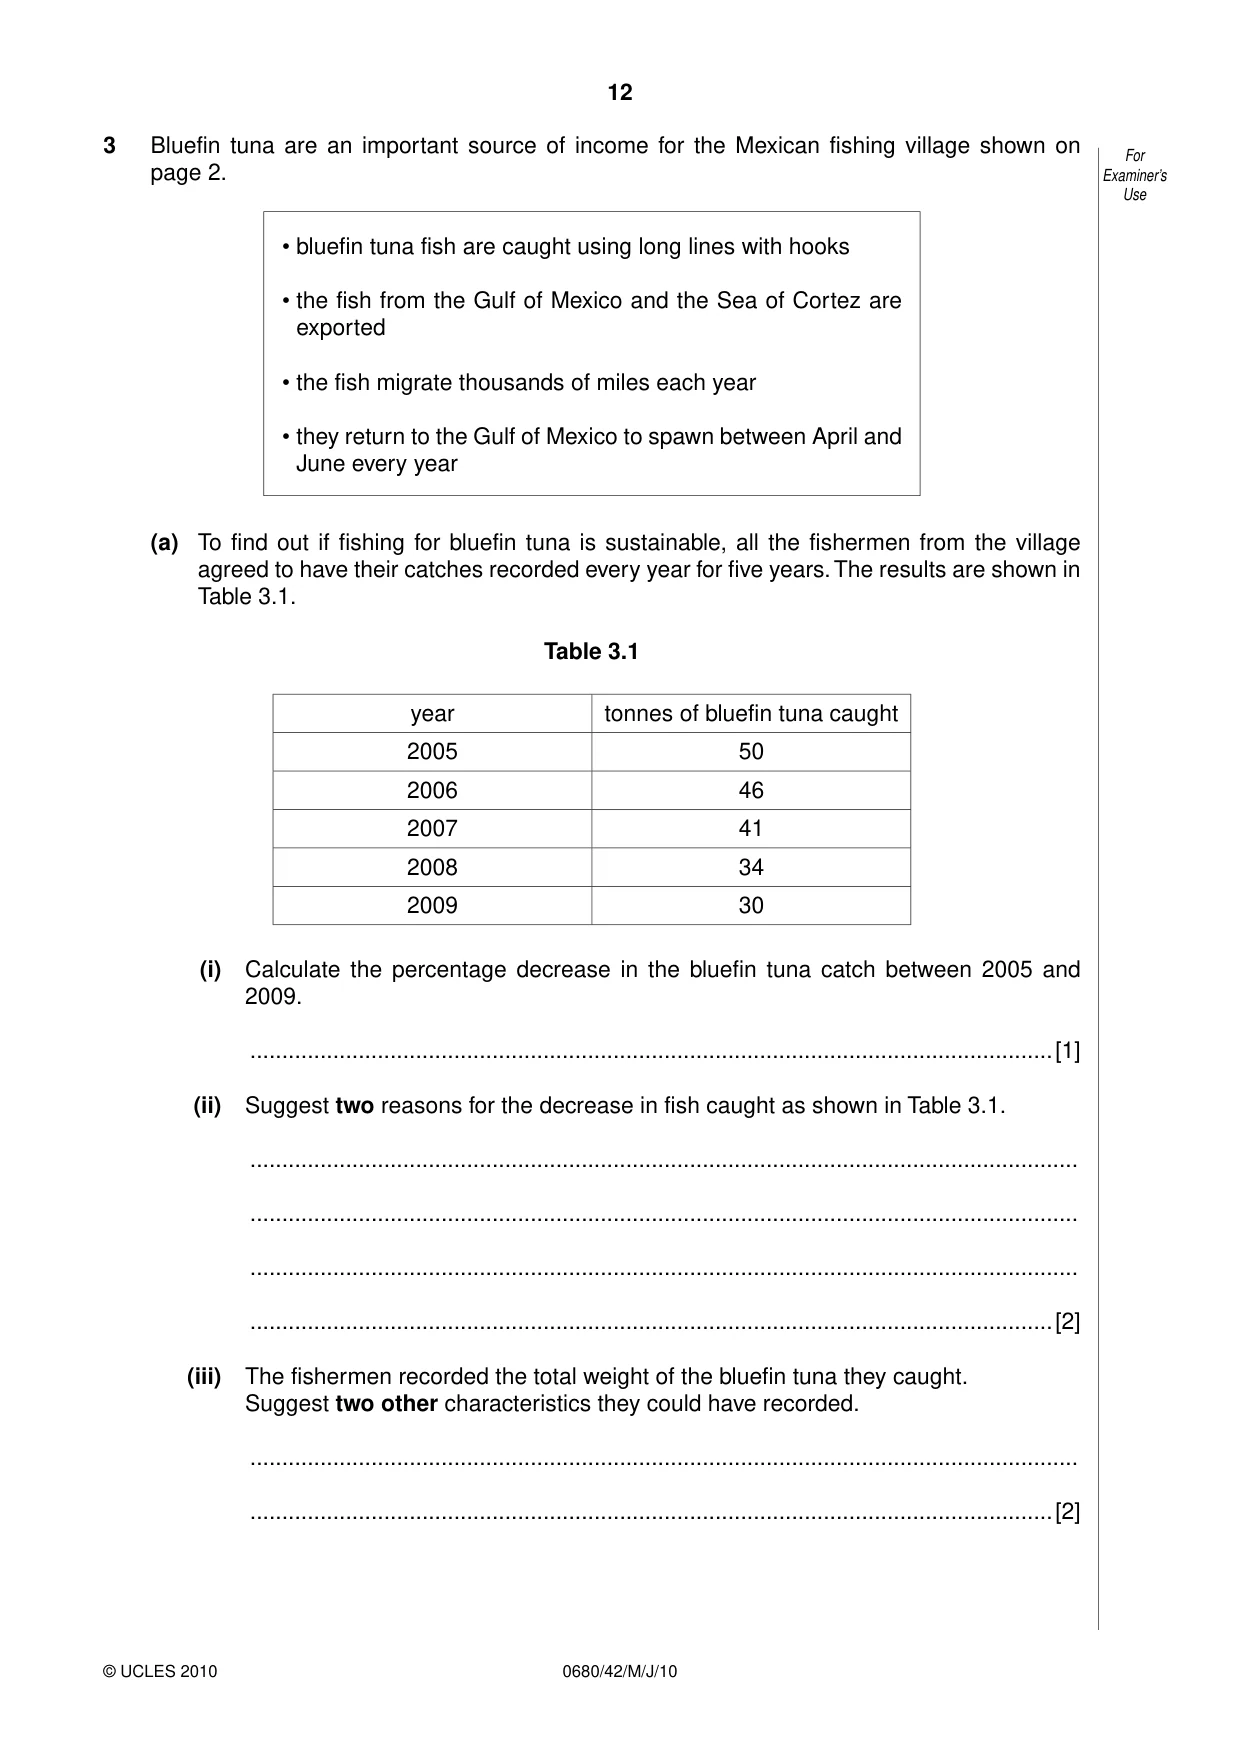
12 0680/42/M/J/10 © UCLES 2010 For Examiner’s Use 3 Bluefin tuna are an important source of income for the Mexican fishing village shown on page 2. • bluefin tuna fish are caught using long lines with hooks • the fish from the Gulf of Mexico and the Sea of Cortez are exported • the fish migrate thousands of miles each year • they return to the Gulf of Mexico to spawn between April and June every year (a) To find out if fishing for bluefin tuna is sustainable, all the fishermen from the village agreed to have their catches recorded every year for five years. The results are shown in Table 3.1. Table 3.1 year tonnes of bluefin tuna caught 2005 50 2006 46 2007 41 2008 34 2009 30 (i) Calculate the percentage decrease in the bluefin tuna catch between 2005 and 2009. …[1] (ii) Suggest two reasons for the decrease in fish caught as shown in Table 3.1. … … … …[2] (iii) The fishermen recorded the total weight of the bluefin tuna they caught. Suggest two other characteristics they could have recorded. … …[2]
Question paper, page 13
13 0680/42/M/J/10 © UCLES 2010 [Turn over For Examiner’s Use (iv) Draw a table that could be used, for a period of one week, to record the weight of fish caught and the two other characteristics you have identified in part (iii). [3] (b) To find out more about fishing activities some students started writing a questionnaire to collect more information. Complete the questionnaire by adding three more questions. fishing questionnaire Q1 Which fish species do you catch? bluefin tuna yellowfin tuna marlin dorado Q2 How many years have you been fishing? 0–1 yr 2–5 yrs 6–10 yrs 11+ yrs Q3 … … Q4 … … Q5 … …[4]
Question paper, page 14
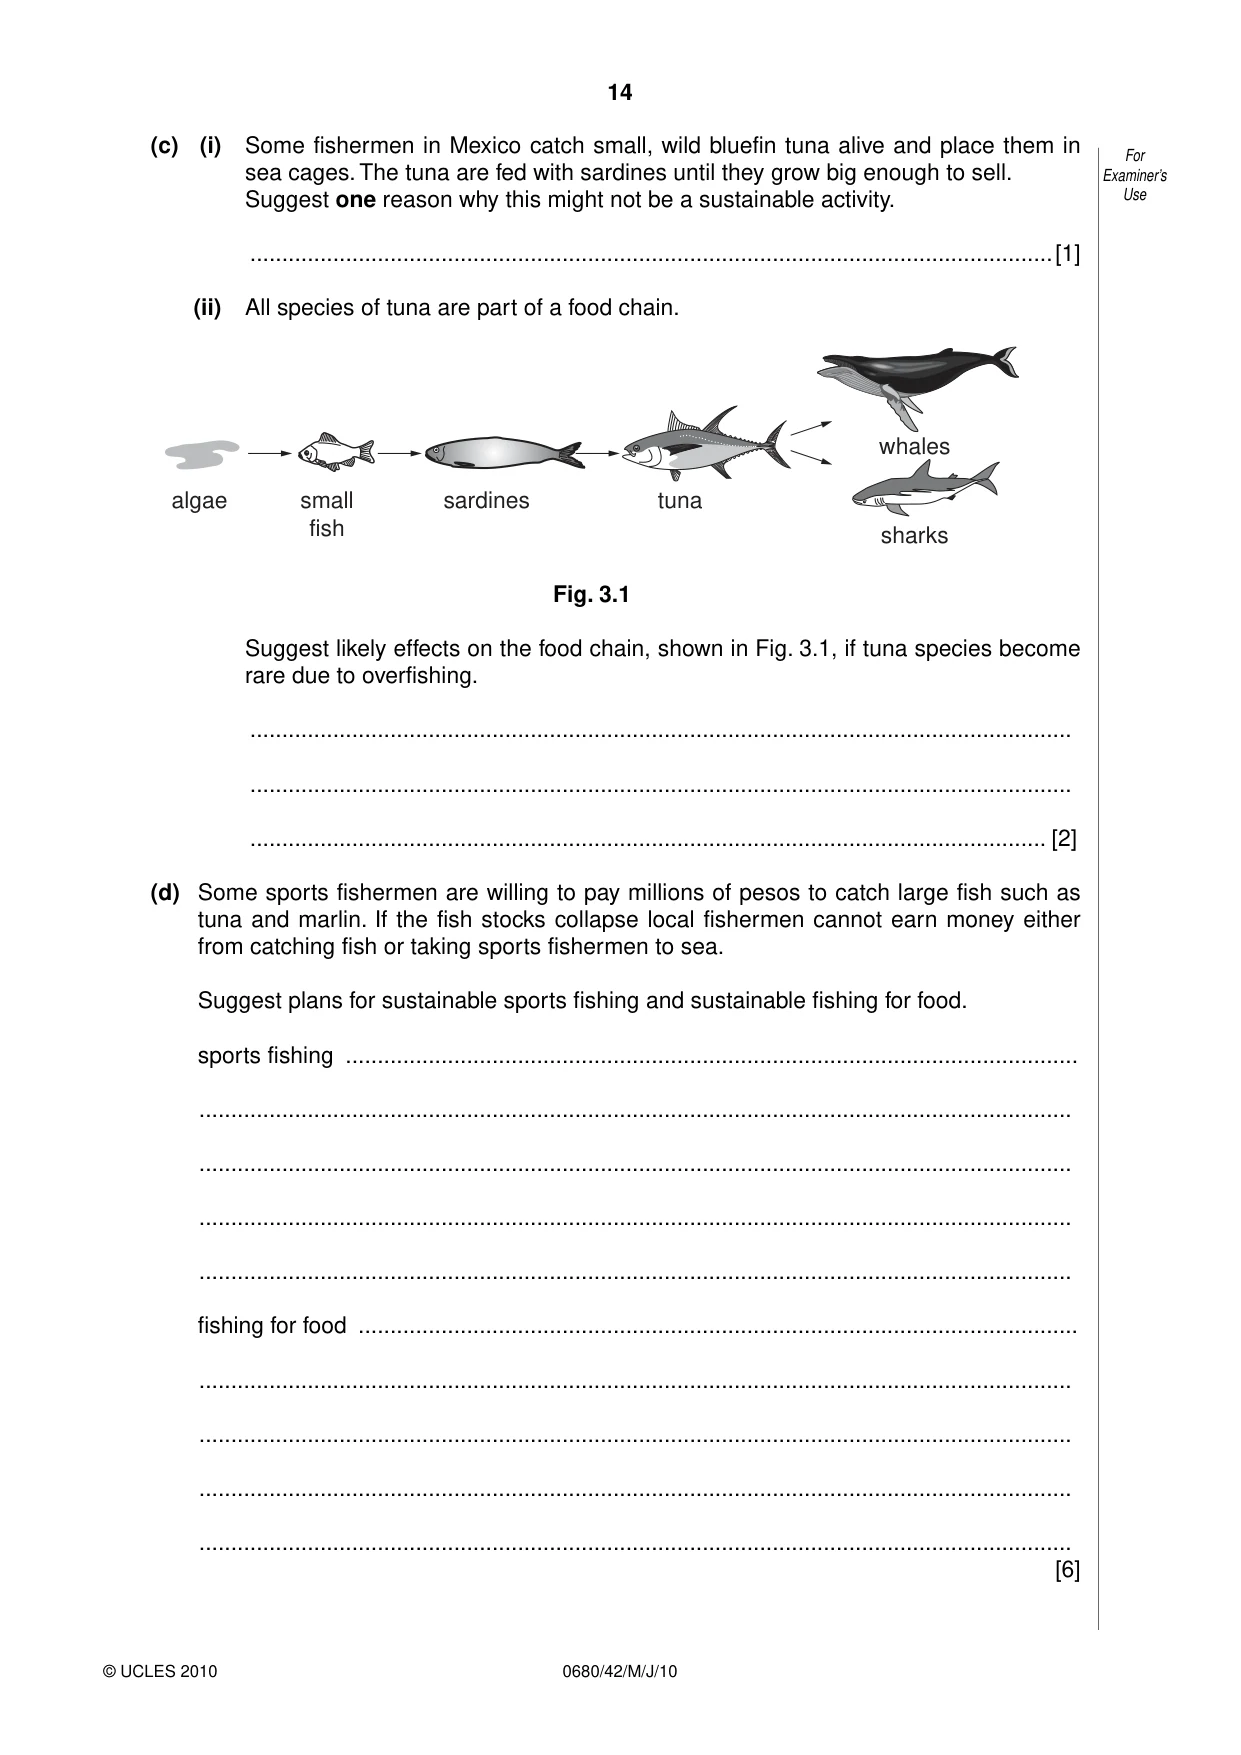
14 0680/42/M/J/10 © UCLES 2010 For Examiner’s Use (c) (i) Some fishermen in Mexico catch small, wild bluefin tuna alive and place them in sea cages. The tuna are fed with sardines until they grow big enough to sell. Suggest one reason why this might not be a sustainable activity. …[1] (ii) All species of tuna are part of a food chain. algae small fish sardines tuna whales sharks Fig. 3.1 Suggest likely effects on the food chain, shown in Fig. 3.1, if tuna species become rare due to overfishing. … … … [2] (d) Some sports fishermen are willing to pay millions of pesos to catch large fish such as tuna and marlin. If the fish stocks collapse local fishermen cannot earn money either from catching fish or taking sports fishermen to sea. Suggest plans for sustainable sports fishing and sustainable fishing for food. sports fishing … … … … … fishing for food … … … … … [6]
Question paper, page 15
15 0680/42/M/J/10 © UCLES 2010 BLANK PAGE
Question paper, page 16
16 0680/42/M/J/10 © UCLES 2010 BLANK PAGE Permission to reproduce items where third-party owned material protected by copyright is included has been sought and cleared where possible. Every reasonable effort has been made by the publisher (UCLES) to trace copyright holders, but if any items requiring clearance have unwittingly been included, the publisher will be pleased to make amends at the earliest possible opportunity. University of Cambridge International Examinations is part of the Cambridge Assessment Group. Cambridge Assessment is the brand name of University of Cambridge Local Examinations Syndicate (UCLES), which is itself a department of the University of Cambridge.
Mark scheme, page 1
UNIVERSITY OF CAMBRIDGE INTERNATIONAL EXAMINATIONS International General Certificate of Secondary Education MARK SCHEME for the May/June 2010 question paper for the guidance of teachers 0680 ENVIRONMENTAL MANAGEMENT 0680/42 Paper 42 (Alternative to Coursework), maximum raw mark 60 This mark scheme is published as an aid to teachers and candidates, to indicate the requirements of the examination. It shows the basis on which Examiners were instructed to award marks. It does not indicate the details of the discussions that took place at an Examiners’ meeting before marking began, which would have considered the acceptability of alternative answers. Mark schemes must be read in conjunction with the question papers and the report on the examination. • CIE will not enter into discussions or correspondence in connection with these mark schemes. CIE is publishing the mark schemes for the May/June 2010 question papers for most IGCSE, GCE Advanced Level and Advanced Subsidiary Level syllabuses and some Ordinary Level syllabuses. www.XtremePapers.com
Mark scheme, page 2
Page 2 Mark Scheme: Teachers’ version Syllabus Paper IGCSE – May/June 2010 0680 42 © UCLES 2010 1 (a) (i) to be able to find a mean/average; to make data more reliable/eq; reference to variability of data/eq; find range of data/eq; (ignore accurate/valid/fair/fair test) [1] (ii) increase in grazing = increase in soil erosion/eq; (ignore reference to years) [1] (iii) 2002, 2007, 2008; (more or less years =0) [1] (iv) 2001 (any two of 2000, 2003, 2004); [1] (v) rods moved/eq by animals; soil erosion; only 5 points measured; soil might be deposited after erosion; AVP; [2] (b) (i) description of a random or systematic method; further detail; at least 10 quadrats from each area; construct recording table/notebook; record/count/calculate total number of plants; identify species/name using books; (ignore reference to metres squared) [3] (ii) hooves/teeth damage some plants so they die/vegetation cover removed; plant growth cannot keep up with rate of grazing/eq; plants survive but cannot regenerate/reproduce/ flower/set seed; reference to root damage; reference to changes in numbers of palatable and unpalatable species; [2] (c) (i) orientation; both axes labelled (minimum is a reference to number, year); plot data from column one in table; plot data from column two in table; (allow one error per plot) [4] (ii) increase in species (until 2008), then a plateau/eq; species fluctuate/no increase or decrease/eq; (allow no trend ignore reference to plateau) [2] (iii) some plants cannot grow/species now extinct; seeds have not entered area yet; other species have taken their place; soil not now suitable for growth of some species; one area (2004) able to recover more; [2] (d) steep slopes encourage surface run-off/soil movement; cooler temperatures means slower plant growth; recovery of plant cover to slow; so limited interception/described; thin topsoil easily lost/more soil erosion; full recovery now not possible; loss of soil fertility/nutrients lost/reference to leeching; (mark the ideas not the exact wording) [2]
Mark scheme, page 3
Page 3 Mark Scheme: Teachers’ version Syllabus Paper IGCSE – May/June 2010 0680 42 © UCLES 2010 2 (a) (i) can be broken down/decomposed by living organisms/microbes/bacteria/enzyme action/ eq; [1] (ii) C 2.3(3); D 2.2(1)/ 2.20; [2] (iii) polluted plants grow slower than control; all grow the same/similar by day 12 /end of period; polluted grass grows taller/faster from day 13 to 24/eq; (must have reference to B C D if ‘polluted’ is not in the answer) [3] (iv) (BCD have) more root growth/absorption/so more water/minerals/named mineral for more growth/photosynthesis/more minerals now available as oil has broken down/A/ control plants grow quicker at the beginning as not inhibited by oil/eq; (allow converse statements) [1] (b) (i) animals will not have much food/grow slowly; toxic chemicals absorbed (by animals); might be poisoned/die; meat might taste bad/be toxic/poor quality/cannot be sold to local people/eq; [2] (ii) more food for animals; gives soil time to recover/grass to grow; less risk of poisoning/ healthier for animals; healthier for humans [2] (iii) overgrazing not likely/likely to be sustainable/eq; more yield of plants/animals after one year/eq; plant grass prevents soil erosion; plant grass reduces toxicity/eq; some oil has biodegraded/eq; some income earlier than plan B/eq; [2] (c) (i) yes; the plants show reduced growth for the first 10 metres/near factory; (accept converse statements) [2] (ii) sulfuric acid/H2SO4; (accept sulfurous acid H2SO3) reject sulfur hydroxide [1] (iii) changes pH of soil water; makes it more acidic/lowers pH; so lower quantity of minerals available to roots; reduced plant growth; reduced photosynthesis; AVP; (reject plants die unqualified) [2]
Mark scheme, page 4
Page 4 Mark Scheme: Teachers’ version Syllabus Paper IGCSE – May/June 2010 0680 42 © UCLES 2010 3 (a) (i) 40 (%); [1] (ii) some fish might not have migrated to Gulf in later years; reference to disease; large fish caught in early years/only small fish now; under recording; cannot reproduce fast enough to replace stock/less reproduction; AVP; (ignore reference to nets) [2] (iii) size/length; sex; age; sexual maturity; [2] (iv) table drawn for a week; two characteristics labelled;; (allow any characteristics identified in part (iii)) [3] (b) three relevant questions about fishing activities such as quantity caught, method used, number of days, details about boats;;; layout similar to question 1 (for 2 questions); [4] reject questions about sport fishing/nets (c) (i) could overfish sardines/eq; pollution/disease from cages; [1] (ii) number of sardines will increase; number of small fish will decrease; as more sardines to eat them; whales/sharks decrease; due to lack of food; if more sardines eaten by whales/sharks then small fish increase; reference to change of algae numbers in correct context; [2] (d) sports fishing control number of fishing days/season/fishing zone; catch per fisherman; number of boats; sports fishermen pay for licence; throw back in water; (reject reference to nets) fishing for food closed season (in April–June) to allow spawning; set quota for each boat/eq; fishing patrols to enforce rules/times; regulate fishing gear; no fishing zones; regulate number of boats/fishermen; (reject reference to nets) (max 4 for each subsection) [6]
What you needed in this session
Cambridge’s own grade thresholds for 2010 May/June, Paper 4 · Variant 2. A higher threshold means an easier paper — the bar moves with how the cohort did.