Cambridge IGCSE Environmental Management 0680 — 2010 May/June Paper 4 · Variant 1
0680/41/M/J/10 · 60 marks · ≈68 min
The question paper and its mark scheme, free to read here and free to download. This is Cambridge’s own paper, exactly as it was sat.
Question paper20 pages







Mark scheme3 pages
Answers below. Sit the paper first if you are practising.
Paper as text
Question paper, page 1
This document consists of 17 printed pages and 3 blank pages. DC (SHW/CGW 00488 5/09) 16729/3 © UCLES 2010 [Turn over UNIVERSITY OF CAMBRIDGE INTERNATIONAL EXAMINATIONS International General Certificate of Secondary Education READ THESE INSTRUCTIONS FIRST Write your Centre number, candidate number and name on all the work you hand in. Write in dark blue or black pen. You may use a soft pencil for any diagrams, graphs or rough working. Do not use staples, paper clips, highlighters, glue or correction fluid. DO NOT WRITE IN ANY BARCODES. Answer all questions. Study the appropriate Source materials before you start to write your answers. Credit will be given for appropriate selection and use of data in your answers and for relevant interpretation of these data. Suggestions for data sources are given in some questions. You may use the source data to draw diagrams and graphs or to do calculations to illustrate your answers. At the end of the examination, fasten all your work securely together. The number of marks is given in brackets [ ] at the end of each question or part question. * 0 0 7 2 2 4 6 3 8 5 * ENVIRONMENTAL MANAGEMENT 0680/41 Alternative to Coursework May/June 2010 1 hour 30 minutes Candidates answer on the Question Paper. Additional Materials: Ruler For Examiner’s Use www.XtremePapers.com
Question paper, page 2
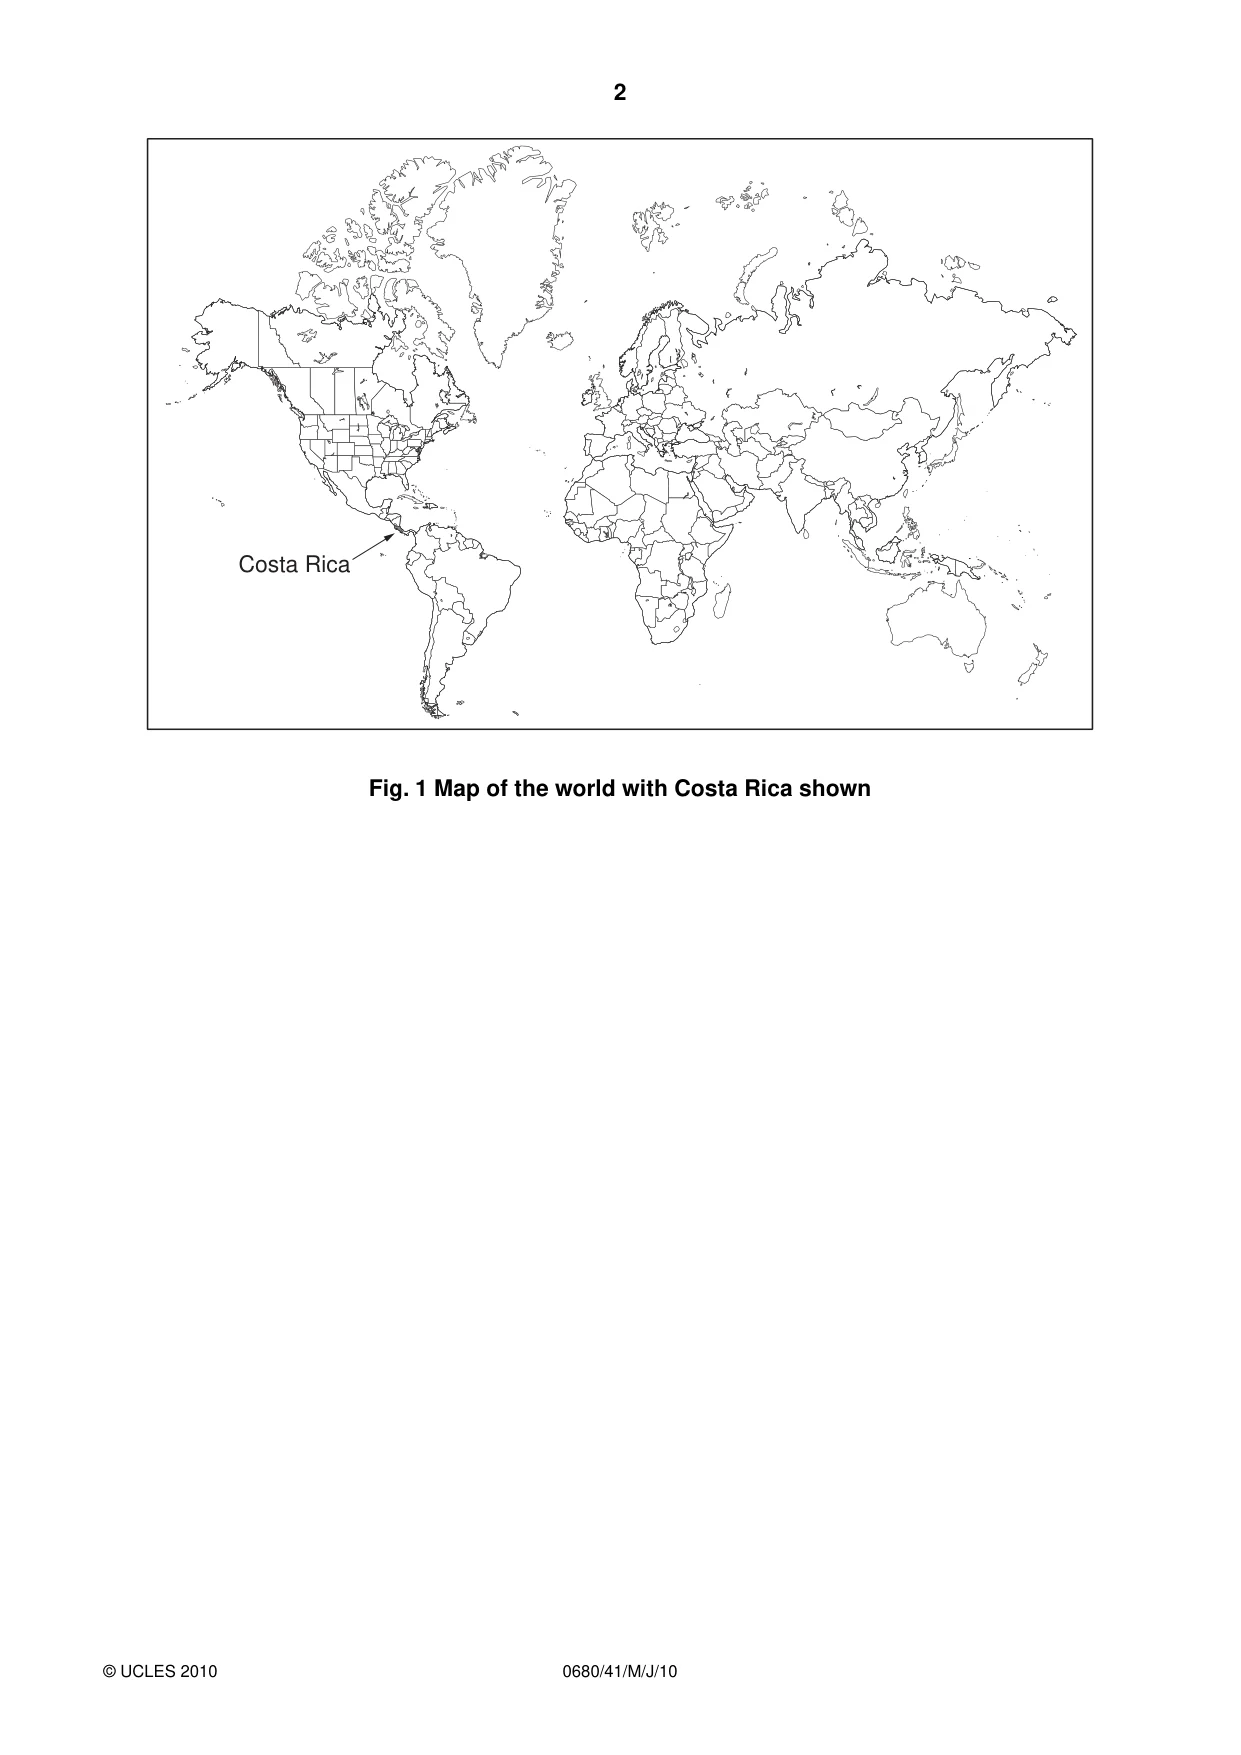
2 0680/41/M/J/10 © UCLES 2010 Costa Rica Fig. 1 Map of the world with Costa Rica shown
Question paper, page 3
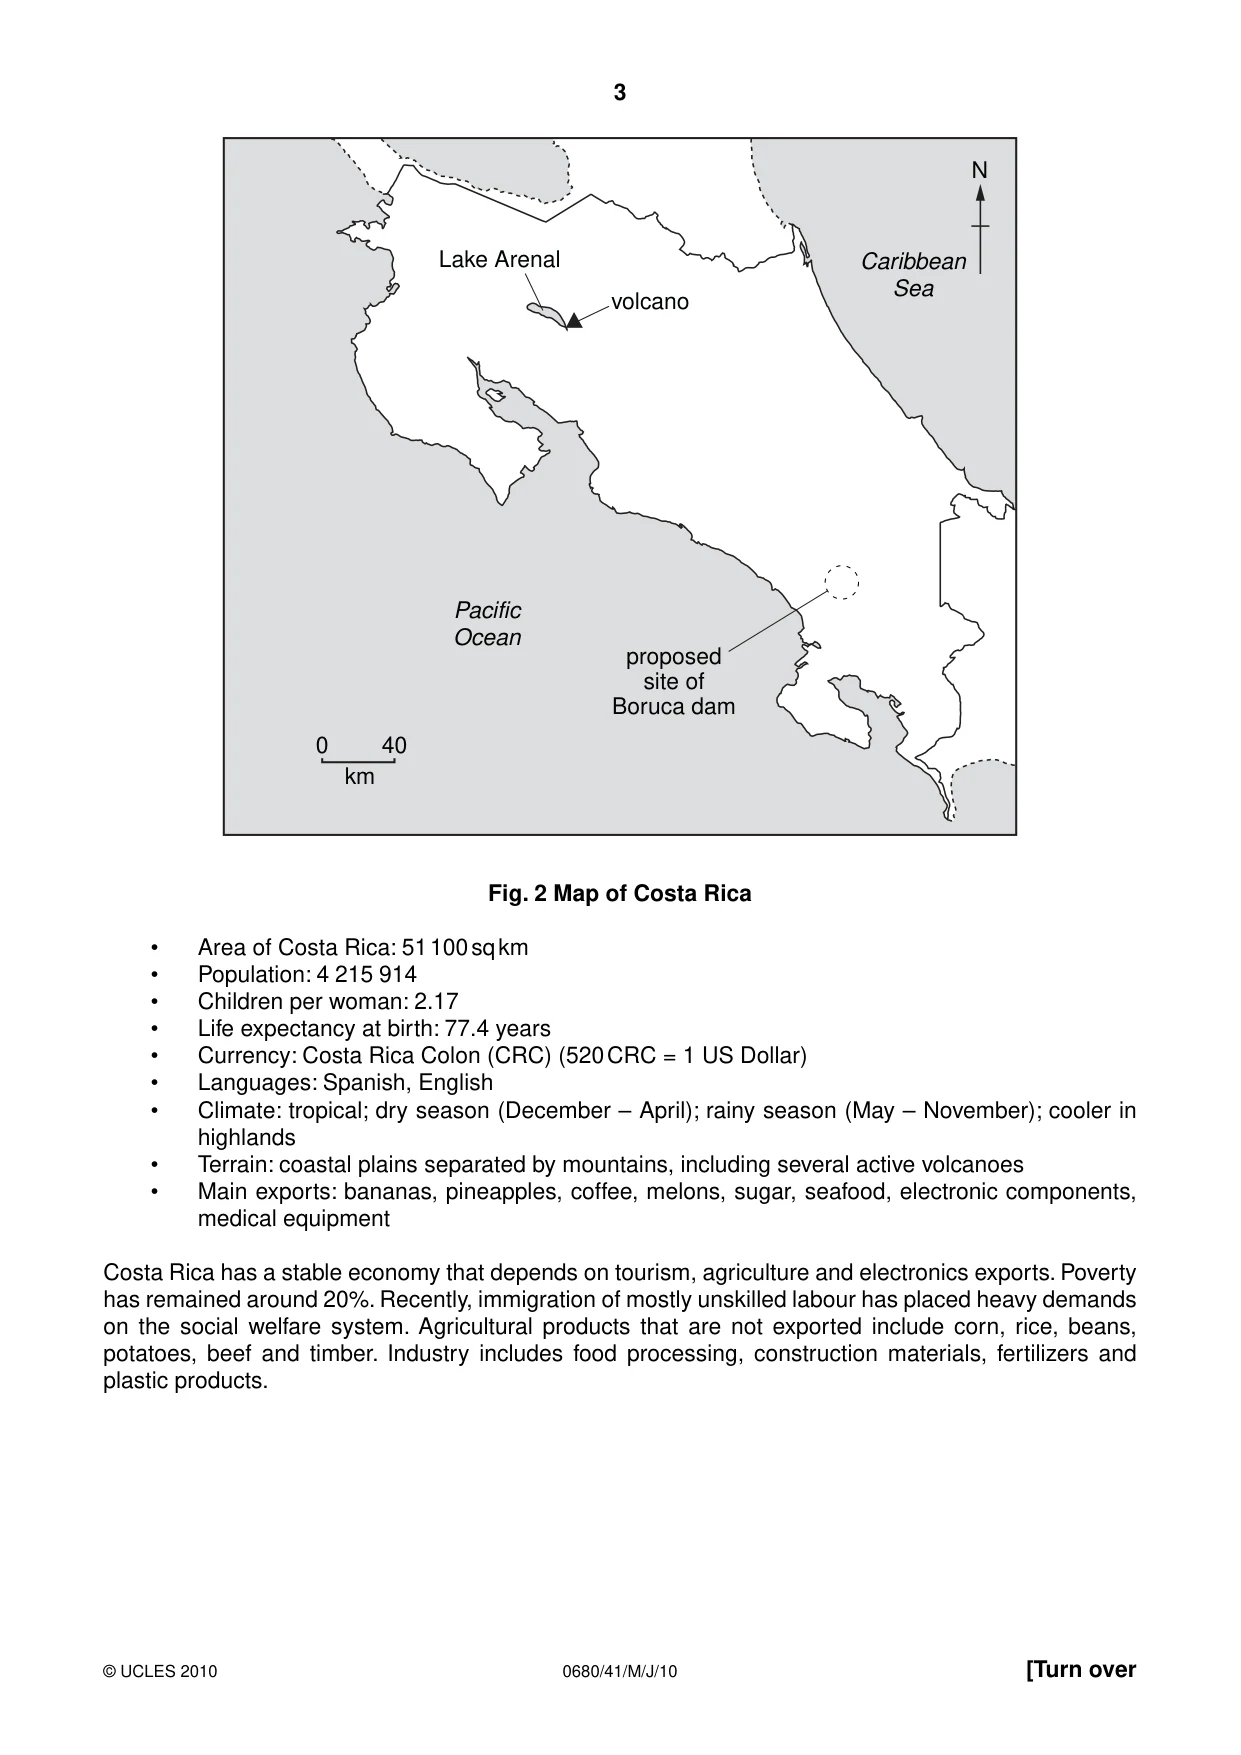
3 0680/41/M/J/10 © UCLES 2010 [Turn over N Lake Arenal volcano proposed site of Boruca dam Pacific Ocean Caribbean Sea 0 40 km Fig. 2 Map of Costa Rica • Area of Costa Rica: 51 100 sq km • Population: 4 215 914 • Children per woman: 2.17 • Life expectancy at birth: 77.4 years • Currency: Costa Rica Colon (CRC) (520 CRC = 1 US Dollar) • Languages: Spanish, English • Climate: tropical; dry season (December – April); rainy season (May – November); cooler in highlands • Terrain: coastal plains separated by mountains, including several active volcanoes • Main exports: bananas, pineapples, coffee, melons, sugar, seafood, electronic components, medical equipment Costa Rica has a stable economy that depends on tourism, agriculture and electronics exports. Poverty has remained around 20%. Recently, immigration of mostly unskilled labour has placed heavy demands on the social welfare system. Agricultural products that are not exported include corn, rice, beans, potatoes, beef and timber. Industry includes food processing, construction materials, fertilizers and plastic products.
Question paper, page 4
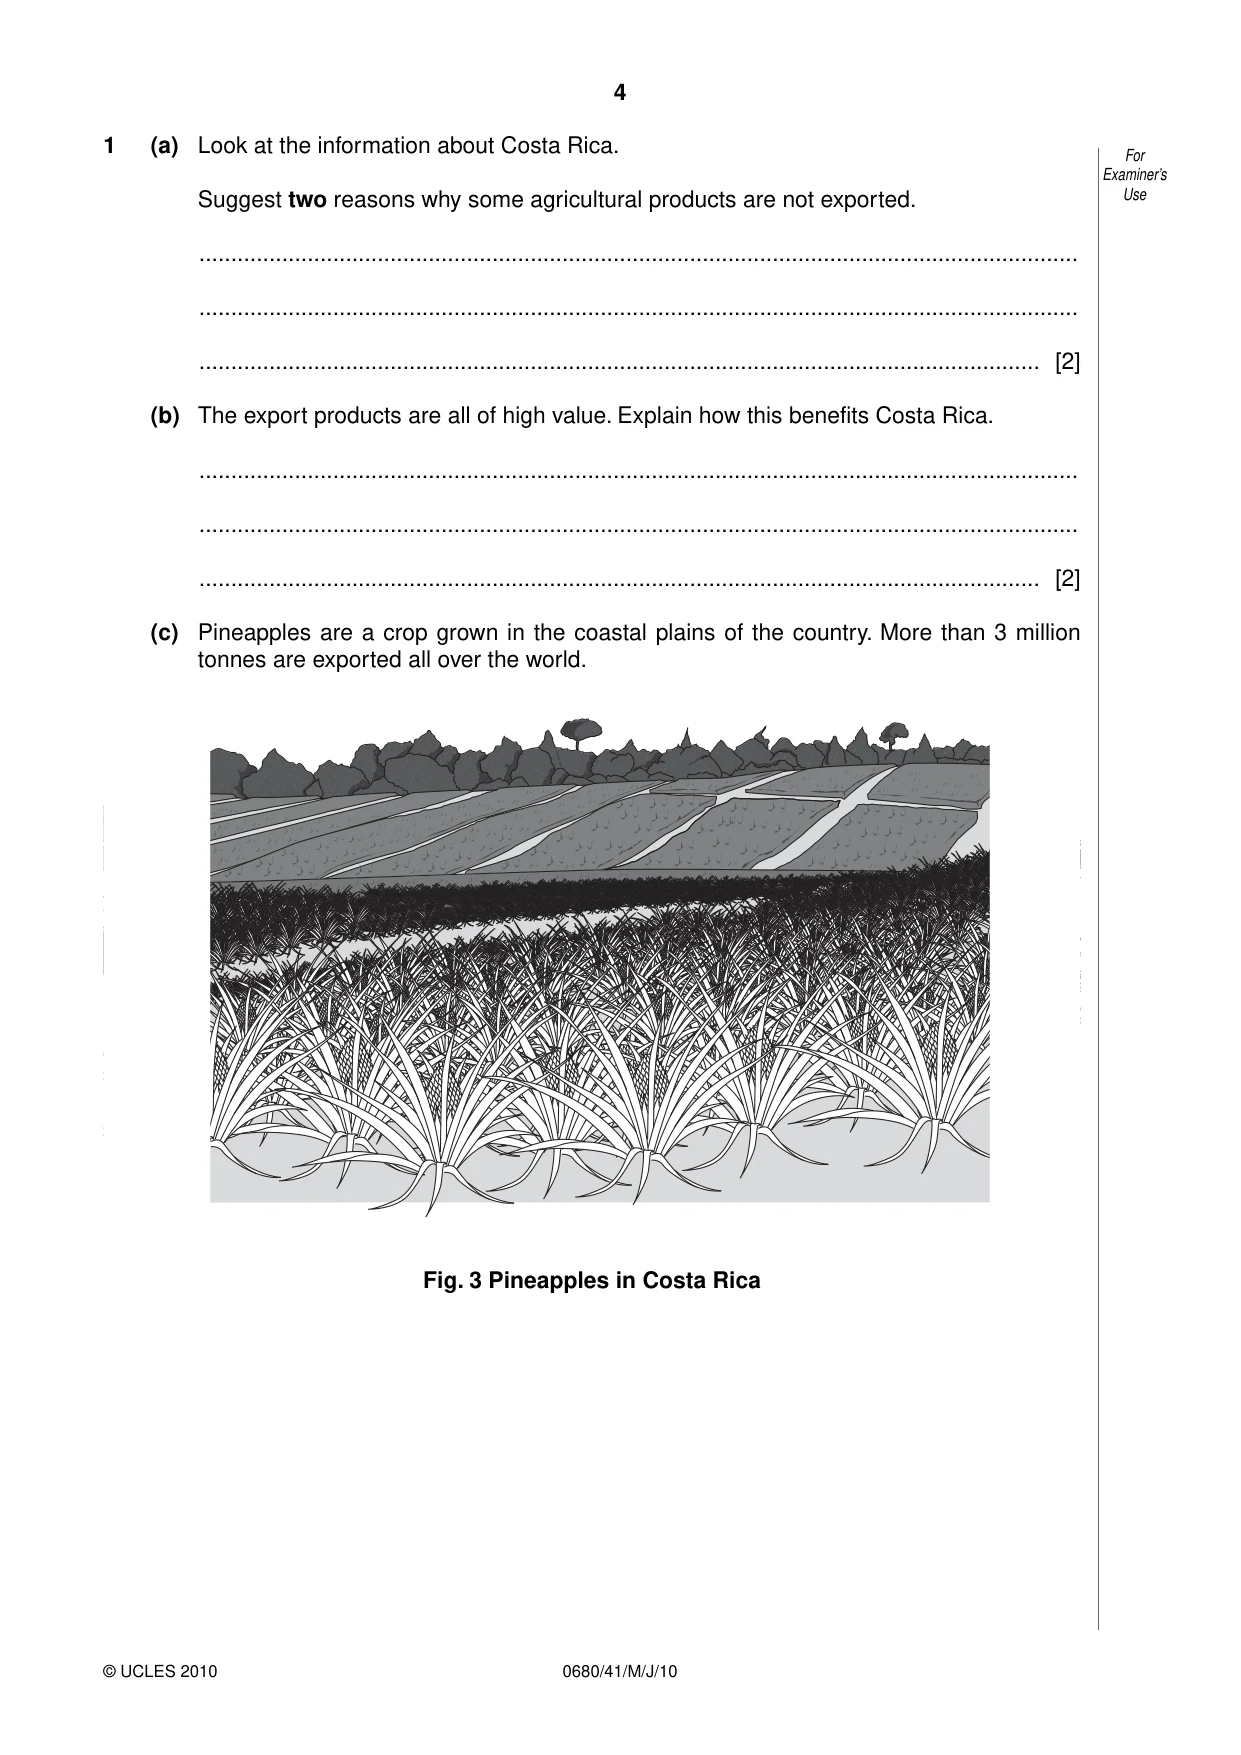
4 0680/41/M/J/10 © UCLES 2010 For Examiner’s Use 1 (a) Look at the information about Costa Rica. Suggest two reasons why some agricultural products are not exported. … … … [2] (b) The export products are all of high value. Explain how this benefits Costa Rica. … … … [2] (c) Pineapples are a crop grown in the coastal plains of the country. More than 3 million tonnes are exported all over the world. Fig. 3 Pineapples in Costa Rica
Question paper, page 5
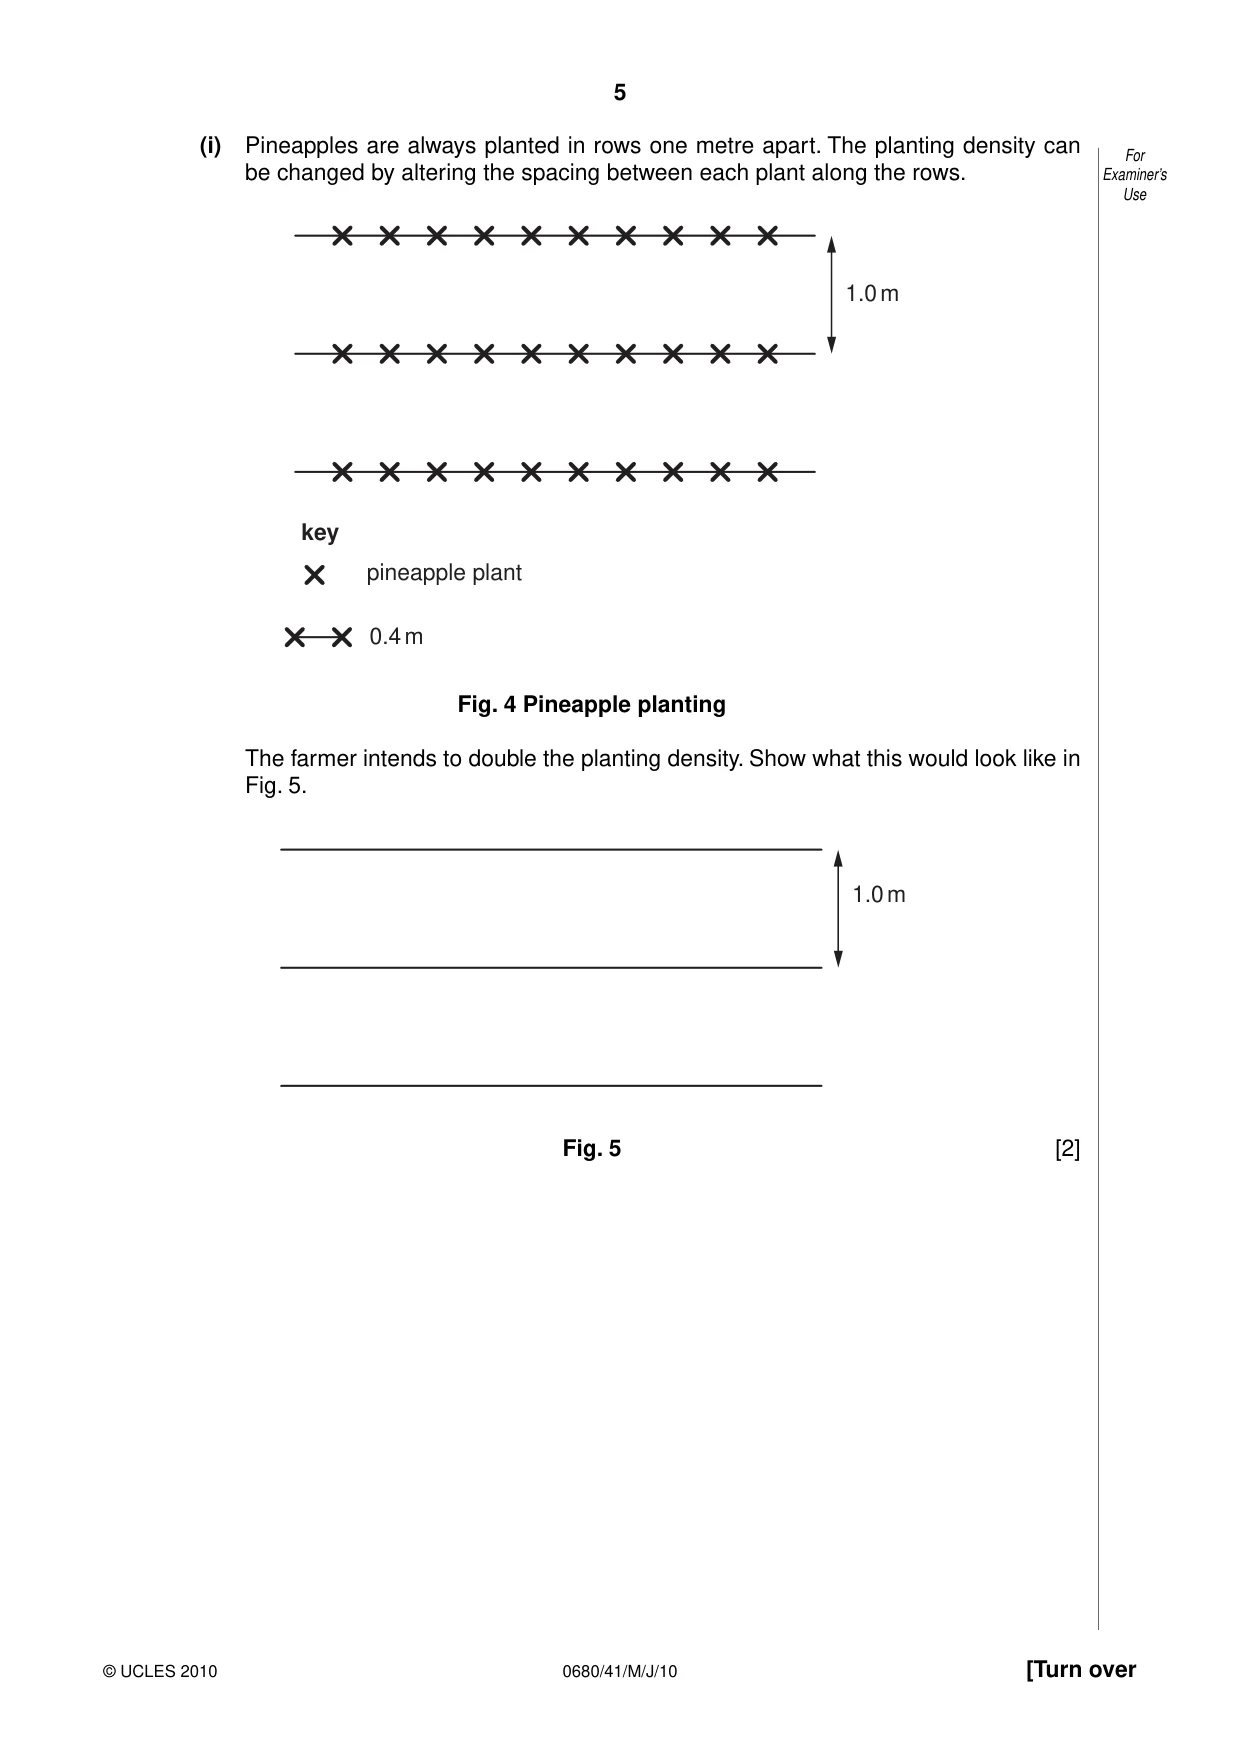
5 0680/41/M/J/10 © UCLES 2010 [Turn over For Examiner’s Use (i) Pineapples are always planted in rows one metre apart. The planting density can be changed by altering the spacing between each plant along the rows. 1.0 m pineapple plant 0.4 m key Fig. 4 Pineapple planting The farmer intends to double the planting density. Show what this would look like in Fig. 5. 1.0 m Fig. 5 [2]
Question paper, page 6
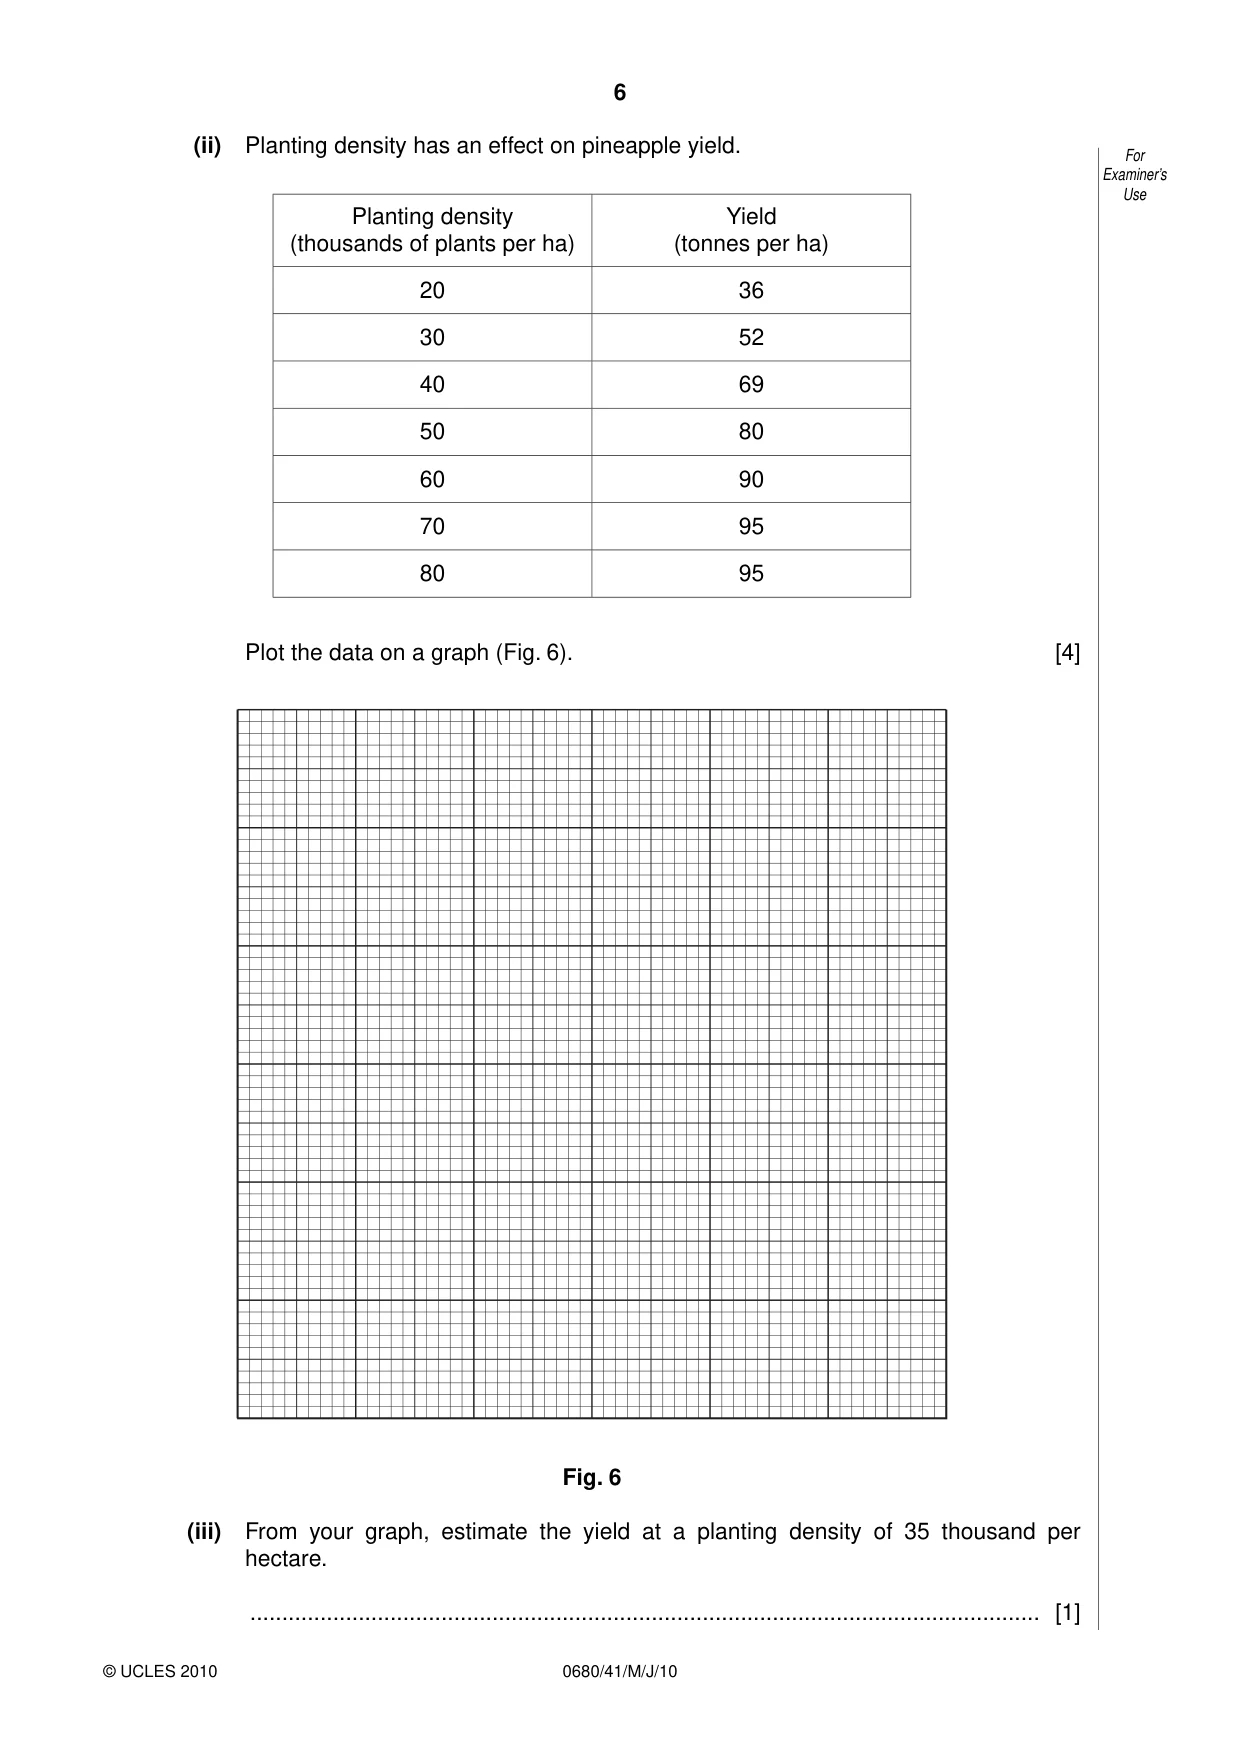
6 0680/41/M/J/10 © UCLES 2010 For Examiner’s Use (ii) Planting density has an effect on pineapple yield. Planting density (thousands of plants per ha) Yield (tonnes per ha) 20 36 30 52 40 69 50 80 60 90 70 95 80 95 Plot the data on a graph (Fig. 6). [4] Fig. 6 (iii) From your graph, estimate the yield at a planting density of 35 thousand per hectare. … [1]
Question paper, page 7
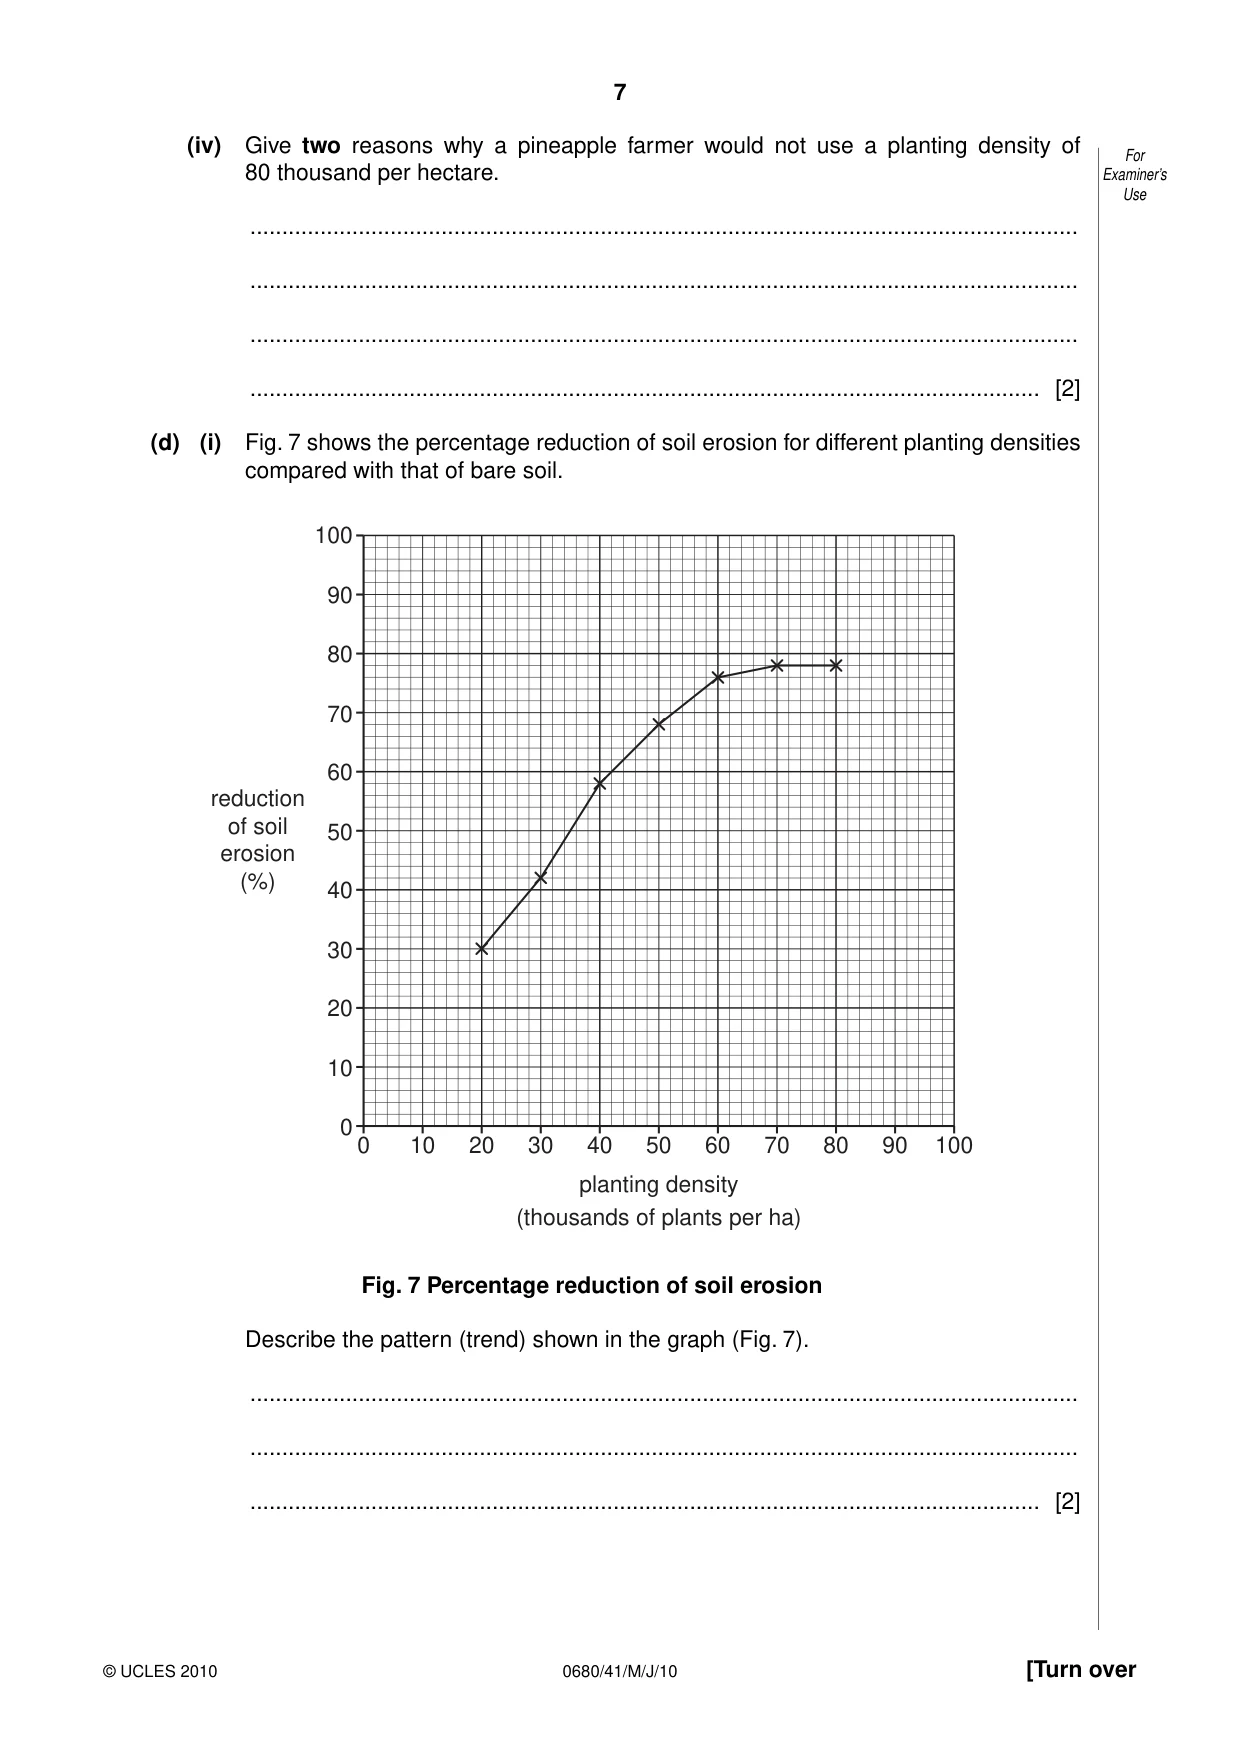
7 0680/41/M/J/10 © UCLES 2010 [Turn over For Examiner’s Use (iv) Give two reasons why a pineapple farmer would not use a planting density of 80 thousand per hectare. … … … … [2] (d) (i) Fig. 7 shows the percentage reduction of soil erosion for different planting densities compared with that of bare soil. 100 90 80 70 60 50 40 30 20 10 0 0 10 20 30 40 50 planting density (thousands of plants per ha) reduction of soil erosion (%) 60 70 80 90 100 Fig. 7 Percentage reduction of soil erosion Describe the pattern (trend) shown in the graph (Fig. 7). … … … [2]
Question paper, page 8
8 0680/41/M/J/10 © UCLES 2010 For Examiner’s Use (ii) Using your own knowledge, and the information shown in Fig. 6 and Fig. 7, suggest one planting density a farmer should use. Planting density … Reason … … [2] (iii) What is soil erosion? … [1] (iv) Describe the causes of soil erosion. … … … … … … [4]
Question paper, page 9
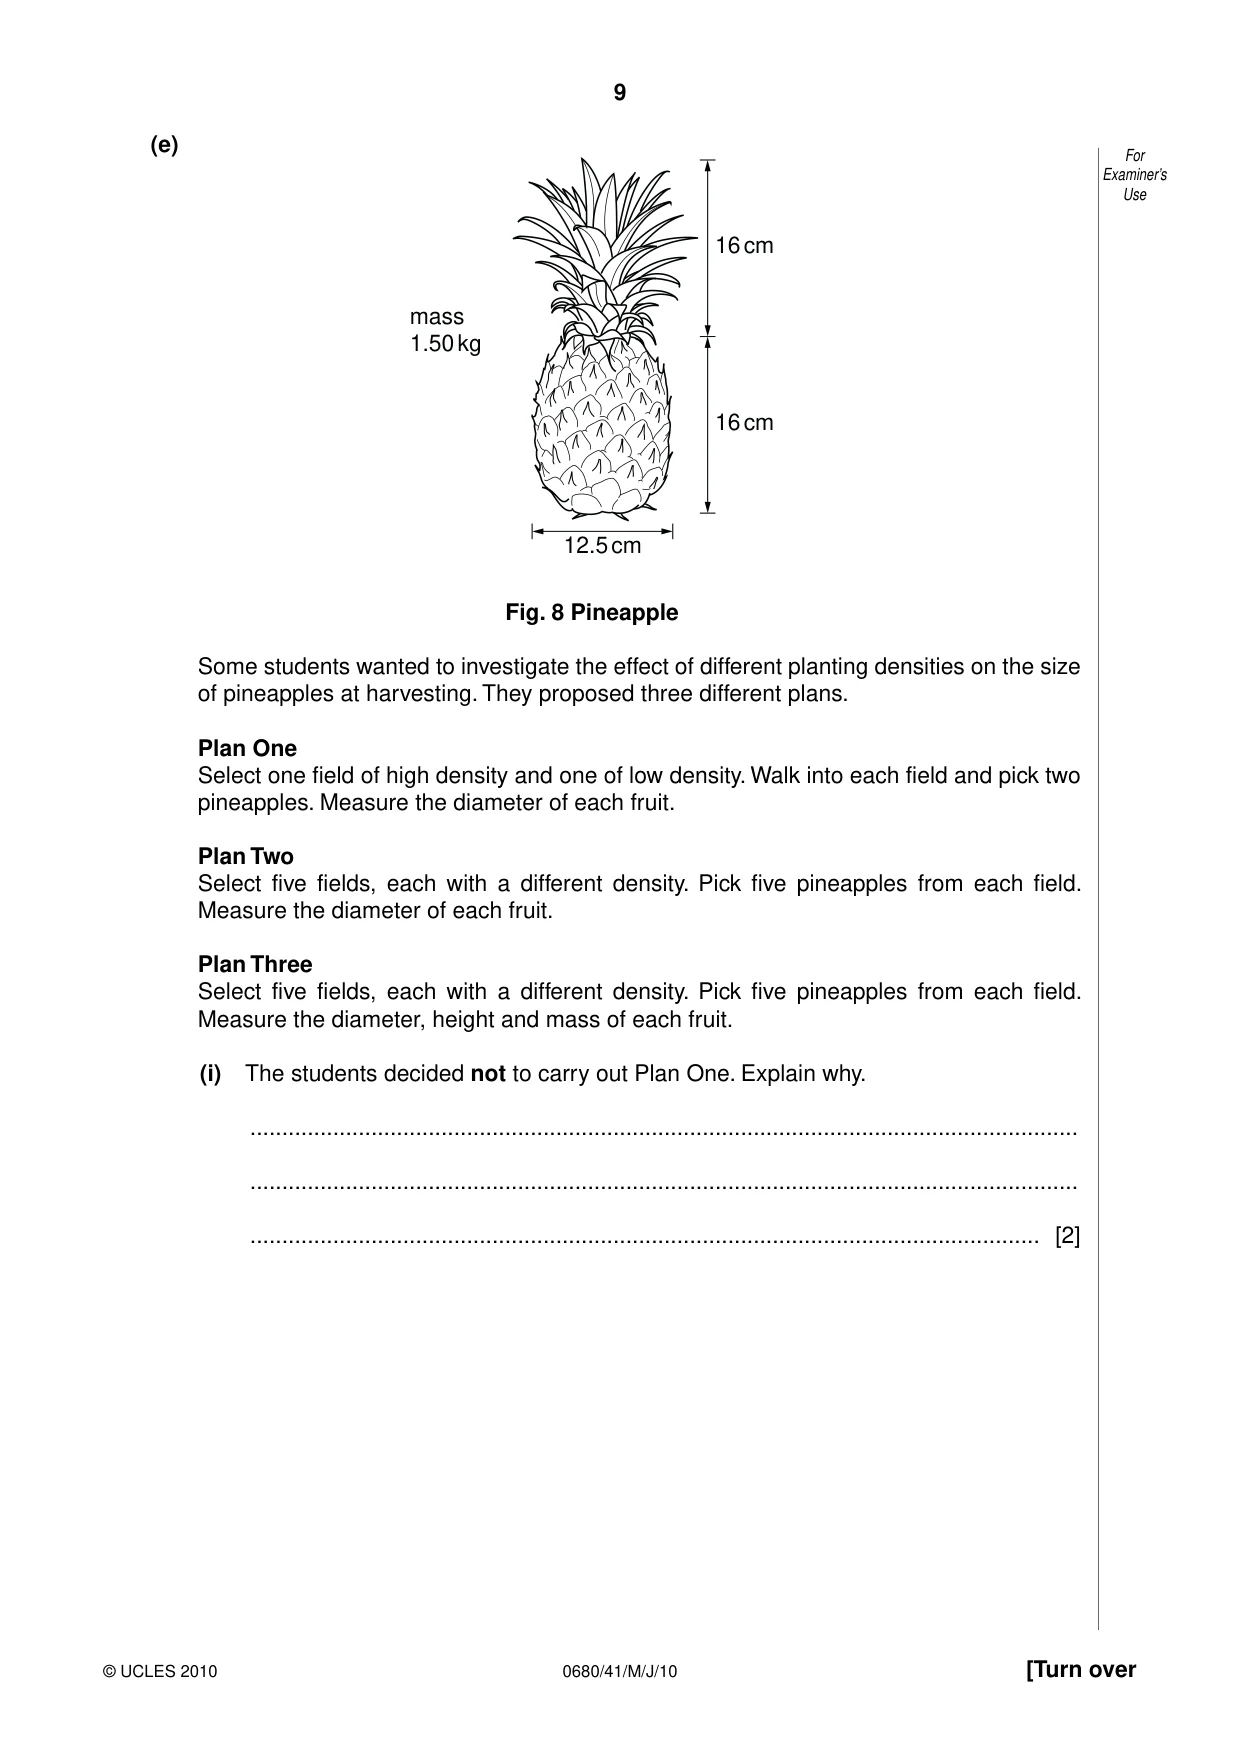
9 0680/41/M/J/10 © UCLES 2010 [Turn over For Examiner’s Use (e) mass 1.50 kg 16 cm 16 cm 12.5 cm Fig. 8 Pineapple Some students wanted to investigate the effect of different planting densities on the size of pineapples at harvesting. They proposed three different plans. Plan One Select one field of high density and one of low density. Walk into each field and pick two pineapples. Measure the diameter of each fruit. Plan Two Select five fields, each with a different density. Pick five pineapples from each field. Measure the diameter of each fruit. Plan Three Select five fields, each with a different density. Pick five pineapples from each field. Measure the diameter, height and mass of each fruit. (i) The students decided not to carry out Plan One. Explain why. … … … [2]
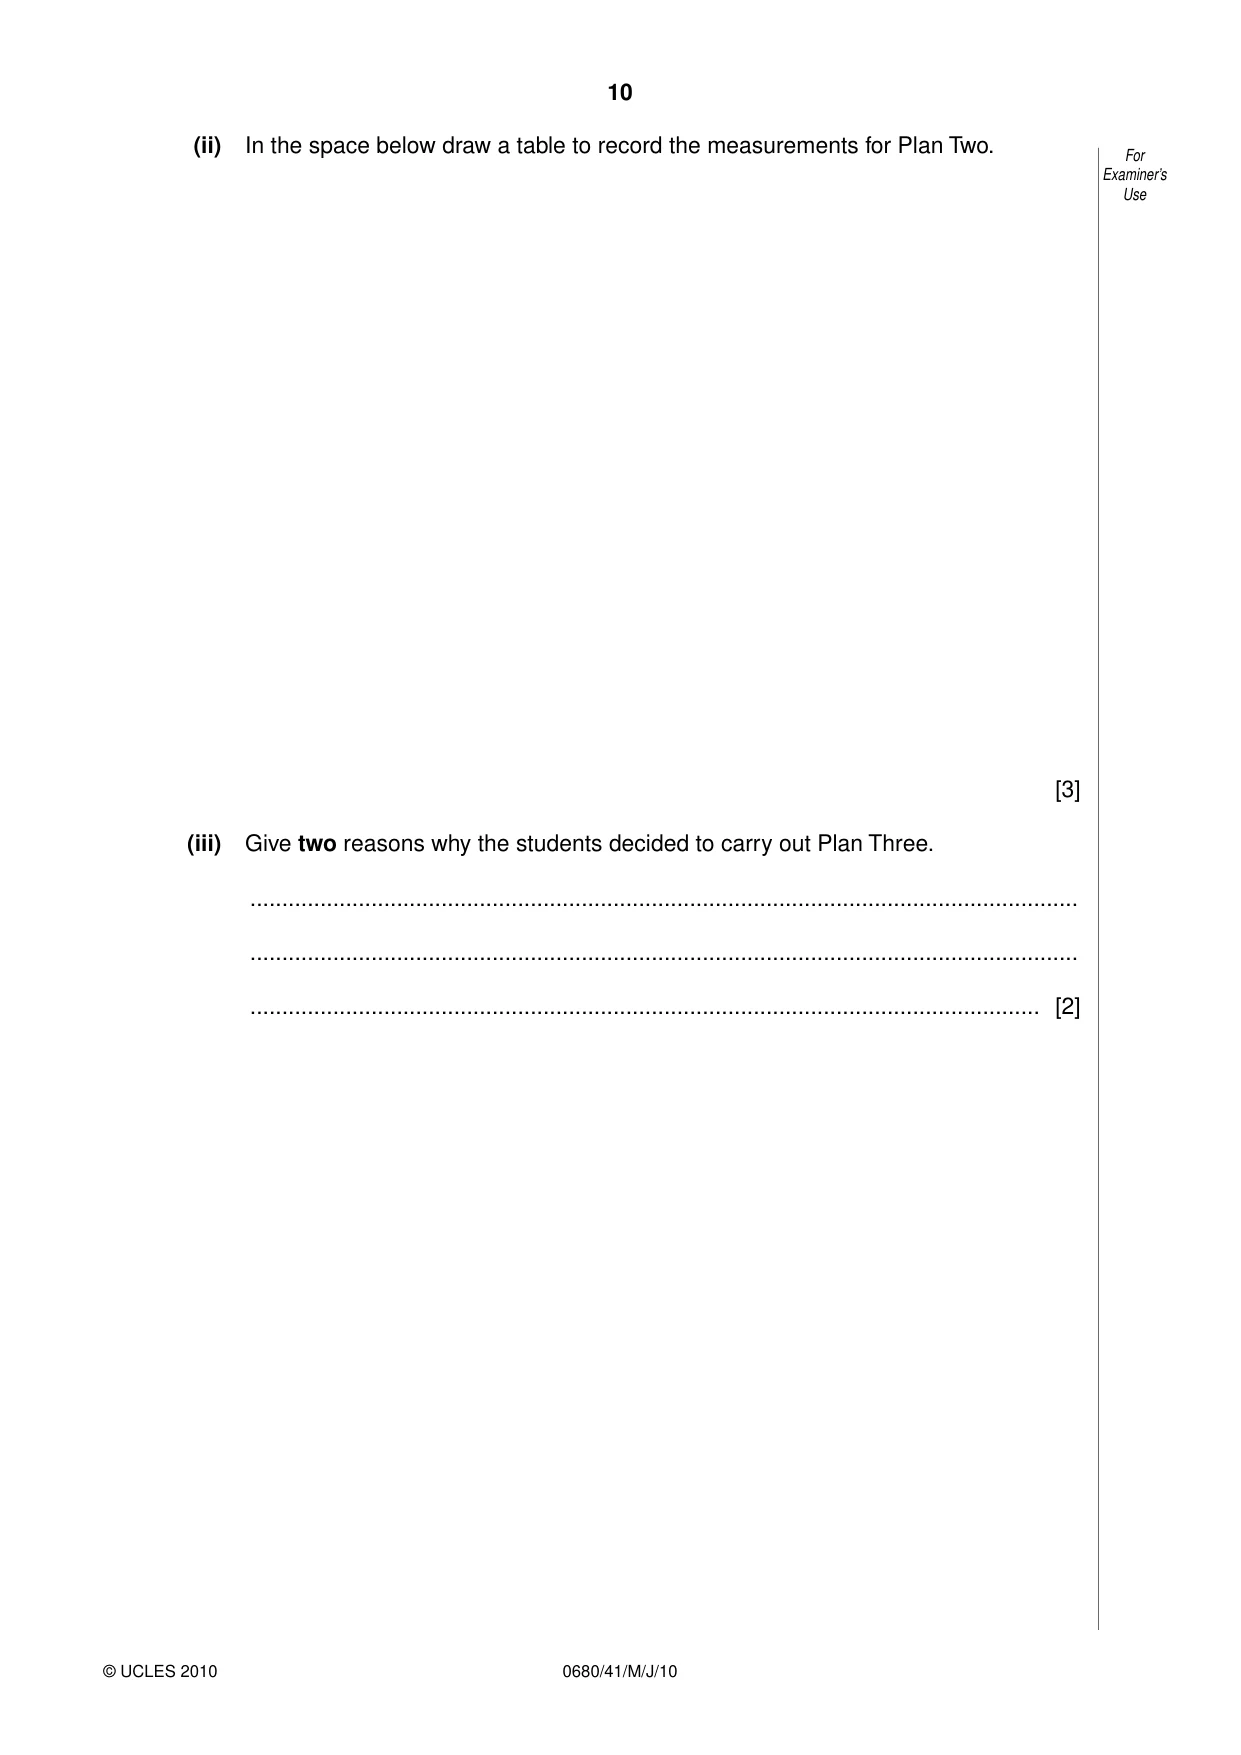
Question paper, page 10
10 0680/41/M/J/10 © UCLES 2010 For Examiner’s Use (ii) In the space below draw a table to record the measurements for Plan Two. [3] (iii) Give two reasons why the students decided to carry out Plan Three. … … … [2]
Question paper, page 11
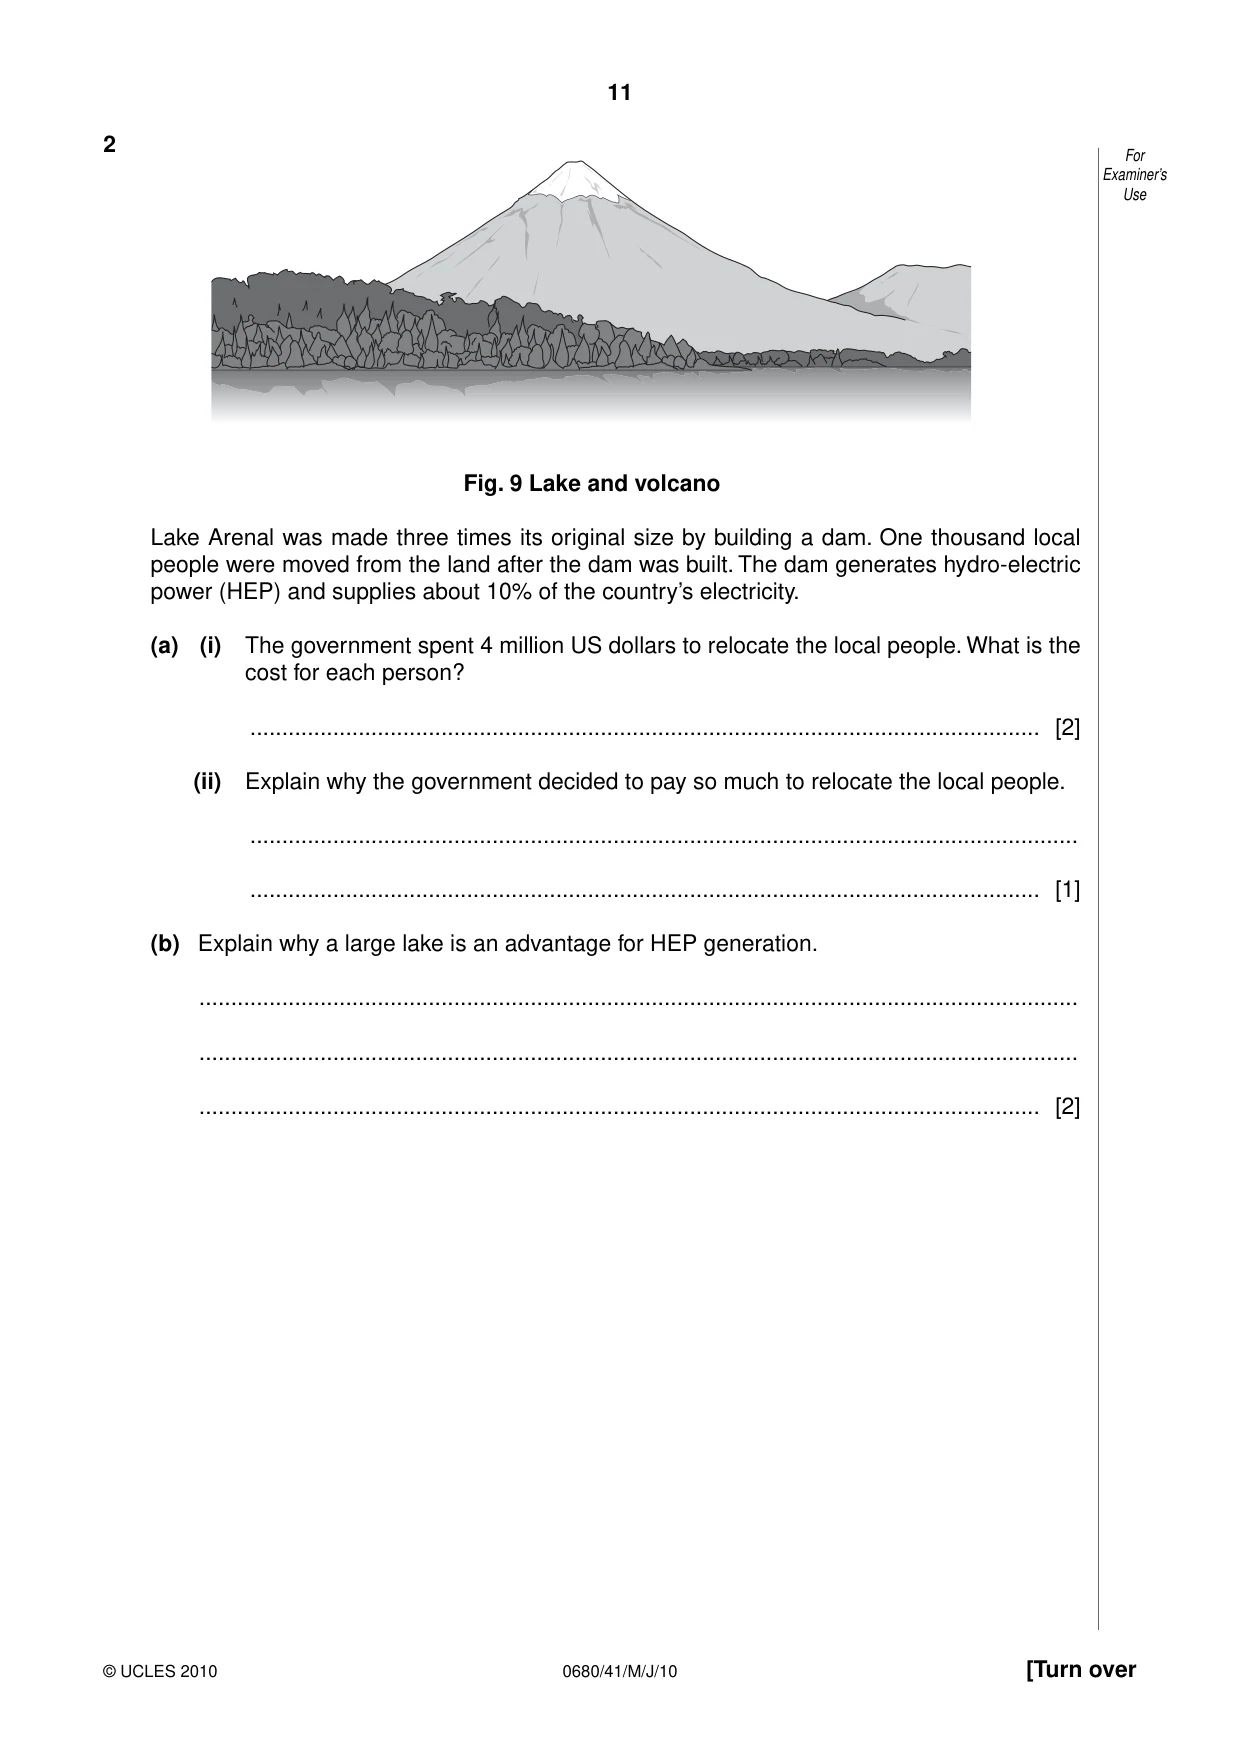
11 0680/41/M/J/10 © UCLES 2010 [Turn over For Examiner’s Use 2 Fig. 9 Lake and volcano Lake Arenal was made three times its original size by building a dam. One thousand local people were moved from the land after the dam was built. The dam generates hydro-electric power (HEP) and supplies about 10% of the country’s electricity. (a) (i) The government spent 4 million US dollars to relocate the local people. What is the cost for each person? … [2] (ii) Explain why the government decided to pay so much to relocate the local people. … … [1] (b) Explain why a large lake is an advantage for HEP generation. … … … [2]
Question paper, page 12
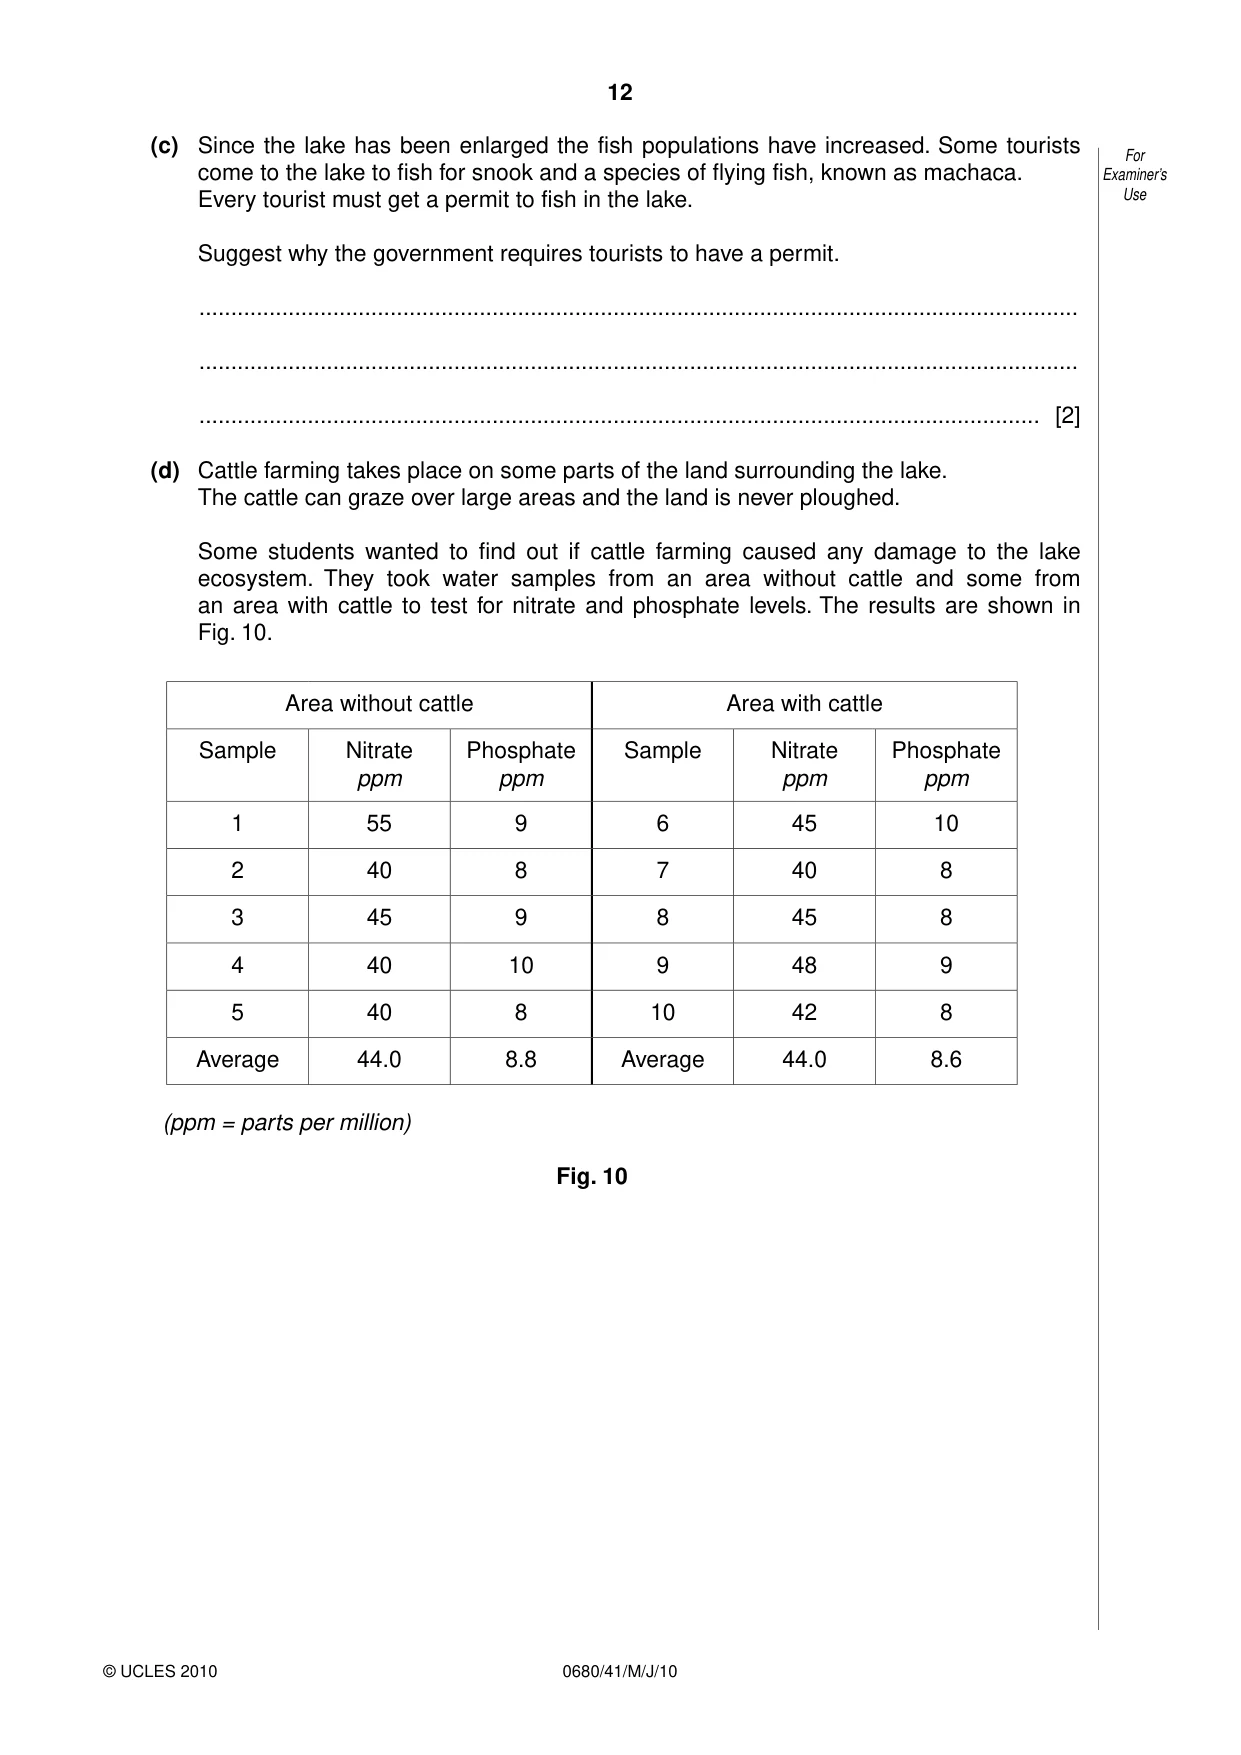
12 0680/41/M/J/10 © UCLES 2010 For Examiner’s Use (c) Since the lake has been enlarged the fish populations have increased. Some tourists come to the lake to fish for snook and a species of flying fish, known as machaca. Every tourist must get a permit to fish in the lake. Suggest why the government requires tourists to have a permit. … … … [2] (d) Cattle farming takes place on some parts of the land surrounding the lake. The cattle can graze over large areas and the land is never ploughed. Some students wanted to find out if cattle farming caused any damage to the lake ecosystem. They took water samples from an area without cattle and some from an area with cattle to test for nitrate and phosphate levels. The results are shown in Fig. 10. Area without cattle Area with cattle Sample Nitrate ppm Phosphate ppm Sample Nitrate ppm Phosphate ppm 1 55 9 6 45 10 2 40 8 7 40 8 3 45 9 8 45 8 4 40 10 9 48 9 5 40 8 10 42 8 Average 44.0 8.8 Average 44.0 8.6 (ppm = parts per million) Fig. 10
Question paper, page 13
13 0680/41/M/J/10 © UCLES 2010 [Turn over For Examiner’s Use (i) Do you think cattle farming is affecting the lake ecosystem? Use the information in the table to help give reasons for your answer. … … … [3] (ii) The students highlighted one of their measurements. Which one? Why? … … [2] (iii) Why should the students repeat their sampling? … [1] (e) Describe what would happen to Lake Arenal if the level of nitrate and phosphate increased. … … … … [3]
Question paper, page 14
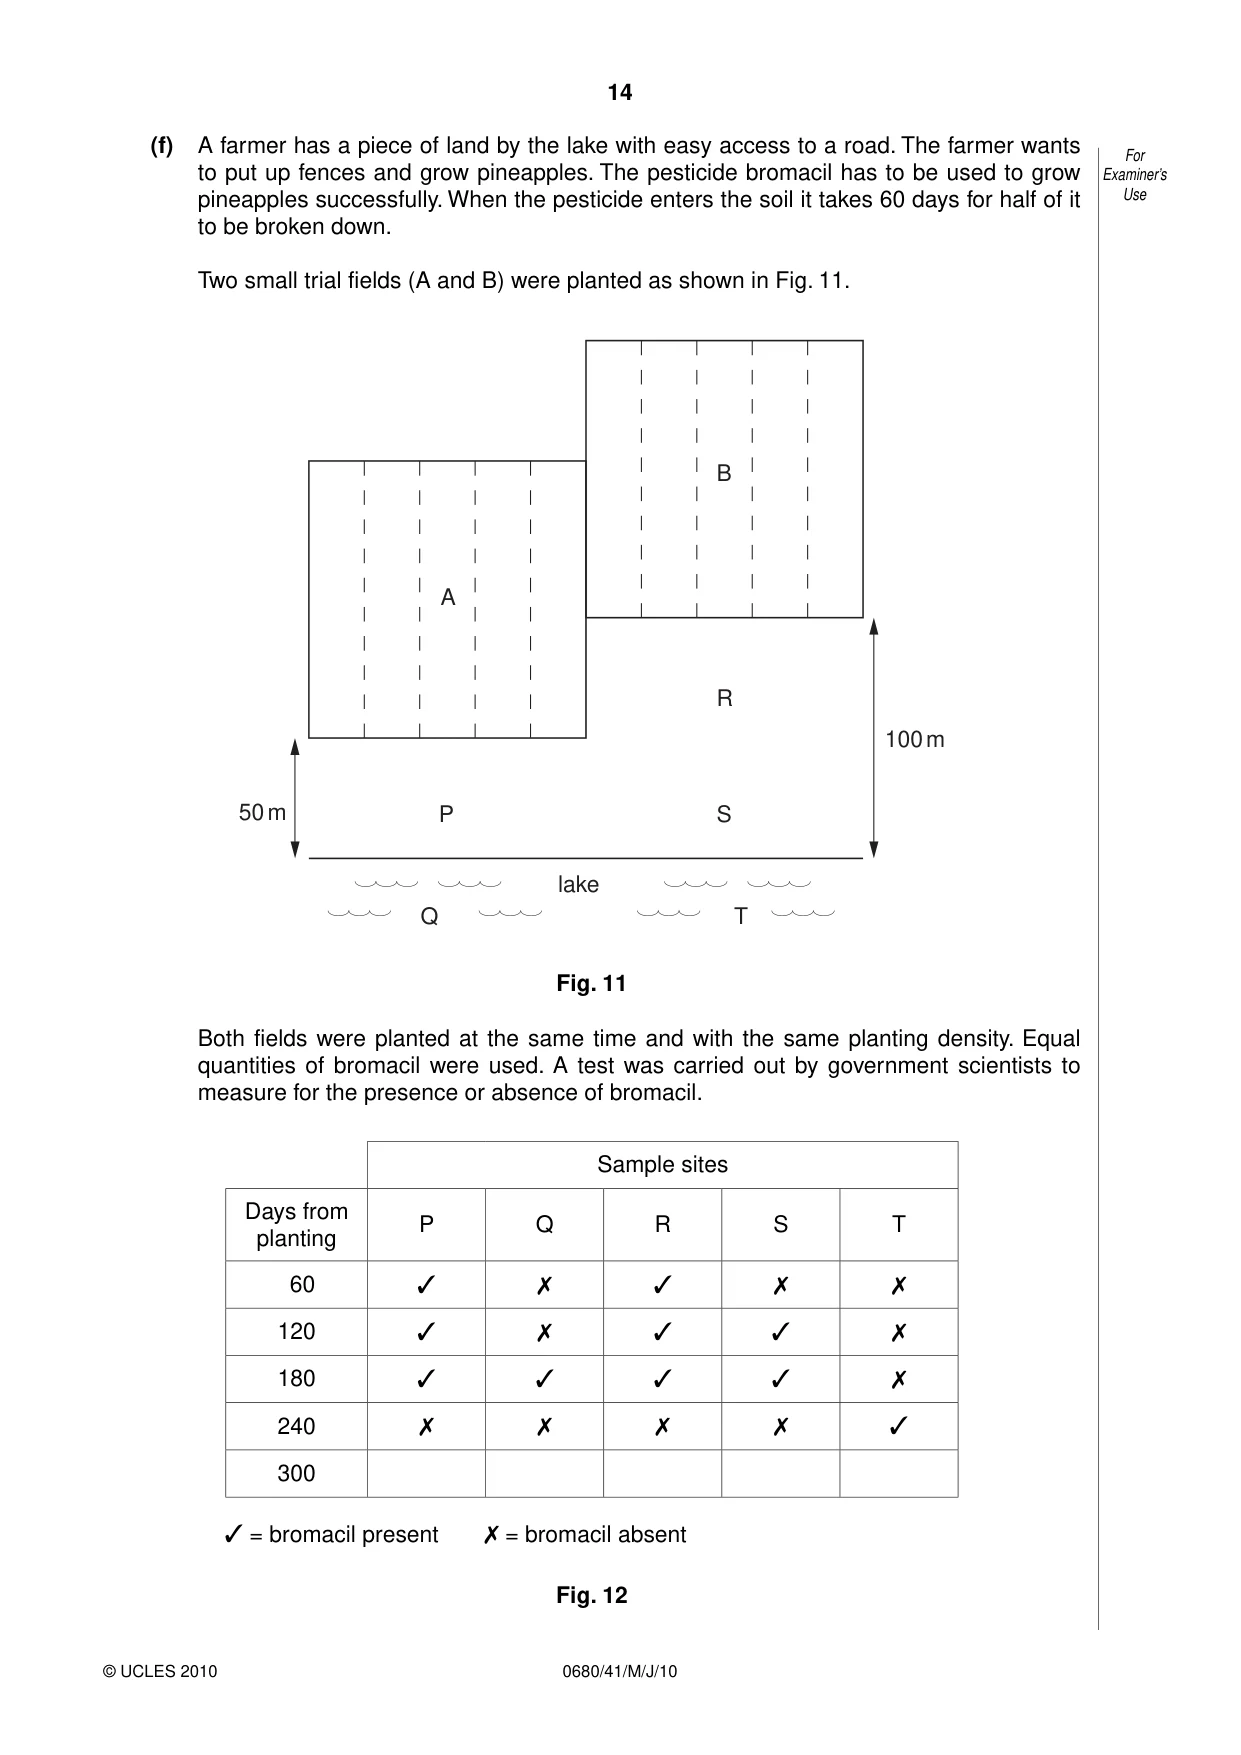
14 0680/41/M/J/10 © UCLES 2010 For Examiner’s Use (f) A farmer has a piece of land by the lake with easy access to a road. The farmer wants to put up fences and grow pineapples. The pesticide bromacil has to be used to grow pineapples successfully. When the pesticide enters the soil it takes 60 days for half of it to be broken down. Two small trial fields (A and B) were planted as shown in Fig. 11. A B R S P 100 m lake Q T 50 m Fig. 11 Both fields were planted at the same time and with the same planting density. Equal quantities of bromacil were used. A test was carried out by government scientists to measure for the presence or absence of bromacil. Sample sites Days from planting P Q R S T 60 ✓ ✗ ✓ ✗ ✗ 120 ✓ ✗ ✓ ✓ ✗ 180 ✓ ✓ ✓ ✓ ✗ 240 ✗ ✗ ✗ ✗ ✓ 300 ✓ = bromacil present ✗ = bromacil absent Fig. 12
Question paper, page 15
15 0680/41/M/J/10 © UCLES 2010 [Turn over For Examiner’s Use (i) Describe the pattern of results shown by the pesticide tests. … … … … [3] (ii) Complete Fig. 12 for readings you would expect at sites P–T after 300 days. [1] (iii) Explain why the government scientists refused to allow the farmer to grow pineapples after this trial. … … … [2]
Question paper, page 16
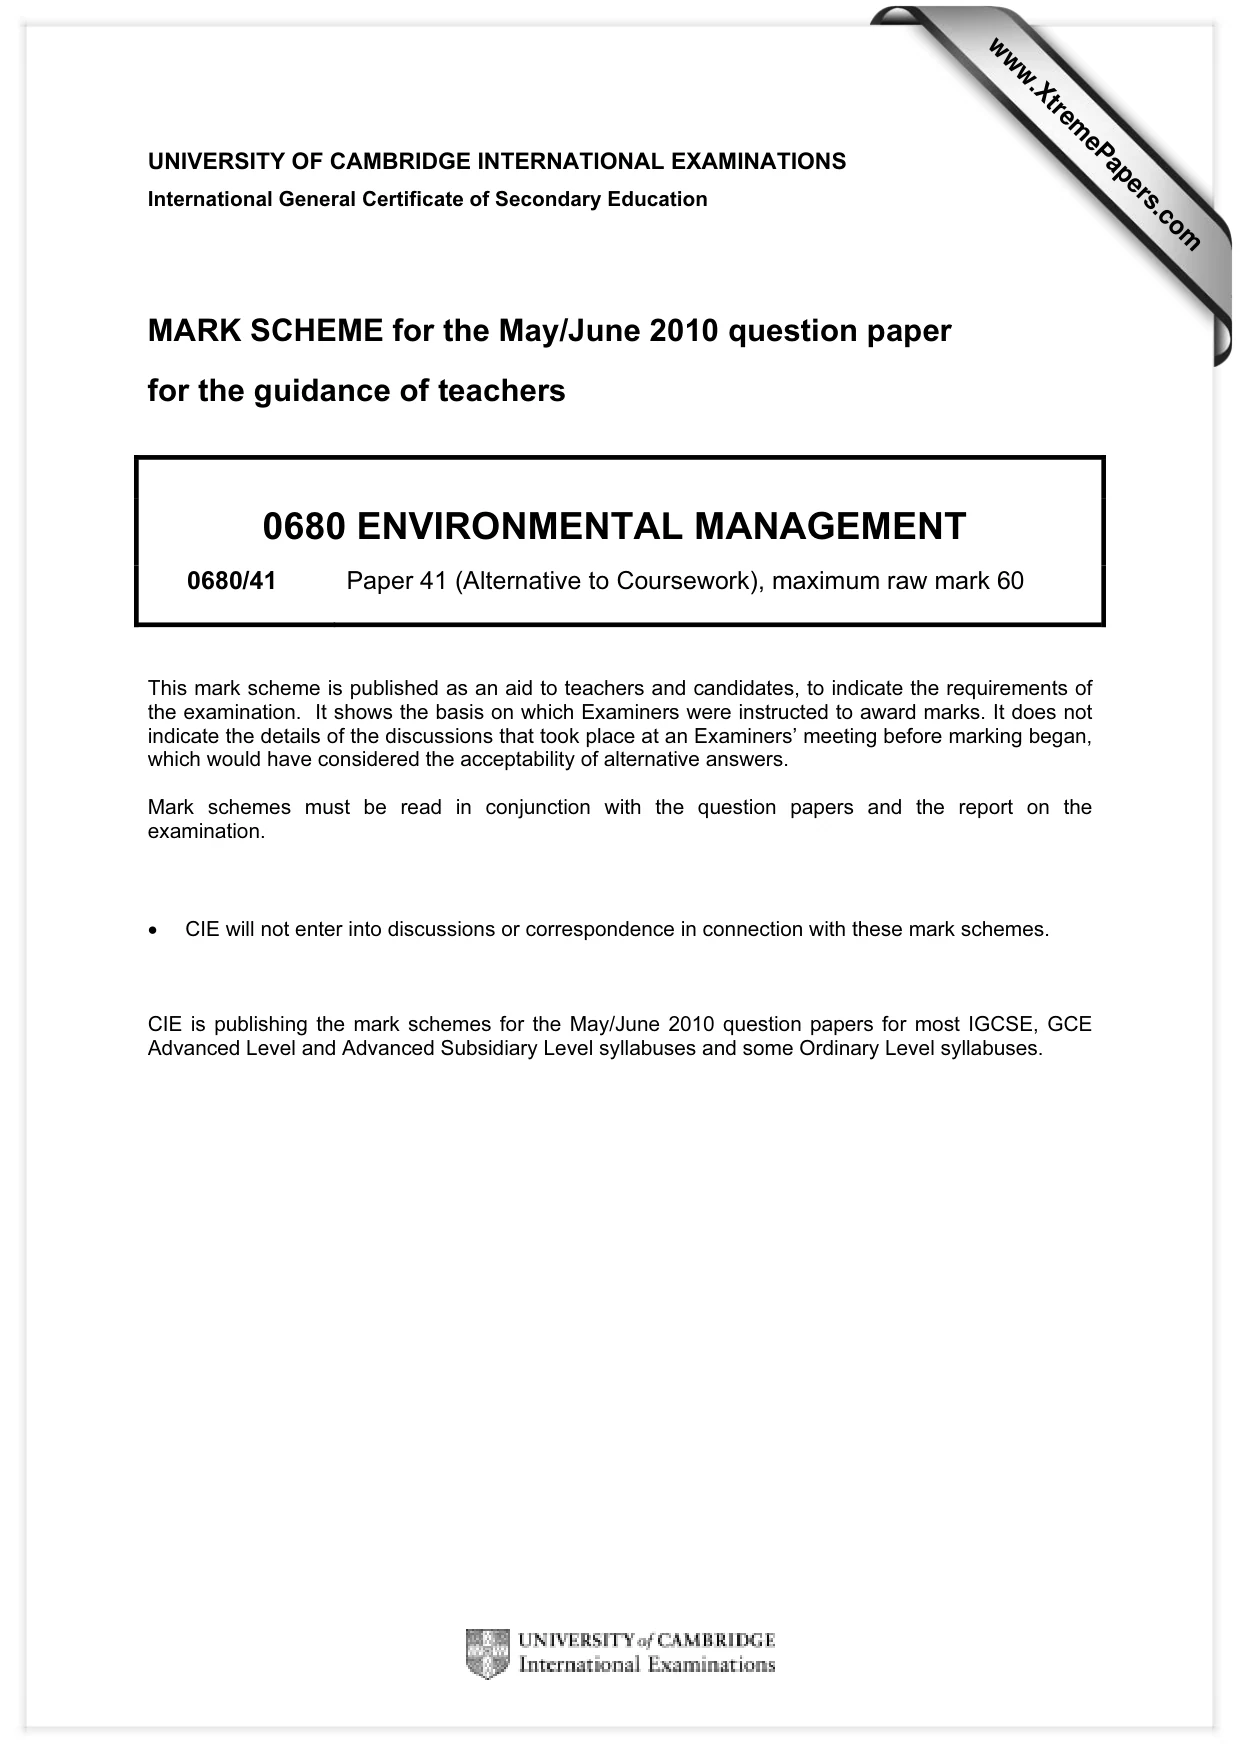
16 0680/41/M/J/10 © UCLES 2010 For Examiner’s Use 3 The government has been considering a proposal to build the Boruca Dam for 30 years. Some statements made about the proposal are: • The dam would provide 100% of the country’s electricity • 5 000 people will need to be relocated • The dam should generate electricity for 60 years • 25 000 hectares of farming land will be flooded • Foreign companies want to loan the government money to build the dam • The dam will silt up and produce less electricity in the future • The government will be paying back loans for 50 years. (a) (i) Select one statement and explain why it would be an advantage to Costa Rica. Statement … Advantage … [1] (ii) Select one statement and explain why it would be a disadvantage to the economy of Costa Rica. Statement … Disadvantage … [1] (iii) Select one statement and explain why it would be a disadvantage to local people. Statement … Disadvantage … [1]
Question paper, page 17
17 0680/41/M/J/10 © UCLES 2010 For Examiner’s Use (b) A foreign company wants to help build an aluminium smelting works close to the Boruca Dam. This could use up to 85% of the power produced. It takes a large amount of electricity to produce aluminium from its ore, bauxite. Costa Rica has bauxite deposits but, unfortunately, not enough can be extracted to make the works profitable. The rest of the bauxite would have to be imported by sea from its mining operations in other countries. BAUXITE + ELECTRICAL ENERGY = ALUMINIUM + OXYGEN (i) Explain why the aluminium smelter is an example of sustainable production. … … [1] (ii) State the other arguments in favour and state the arguments against the building of the aluminium smelter. In your view, which are the stronger? … … … … … … … … [5]
Question paper, page 18
18 0680/41/M/J/10 © UCLES 2010 BLANK PAGE
Question paper, page 19
19 0680/41/M/J/10 © UCLES 2010 BLANK PAGE
Question paper, page 20
20 0680/41/M/J/10 © UCLES 2010 BLANK PAGE Permission to reproduce items where third-party owned material protected by copyright is included has been sought and cleared where possible. Every reasonable effort has been made by the publisher (UCLES) to trace copyright holders, but if any items requiring clearance have unwittingly been included, the publisher will be pleased to make amends at the earliest possible opportunity. University of Cambridge International Examinations is part of the Cambridge Assessment Group. Cambridge Assessment is the brand name of University of Cambridge Local Examinations Syndicate (UCLES), which is itself a department of the University of Cambridge.
Mark scheme, page 1
UNIVERSITY OF CAMBRIDGE INTERNATIONAL EXAMINATIONS International General Certificate of Secondary Education MARK SCHEME for the May/June 2010 question paper for the guidance of teachers 0680 ENVIRONMENTAL MANAGEMENT 0680/41 Paper 41 (Alternative to Coursework), maximum raw mark 60 This mark scheme is published as an aid to teachers and candidates, to indicate the requirements of the examination. It shows the basis on which Examiners were instructed to award marks. It does not indicate the details of the discussions that took place at an Examiners’ meeting before marking began, which would have considered the acceptability of alternative answers. Mark schemes must be read in conjunction with the question papers and the report on the examination. • CIE will not enter into discussions or correspondence in connection with these mark schemes. CIE is publishing the mark schemes for the May/June 2010 question papers for most IGCSE, GCE Advanced Level and Advanced Subsidiary Level syllabuses and some Ordinary Level syllabuses. www.XtremePapers.com
Mark scheme, page 2
Page 2 Mark Scheme: Teachers’ version Syllabus Paper IGCSE – May/June 2010 0680 41 © UCLES 2010 1 (a) some products used for food/personal use; timber used for building; no spare products for export/eq; not profitable/not of high value; [2] (b) country gains foreign exchange/revenue/eq; can be used to pay for imports; sensible reference to balance of payments/controlling national budget/debt/company profits; helps government spending on infrastructure/eq; maintains/ creates jobs; [2] (c) (i) 20 plants on each row (+/-1); even spacing; [2] (ii) orientation; labelled axes (both, minimum yield/density); plots;; [4] (iii) allow correct figure from drawn graph; (58–62 usually) [1] (iv) no increase in yield compared to 70 thousand; so profits reduced/not profitable; more work for no return/eq; more work to harvest; more expensive to plant; [2] (d) (i) as planting density increases reduction of soil erosion increases/eq; not much change in soil erosion between 60–80 planting density/eq; [2] (ii) 50 or 60 max yield (per Ha)/profit compared to planting costs; nutrients retained to help yields/eq; [2] (iii) removal of topsoil/eq; [1] (iv) removal of plant cover; overcropping; loss of root binding; reference to lack of interception/described; infiltration/soil saturation; removal of topsoil/fertile layer; surface run-off; erosion by water; wind; reference to flooding; [4] (e) (i) only two densities sampled; two pineapples not representative/eq; only diameter measured; [2] (ii) suitable table, rows/columns for 25 items of data; densities/field number; and diameter headings; [3] (iii) more measurements for each pineapple to see changes with density/type of growth/eq; several densities sampled to see pattern/could be presented as a graph; [2] 2 (a) (i) 4000;; [2] (ii) so government could gain more revenue form HEP/eq; people would not object to scheme; [1] (b) generate more power/electricity; unlikely to dry out/eq; allow one of – does not release carbon dioxide/so does not contribute to greenhouse effect/ low running costs/renewable source of energy; [2]
Mark scheme, page 3
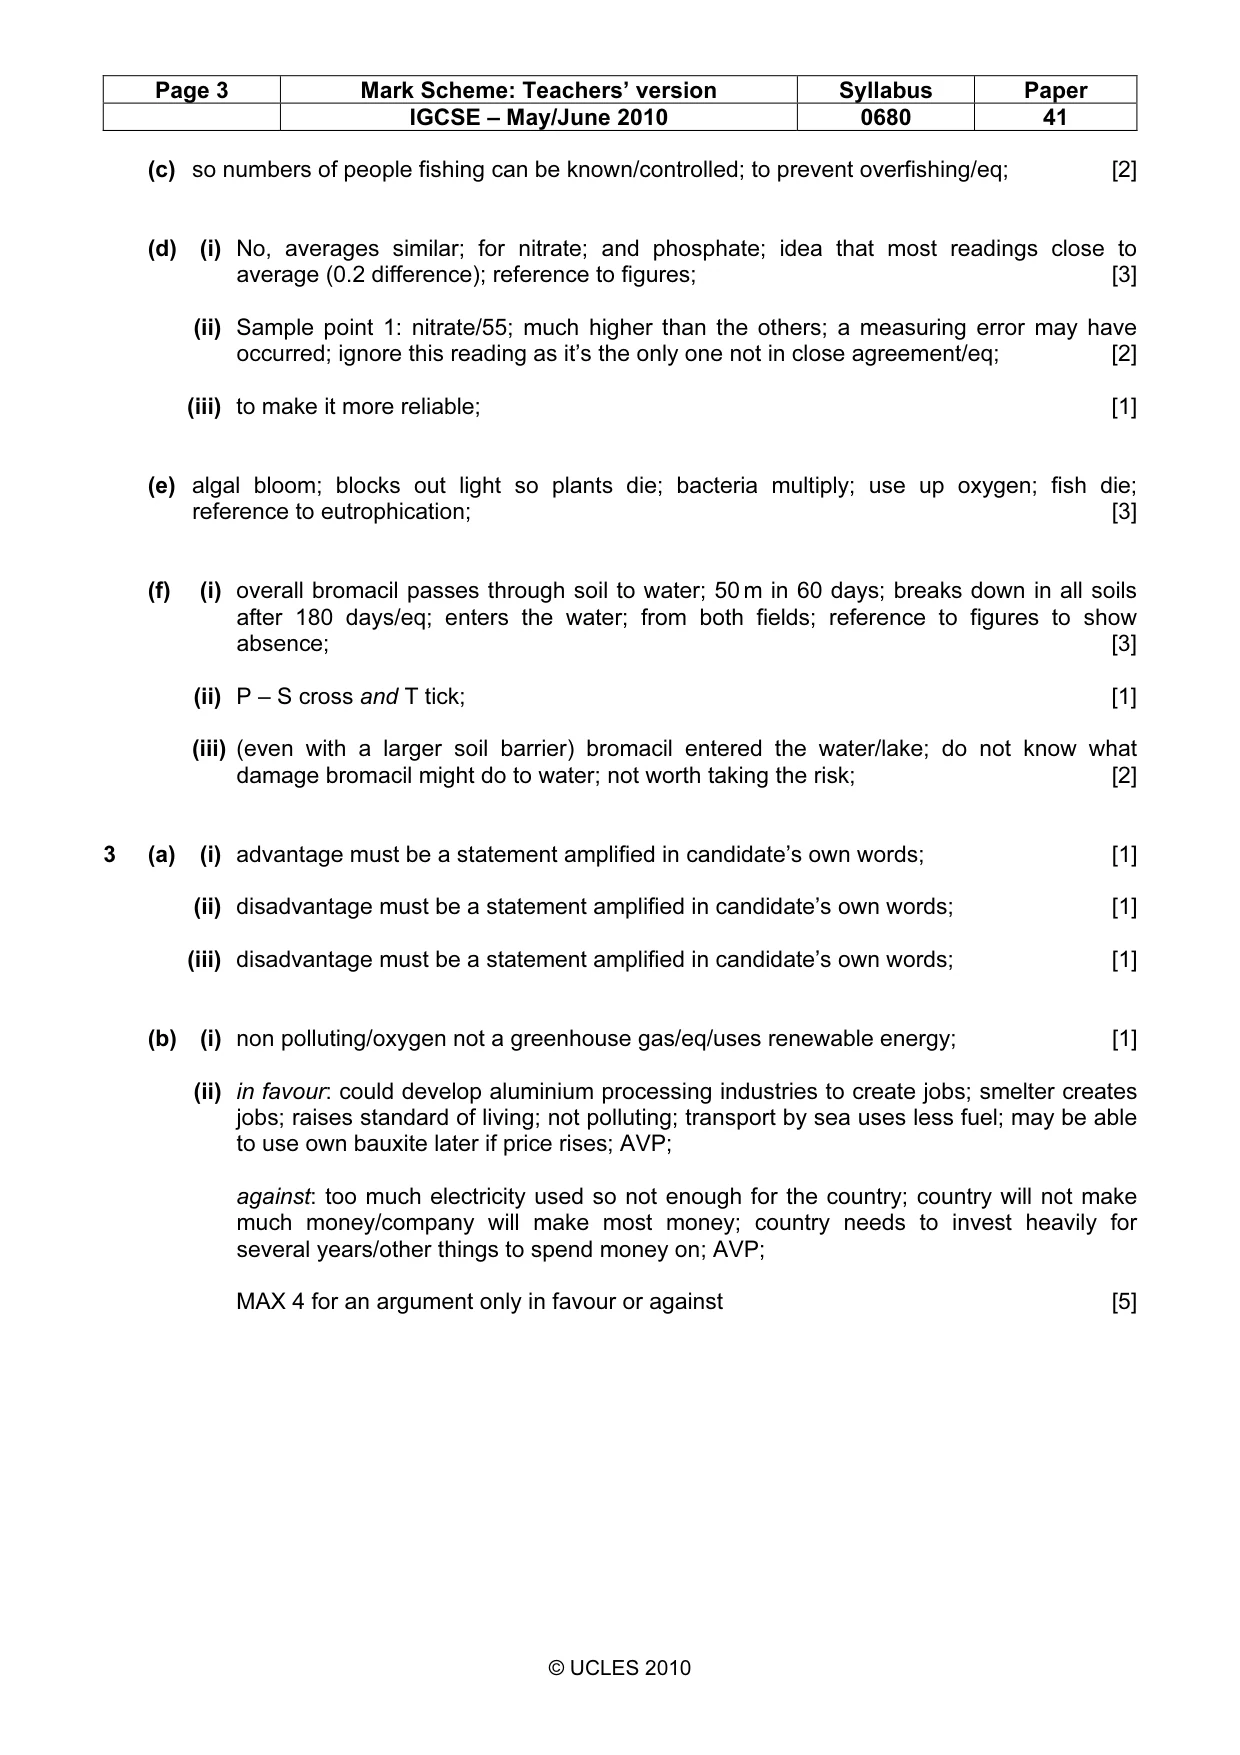
Page 3 Mark Scheme: Teachers’ version Syllabus Paper IGCSE – May/June 2010 0680 41 © UCLES 2010 (c) so numbers of people fishing can be known/controlled; to prevent overfishing/eq; [2] (d) (i) No, averages similar; for nitrate; and phosphate; idea that most readings close to average (0.2 difference); reference to figures; [3] (ii) Sample point 1: nitrate/55; much higher than the others; a measuring error may have occurred; ignore this reading as it’s the only one not in close agreement/eq; [2] (iii) to make it more reliable; [1] (e) algal bloom; blocks out light so plants die; bacteria multiply; use up oxygen; fish die; reference to eutrophication; [3] (f) (i) overall bromacil passes through soil to water; 50 m in 60 days; breaks down in all soils after 180 days/eq; enters the water; from both fields; reference to figures to show absence; [3] (ii) P – S cross and T tick; [1] (iii) (even with a larger soil barrier) bromacil entered the water/lake; do not know what damage bromacil might do to water; not worth taking the risk; [2] 3 (a) (i) advantage must be a statement amplified in candidate’s own words; [1] (ii) disadvantage must be a statement amplified in candidate’s own words; [1] (iii) disadvantage must be a statement amplified in candidate’s own words; [1] (b) (i) non polluting/oxygen not a greenhouse gas/eq/uses renewable energy; [1] (ii) in favour: could develop aluminium processing industries to create jobs; smelter creates jobs; raises standard of living; not polluting; transport by sea uses less fuel; may be able to use own bauxite later if price rises; AVP; against: too much electricity used so not enough for the country; country will not make much money/company will make most money; country needs to invest heavily for several years/other things to spend money on; AVP; MAX 4 for an argument only in favour or against [5]
What you needed in this session
Cambridge’s own grade thresholds for 2010 May/June, Paper 4 · Variant 1. A higher threshold means an easier paper — the bar moves with how the cohort did.