Cambridge IGCSE Environmental Management 0680 — 2010 May/June Paper 2 · Variant 3
0680/23/M/J/10
The question paper and its mark scheme, free to read here and free to download. This is Cambridge’s own paper, exactly as it was sat.
Question paper16 pages


Mark scheme
No mark scheme is in the library for this paper.
Paper as text
Question paper, page 1
This document consists of 14 printed pages and 2 blank pages. DC (AC/SW) 26869 © UCLES 2010 [Turn over UNIVERSITY OF CAMBRIDGE INTERNATIONAL EXAMINATIONS International General Certificate of Secondary Education READ THESE INSTRUCTIONS FIRST Write your Centre number, candidate number and name on all the work you hand in. Write in dark blue or black pen. You may use a soft pencil for any diagrams, graphs or rough working. Do not use staples, paper clips, highlighters, glue or correction fluid. DO NOT WRITE IN ANY BARCODES. Answer both questions. At the end of the examination, fasten all your work securely together. The number of marks is given in brackets [ ] at the end of each question or part question. * 7 1 2 3 4 9 7 7 0 0 * ENVIRONMENTAL MANAGEMENT 0680/23 Paper 2 May/June 2010 1 hour 45 minutes Candidates answer on the Question Paper. Additional Materials: Ruler For Examiner’s Use 1 2 Total www.XtremePapers.com
Question paper, page 2
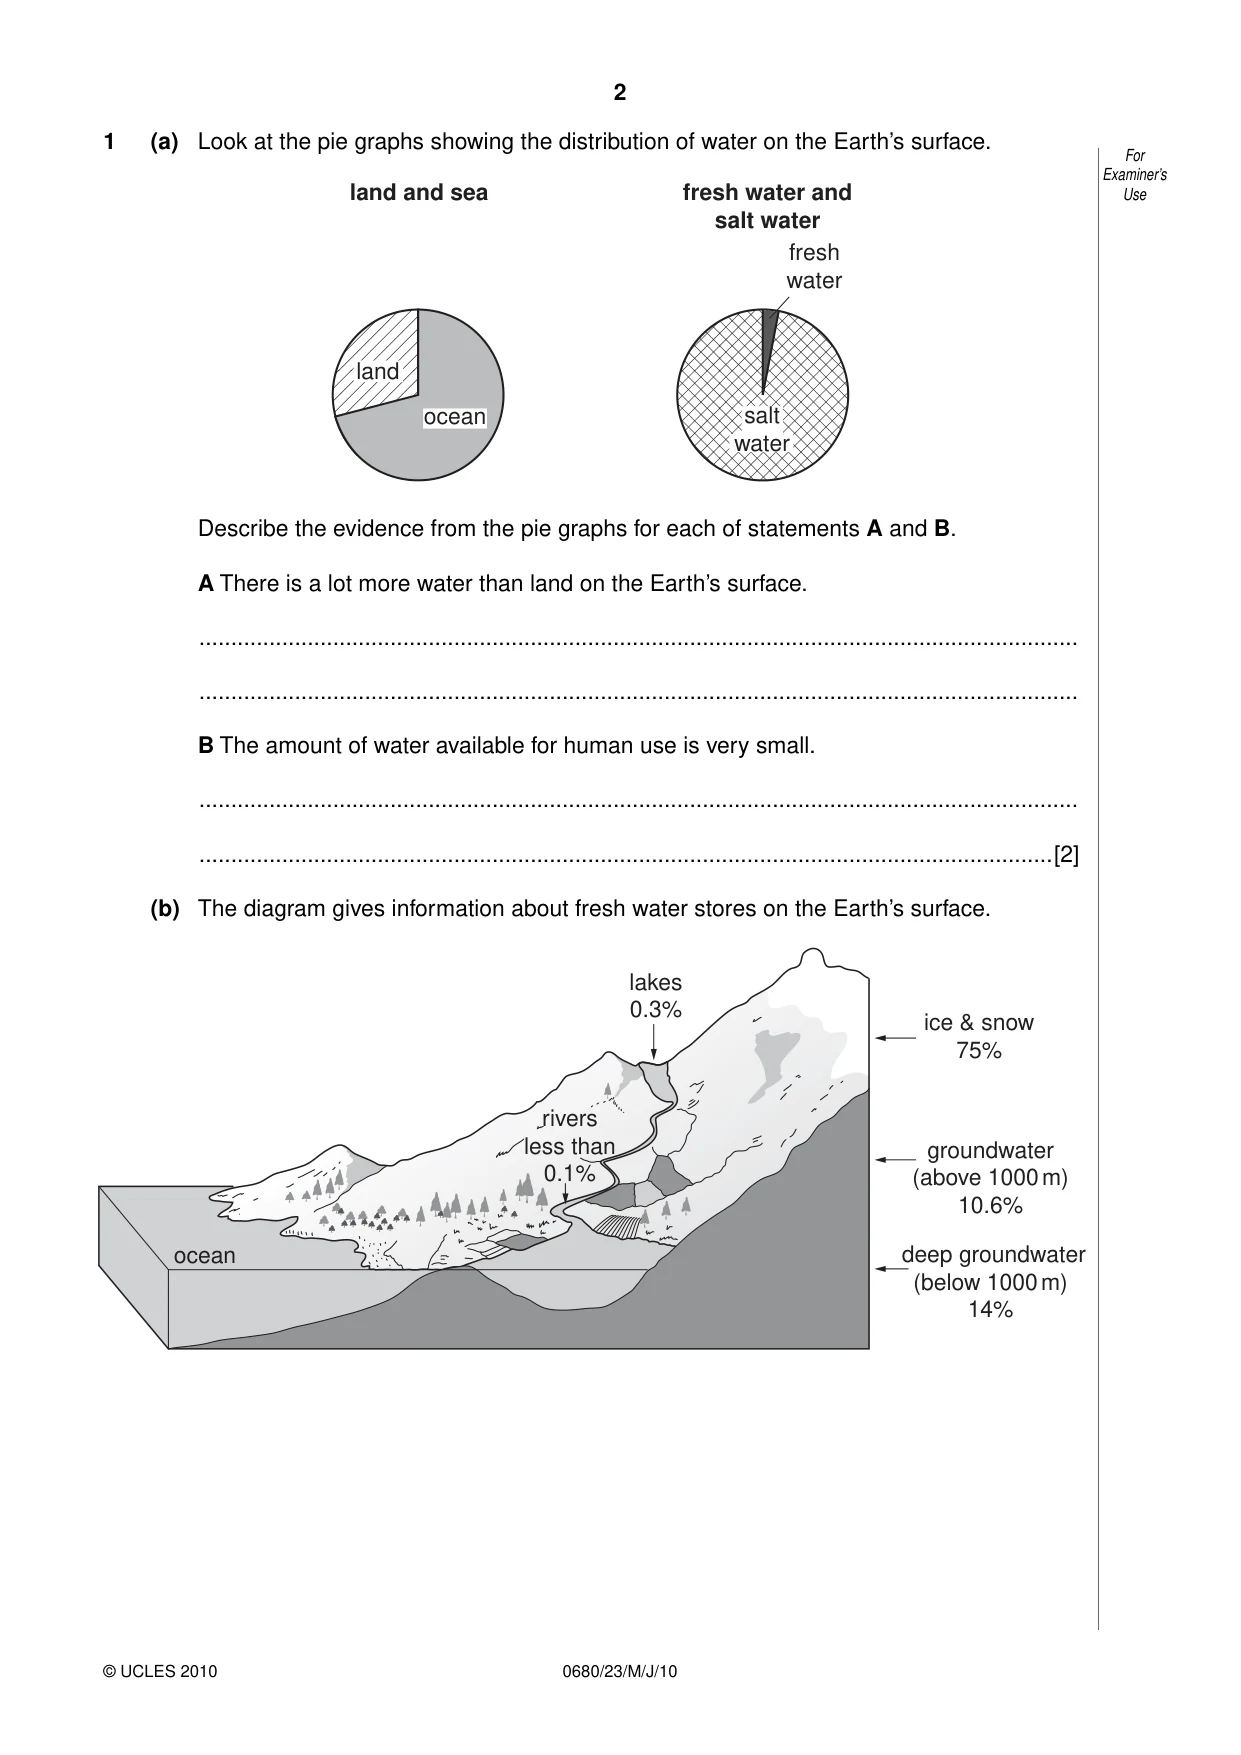
2 © UCLES 2010 For Examiner’s Use 0680/23/M/J/10 1 (a) Look at the pie graphs showing the distribution of water on the Earth’s surface. ocean land and sea fresh water and salt water salt water fresh water land Describe the evidence from the pie graphs for each of statements A and B. A There is a lot more water than land on the Earth’s surface. … … B The amount of water available for human use is very small. … …[2] (b) The diagram gives information about fresh water stores on the Earth’s surface. ice & snow 75% groundwater (above 1000 m) 10.6% lakes 0.3% rivers less than 0.1% ocean deep groundwater (below 1000 m) 14%
Question paper, page 3
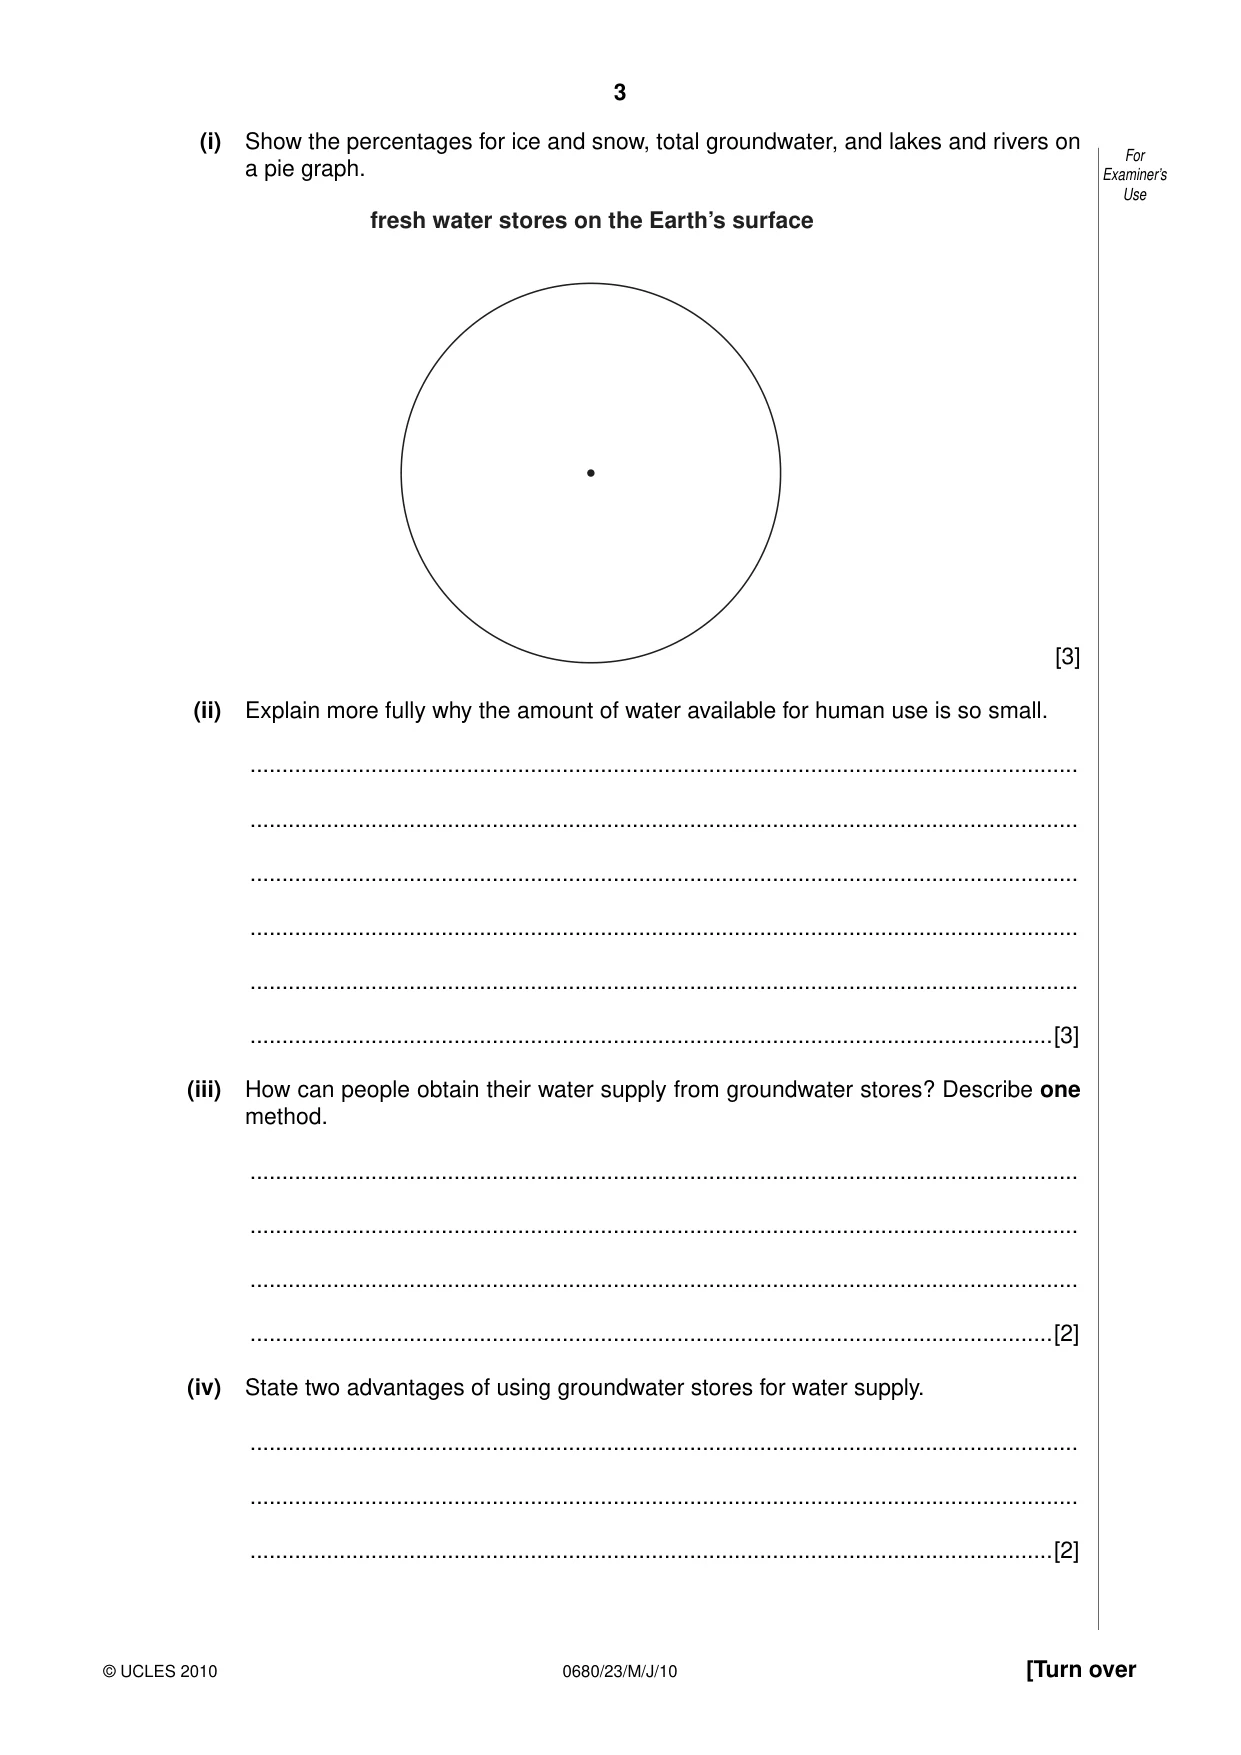
3 0680/23/M/J/10 [Turn over © UCLES 2010 For Examiner’s Use (i) Show the percentages for ice and snow, total groundwater, and lakes and rivers on a pie graph. fresh water stores on the Earth’s surface [3] (ii) Explain more fully why the amount of water available for human use is so small. … … … … … …[3] (iii) How can people obtain their water supply from groundwater stores? Describe one method. … … … …[2] (iv) State two advantages of using groundwater stores for water supply. … … …[2]
Question paper, page 4
4 0680/23/M/J/10 © UCLES 2010 For Examiner’s Use (c) In many countries large dams have been built to increase natural stores in rivers and lakes. (i) Name or state the location of an example of a large dam. …[1] (ii) Describe its advantages and explain why it was built. … … … … … …[4] (iii) Why are decisions to build large dams often controversial? Describe some of the economic, social and environmental factors which help to explain why some people object to the building of large dams. … … … … … … … … … …[5]
Question paper, page 5
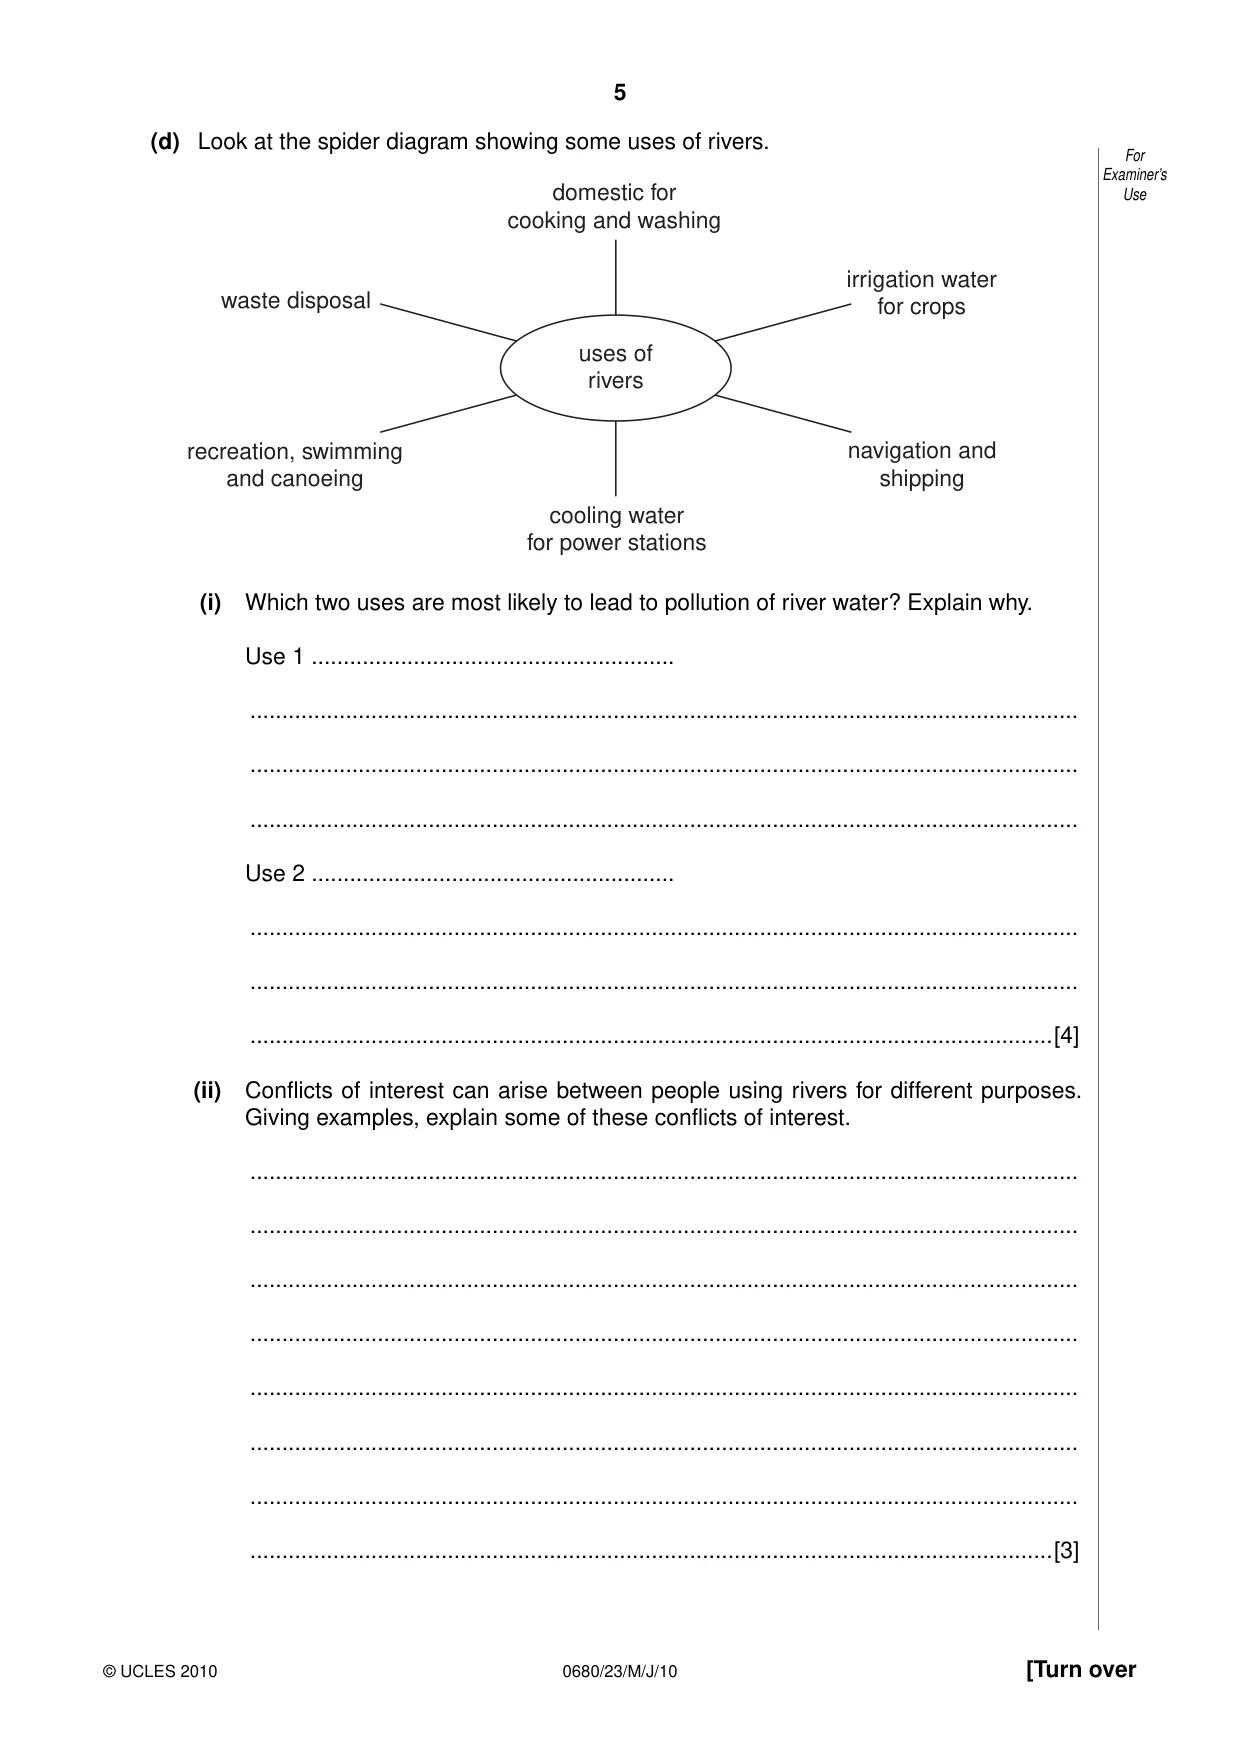
5 0680/23/M/J/10 [Turn over © UCLES 2010 For Examiner’s Use (d) Look at the spider diagram showing some uses of rivers. uses of rivers waste disposal navigation and shipping domestic for cooking and washing irrigation water for crops cooling water for power stations recreation, swimming and canoeing (i) Which two uses are most likely to lead to pollution of river water? Explain why. Use 1 … … … … Use 2 … … … …[4] (ii) Conflicts of interest can arise between people using rivers for different purposes. Giving examples, explain some of these conflicts of interest. … … … … … … … …[3]
Question paper, page 6
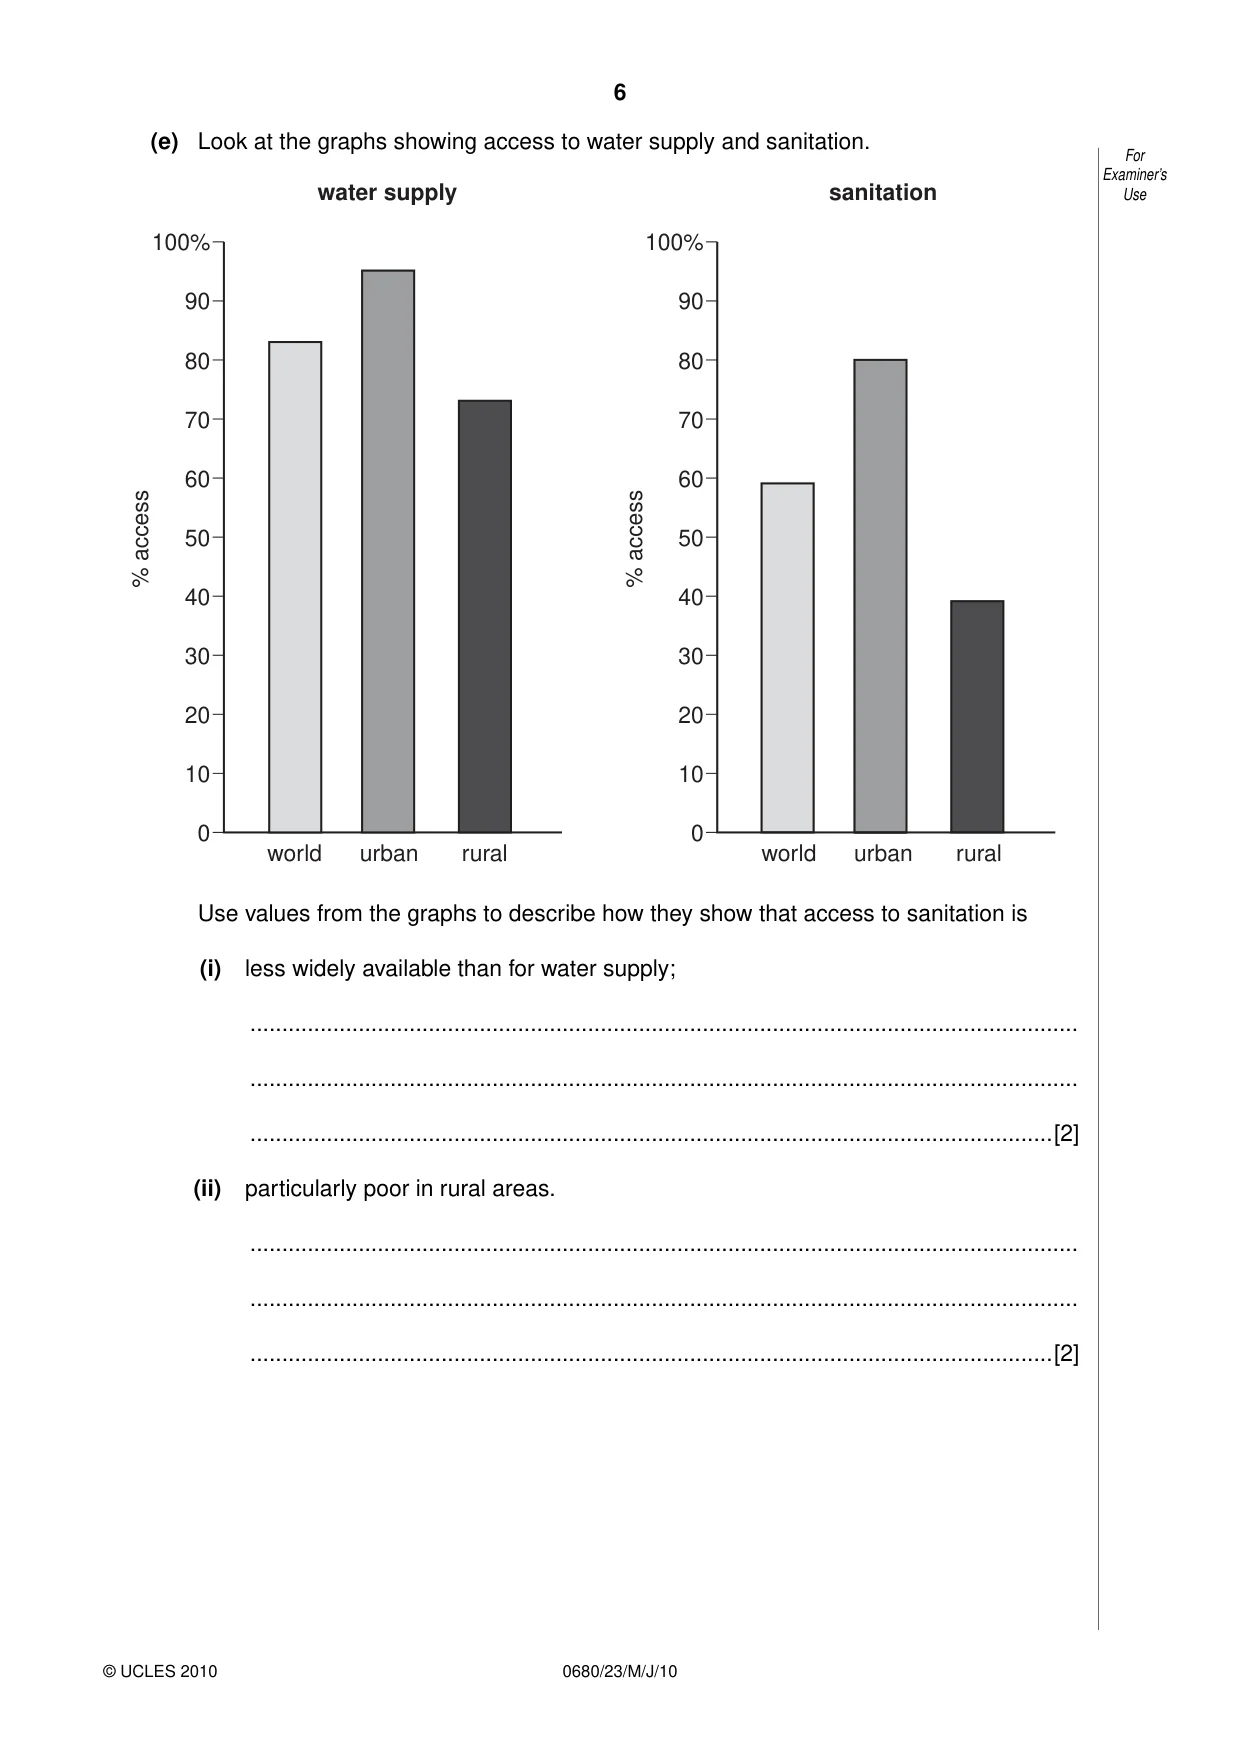
6 0680/23/M/J/10 © UCLES 2010 For Examiner’s Use (e) Look at the graphs showing access to water supply and sanitation. world 0 10 20 30 40 50 60 70 80 90 100% water supply sanitation % access 0 10 20 30 40 50 60 70 80 90 100% % access urban rural world urban rural Use values from the graphs to describe how they show that access to sanitation is (i) less widely available than for water supply; … … …[2] (ii) particularly poor in rural areas. … … …[2]
Question paper, page 7
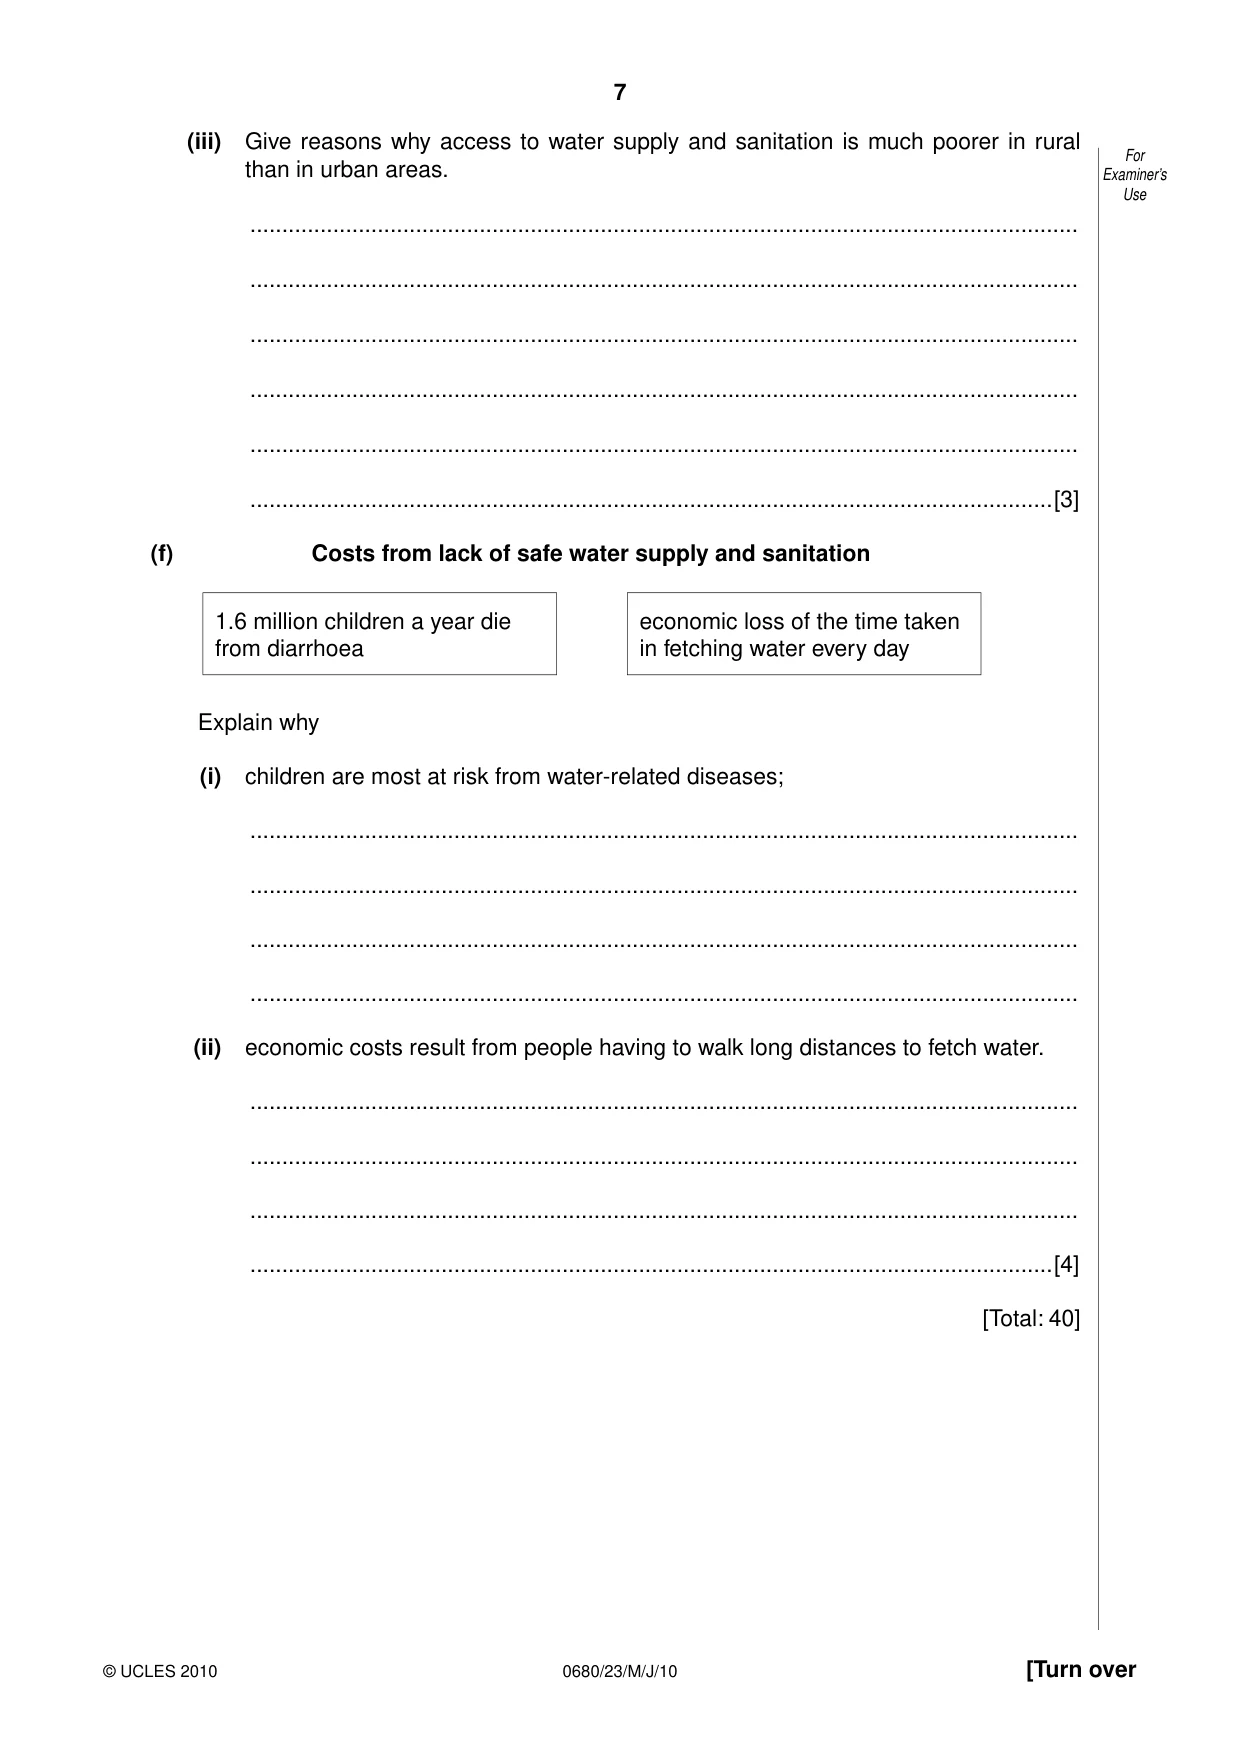
7 0680/23/M/J/10 [Turn over © UCLES 2010 For Examiner’s Use (iii) Give reasons why access to water supply and sanitation is much poorer in rural than in urban areas. … … … … … …[3] (f) Costs from lack of safe water supply and sanitation 1.6 million children a year die from diarrhoea economic loss of the time taken in fetching water every day Explain why (i) children are most at risk from water-related diseases; … … … … (ii) economic costs result from people having to walk long distances to fetch water. … … … …[4] [Total: 40]
Question paper, page 8
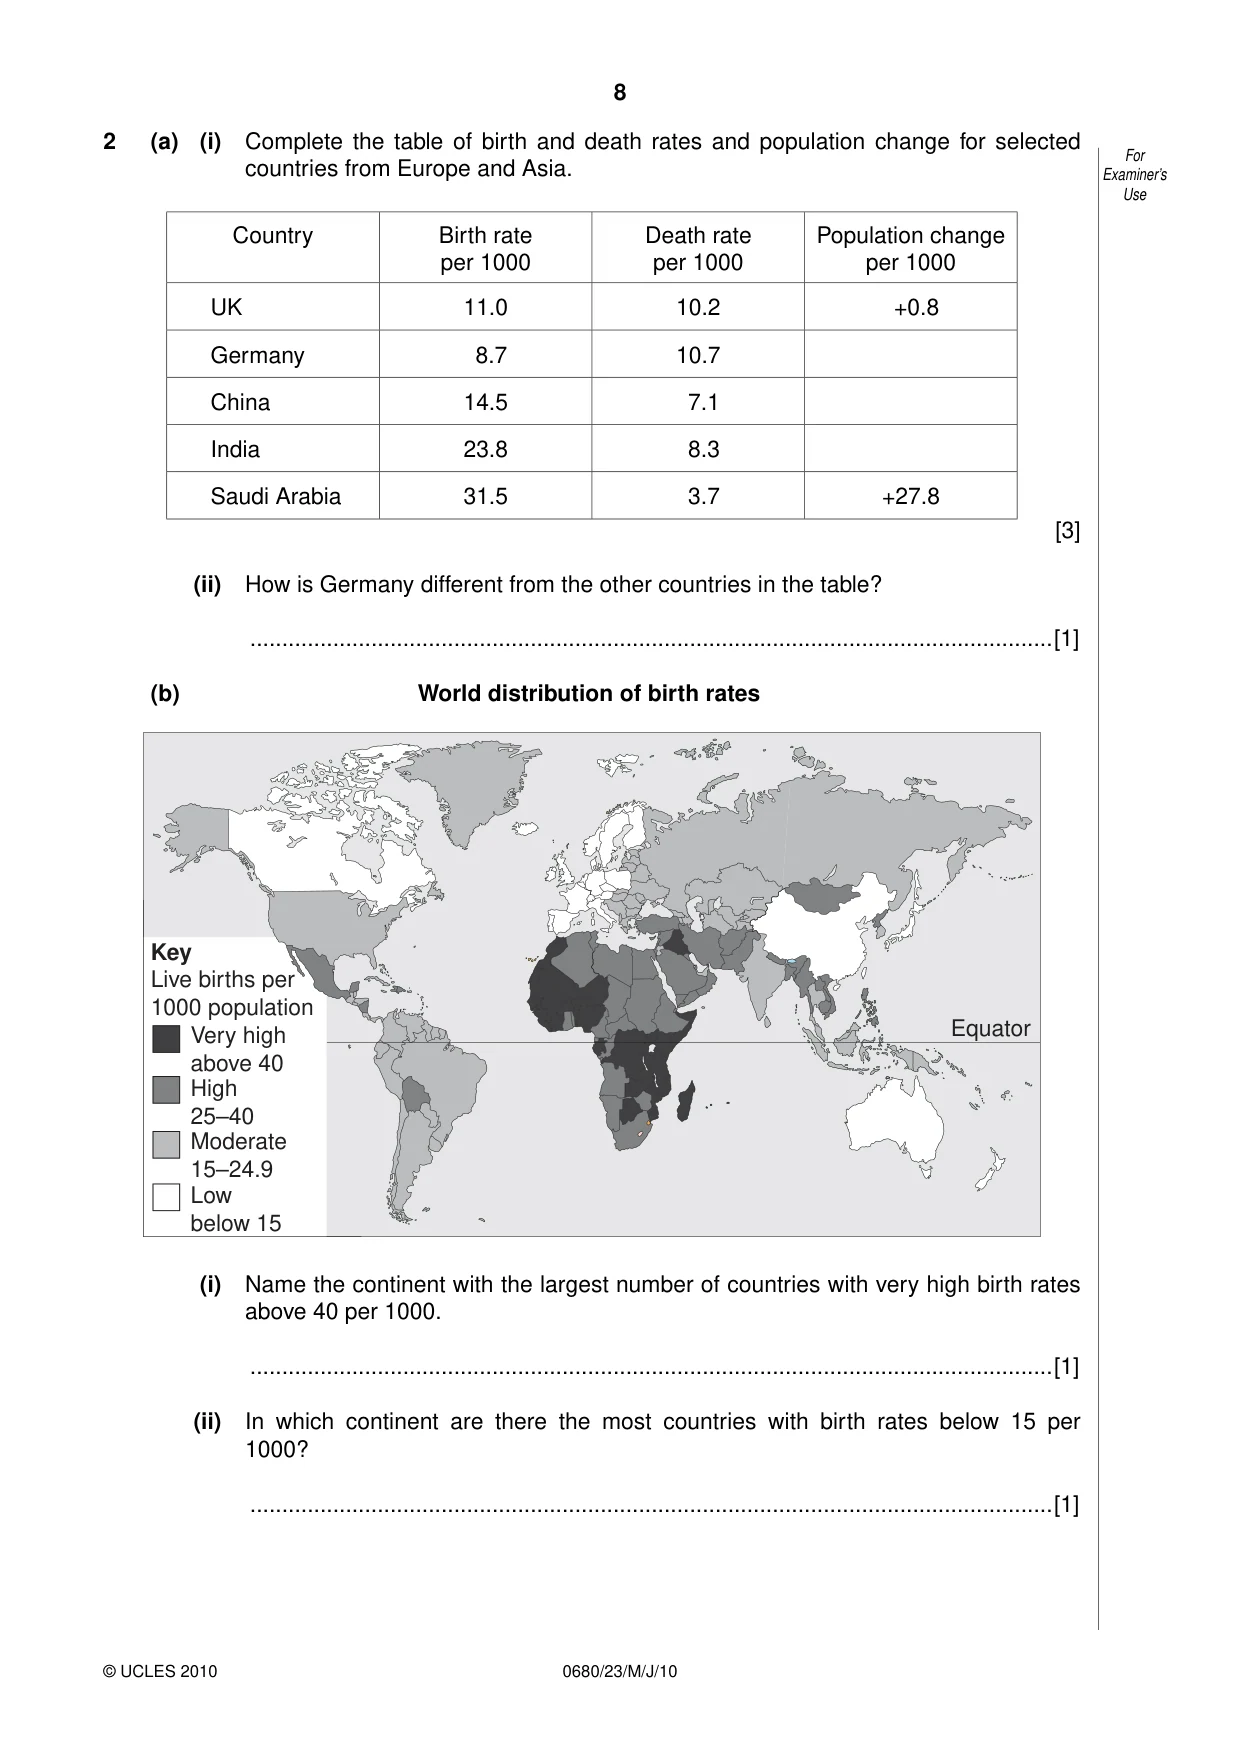
8 0680/23/M/J/10 © UCLES 2010 For Examiner’s Use 2 (a) (i) Complete the table of birth and death rates and population change for selected countries from Europe and Asia. Country Birth rate per 1000 Death rate per 1000 Population change per 1000 UK 11.0 10.2 +0.8 Germany 8.7 10.7 China 14.5 7.1 India 23.8 8.3 Saudi Arabia 31.5 3.7 +27.8 [3] (ii) How is Germany different from the other countries in the table? …[1] (b) World distribution of birth rates Equator Very high above 40 High 25–40 Moderate 15–24.9 Low below 15 Live births per 1000 population Key (i) Name the continent with the largest number of countries with very high birth rates above 40 per 1000. …[1] (ii) In which continent are there the most countries with birth rates below 15 per 1000? …[1]
Question paper, page 9
9 0680/23/M/J/10 [Turn over © UCLES 2010 For Examiner’s Use (iii) Describe the distribution of countries with high and very high birth rates above 25 per 1000. … … … … …[3] (iv) Give reasons why some countries have very low birth rates, below 15 per 1000. … … … … … … … …[4]
Question paper, page 10
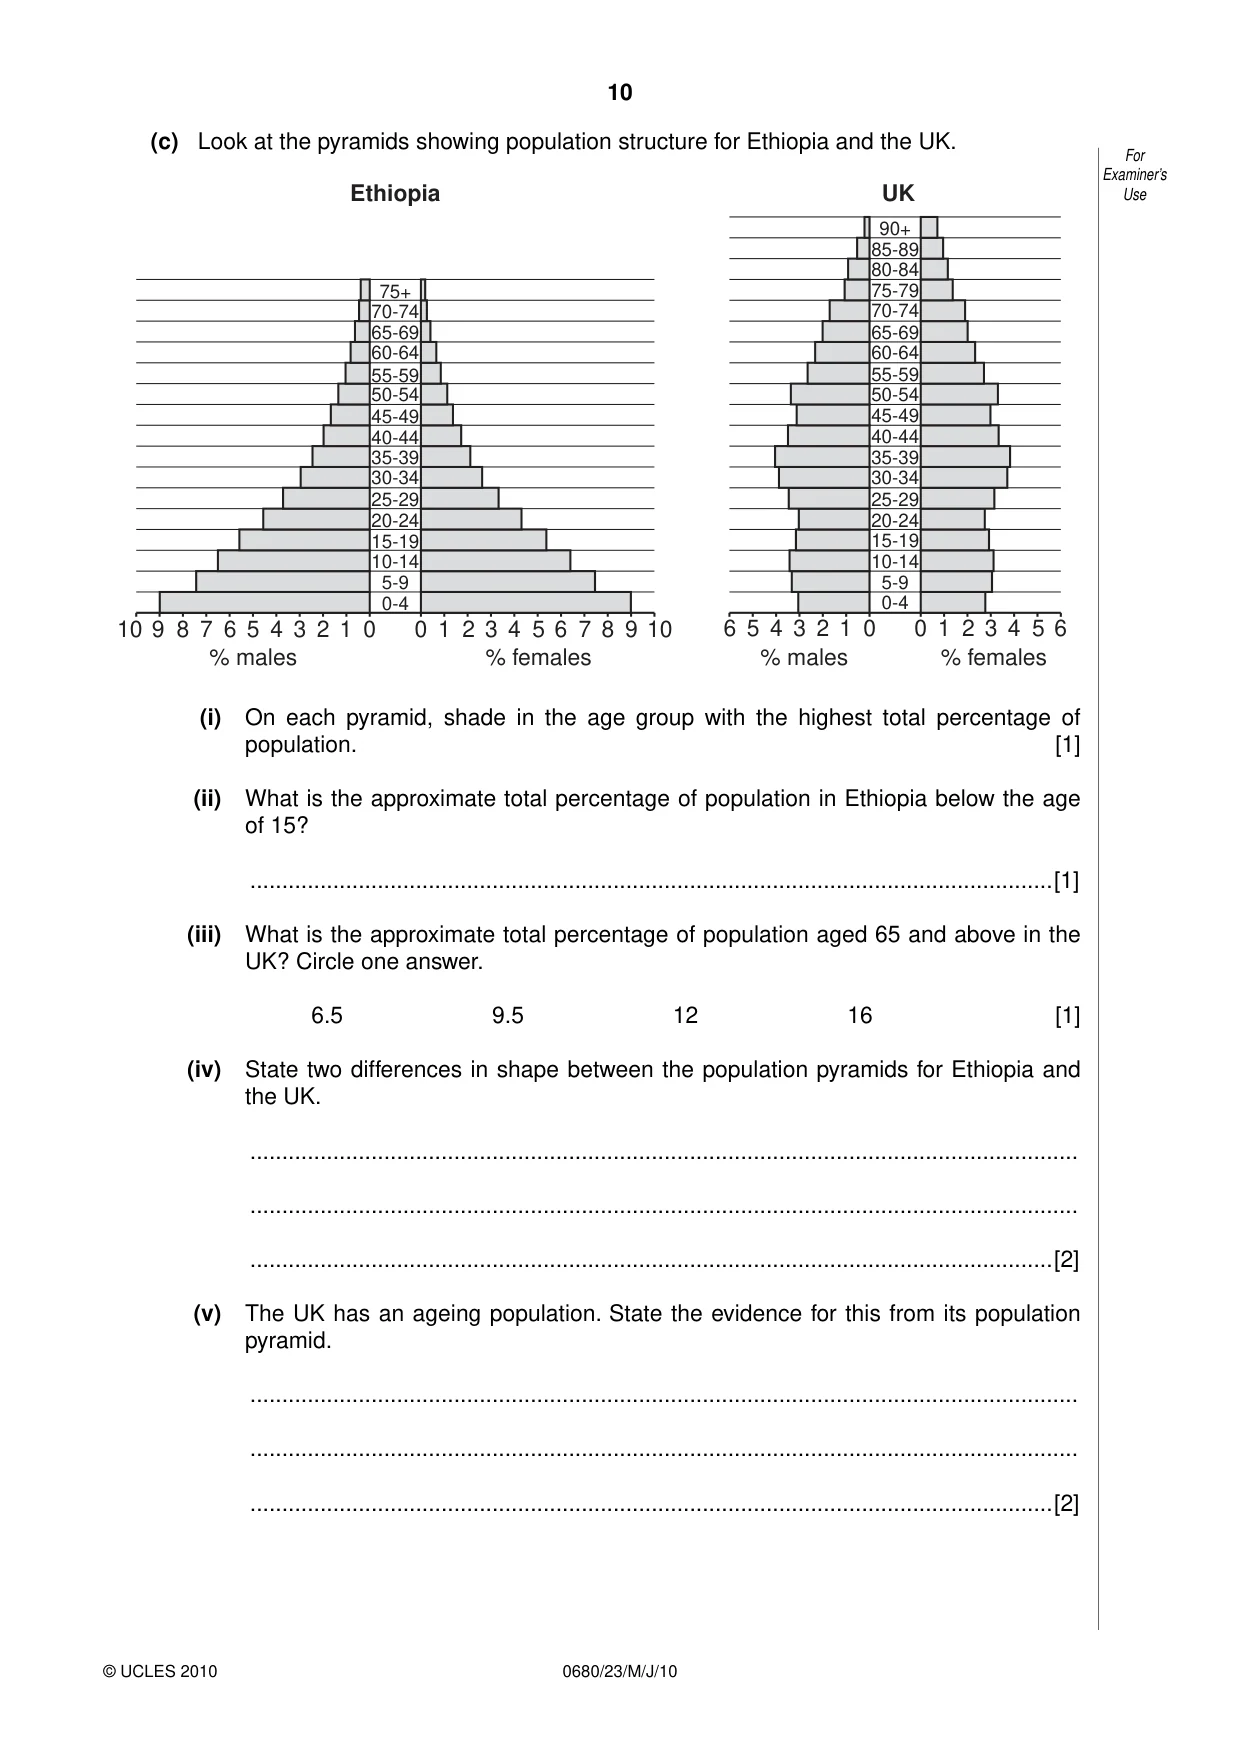
10 0680/23/M/J/10 © UCLES 2010 For Examiner’s Use (c) Look at the pyramids showing population structure for Ethiopia and the UK. 0-4 10 9 8 7 6 5 4 3 2 1 0 0 1 2 3 4 5 % males % females % males % females 6 7 8 9 10 5-9 10-14 15-19 20-24 25-29 30-34 35-39 40-44 45-49 50-54 55-59 60-64 65-69 70-74 75+ Ethiopia UK 6 5 4 3 2 1 0 0 1 2 3 4 5 6 0-4 5-9 10-14 15-19 20-24 25-29 30-34 35-39 40-44 45-49 50-54 55-59 60-64 65-69 70-74 75-79 90+ 85-89 80-84 (i) On each pyramid, shade in the age group with the highest total percentage of population. [1] (ii) What is the approximate total percentage of population in Ethiopia below the age of 15? …[1] (iii) What is the approximate total percentage of population aged 65 and above in the UK? Circle one answer. 6.5 9.5 12 16 [1] (iv) State two differences in shape between the population pyramids for Ethiopia and the UK. … … …[2] (v) The UK has an ageing population. State the evidence for this from its population pyramid. … … …[2]
Question paper, page 11
11 0680/23/M/J/10 [Turn over © UCLES 2010 For Examiner’s Use (vi) Some countries like Ethiopia have a young population; others like the UK have an ageing population. Their population problems are different. Explain how and why their problems are different. … … … … … … … …[4]
Question paper, page 12
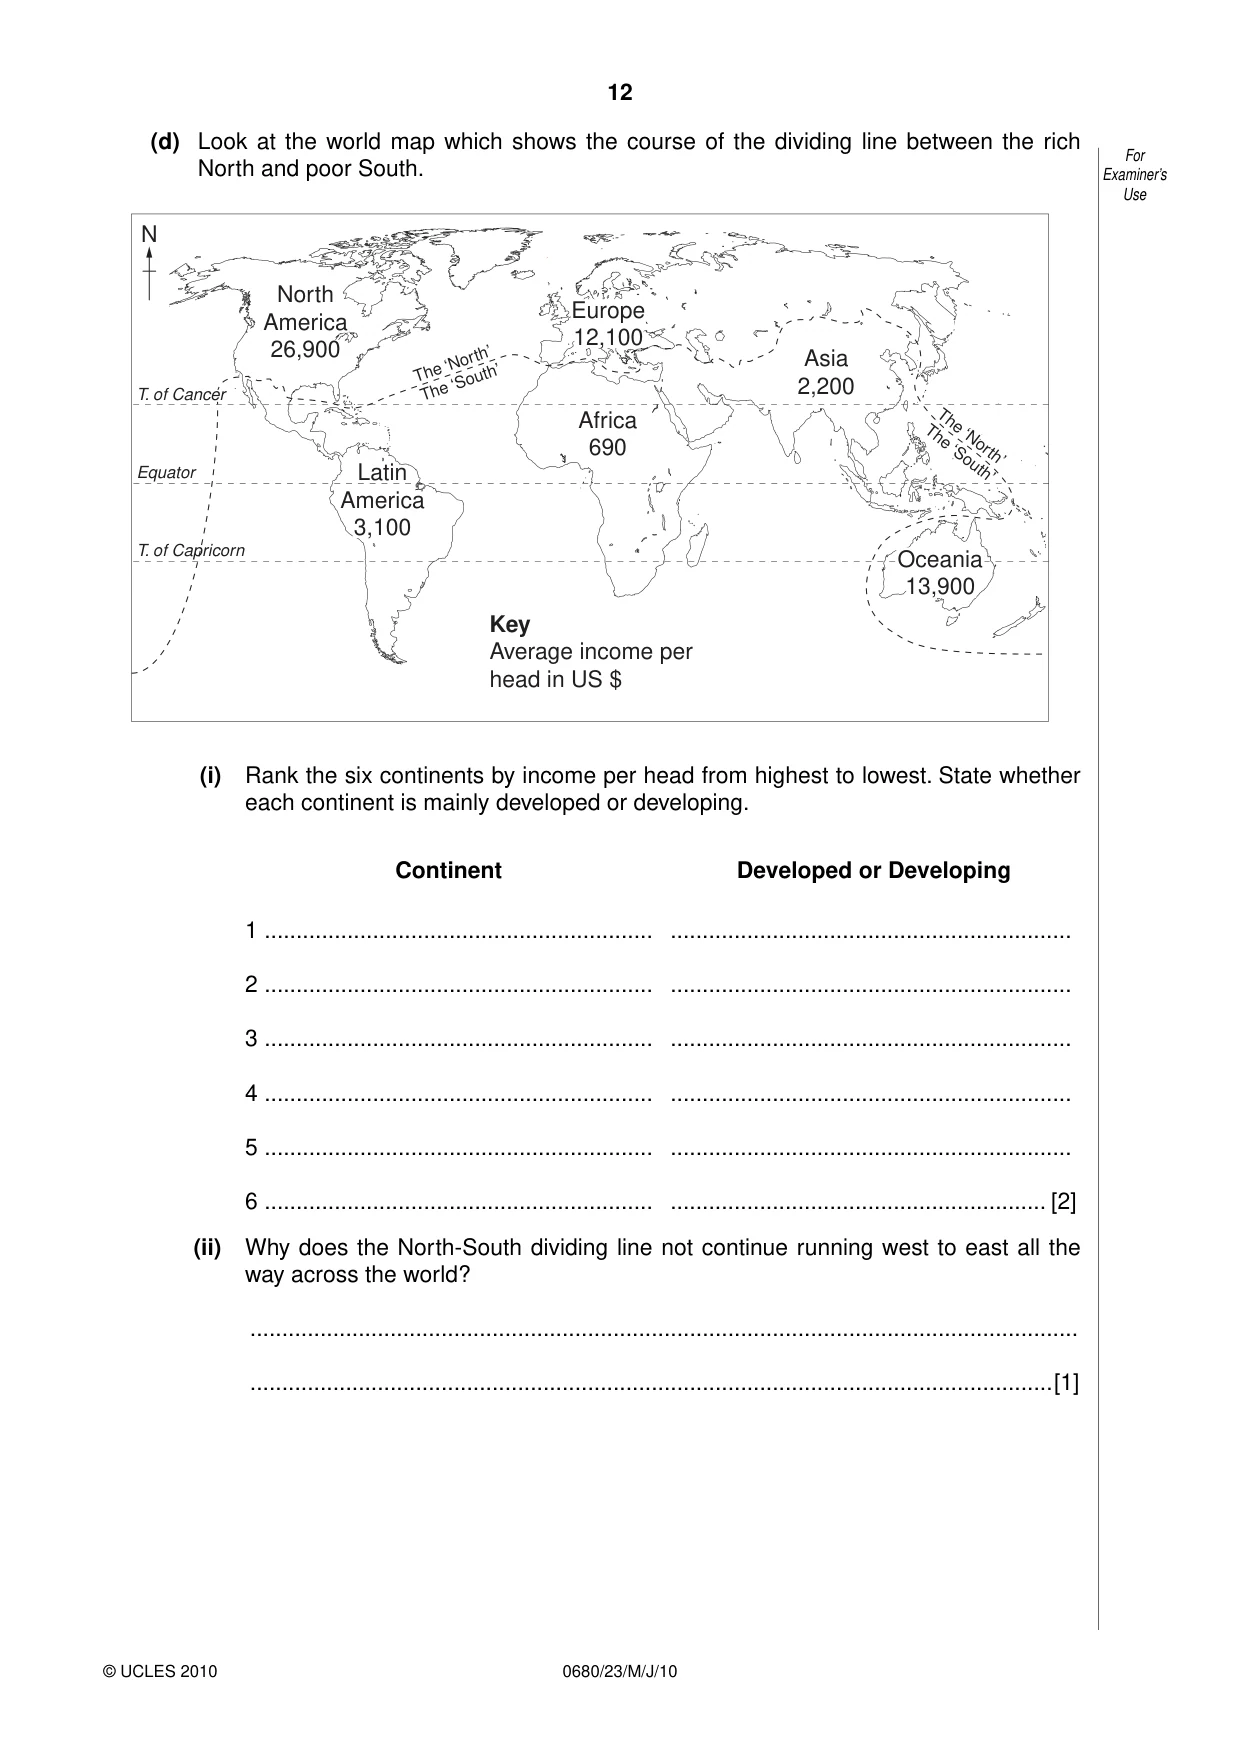
12 0680/23/M/J/10 © UCLES 2010 For Examiner’s Use (d) Look at the world map which shows the course of the dividing line between the rich North and poor South. North America 26,900 N Latin America 3,100 Africa 690 Europe 12,100 Asia 2,200 Oceania 13,900 Key Average income per head in US $ The ‘North’ The ‘South’ The ‘North’ The ‘South’ Equator T. of Capricorn T. of Cancer (i) Rank the six continents by income per head from highest to lowest. State whether each continent is mainly developed or developing. Continent Developed or Developing 1 … 2 … 3 … 4 … 5 … 6 … … … … … … … [2] (ii) Why does the North-South dividing line not continue running west to east all the way across the world? … …[1]
Question paper, page 13
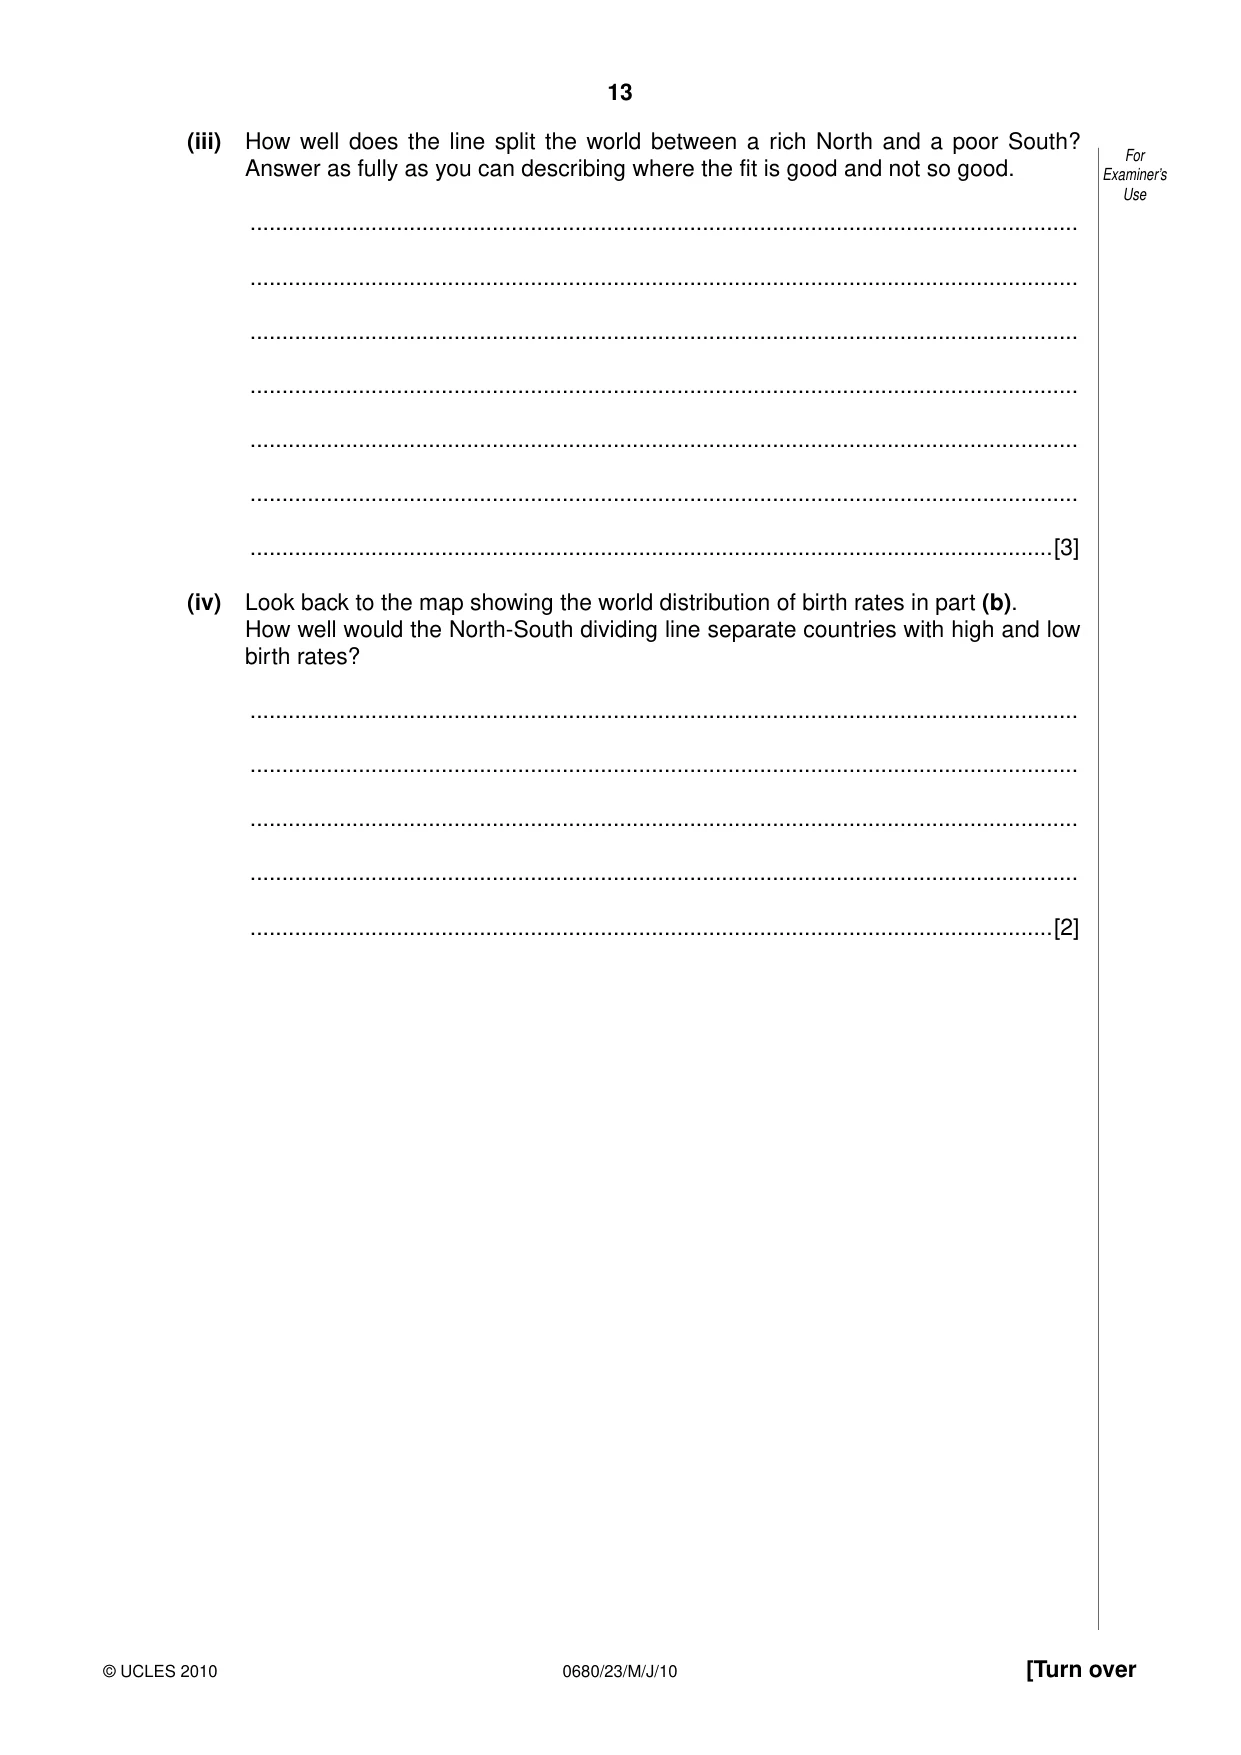
13 0680/23/M/J/10 [Turn over © UCLES 2010 For Examiner’s Use (iii) How well does the line split the world between a rich North and a poor South? Answer as fully as you can describing where the fit is good and not so good. … … … … … … …[3] (iv) Look back to the map showing the world distribution of birth rates in part (b). How well would the North-South dividing line separate countries with high and low birth rates? … … … … …[2]
Question paper, page 14
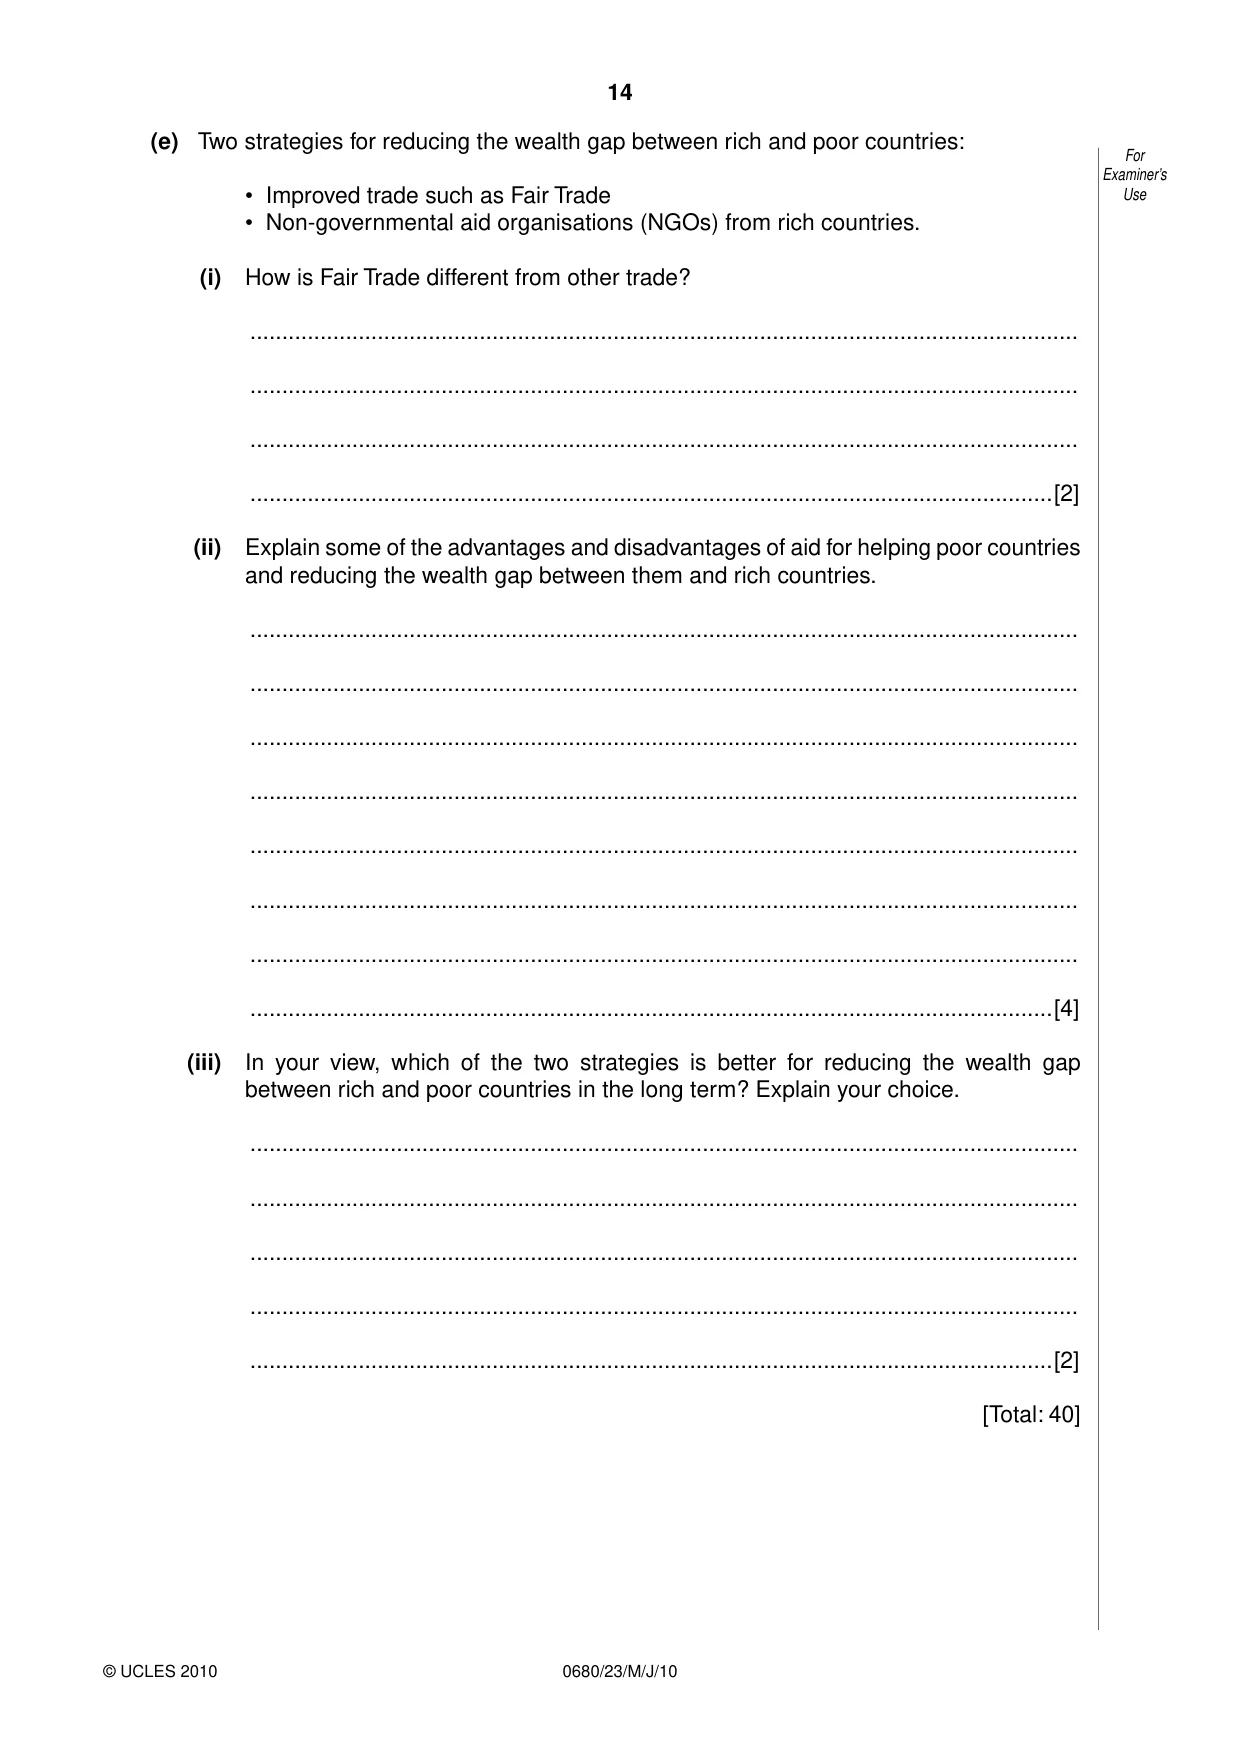
14 0680/23/M/J/10 © UCLES 2010 For Examiner’s Use (e) Two strategies for reducing the wealth gap between rich and poor countries: • Improved trade such as Fair Trade • Non-governmental aid organisations (NGOs) from rich countries. (i) How is Fair Trade different from other trade? … … … …[2] (ii) Explain some of the advantages and disadvantages of aid for helping poor countries and reducing the wealth gap between them and rich countries. … … … … … … … …[4] (iii) In your view, which of the two strategies is better for reducing the wealth gap between rich and poor countries in the long term? Explain your choice. … … … … …[2] [Total: 40]
Question paper, page 15
15 0680/23/M/J/10 © UCLES 2010 BLANK PAGE
Question paper, page 16
16 0680/23/M/J/10 © UCLES 2010 BLANK PAGE Permission to reproduce items where third-party owned material protected by copyright is included has been sought and cleared where possible. Every reasonable effort has been made by the publisher (UCLES) to trace copyright holders, but if any items requiring clearance have unwittingly been included, the publisher will be pleased to make amends at the earliest possible opportunity. University of Cambridge International Examinations is part of the Cambridge Assessment Group. Cambridge Assessment is the brand name of University of Cambridge Local Examinations Syndicate (UCLES), which is itself a department of the University of Cambridge.