Cambridge IGCSE Environmental Management 0680 — 2010 May/June Paper 2 · Variant 1
0680/21/M/J/10 · 80 marks · ≈90 min
The question paper and its mark scheme, free to read here and free to download. This is Cambridge’s own paper, exactly as it was sat.
Question paper16 pages


Mark scheme7 pages
Answers below. Sit the paper first if you are practising.
Paper as text
Question paper, page 1
This document consists of 14 printed pages and 2 blank pages. DC (CW/JG) 15091/5 © UCLES 2010 [Turn over UNIVERSITY OF CAMBRIDGE INTERNATIONAL EXAMINATIONS International General Certificate of Secondary Education READ THESE INSTRUCTIONS FIRST Write your Centre number, candidate number and name on all the work you hand in. Write in dark blue or black pen. You may use a soft pencil for any diagrams, graphs or rough working. Do not use staples, paper clips, highlighters, glue or correction fluid. DO NOT WRITE IN ANY BARCODES. Answer both questions. At the end of the examination, fasten all your work securely together. The number of marks is given in brackets [ ] at the end of each question or part question. * 3 5 1 6 1 0 7 4 0 2 * ENVIRONMENTAL MANAGEMENT 0680/21 Paper 2 May/June 2010 1 hour 45 minutes Candidates answer on the Question Paper. Additional Materials: Ruler For Examiner’s Use 1 2 Total www.XtremePapers.com
Question paper, page 2
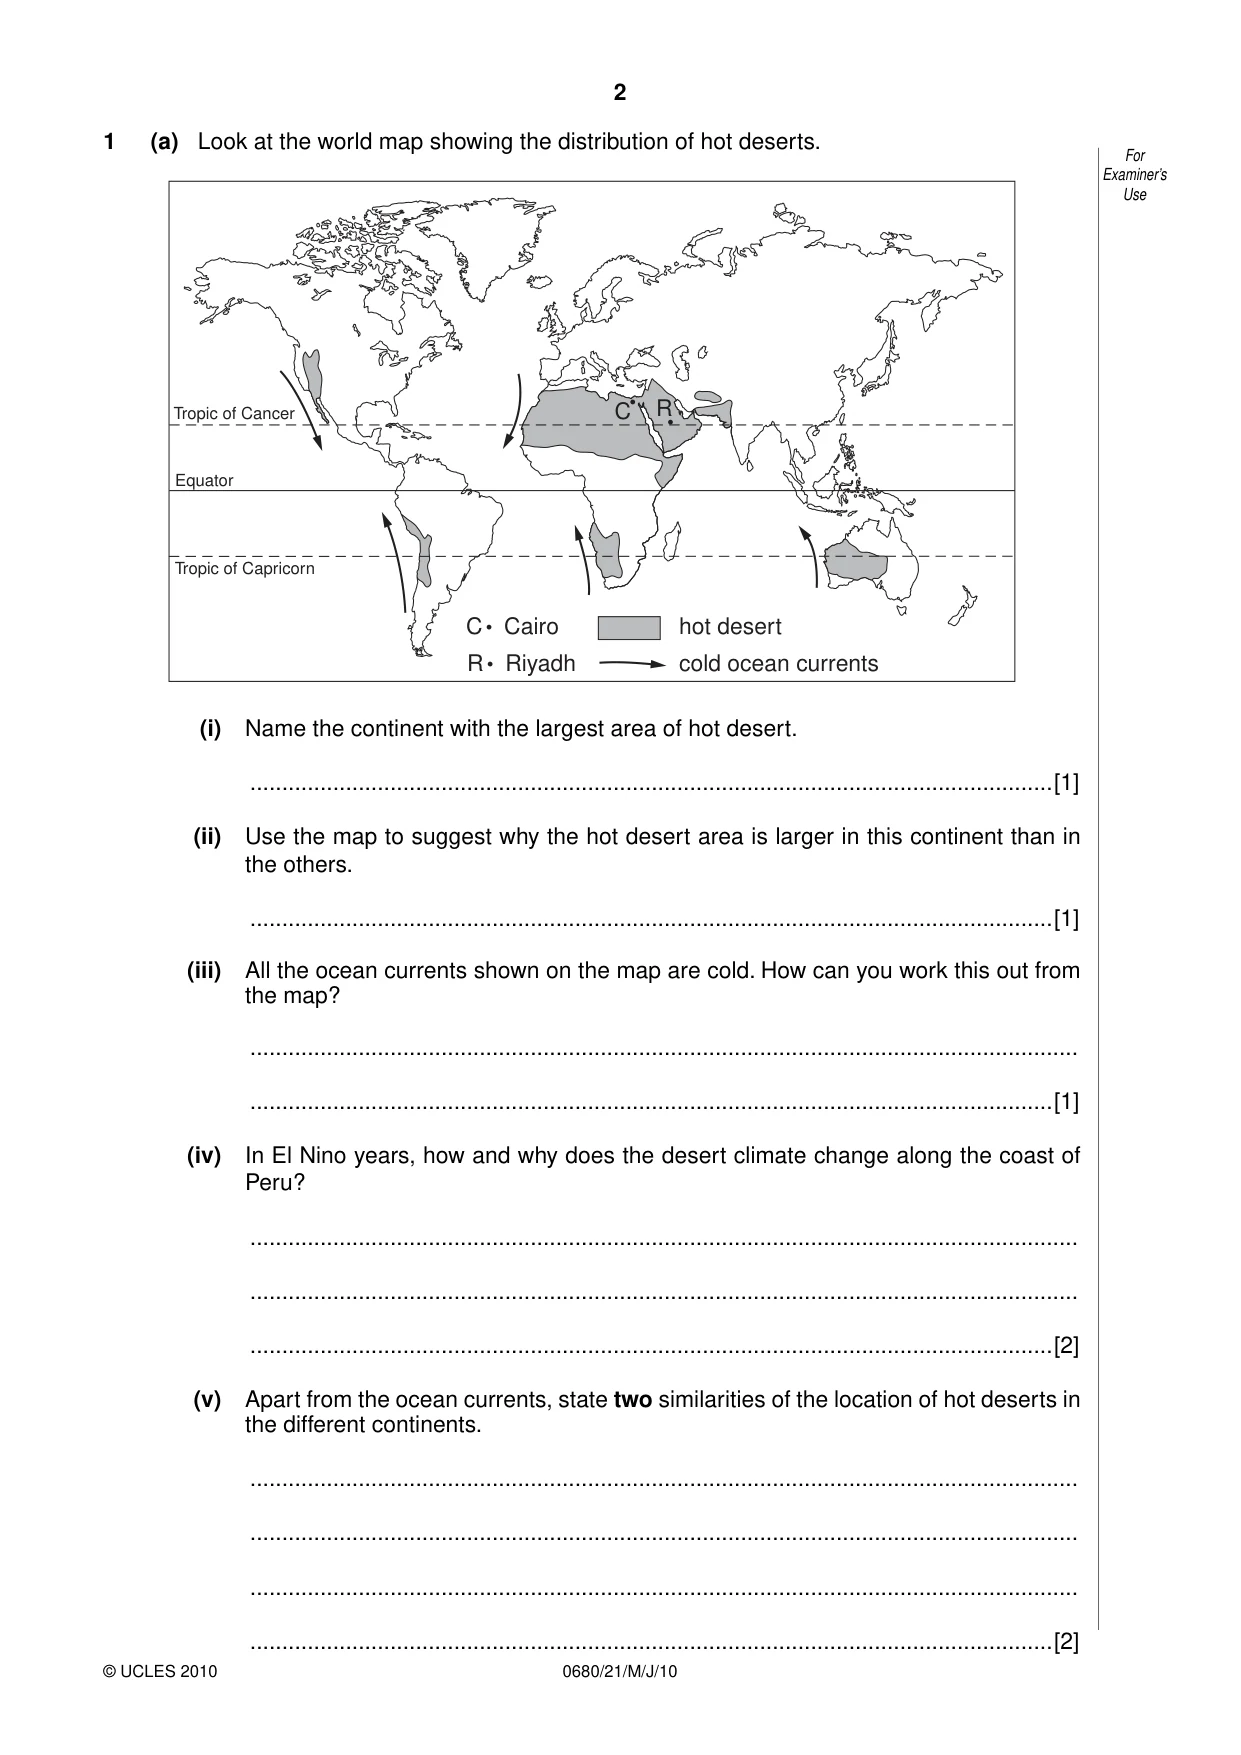
2 0680/21/M/J/10 © UCLES 2010 For Examiner’s Use 1 (a) Look at the world map showing the distribution of hot deserts. hot desert cold ocean currents Equator Tropic of Capricorn Tropic of Cancer C C R R Cairo Riyadh (i) Name the continent with the largest area of hot desert. …[1] (ii) Use the map to suggest why the hot desert area is larger in this continent than in the others. …[1] (iii) All the ocean currents shown on the map are cold. How can you work this out from the map? … …[1] (iv) In El Nino years, how and why does the desert climate change along the coast of Peru? … … …[2] (v) Apart from the ocean currents, state two similarities of the location of hot deserts in the different continents. … … … …[2]
Question paper, page 3
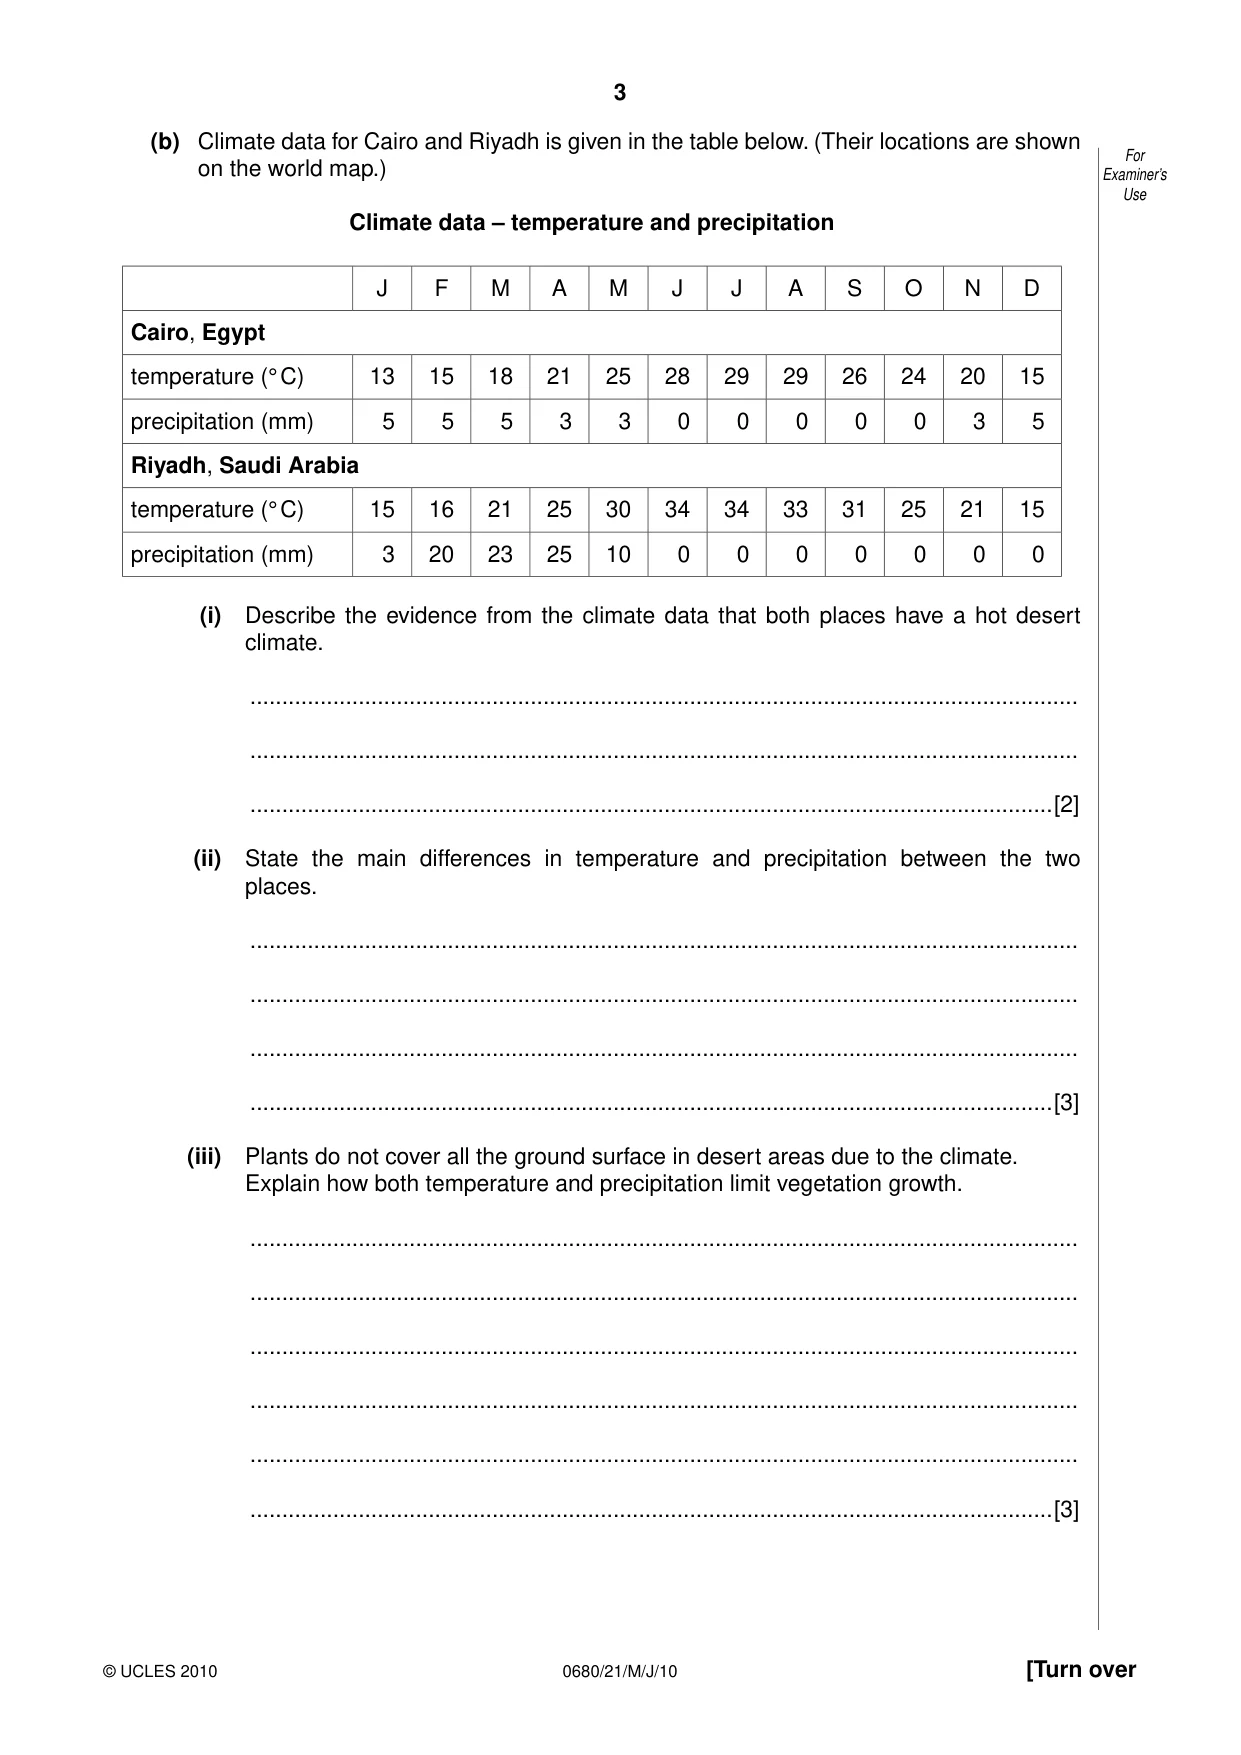
3 0680/21/M/J/10 [Turn over © UCLES 2010 For Examiner’s Use (b) Climate data for Cairo and Riyadh is given in the table below. (Their locations are shown on the world map.) Climate data – temperature and precipitation J F M A M J J A S O N D Cairo, Egypt temperature (° C) 13 15 18 21 25 28 29 29 26 24 20 15 precipitation (mm) 5 5 5 3 3 0 0 0 0 0 3 5 Riyadh, Saudi Arabia temperature (° C) 15 16 21 25 30 34 34 33 31 25 21 15 precipitation (mm) 3 20 23 25 10 0 0 0 0 0 0 0 (i) Describe the evidence from the climate data that both places have a hot desert climate. … … …[2] (ii) State the main differences in temperature and precipitation between the two places. … … … …[3] (iii) Plants do not cover all the ground surface in desert areas due to the climate. Explain how both temperature and precipitation limit vegetation growth. … … … … … …[3]
Question paper, page 4
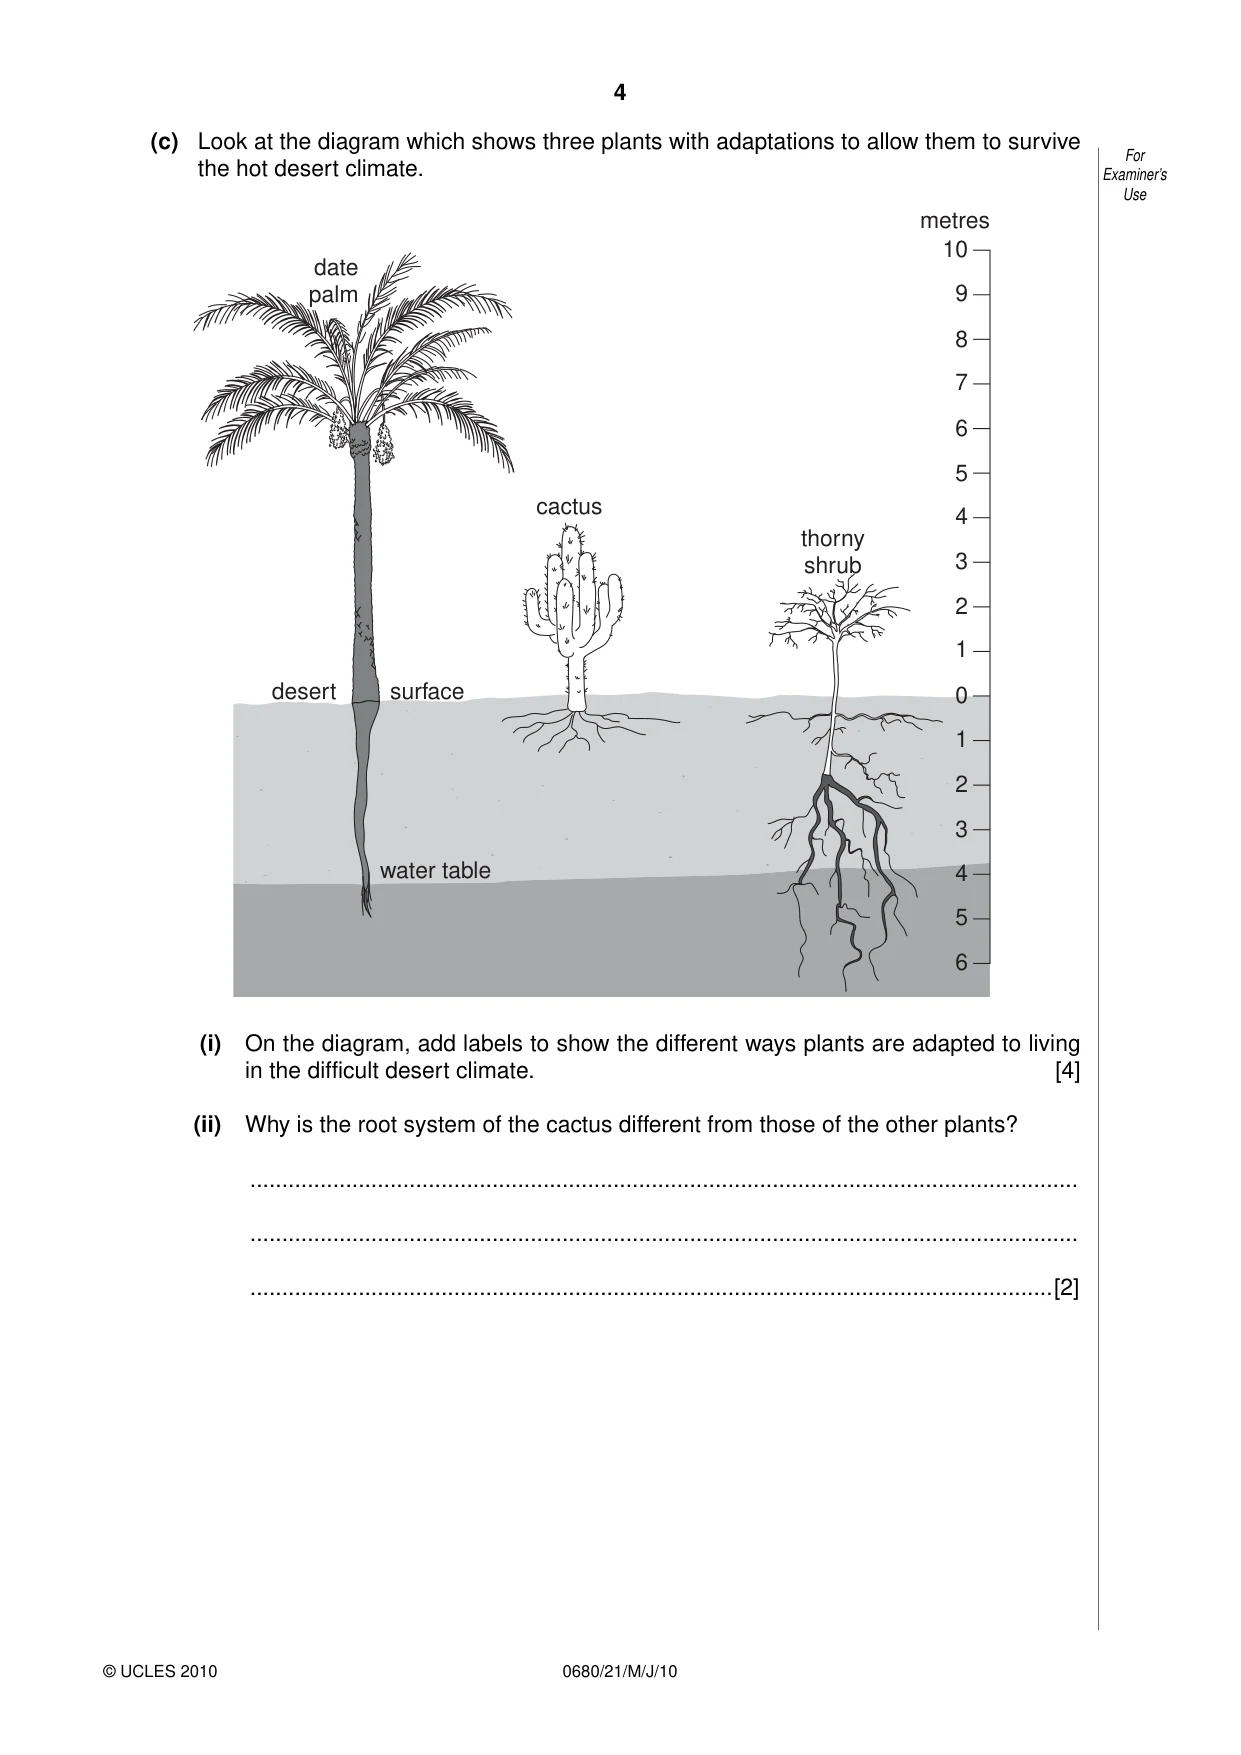
4 0680/21/M/J/10 © UCLES 2010 For Examiner’s Use (c) Look at the diagram which shows three plants with adaptations to allow them to survive the hot desert climate. 6 5 4 3 2 1 0 1 2 3 4 5 6 7 8 9 10 water table date palm cactus thorny shrub metres desert surface (i) On the diagram, add labels to show the different ways plants are adapted to living in the difficult desert climate. [4] (ii) Why is the root system of the cactus different from those of the other plants? … … …[2]
Question paper, page 5
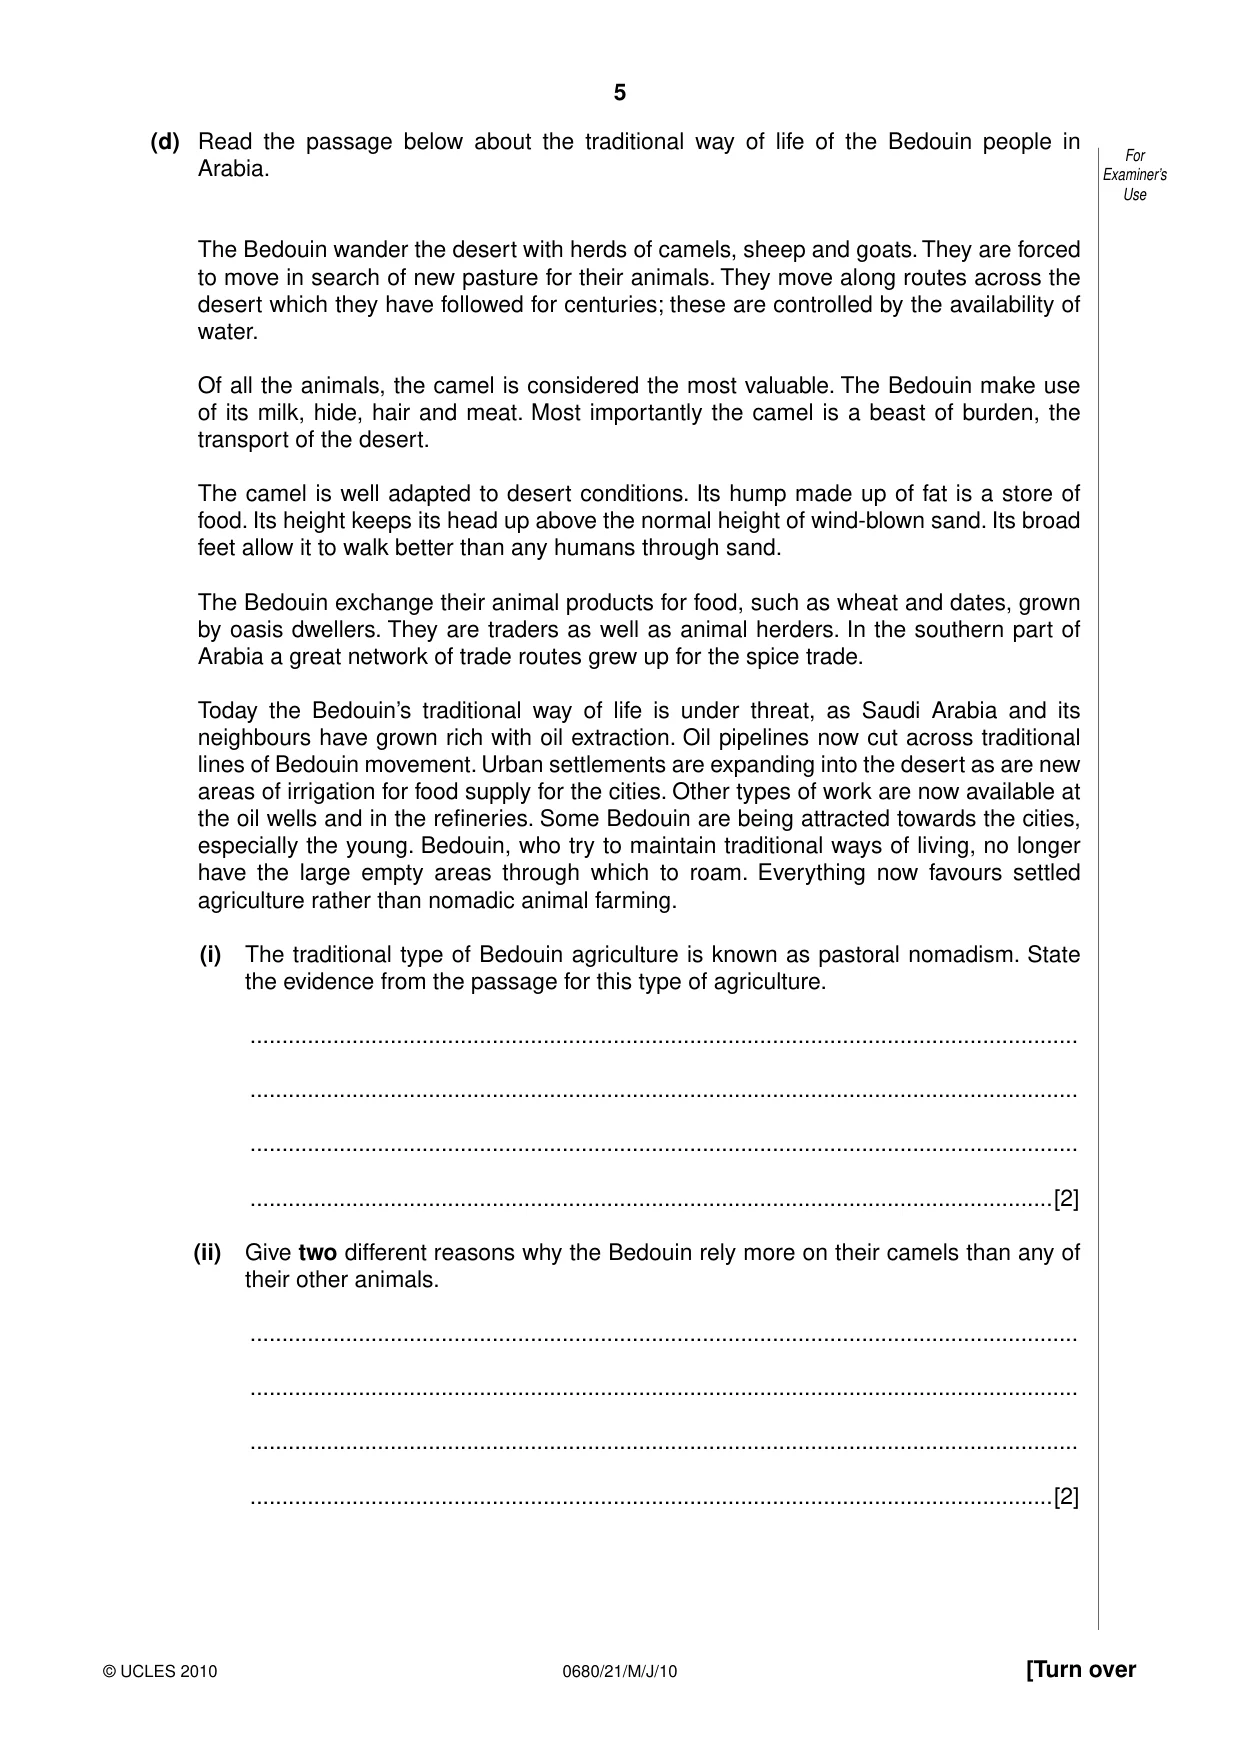
5 0680/21/M/J/10 [Turn over © UCLES 2010 For Examiner’s Use (d) Read the passage below about the traditional way of life of the Bedouin people in Arabia. The Bedouin wander the desert with herds of camels, sheep and goats. They are forced to move in search of new pasture for their animals. They move along routes across the desert which they have followed for centuries; these are controlled by the availability of water. Of all the animals, the camel is considered the most valuable. The Bedouin make use of its milk, hide, hair and meat. Most importantly the camel is a beast of burden, the transport of the desert. The camel is well adapted to desert conditions. Its hump made up of fat is a store of food. Its height keeps its head up above the normal height of wind-blown sand. Its broad feet allow it to walk better than any humans through sand. The Bedouin exchange their animal products for food, such as wheat and dates, grown by oasis dwellers. They are traders as well as animal herders. In the southern part of Arabia a great network of trade routes grew up for the spice trade. Today the Bedouin’s traditional way of life is under threat, as Saudi Arabia and its neighbours have grown rich with oil extraction. Oil pipelines now cut across traditional lines of Bedouin movement. Urban settlements are expanding into the desert as are new areas of irrigation for food supply for the cities. Other types of work are now available at the oil wells and in the refineries. Some Bedouin are being attracted towards the cities, especially the young. Bedouin, who try to maintain traditional ways of living, no longer have the large empty areas through which to roam. Everything now favours settled agriculture rather than nomadic animal farming. (i) The traditional type of Bedouin agriculture is known as pastoral nomadism. State the evidence from the passage for this type of agriculture. … … … …[2] (ii) Give two different reasons why the Bedouin rely more on their camels than any of their other animals. … … … …[2]
Question paper, page 6
6 0680/21/M/J/10 © UCLES 2010 For Examiner’s Use (iii) The traditional Bedouin way of life was an example of sustainable living. Explain how and why. … … … … …[3] (iv) Changes are now taking place in Arabia resulting from the discovery and extraction of oil. Describe some of the economic and likely social effects on the Bedouin people. … … … … … … … …[4]
Question paper, page 7
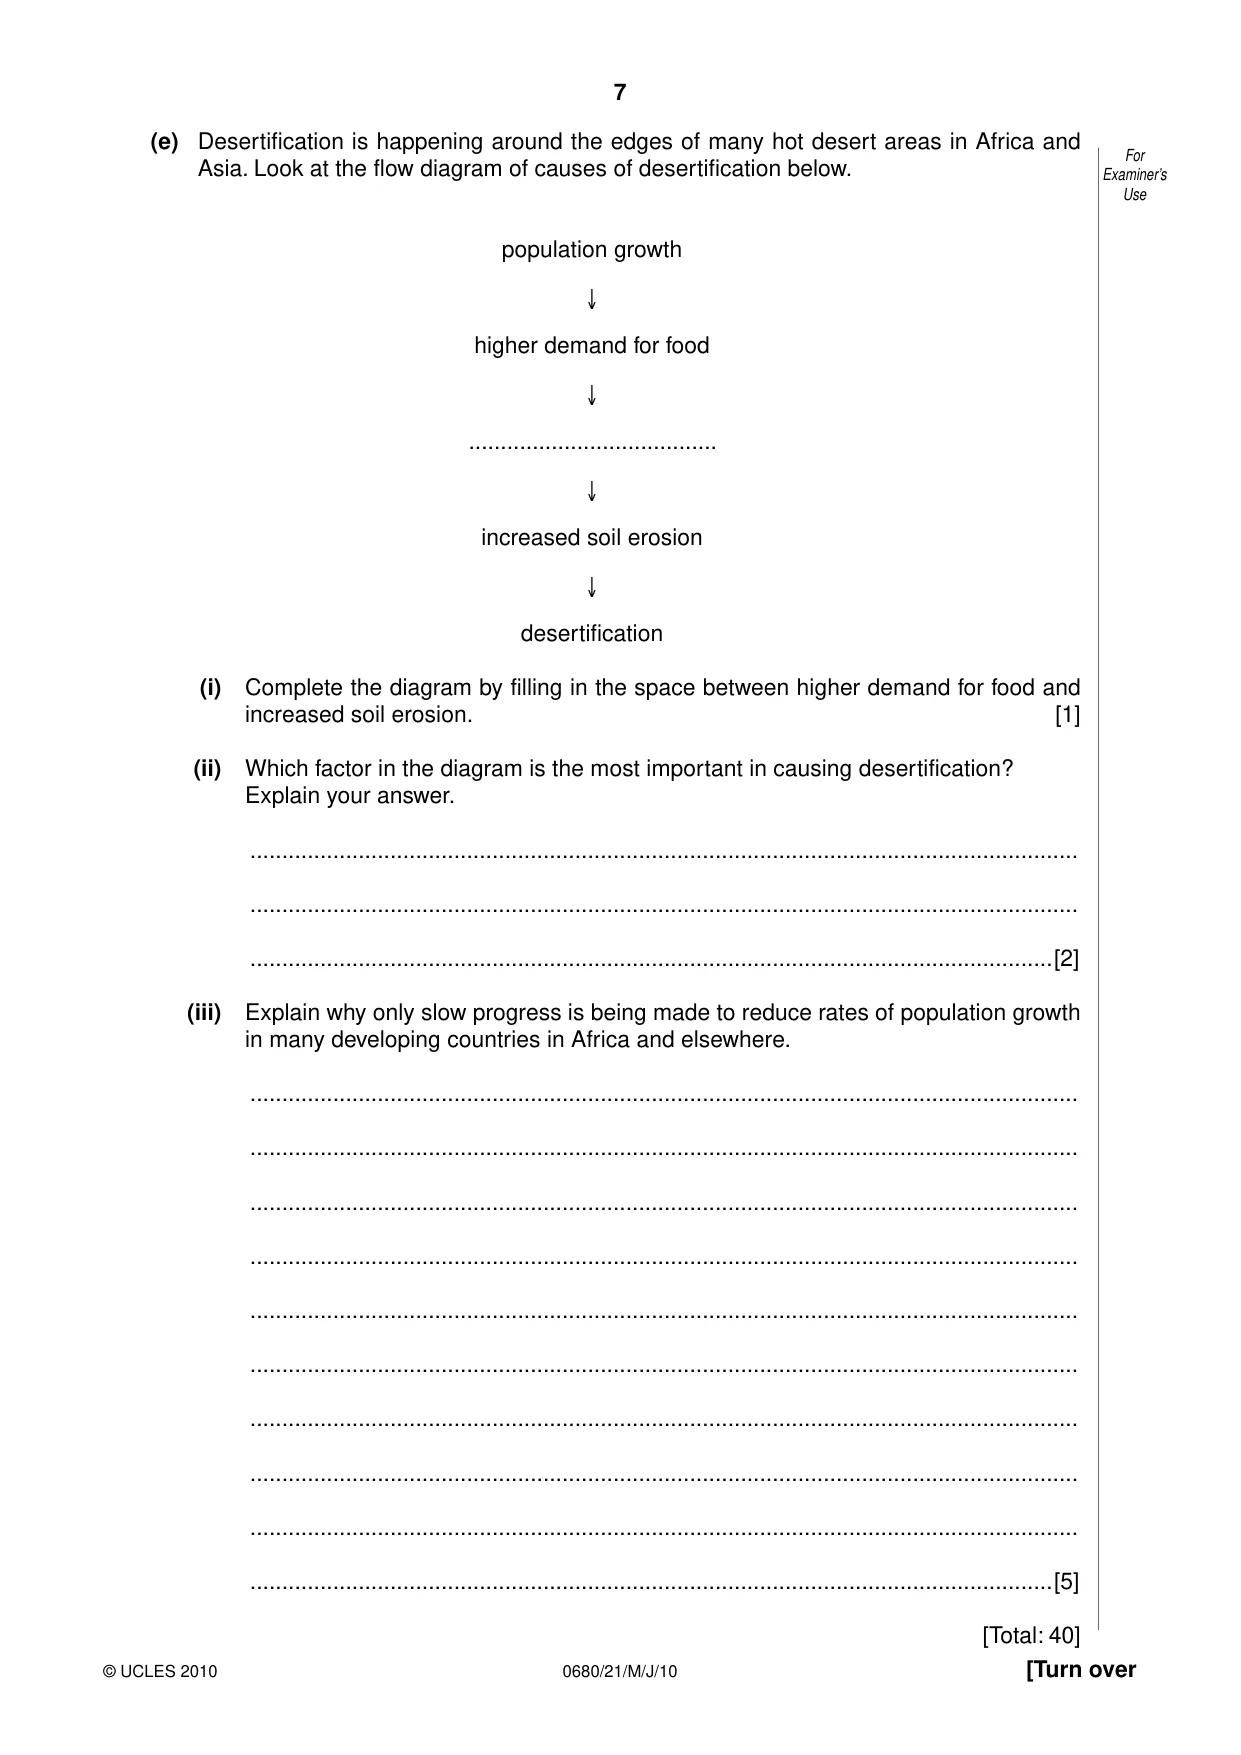
7 0680/21/M/J/10 [Turn over © UCLES 2010 For Examiner’s Use (e) Desertification is happening around the edges of many hot desert areas in Africa and Asia. Look at the flow diagram of causes of desertification below. population growth ↓ higher demand for food ↓ … ↓ increased soil erosion ↓ desertification (i) Complete the diagram by filling in the space between higher demand for food and increased soil erosion. [1] (ii) Which factor in the diagram is the most important in causing desertification? Explain your answer. … … …[2] (iii) Explain why only slow progress is being made to reduce rates of population growth in many developing countries in Africa and elsewhere. … … … … … … … … … …[5] [Total: 40]
Question paper, page 8
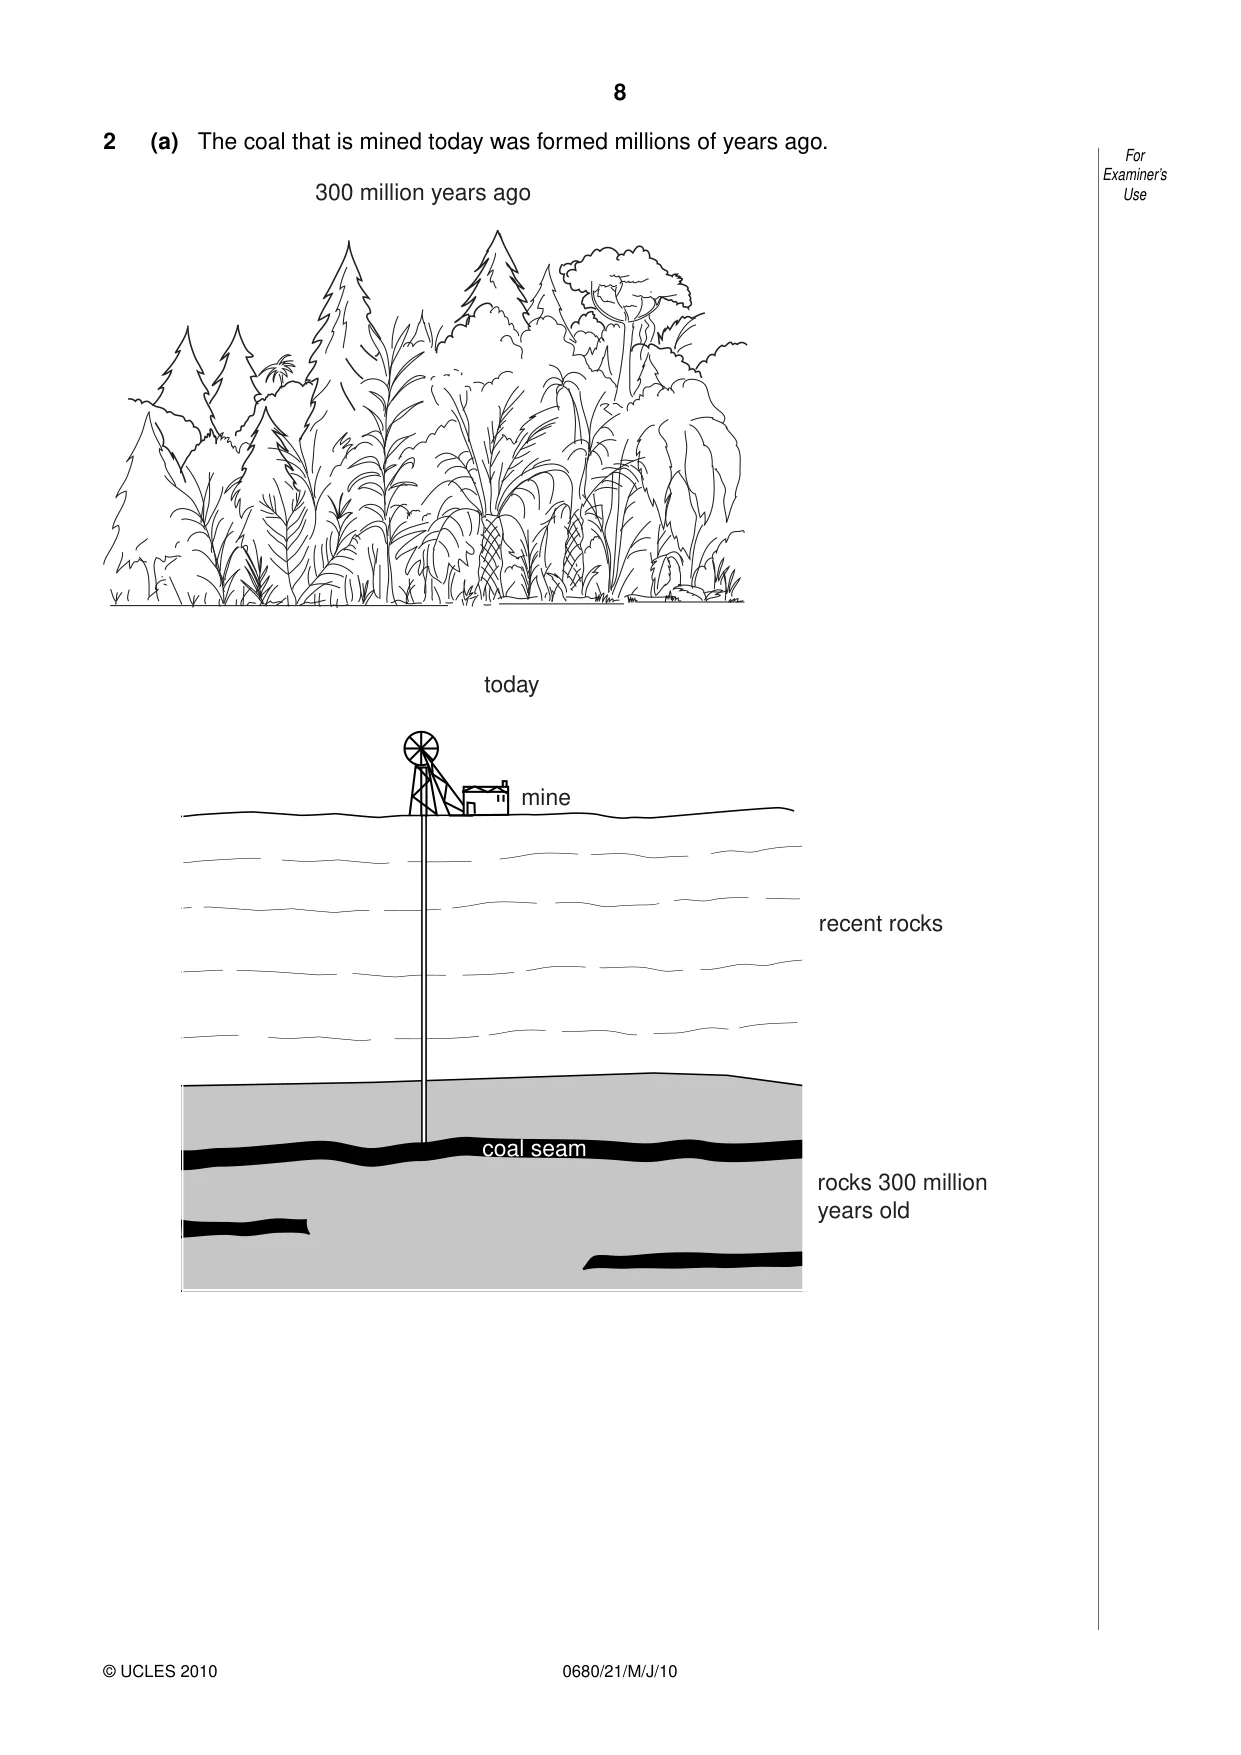
8 0680/21/M/J/10 © UCLES 2010 For Examiner’s Use 2 (a) The coal that is mined today was formed millions of years ago. 300 million years ago mine recent rocks rocks 300 million years old coal seam today
Question paper, page 9
9 0680/21/M/J/10 [Turn over © UCLES 2010 For Examiner’s Use (i) Explain how coal is formed. … … … … …[3] (ii) State two reasons why coal is called a fossil fuel. … … … …[2] (iii) Why is carbon dioxide released into the atmosphere when coal is burnt? … … … …[2]
Question paper, page 10
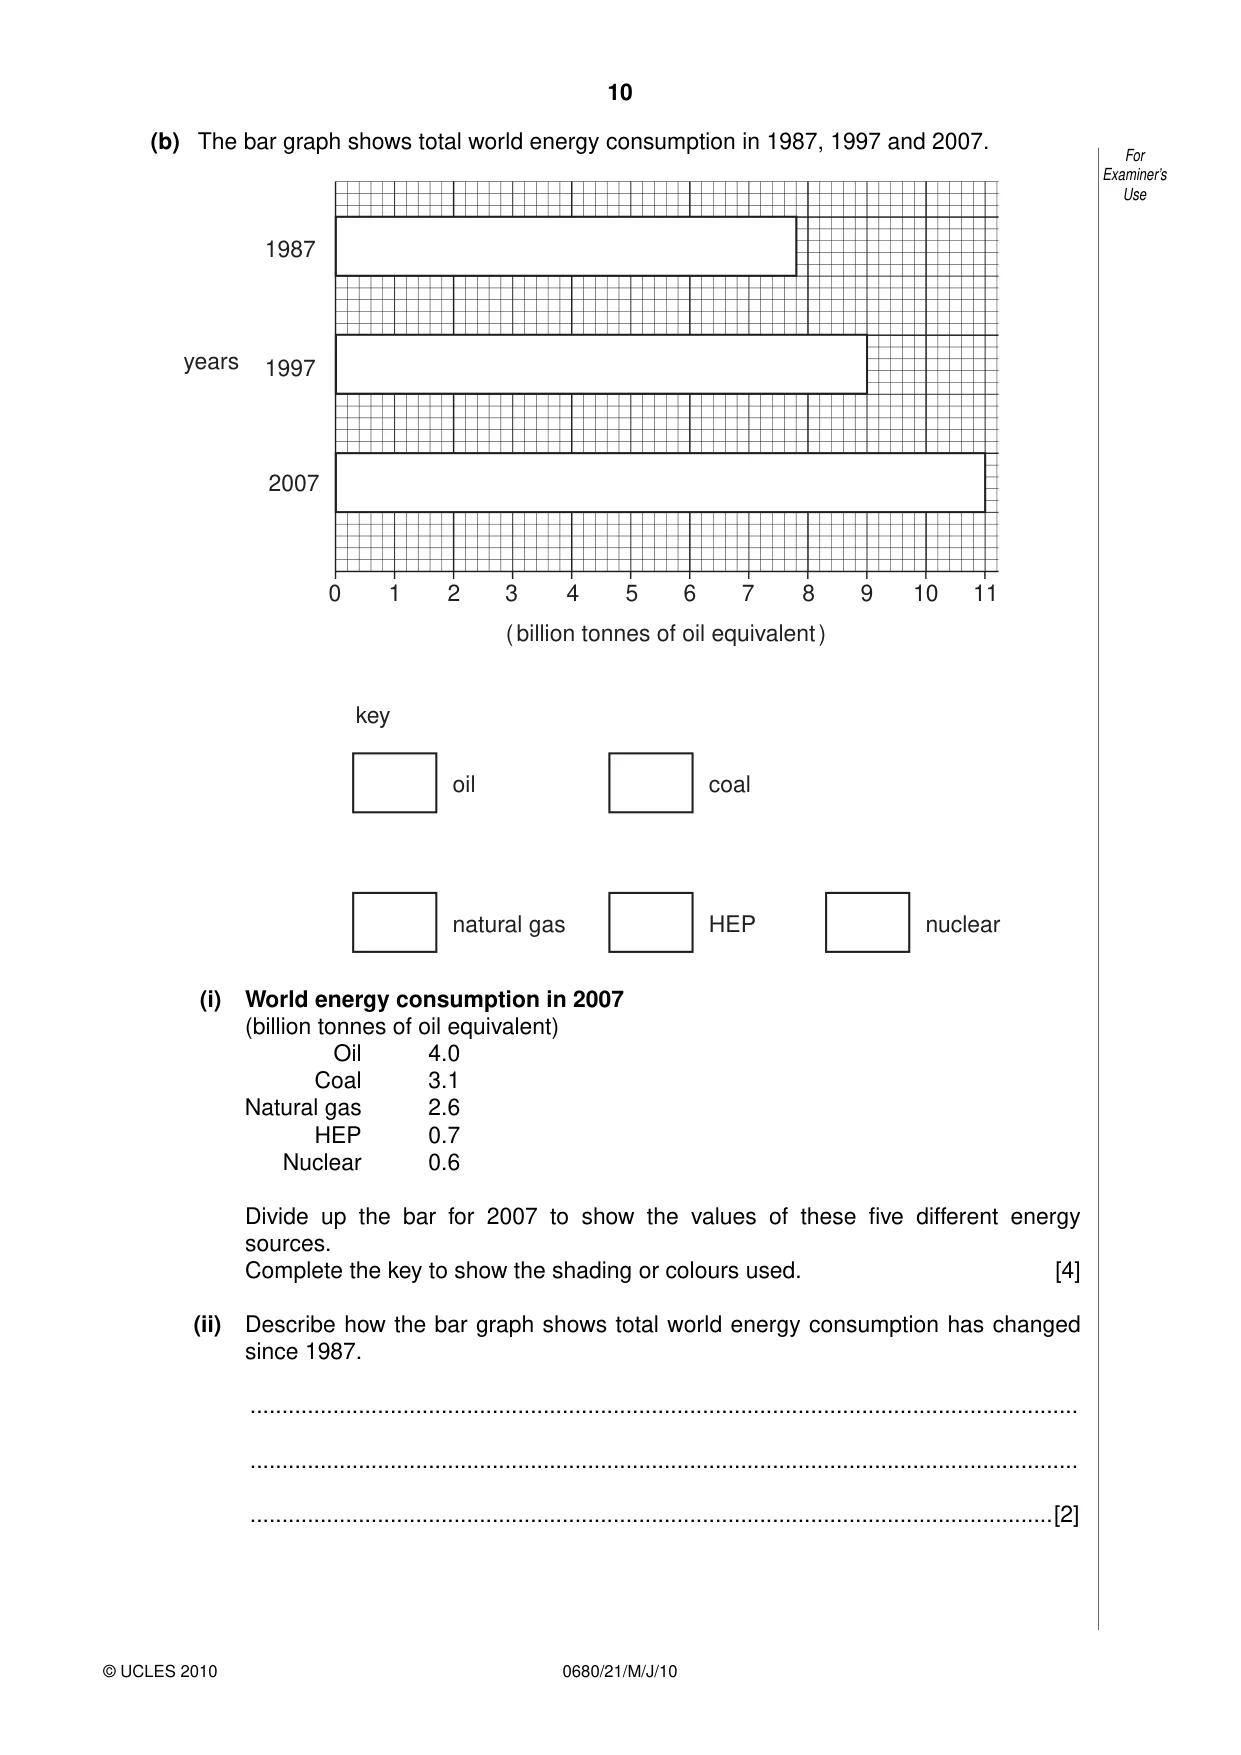
10 0680/21/M/J/10 © UCLES 2010 For Examiner’s Use (b) The bar graph shows total world energy consumption in 1987, 1997 and 2007. 0 1 2 3 4 5 6 7 8 9 10 11 2007 1997 1987 years ( billion tonnes of oil equivalent ) oil coal natural gas HEP nuclear key (i) World energy consumption in 2007 (billion tonnes of oil equivalent) Oil 4.0 Coal 3.1 Natural gas 2.6 HEP 0.7 Nuclear 0.6 Divide up the bar for 2007 to show the values of these five different energy sources. Complete the key to show the shading or colours used. [4] (ii) Describe how the bar graph shows total world energy consumption has changed since 1987. … … …[2]
Question paper, page 11
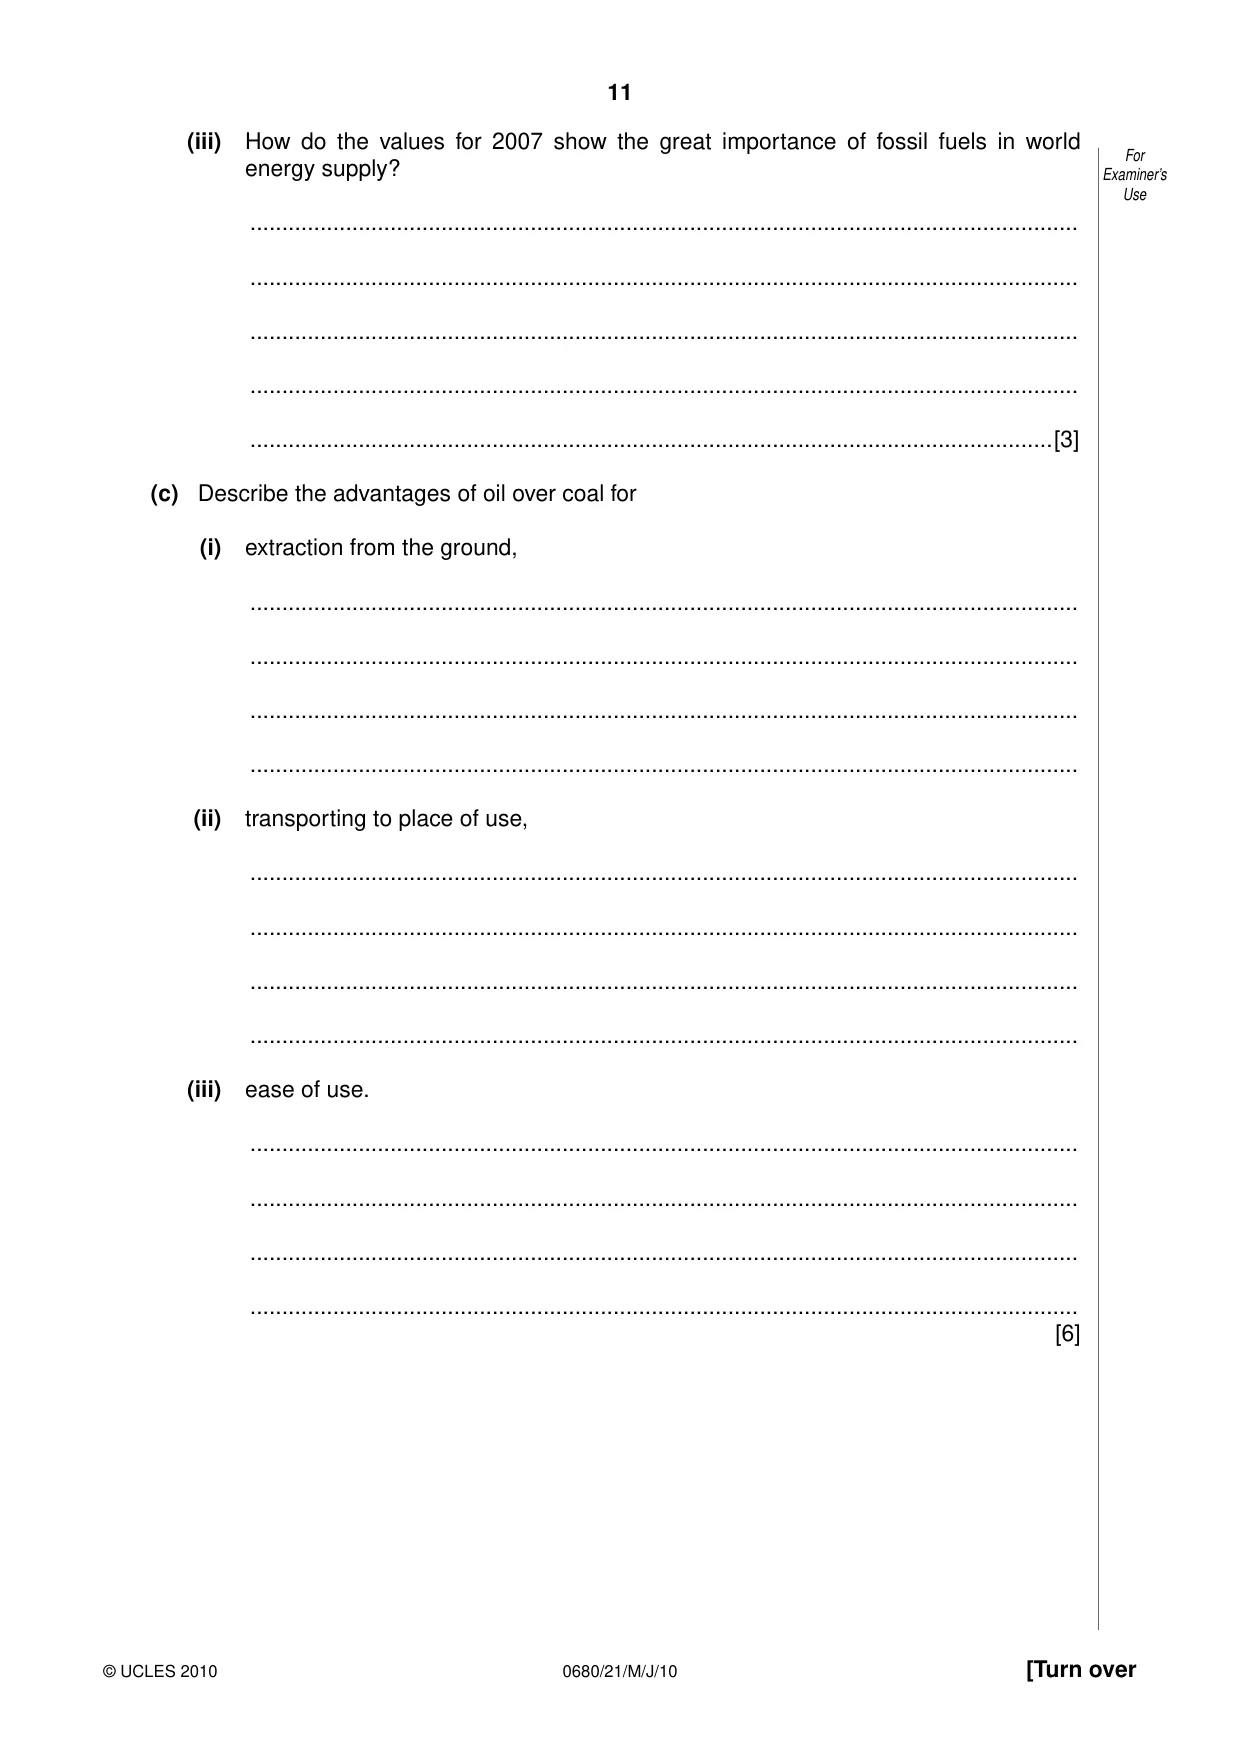
11 0680/21/M/J/10 [Turn over © UCLES 2010 For Examiner’s Use (iii) How do the values for 2007 show the great importance of fossil fuels in world energy supply? … … … … …[3] (c) Describe the advantages of oil over coal for (i) extraction from the ground, … … … … (ii) transporting to place of use, … … … … (iii) ease of use. … … … … [6]
Question paper, page 12
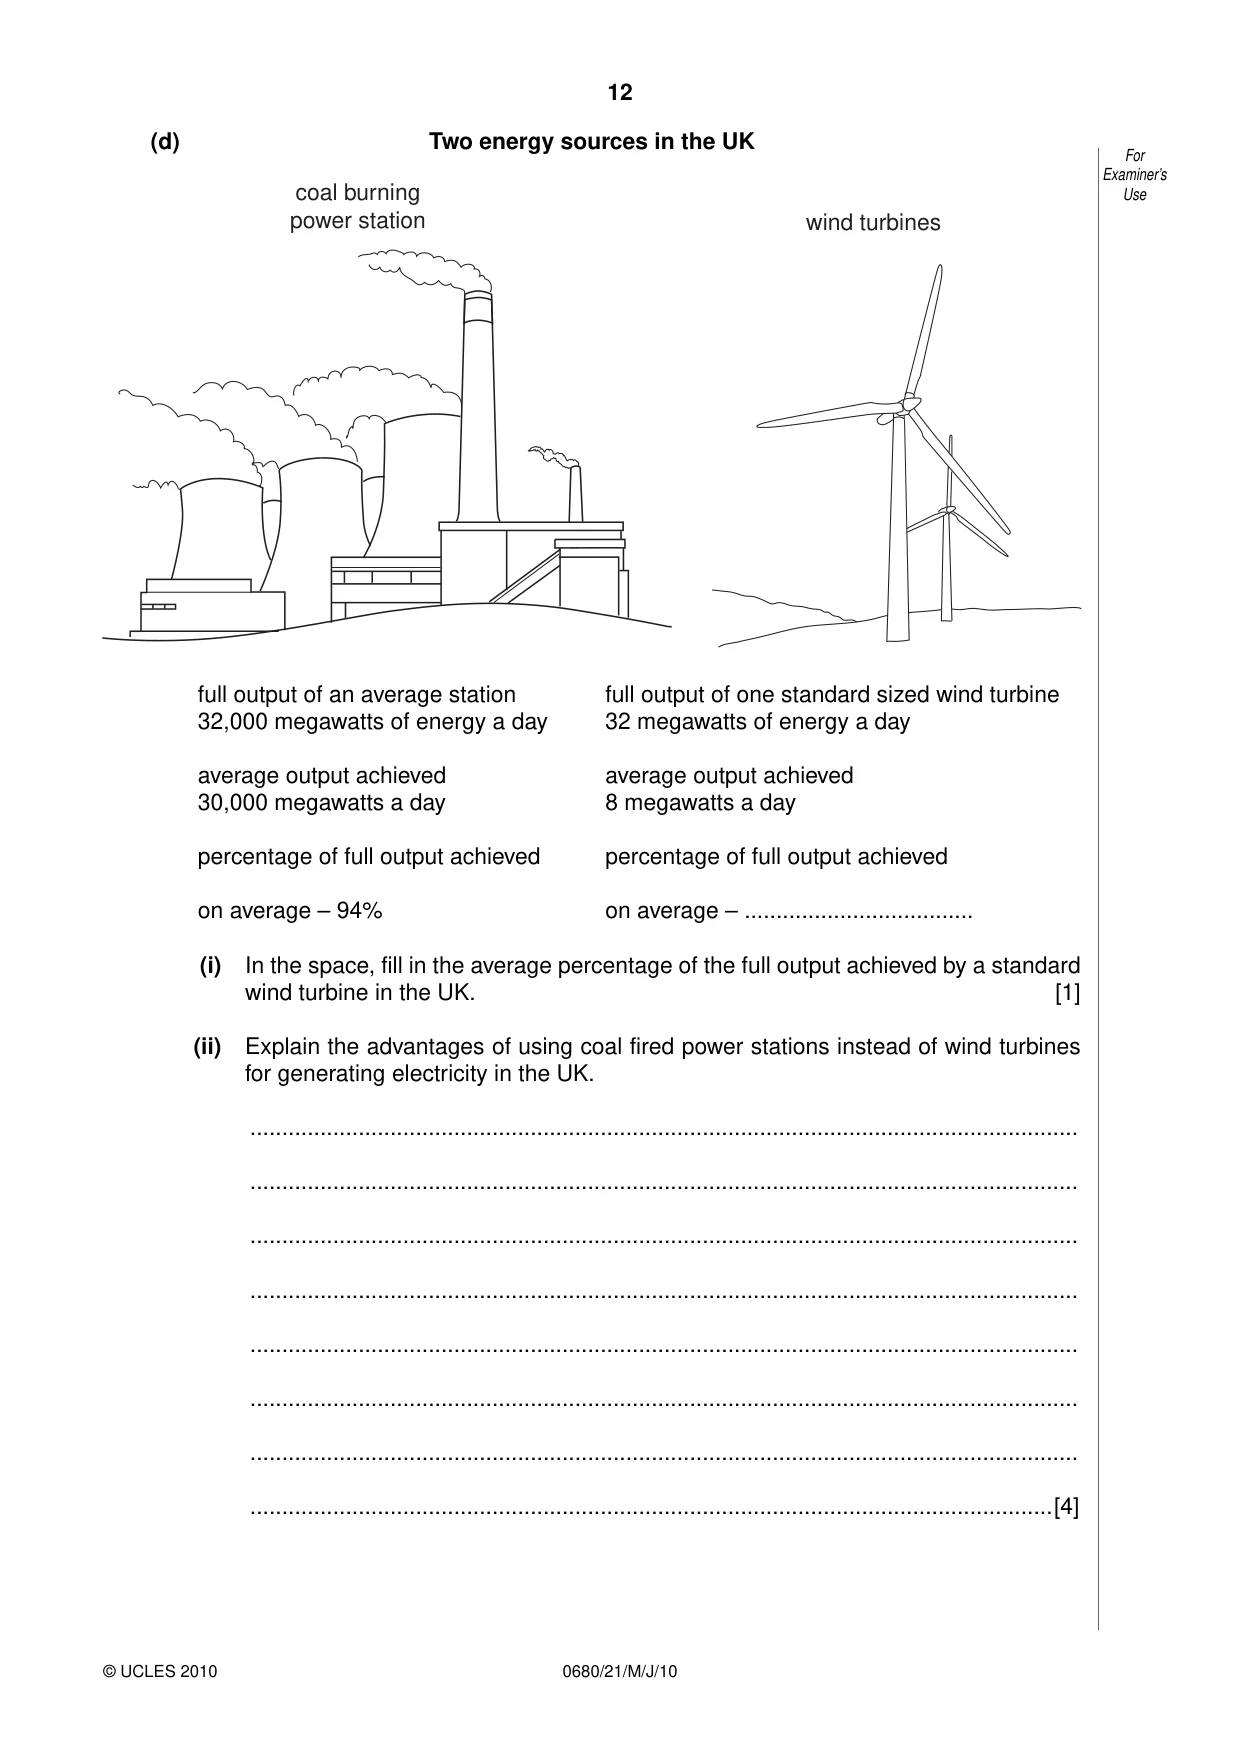
12 0680/21/M/J/10 © UCLES 2010 For Examiner’s Use (d) Two energy sources in the UK coal burning power station wind turbines full output of an average station full output of one standard sized wind turbine 32,000 megawatts of energy a day 32 megawatts of energy a day average output achieved average output achieved 30,000 megawatts a day 8 megawatts a day percentage of full output achieved percentage of full output achieved on average – 94% on average – … (i) In the space, fill in the average percentage of the full output achieved by a standard wind turbine in the UK. [1] (ii) Explain the advantages of using coal fired power stations instead of wind turbines for generating electricity in the UK. … … … … … … … …[4]
Question paper, page 13
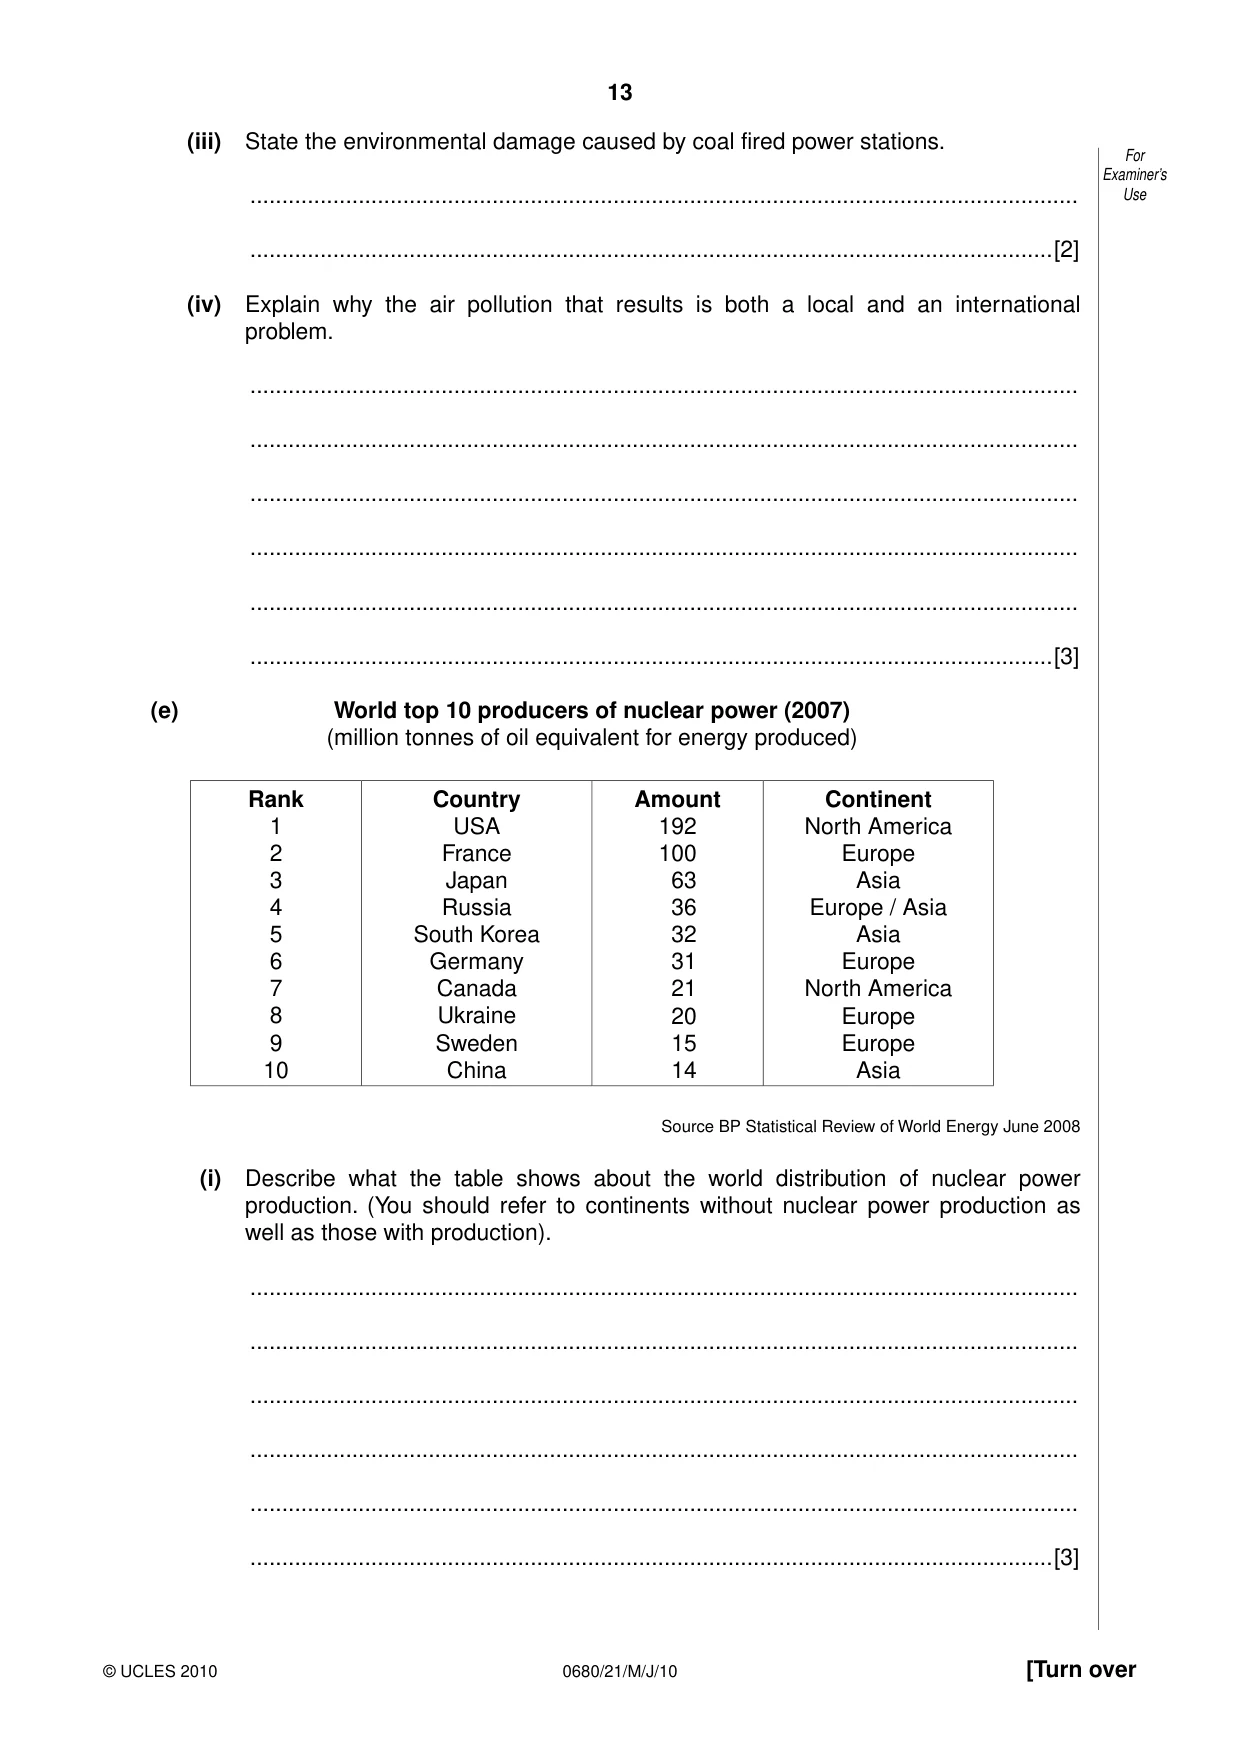
13 0680/21/M/J/10 [Turn over © UCLES 2010 For Examiner’s Use (iii) State the environmental damage caused by coal fired power stations. … …[2] (iv) Explain why the air pollution that results is both a local and an international problem. … … … … … …[3] (e) World top 10 producers of nuclear power (2007) (million tonnes of oil equivalent for energy produced) Rank 1 2 3 4 5 6 7 8 9 10 Country USA France Japan Russia South Korea Germany Canada Ukraine Sweden China Amount 192 100 63 36 32 31 21 20 15 14 Continent North America Europe Asia Europe / Asia Asia Europe North America Europe Europe Asia Source BP Statistical Review of World Energy June 2008 (i) Describe what the table shows about the world distribution of nuclear power production. (You should refer to continents without nuclear power production as well as those with production). … … … … … …[3]
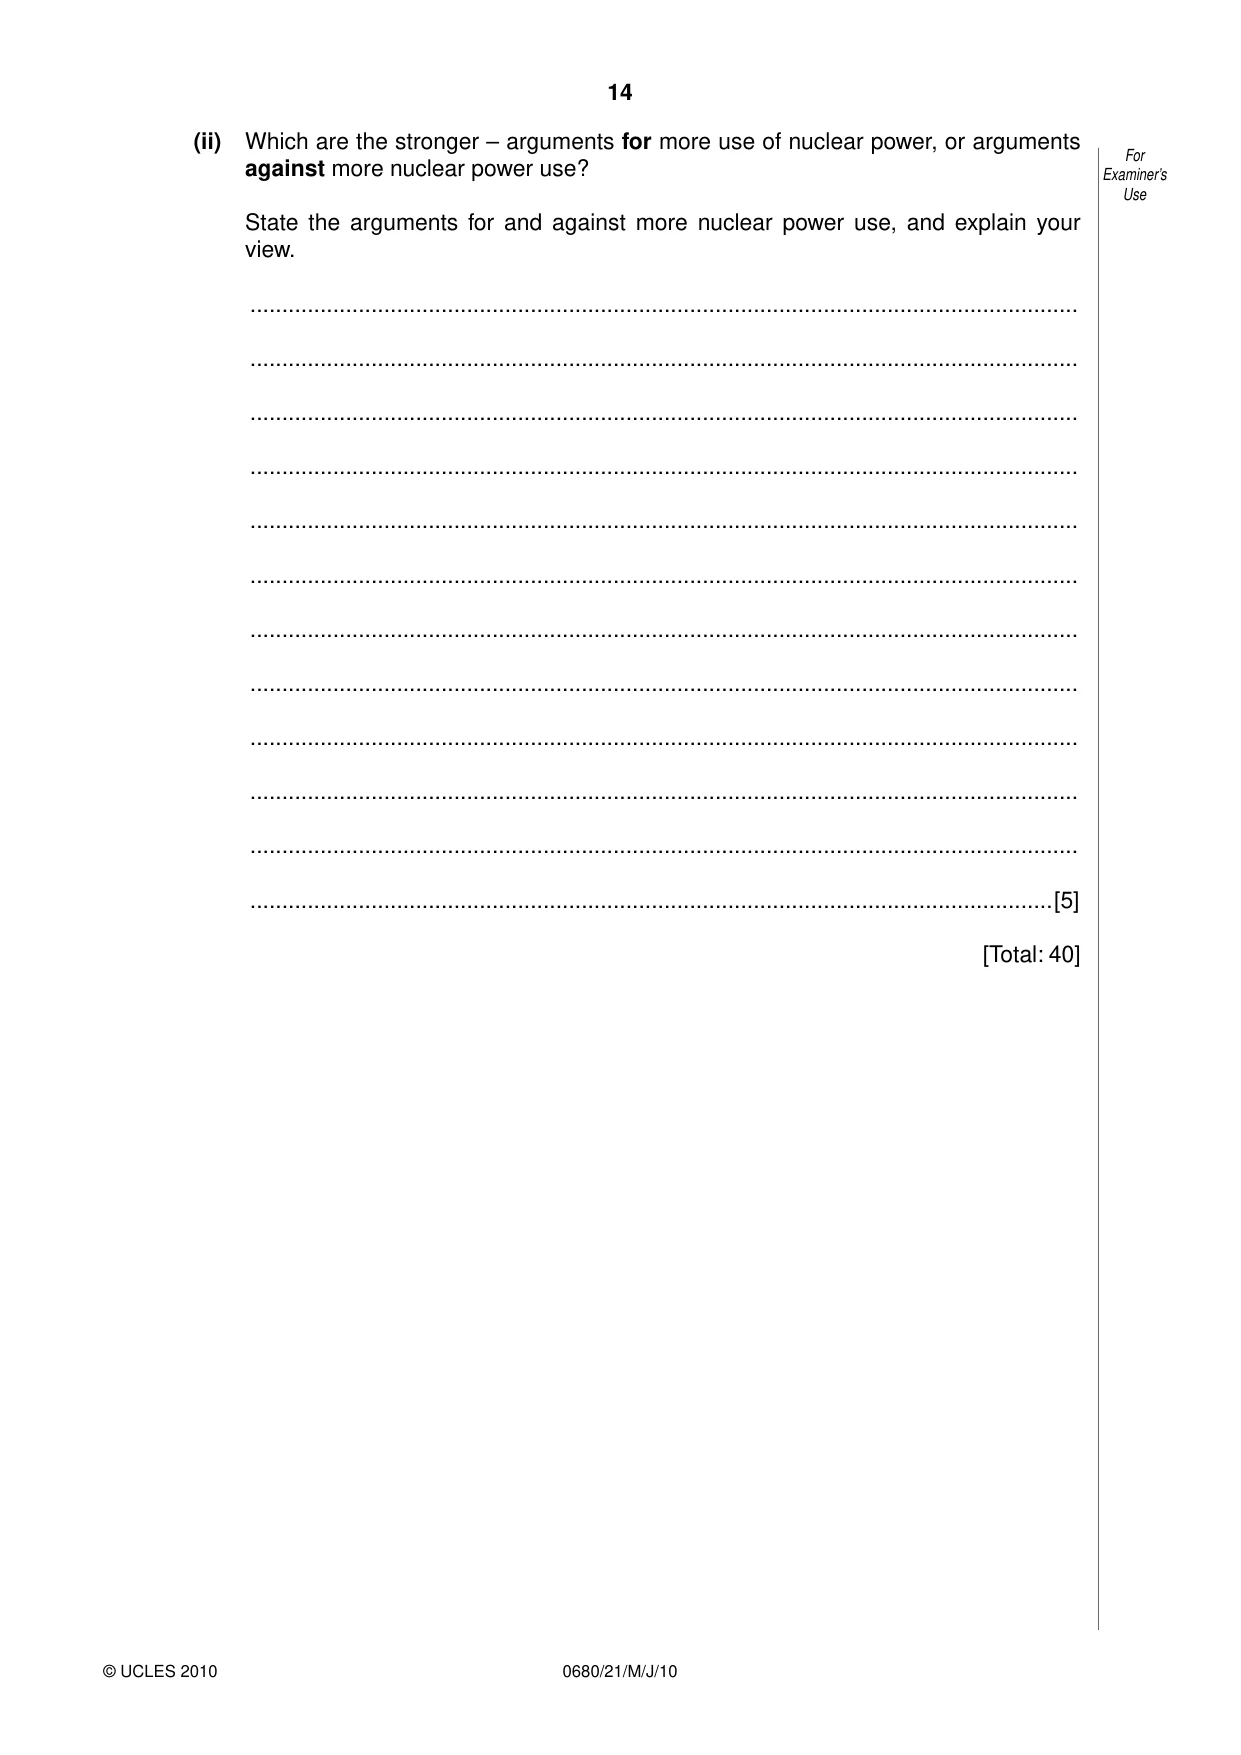
Question paper, page 14
14 0680/21/M/J/10 © UCLES 2010 For Examiner’s Use (ii) Which are the stronger – arguments for more use of nuclear power, or arguments against more nuclear power use? State the arguments for and against more nuclear power use, and explain your view. … … … … … … … … … … … …[5] [Total: 40]
Question paper, page 15
15 0680/21/M/J/10 © UCLES 2010 BLANK PAGE
Question paper, page 16
16 0680/21/M/J/10 © UCLES 2010 BLANK PAGE Permission to reproduce items where third-party owned material protected by copyright is included has been sought and cleared where possible. Every reasonable effort has been made by the publisher (UCLES) to trace copyright holders, but if any items requiring clearance have unwittingly been included, the publisher will be pleased to make amends at the earliest possible opportunity. University of Cambridge International Examinations is part of the Cambridge Assessment Group. Cambridge Assessment is the brand name of University of Cambridge Local Examinations Syndicate (UCLES), which is itself a department of the University of Cambridge.
Mark scheme, page 1
UNIVERSITY OF CAMBRIDGE INTERNATIONAL EXAMINATIONS International General Certificate of Secondary Education MARK SCHEME for the May/June 2010 question paper for the guidance of teachers 0680 ENVIRONMENTAL MANAGEMENT 0680/21 Paper 21, maximum raw mark 80 This mark scheme is published as an aid to teachers and candidates, to indicate the requirements of the examination. It shows the basis on which Examiners were instructed to award marks. It does not indicate the details of the discussions that took place at an Examiners’ meeting before marking began, which would have considered the acceptability of alternative answers. Mark schemes must be read in conjunction with the question papers and the report on the examination. • CIE will not enter into discussions or correspondence in connection with these mark schemes. CIE is publishing the mark schemes for the May/June 2010 question papers for most IGCSE, GCE Advanced Level and Advanced Subsidiary Level syllabuses and some Ordinary Level syllabuses. www.XtremePapers.com
Mark scheme, page 2
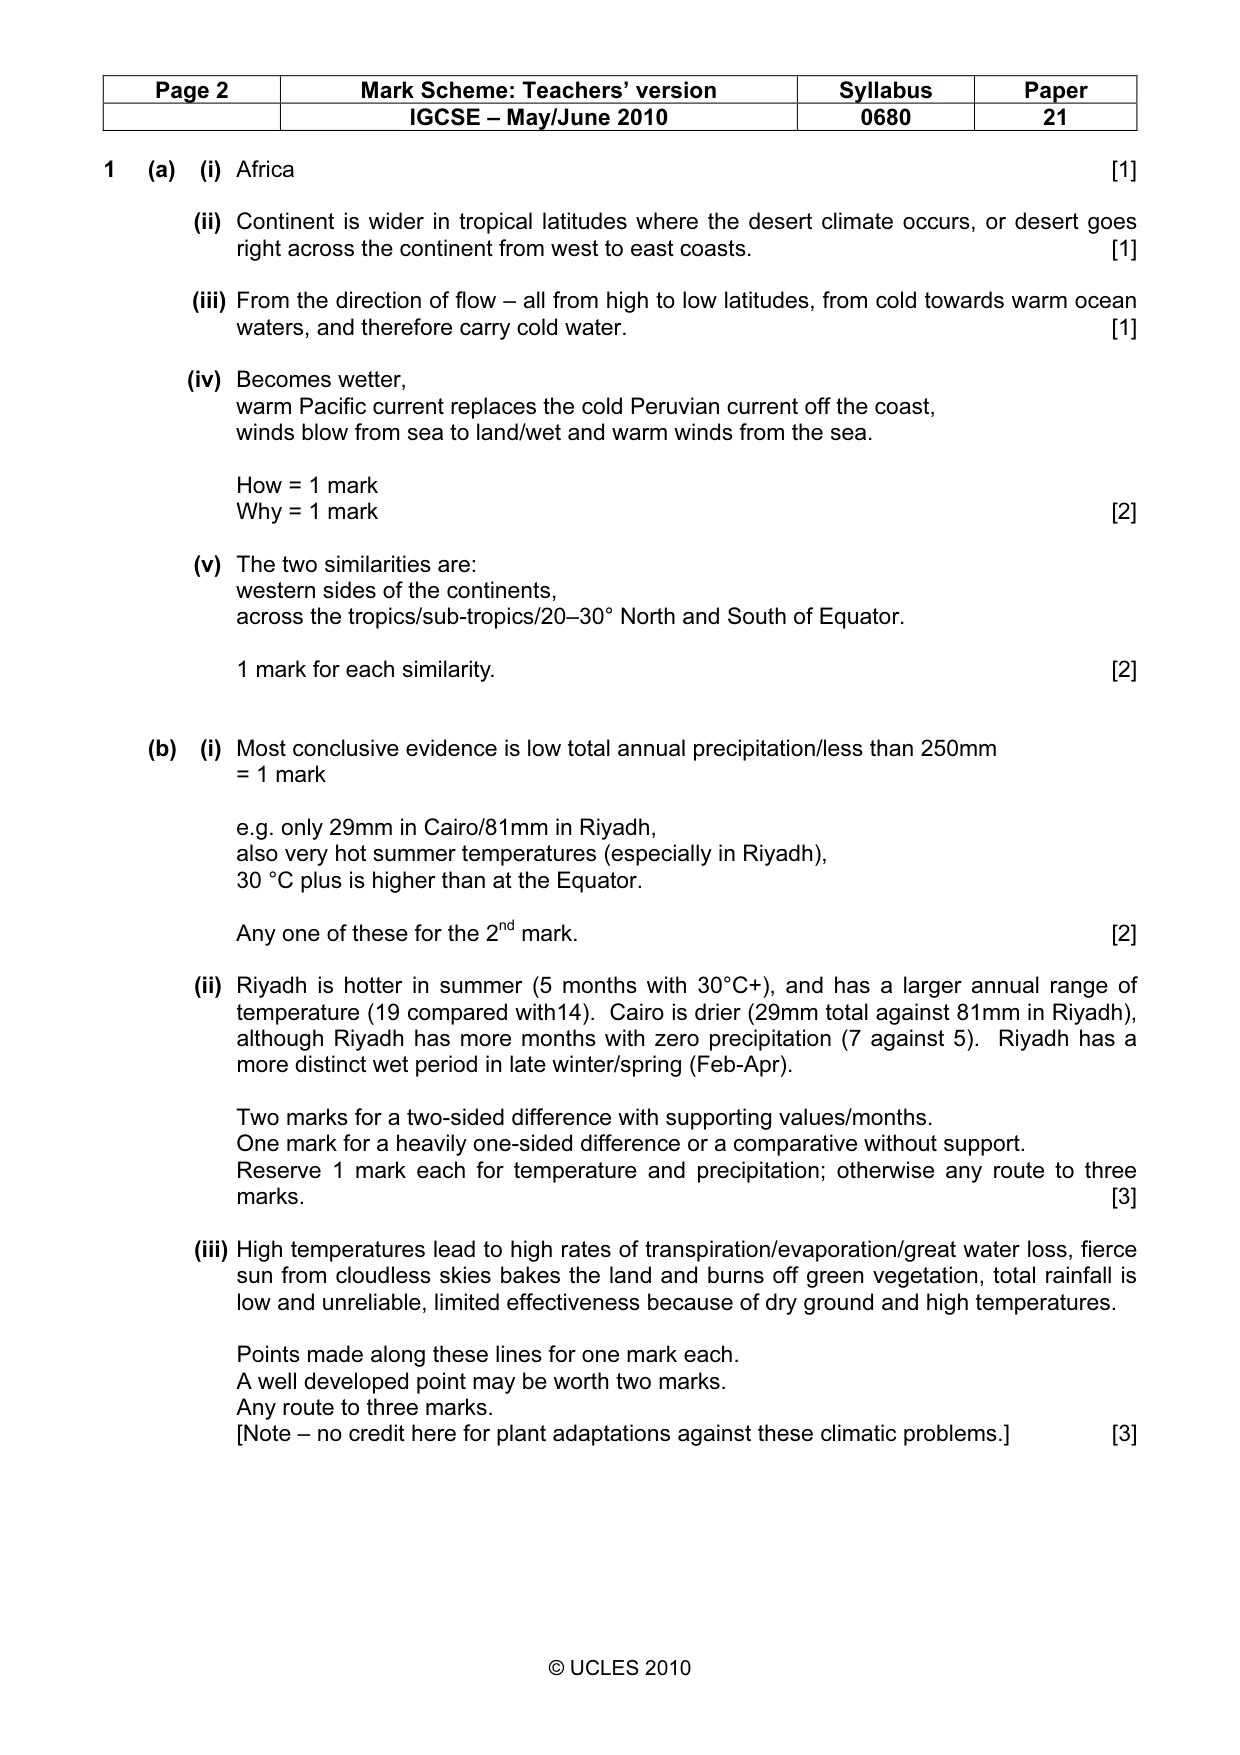
Page 2 Mark Scheme: Teachers’ version Syllabus Paper IGCSE – May/June 2010 0680 21 © UCLES 2010 1 (a) (i) Africa [1] (ii) Continent is wider in tropical latitudes where the desert climate occurs, or desert goes right across the continent from west to east coasts. [1] (iii) From the direction of flow – all from high to low latitudes, from cold towards warm ocean waters, and therefore carry cold water. [1] (iv) Becomes wetter, warm Pacific current replaces the cold Peruvian current off the coast, winds blow from sea to land/wet and warm winds from the sea. How = 1 mark Why = 1 mark [2] (v) The two similarities are: western sides of the continents, across the tropics/sub-tropics/20–30° North and South of Equator. 1 mark for each similarity. [2] (b) (i) Most conclusive evidence is low total annual precipitation/less than 250mm = 1 mark e.g. only 29mm in Cairo/81mm in Riyadh, also very hot summer temperatures (especially in Riyadh), 30 °C plus is higher than at the Equator. Any one of these for the 2nd mark. [2] (ii) Riyadh is hotter in summer (5 months with 30°C+), and has a larger annual range of temperature (19 compared with14). Cairo is drier (29mm total against 81mm in Riyadh), although Riyadh has more months with zero precipitation (7 against 5). Riyadh has a more distinct wet period in late winter/spring (Feb-Apr). Two marks for a two-sided difference with supporting values/months. One mark for a heavily one-sided difference or a comparative without support. Reserve 1 mark each for temperature and precipitation; otherwise any route to three marks. [3] (iii) High temperatures lead to high rates of transpiration/evaporation/great water loss, fierce sun from cloudless skies bakes the land and burns off green vegetation, total rainfall is low and unreliable, limited effectiveness because of dry ground and high temperatures. Points made along these lines for one mark each. A well developed point may be worth two marks. Any route to three marks. [Note – no credit here for plant adaptations against these climatic problems.] [3]
Mark scheme, page 3
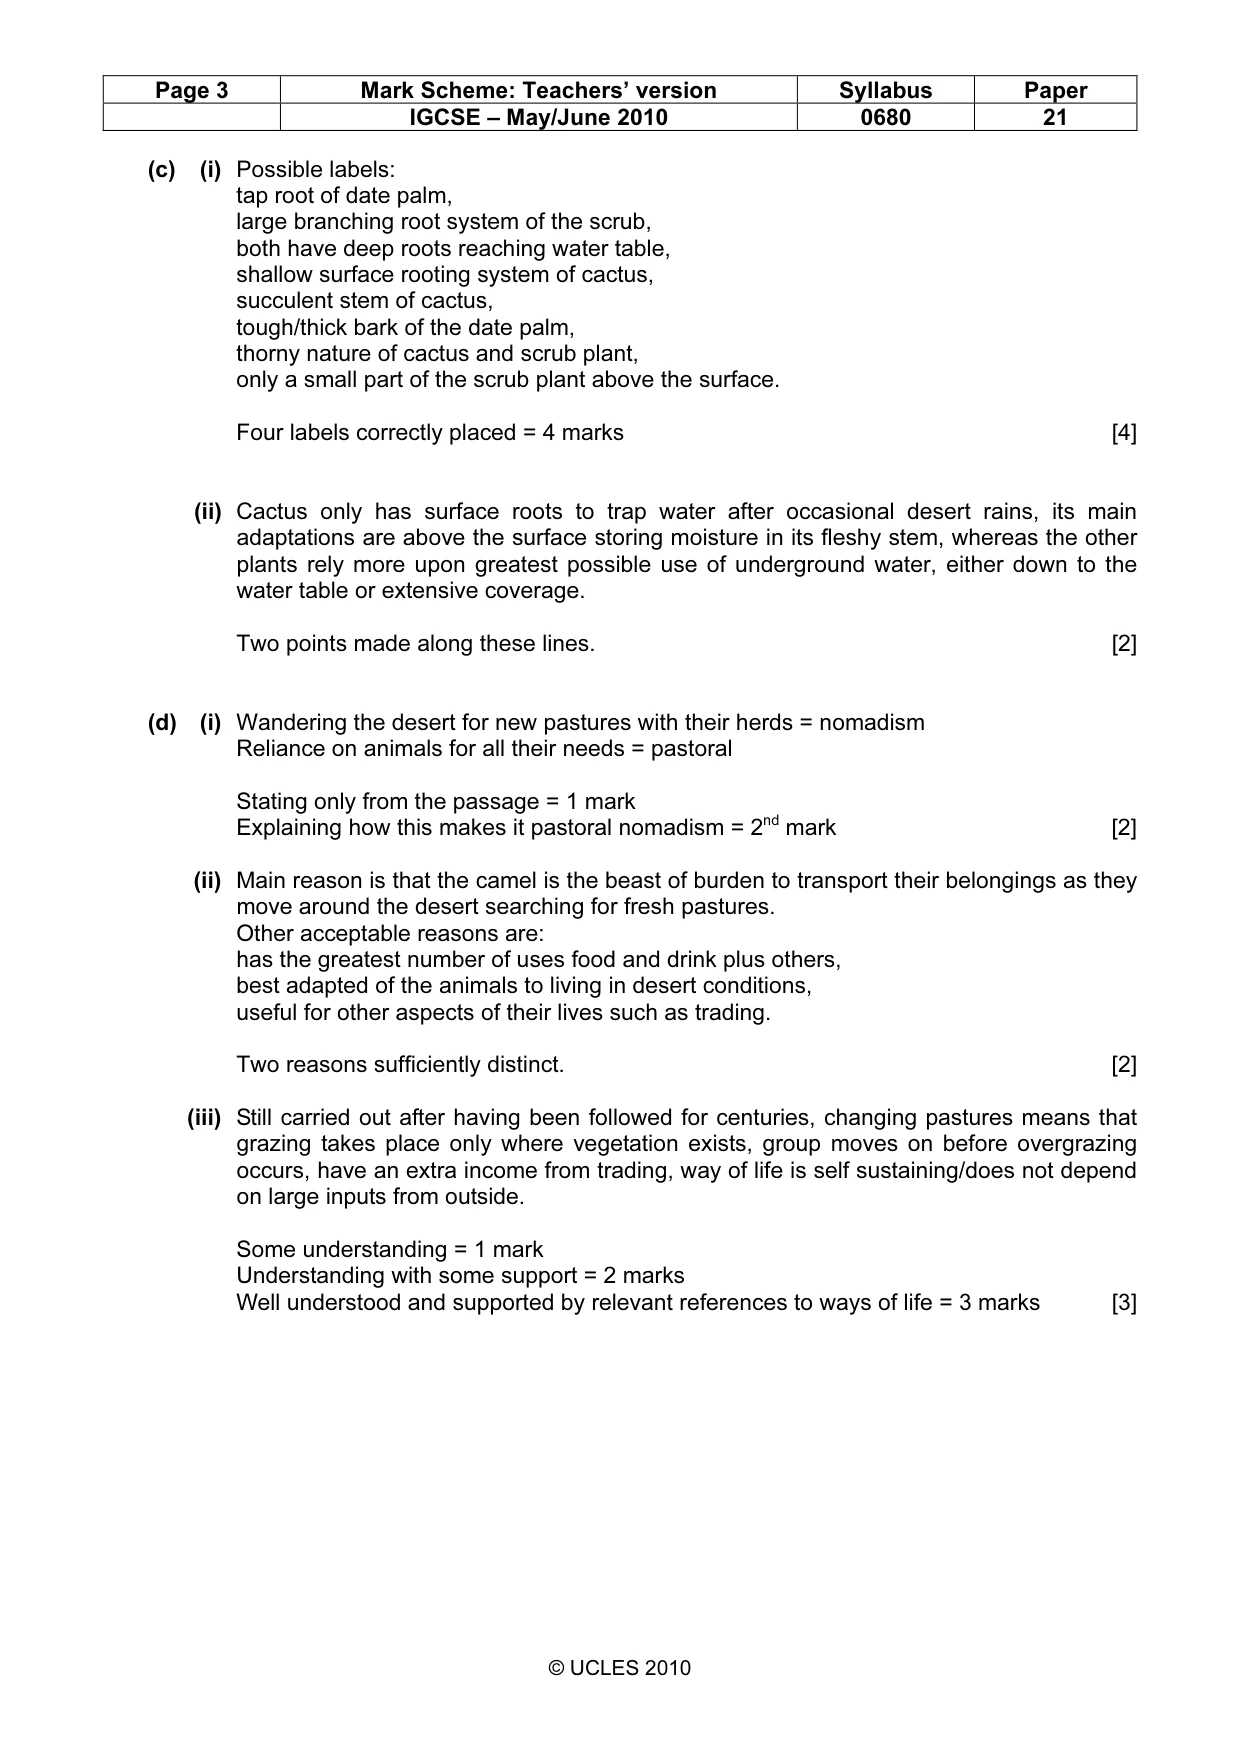
Page 3 Mark Scheme: Teachers’ version Syllabus Paper IGCSE – May/June 2010 0680 21 © UCLES 2010 (c) (i) Possible labels: tap root of date palm, large branching root system of the scrub, both have deep roots reaching water table, shallow surface rooting system of cactus, succulent stem of cactus, tough/thick bark of the date palm, thorny nature of cactus and scrub plant, only a small part of the scrub plant above the surface. Four labels correctly placed = 4 marks [4] (ii) Cactus only has surface roots to trap water after occasional desert rains, its main adaptations are above the surface storing moisture in its fleshy stem, whereas the other plants rely more upon greatest possible use of underground water, either down to the water table or extensive coverage. Two points made along these lines. [2] (d) (i) Wandering the desert for new pastures with their herds = nomadism Reliance on animals for all their needs = pastoral Stating only from the passage = 1 mark Explaining how this makes it pastoral nomadism = 2nd mark [2] (ii) Main reason is that the camel is the beast of burden to transport their belongings as they move around the desert searching for fresh pastures. Other acceptable reasons are: has the greatest number of uses food and drink plus others, best adapted of the animals to living in desert conditions, useful for other aspects of their lives such as trading. Two reasons sufficiently distinct. [2] (iii) Still carried out after having been followed for centuries, changing pastures means that grazing takes place only where vegetation exists, group moves on before overgrazing occurs, have an extra income from trading, way of life is self sustaining/does not depend on large inputs from outside. Some understanding = 1 mark Understanding with some support = 2 marks Well understood and supported by relevant references to ways of life = 3 marks [3]
Mark scheme, page 4
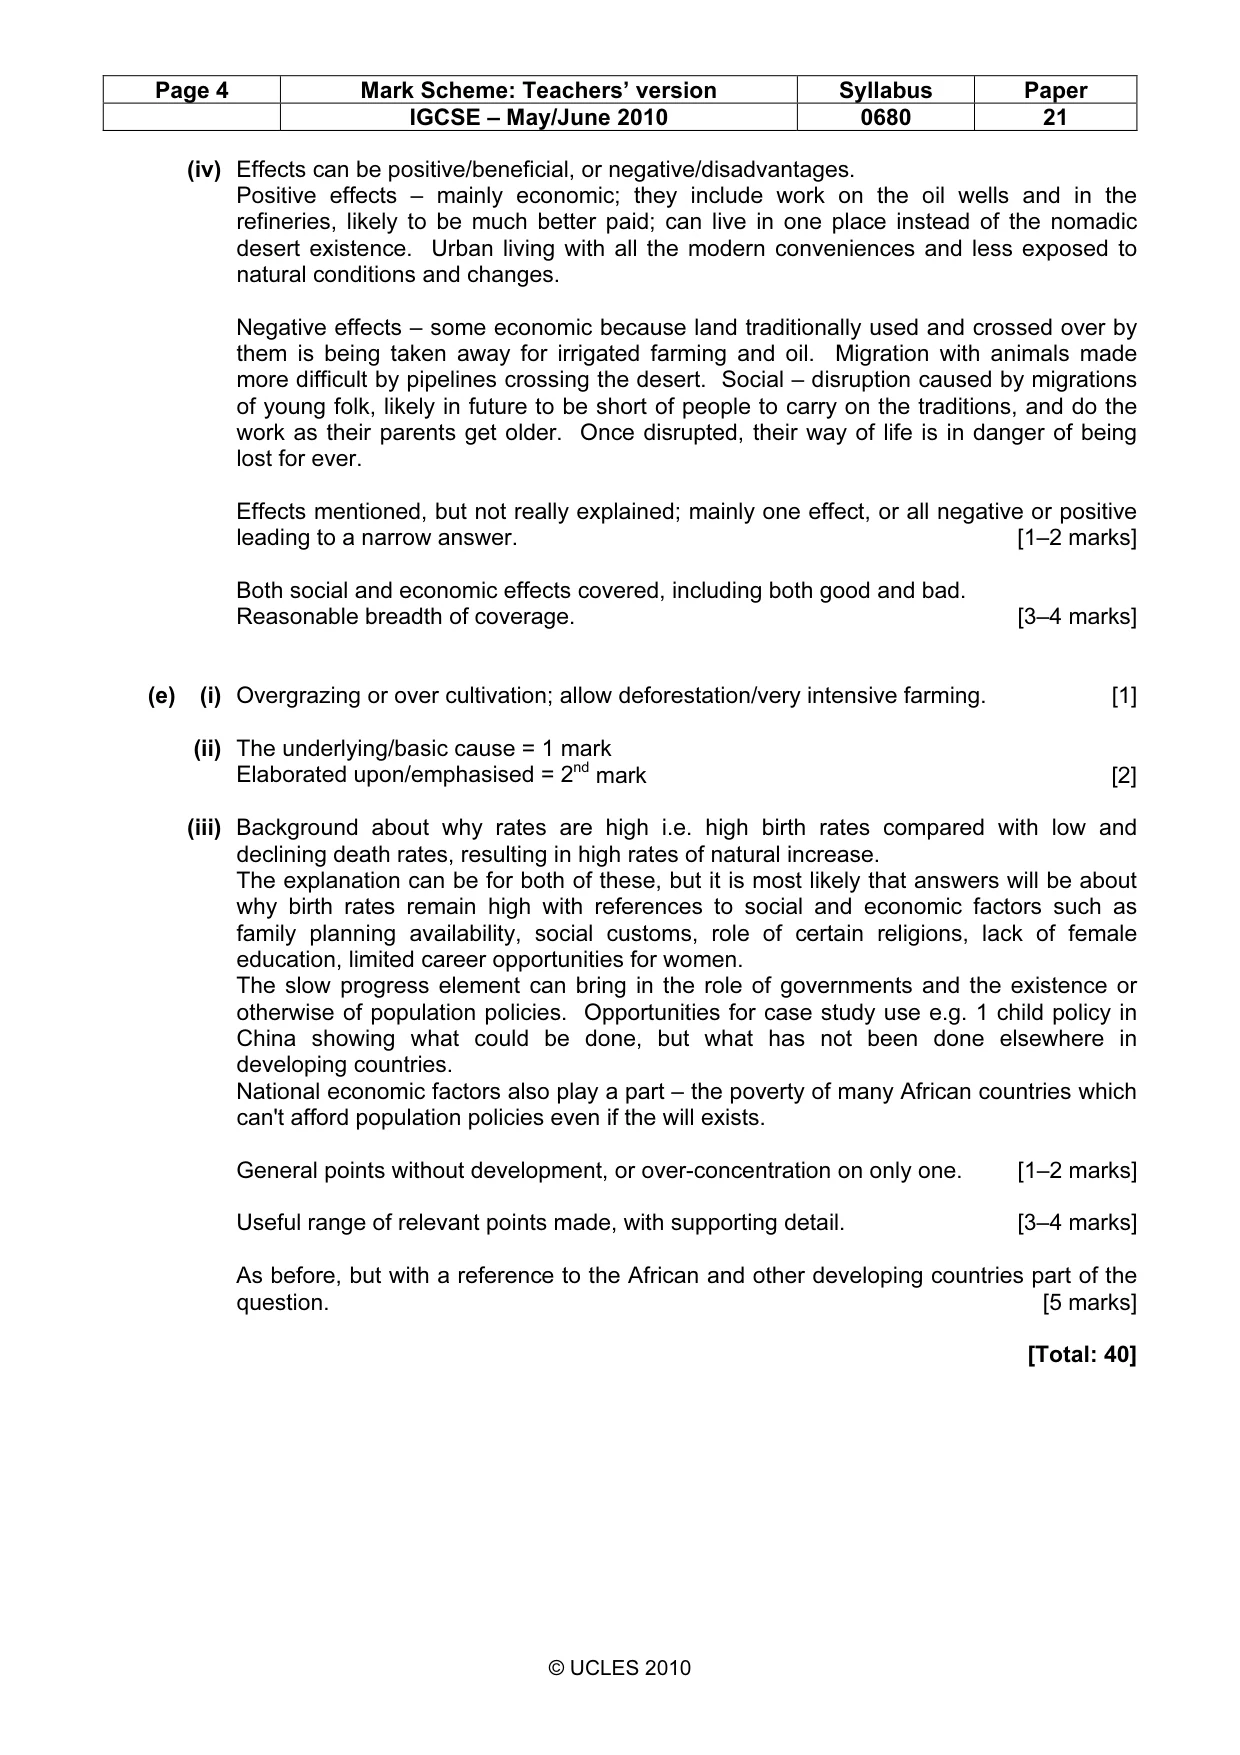
Page 4 Mark Scheme: Teachers’ version Syllabus Paper IGCSE – May/June 2010 0680 21 © UCLES 2010 (iv) Effects can be positive/beneficial, or negative/disadvantages. Positive effects – mainly economic; they include work on the oil wells and in the refineries, likely to be much better paid; can live in one place instead of the nomadic desert existence. Urban living with all the modern conveniences and less exposed to natural conditions and changes. Negative effects – some economic because land traditionally used and crossed over by them is being taken away for irrigated farming and oil. Migration with animals made more difficult by pipelines crossing the desert. Social – disruption caused by migrations of young folk, likely in future to be short of people to carry on the traditions, and do the work as their parents get older. Once disrupted, their way of life is in danger of being lost for ever. Effects mentioned, but not really explained; mainly one effect, or all negative or positive leading to a narrow answer. [1–2 marks] Both social and economic effects covered, including both good and bad. Reasonable breadth of coverage. [3–4 marks] (e) (i) Overgrazing or over cultivation; allow deforestation/very intensive farming. [1] (ii) The underlying/basic cause = 1 mark Elaborated upon/emphasised = 2nd mark [2] (iii) Background about why rates are high i.e. high birth rates compared with low and declining death rates, resulting in high rates of natural increase. The explanation can be for both of these, but it is most likely that answers will be about why birth rates remain high with references to social and economic factors such as family planning availability, social customs, role of certain religions, lack of female education, limited career opportunities for women. The slow progress element can bring in the role of governments and the existence or otherwise of population policies. Opportunities for case study use e.g. 1 child policy in China showing what could be done, but what has not been done elsewhere in developing countries. National economic factors also play a part – the poverty of many African countries which can't afford population policies even if the will exists. General points without development, or over-concentration on only one. [1–2 marks] Useful range of relevant points made, with supporting detail. [3–4 marks] As before, but with a reference to the African and other developing countries part of the question. [5 marks] [Total: 40]
Mark scheme, page 5
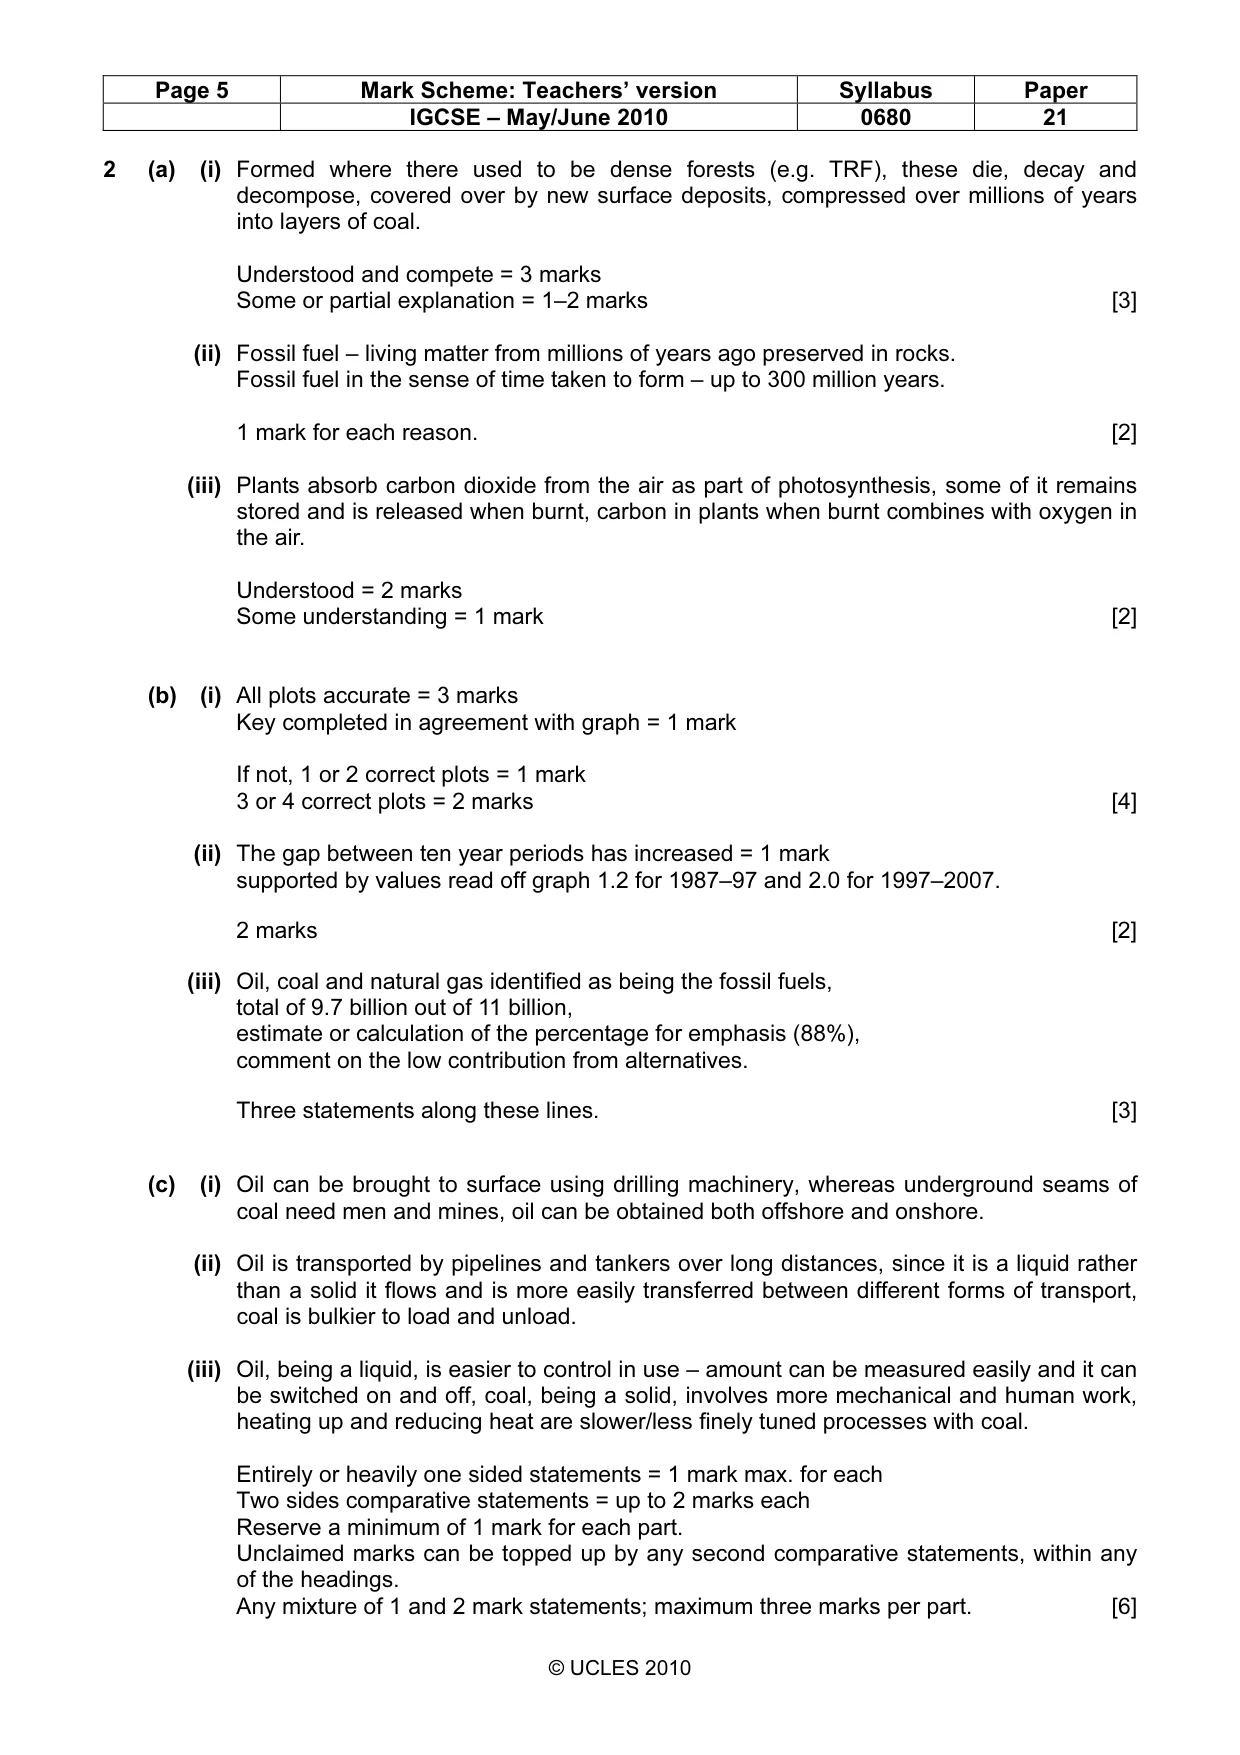
Page 5 Mark Scheme: Teachers’ version Syllabus Paper IGCSE – May/June 2010 0680 21 © UCLES 2010 2 (a) (i) Formed where there used to be dense forests (e.g. TRF), these die, decay and decompose, covered over by new surface deposits, compressed over millions of years into layers of coal. Understood and compete = 3 marks Some or partial explanation = 1–2 marks [3] (ii) Fossil fuel – living matter from millions of years ago preserved in rocks. Fossil fuel in the sense of time taken to form – up to 300 million years. 1 mark for each reason. [2] (iii) Plants absorb carbon dioxide from the air as part of photosynthesis, some of it remains stored and is released when burnt, carbon in plants when burnt combines with oxygen in the air. Understood = 2 marks Some understanding = 1 mark [2] (b) (i) All plots accurate = 3 marks Key completed in agreement with graph = 1 mark If not, 1 or 2 correct plots = 1 mark 3 or 4 correct plots = 2 marks [4] (ii) The gap between ten year periods has increased = 1 mark supported by values read off graph 1.2 for 1987–97 and 2.0 for 1997–2007. 2 marks [2] (iii) Oil, coal and natural gas identified as being the fossil fuels, total of 9.7 billion out of 11 billion, estimate or calculation of the percentage for emphasis (88%), comment on the low contribution from alternatives. Three statements along these lines. [3] (c) (i) Oil can be brought to surface using drilling machinery, whereas underground seams of coal need men and mines, oil can be obtained both offshore and onshore. (ii) Oil is transported by pipelines and tankers over long distances, since it is a liquid rather than a solid it flows and is more easily transferred between different forms of transport, coal is bulkier to load and unload. (iii) Oil, being a liquid, is easier to control in use – amount can be measured easily and it can be switched on and off, coal, being a solid, involves more mechanical and human work, heating up and reducing heat are slower/less finely tuned processes with coal. Entirely or heavily one sided statements = 1 mark max. for each Two sides comparative statements = up to 2 marks each Reserve a minimum of 1 mark for each part. Unclaimed marks can be topped up by any second comparative statements, within any of the headings. Any mixture of 1 and 2 mark statements; maximum three marks per part. [6]
Mark scheme, page 6
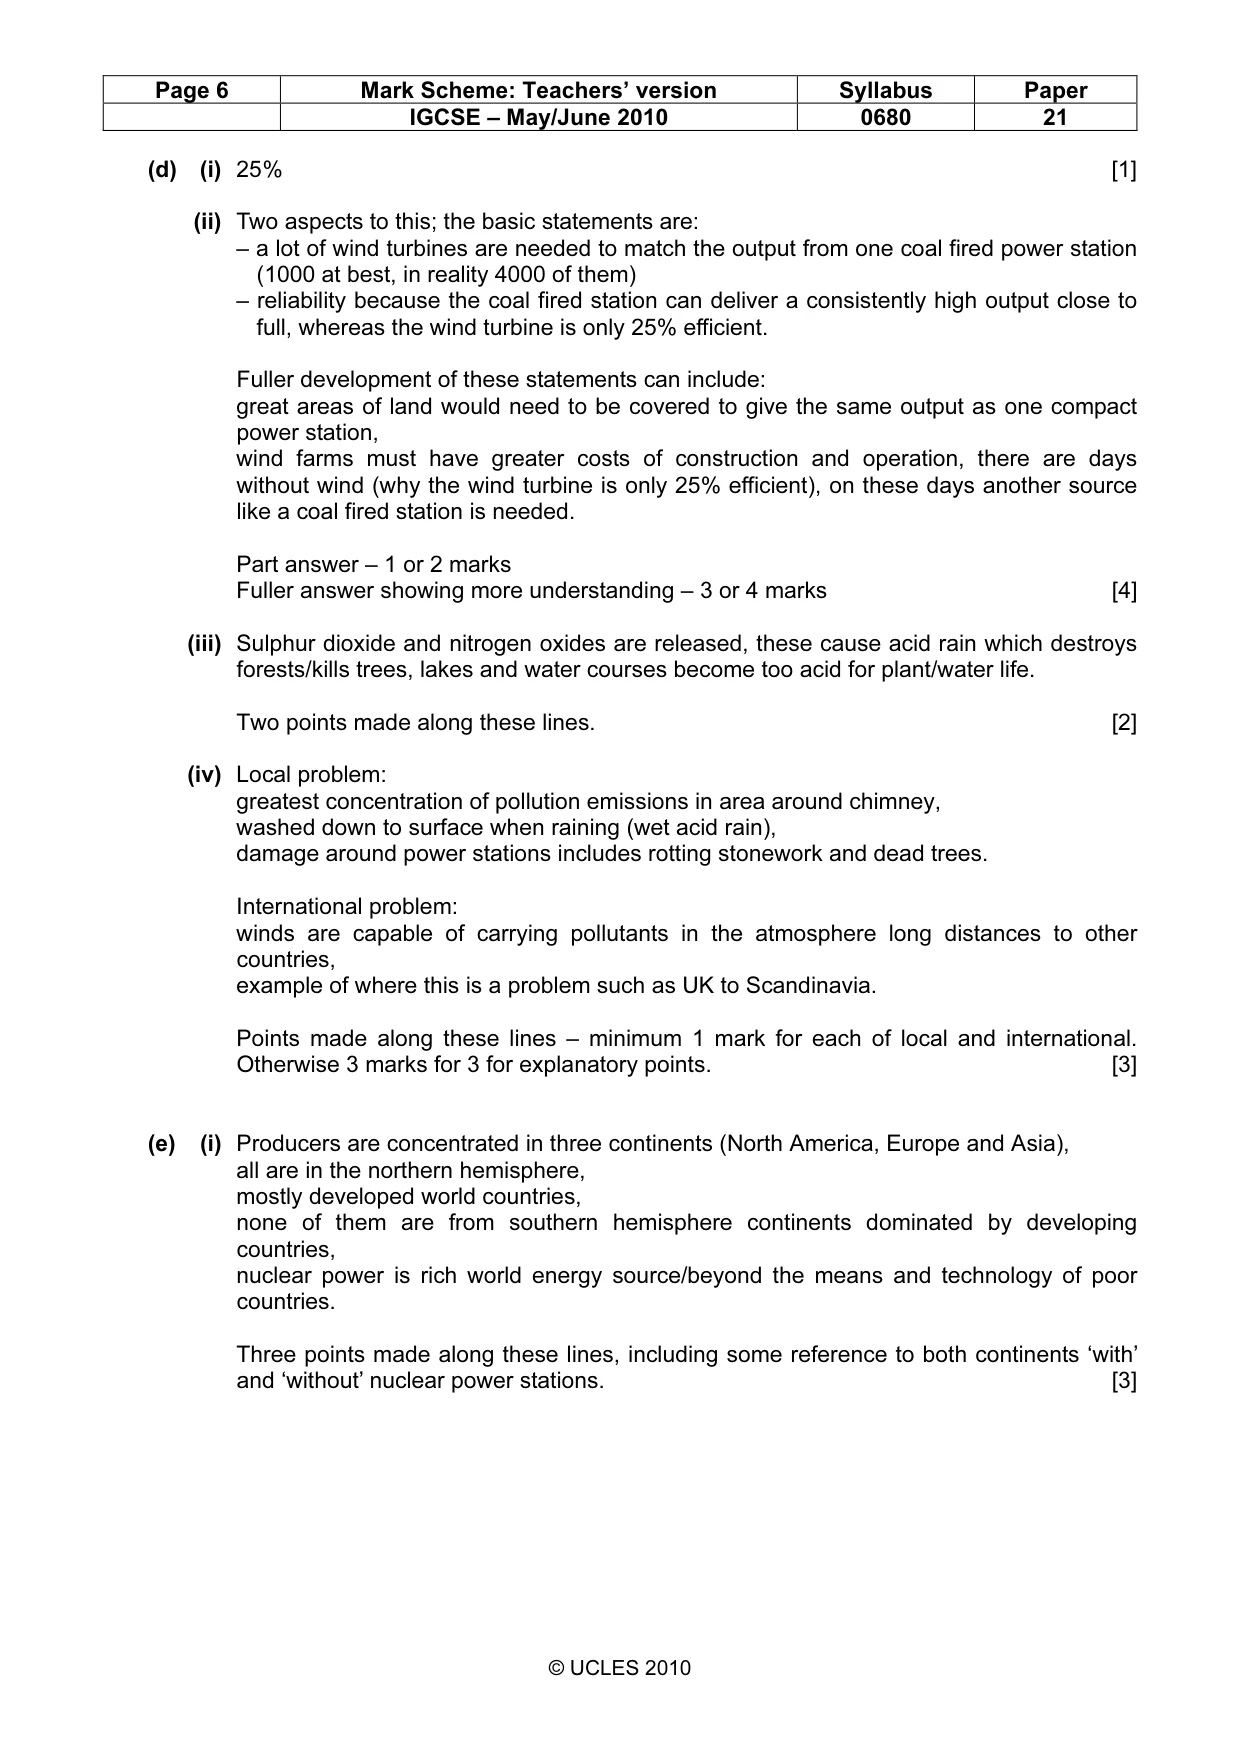
Page 6 Mark Scheme: Teachers’ version Syllabus Paper IGCSE – May/June 2010 0680 21 © UCLES 2010 (d) (i) 25 % [1] (ii) Two aspects to this; the basic statements are: – a lot of wind turbines are needed to match the output from one coal fired power station (1000 at best, in reality 4000 of them) – reliability because the coal fired station can deliver a consistently high output close to full, whereas the wind turbine is only 25% efficient. Fuller development of these statements can include: great areas of land would need to be covered to give the same output as one compact power station, wind farms must have greater costs of construction and operation, there are days without wind (why the wind turbine is only 25% efficient), on these days another source like a coal fired station is needed. Part answer – 1 or 2 marks Fuller answer showing more understanding – 3 or 4 marks [4] (iii) Sulphur dioxide and nitrogen oxides are released, these cause acid rain which destroys forests/kills trees, lakes and water courses become too acid for plant/water life. Two points made along these lines. [2] (iv) Local problem: greatest concentration of pollution emissions in area around chimney, washed down to surface when raining (wet acid rain), damage around power stations includes rotting stonework and dead trees. International problem: winds are capable of carrying pollutants in the atmosphere long distances to other countries, example of where this is a problem such as UK to Scandinavia. Points made along these lines – minimum 1 mark for each of local and international. Otherwise 3 marks for 3 for explanatory points. [3] (e) (i) Producers are concentrated in three continents (North America, Europe and Asia), all are in the northern hemisphere, mostly developed world countries, none of them are from southern hemisphere continents dominated by developing countries, nuclear power is rich world energy source/beyond the means and technology of poor countries. Three points made along these lines, including some reference to both continents ‘with’ and ‘without’ nuclear power stations. [3]
Mark scheme, page 7
Page 7 Mark Scheme: Teachers’ version Syllabus Paper IGCSE – May/June 2010 0680 21 © UCLES 2010 (ii) Arguments for nuclear power include clean in the sense of giving no carbon emissions, not contributing to global warming, source uses relatively little raw material (uranium) compared with the amount of energy produced, known technology which has been made more efficient. Arguments against nuclear power include generates wastes that are radioactive without satisfactory means of storage, remain dangerously radioactive for many years, radioactive leaks are highly dangerous to living things, causing cancers, explosion of Chernobyl contaminated a wide area, known world reserves of uranium are running down. Some arguments for or against, but simple/shallow/unsupported statements. May be very unbalanced e.g. dominated by arguments against. [1–2 marks] More substantial arguments, with something for both sides, even if not in perfect balance. More understanding shown. View may be explained no better than in an earlier statement. [3–4 marks] Arguments made for both sides. The view expressed is an overview and is supported by the explanation. [5 marks] [Total: 40]
What you needed in this session
Cambridge’s own grade thresholds for 2010 May/June, Paper 2 · Variant 1. A higher threshold means an easier paper — the bar moves with how the cohort did.