Questions as text
Q1 · There is a smaller proportion of large firms in Africa than in Asia 0987/21 May/June 2020
3 There is a smaller proportion of large firms in Africa than in Asia. The two African countries with the largest firms are Nigeria and South Africa. These two countries’ firms have more capital goods than most other African countries’ firms. Firms in South Africa produce a range of products including gold and petrochemicals. In recent years, a number of African firms have developed into multinational companies (MNCs), producing mainly in other African countries. (a) Define a capital good. [2] (b) Explain two challenges facing small firms. [4] (c) Analyse, using a demand and supply diagram, how a rise in income may affect the market for gold. [6] (d) Discuss whether or not MNCs increase production and productivity in their host countries. [8]
20 marks
Mark scheme: 3(a) Define a capital good. 2 Human-made good (1) used in production/used to produce other goods and services (1). 3(b) Explain two challenges facing small firms. 4 Logical explanation which might include: Lack of finance/difficulty raising finance (1) banks may be more reluctant to lend to small firms (1). May not be able to take advantage of economies of scale (1) may have higher average cost (1). Not well known (1) difficult to attract consumers (1). May face fierce competition from large firms (1) which may lower their prices/spend more on advertising (1). Risk of failure (1) due to inexperience of owners (1). 3(c) Analyse, using a demand and supply diagram, how a rise in income 6 may affect the market for gold. Up to 4 marks for the diagram: Axes correctly labelled – price and quantity or p and q (1). Demand and supply curves correctly labelled (1). Demand curve shifted to the right (1). Equilibriums – shown by lines P1, P2/Q1, Q2 or marking the equilibrium points E1 and E2 (1). Up to 2 marks for logical analysis: An increase in income will increase people’s ability to buy gold/raise purchasing power (1). Price will rise/quantity traded will rise (1). 3(d) Discuss whether or not MNCs increase production and productivity in 8 their host countries. In assessing each answer, use the table below. Level Description Marks 3 A reasoned discussion which accurately examines both 6–8 sides of the economic argument, making use of economic information and clear and logical analysis to evaluate economic issues and situations. One side of the argument may have more depth than the other but, overall, both sides of the argument are considered and developed. There is thoughtful evaluation of economic concepts, terminology, information and/or data appropriate to the question. The discussion may also point out the possible uncertainties of alternative decisions and outcomes. 2 A reasoned discussion which makes use of economic 3–5 information and clear analysis to evaluate economic issues and situations. The answer may lack some depth and development may be one-sided. There is relevant use of economic concepts, terminology, information and data appropriate to the question. 1 There is a simple attempt at using economic definitions 1–2 and terminology. Some reference may be made to economic theory, with occasional understanding. 0 A mark of zero should be awarded for no creditable 0 content. Why they might: • may have high demand for their products • may create demand for raw materials from domestic firms • may bring new technology and working practices into the countries • may train workers • may pay higher wages which may motivate workers. Why it might not: • may drive some domestic firms of business • may deplete natural resources, reducing output in the future • may have long/unsociable working hours • may generate external costs including pollution which may reduce the health of workers. Limit to level 2 if only production or productivity is considered.
This question in 0987/21 May/June 2020
Q2 · The population of Hungary is the most obese in Europe 0987/22 Oct/Nov 2020
3 The population of Hungary is the most obese in Europe. Hungarians eat fewer vegetables than most Europeans and more food types that may be considered to be demerit goods. In 2017, the Hungarian government introduced a tax on unhealthy food, known as the chips tax. The tax has had some success in moving demand to healthier foods. Some economists suggest that governments should use price controls as well as taxes to influence the food market. (a) Define demerit good. [2] (b) Explain the difference between an extension in demand and an increase in demand. [4] (c) Analyse the effects on income distribution and tax revenue of an increase in indirect taxes. [6] (d) Discuss whether or not a government should impose a maximum price on food. [8]
20 marks
Mark scheme: 3(a) Define demerit good. A product which is more harmful to consumers than they realise / the government considers is more harmful (2). It is over-consumed / overproduced (1) it creates external costs (1). A product that is harmful (1). 3(b) Explain the difference between an extension in demand and an increase in demand. Logical explanation which might include: An extension in demand is caused by a change in the price of the product (1) rise in quantity demanded (1) it is shown by a movement along the demand curve (1). An increase in demand is caused by a change in an influence on demand other than a change in the price of the product / means more is demanded at each and every price (1) example of a cause of an increase in demand e.g. rise in incomes (1) it is shown by a shift in the demand curve (1). 4 Up to 2 marks for diagram(s) showing the difference. Maximum of 2 marks for extension in demand and a maximum of 2 marks for an increase in demand. Question Answer Marks Guidance 3(c) Analyse the effects on income distribution and tax revenue of an increase in indirect taxes. Coherent analysis which might include: Income is likely to become less evenly distributed (1) indirect taxes are usually regressive (1) taking a larger percentage of income of the poor (1). Tax revenue likely to rise (1) will rise more on goods with inelastic demand (1) e.g. food (1) may fall if demand falls significantly (1). If any extra tax revenue is spent on lower income groups (1) e.g. welfare benefits (1) the effect on income distribution is less certain / income may be more evenly distributed (1). Tax evasion and avoidance is less common in the case of indirect taxes (1) though there may be informal markets (1). 6 Question Answer Marks Guidance 3(d) Discuss whether or not a government should impose a maximum price on food. In assessing each answer, use the table opposite. Why it should: • may influence price and quantity purchased • if set below the equilibrium level, will reduce price • some people will be able to purchase food at a lower price • may reduce poverty – food is a basic necessity • may stop monopoly food producers setting high prices. Why it should not: • if set above the equilibrium, it will have no effect • it set below the equilibrium, will result in shortages • some additional measure will have to be introduced to ration out food • some foods may be harmful to health and their consumption should be discouraged • may result in firms making losses and so reducing quality of food or employment of workers • free market forces may result in a more efficient allocation of resources. 8 Level Descriptors Mark 3 A reasoned discussion which accurately examines both sides of the economic argument, making use of economic information and clear and logical analysis to evaluate economic issues and situations. One side of the argument may have more depth than the other, but overall both sides of the argument are considered and developed. There is thoughtful evaluation of economic concepts, terminology, information and/or data appropriate to the question. The discussion may also point out the possible uncertainties of alternative decisions and outcomes. 6–8 2 A reasoned discussion which makes use of economic information and clear analysis to evaluate economic issues and situations. The answer may lack some depth and development or may be one-sided. There is relevant use of economic concepts, terminology, information and data appropriate to the question. 3–5 1 There is a simple attempt at using economic definitions and terminology. Some reference may be made to economic theory, with occasional understanding. 1–2 0 A mark of zero should be awarded for no creditable content. 0 Question Answer Marks Guidance 3(d) Example of L2 answer: Government should impose a maximum price on foods. Price is likely to fall and this will aid those in poverty. They will be able to buy basic necessities easier and allow them to spend on other things. Governments should not impose a maximum price on food as it can cause businesses to make a loss and need government subsidisation. Principal Examiner comment: Reasonable on one side and limited on the other side. The effect on price, quantity demanded and quantity supplied may be shown on a diagram.
This question in 0987/22 Oct/Nov 2020
Q3 · There is an area of rubbish, three times the size of France, floating in the Pacific… 0987/21 May/June 2021
2 There is an area of rubbish, three times the size of France, floating in the Pacific Ocean called the Great Pacific Garbage Patch. It is made up of rubbish including old fishing nets but most is plastic waste. It is forecast that, by 2050, there will be more plastic in the Pacific Ocean than fish. A number of islands in the Pacific Ocean specialise in fishing. Greater pollution will increase the social cost of the fishing industry. (a) Identify the two types of costs that make up social cost. [2] (b) Explain two causes of a shift to the right in the demand curve for fish. [4] (c) Analyse how cleaning up pollution could benefit an economy. [6] (d) Discuss whether or not countries specialising benefits consumers. [8]
20 marks
Mark scheme: 2(a) Identify the two types of costs that make up social cost. Private costs (1) External costs (1). 2 2(b) Explain two causes of a shift to the right in the demand curve for fish. Logical explanation which might include: • Rise in the price of a substitute for fish (1) people will switch away from buying e.g. chicken to buying fish (1). • Fall in the price of a complement for fish (1) people will buy more of the complement (1). • A rise in income (1) people will be able to afford to buy more fish (1). • A report stating eating fish is good for health / changes in tastes (1) people may buy more fish to try to increase their life expectancy (1). • Increase in population size (1) more people to buy fish (1). • A successful advertising campaign (1) may persuade more people to buy fish (1). 4 One mark each for each of two causes identified and one mark each for each of two explanations. Question Answer Marks Guidance 2(c) Analyse how cleaning up pollution could benefit an economy. Coherent analysis which might include: • Will reduce external costs (1) improve health / less sickness (1) raise quality of life / standard of living (1). • Less (government) spending on healthcare (1) more can be spent on other priorities e.g., education (1). • Cleaning up pollution may create jobs / employment (1) reduce unemployment (1) may attract MNCs (1) increase in incomes (1) reduction in poverty (1). • Recycling of some of the material collected (1) could increase the country’s output (1) less use of non- renewable resources (1). • Better working conditions (1) productivity of labour could increase (1) reduce costs of production (1) increase output (1) reduce unemployment (1) reduce inflation (1). • Improve the environment (1) Increase tourism (1) increase exports of services (1) improve the current account position (1). • Reduction in ocean pollution (1) will improve fish stock (1) improve quality of fish (1) greater catches of fish (1) leading to rise in incomes / revenue / GDP (1). 6 Question Answer Marks Guidance 2(d) Discuss whether or not countries specialising benefits consumers. In assessing each answer, use the table opposite. Why it might: • countries may specialise in what they are best at producing • output may rise • greater availability • costs of production may fall • prices may fall • quality may rise • better paid jobs increasing purchasing power of consumers Why it might not: • a country may gain a monopoly of production, raising price and lowering quality • choice may be reduced / greater reliance on imports • other countries’ producers may have lower health and safety standards • supply problems may affect a particular country, cutting off supplies • trade disputes may cut off supplies 8 Reward but do not expect reference to absolute and comparative advantage. Level Description Marks 3 A reasoned discussion which accurately examines both sides of the economic argument, making use of economic information and clear and logical analysis to evaluate economic issues and situations. One side of the argument may have more depth than the other, but overall both sides of the argument are considered and developed. There is thoughtful evaluation of economic concepts, terminology, information and/or data appropriate to the question. The discussion may also point out the possible uncertainties of alternative decisions and outcomes. 6–8 2 A reasoned discussion which makes use of economic information and clear analysis to evaluate economic issues and situations. The answer may lack some depth and development may be one- sided. There is relevant use of economic concepts, terminology, information and data appropriate to the question. 3–5 Question Answer Marks Guidance 2(d) Level Description Marks 1 There is a simple attempt at using economic definitions and terminology. Some reference may be made to economic theory, with occasional understanding. 1–2 0 A mark of zero should be awarded for no creditable content. 0
This question in 0987/21 May/June 2021
Q4 · Singapore is a high-income country with a shortage of land and labour 0987/21 May/June 2022
5 Singapore is a high-income country with a shortage of land and labour. Singapore is often given as an example of a market economy. The Singaporean government does, however, intervene in the economy. For example, it encourages its population to eat two servings of fruit and two servings of vegetables per day. (a) Identify the reward to labour and the reward to land. [2] (b) Explain how an increase in a worker’s income can affect their mobility of labour. [4] (c) Analyse, using a demand and supply diagram, how a greater awareness of the health benefits of eating fruit will affect the market for fruit. [6] (d) Discuss whether or not a market economic system benefits an economy. [8]
20 marks
Mark scheme: 5(a) Identify the reward to labour and the reward to land. Wages (1) rent (1). 2 Question Answer Marks Guidance 5(b) Explain how an increase in a worker’s income can affect their mobility of labour. Logical explanation which might include: An increase in income will enable a worker to spend more on their education (1) increasing occupational mobility (1). Higher income will make housing more affordable (1) increasing geographical mobility (1). Higher income will make high-tech products more affordable (1) enabling a worker to be better informed (1) increasing both occupational and geographical mobility (1). Higher incomes may discourage a worker from changing jobs / may be content with current job (1) may be satisfied with income level (1) reducing geographical and occupational mobility (1). Higher incomes make it easier to afford car / use public transport (1) increases geographical mobility (1). 4 No marks for causes of higher income. Question Answer Marks Guidance 5(c) Analyse, using a demand and supply diagram, how a greater awareness of the health benefits of eating fruit will affect the market for fruit. Coherent analysis which might include: Up to 4 marks for D & S diagram: Axes correctly labelled–price and quantity or p and q (1). Original demand and supply curves correctly labelled (1). New demand curve shifted to the right (1). Equilibriums–shown by lines P1 and Q1 and P2 and Q2 or equilibrium points E1 and E2 (1). Up to 2 marks for written analysis which might include: Greater awareness of health benefits will encourage more people to eat / demand fruit (1) Raise price / raise quantity traded (1). 6 Note Note: Axes do not have to be labelled price of fruit and quantity of fruit to get mark. No marks for stating price changes from P1 to P2 or quantity changes from Q1 to Q2. To get first mark in written analysis they must refer to fruit. Question Answer Marks Guidance 5(d) Discuss whether or not a market economic system benefits an economy. In assessing each answer, use the table opposite. Why it might: profit incentive and competition may increase efficiency wage differentials may encourage effort price may be low and quality high country’s products may be internationally competitive economic growth may be high consumer choice may be high consumer sovereignty may be high Why it might not: risk of market failure public goods will not be provided demerit goods are overconsumed and merit goods and under-consumed problem of pollution and other external costs unemployment may be high as lack of co-ordination some countries may lack the support structures e.g., legal system to enforce property rights to allow market forces to work efficiently. monopolies can be created 8 Level Description Marks 3 A reasoned discussion which accurately examines both sides of the economic argument, making use of economic information and clear and logical analysis to evaluate economic issues and situations. One side of the argument may have more depth than the other, but overall, both sides of the argument are considered and developed. There is thoughtful evaluation of economic concepts, terminology, information and / or data appropriate to the question. The discussion may also point out the possible uncertainties of alternative decisions and outcomes. 68 Question Answer Marks Guidance 5(d) Level Description Marks 2 A reasoned discussion which makes use of economic information and clear analysis to evaluate economic issues and situations. The answer may lack some depth and development may be one- sided. There is relevant use of economic concepts, terminology, information and data appropriate to the question. 35 1 There is a simple attempt at using economic definitions and terminology. Some reference may be made to economic theory, with occasional understanding. 12 0 A mark of zero should be awarded for no creditable content. 0
This question in 0987/21 May/June 2022
Q5 · In 2019, France produced inside its production possibility curve (PPC) 0987/22 May/June 2022
3 In 2019, France produced inside its production possibility curve (PPC). France exports a wide range of its products. It is the world’s top exporter of luxury perfume and the 7th largest exporter of soap. Changes in technology affect the products people produce and buy. The French government plans to upgrade its infrastructure for all households to have internet access. (a) Define a production possibility curve. [2] (b) Explain why demand for soap is more price-inelastic than demand for a luxury brand of perfume. [4] (c) Analyse, using a demand and supply diagram, how an increase in income will affect the market for a luxury brand of perfume. [6] (d) Discuss whether or not the public sector should be responsible for the supply of all internet services. [8]
20 marks
Mark scheme: 3(a) Define a production possibility curve. A diagram showing maximum output / possible combinations (1) of two types of products / of capital and consumer goods (1) with given resources / given technology / in a given time period (1) shows opportunity cost (1). 2 Nothing for a diagram, 3(b) Explain why demand for soap is more price-inelastic than demand for a luxury brand of perfume. Logical explanation which might include: Soap is more essential / necessary than a luxury brand of perfume (2) OR soap is a necessity (1) luxury brand of perfume does not have to be purchased / not essential / a want (1). Soap has fewer substitutes than a luxury brand of perfume (2) OR soap does not have close substitutes (1) whereas a luxury brand of perfume may have close substitutes (1). Soap is likely to take up a smaller proportion of income than a luxury brand of soap (2) OR soap is likely to take only a small proportion of income (1) whereas a luxury brand of perfume is likely to take up a large proportion (1). It is harder to delay the purchase of soap than the purchase of a luxury brand of perfume OR the purchase of soap cannot be delayed (1) while the purchase of a luxury brand of perfume can be (1). 4 Question Answer Marks Guidance 3(c) Analyse, using a demand and supply diagram, how an increase in income will affect the market for a luxury brand of perfume. Coherent analysis which might include: Up to 4 marks for the diagram: D and S diagram: Axes correctly labelled – price and quantity or p and q (1). Original demand and supply curves correctly labelled (1). New demand curve shifted to the right (1). Equilibriums – shown by lines or equilibrium points (1). Up to 2 marks for written analysis which might include: Luxury perfume will be more affordable / greater purchasing power / luxury perfume will take a smaller proportion of income / more will be demanded at the same price (1) price will rise / quantity traded will increase (1). 6 Written analysis An increase in income will cause an increase in demand for luxury perfume is not sufficient for a mark. Reward but do not expect reference to a luxury brand of perfume being a normal good. Question Answer Marks Guidance 3(d) Discuss whether or not the public sector should be responsible for the supply of all internet services. In assessing each answer, use the table opposite. Why it might: government may charge a low price enable poor to gain access to the internet, help children with education government may base decisions on social costs and benefits government can control what is on the internet may be more able to take advantage of economies of scale avoidance of wasteful duplication government may take a longer-term view on investing. Why it might not: opportunity cost – could have spent the money on e.g. healthcare private sector may invest more private sector may be more efficient / have lower costs of production profit incentive may encourage private sector to raise quality private sector may make decisions quicker. 8 Level Description Marks 3 A reasoned discussion which accurately examines both sides of the economic argument, making use of economic information and clear and logical analysis to evaluate economic issues and situations. One side of the argument may have more depth than the other, but overall, both sides of the argument are considered and developed. There is thoughtful evaluation of economic concepts, terminology, information and/or data appropriate to the question. The discussion may also point out the possible uncertainties of alternative decisions and outcomes. 68 Question Answer Marks Guidance 3(d) 2 A reasoned discussion which makes use of economic information and clear analysis to evaluate economic issues and situations. The answer may lack some depth and development may be one-sided. There is relevant use of economic concepts, terminology, information and data appropriate to the question. 35 1 There is a simple attempt at using economic definitions and terminology. Some reference may be made to economic theory, with occasional understanding. 12 0 A mark of zero should be awarded for no creditable content. 0
This question in 0987/22 May/June 2022
Q6 · Calculate Australia’s unemployment rate in 2021 0987/21 May/June 2023
1 (a) Calculate Australia’s unemployment rate in 2021. [1] (b) Identify two substitutes for coal. [2] (c) Explain one economy of scale that could benefit a coal-mining firm. [2] (d) Explain two influences on the price elasticity of supply of coal. [4] (e) Draw a demand and supply diagram to show how setting a maximum price below the equilibrium price will affect a market. [4] (f) Analyse whether large coal-producing countries are likely to be net exporters of coal. [5] (g) Discuss whether or not an increase in the size of its coal industry will benefit the Australian economy. [6] (h) Discuss whether or not Australia is likely to have a budget deficit in 2026. [6]
30 marks
Mark scheme: 1(a) Calculate Australia’s unemployment rate in 2021. 4% Allow 4 without percentage 1(b) Identify two substitutes for coal. Two from: gas offshore wind / wind power solar power / panels 2 1(c) Explain one economy of scale that could benefit a coal- mining firm. Managerial / labour economy (1) employing specialist workers e.g. mining engineers (1). Technical economy (1) employing efficient / technologically advanced equipment e.g. drones (1). External economy of scale (1) example e.g. skilled labour force (1). 2 One mark for the economy of scale identified and one mark for an explanation. 1(d) Explain two influences on the price elasticity of supply of coal. Storage time (1) expensive to store so inelastic supply (1). Construction of new mine / production time (1) takes a long time, so inelastic supply (1). Stocks (1) may make supply elastic (1). 4 One mark each for each of two influences identified and one mark each for each of two explanations. Question Answer Marks Guidance 1(e) Draw a demand and supply diagram to show how setting a maximum price below the equilibrium price will affect a market. Demand and supply diagram: Axes correctly labelled – price and quantity or p and q (1). Demand and supply curves correctly labelled (1). Price line set below the equilibrium (1). Demand shown as greater than supply (1) e.g. has the two dotted lines downwards (it does not have to be labelled Qs and Qd). 4 Note: Accept unlabelled price line / line drawn only to demand curve. Accept shortage if correctly identified on the diagram. Do not accept demand greater than supply if demand and supply curves are incorrectly drawn Question Answer Marks Guidance 1(f) Analyse whether large coal-producing countries are likely to be net exporters of coal. Coherent analysis which might include: Expected outcome: Large coal-producing countries may have a surplus to sell / may have grown their production in order to sell abroad (1) most of the evidence supports this relationship (1). Supporting evidence: Five of the seven countries consume less coal than they produce (1) calculation e.g. US could have exported 11 million tonnes / Australia could have exported 394 million tonnes or simply the difference (1). Analysis: Countries that produce more coal than they consume may benefit from economies of scale / can export because their prices are low (1). Exceptions: China or India are an exception (1) as they consumed more coal than they produced (1). Analysis: They may have been net importers (1) since had used up stocks of coal / need more energy as a developing country (1) may not be able to export coal if world demand for coal is low / countries may both import and export coal (1). 5 Responses do not have to be in the format suggested but they should address the expected / normal outcome, offer supporting evidence of that, highlight any exceptions to that, and analyse the overall data. Question Answer Marks Guidance 1(g) Discuss whether or not an increase in the size of its coal industry will benefit the Australian economy. Award up to 4 marks for logical reasons why it might, which may include: may increase GDP / economic growth (1) increasing living standards / raise incomes / reduce poverty (1) may reduce unemployment (1) structural unemployment (1) may improve current account position / have a surplus (1) as Australia seems to be a net exporter of coal (1) may increase tax revenue (1) increasing government’s ability to spend (1) economies of scale (1) result in lower prices for households and industries (1). Award up to 4 marks for logical reasons why it might not, which may include: may increase pollution (1) lowering living standards / cause health issues (1) reduce tourism / negative impact on current account (1) other forms of power may not be developed (1) example (1) some workers may leave other jobs (1) these jobs may have better working conditions (1) coal mining is a relatively dangerous industry (1) so life expectancy may be reduced / creates chronic illnesses / workers unable to work (1). Global demand for coal may fall (1) impact upon Australia e.g. unsold stock (1). May rapidly deplete stocks (1) leading to lower exports (1) and less employment (1). 6 Apply this example to all questions with the command word DISCUSS (1g, 1h, 2d, 3d, 4d and 5d) Each point may be credited only once, on either side of an argument, but separate development as to how/why the outcome may differ is rewarded. Generic example Mark Tax revenue may decrease … 1 … because of reason e.g. incomes may be lower. 1 Tax revenue may increase because incomes may be higher i.e. reverse of a previous argument. 0 Tax revenue may increase because of a different reason i.e. not the reverse of a previous argument e.g. government spending on subsidies may stimulate the economy more than spending on education. 1 Question Answer Marks Guidance 1(h) Discuss whether or not Australia is likely to have a budget deficit in 2026. Award up to 4 marks for logical reasons why it might, which may include: unemployment is forecast to increase (1) so there may be more government spending on unemployment benefits (1) less income tax revenue (1) there may be more government spending on retraining unemployed workers (1) some of the rise in population may result in more government spending (1) e.g. on pensions / healthcare / education (up to 2 marks) budget deficit in previous years (1) would mean interest would have to be paid on the debt that has built up (1). Award up to 4 marks for logical reasons why it might not, which may include: population and the labour force are forecast to increase (1) so there may be more taxpayers / fewer claiming benefits (1) tax revenue may rise (1) due to higher profits / higher tax rates (1) GDP is forecast to increase (1) more people in work (1) which would be likely to increase direct and indirect tax revenue (1) state support for industries may fall (1) may have been high in 2021 due to Covid-19 (1). 6
This question in 0987/21 May/June 2023
Q7 · Living standards, including education, have improved for most people in South Africa in… 0987/21 May/June 2023
2 Living standards, including education, have improved for most people in South Africa in recent years. Most households have more money and the government has more tax revenue. There is, however, considerable income inequality. In 2020, 36% of the population were living in poverty. An increase in unemployment benefit payments might reduce this poverty. (a) Identify two functions of money. [2] (b) Explain how improved education may affect the demand for cigarettes and for fresh fruit. [4] (c) Analyse the causes of an increase in a government’s tax revenue. [6] (d) Discuss whether or not an increase in unemployment benefit payments would reduce poverty. [8]
20 marks
Mark scheme: 2(a) Identify two functions of money. Two from: Medium of exchange Unit of account / measure of value Store of value Standard of deferred payments 2 Note: a description of the function, without the term, gets a mark e.g. money can be used to buy and sell products, may be used to trade. Nothing for characteristics of money. If more than two functions are given, consider the first three. 2(b) Explain how improved education may affect the demand for cigarettes and for fresh fruit. Logical explanation which might include: It may reduce demand for cigarettes (1) people may be better informed about harmful effects / cigarettes are a demerit good (1). It may increase demand for fresh fruit (1) people may be better informed about beneficial effects / fresh fruit is a merit good / may gain better paid jobs and so able to afford fresh food (1). 4 Only accept demand for cigarettes may increase if linked to higher income (resulting from improved education). One mark for each of two reasons identified and one for each of two explanations. Question Answer Marks Guidance 2(c) Analyse the causes of an increase in a government’s tax revenue. Coherent analysis which might include: Tax revenue is government income / part of government fiscal policy (1) which can be spent on government objectives e.g. education (1) Increase in employment (1) increase in income (1) More convenient (1) easier to pay (1) and collect the tax (1) higher income tax revenue (1) Increase in spending (1) higher indirect tax revenue (1) Increase in profits (1) higher corporation tax (1) Increase in population (1) more people to pay taxes (1) Change in tax rates (1) higher tax rates can increase revenue without a change in income / spending / profits (1) lower tax rates may reduce tax avoidance / evasion (1) increase incentives (1) Greater efficiency in tax collection (1) reduction in corruption / simpler forms (1) Wider tax base (1) more products / more people taxed (1) Increase in imports (1) higher revenue from tariffs (1). 6 Question Answer Marks Guidance 2(d) Discuss whether or not an increase in unemployment benefit payments would reduce poverty. In assessing each answer, use the table opposite. Why it might: raise incomes of those on low incomes may enable them to buy more basic necessities may reduce absolute poverty may increase total demand higher total demand may reduce unemployment Also enable them to seek education / become more employable Why it might not: may be a disincentive to find employment people may become dependent on benefits will not help all those on low incomes e.g. the retired and the sick may not reduce relative poverty some of the unemployed may not claim benefits opportunity cost – government could spend on e.g. education which might be more effective. Size of unemployment benefit may be small and may be less than inflation 8 Level Description Marks 3 A reasoned discussion which accurately examines both sides of the economic argument, making use of economic information and clear and logical analysis to evaluate economic issues and situations. One side of the argument may have more depth than the other, but overall, both sides of the argument are considered and developed. There is thoughtful evaluation of economic concepts, terminology, information and / or data appropriate to the question. The discussion may also point out the possible uncertainties of alternative decisions and outcomes. 6–8 2 A reasoned discussion which makes use of economic information and clear analysis to evaluate economic issues and situations. The answer may lack some depth and development may be one-sided. There is relevant use of economic concepts, terminology, information and data appropriate to the question. 3–5 1 There is a simple attempt at using economic definitions and terminology. Some reference may be made to economic theory, with occasional understanding. 1–2 0 A mark of zero should be awarded for no creditable content. 0
This question in 0987/21 May/June 2023
Q8 · Calculate the number of people who were living in poverty in Guyana in 2020 0987/22 May/June 2023
1 (a) Calculate the number of people who were living in poverty in Guyana in 2020. [1] (b) Identify two causes of the decrease in the output of sugar in 2020. [2] (c) Explain how economic growth is measured. [2] (d) Explain two reasons why labour mobility may increase in Guyana in the future. [4] (e) Draw a demand and supply diagram to show the effect of a decrease in the price of rail transport on the market for car transport. [4] (f) Analyse the relationship between GDP per head and internet access. [5] (g) Discuss whether or not the discovery of oil is likely to increase living standards in Guyana. [6] (h) Discuss whether or not Guyana would benefit from an increase in the size of its population. [6]
30 marks
Mark scheme: 1(a) Calculate the number of people who were living in poverty in Guyana in 2020. 276 500 (1). 1 1(b) Identify two causes of the decrease in the output of sugar in 2020. Bad weather (1) falling (global) demand (1). 2 If more than two causes given, consider the first three. 1(c) Explain how economic growth is measured. Real (1) GDP / national / country’s output / income / expenditure (1). 2 If more than two ways given, consider the first three. Not accepting GDP per head for GDP. 1(d) Explain two reasons why labour mobility may increase in Guyana in the future. Logical explanation which might include: Increased government spending on education / improved education (1) improved skills / productivity / occupational mobility (1). Improved / cheaper rail travel / increased spending on infrastructure / improved infrastructure (1) easier to work further away / increased ability to work in other areas / increased geographical mobility (1). Increased government spending on the internet (1) people learn new skills / gain information about job opportunities / increase occupational mobility (1). May be net immigration (1) migrants may be skilled / may be more willing to move to different areas of the country (1). 4 One mark each for each of two reasons identified and one mark each for each of two explanations. If more than two reasons given, consider the first three. Question Answer Marks Guidance 1(e) Draw a demand and supply diagram to show the effect of a decrease in the price of rail transport on the market for car transport. Demand and supply diagram: Axes correctly labelled – price and quantity or p and q (1). Original demand and supply curves correctly labelled (1). Demand curve shifted to the left (1). Equilibriums – shown by lines P1 and Q1 and P2 and Q2 or equilibrium points marked as E1 and E2 (1). 4 Question Answer Marks Guidance 1(f) Analyse the relationship between GDP per head and internet access. Coherent analysis which might include: Expected relationship: Direct / positive (1) the higher the GDP per head, the higher the internet access (1) Supporting evidence: Up to two marks E.g. Iceland with the highest GDP per head had the highest % of the population with internet access Eritrea with the lowest GDP per head had the least internet access France with the second highest GDP per head has the second highest % of population with internet access Analysis of expected relationship: Higher GDP per head increases household’s ability to pay for internet access / higher internet access may increase productivity/efficiency / increase job opportunities (1) higher GDP per head increases tax revenue, some of which can be spent on the provision of internet access / higher productivity/efficiency could increase wages (1). Exception: Guyana / Morocco (1) Guyana had a higher GDP per head but low internet access (1). Analysis of exception: Internet access is determined by other influences e.g. education levels (1). 5 Responses do not have to be in the format suggested but they should address the expected / normal relationship, offer supporting evidence of that, highlight any exceptions to that, and analyse the overall data. In terms of supporting evidence: no marks for just description of the figures e.g. Brazil had a GDP per head of $8717 and 72% of the population with internet access / Eritrea had a GDP per head of $643 and 2% of population with internet access. France had a GDP of $40 494 and 83% of the population with internet access etc. In terms of supporting evidence one mark maximum for an indirect comparison e.g. Iceland had a GDP per head of $66 945 and 99% population with internet access whereas in Zambia with a GDP per head of $1,305, only 29% of the population had access to the internet. Question Answer Marks Guidance 1(g) Discuss whether or not the discovery of oil is likely to increase living standards in Guyana. Award up to 4 marks for logical reasons why it might, which may include: increase exports (1) increase economic growth / higher national output (1) and raise incomes / increase GDP per head (1) increase purchasing power / able to buy more goods and services / able to buy basic necessities (1) could reduce poverty (1) create jobs / reduce unemployment / increase employment (1) discourage emigration / encourage immigration (1). raise tax revenue (1) allowing the government to spend more on e.g. education and healthcare (1) MNCs may spend on e.g. improving infrastructure / training (1). Award up to 4 marks for logical reasons why it might not, which may include: may create pollution (1) create external costs / damage the environment (1) which will harm people’s health / reduce life expectancy (1) may be poor working conditions in the industry (1) affecting health of workers (1) the foreign MNC may send much of the profit back to its country (1) it may drive domestic oil firms out of business (1) may deplete the country’s oil reserves (1) the foreign MNC may employ workers from its own country (1) global demand for oil may fall /may be overdependence on oil / other countries may impose trade restrictions on oil. (1) 6 3rd bullet point: increase in government spending should be linked to a form of spending that could increase living standards. Apply this example to all questions with the command word DISCUSS (1g, 1h, 2d, 3d, 4d and 5d) Each point may be credited only once, on either side of an argument, but separate development as to how/why the outcome may differ is rewarded. Generic example Mark Tax revenue may decrease … 1 ... because of reason e.g. incomes may be lower. 1 Tax revenue may increase because incomes may be higher i.e. reverse of a previous argument. 0 Tax revenue may increase because of a different reason i.e. not the reverse of a previous argument e.g. government spending on subsidies may stimulate the economy more than spending on education. 1 Question Answer Marks Guidance 1(h) Discuss whether or not Guyana would benefit from an increase in the size of its population. Award up to 4 marks for logical reasons why it might, which may include: population is below the optimum level / move to the optimum level (1), could make better use of resources (1) if rise due to immigration (1) may bring in new ideas / new production methods / new skills / new technology (1) an increase in the size of the labour force (1) if the number of people of working age increases (1) rise in tax revenue (1) allowing the government to spend more on e.g. education and healthcare (1) consumer expenditure may increase (1) total (aggregate) demand may increase (1) output could increase / cause economic growth / increase productive potential (1) dependency ratio could fall (1) Award up to 4 marks for logical reasons why it might not, which may include: larger population could result in pollution / congestion / overcrowding (1) damage the environment / increase external costs (1) if rise due to fall in death rate or rise in the birth rate / increase in young / old population (1), the dependency ratio will increase (1) some of the extra population may be unemployed (1) 6 Question Answer Marks Guidance 1(h) pressure may be put on e.g. housing / welfare payments (1) increasing need for government expenditure (1) there may be inflation (1) population may increase to the extent that there is overpopulation (1) resources may be depleted (more quickly) (1). 6
This question in 0987/22 May/June 2023
Q9 · Calculate what percentage of Honduran people did not have access to electricity in 2020 0987/22 Oct/Nov 2023
1 (a) Calculate what percentage of Honduran people did not have access to electricity in 2020. [1] (b) Identify two benefits the Honduran economy could gain from a growth in the US economy. [2] (c) Explain one advantage of an economy specialising. [2] (d) Explain two ways a government could redistribute income. [4] (e) Draw a demand and supply diagram to show how a report stating that bananas are good for health would affect the market for bananas. [4] (f) Analyse the relationship between the percentage of population living in poverty and life expectancy. [5] (g) Discuss whether or not the cost of producing clothes in Honduras will fall in the future. [6] (h) Discuss whether or not a fall in unemployment in Honduras is likely to cause inflation. [6]
30 marks
Mark scheme: Question Answer Marks Guidance 1(a) Calculate what percentage of Honduran people did not 1 Accept 8.0 or 8.3. have access to electricity in 2020. 8.3%. 1(b) Identify two benefits the Honduran economy could gain 2 If more than two benefits are given, consider the first three. from a growth in the US economy. Accept increase trade for more exports. Sell more exports to the US (1). Receive more money from Honduran workers in the US (1). Accept increase employment / lower unemployment for More job opportunities for Honduran workers in the US (1). more job opportunities. 1(c) Explain one advantage of an economy specialising. 2 One mark for an advantage identified and one mark an explanation. Gain skills (1) raise productivity / raise efficiency / ‘practice Identification mark must come directly from the source makes perfect’ / lower costs of production / raise quality / material. increase output / supply / less waste (1). A relevant explanation mark can be given even in the Gain a good reputation (1) increase demand (1). absence of an identification. 1(d) Explain two ways a government could redistribute 4 One mark each for each of two ways identified and one income. mark each for each of two explanations. Logical explanation which might include: If more than two reasons given, consider the first three. Provision of unemployment benefit / state benefit / welfare benefit / benefits (1) raise income of those on low or no One mark for taxing the rich and giving to the poor. income / enable the unemployed to buy basic necessities / reduce absolute poverty (1). Progressive income tax system (1) takes a higher proportion of the income of the rich / use some of tax revenue raised to increase spending to help those on low incomes (1). 1(e) Draw a demand and supply diagram to show how a 4 report stating that bananas are good for health would affect the market for bananas. Coherent analysis which might include: Demand and supply diagram: Axes correctly labelled – price and quantity or p and q (1). Original demand and supply curves correctly labelled (1). Demand curve shifted to the right (1). Equilibriums – shown by lines P1 and Q1 and P2 and Q2 or equilibrium points marked as E1 and E2 (1). If a candidate draws two diagrams, they may be able to get 3 marks: 1 mark for axes 1 mark for D & S labelled correctly 1 mark for the demand curve shifted to the right. They would not get the mark for the equilibriums as the two diagrams are likely to conflict on this. 1(f) Analyse the relationship between the percentage of 5 Responses do not have to be in the format suggested but population living in poverty and life expectancy. they should address the expected/normal relationship, offer supporting evidence of that, highlight any exceptions to that, Coherent analysis which might include: and analyse the overall data. Expected relationship: Inverse / negative (1) the higher the level of poverty, the lower the life expectancy / the lower the level of poverty, the higher the life expectancy (1). Supporting evidence: Sweden has the lowest % of population living in poverty and the highest life expectancy / The country / two countries / three countries / four countries with the lowest levels of poverty head had the longest life expectancy (1) the two countries, Chad and South Sudan, with the highest level of poverty had the lowest life expectancy (1). Analysis of expected relationship: A high level of poverty is likely to mean poor healthcare (1) low nutrition / poor housing / poor sanitation / low levels of education (1). Exception: Chad / South Sudan (1) Chad had a lower level of poverty but also a lower level of life expectancy than South Sudan (1) Analysis of exception: Life expectancy is determined by other influences e.g. wars (1). 1(g) Discuss whether or not the cost of producing clothes in 6 Allow higher productivity / efficiency once either in Honduras will fall in the future. connection with labour or capital. Some points may be given in reverse e.g. price of raw Award up to 4 marks for logical reasons why it might, which materials may fall. may include: Not accepting subsidising the clothes industry as the source • more training (1) better working conditions (1) may material indicates that it is a successful industry. increase labour productivity / efficiency / skills (1) reduce labour costs (1) Apply this example to all questions with the command • more use of capital goods (1) may reduce disruption to word DISCUSS production / make fewer mistakes / less waste (1) speed (1(g), 1(h), 2(d), 3(d), 4(d) and 5(d)) up production / increase productivity / efficiency (1) • improved working conditions (1) may reduce industrial Each point may be credited only once, on either side of an action (1) more motivation (1) argument, but separate development as to how/why the • successful clothes industry so firms may grow in size (1) outcome may differ is rewarded. more able to take advantage of economies of scale (1). Generic example Mark Award up to 4 marks for logical reasons why it might not, which may include: Tax revenue may decrease… 1 • price of raw materials may rise (1) may be subject to bad weather (1) exchange rate may fall / tariffs may be ...because of reason e.g. incomes 1 imposed on imported raw materials (1) reduce supply may be lower. (1) country has experience of inflation (1) • unemployment may fall (1) making it more difficult for Tax revenue may increase 0 the clothes industry to recruit labour (1) strengthening because incomes may be higher the bargaining power of workers (1) raising wages / i.e. reverse of a previous increasing labour costs (1) argument. • providing training (1) and better working conditions will involve a cost (1) Tax revenue may increase 1 • more use of capital goods may involve initial high because of a different reason i.e. not the reverse of a previous spending on equipment (1) firms may experience argument e.g. government diseconomies of scale (1) • higher indirect tax / tax may be imposed (on clothes / spending on subsidies may stimulate the economy more than clothes firms) (1). spending on education. 1(h) Discuss whether or not a fall in unemployment in 6 Honduras is likely to cause inflation. Award up to 4 marks for logical reasons why it might, which may include: • unemployment is already low (1) may move towards full employment (1) may push up wages (1) increase (average) costs (1) cause cost-push inflation / total supply less than total demand (1) • lower unemployment may increase incomes (1) causing a rise in consumer spending / purchasing power (1) increasing total demand (1) causing demand-pull inflation / total demand higher than total supply (1). • inflation already exists (1) which may lead workers to expect it to continue (1) increasing wage claims (1). Award up to 4 marks for logical reasons why it might not, which may include: • may be higher investment (1) could increase total supply / total supply may rise in line with total demand (1) reducing cost-push inflation (1) • lower unemployment could reduce spending on unemployment benefit (1) increase tax revenue (1) reduce the budget deficit (1) reduce the growth in total demand (1) some of higher tax revenue could be spent on supply-side policy / unemployment may have fallen due to supply-side policy (1) • the extra income may be saved / spent on imports (1) due to uncertainty about the future (1) • A fall in unemployment does not necessarily mean a rise in employment (1) the unemployed could have e.g. retired / emigrated (1).
This question in 0987/22 Oct/Nov 2023
Q10 · In 2020, the price of gold fell in Vietnam 0987/21 May/June 2024
5 In 2020, the price of gold fell in Vietnam. That year, Vietnam was one of Asia’s best performing economies. Unlike some Asian economies, Vietnam did not experience a recession. Its total output, exports and imports all increased. Unemployment did increase from 2.0% to 2.3% but remained very low. One of the aims of fiscal policy can be to achieve full employment. (a) Identify how the effect of a fall in the price of gold would be shown on a demand curve for gold. [2] (b) Explain two disadvantages of a recession. [4] (c) Analyse why a country may demand more imports. [6] (d) Discuss whether or not fiscal policy can achieve full employment. [8]
20 marks
Mark scheme: 5(a) Identify how the effect of a fall in the price of gold would be shown on a demand curve for gold. A movement down the demand curve (1) from left to right / extension (1). A movement along the demand curve (1). down the demand curve. Allow one mark for the idea that demand will rise. 5(b) Explain two disadvantages of a recession. Logical explanation which might include: Lower output / lower GDP (1) lower living standards / higher poverty / less income / less consumer spending (1). Higher unemployment / lower employment (1) higher cost of unemployment benefit (1). Lower investment (1) due to reduction in confidence (1). Firms shutdown (1) due to lower profits (1). Lower tax revenue (1) may cause budget deficit / reduce ability to spend e.g. on education / increase in national debt (1). 4 One mark each for each of two disadvantages identified and one mark for each of two explanations. Question Answer Mark Guidance 5(c) Analyse why a country may demand more imports. Coherent analysis which might include: Price of imports may fall (1) due to a fall in costs of production (1) a rise in the exchange rate (1). Quality of imports may rise (1) foreign workers may be less skilled (1) investment in foreign countries may have decreased (1). Incomes may have increased (1) raising the purchasing power of buyers (1) increasing the country’s’ need for consumer goods (1) which the country cannot produce (1) due to specialisation (1). Trade restrictions may be removed or reduced (1) e.g. lower tariffs / quotas / subsidies / embargoes will make it easier to import (1). Country needs more raw materials / lacks the technology to produce certain goods (1) to enable growth of domestic industries (1). Failure of harvest /natural disaster e.g. rice (1) means need to import the good instead (1). 6 Do not expect, but reward reference to absolute or comparative advantage. A maximum of three marks for only identifying the reasons. Question Answer Mark Guidance 5(d) Discuss whether or not fiscal policy can achieve full employment. In assessing each answer, use the table opposite. Why it might: higher government spending and/or lower taxation may increase total (aggregate) demand which could reduce cyclical unemployment government spending on education and training could raise workers’ skills could increase their mobility and may reduce frictional unemployment government spending on the provision of labour market information may reduce frictional unemployment government spending on subsidies may lead to firms increasing job opportunities. Why it might not: government spending may not be raised enough / a cut in taxation may not be sufficient consumer spending and investment may fall if there is a lack of confidence net exports may fall if there is a global recession there may still be some labour immobility due to e.g. differences in house prices in different parts of the country so structural unemployment increased government spending on benefits may be an encouragement not to work and stay unemployed. 8 See Guidance table at the end of the mark scheme. Do not reward a simple reversal of policies in why it might achieve full employment in the why it might not part of the response. Level Description Marks 3 A reasoned discussion which accurately examines both sides of the economic argument, making use of economic information and clear and logical analysis to evaluate economic issues and situations. One side of the argument may have more depth than the other, but overall both sides of the argument are considered and developed. There is thoughtful evaluation of economic concepts, terminology, information and/or data appropriate to the question. The discussion may also point out the possible uncertainties of alternative decisions and outcomes. 68 2 A reasoned discussion which makes use of economic information and clear analysis to evaluate economic issues and situations. The answer may lack some depth and development may be one-sided. There is relevant use of economic concepts, terminology, information and data appropriate to the question. 35 1 There is a simple attempt at using economic definitions and terminology. Some reference may be made to economic theory, with occasional understanding. 12 0 A mark of zero should be awarded for no creditable content. 0
This question in 0987/21 May/June 2024
Q11 · Free goods and economic goods are consumed in Poland 0987/22 May/June 2024
5 Free goods and economic goods are consumed in Poland. In 2020, demand for both economic goods and factors of production increased in Poland. For example, Polish consumers demanded more football shirts and the Polish government increased its spending on housing for the country’s population. (a) Identify two free goods. [2] (b) Explain two influences on demand for factors of production. [4] (c) Analyse the effect of an increase in demand for football shirts on demand for football shorts and demand for basketball shirts. [6] (d) Discuss whether or not an increase in government spending on housing would benefit an economy. [8]
20 marks
Mark scheme: 5(a) Identify two free goods. Two from e.g.: air / oxygen sunlight water wind 2 BOD on ‘sun’, trees (not wood), wild flowers, wild fruit. Not accepting fish or stone. 5(b) Explain two influences on demand for factors of production. Logical explanation which might include: Demand for the product produced / total demand / economic activity (1) rise in demand for the product/products will be likely to increase demand for the factor/factors of production / derived demand (1). Price of the factor itself (1) lower price will be likely to result in higher demand (1). Price of substitute factors of production (1) e.g. may demand more labour if price of capital rises (1). Price of complementary factors of production (1) e.g. if labour is used with capital, a fall in the price of capital may increase demand for labour (1). Productivity (1) higher productivity will be likely to increase demand (1). Quality / advances in technology / changes in standards of education and training (1) higher quality will increase demand (1). Occupational mobility (1) the more occupationally mobile, the higher demand will tend to be (1). Method of production (1) switch from labour-intensive production will increase demand for capital goods (1). 4 One mark each for each of two influences identified and one mark for each of two explanations. If more than 2 influences are given, consider the first 3. Accept price and / or demand on its own but looking for price of a complement or price of a substitute not just complement or substitute. Question Answer Marks Guidance 5(c) Analyse the effect of an increase in demand for football shirts on demand for football shorts and demand for basketball shirts. Coherent analysis which might include: Demand for football shorts is likely to increase (1) football shirts and shorts are complements (1) bought to be used together / bought to complete the set (1). Demand for basketball shirts is likely to fall (1) basketball shirts and football shirts may be substitutes (1) consumers may switch between them (1). 6 Changes in demand may be shown in the written answer or on diagrams. Question Answer Marks Guidance 5(d) Discuss whether or not an increase in government spending on housing would benefit an economy. In assessing each answer, use the table opposite. Why it might: may increase total demand may increase output / GDP may increase employment / reduce unemployment may lower the price of housing may increase living standards may reduce homelessness may reduce poverty. Why it might not: will have an opportunity cost may increase taxes quality of housing may be low private sector may provide better housing may be external costs during the construction. 8 Level Description Marks 3 A reasoned discussion which accurately examines both sides of the economic argument, making use of economic information and clear and logical analysis to evaluate economic issues and situations. One side of the argument may have more depth than the other, but overall both sided of the argument are considered and developed. There is thoughtful evaluation of economic concepts, terminology, information and/or data appropriate to the question. The discussion may also point out the possible uncertainties of alternative decisions and outcomes. 6–8 2 A reasoned discussion which makes use of economic information and clear analysis to evaluate economic issues and situations. The answer may lack some depth and development may be one-sided. There is relevant use of economic concepts, terminology, information and data appropriate to the question. 3–5 1 There is a simple attempt at using economic definitions and terminology. Some reference may be made to economic theory, with occasional understanding. 1–2 Question Answer Marks Guidance 5(d) Level Description Marks 0 A mark of zero should be awarded for no creditable content. 0
This question in 0987/22 May/June 2024
Q12 · Calculate the percentage of the Jordanian labour force employed in the secondary sector 0987/22 Oct/Nov 2024
1 (a) Calculate the percentage of the Jordanian labour force employed in the secondary sector. [1] (b) Identify two components of the current account of Jordan’s balance of payments. [2] (c) Explain the main type of unemployment experienced by Jordan in 2020. [2] (d) Explain two advantages the Jordanian economy may gain from the mergers between its tourism firms. [4] (e) Analyse the relationship between birth rate and average age. [4] (f) Analyse, using a demand and supply diagram, how an increase in population size will affect the market for clothing. [5] (g) Discuss whether or not the Jordanian government should spend more on renewable energy. [6] (h) Discuss whether or not the Jordanian central bank should have raised the rate of interest in 2021. [6]
30 marks
Mark scheme: Question Answer Marks Guidance 1(a) Calculate the percentage of the Jordanian labour force 1 Accept 19. employed in the secondary sector. 19% (1). 1(b) Identify two components of the current account of 2 If more than two suggested components are given, consider Jordan’s balance of payments. the first three. Trade in services (1) primary income (1). Accept invisibles for trade in services. 1(c) Explain the main type of unemployment experienced by 2 Faill in demand is not sufficient here for fall in total demand Jordan in 2020. as total demand is given in the source material – must be macro. Cyclical unemployment (1) lower total demand / fall in employment in most industries / number of workers greater Accept ‘demand deficient unemployment for cyclical than the number of jobs available (1). unemployment. 1(d) Explain two advantages the Jordanian economy may 4 One mark each for each of two advantages identified and gain from the mergers between its tourism firms. one mark for each of two explanations. Logical explanation which might include: Lower prices may be linked to either ‘raise output’ etc. or Lower prices (1) may raise output/GDP/employment/living ‘raise exports’ etc. standards / may be the result of taking advantage of Similarly higher quality may be linked to ‘raise exports etc.’ economies of scale (1). or ‘raise output etc.’. Higher quality (1) may raise exports / reduce current account deficit / increase international competitiveness / increase tourism revenue / more foreign currency / may be the result of sharing ideas (1). 1(e) Analyse the relationship between birth rate and average 4 Responses do not have to be in the format suggested but age. they should address the expected/normal relationship, offer supporting evidence of that, highlight any exceptions to that, Coherent analysis which might include: and analyse the overall data. Expected relationship (up to 2 marks): Accept analysis based on how differences in the average of Countries with a low birth rate are likely to have a high population may affect the birth rate. average age (1) an inverse relationship / negative relationship / move in opposite directions (1). For supporting evidence and the second ‘exception’ mark, comparisons must be made. No marks for just stating the Supporting evidence (up to 2 marks): birth rate and average age figures. Four countries with the lowest birth rates had the highest average age (1) Monaco had the lowest birth rate and the highest average age (1) Niger with the highest birth rate has the lowest average age (1) e.g. Germany has a lower birth rate and a higher average age than Jordan (1). Analysis of expected relationship (up to 2 marks): A low birth rate would mean that children would form a small proportion of the population / a high birth rate may mean children would form a high proportion of the population / it would increase the proportion of people aged over 65 (1). A high birth rate may indicate low living standards / lower income which may be associated with low life expectancy (1). A high average age may mean that there are fewer people of child-bearing age (1). Exception (up to 2 marks): Venezuela or Maldives (1) Maldives had a lower birth rate than Venezuela but the same average age (1). Analysis of exception (up to 1 mark): The average age of a country’s population is also influenced by the death rate and net migration (1). 1(f) Analyse, using a demand and supply diagram, how an 5 increase in population size will affect the market for clothing. Coherent analysis which might include: D&S diagram: Axes correctly labelled – price and quantity or p and q (1). Original demand and supply curves correctly labelled (1). New demand curve shifted to the right (1). Equilibriums – shown by lines P1 and Q1 and P2 and Q2 or equilibrium points marked as E1 and E2 (1). Written analysis: An increase in population size will increase the number of consumers / increase demand for clothes / price increases (1). 1(g) Discuss whether or not the Jordanian government 6 Apply this example to all questions with the command should spend more on renewable energy. word DISCUSS (1g, 1h, 2d, 3d, 4d and 5d) Award up to 4 marks for logical reasons why it should, which may include: Each point may be credited only once, on either side of an • need for more energy due to an increase in population argument, but separate development as to how/why the (1) non-renewable sources of energy will run out / outcome may differ is rewarded. reduced dependency on fossil fuels (1) may reduce import bills (1) Generic example mark • would reduce environmental damage (1) reduce external costs (1) lower pollution (1) reduce extent of Tax revenue may decrease… 1 climate change / global warming / promote sustainable development (1) improve health (1). ...because of reason e.g. incomes may be 1 • cheaper in the longer run (1) solar and wind power are lower. free goods (1) lower costs of production (1) reduce household bills (1). Tax revenue may increase because incomes 0 may be higher i.e. reverse of a previous Award up to 4 marks for logical reasons why it should not, argument. which may include: • expensive to build (1) opportunity cost (1) example (1) Tax revenue may increase because of a 1 • relies on weather (1) supplies may be disrupted / different reason i.e. not the reverse of a insufficient / unreliable (1) previous argument e.g. government spending • cost of renewable energy projects may increase with on subsidies may stimulate the economy more high interest than spending on education. • rates (1) may be funded by borrowing (1) may increase taxes (1) • may cause visual pollution (1) e.g. wind turbines (1). 1(h) Discuss whether or not the Jordanian central bank 6 Some points e.g. discouraged spending may be considered should have raised the rate of interest in 2021. from either side but see guidance table on 1f. Award up to 4 marks for logical reasons why it should have, which may include: • total demand predicted to increase / may have reduced total demand (1) encouraged saving (1) discouraged spending / borrowing (1) lowered demand-pull (1) inflation (1) reduced imports (1) • may have attracted more funds for the Jordanian government to borrow / use (1) for e.g. renewable energy projects (1). Award up to 4 marks for logical reasons why it should not have, which may include: • cost of government borrowing would have increased / may have difficulty paying off government debt (1) • investment may have been discouraged (1) lowered economic growth (1) reduced growth in employment / caused unemployment (1) • may have increased the exchange rate (1) foreigners depositing money in the country’s banks / attracted hot money flow (1) raised export prices / lowered import prices / decreased exports / increased imports (1) reduced tourism (1) increased the current account deficit (1).
This question in 0987/22 Oct/Nov 2024
Q13 · In 2021, the production point on the UK’s production possibility curve (PPC) changed 0987/22 Oct/Nov 2024
2 In 2021, the production point on the UK’s production possibility curve (PPC) changed. Average wages increased. The average annual wage of a waiter was $23,580 while that of a chief executive of a large commercial bank was $1,617,000. A rise in wages enables people to eat in restaurants more often. Some of the food sold in UK restaurants is imported. In 2021, the UK government signed free trade agreements, removing import restrictions, with a number of countries. (a) Identify two places where a production point could be located on a PPC diagram. [2] (b) Explain two reasons why someone may switch from eating in one restaurant to eating in another restaurant. [4] (c) Analyse why the wage of a chief executive of a large commercial bank is higher than that of a waiter. [6] (d) Discuss whether or not free trade will increase economic growth. [8]
20 marks
Mark scheme: 2(a) Identify two places where a production point could be 2 The points may be identified on a diagram. located on a PPC diagram. Accept below the curve and above the curve. Two from: • point inside the curve / left of the curve • point on the curve / along the curve • point outside the curve / right of the curve 2(b) Explain two reasons why someone may switch from 4 One mark each for each of two reasons identified and one eating in one restaurant to eating in another restaurant. mark for each of two explanations. Logical explanation which might include: (Change in) prices (1) lower price making it more affordable / substitutes / save money (1). (Change in) quality (1) better ingredients / better cleanliness / quicker service / new menu / more satisfaction / better taste / change in staff (1). (Change in) convenience (1) e.g. longer opening hours / / better location (1) (Change in) facilities (1) e.g. better restrooms (1). (Change in) income (1) enabling some to eat in more expensive restaurants (1). (Change in) consumer tastes (1) switch to e.g. vegan restaurant (1) Advertising (1) may attract/persuade customers / increase attractiveness (1). (Change in) quantity provided (1) lower quantity may represent lower value for money (1). 2(c) Analyse why the wage of a chief executive of a large 6 Note: may also be answered from the point of view why the commercial bank is higher than that of a waiter. wage of a waiter may be lower than that of a chief executive. Coherent analysis which might include: No marks here for banks may be more profitable than restaurants as e.g. a cleaner in a bank may have a lower Chief executive may be more qualified / more educated (1) wage than a waiter. received more training (1) more skilled / talented (1) more productive (1) more experienced (1) higher level of responsibility / higher level of stress / more demanding job (1) in shorter supply / harder to replace (1) more inelastic supply (1). Chief executive may be in higher demand (1) more inelastic demand (1). Chief executive may have stronger bargaining power (1) may be more likely to be in a trade union / professional body (1). May be less likely to be in a group that is discriminated against (1) e.g. migrant workers (1). Chief executive may work longer hours (1). 2(d) Discuss whether or not free trade will increase 8 Level Description Marks economic growth. 3 A reasoned discussion which 6–8 In assessing each answer, use the table opposite. accurately examines both sides of the economic argument, making use of Why it might: economic information and clear and • may enable countries to specialise on what they are logical analysis to evaluate economic best at producing issues and situations. One side of the • higher competition may increase productivity and lower argument may have more depth than the other, but overall both sides of the costs of production, increasing demand for their argument are considered and products developed. There is thoughtful • may enable firms to buy raw materials and capital evaluation of economic concepts, goods at a lower price terminology, information and/or data • may give firms access to larger markets, enabling them appropriate to the question. The to expand output. discussion may also point out the possible uncertainties of alternative decisions and outcomes. Why it might not: • may prevent infant industry from growing 2 A reasoned discussion which makes 3–5 • may speed up the closure of declining industries use of economic information and clear • may replace domestic output with imports analysis to evaluate economic issues • may reduce tax revenue and situations. The answer may lack • firms may gain monopoly power and may restrict output some depth and development may be • firms may engage in unfair competition e.g. dumping. one-sided. There is relevant use of economic concepts, terminology, information and data appropriate to the question. 1 There is a simple attempt at using 1–2 economic definitions and terminology. Some reference may be made to economic theory, with occasional understanding. 0 A mark of zero should be awarded for 0 no creditable content.
This question in 0987/22 Oct/Nov 2024
Q14 · In 2021, there were extensions and contractions in demand for a number of South African… 0987/22 Oct/Nov 2024
4 In 2021, there were extensions and contractions in demand for a number of South African products. In that year, a South African court stopped a multinational company (MNC) exploring for oil along South Africa’s coastline. South Africa experienced an increase in output, driven largely by the growth in its tertiary sector. However, its unemployment rate was 35%, a long way from full employment. (a) Define an extension in demand. [2] (b) Explain two external costs that may be caused by exploring for oil. [4] (c) Analyse how growth in a country’s tertiary sector can increase its living standards. [6] (d) Discuss whether or not workers who lose their jobs are likely to stay unemployed for a long time. [8]
20 marks
Mark scheme: 4(a) Define an extension in demand. 2 May be shown by a movement down a demand curve caused by a fall in price. A movement along a demand curve (1) higher demand (1) caused by a fall (1) in price (1). Not accepting: an increase in demand but accepting: an increase in quantity demanded. 4(b) Explain two external costs that may be caused by 4 One mark each for each of two costs identified and one exploring for oil. mark for each of two explanations. Logical explanation which might include: Reduce tourism may be given as an identification or as an explanation of e.g. ‘Damage to the natural environment’ Air pollution / pollution (1) those living nearby may experience a reduction in air quality / contribute to climate change/global warming / reduced health (1). Noise pollution (1) disturbing sleep (1). Water pollution / oil spillage (1) damage health (1). Damage to the natural environment / land / deforestation (1) destroy wildlife habitats / cause global warming / climate change (1). Reduce tourism (1) lower employment (1). Congestion (1) increasing transport costs (1). 4(c) Analyse how growth in a country’s tertiary sector can 6 increase its living standards. Coherent analysis which might include: May have high productivity (1) increase output (1) increase employment / reduce unemployment (1). May pay higher wages (1) allowing workers to consume more goods and services / afford education / afford healthcare / reduce poverty / buy more necessities / buy some luxuries/wants (1). May provide good working conditions (1) less tiring / less physically demanding (1) resulting in good health of workers (1) few accidents (1). May involve expansion of education (1) increasing future employment / workers’ skills (1) earning prospects (1) increase quality of output (1) increase HDI value (1). More transport services (1) could reduce prices / lower congestion / reduce stress (1). Growth of entertainment industry (1) improve leisure time (1). May involve expansion of healthcare (1) increase life expectancy / better health (1). May increase tax revenue (1) enabling the government to spend more on e.g. education (1). Less pollution (1) less environmental damage / less climate change / less global warming (1). 4(d) Discuss whether or not workers who lose their jobs are 8 Reward but do not expect reference to hysteresis. likely to stay unemployed for a long time. Level Description Marks In assessing each answer, use the table opposite. 3 A reasoned discussion which 6–8 Why they might: accurately examines both sides of the • may lose skills / unskilled workers may have greater economic argument, making use of difficulty than skilled workers in finding another job economic information and clear and • may become out of date with advances in technology / logical analysis to evaluate economic working practices issues and situations. One side of the • may be expensive for firms to employ as may need argument may have more depth than extra training the other, but overall both sides of the • may lose confidence argument are considered and • may become less attractive to employers developed. There is thoughtful • more likely to stay unemployed if a result of evaluation of economic concepts, cyclical/structural rather than frictional unemployment terminology, information and/or data • may be high unemployment benefits. appropriate to the question. The discussion may also point out the Why they might not: possible uncertainties of alternative • may receive government training decisions and outcomes. • may be geographically/occupationally mobile • gap between wages and state benefits may encourage 2 A reasoned discussion which makes 3–5 the unemployed to seek work use of economic information and clear • economy may grow, expanding employment analysis to evaluate economic issues and situations. The answer may lack opportunities some depth and development may be • may leave the labour force, e.g. retire / emigrate one-sided. There is relevant use of • may be seasonally unemployed. economic concepts, terminology, information and data appropriate to the question. 4(d) Level Description Marks 1 There is a simple attempt at using 1–2 economic definitions and terminology. Some reference may be made to economic theory, with occasional understanding. 0 A mark of zero should be awarded for 0 no creditable content.
This question in 0987/22 Oct/Nov 2024
Q15 · Calculate foreign workers as a percentage of Japan’s labour force in 2022 0987/22 Oct/Nov 2025
1 (a) Calculate foreign workers as a percentage of Japan’s labour force in 2022. [1] (b) Identify two reasons why Japan has a high average age of population. [2] (c) Explain why some young Japanese people emigrate. [2] (d) Explain two ways Japan could attract more foreign workers. [4] (e) Draw a demand and supply diagram to show the effect of a decrease in population on the market for furniture. [4] (f) Analyse the relationship between global GDP per head and global air passenger numbers. [5] (g) Discuss whether or not a high savings rate is likely to benefit Japan. [6] (h) Discuss whether or not labour mobility in Japan is likely to increase in the future. [6]
30 marks
Mark scheme: Question Answer Marks Guidance 1(a) Calculate foreign workers as a percentage of Japan’s 1 Accept 2.5 without %. labour force in 2022. 2.5% (1). 1(b) Identify two reasons why Japan has a high average age 2 If more than two reasons are given, consider the first three. of population. Low birth rate (1) high life expectancy (1) good healthcare (1) young adults moving abroad (1). 1(c) Explain why some young Japanese people emigrate. 2 One mark for identification and one mark for explanation. To gain high wages (1) enjoy a better living standard / able to purchase more goods and services (1). 1(d) Explain two ways Japan could attract more foreign 4 One mark each for two ways identified and one mark each workers. for two explanations. Logical explanation which might include: If more than two ways are given, consider the first three. Only the 3 listed identifications can be credited, and • remove the Japanese language test (1) more foreigners explanation marks can only be awarded if applied to a valid would be able to work in the country (1) identification. • allow foreign workers to bring their families with them (1) foreign workers are more likely to settle in the country if they are not separated from their families (1) • allow unskilled workers to stay for more than five years (1) if gain high wages / enjoy living in the country would not want to leave / attract workers who want to live permanently in the country / give workers the opportunity to stay permanently / increase international mobility of labour (1). 1(e) Draw a demand and supply diagram to show the effect 4 of a decrease in population on the market for furniture. Coherent analysis which might include the following. D&S diagram: Axes correctly labelled – price and quantity or p and q (1). Original demand and supply curves correctly labelled (1). New demand curve shifted to the left (1). OR New supply curve shifted to the left (1). OR New demand curve shifted to the left AND new supply curve shifted to the left. Equilibriums – shown by lines P1 and Q1 and P2 and Q2 or equilibrium points marked as E1 and E2 (1). 1(f) Analyse the relationship between global GDP per head 5 Responses do not have to be in the format suggested but and global air passenger numbers. they should address the expected / normal relationship, offer supporting evidence of that, highlight any exceptions to that, Coherent analysis which might include the following. and analyse the overall data. Expected relationship: Supporting evidence should involve interpretation, not just Generally, a positive relationship (1) the higher the global description. GDP head, the higher the air passenger numbers (1). Supporting evidence: 2016–2019 GDP per head rose and air passenger numbers increased (1). Analysis of expected relationship: Higher GDP per head increases purchasing power / ability to pay for air travel (1) as people get richer, they travel more for leisure and business (1). Exception: 2021 (1) GDP per head rose but air passenger numbers decreased (1). Analysis of exception: May have been a time delay in people gaining confidence in flying after COVID-19 pandemic / other influences on demand e.g. air fares (1). 1(g) Discuss whether or not a high savings rate is likely to 6 Reference to AD / total demand falling can be credited on benefit Japan. either side of the argument, but only once. Award up to 4 marks for logical reasons why it might, which Apply this example to all questions with the command may include: word DISCUSS (1g, 1h, 2d, 3d, 4d and 5d) • may keep inflation low (1) as spending will not be high (1) reduce (total) demand (1) reduce demand-pull Each point may be credited only once, on either side of an inflation (1) argument, but separate development as to how / why the • may reduce imports (1) improve the current account of outcome may differ is rewarded. the balance of payments (1) • provide finance for investment (1) firms able to borrow Generic example mark from banks (1) • may enable households to finance future expenditure Tax revenue may decrease… 1 (1) on e.g. healthcare / education / provide for retirement / provide support for individuals in difficult ...because of reason e.g. incomes may be lower. 1 times (1) • may enable government to cut benefits, e.g. pensions Tax revenue may increase because incomes 0 (1) spend money saved on other priorities, e.g. may be higher i.e. reverse of a previous healthcare (1). argument. Award up to 4 marks for logical reasons why it might not, Tax revenue may increase because of a different 1 which may include: reason i.e. not the reverse of a previous argument e.g. government spending on subsidies • may lower total demand (1) reduce GDP (1) increase may stimulate the economy more than spending unemployment (1) cyclical unemployment (1) could on education. cause a recession (1) • may reduce investment as demand is low (1) reduce improvements in technology (1) • Less indirect tax raised (1) may lead to reduced government spending (1). 1(h) Discuss whether or not labour mobility in Japan is likely 6 Reference to occupational and geographical mobility can be to increase in the future. credited on either side of the argument, but only once. Award up to 4 marks for logical reasons why it might, which Reference to falling house prices or improved transport must may include: be linked to improved mobility for credit and vice versa. • Improvements in education and training (1) could increase skills / qualifications (1) increase occupational mobility (1) • Improvements in transport / subsidised travel (1) could enable people to move to different areas (1) raise geographical mobility (1). Award up to 4 marks for logical reasons why it might not, which may include: • Ageing population (1) may have out-of-date skills (1) more difficult to change jobs (1) reduce occupational mobility (1) may be more reluctant to move to a different area (1) reason (1) reduce geographical mobility (1) • House prices may rise (1) making it difficult to move from areas with low house prices to areas with high prices (1).
This question in 0987/22 Oct/Nov 2025
 1 / 5
1 / 5
![Question 6: (a) Calculate Australia’s unemployment rate in 2021. [1] (b) Identify two substitutes for coal. [2] (c) Explain one economy of scale that c…](https://img.pastlit.com/crops/43773573-027c-4c31-9d93-e6f9b316cb22/q1.webp) 2 / 5
2 / 5
![Question 8: (a) Calculate the number of people who were living in poverty in Guyana in 2020. [1] (b) Identify two causes of the decrease in the output …](https://img.pastlit.com/crops/0e446b44-79e6-4556-bae5-89cc55f1d727/q1.webp)
![Question 9: (a) Calculate what percentage of Honduran people did not have access to electricity in 2020. [1] (b) Identify two benefits the Honduran eco…](https://img.pastlit.com/crops/711b4dae-d871-4d27-988e-be99e0e00694/q1.webp) 3 / 5
3 / 5
![Question 12: (a) Calculate the percentage of the Jordanian labour force employed in the secondary sector. [1] (b) Identify two components of the current…](https://img.pastlit.com/crops/4db370cd-0f72-41cb-9427-0fb64318c640/q1.webp) 4 / 5
4 / 5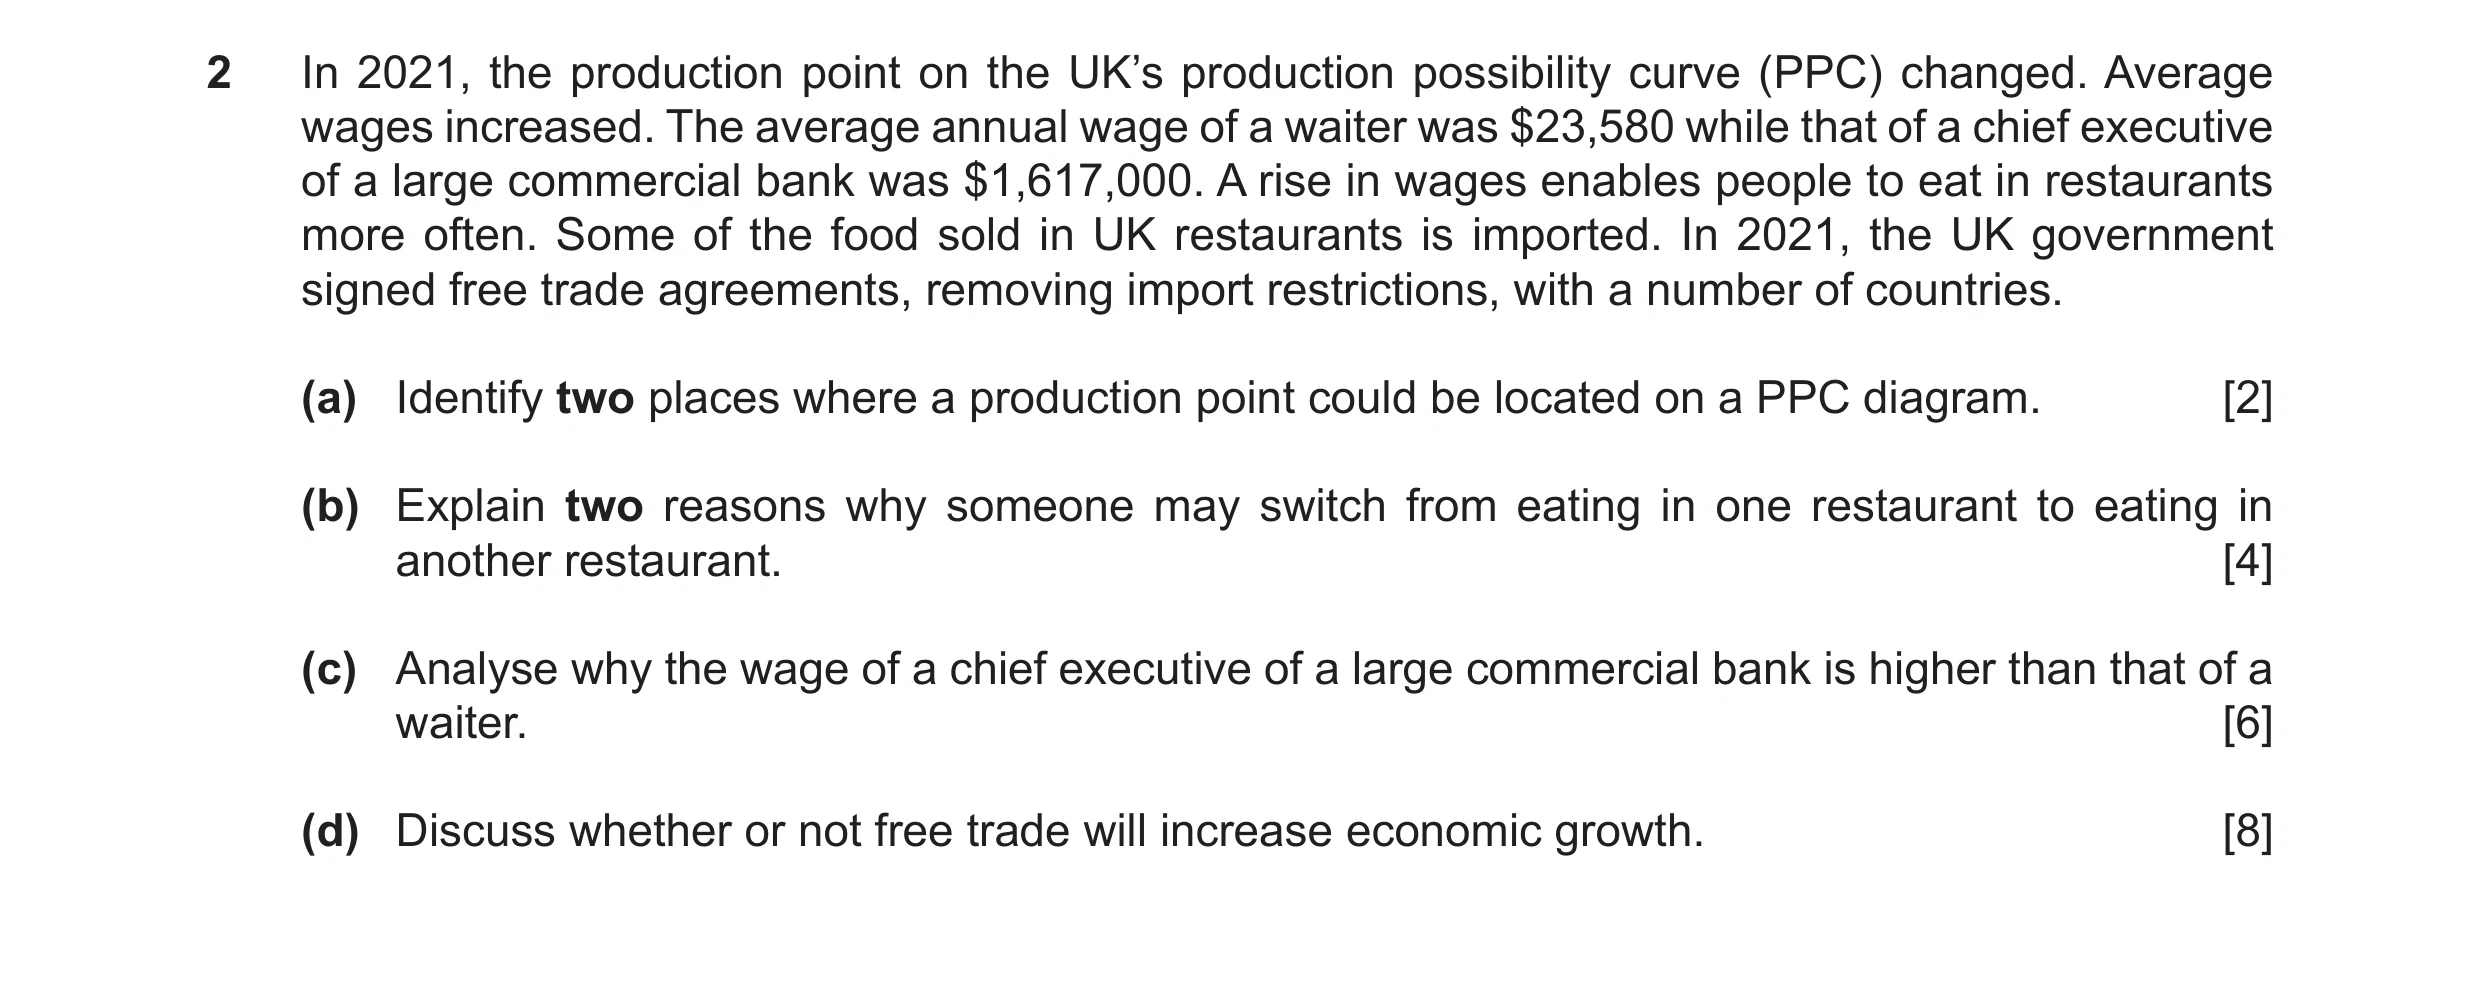
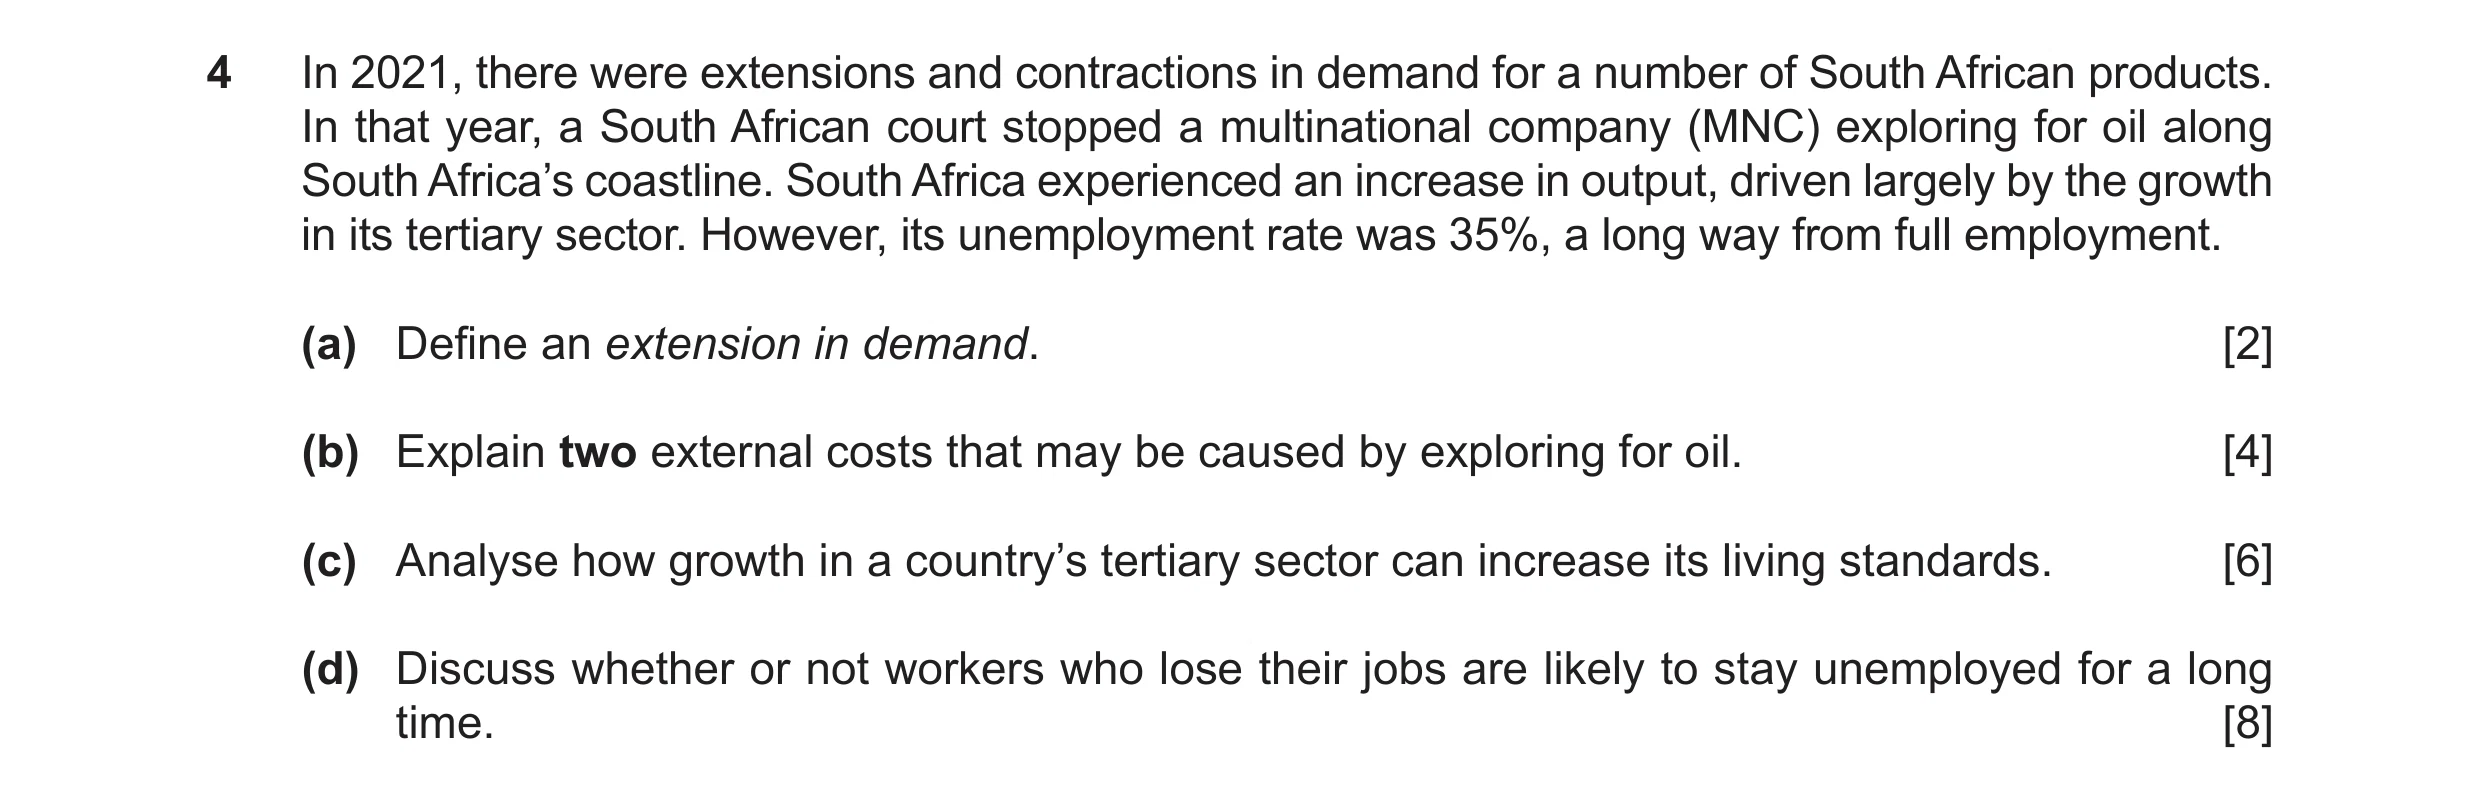
![Question 15: (a) Calculate foreign workers as a percentage of Japan’s labour force in 2022. [1] (b) Identify two reasons why Japan has a high average ag…](https://img.pastlit.com/crops/1ec7477a-d816-44d1-8c66-b0b17092a593/q1.webp) 5 / 5
5 / 5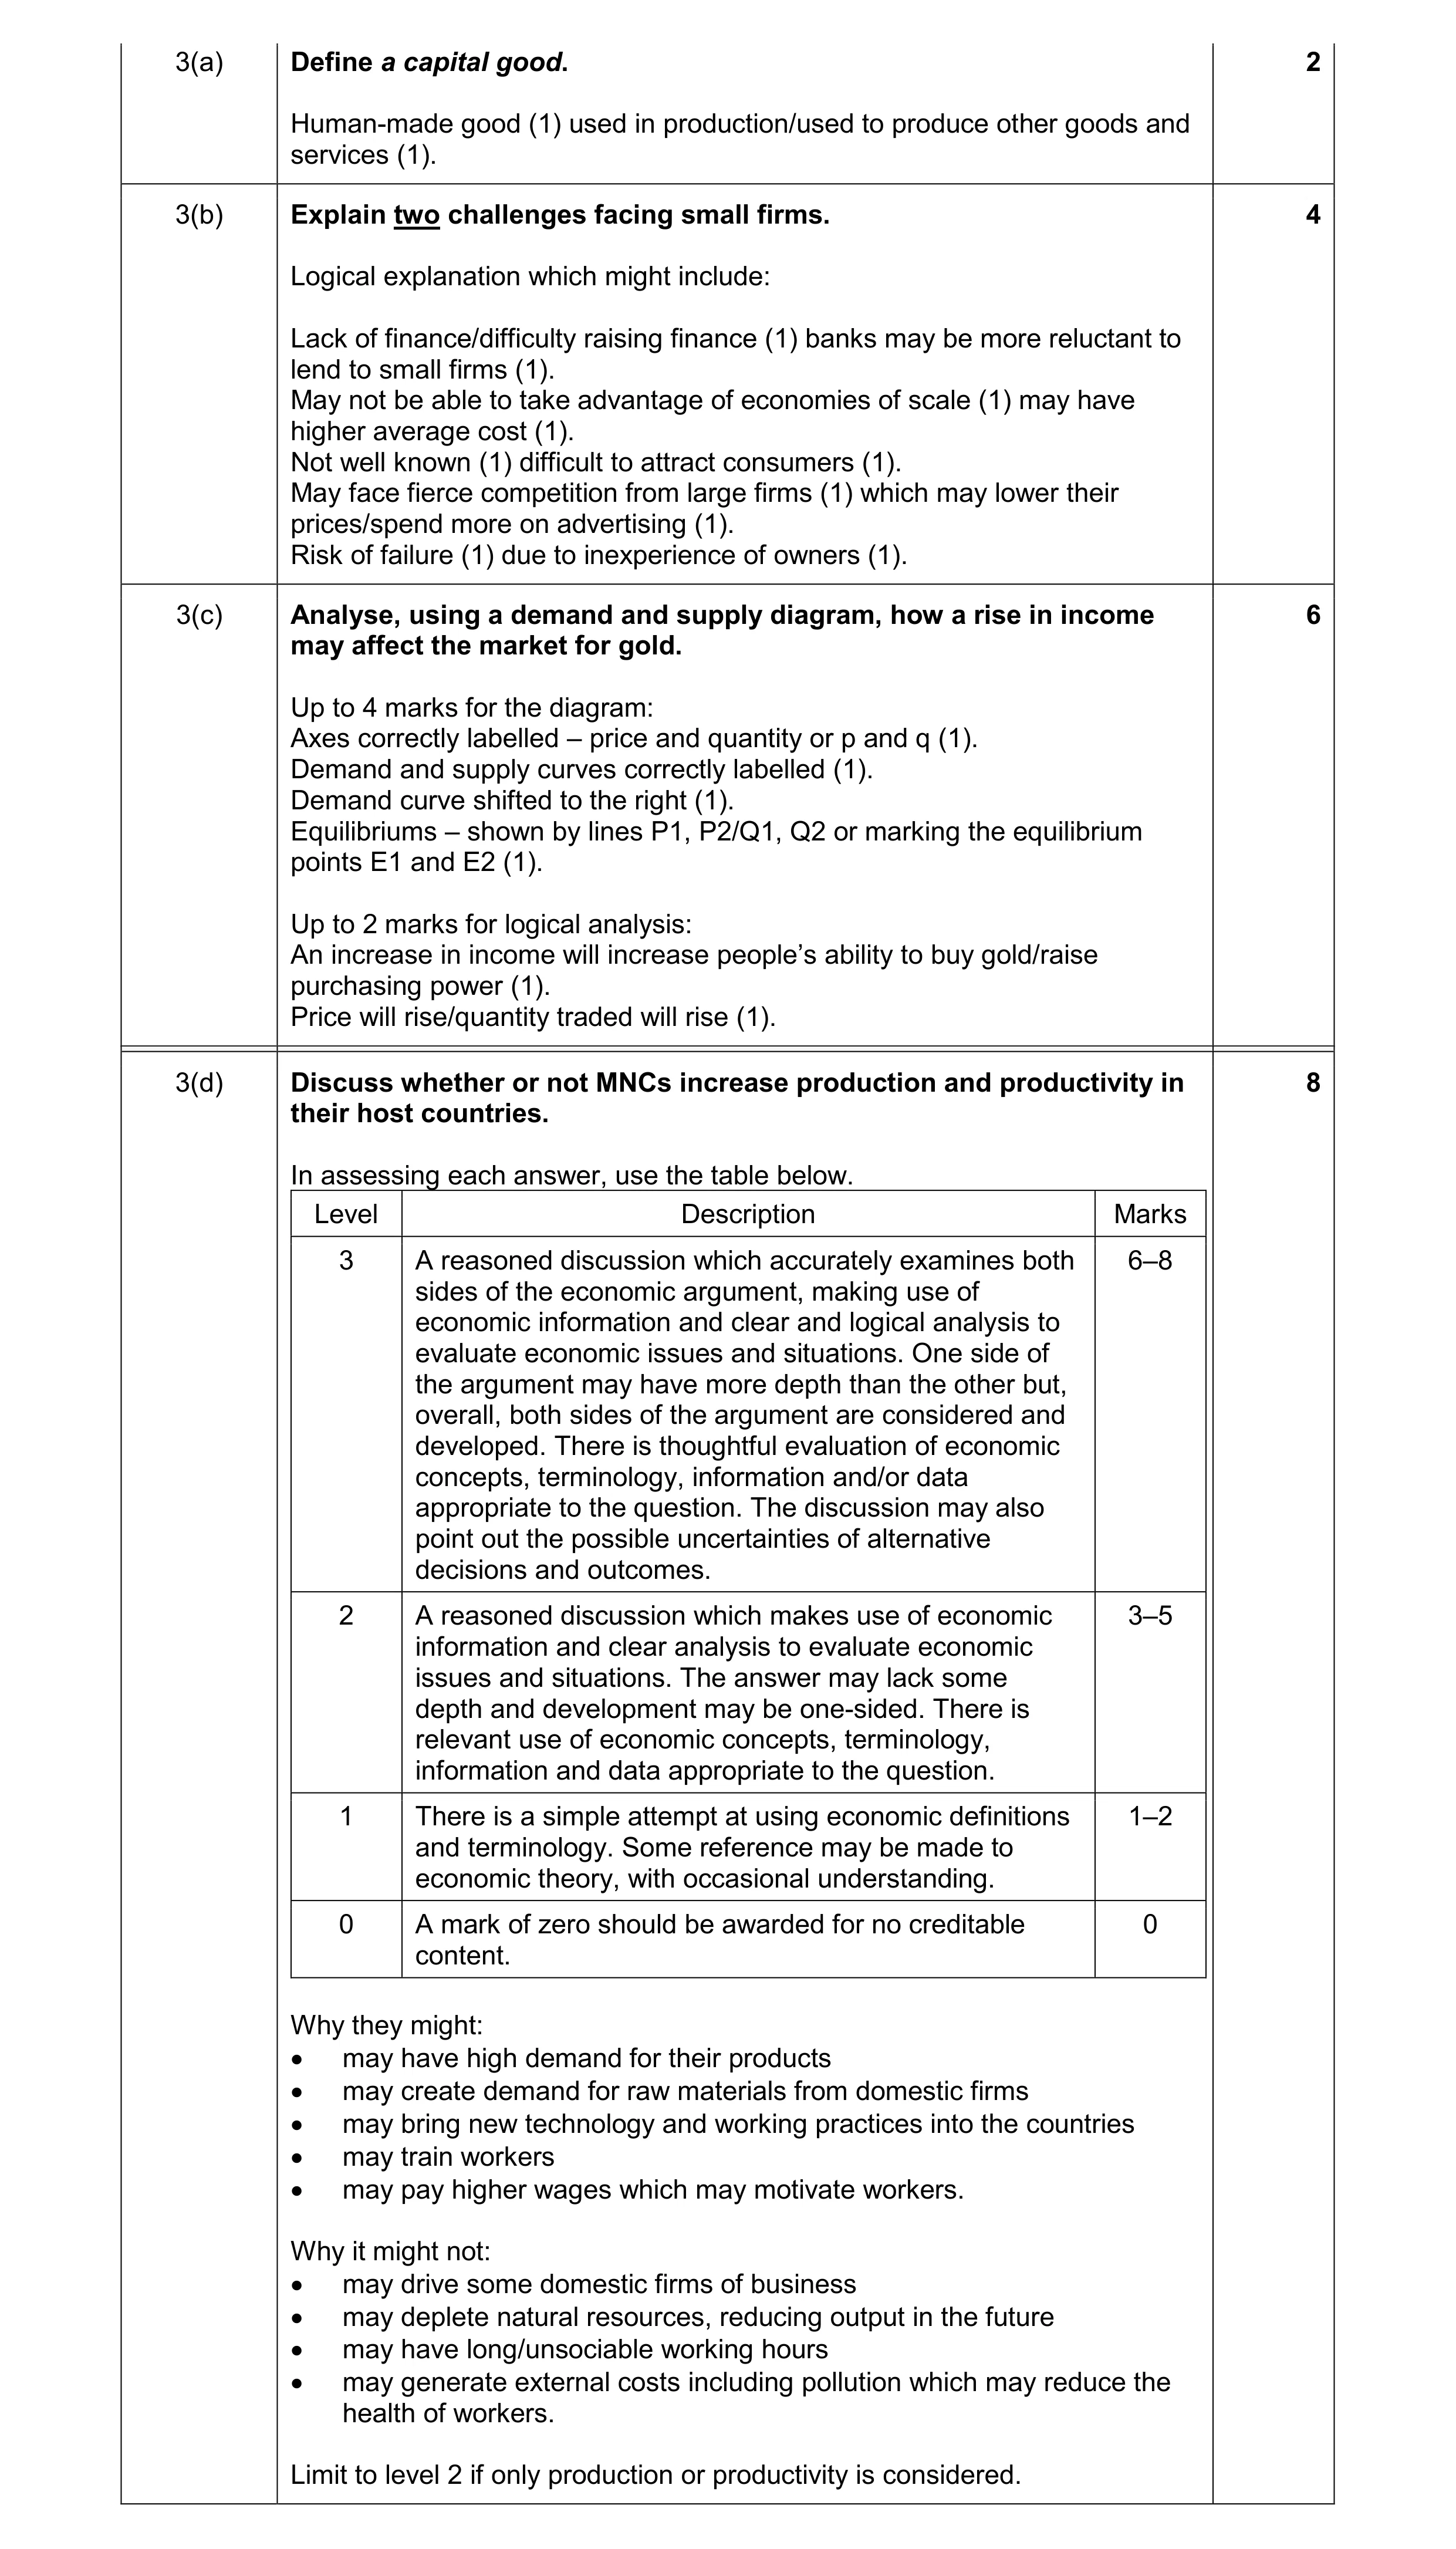 20
20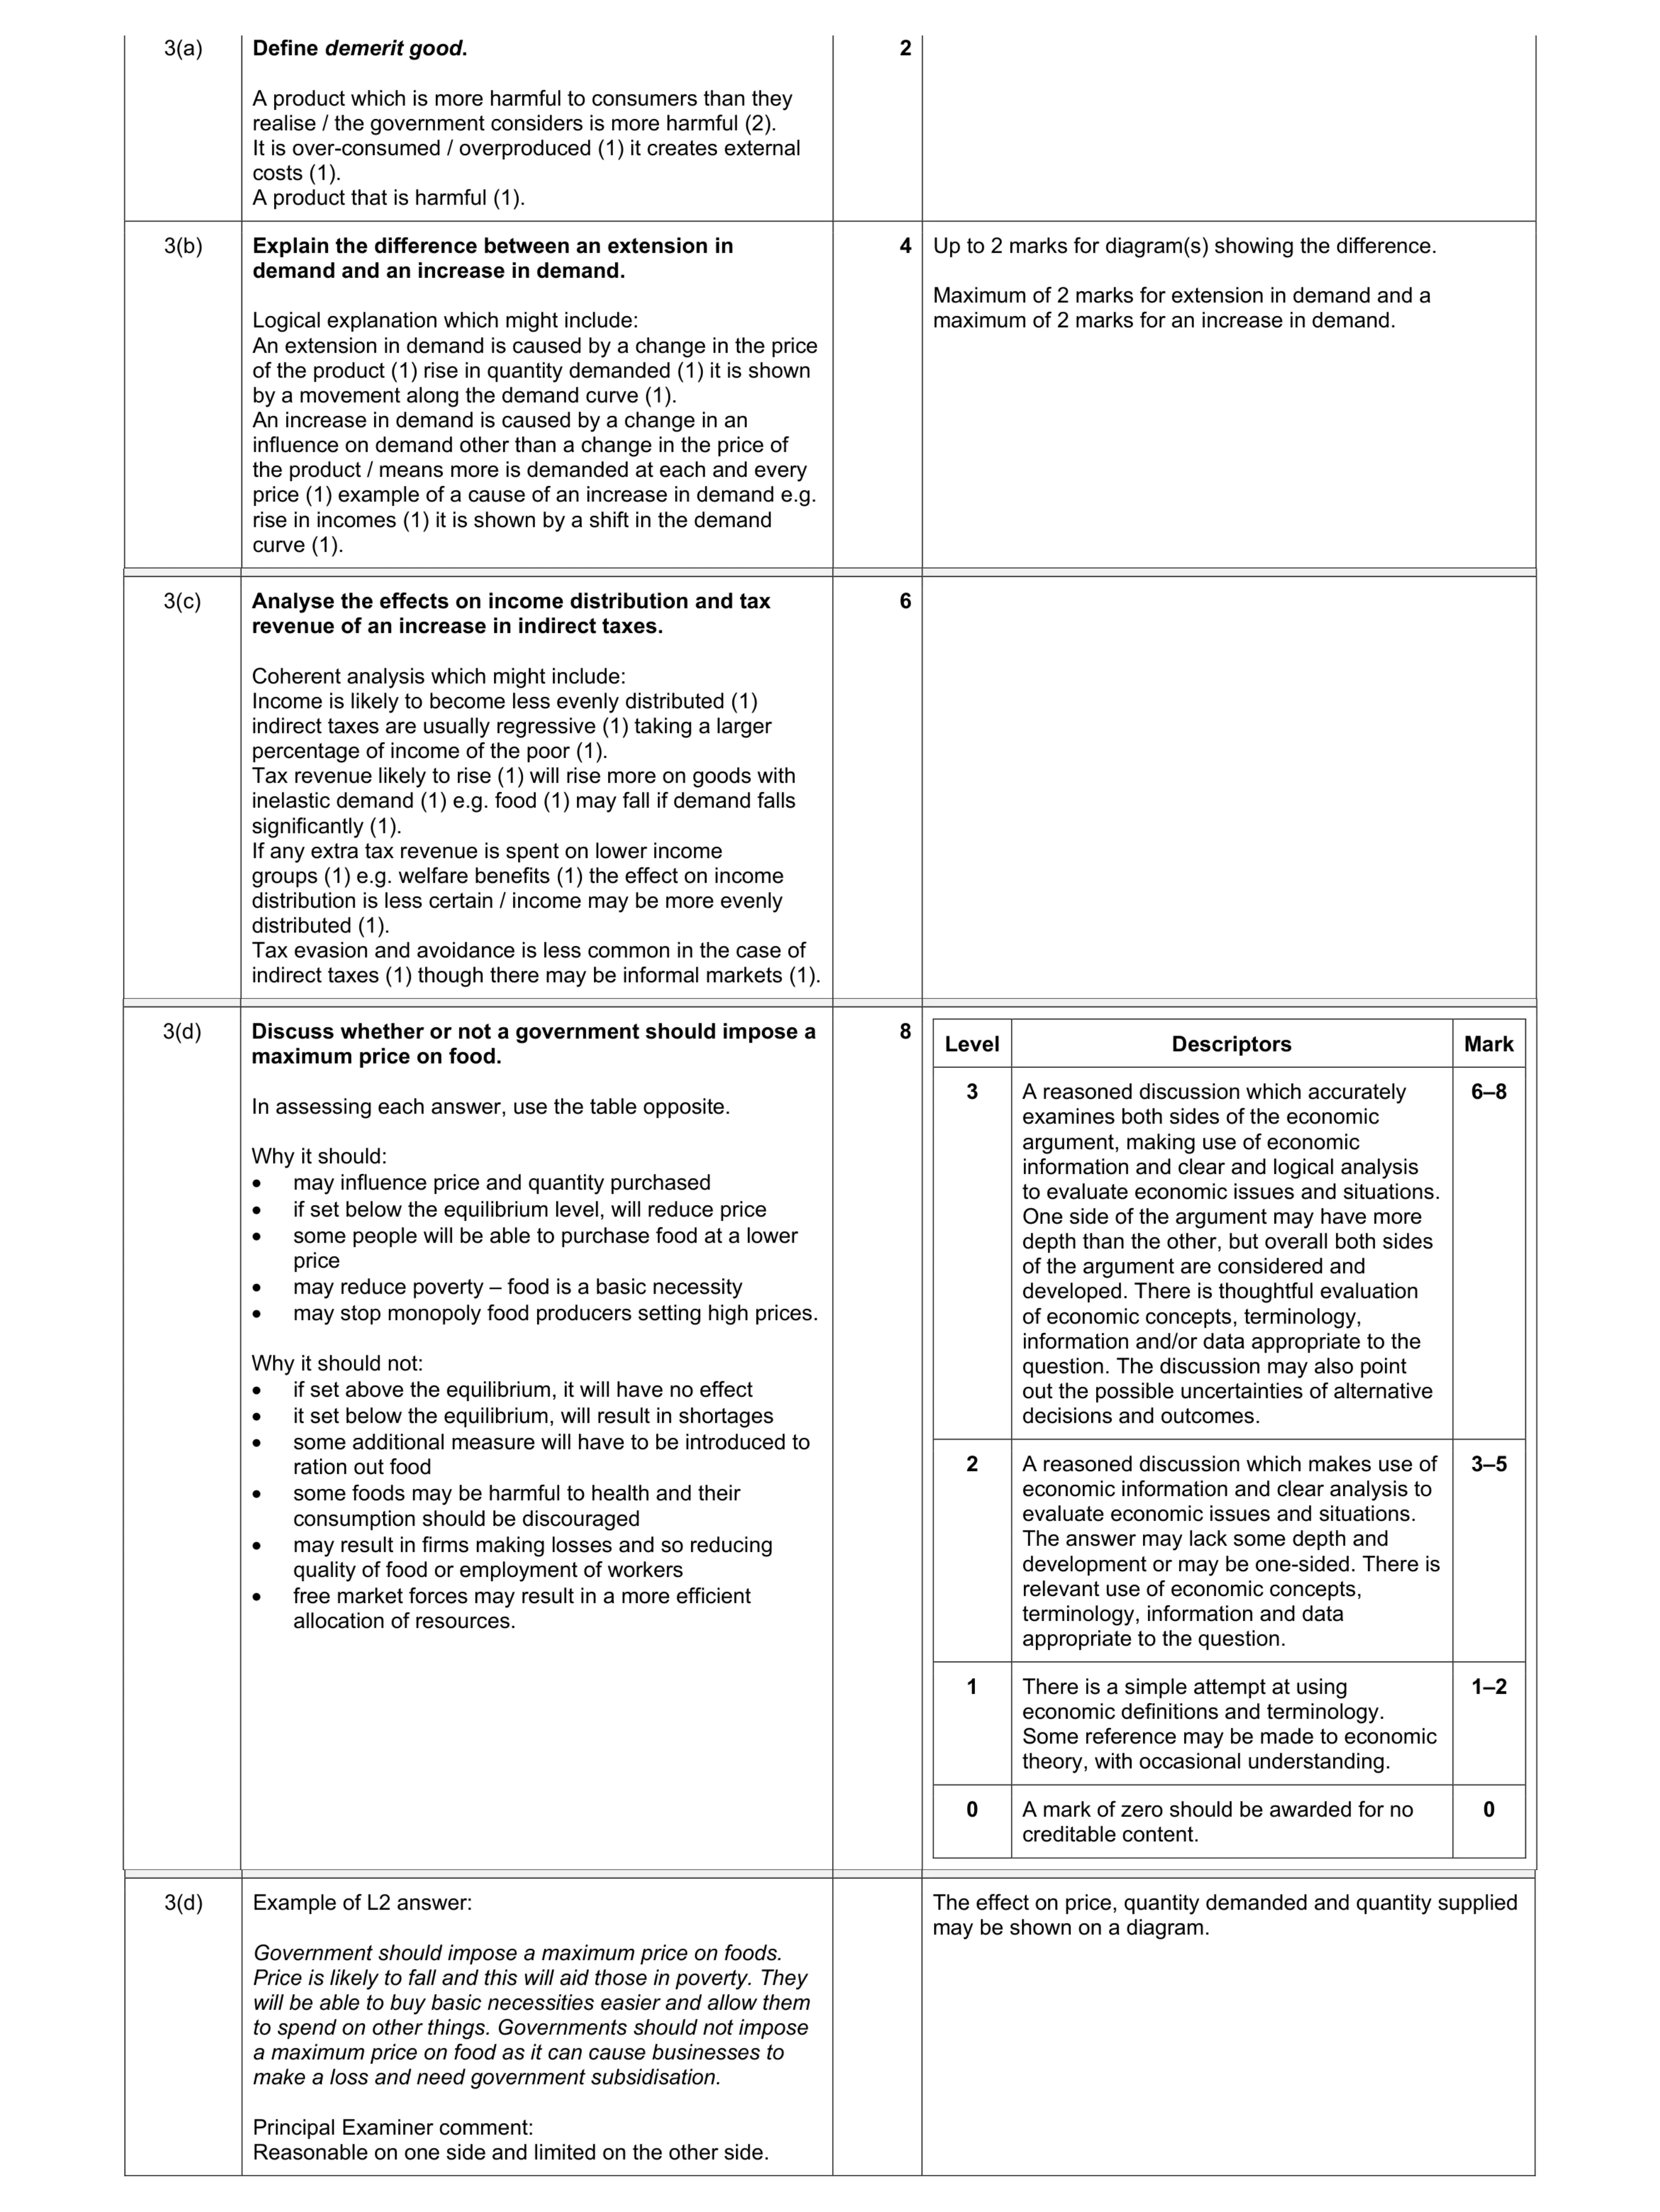 20
20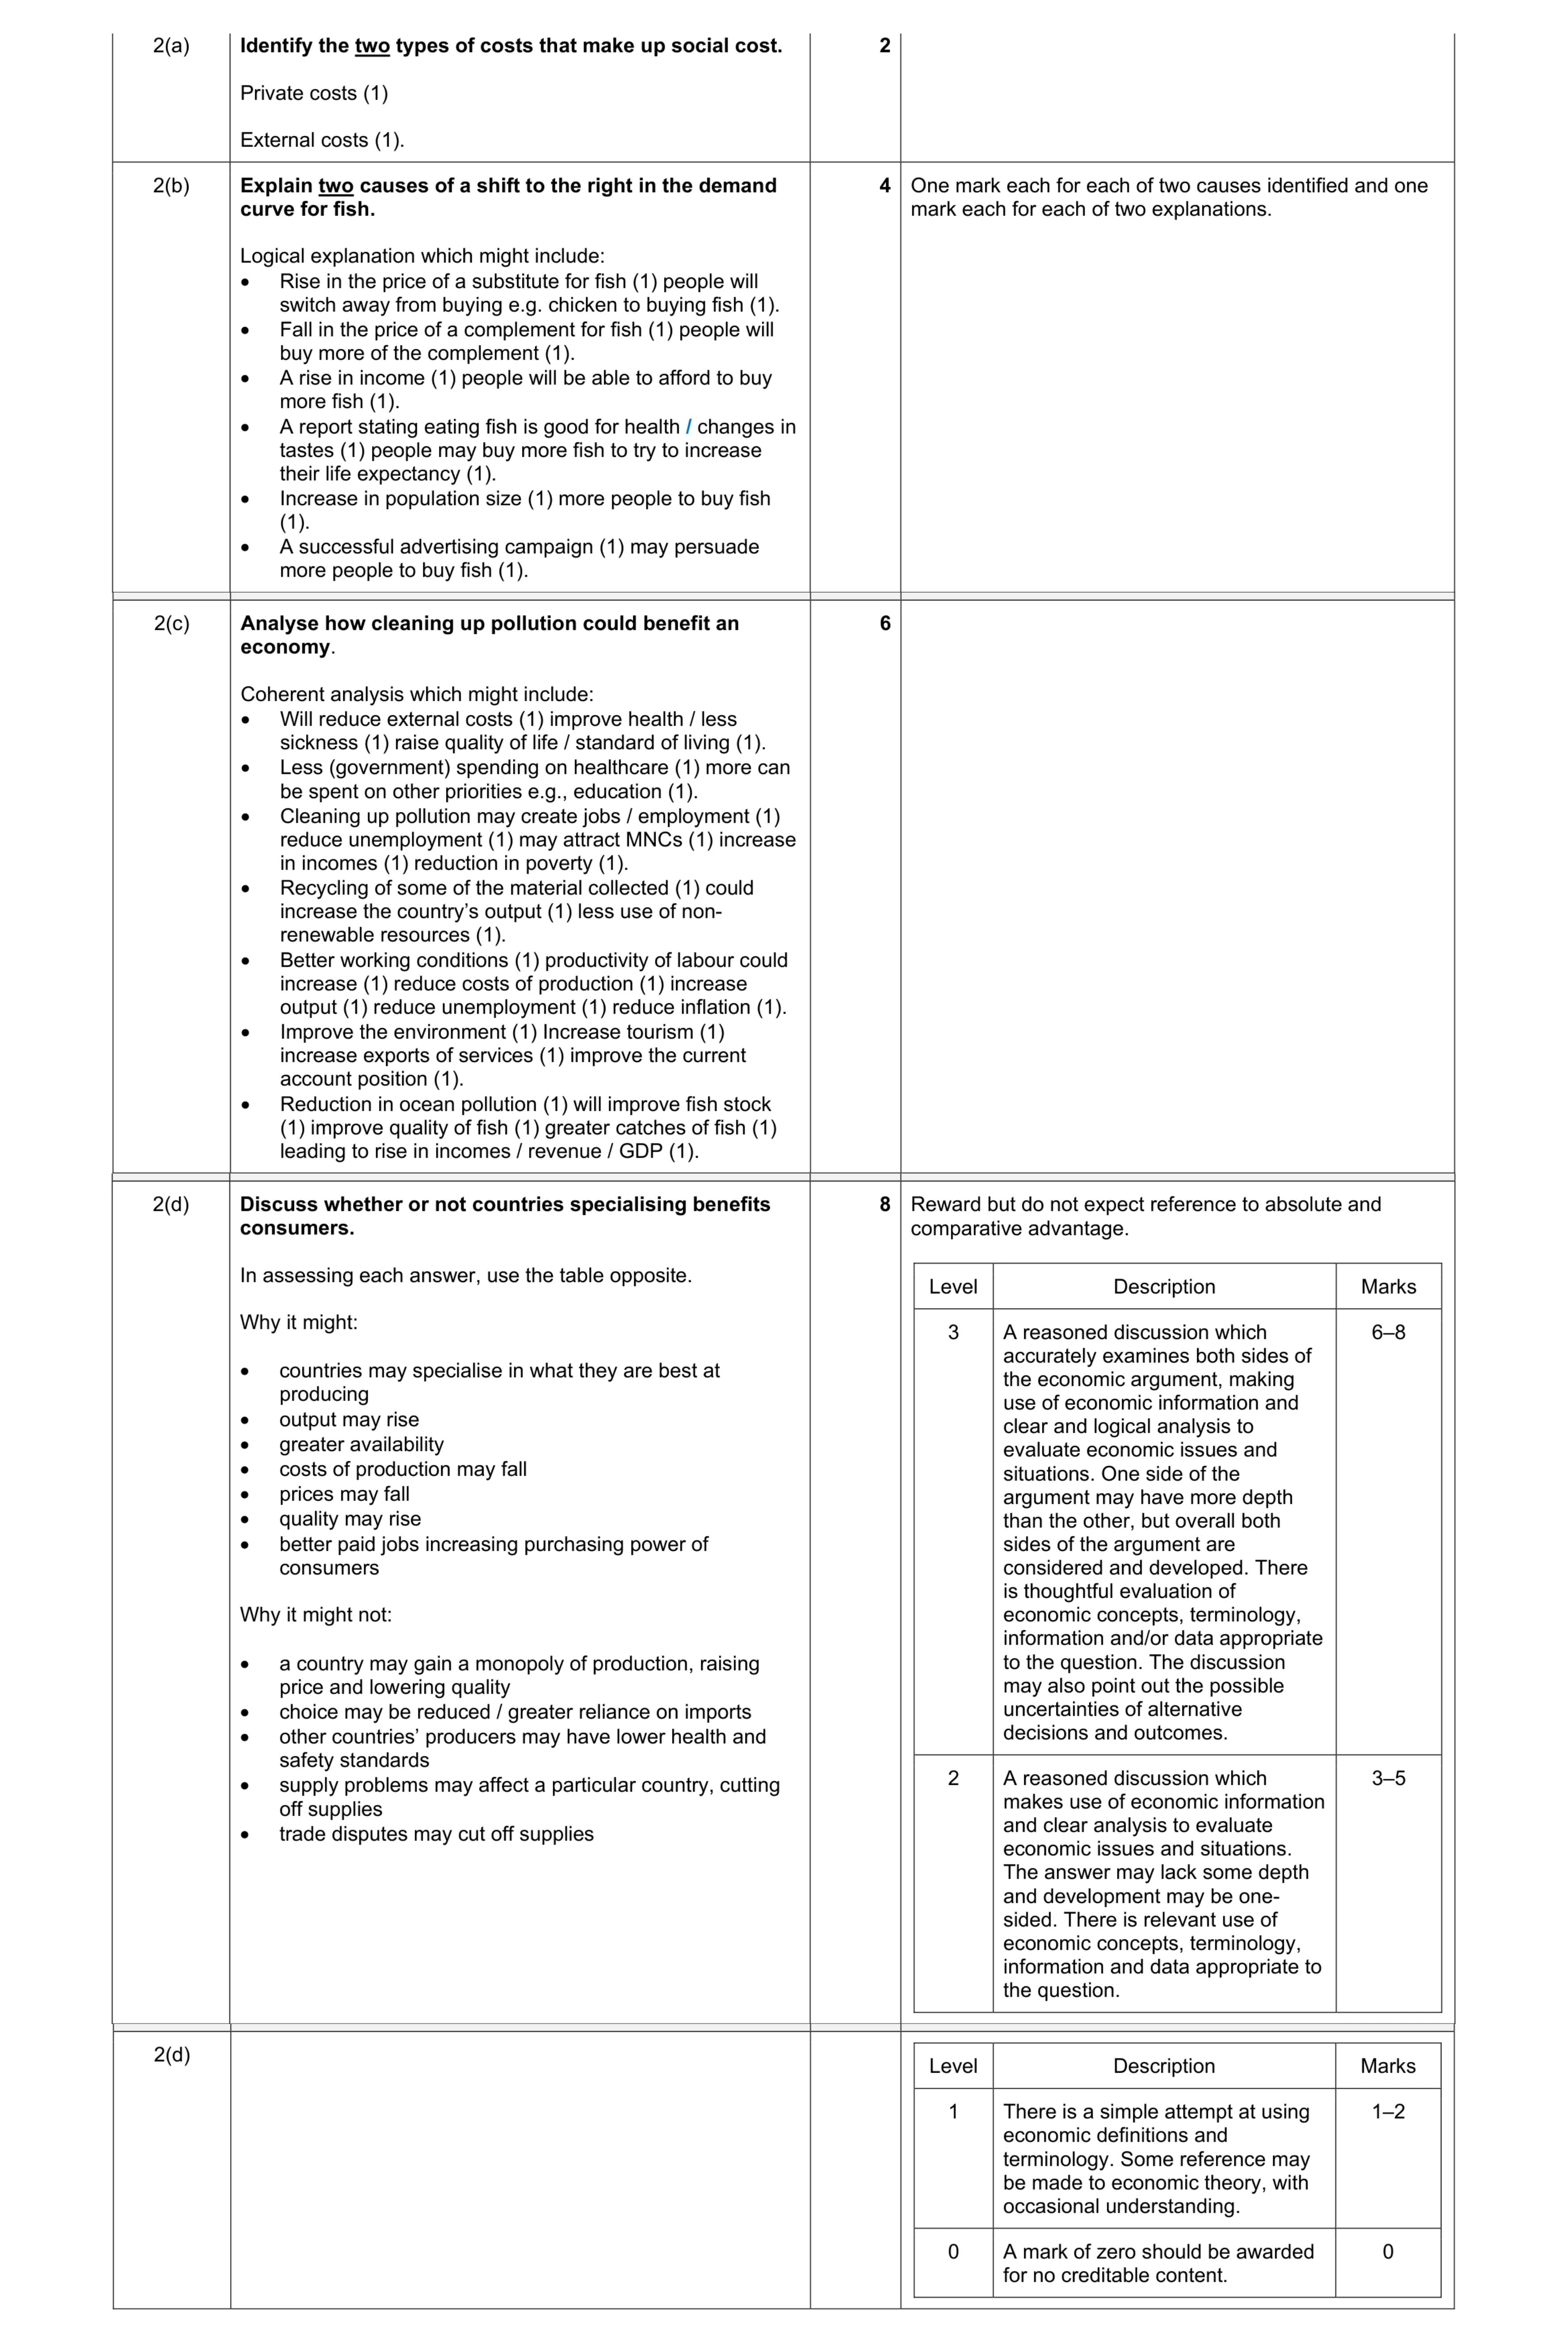 20
20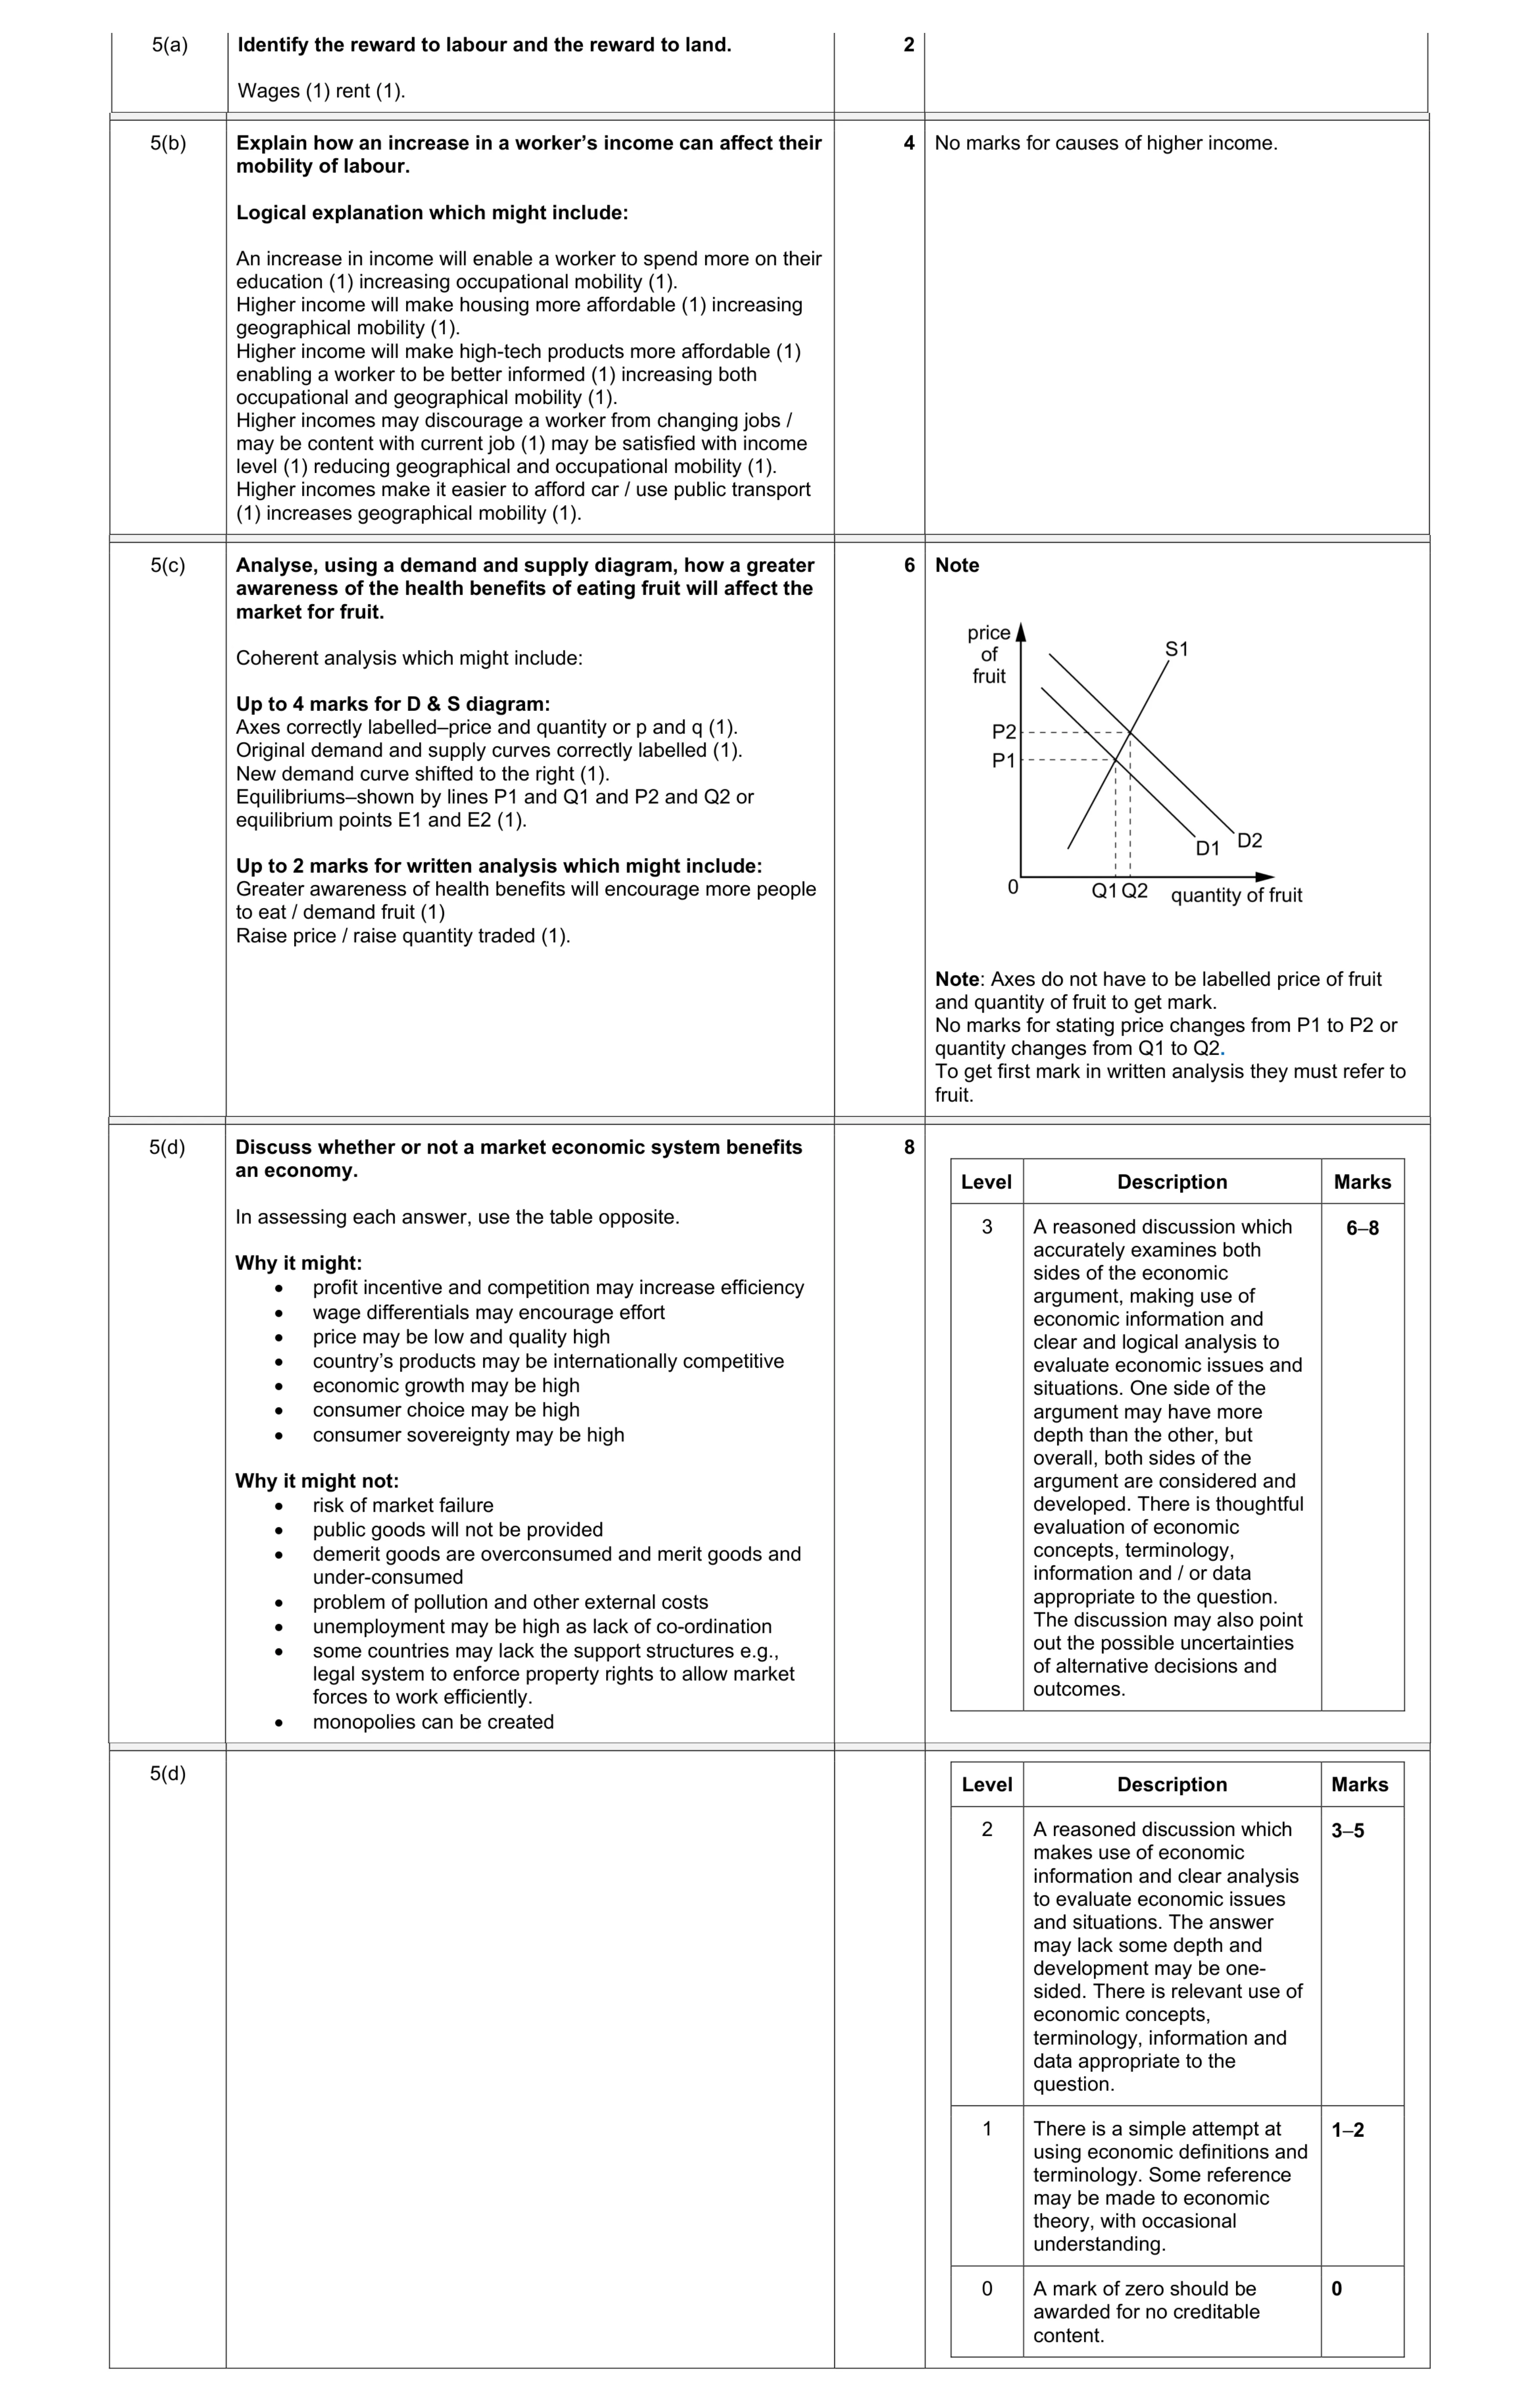 20
20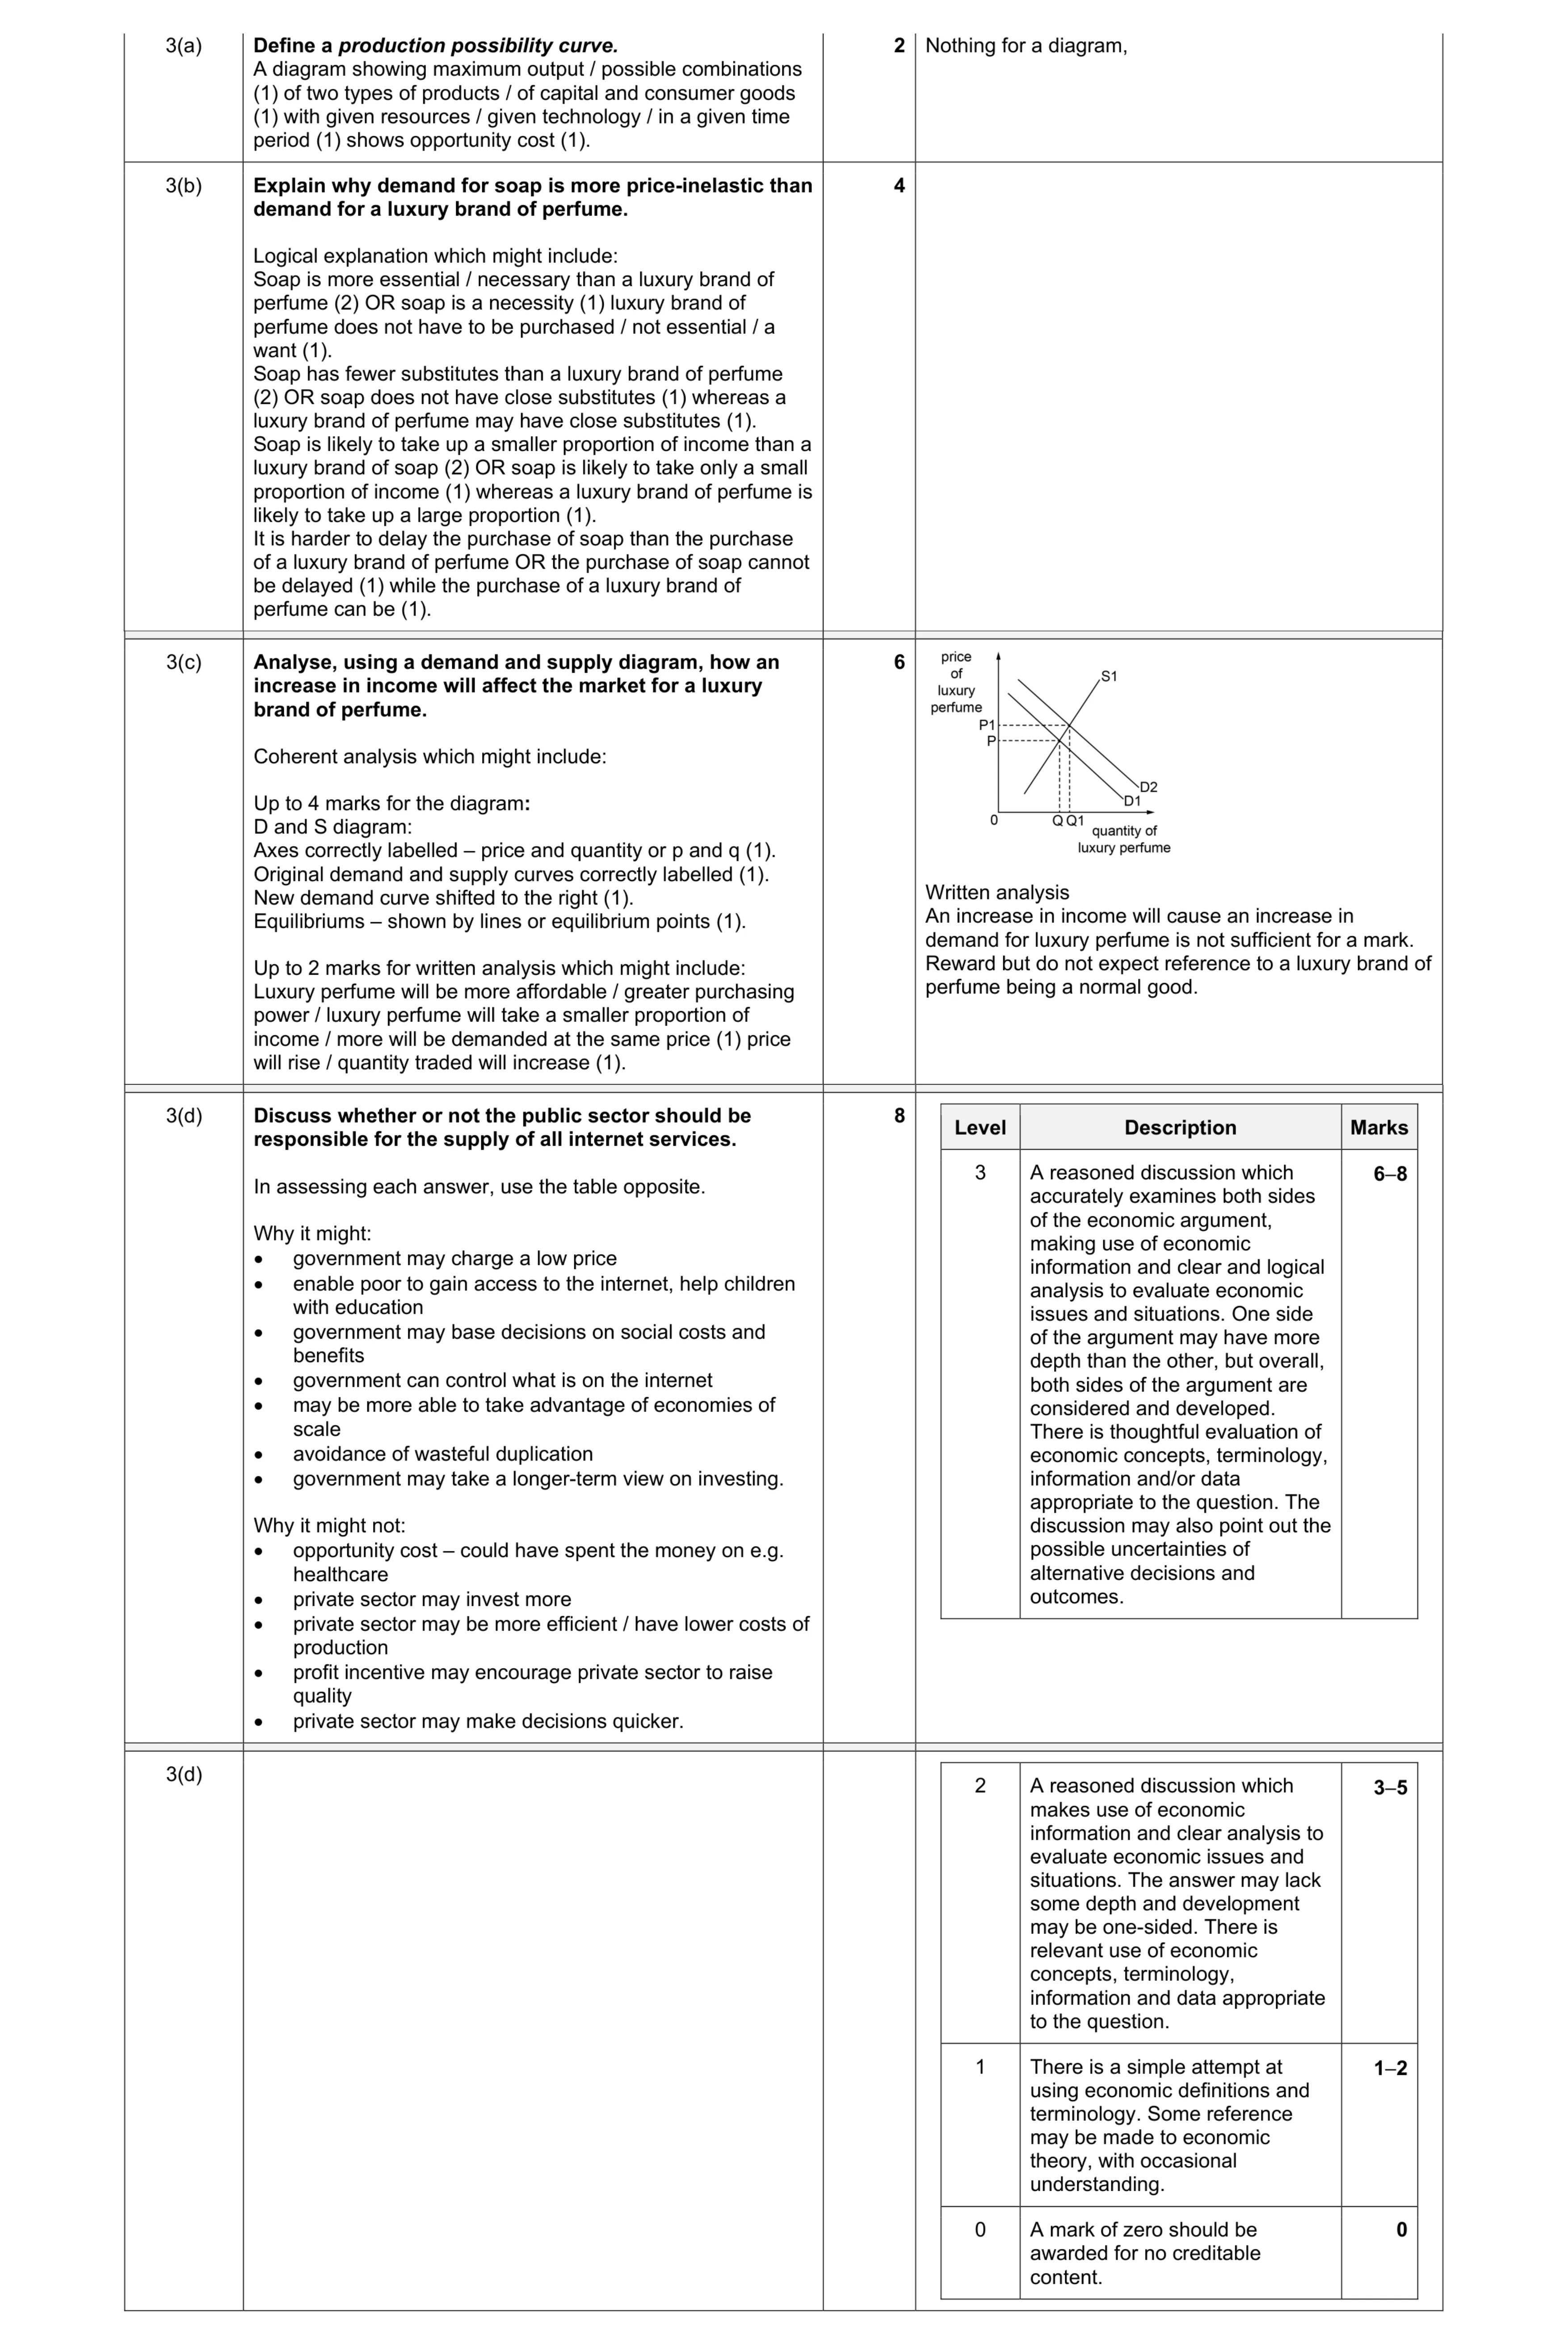 20
20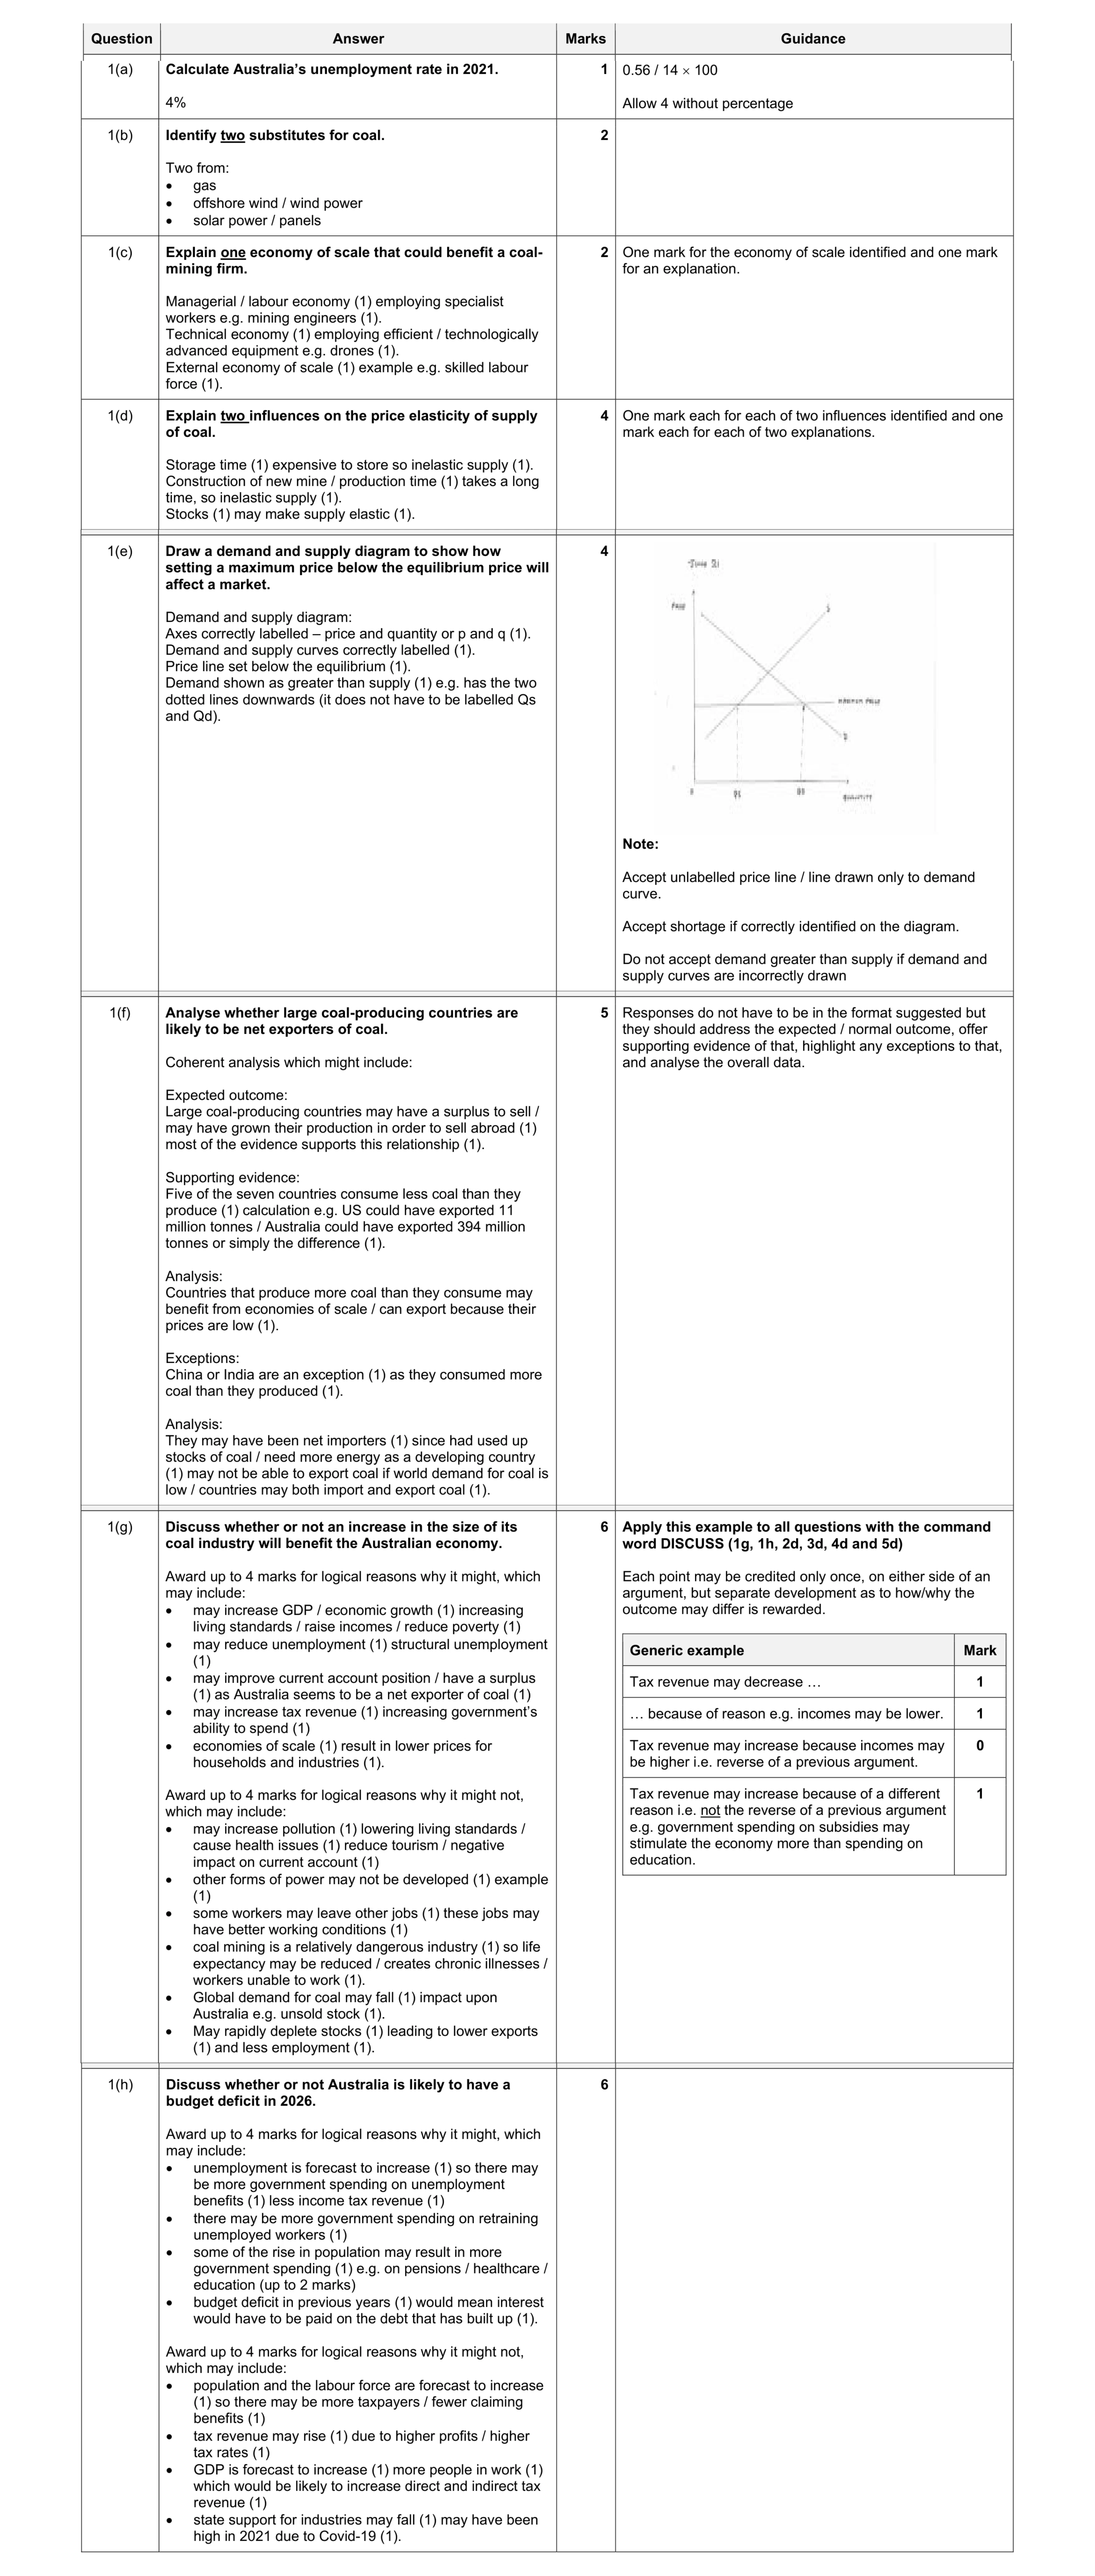 30
30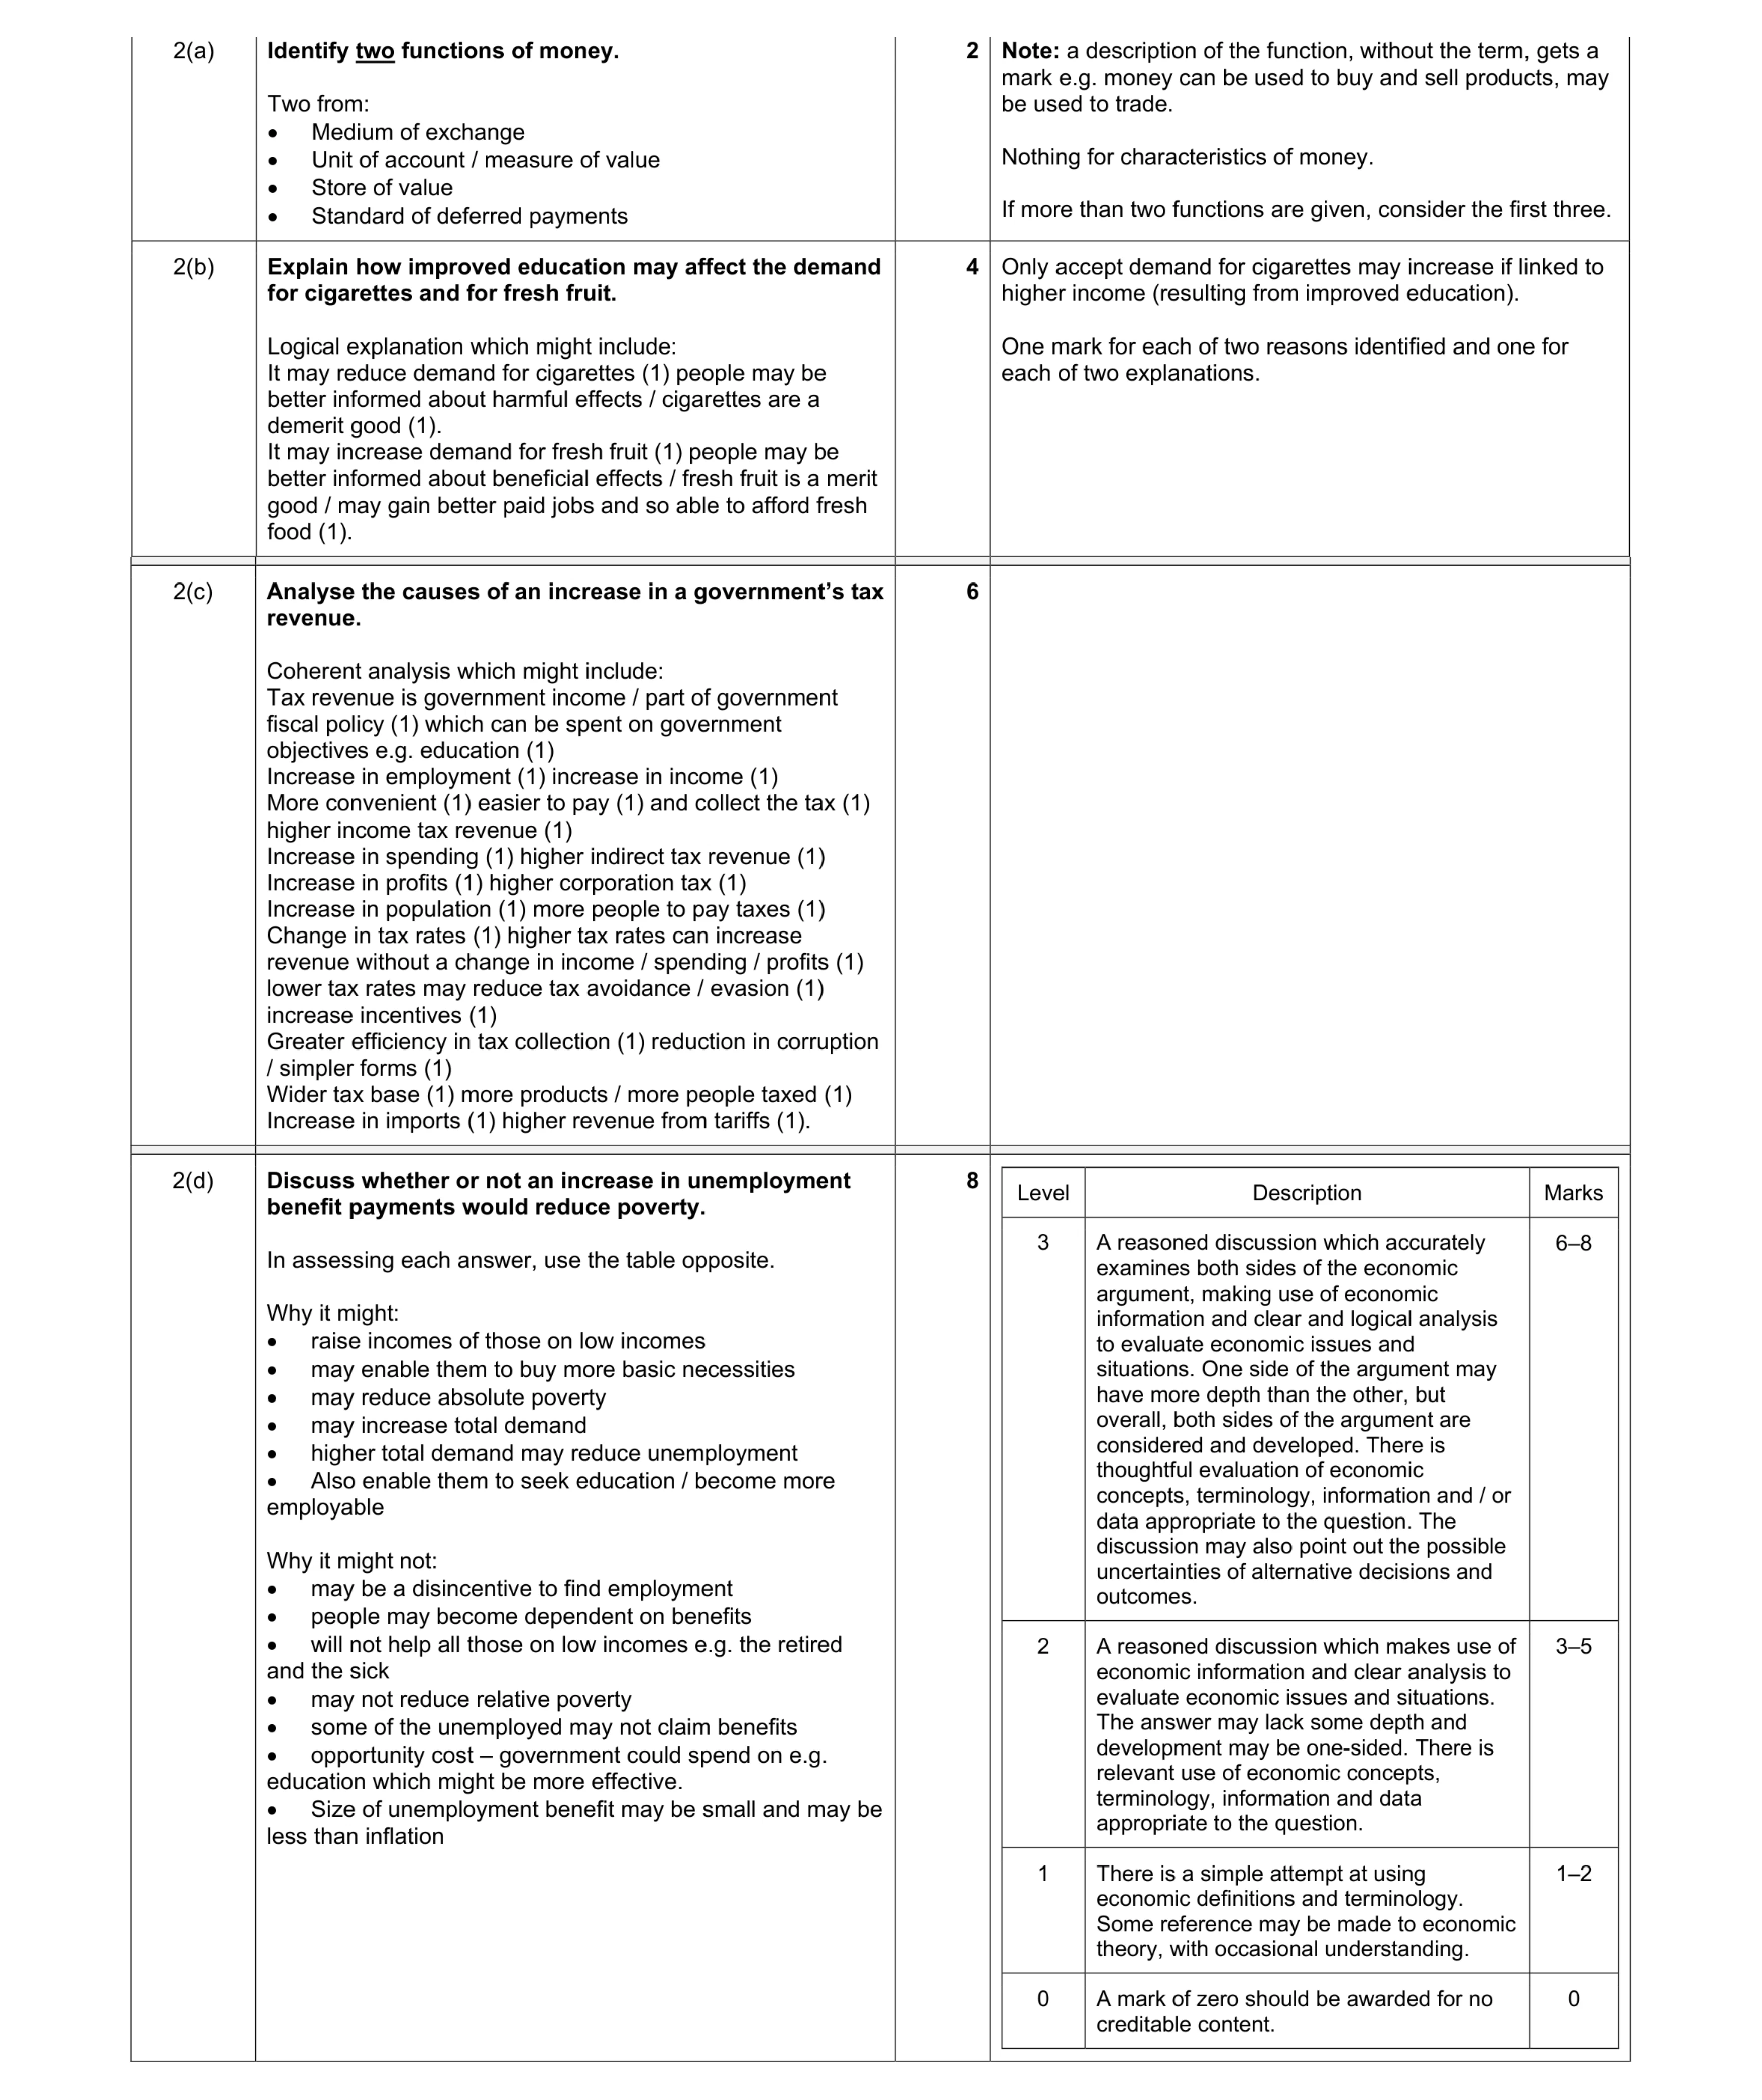 20
20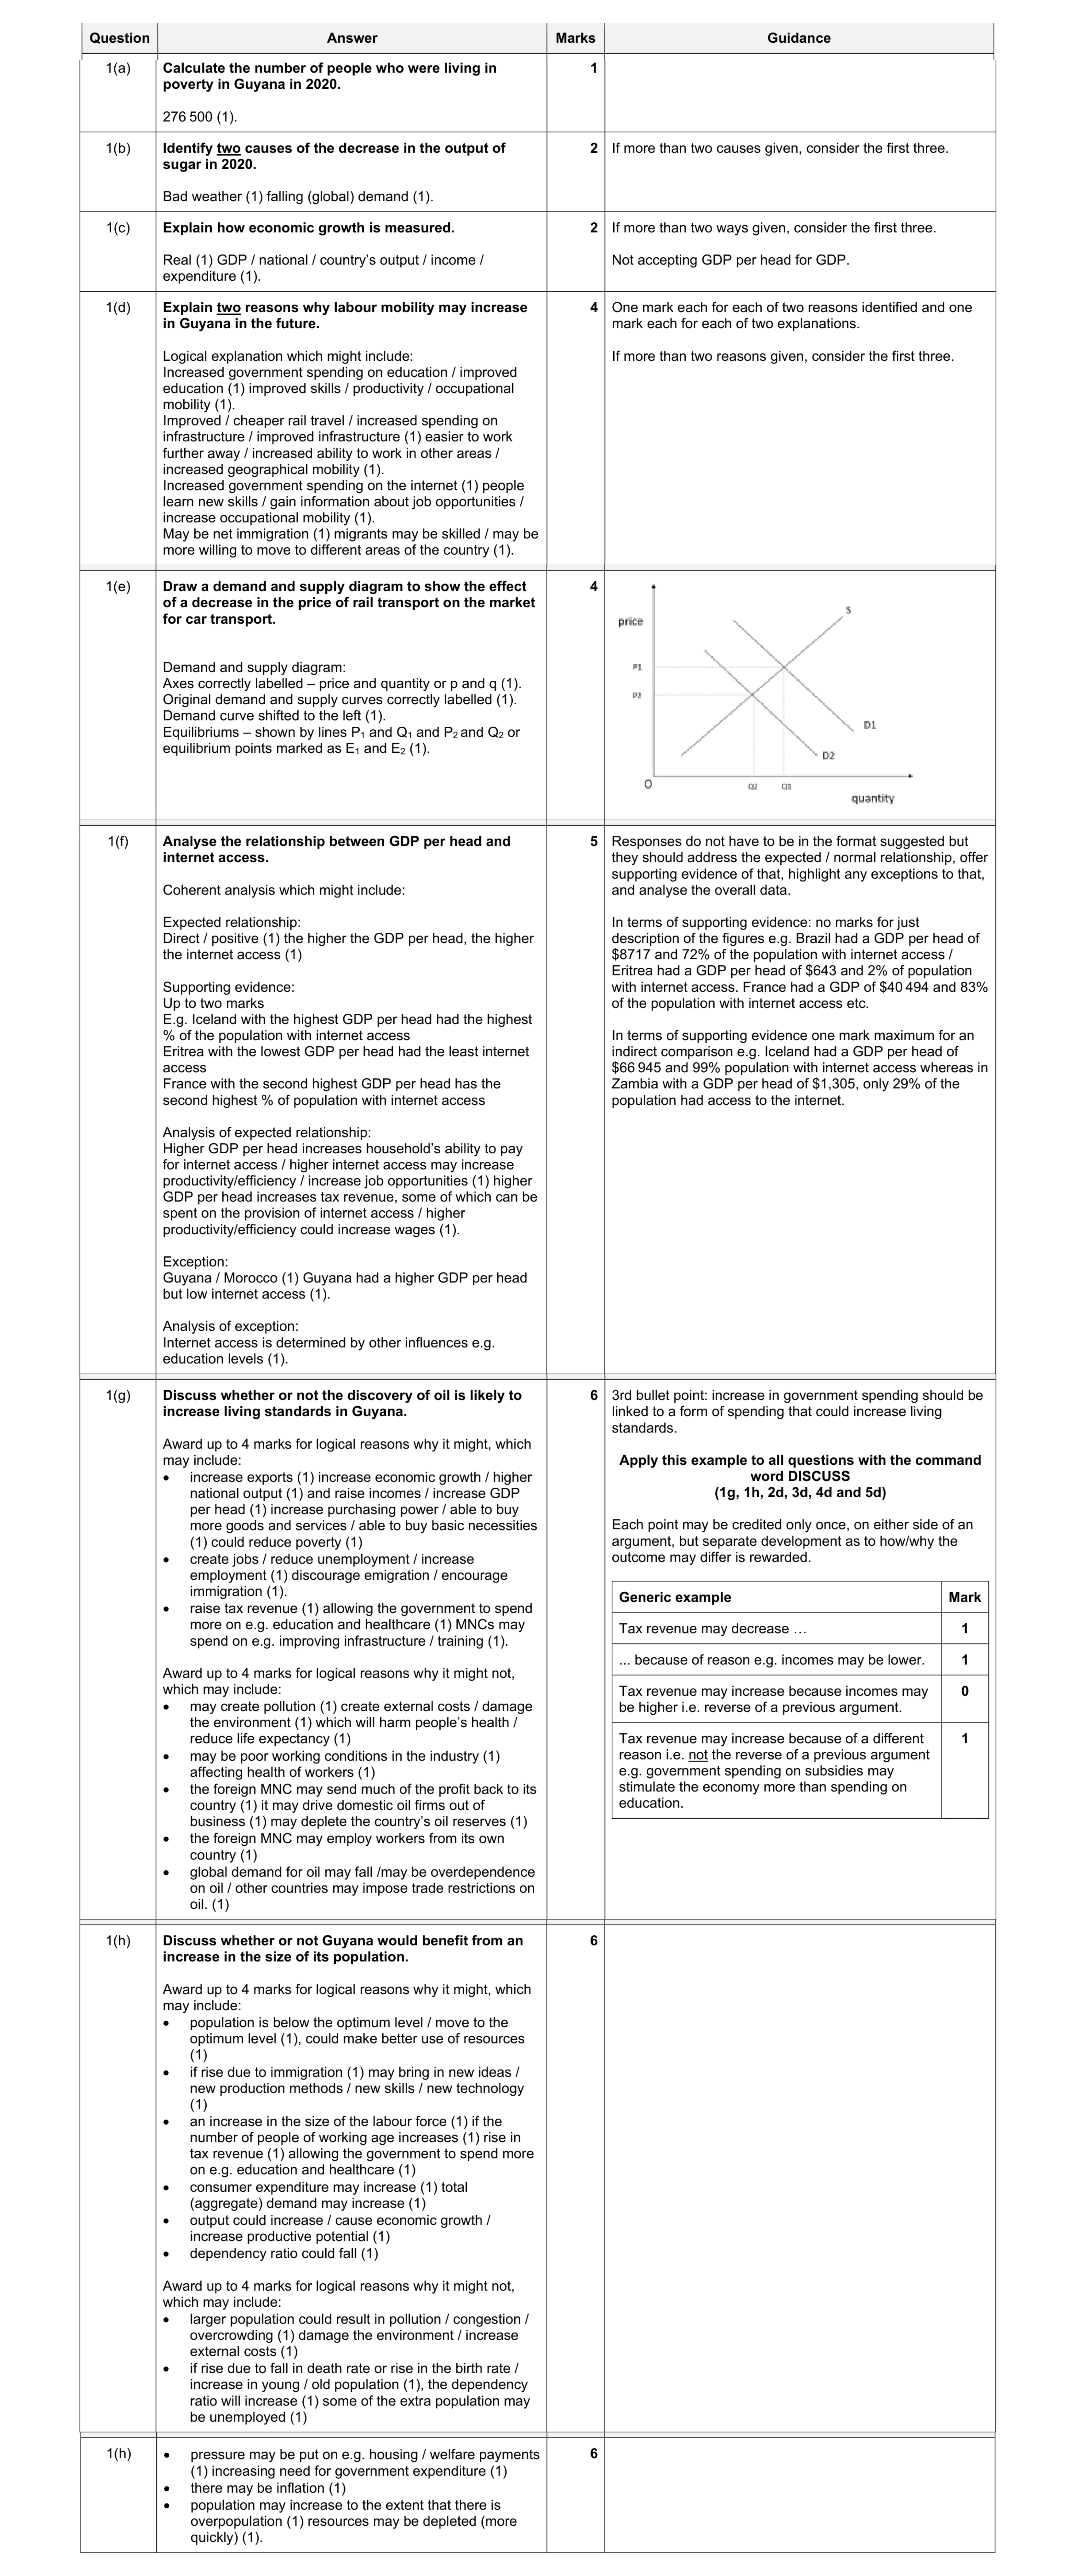 30
30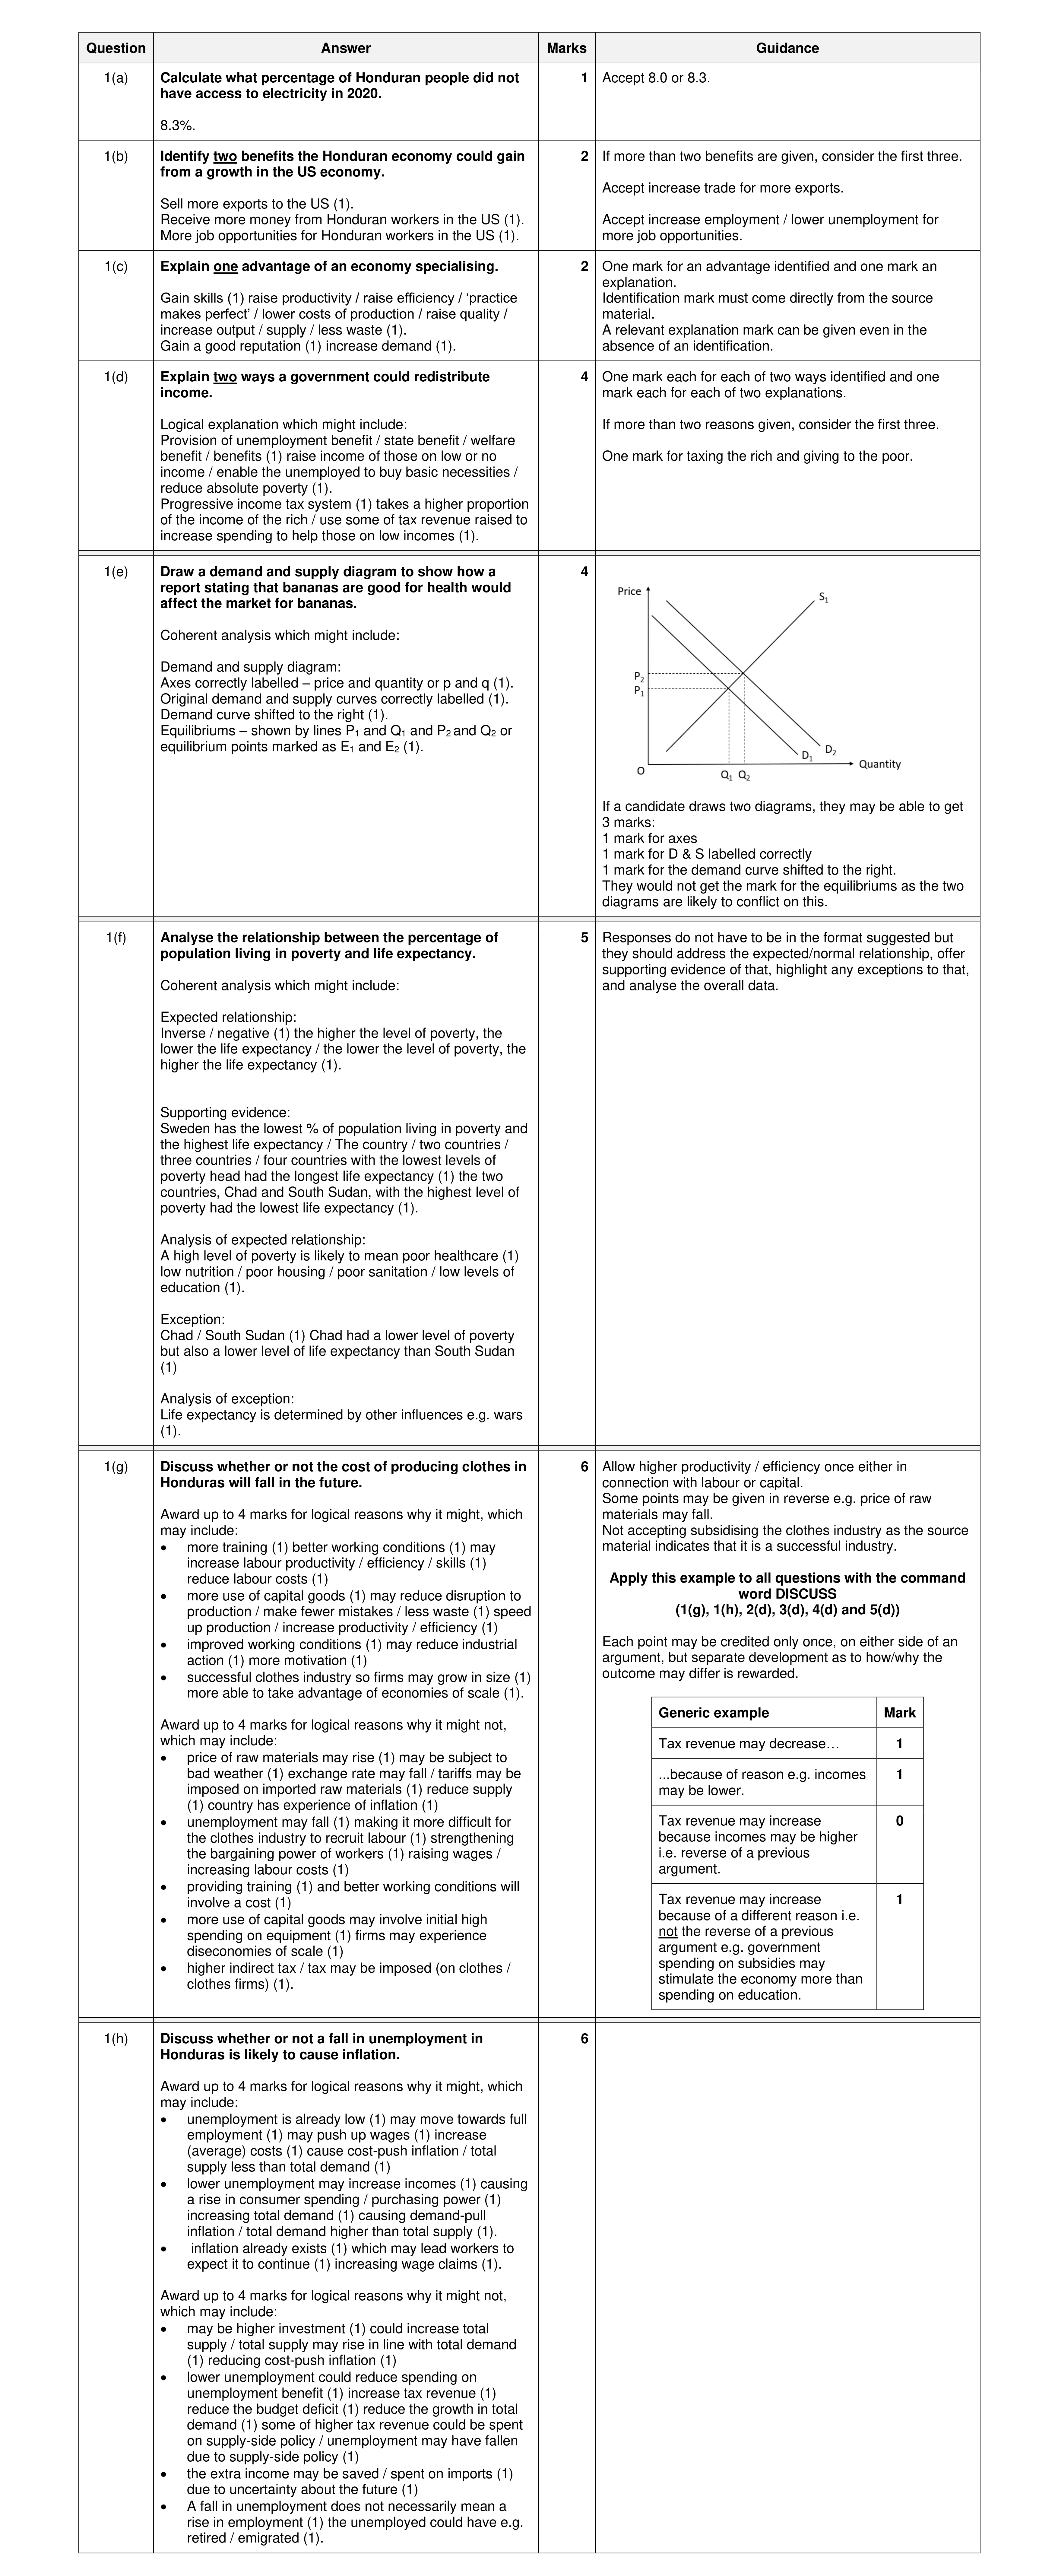 30
30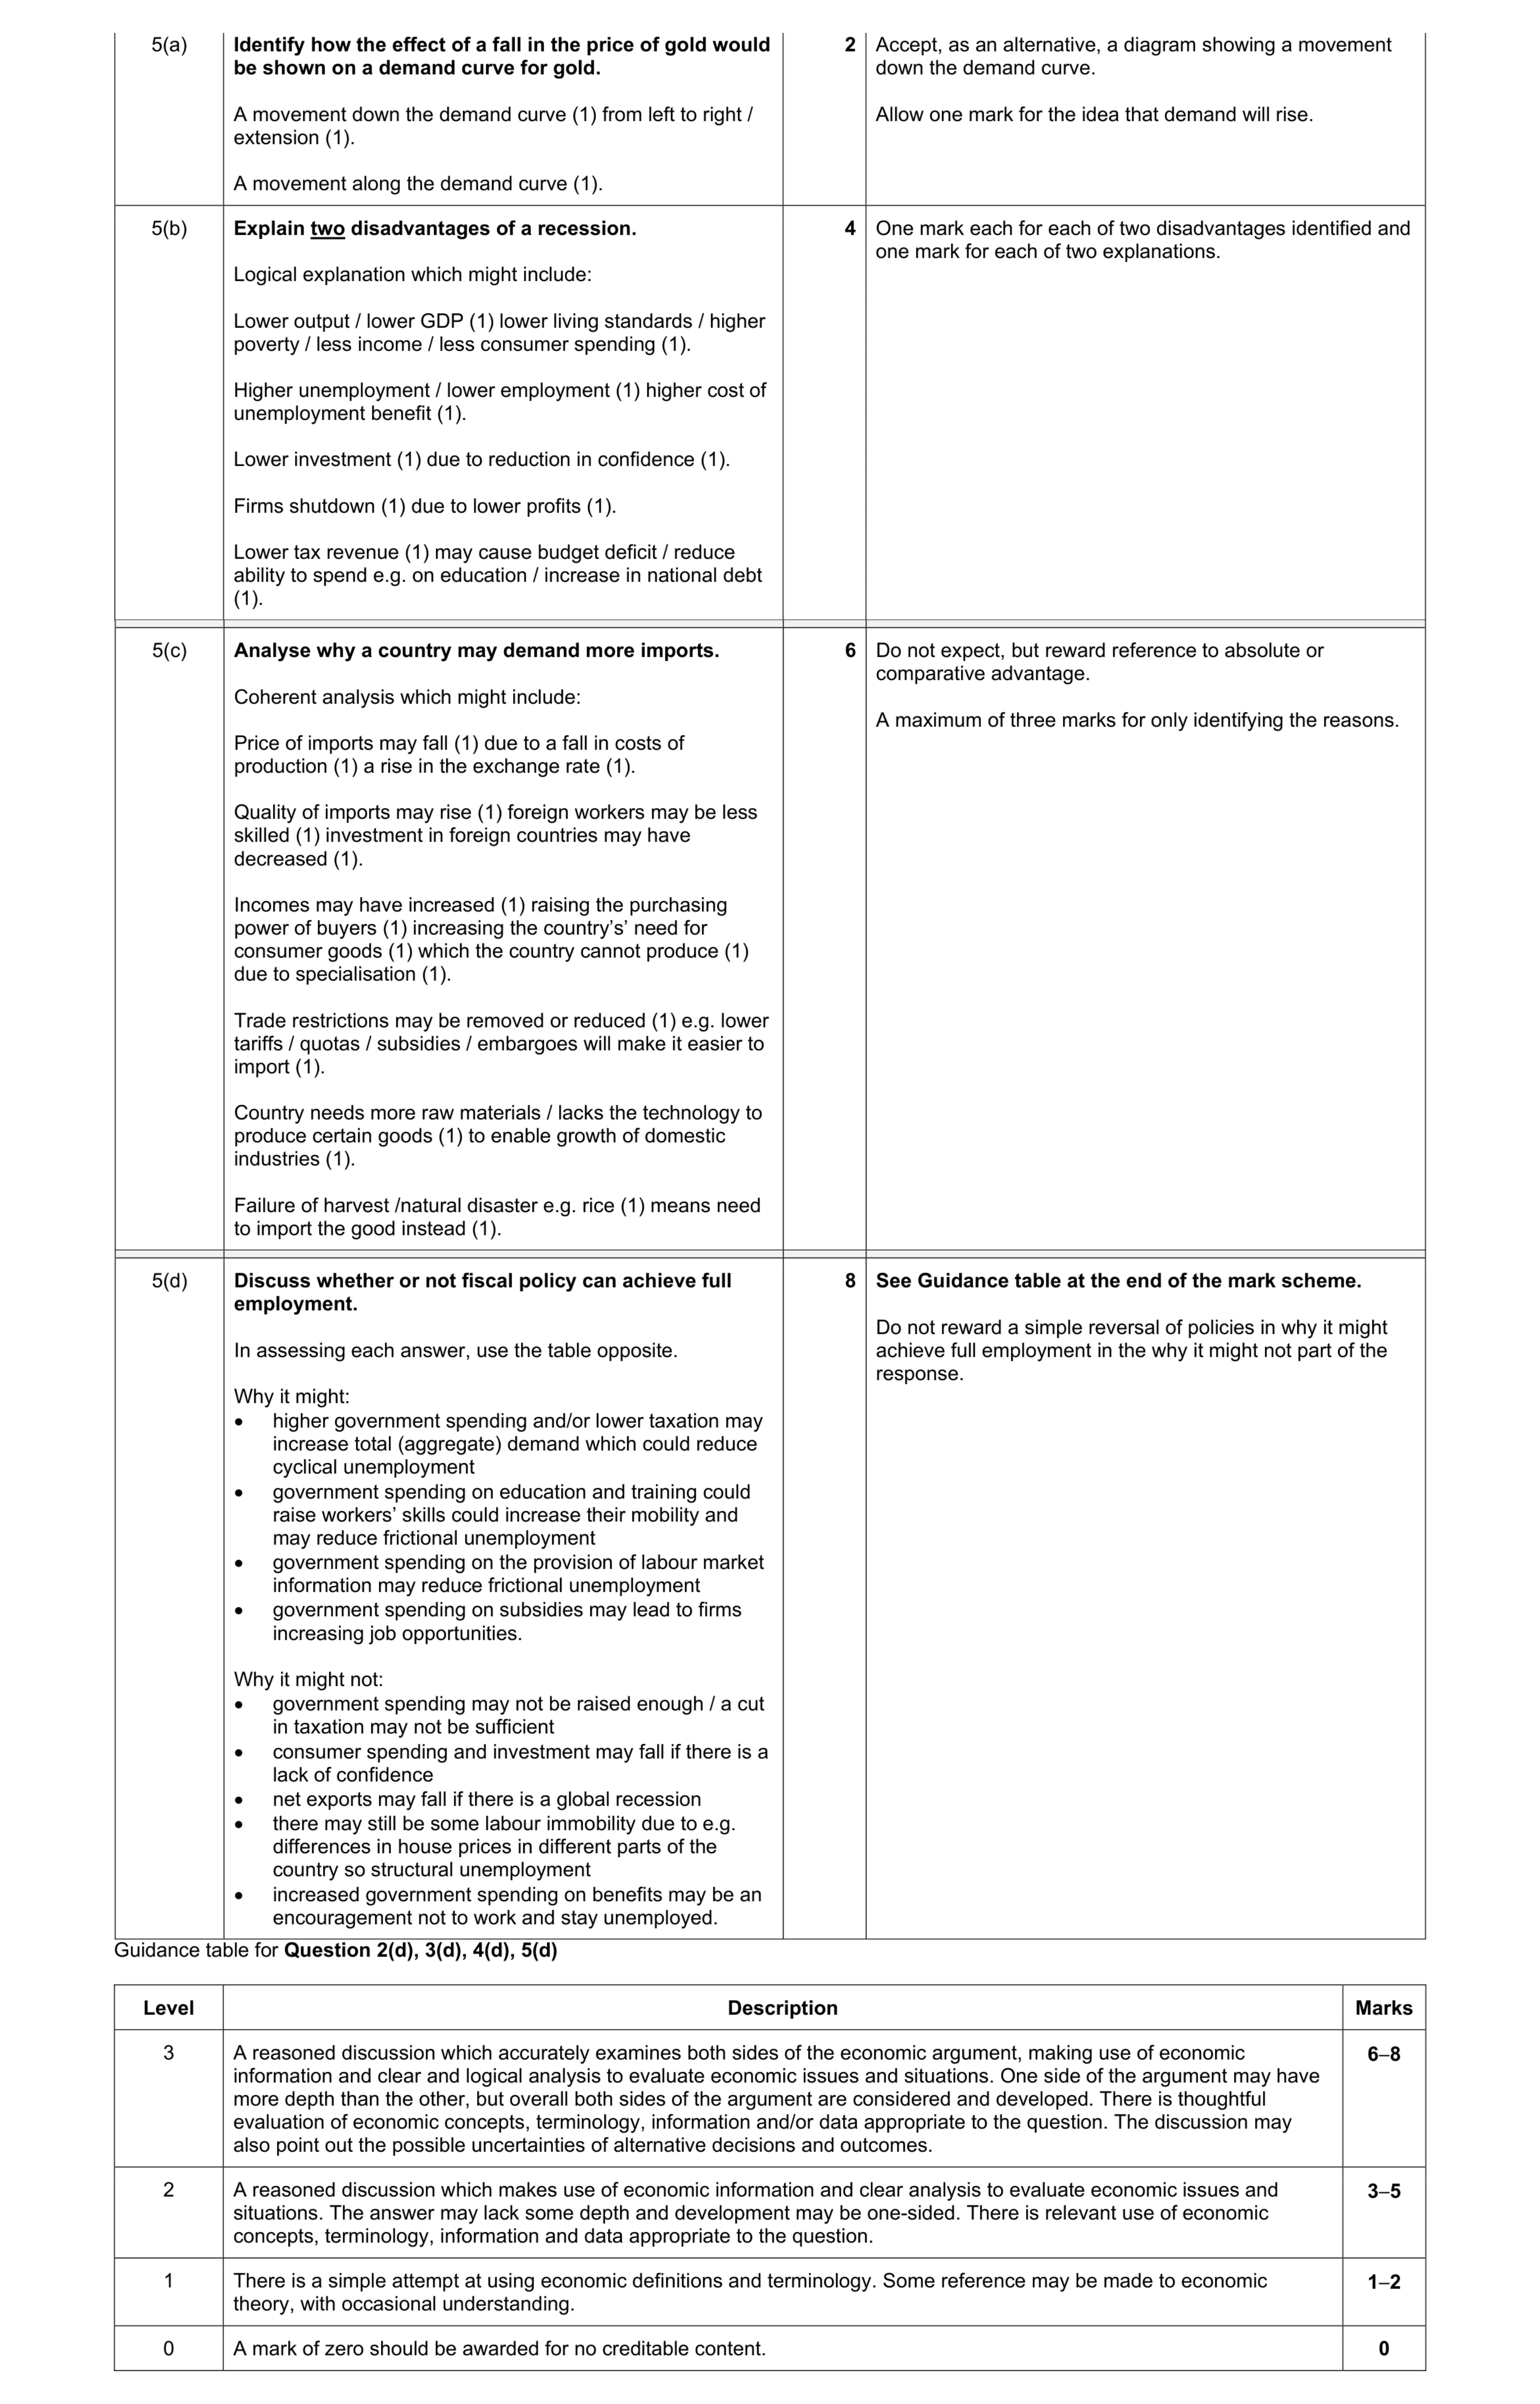 20
20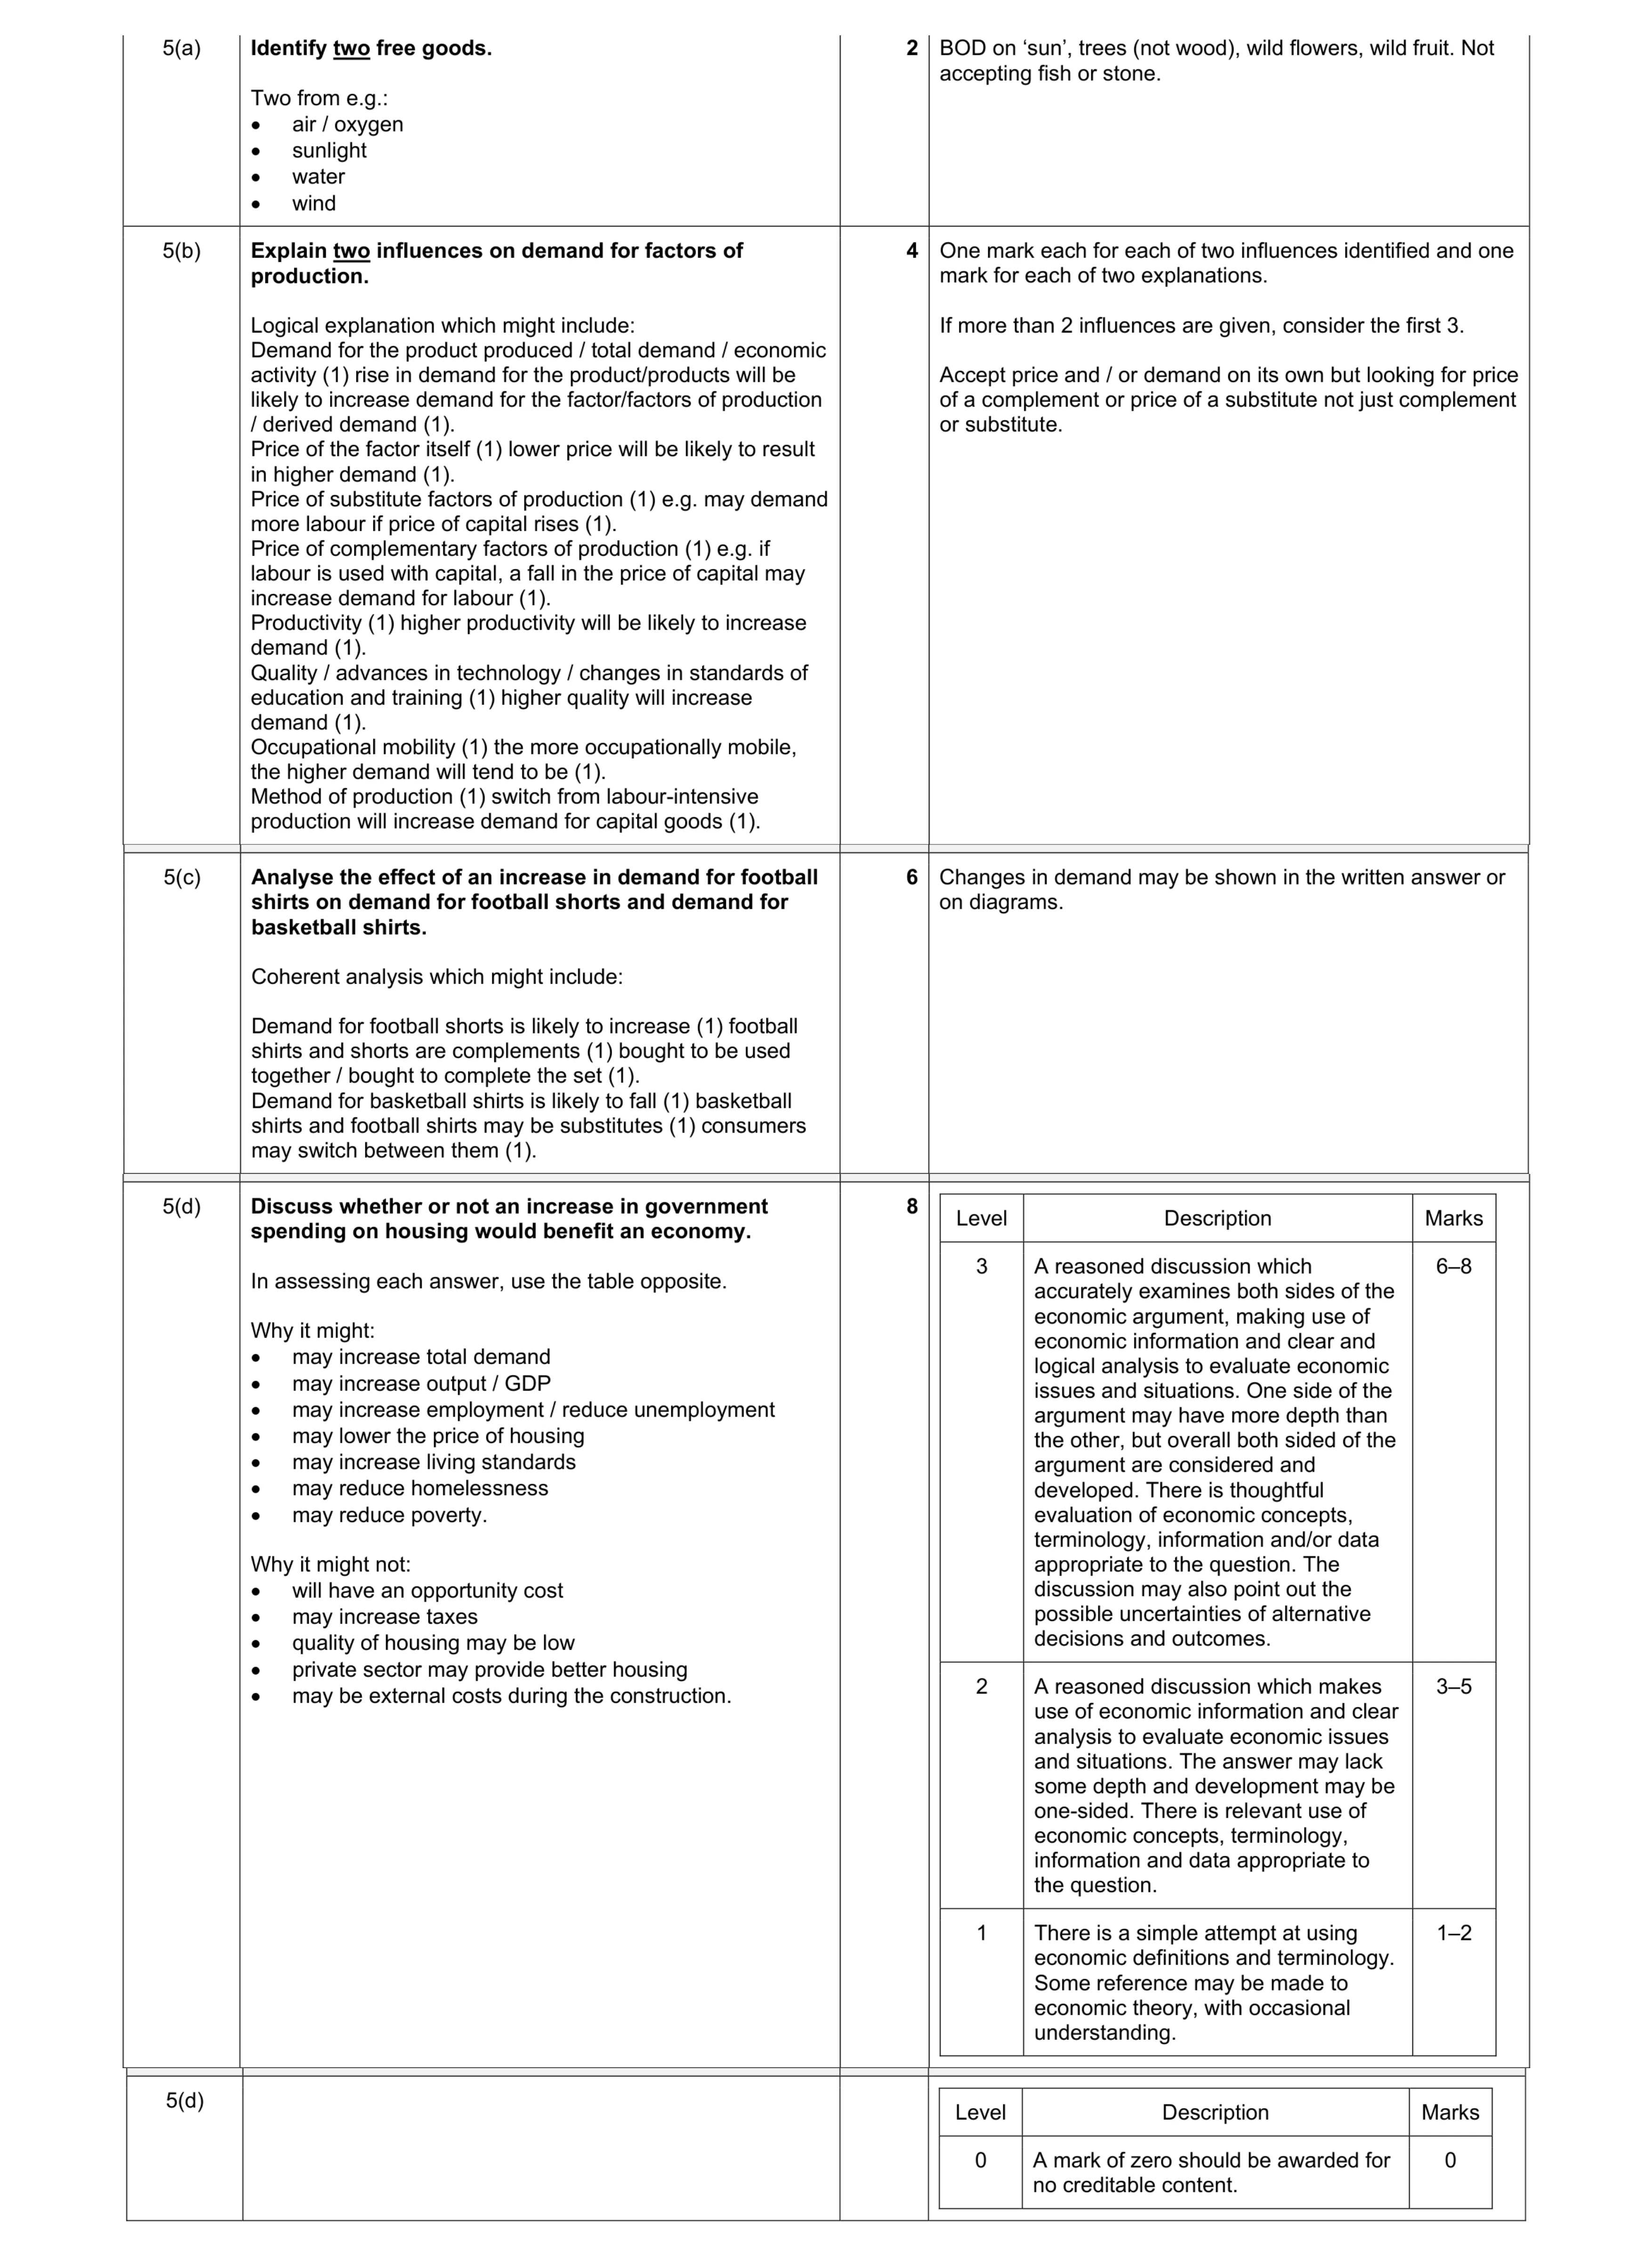 20
20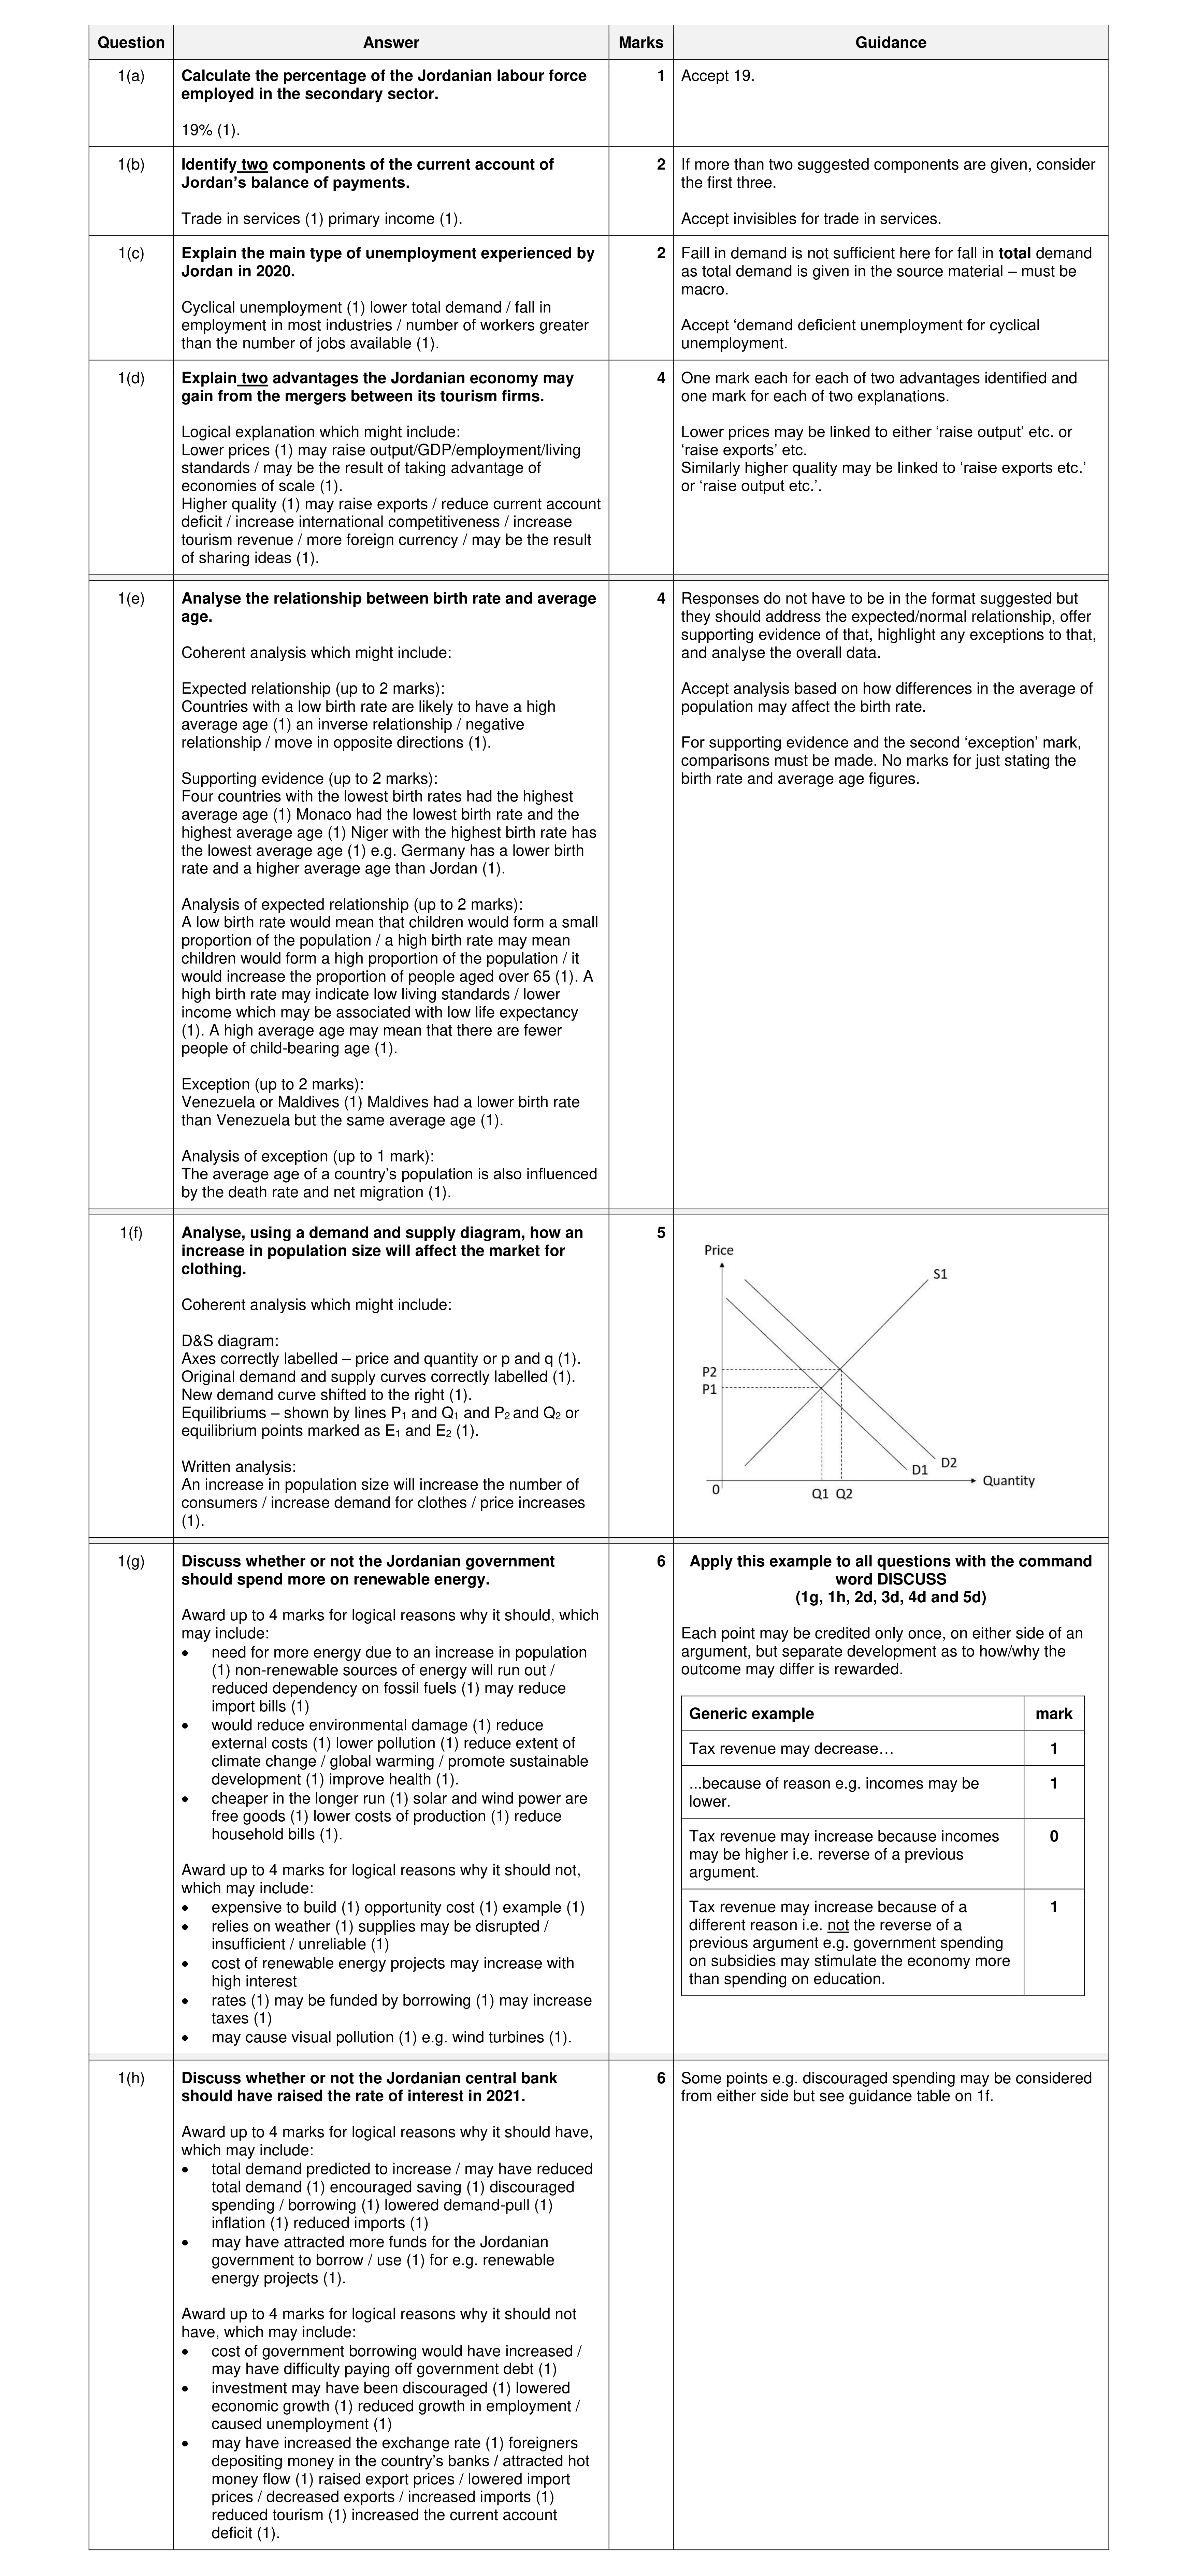 30
30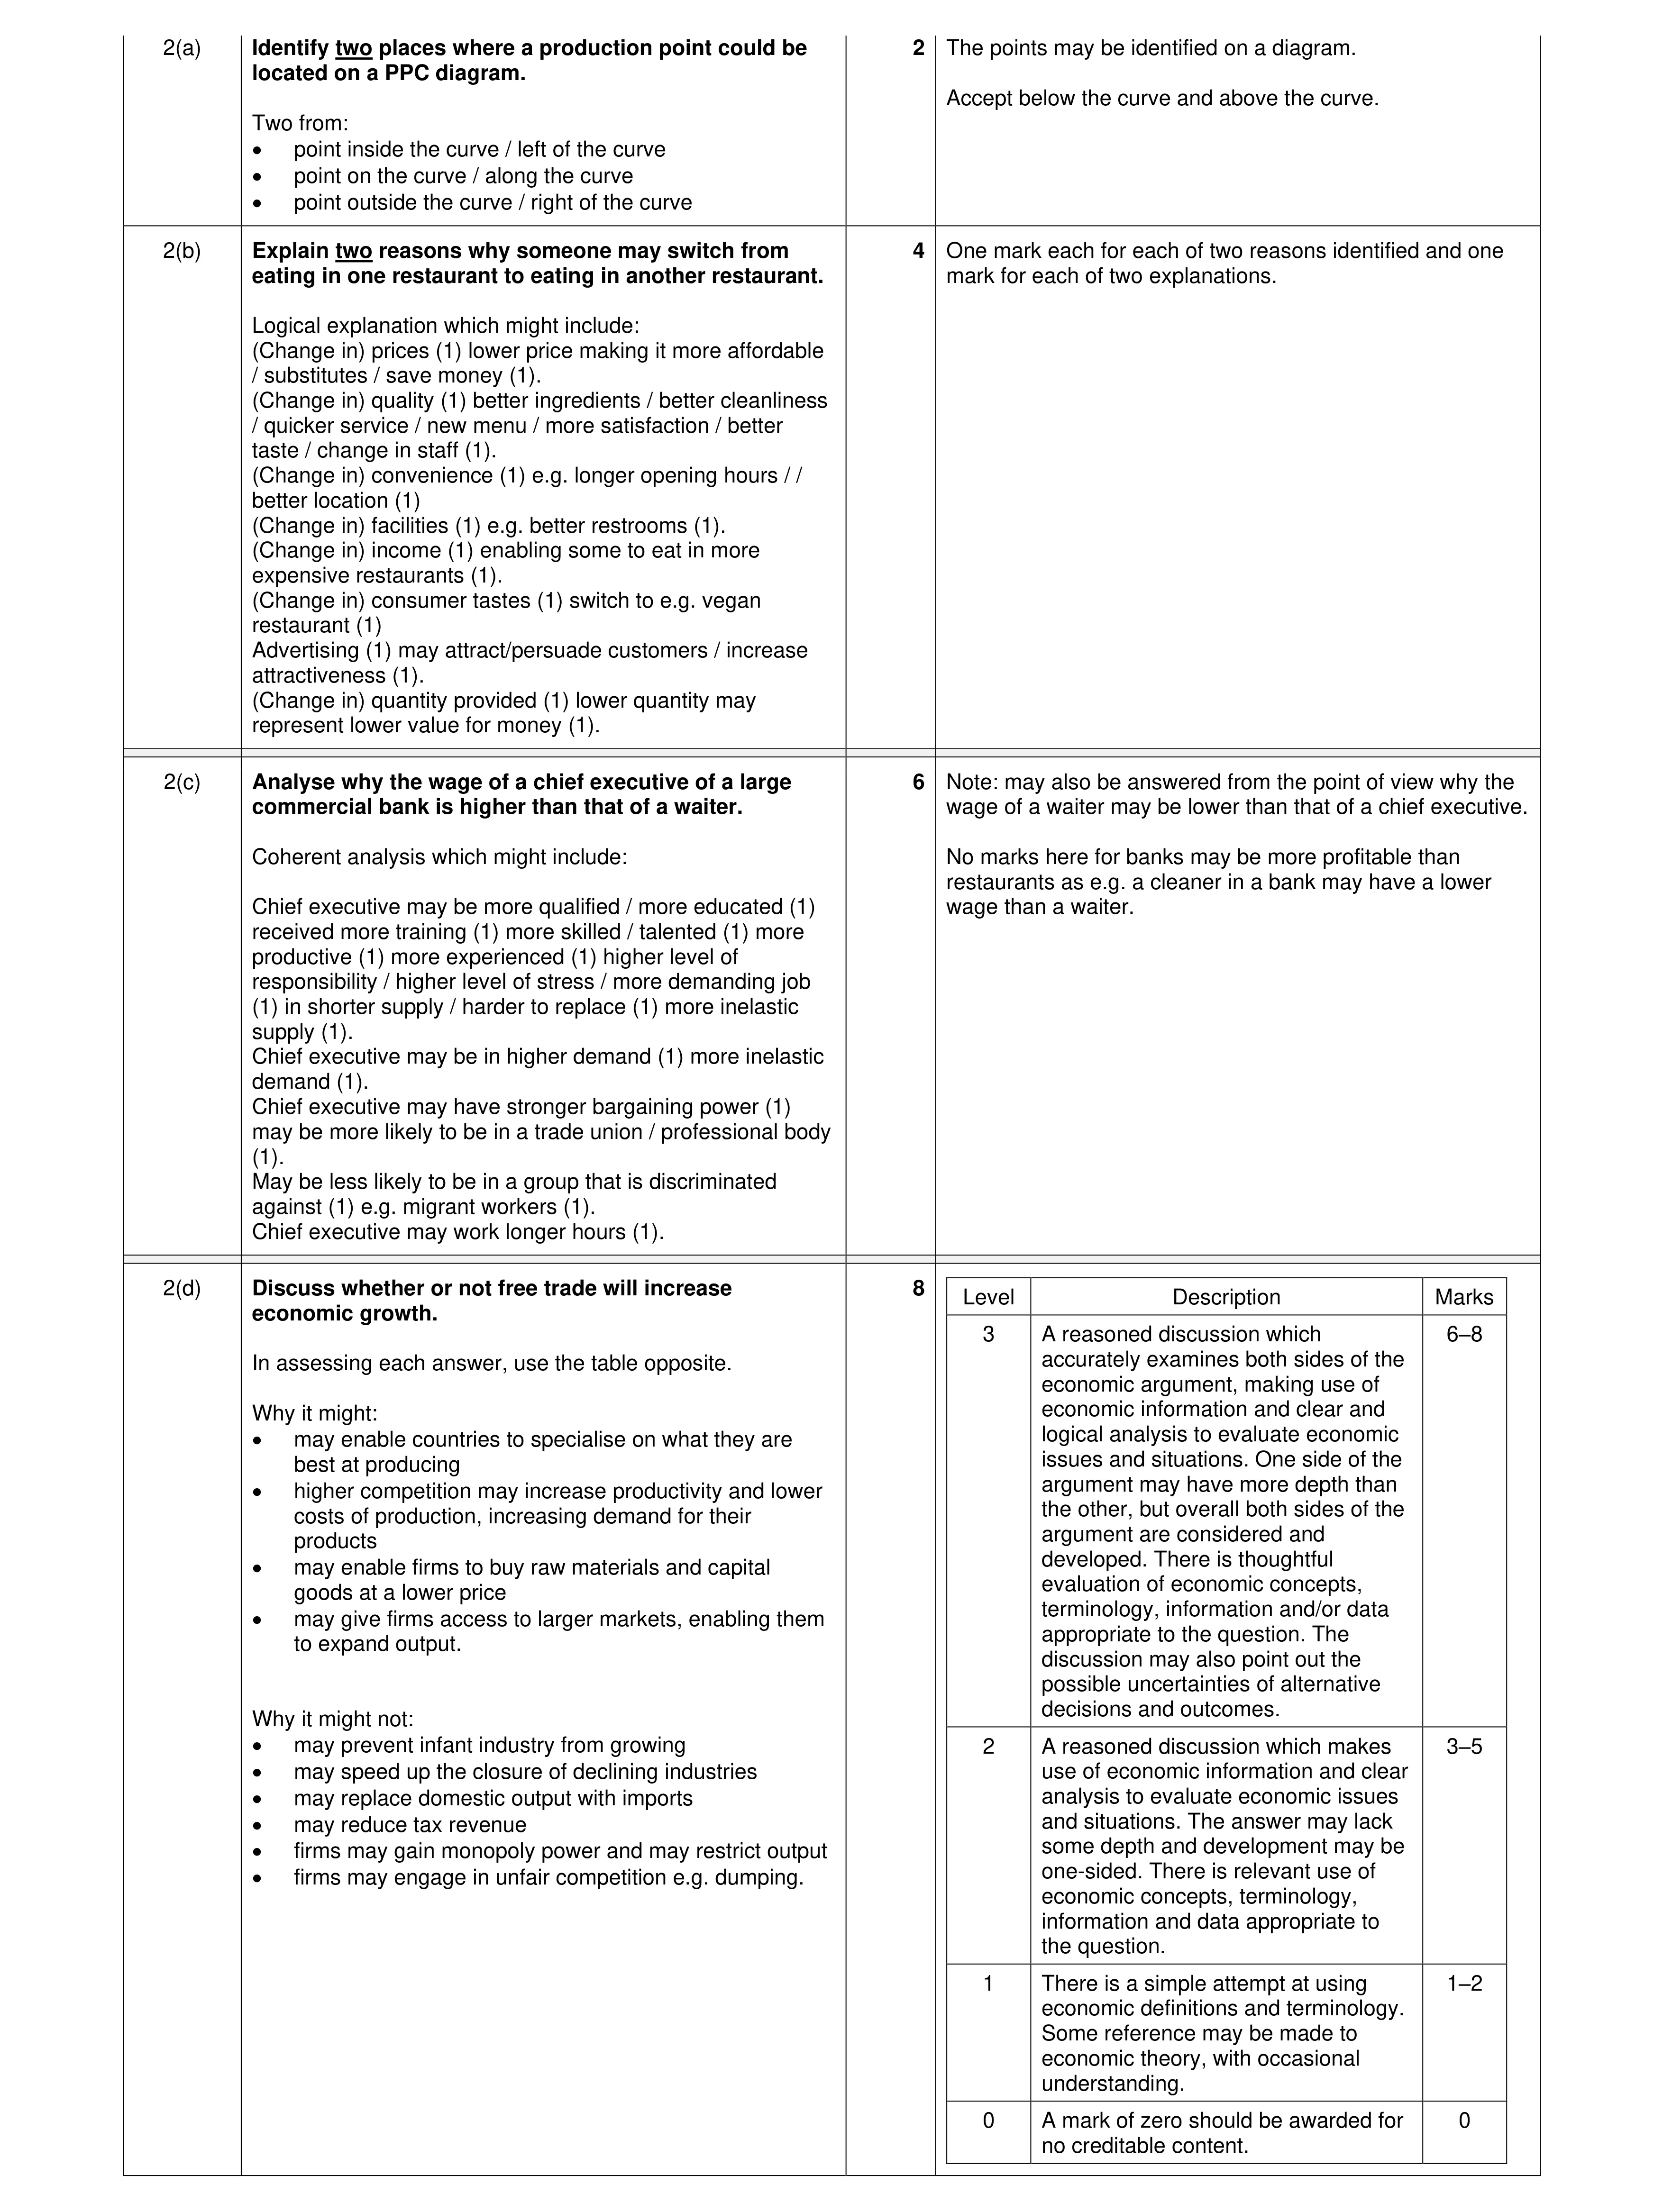 20
20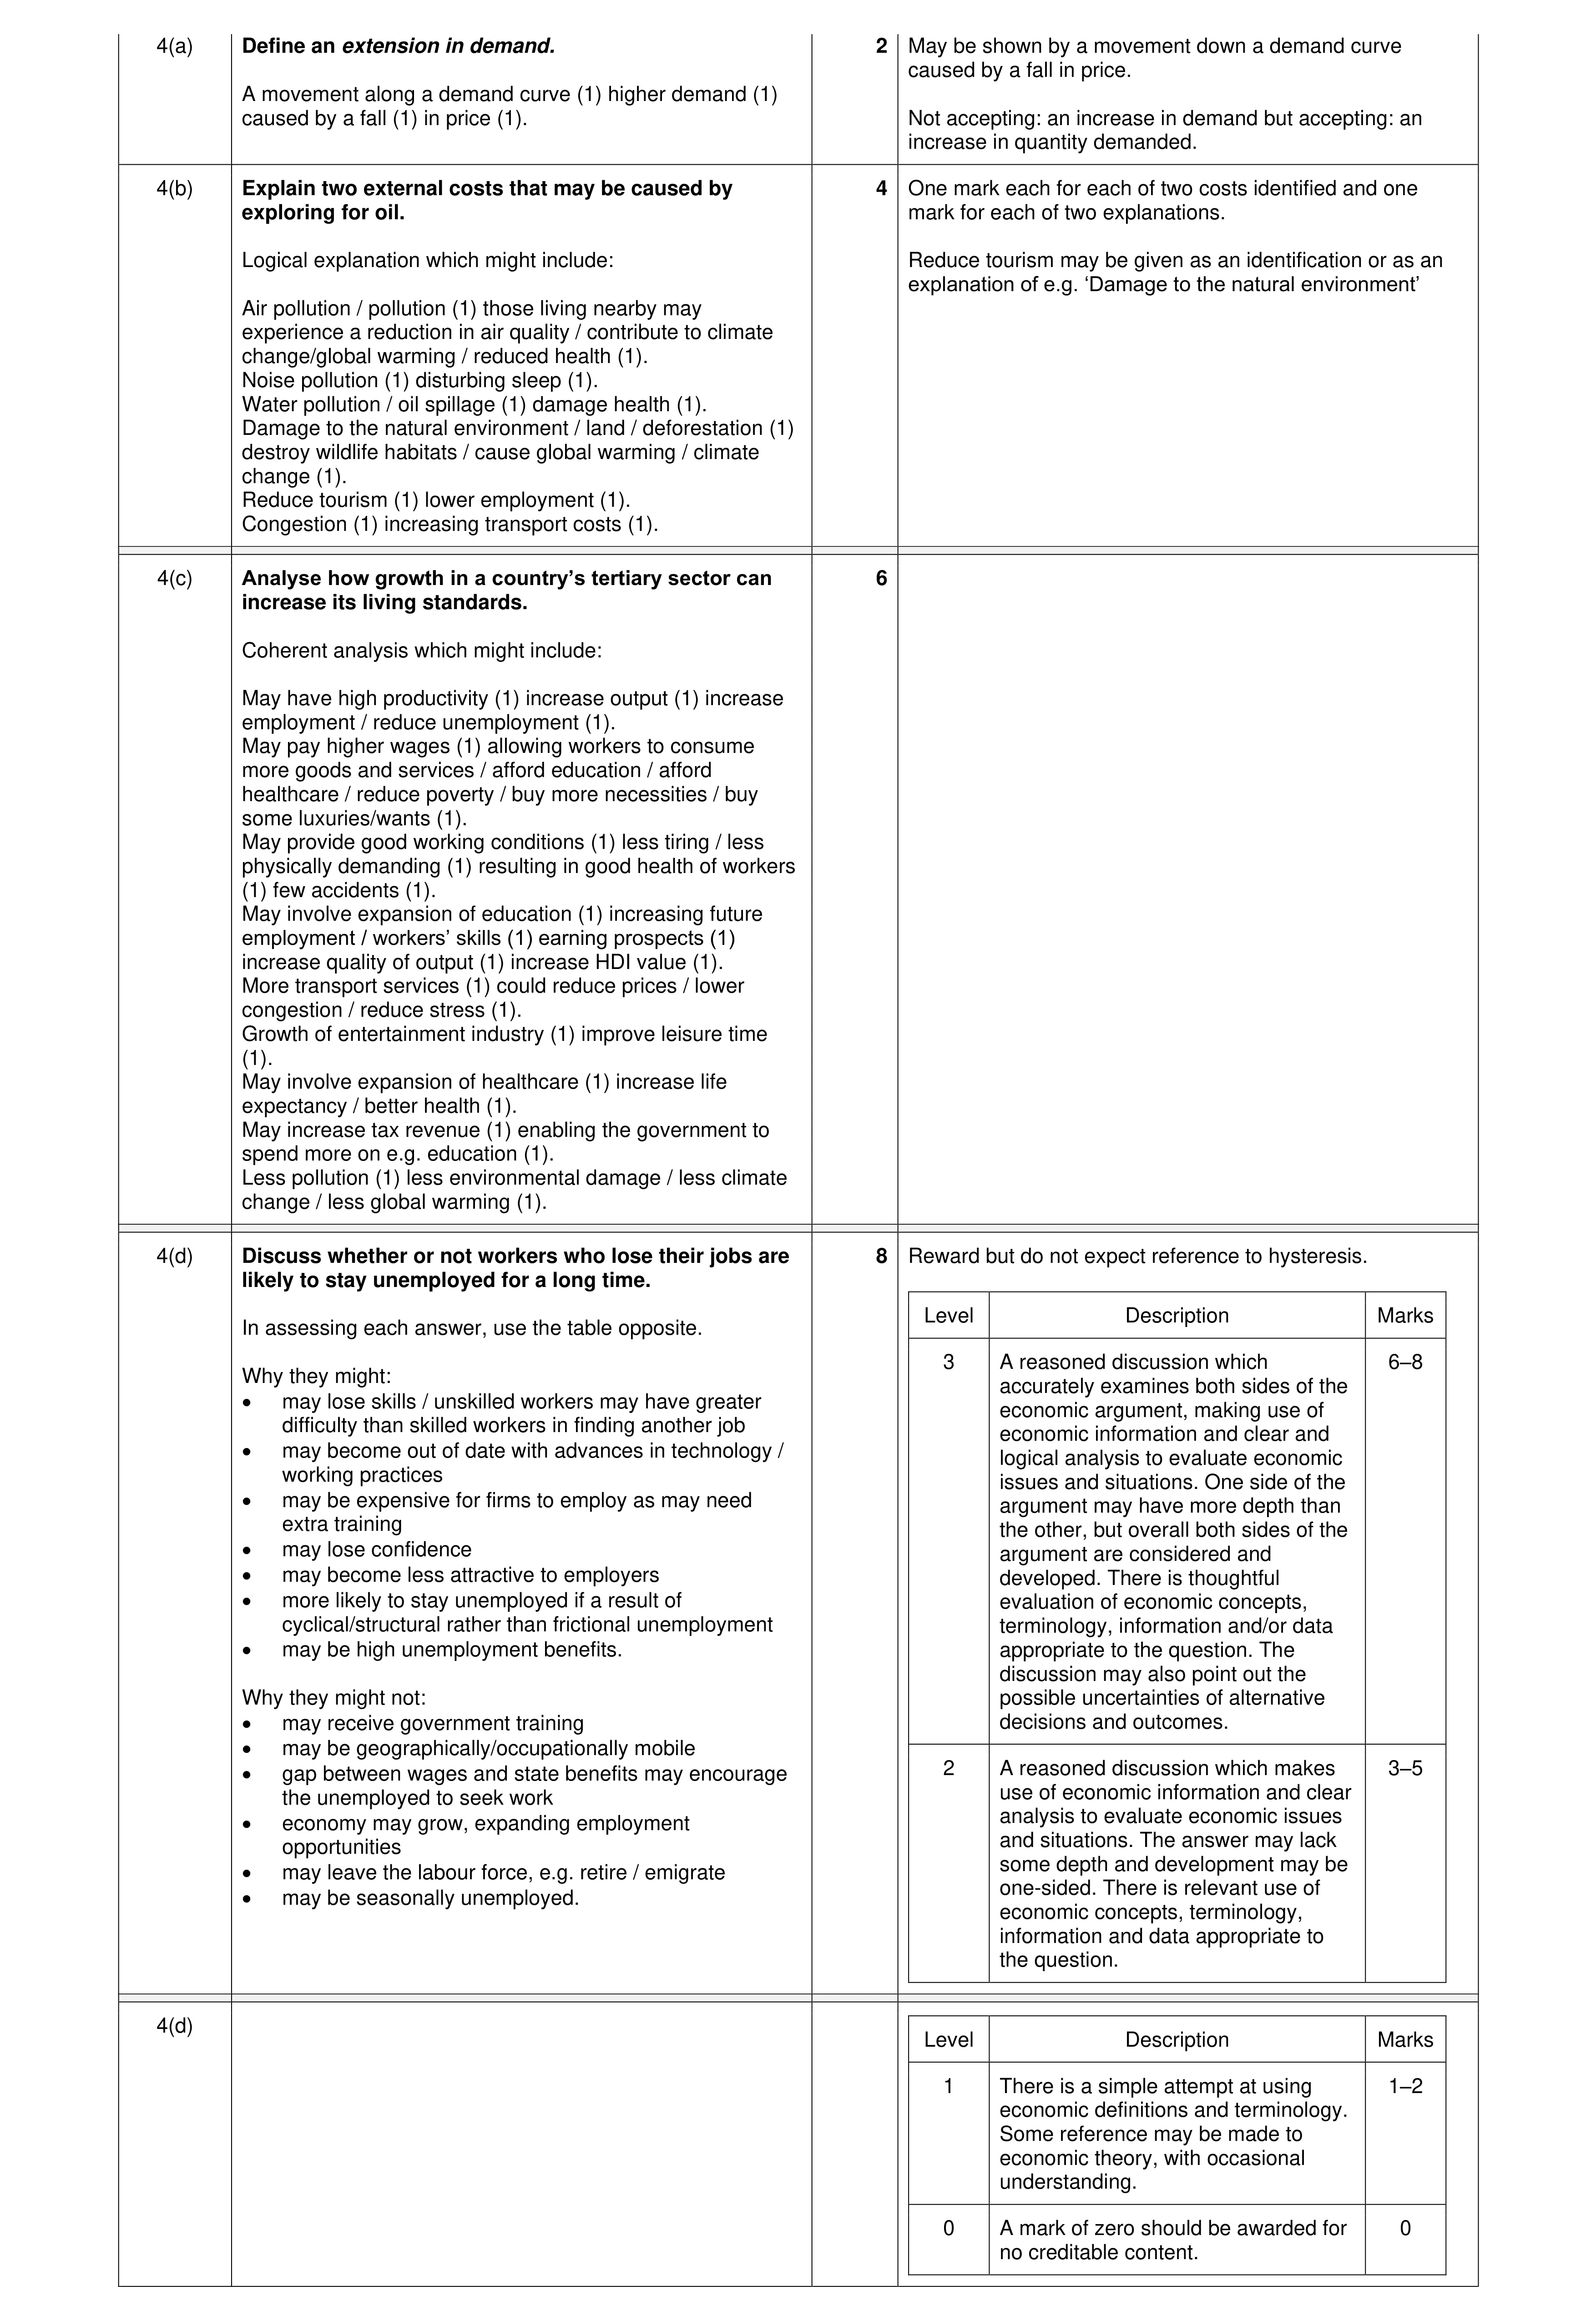 20
20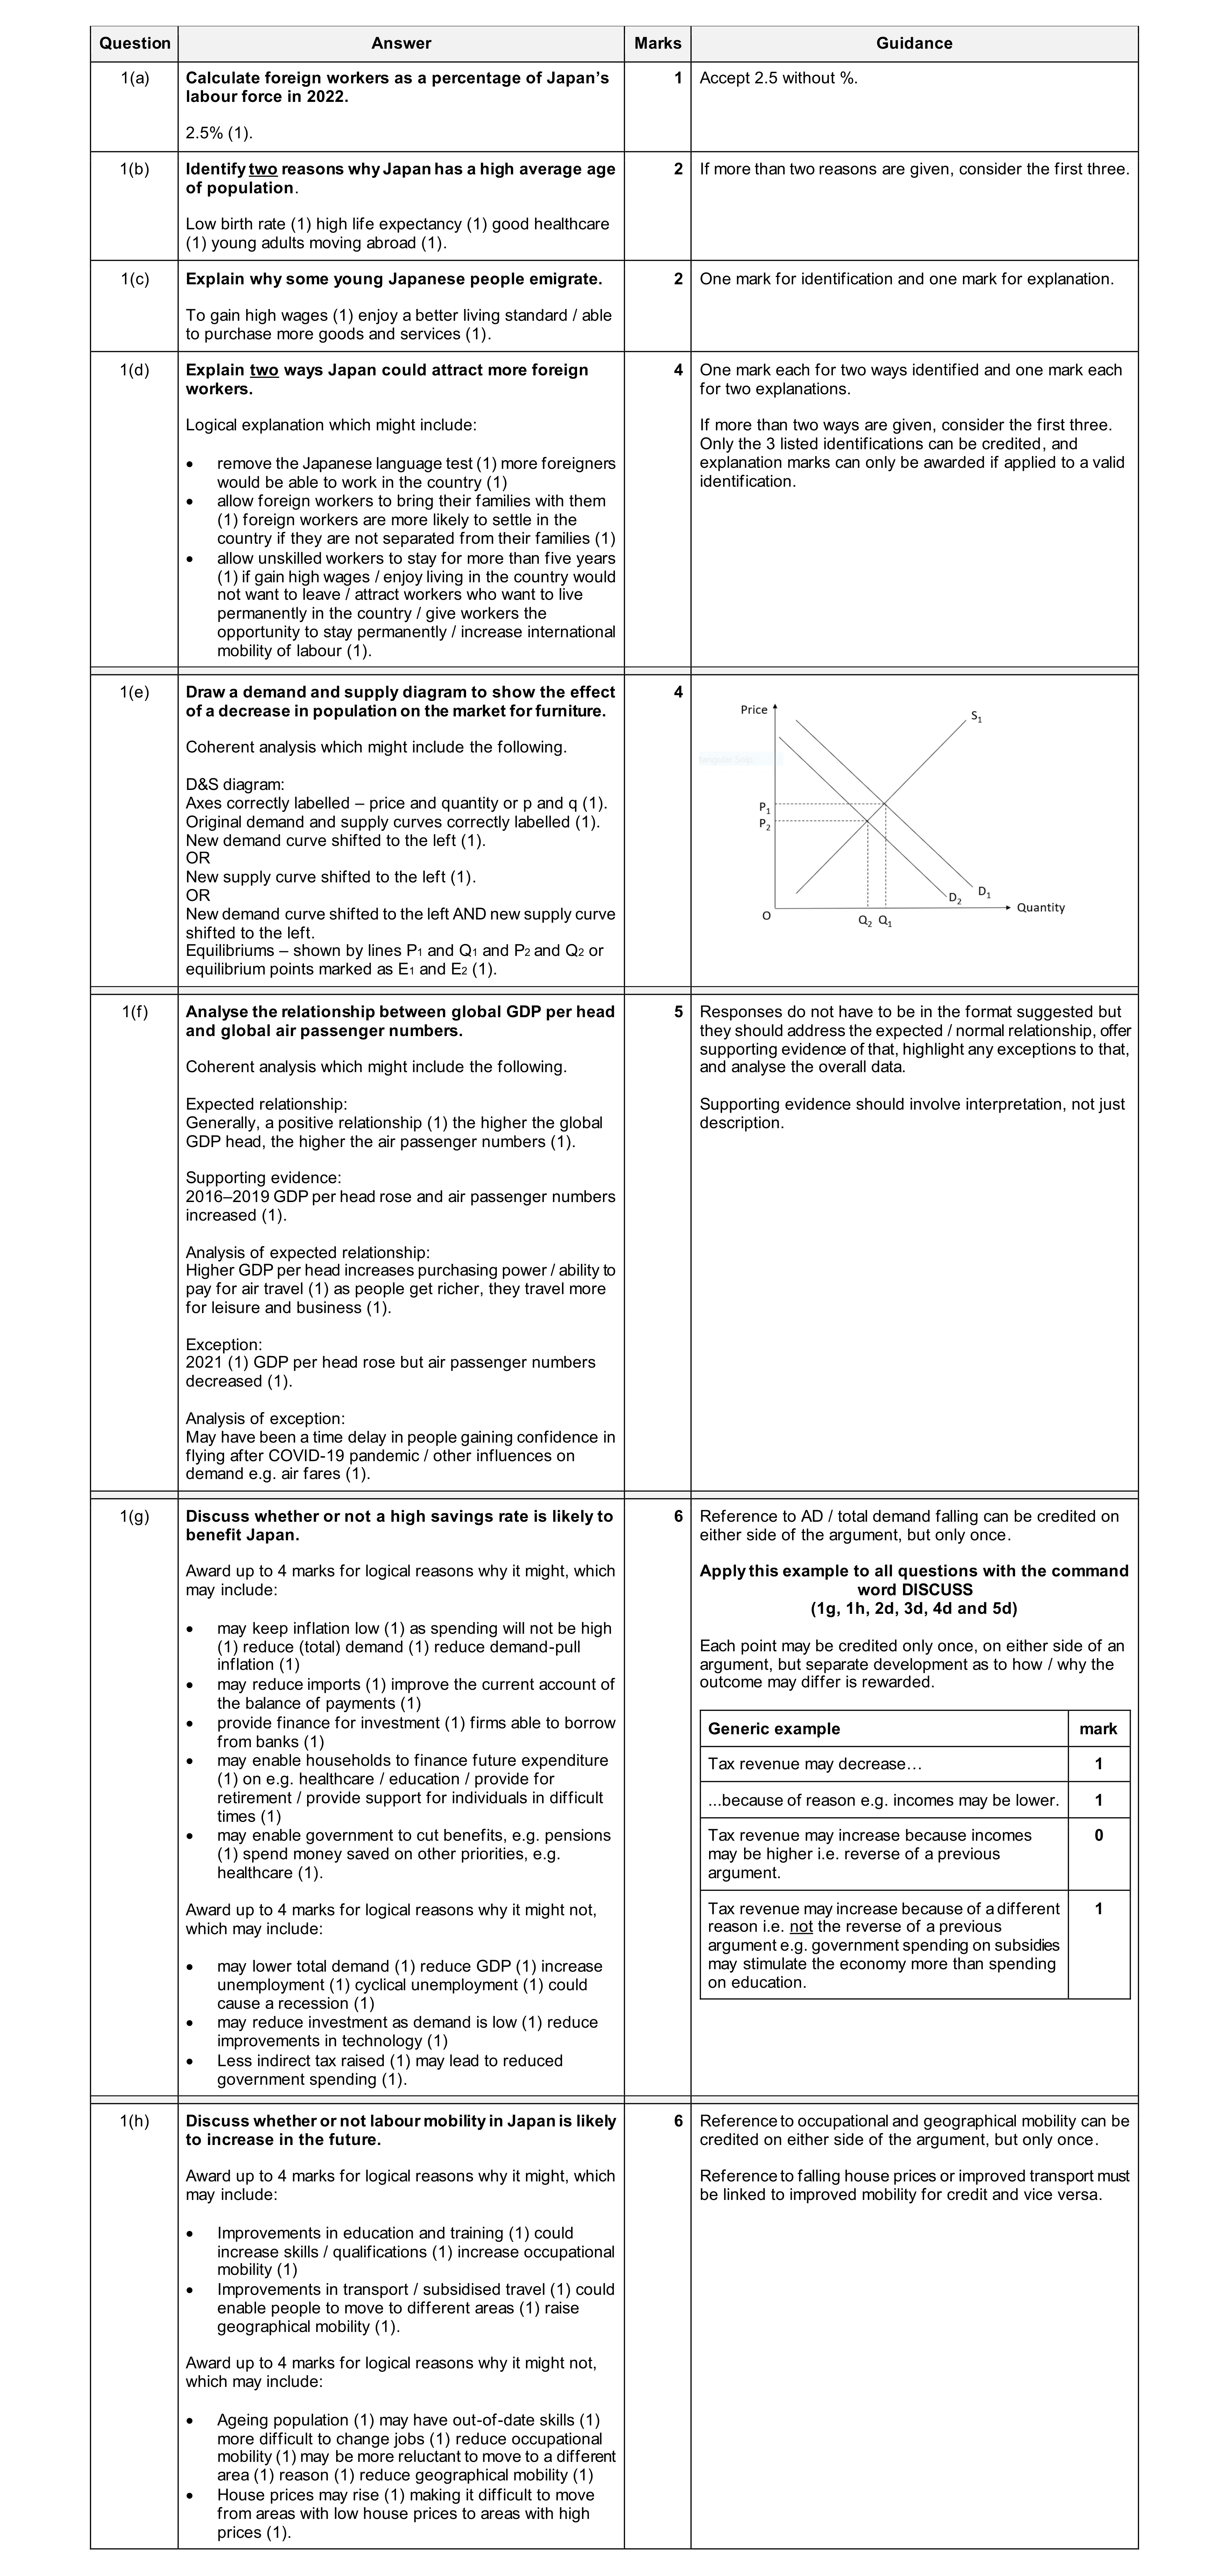 30
30