Cambridge IGCSE Economics 0455 — 2013 Oct/Nov Paper 3 · Variant 2
0455/32/O/N/13 · 2 questions · 40 marks · ≈45 min
The question paper and its mark scheme, free to read here and free to download. This is Cambridge’s own paper, exactly as it was sat.
Question paper8 pages
Mark scheme5 pages
Answers below. Sit the paper first if you are practising.
Questions as text
Q1 · Using information from the extract, calculate the percentage change in the price of…
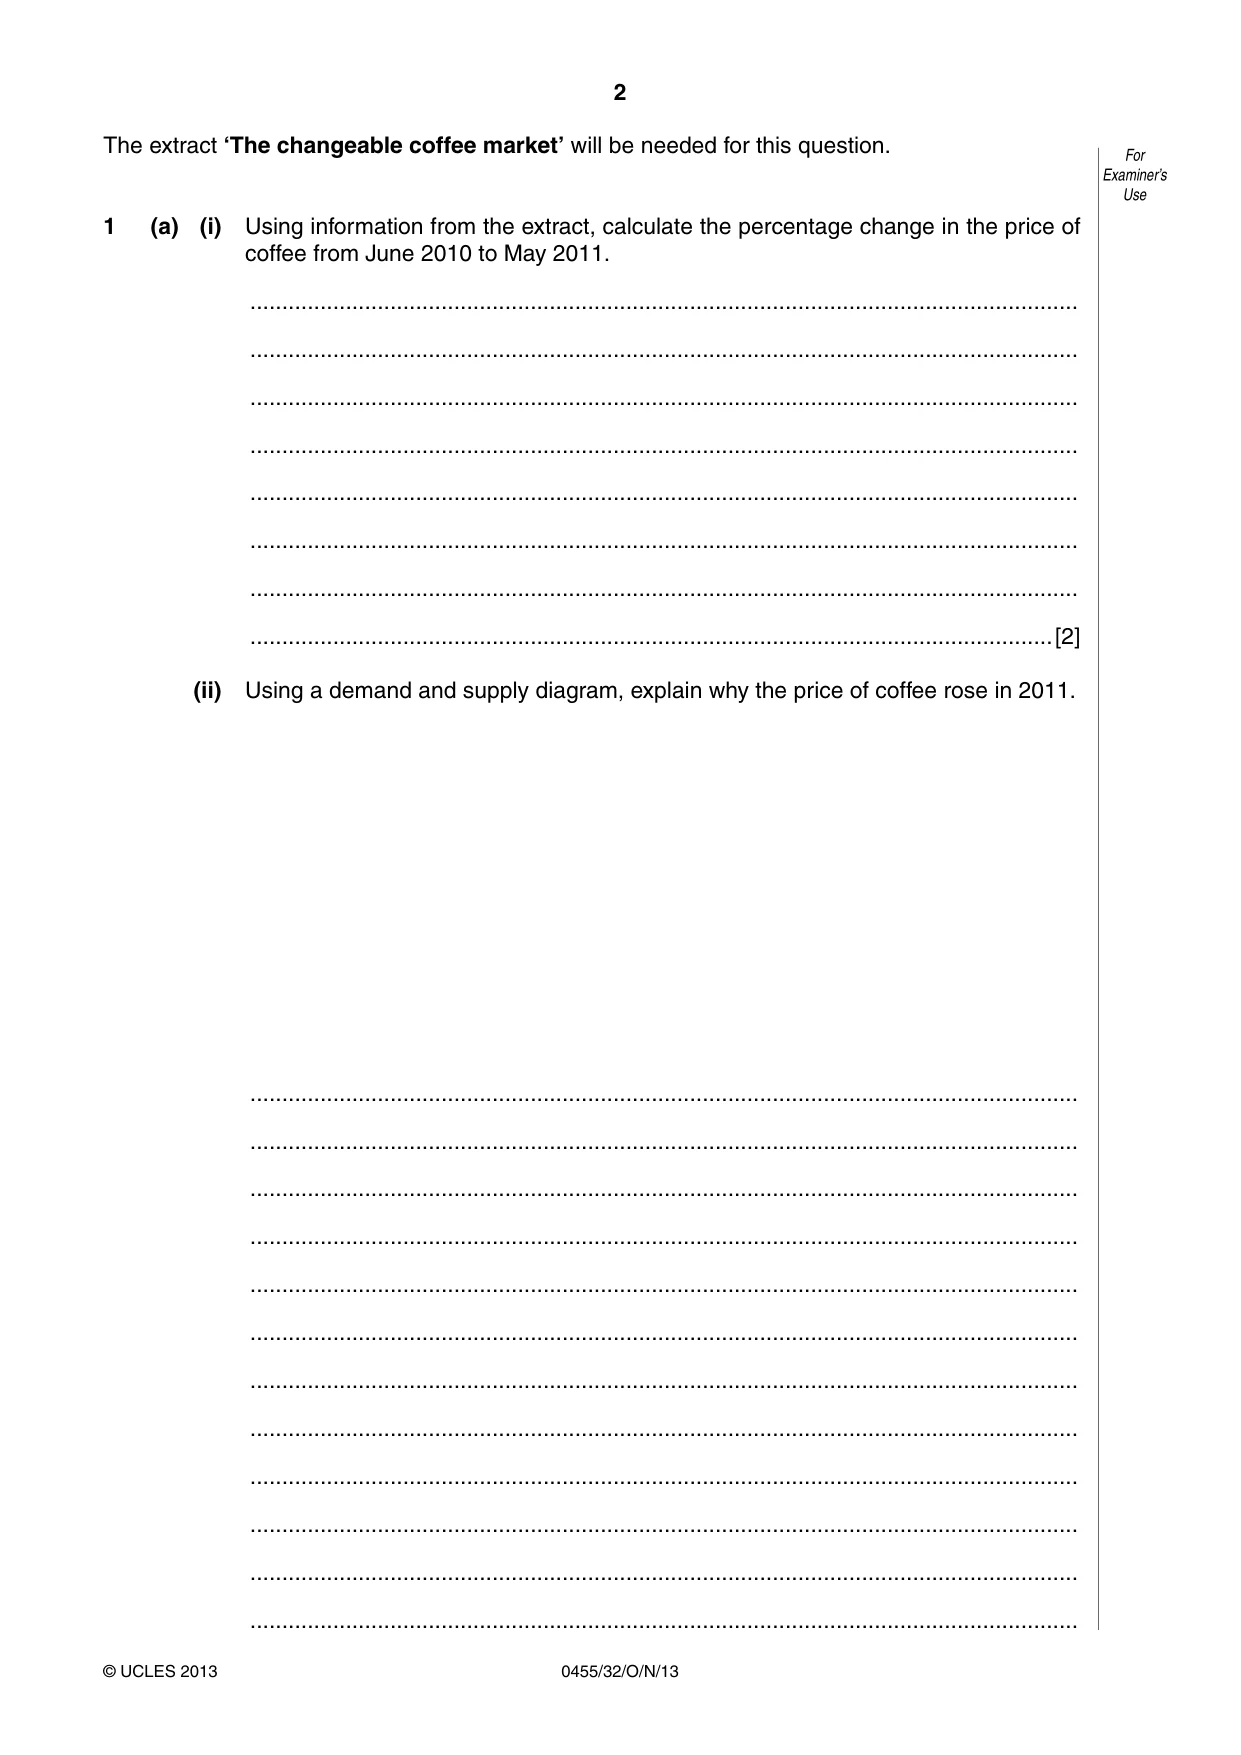
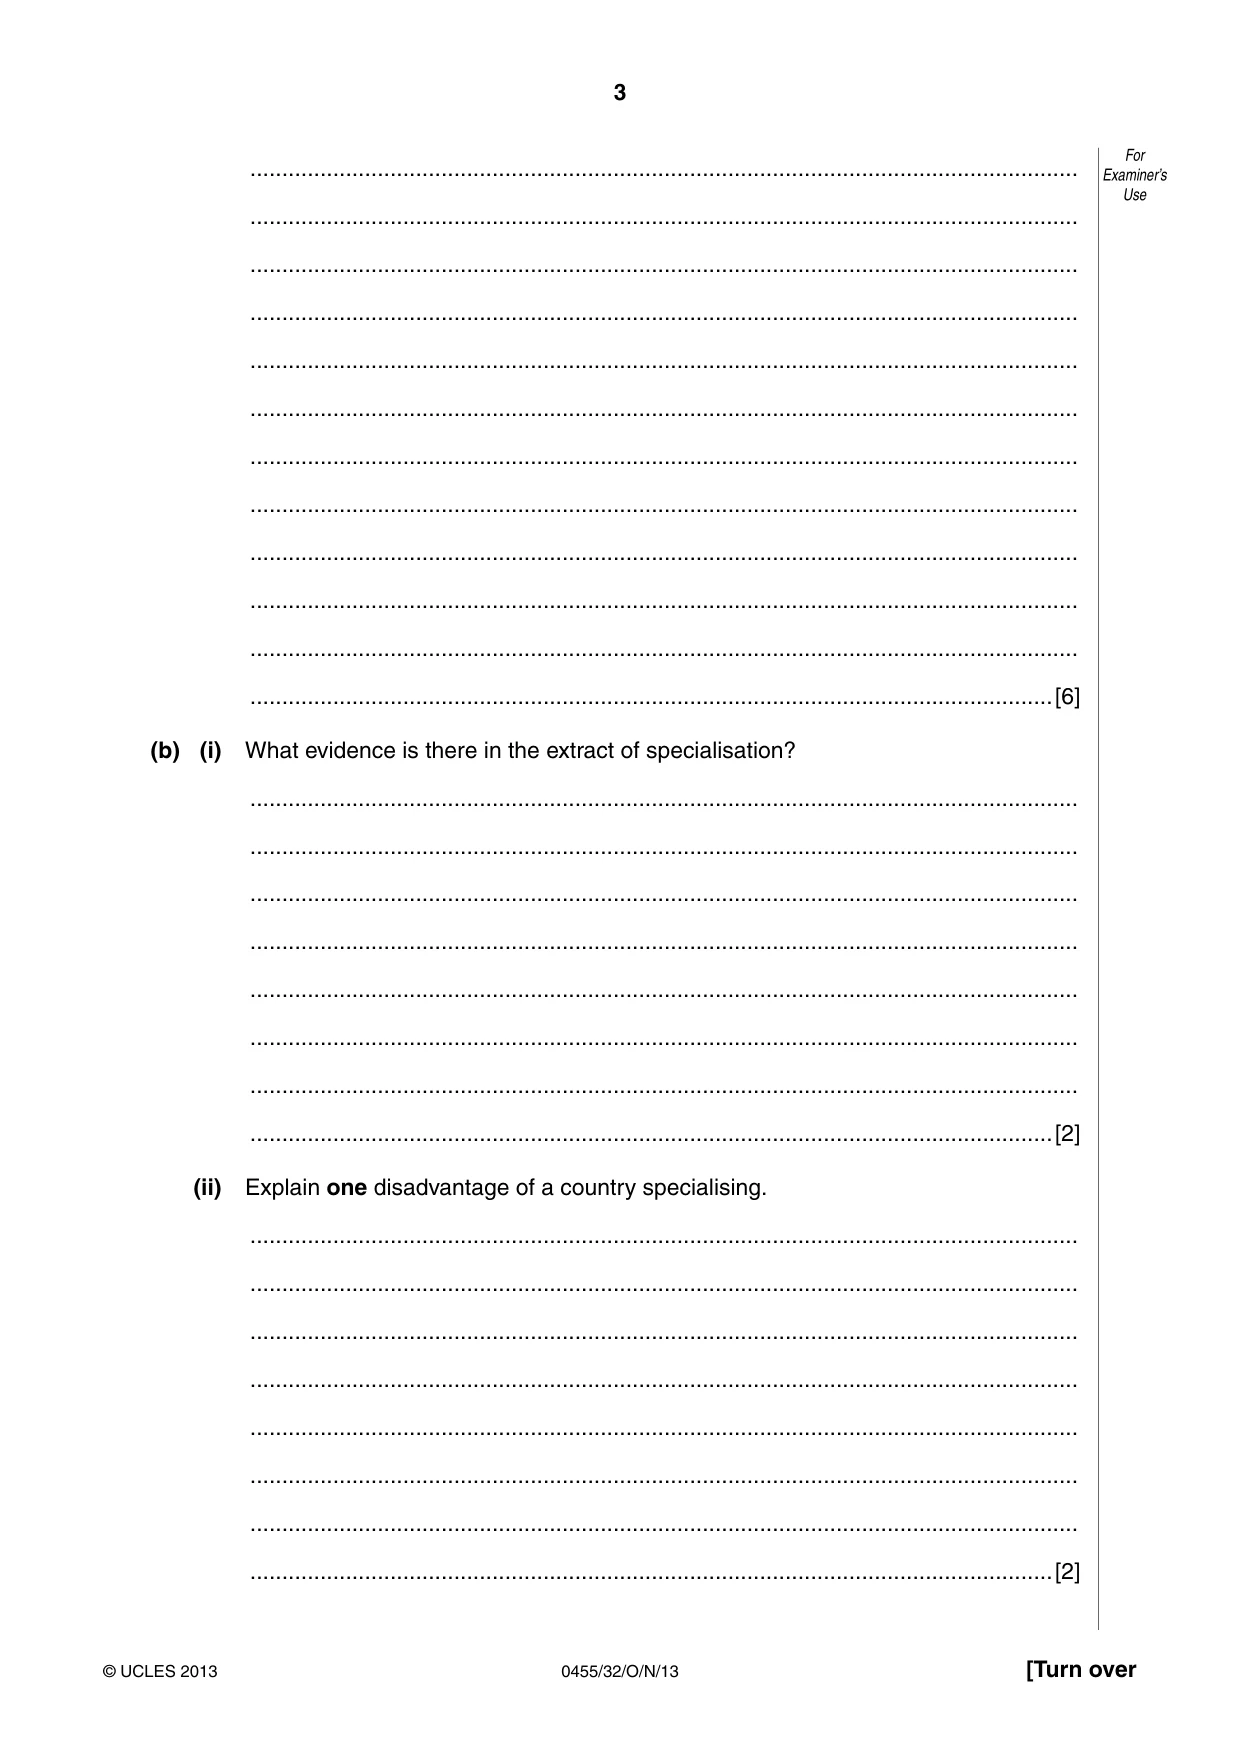
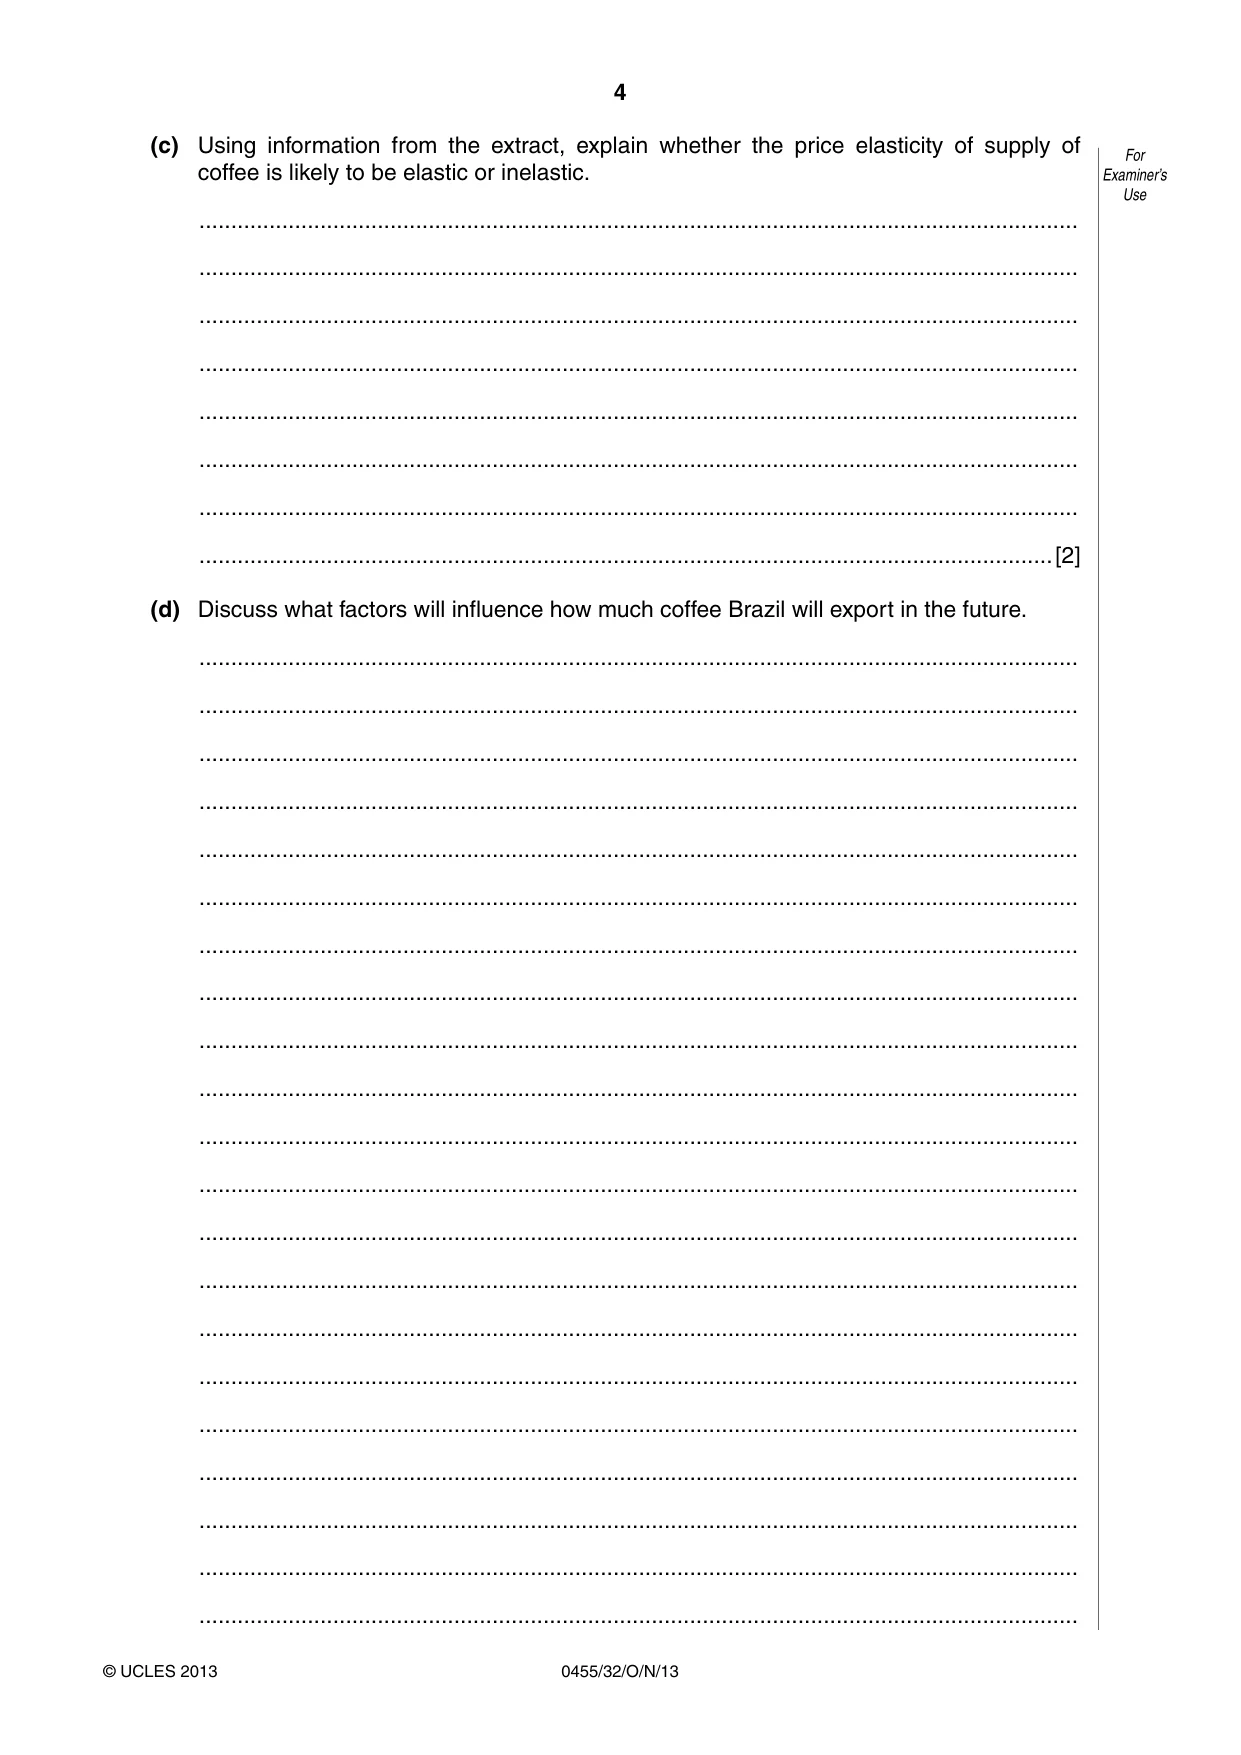
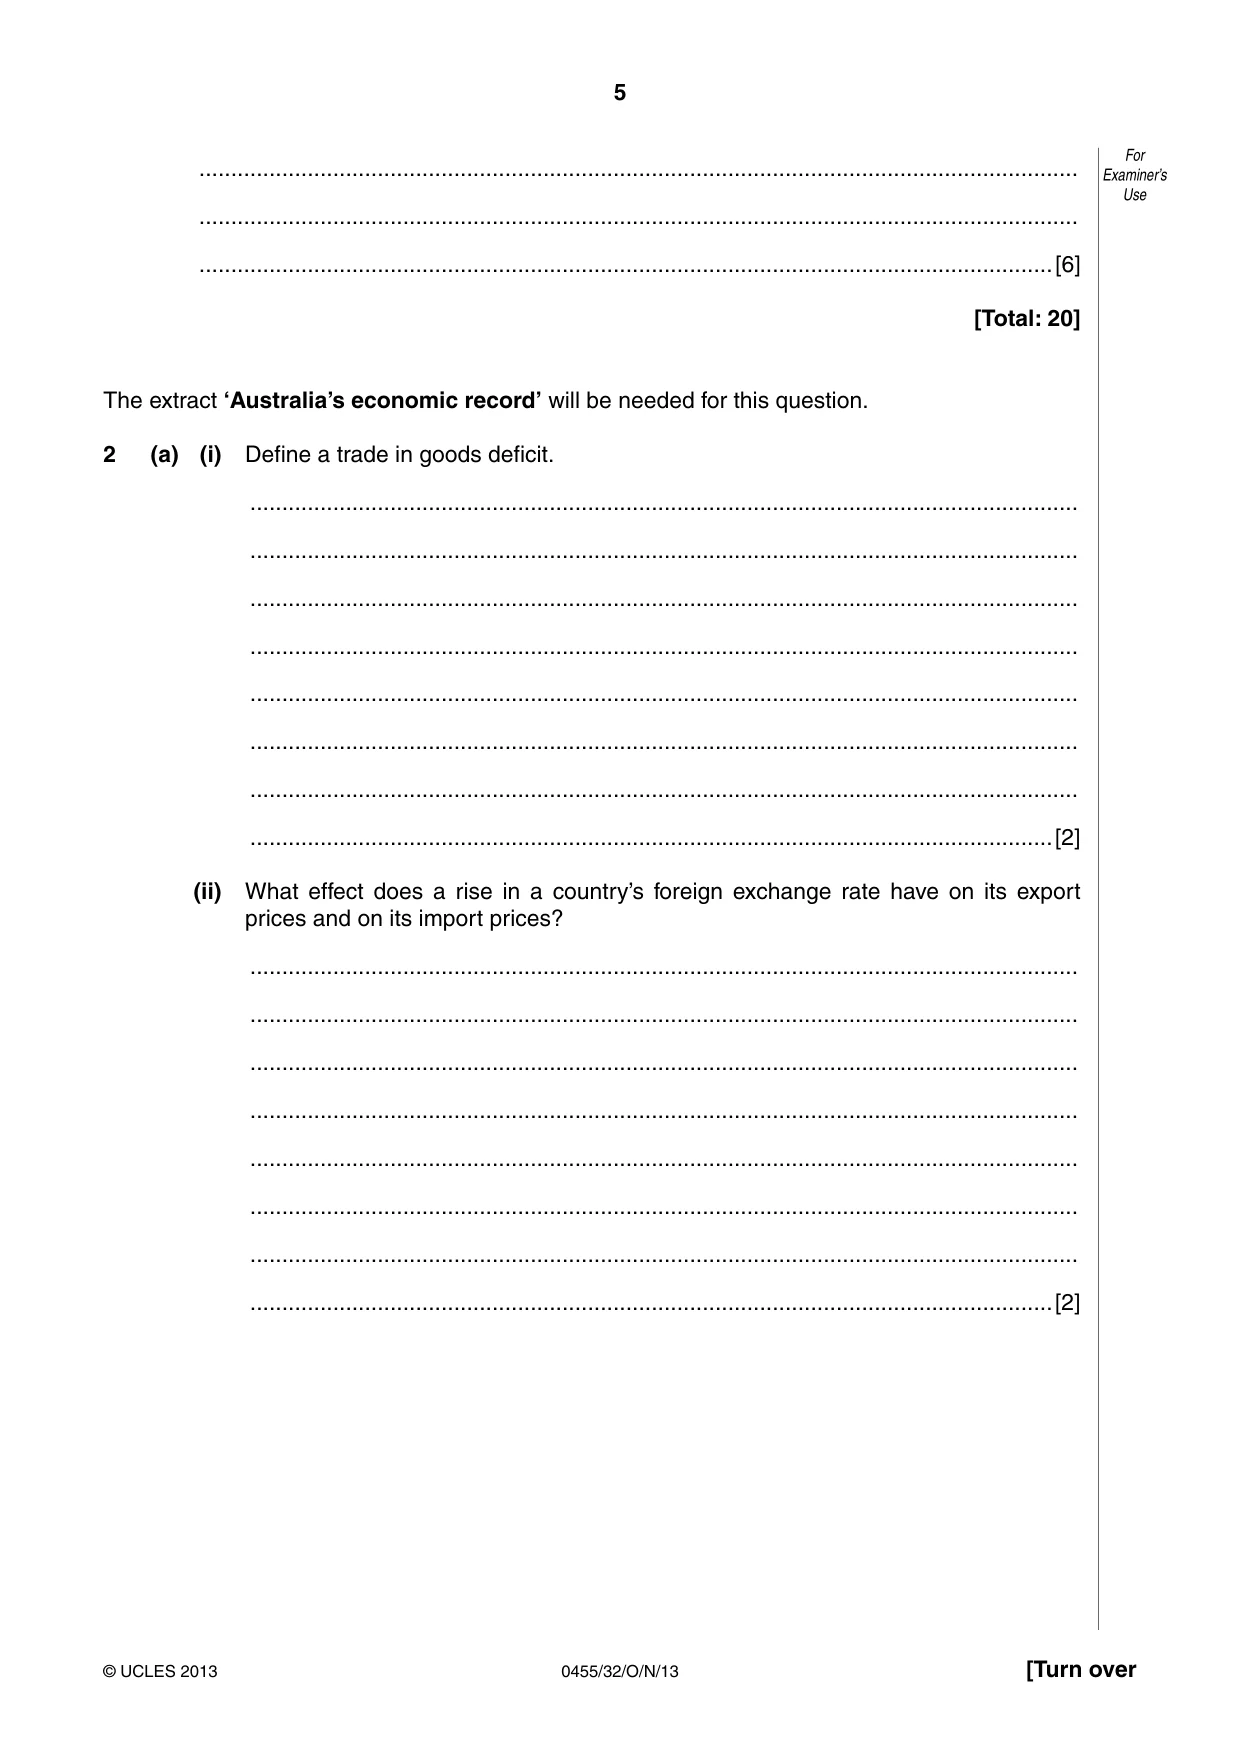
1 (a) (i) Using information from the extract, calculate the percentage change in the price of coffee from June 2010 to May 2011. .................................................................................................................................. .................................................................................................................................. .................................................................................................................................. .................................................................................................................................. .................................................................................................................................. .................................................................................................................................. .................................................................................................................................. ..............................................................................................................................[2] (ii) Using a demand and supply diagram, explain why the price of coffee rose in 2011. .................................................................................................................................. .................................................................................................................................. .................................................................................................................................. .................................................................................................................................. .................................................................................................................................. .................................................................................................................................. .................................................................................................................................. .................................................................................................................................. .................................................................................................................................. .................................................................................................................................. .................................................................................................................................. .................................................................................................................................. .................................................................................................................................. .................................................................................................................................. .................................................................................................................................. .................................................................................................................................. .................................................................................................................................. .................................................................................................................................. .................................................................................................................................. .................................................................................................................................. .................................................................................................................................. .................................................................................................................................. .................................................................................................................................. ..............................................................................................................................[6] (b) (i) What evidence is there in the extract of specialisation? .................................................................................................................................. .................................................................................................................................. .................................................................................................................................. .................................................................................................................................. .................................................................................................................................. .................................................................................................................................. .................................................................................................................................. ..............................................................................................................................[2] (ii) Explain one disadvantage of a country specialising. .................................................................................................................................. .................................................................................................................................. .................................................................................................................................. .................................................................................................................................. .................................................................................................................................. .................................................................................................................................. .................................................................................................................................. ..............................................................................................................................[2] (c) Using information from the extract, explain whether the price elasticity of supply of coffee is likely to be elastic or inelastic. .......................................................................................................................................... .......................................................................................................................................... .......................................................................................................................................... .......................................................................................................................................... .......................................................................................................................................... .......................................................................................................................................... .......................................................................................................................................... ......................................................................................................................................[2] (d) Discuss what factors will influence how much coffee Brazil will export in the future. .......................................................................................................................................... .......................................................................................................................................... .......................................................................................................................................... .......................................................................................................................................... .......................................................................................................................................... .......................................................................................................................................... .......................................................................................................................................... .......................................................................................................................................... .......................................................................................................................................... .......................................................................................................................................... .......................................................................................................................................... .......................................................................................................................................... .......................................................................................................................................... .......................................................................................................................................... .......................................................................................................................................... .......................................................................................................................................... .......................................................................................................................................... .......................................................................................................................................... .......................................................................................................................................... .......................................................................................................................................... .......................................................................................................................................... .......................................................................................................................................... .......................................................................................................................................... ......................................................................................................................................[6] [Total: 20] The extract ‘Australia’s economic record’ will be needed for this question.
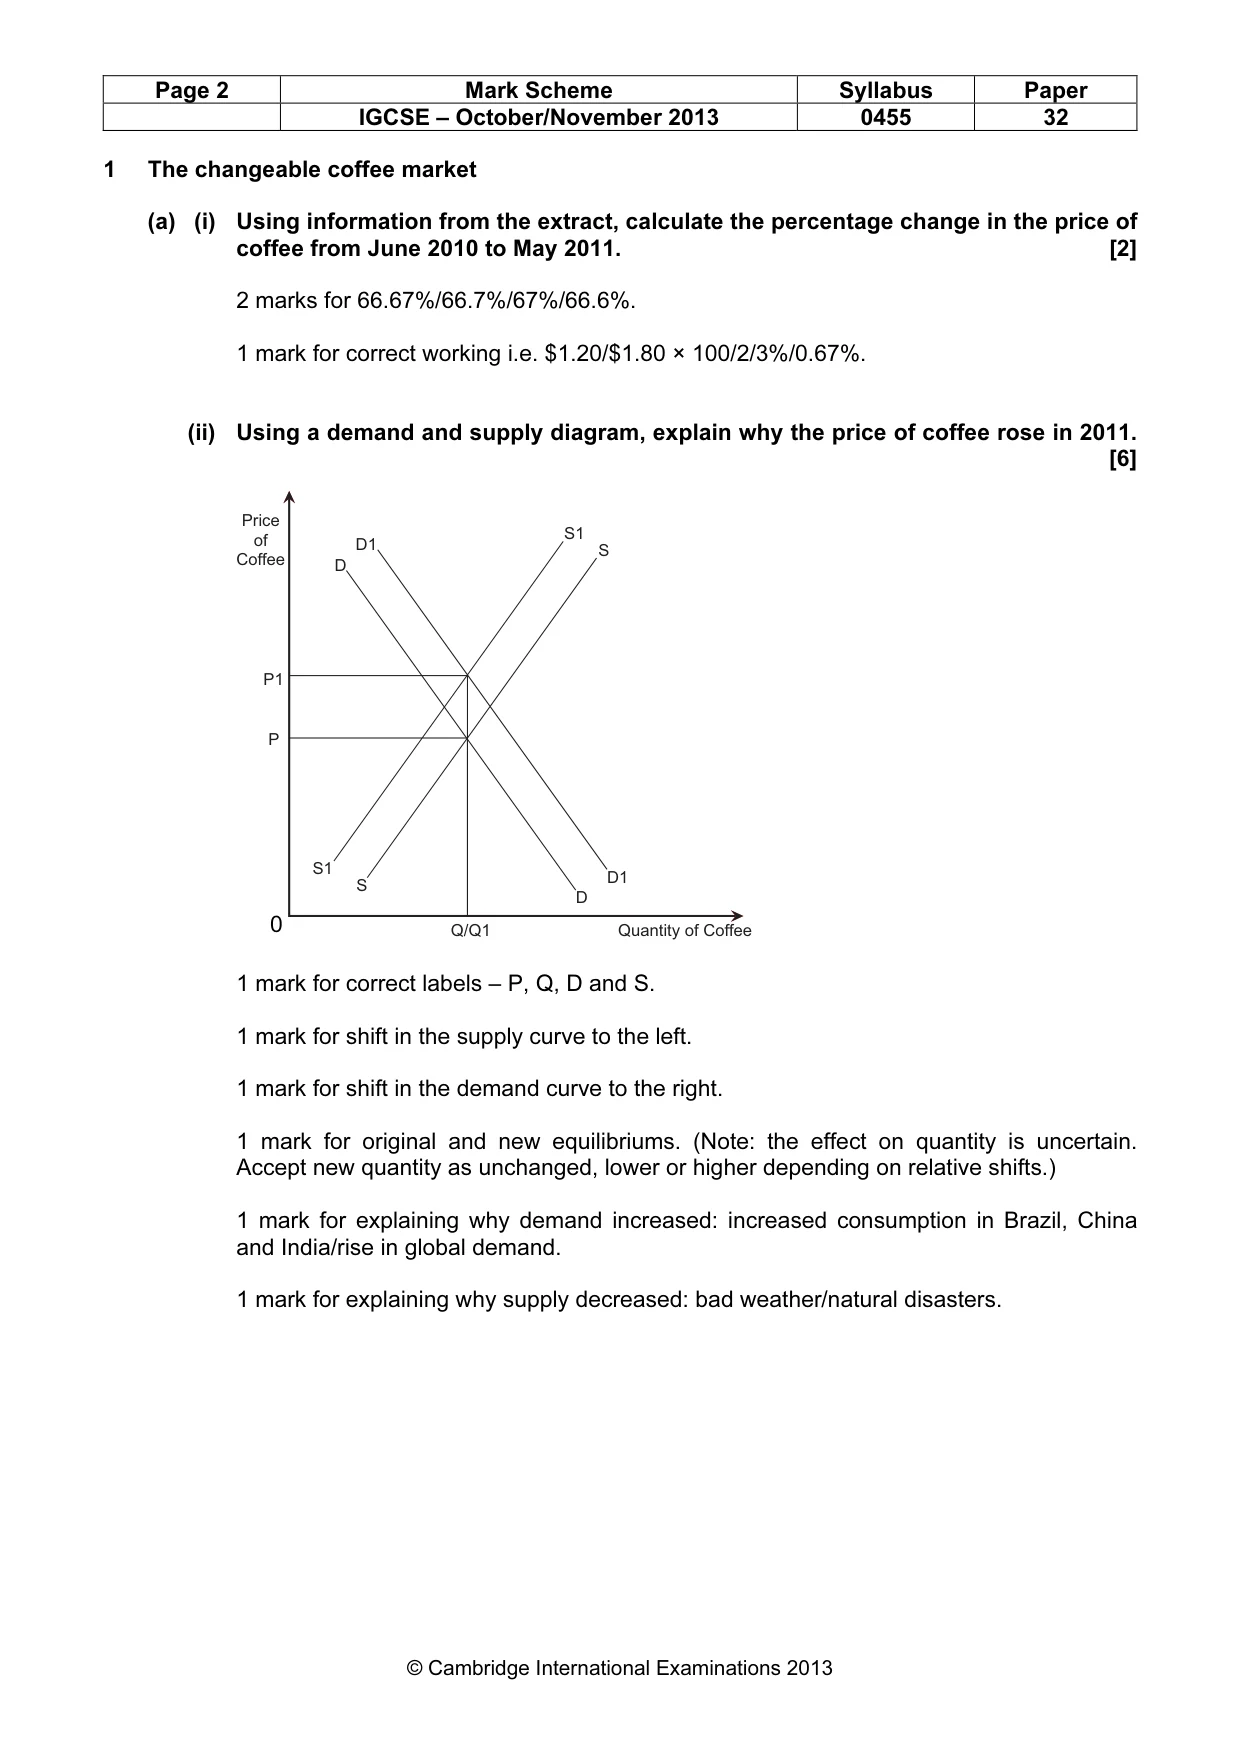
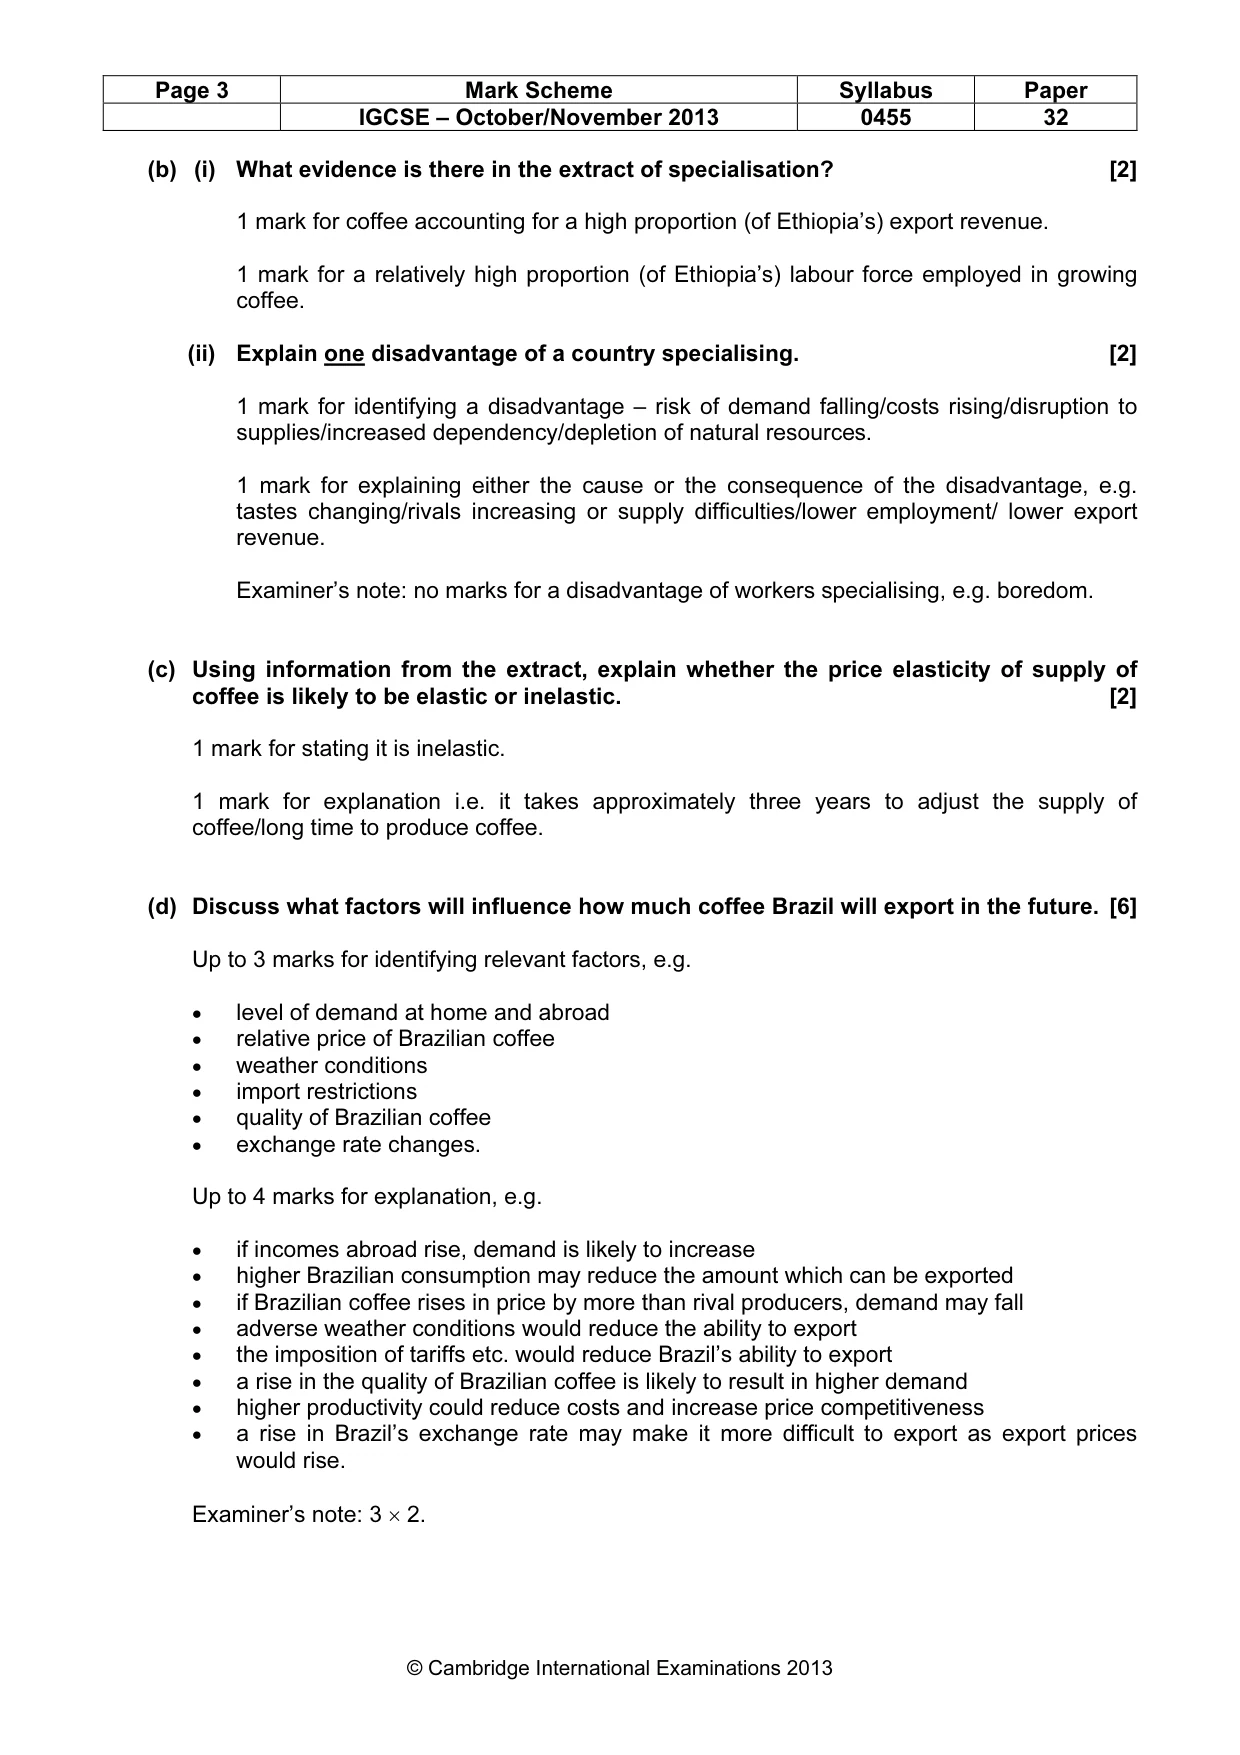
Mark scheme: 1 The changeable coffee market (a) (i) Using information from the extract, calculate the percentage change in the price of coffee from June 2010 to May 2011. [2] 2 marks for 66.67%/66.7%/67%/66.6%. 1 mark for correct working i.e. $1.20/$1.80 × 100/2/3%/0.67%. (ii) Using a demand and supply diagram, explain why the price of coffee rose in 2011. [6] Price of D1 S1 S Coffee D P1 P S1 D1 S D 0 Q/Q1 Quantity of Coffee 1 mark for correct labels – P, Q, D and S. 1 mark for shift in the supply curve to the left. 1 mark for shift in the demand curve to the right. 1 mark for original and new equilibriums. (Note: the effect on quantity is uncertain. Accept new quantity as unchanged, lower or higher depending on relative shifts.) 1 mark for explaining why demand increased: increased consumption in Brazil, China and India/rise in global demand. 1 mark for explaining why supply decreased: bad weather/natural disasters. IGCSE – October/November 2013 0455 32 (b) (i) What evidence is there in the extract of specialisation? [2] 1 mark for coffee accounting for a high proportion (of Ethiopia’s) export revenue. 1 mark for a relatively high proportion (of Ethiopia’s) labour force employed in growing coffee. (ii) Explain one disadvantage of a country specialising. [2] 1 mark for identifying a disadvantage – risk of demand falling/costs rising/disruption to supplies/increased dependency/depletion of natural resources. 1 mark for explaining either the cause or the consequence of the disadvantage, e.g. tastes changing/rivals increasing or supply difficulties/lower employment/ lower export revenue. Examiner’s note: no marks for a disadvantage of workers specialising, e.g. boredom. (c) Using information from the extract, explain whether the price elasticity of supply of coffee is likely to be elastic or inelastic. [2] 1 mark for stating it is inelastic. 1 mark for explanation i.e. it takes approximately three years to adjust the supply of coffee/long time to produce coffee. (d) Discuss what factors will influence how much coffee Brazil will export in the future. [6] Up to 3 marks for identifying relevant factors, e.g. • level of demand at home and abroad • relative price of Brazilian coffee • weather conditions • import restrictions • quality of Brazilian coffee • exchange rate changes. Up to 4 marks for explanation, e.g. • if incomes abroad rise, demand is likely to increase • higher Brazilian consumption may reduce the amount which can be exported • if Brazilian coffee rises in price by more than rival producers, demand may fall • adverse weather conditions would reduce the ability to export • the imposition of tariffs etc. would reduce Brazil’s ability to export • a rise in the quality of Brazilian coffee is likely to result in higher demand • higher productivity could reduce costs and increase price competitiveness • a rise in Brazil’s exchange rate may make it more difficult to export as export prices would rise. Examiner’s note: 3 × 2. IGCSE – October/November 2013 0455 32
Q2 · Define a trade in goods deficit
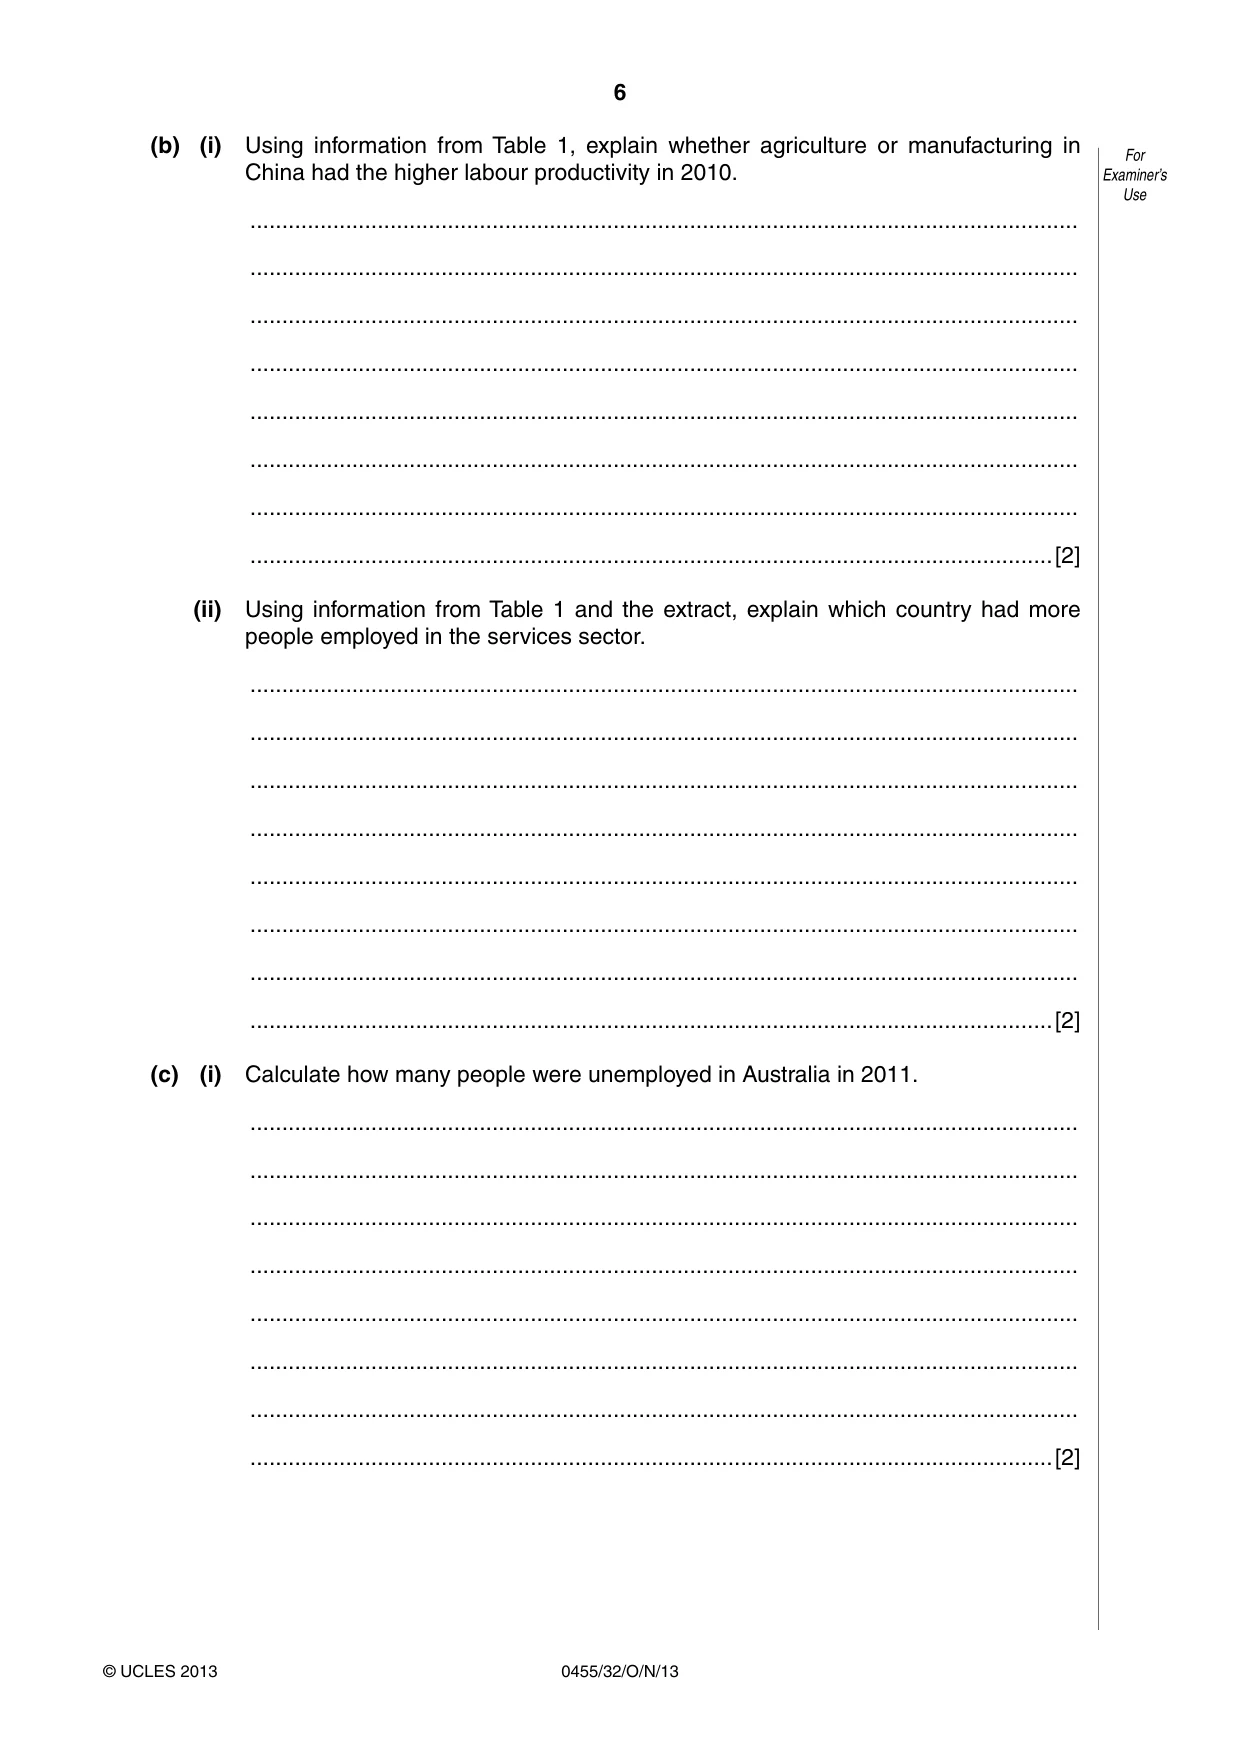
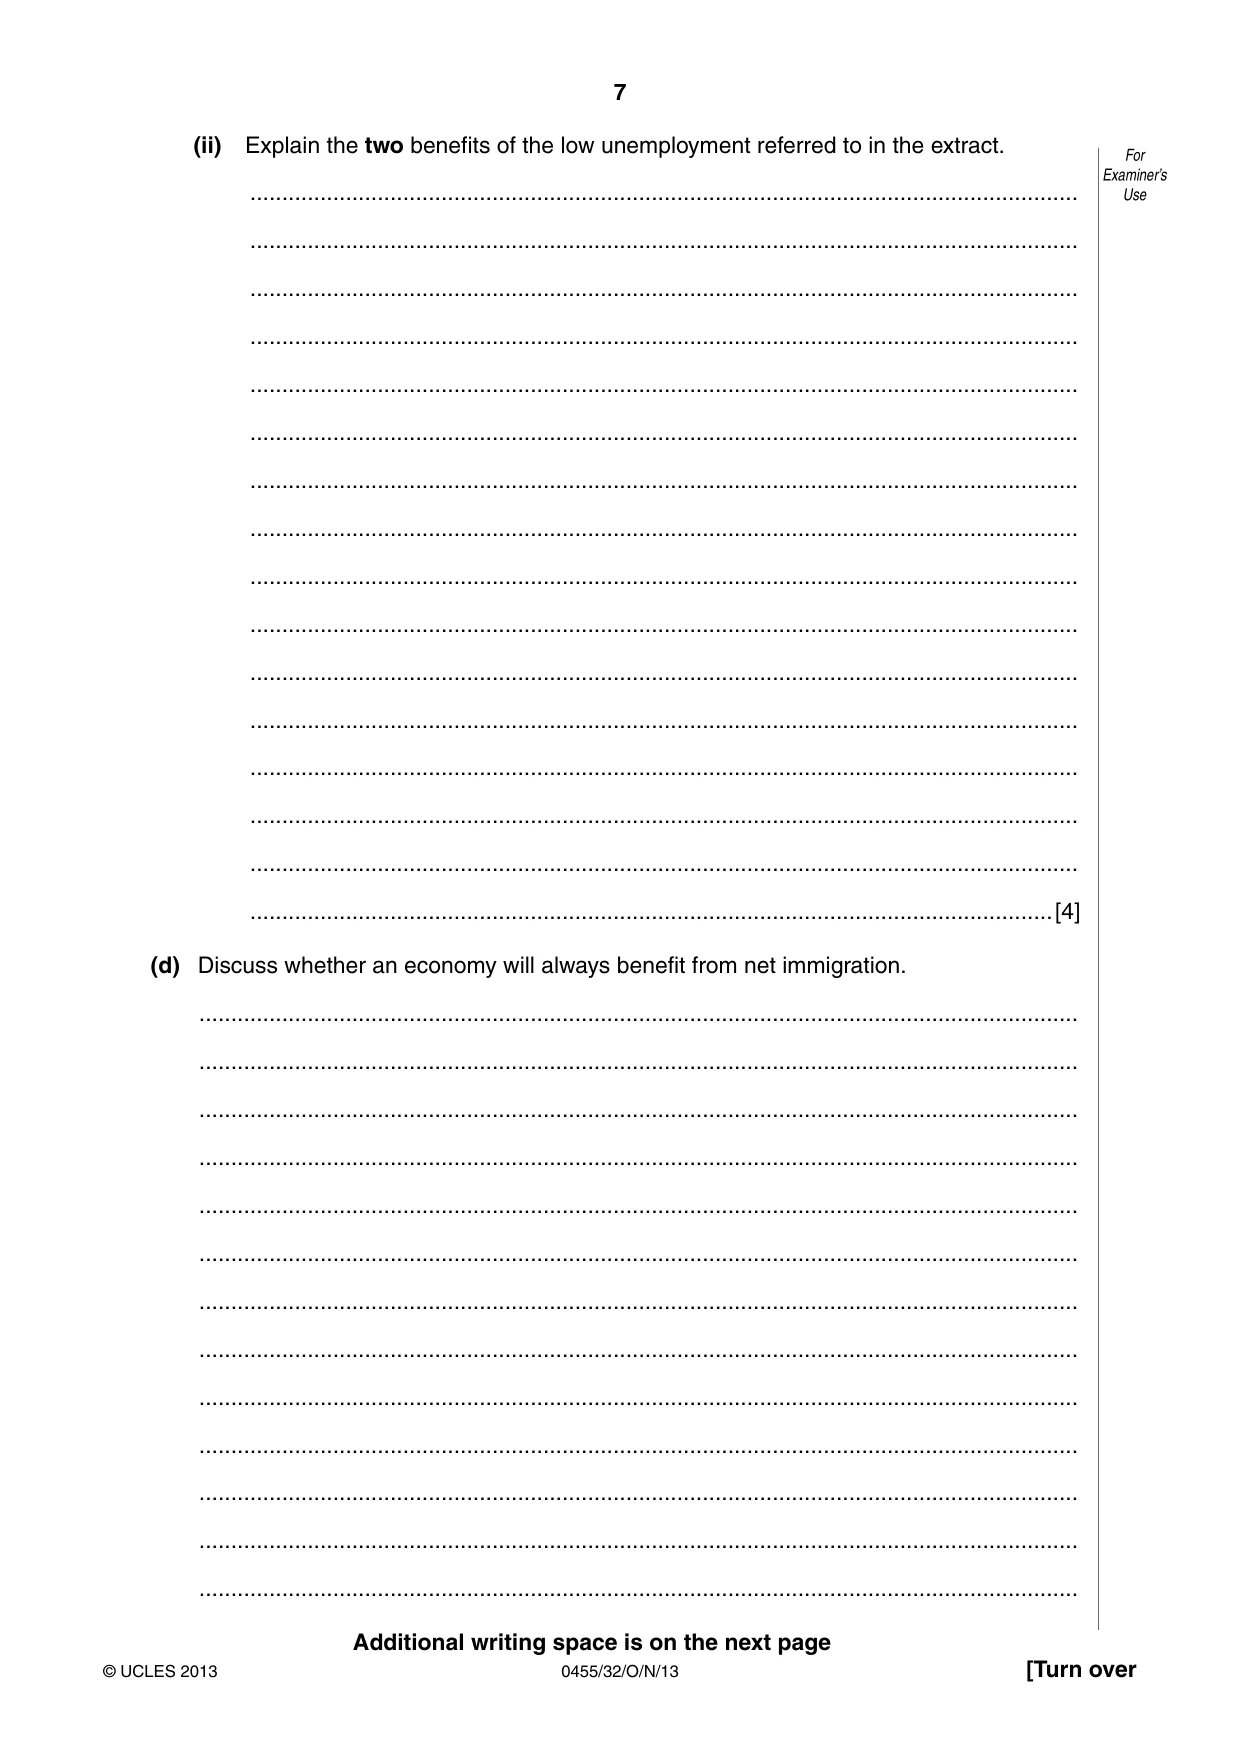
2 (a) (i) Define a trade in goods deficit. .................................................................................................................................. .................................................................................................................................. .................................................................................................................................. .................................................................................................................................. .................................................................................................................................. .................................................................................................................................. .................................................................................................................................. ..............................................................................................................................[2] (ii) What effect does a rise in a country’s foreign exchange rate have on its export prices and on its import prices? .................................................................................................................................. .................................................................................................................................. .................................................................................................................................. .................................................................................................................................. .................................................................................................................................. .................................................................................................................................. .................................................................................................................................. ..............................................................................................................................[2] (b) (i) Using information from Table 1, explain whether agriculture or manufacturing in China had the higher labour productivity in 2010. .................................................................................................................................. .................................................................................................................................. .................................................................................................................................. .................................................................................................................................. .................................................................................................................................. .................................................................................................................................. .................................................................................................................................. ..............................................................................................................................[2] (ii) Using information from Table 1 and the extract, explain which country had more people employed in the services sector. .................................................................................................................................. .................................................................................................................................. .................................................................................................................................. .................................................................................................................................. .................................................................................................................................. .................................................................................................................................. .................................................................................................................................. ..............................................................................................................................[2] (c) (i) Calculate how many people were unemployed in Australia in 2011. .................................................................................................................................. .................................................................................................................................. .................................................................................................................................. .................................................................................................................................. .................................................................................................................................. .................................................................................................................................. .................................................................................................................................. ..............................................................................................................................[2] (ii) Explain the two benefits of the low unemployment referred to in the extract. .................................................................................................................................. .................................................................................................................................. .................................................................................................................................. .................................................................................................................................. .................................................................................................................................. .................................................................................................................................. .................................................................................................................................. .................................................................................................................................. .................................................................................................................................. .................................................................................................................................. .................................................................................................................................. .................................................................................................................................. .................................................................................................................................. .................................................................................................................................. .................................................................................................................................. ..............................................................................................................................[4] (d) Discuss whether an economy will always benefit from net immigration. .......................................................................................................................................... .......................................................................................................................................... .......................................................................................................................................... .......................................................................................................................................... .......................................................................................................................................... .......................................................................................................................................... .......................................................................................................................................... .......................................................................................................................................... .......................................................................................................................................... .......................................................................................................................................... .......................................................................................................................................... .......................................................................................................................................... ..........................................................................................................................................
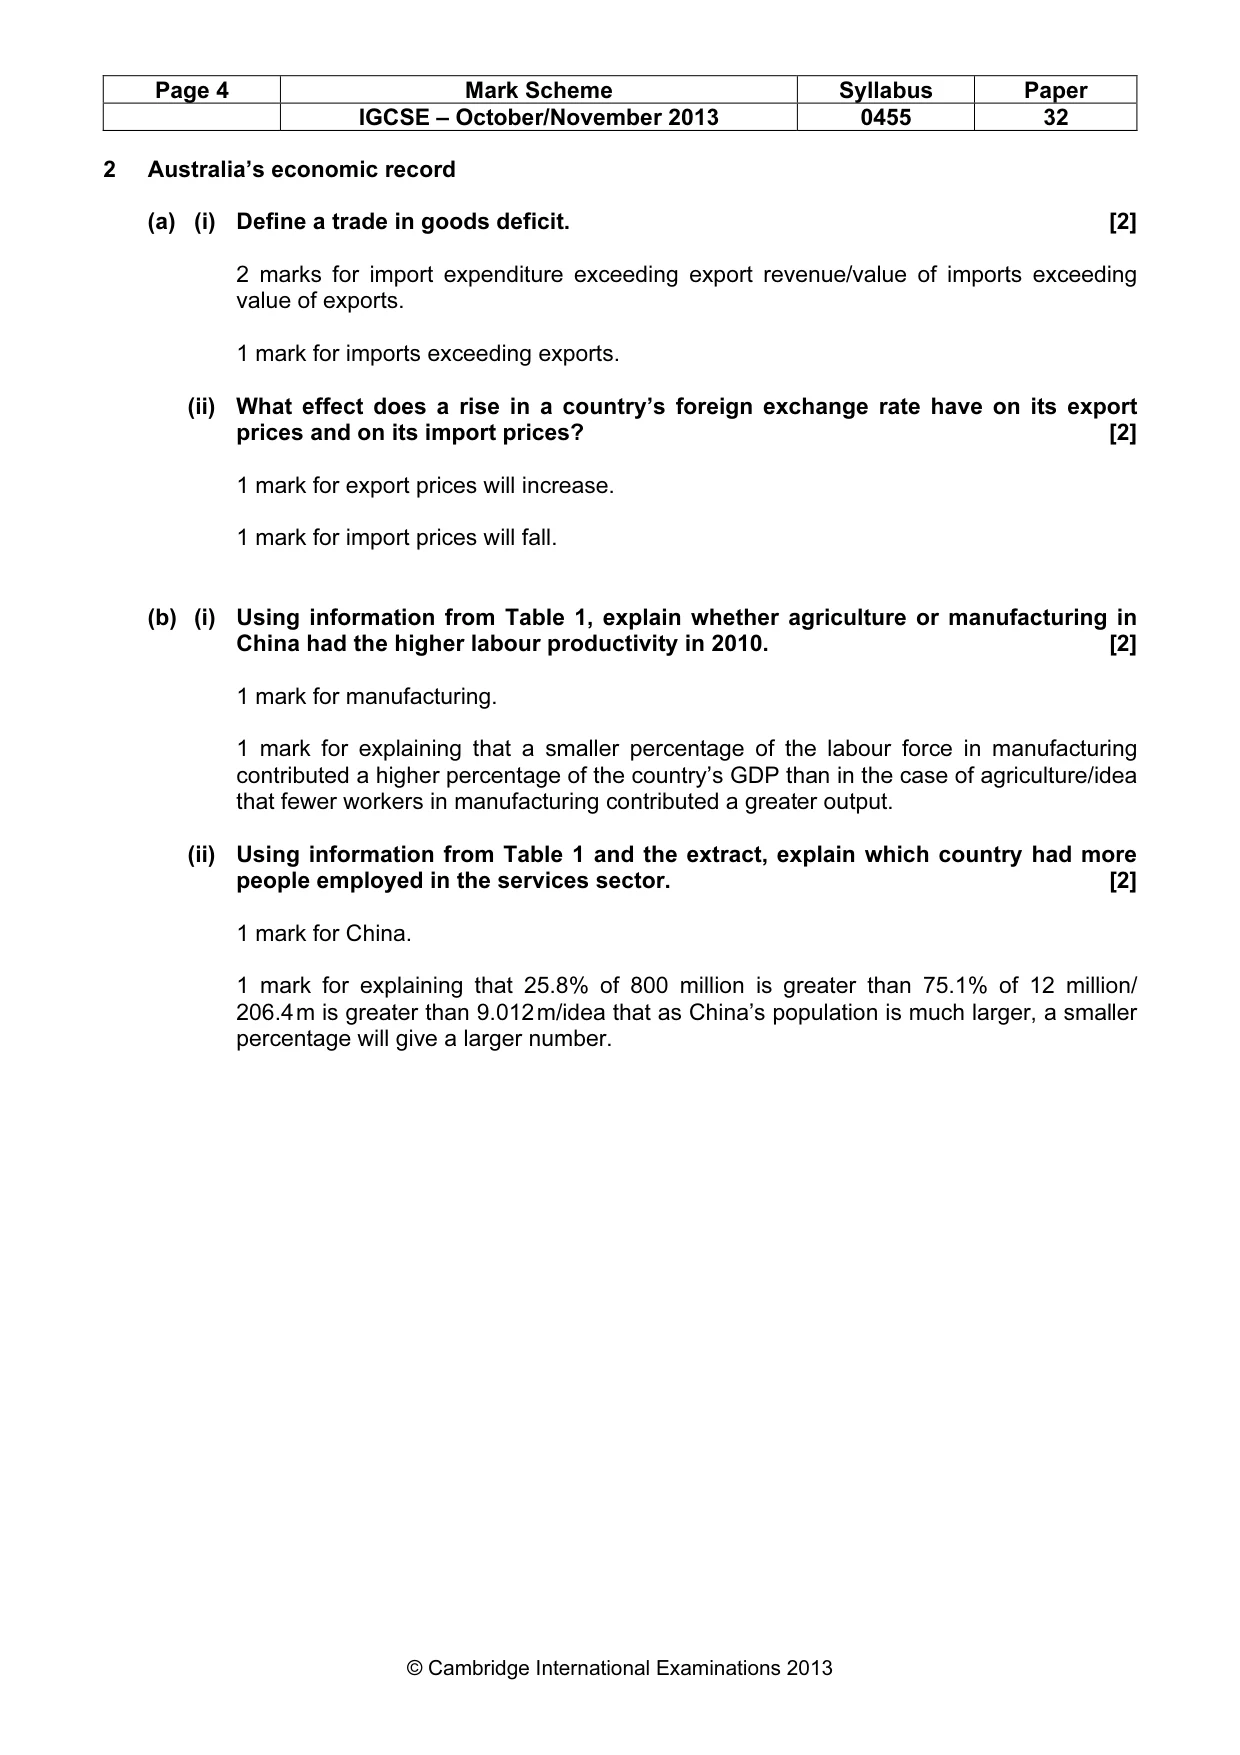
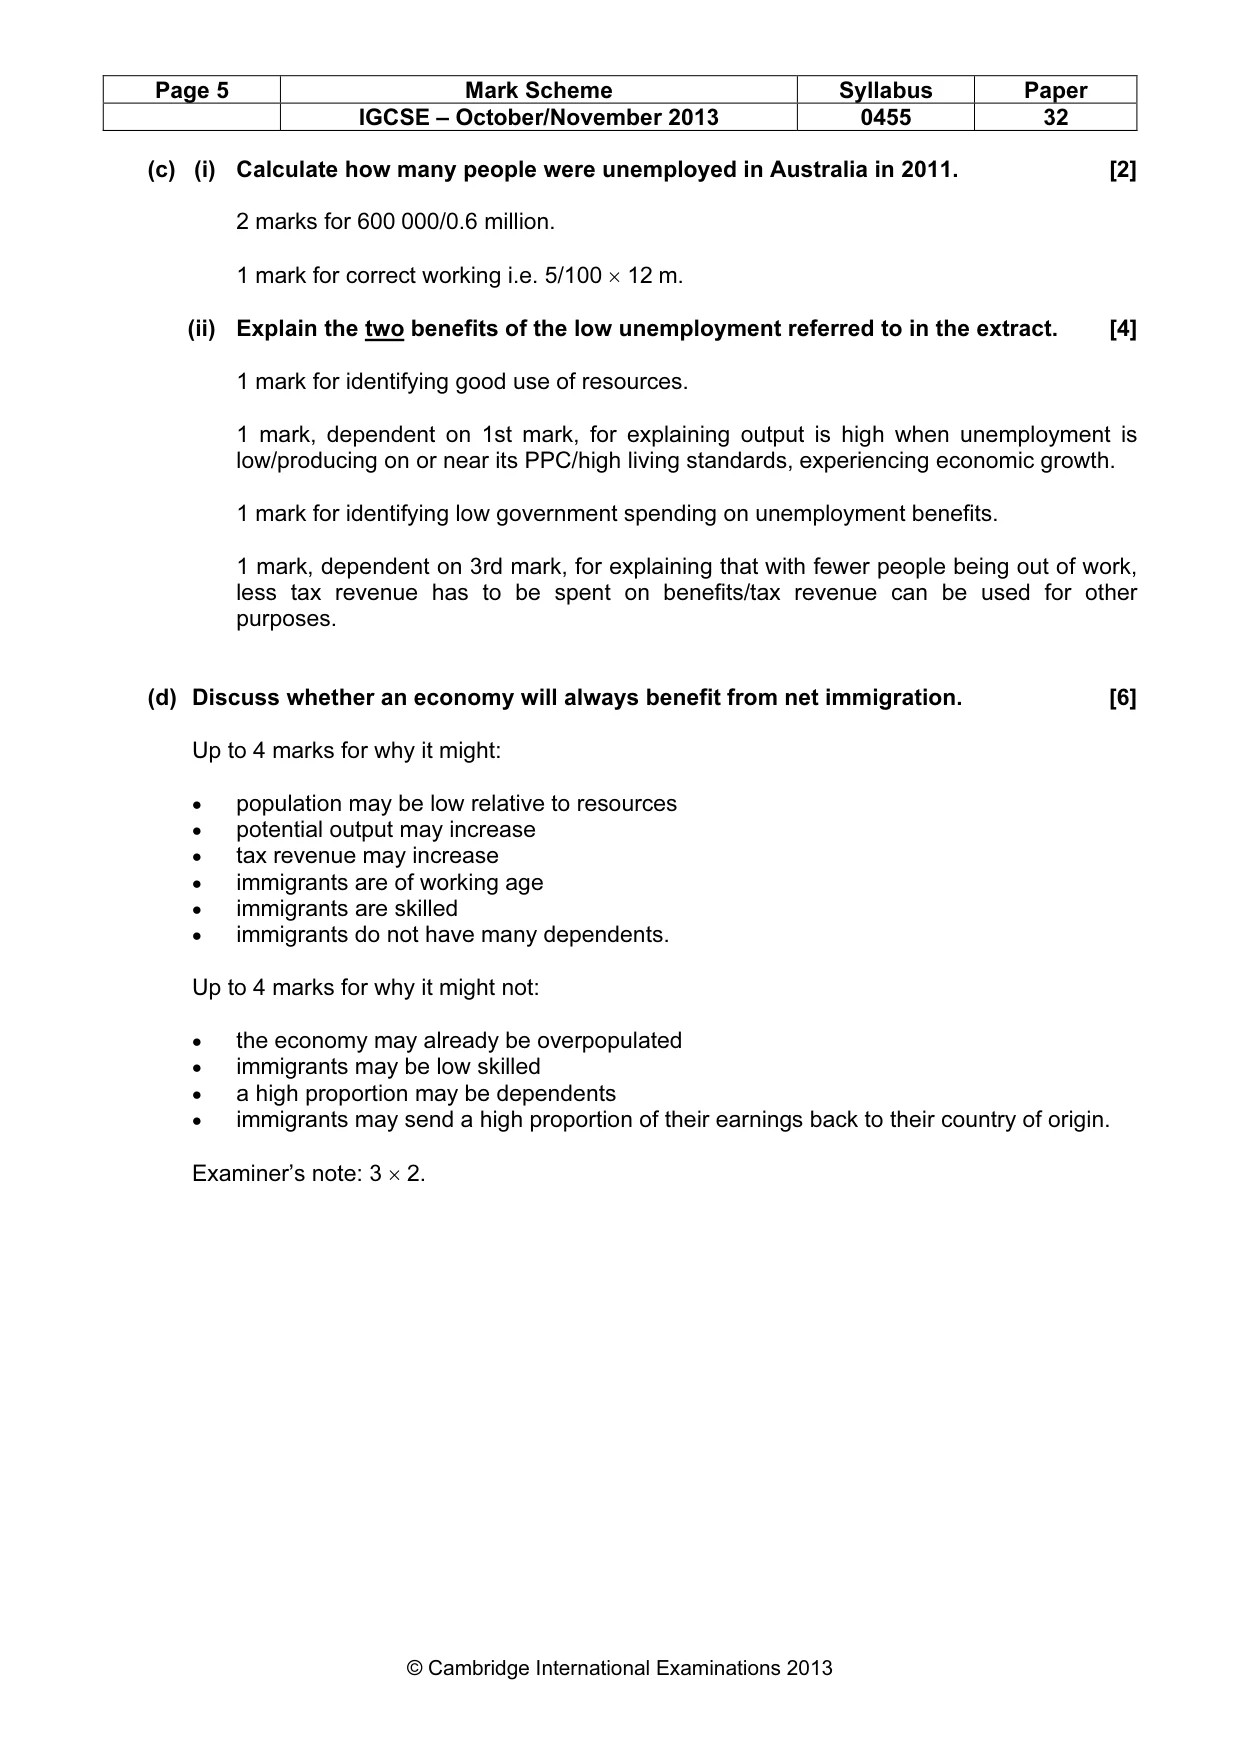
Mark scheme: 2 Australia’s economic record (a) (i) Define a trade in goods deficit. [2] 2 marks for import expenditure exceeding export revenue/value of imports exceeding value of exports. 1 mark for imports exceeding exports. (ii) What effect does a rise in a country’s foreign exchange rate have on its export prices and on its import prices? [2] 1 mark for export prices will increase. 1 mark for import prices will fall. (b) (i) Using information from Table 1, explain whether agriculture or manufacturing in China had the higher labour productivity in 2010. [2] 1 mark for manufacturing. 1 mark for explaining that a smaller percentage of the labour force in manufacturing contributed a higher percentage of the country’s GDP than in the case of agriculture/idea that fewer workers in manufacturing contributed a greater output. (ii) Using information from Table 1 and the extract, explain which country had more people employed in the services sector. [2] 1 mark for China. 1 mark for explaining that 25.8% of 800 million is greater than 75.1% of 12 million/ 206.4 m is greater than 9.012 m/idea that as China’s population is much larger, a smaller percentage will give a larger number. IGCSE – October/November 2013 0455 32 (c) (i) Calculate how many people were unemployed in Australia in 2011. [2] 2 marks for 600 000/0.6 million. 1 mark for correct working i.e. 5/100 × 12 m. (ii) Explain the two benefits of the low unemployment referred to in the extract. [4] 1 mark for identifying good use of resources. 1 mark, dependent on 1st mark, for explaining output is high when unemployment is low/producing on or near its PPC/high living standards, experiencing economic growth. 1 mark for identifying low government spending on unemployment benefits. 1 mark, dependent on 3rd mark, for explaining that with fewer people being out of work, less tax revenue has to be spent on benefits/tax revenue can be used for other purposes. (d) Discuss whether an economy will always benefit from net immigration. [6] Up to 4 marks for why it might: • population may be low relative to resources • potential output may increase • tax revenue may increase • immigrants are of working age • immigrants are skilled • immigrants do not have many dependents. Up to 4 marks for why it might not: • the economy may already be overpopulated • immigrants may be low skilled • a high proportion may be dependents • immigrants may send a high proportion of their earnings back to their country of origin. Examiner’s note: 3 × 2.
What was in this paper
The subtopics covered by these 2 questions, and how many questions each got. Open one in a new tab to see every Cambridge question on it.
What you needed in this session
Cambridge’s own grade thresholds for 2013 Oct/Nov, Paper 3 · Variant 2. A higher threshold means an easier paper — the bar moves with how the cohort did.