Cambridge IGCSE Economics 0455 — 2011 Oct/Nov Paper 3 · Variant 2
0455/32/O/N/11 · 2 questions · 40 marks · ≈45 min
The question paper and its mark scheme, free to read here and free to download. This is Cambridge’s own paper, exactly as it was sat.
Question paper8 pages

Mark scheme3 pages
Answers below. Sit the paper first if you are practising.
Questions as text
Q1 · Calculate Sierra Leone’s Human Development Index (HDI) value in 2008
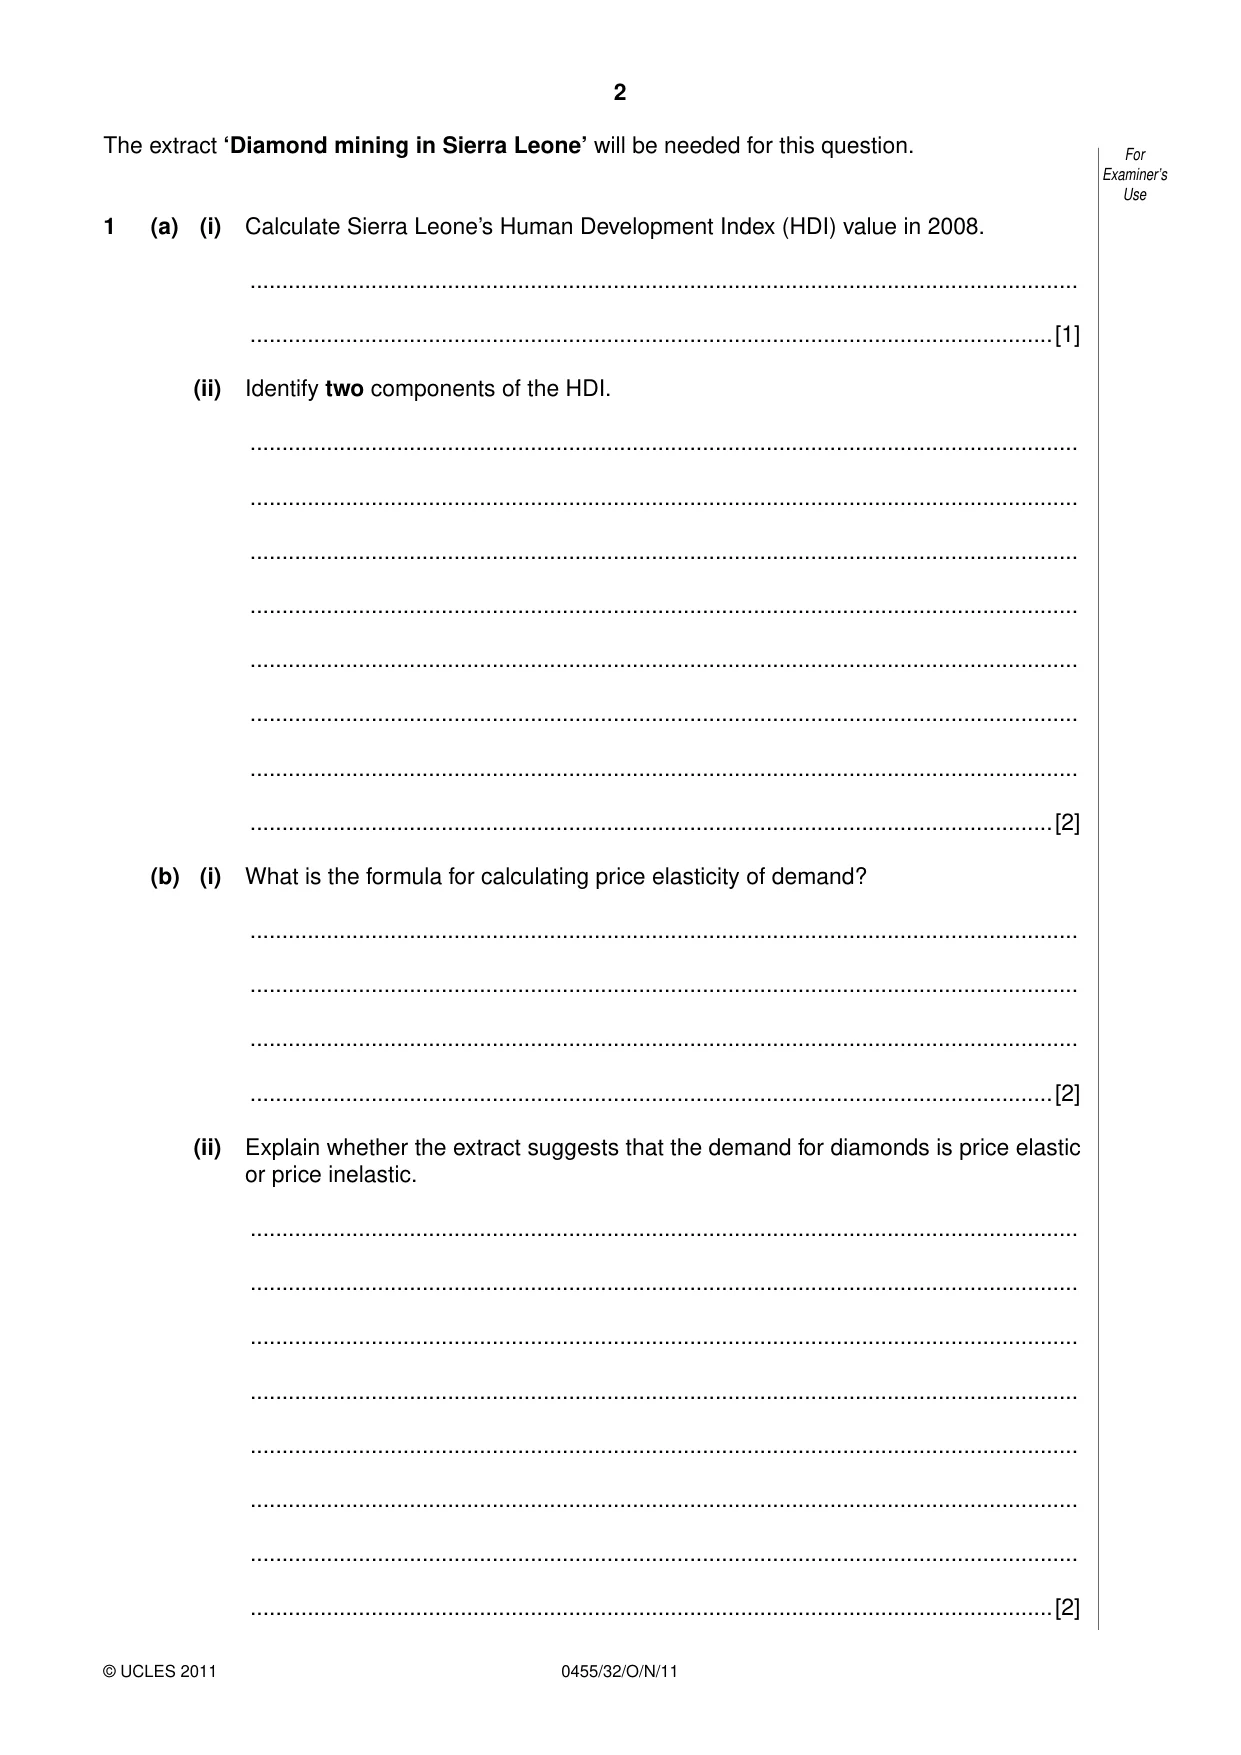
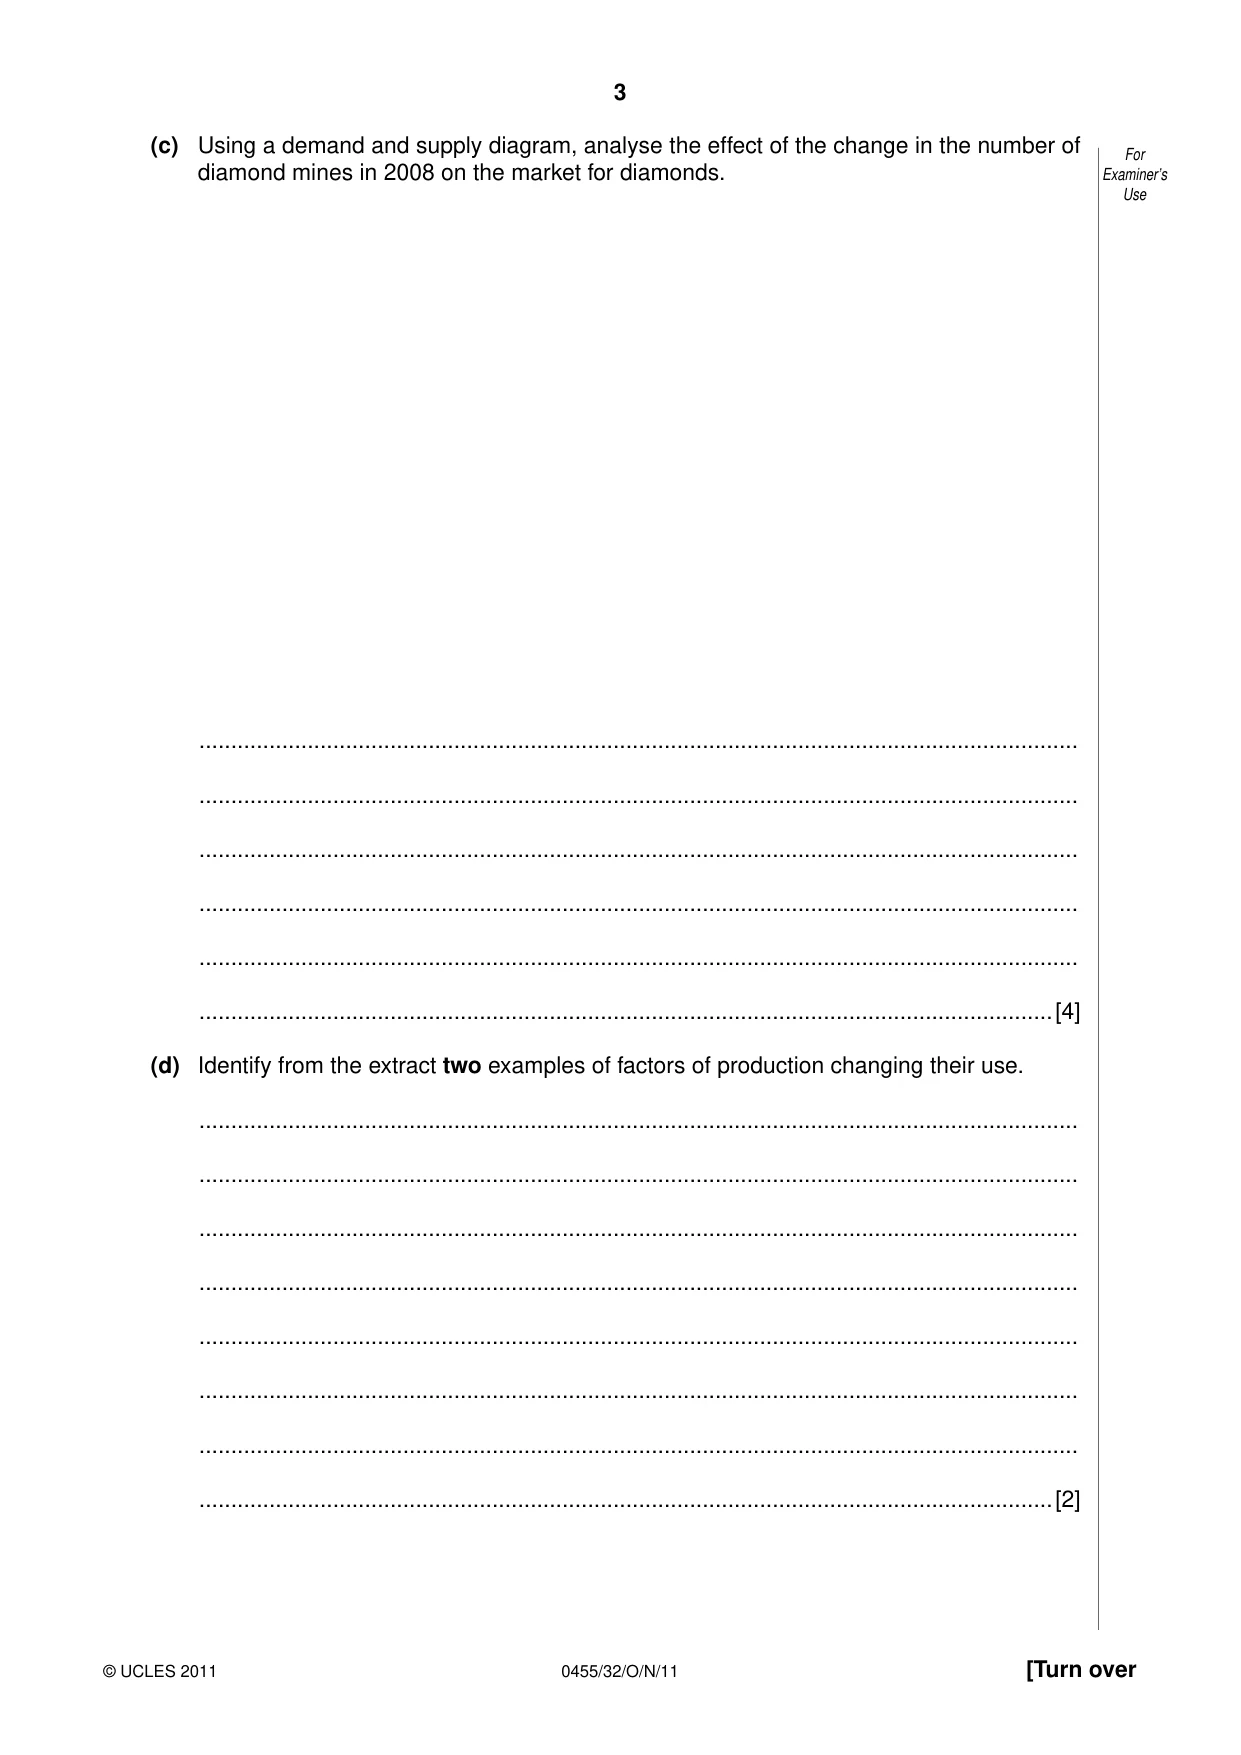
1 (a) (i) Calculate Sierra Leone’s Human Development Index (HDI) value in 2008. .................................................................................................................................. ..............................................................................................................................[1] (ii) Identify two components of the HDI. .................................................................................................................................. .................................................................................................................................. .................................................................................................................................. .................................................................................................................................. .................................................................................................................................. .................................................................................................................................. .................................................................................................................................. ..............................................................................................................................[2] (b) (i) What is the formula for calculating price elasticity of demand? .................................................................................................................................. .................................................................................................................................. .................................................................................................................................. ..............................................................................................................................[2] (ii) Explain whether the extract suggests that the demand for diamonds is price elastic or price inelastic. .................................................................................................................................. .................................................................................................................................. .................................................................................................................................. .................................................................................................................................. .................................................................................................................................. .................................................................................................................................. .................................................................................................................................. ..............................................................................................................................[2] (c) Using a demand and supply diagram, analyse the effect of the change in the number of diamond mines in 2008 on the market for diamonds. .......................................................................................................................................... .......................................................................................................................................... .......................................................................................................................................... .......................................................................................................................................... .......................................................................................................................................... ......................................................................................................................................[4] (d) Identify from the extract two examples of factors of production changing their use. .......................................................................................................................................... .......................................................................................................................................... .......................................................................................................................................... .......................................................................................................................................... .......................................................................................................................................... .......................................................................................................................................... .......................................................................................................................................... ......................................................................................................................................[2] (e) Discuss whether a successful, domestic diamond industry would benefit the economy of Sierra Leone. .......................................................................................................................................... .......................................................................................................................................... .......................................................................................................................................... .......................................................................................................................................... .......................................................................................................................................... .......................................................................................................................................... .......................................................................................................................................... .......................................................................................................................................... .......................................................................................................................................... .......................................................................................................................................... .......................................................................................................................................... .......................................................................................................................................... .......................................................................................................................................... .......................................................................................................................................... .......................................................................................................................................... .......................................................................................................................................... .......................................................................................................................................... .......................................................................................................................................... .......................................................................................................................................... .......................................................................................................................................... .......................................................................................................................................... .......................................................................................................................................... .......................................................................................................................................... .......................................................................................................................................... .......................................................................................................................................... .......................................................................................................................................... .......................................................................................................................................... ......................................................................................................................................[7] [Total: 20] The extract ‘The changing fate of the Philippines’ will be needed for this question.
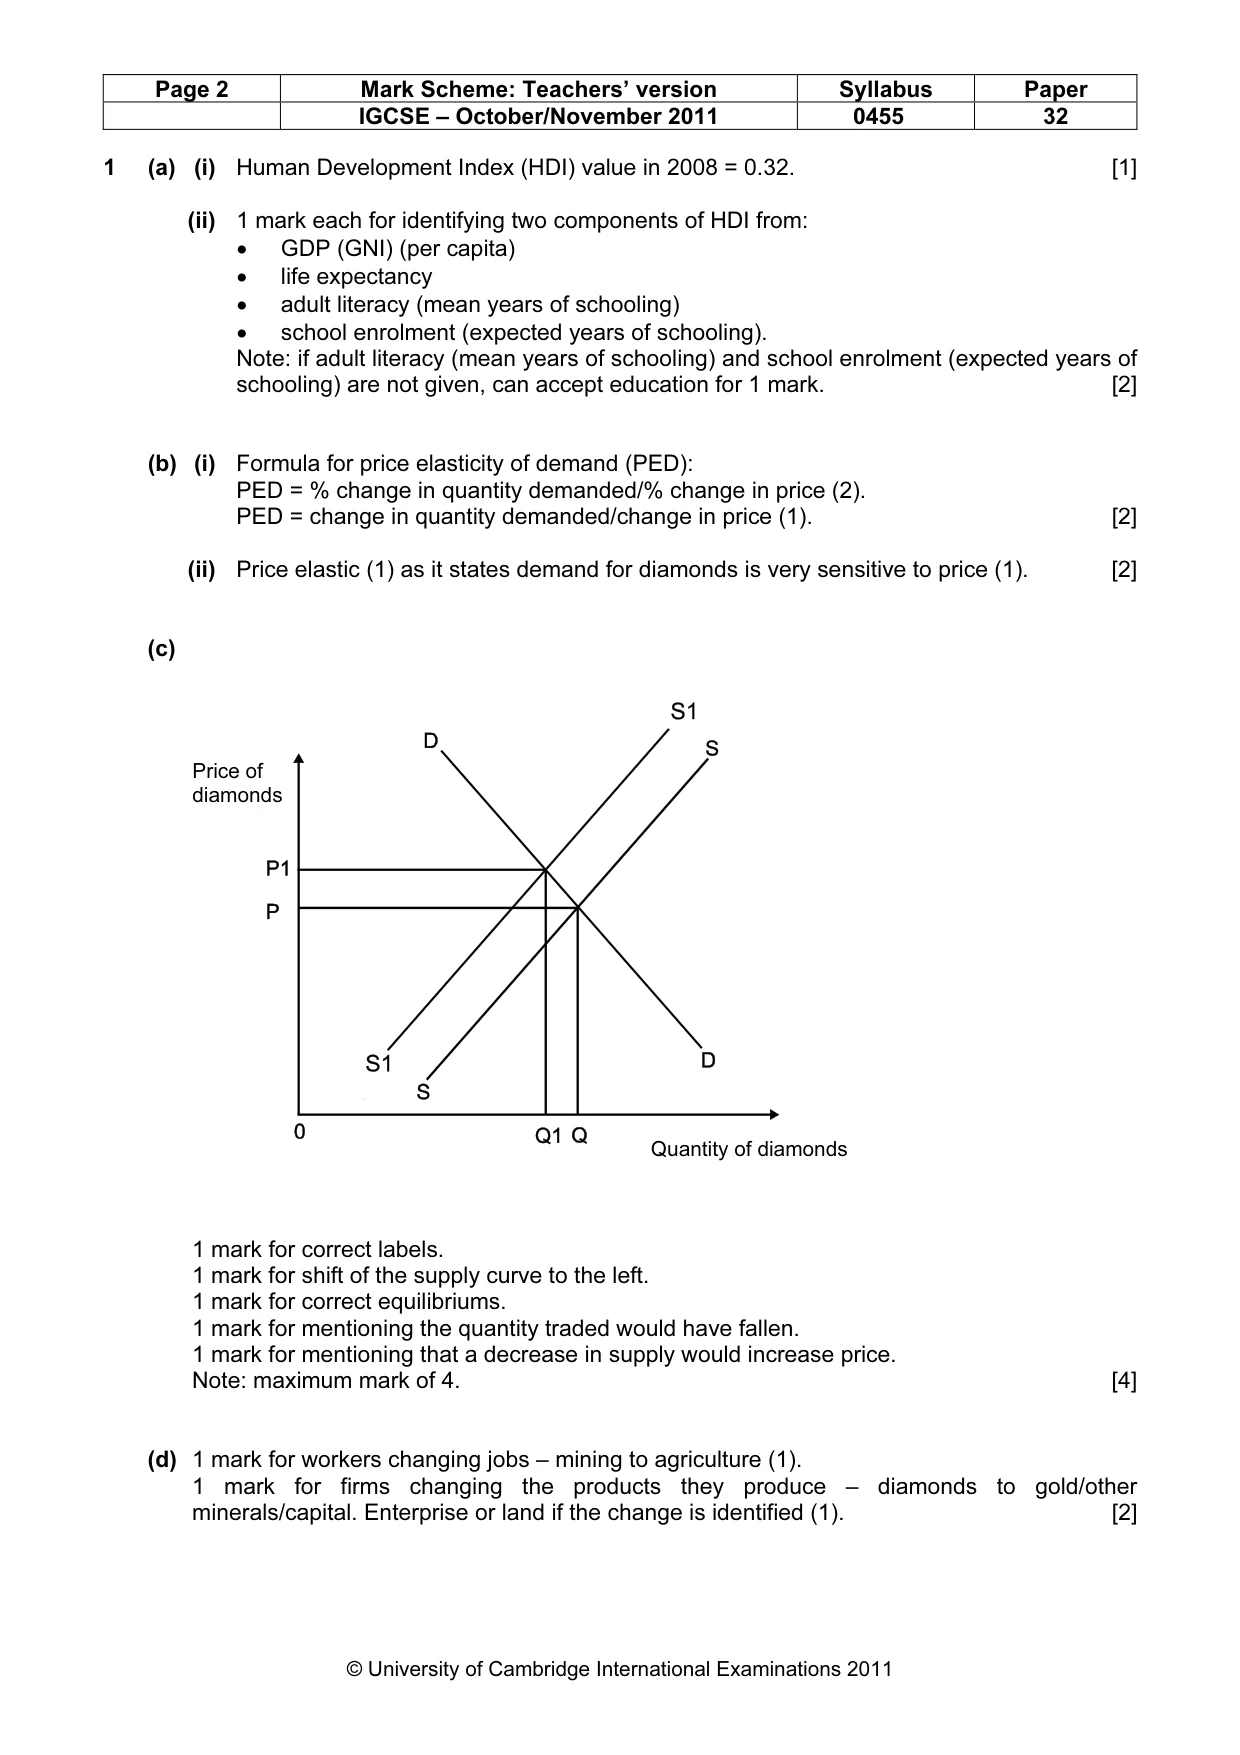
Mark scheme: 1 (a) (i) Human Development Index (HDI) value in 2008 = 0.32. [1] (ii) 1 mark each for identifying two components of HDI from: • GDP (GNI) (per capita) • life expectancy • adult literacy (mean years of schooling) • school enrolment (expected years of schooling). Note: if adult literacy (mean years of schooling) and school enrolment (expected years of schooling) are not given, can accept education for 1 mark. [2] (b) (i) Formula for price elasticity of demand (PED): PED = % change in quantity demanded/% change in price (2). PED = change in quantity demanded/change in price (1). [2] (ii) Price elastic (1) as it states demand for diamonds is very sensitive to price (1). [2] (c) Price of diamonds Quantity of diamonds 1 mark for correct labels. 1 mark for shift of the supply curve to the left. 1 mark for correct equilibriums. 1 mark for mentioning the quantity traded would have fallen. 1 mark for mentioning that a decrease in supply would increase price. Note: maximum mark of 4. [4] (d) 1 mark for workers changing jobs – mining to agriculture (1). 1 mark for firms changing the products they produce – diamonds to gold/other minerals/capital. Enterprise or land if the change is identified (1). [2] IGCSE – October/November 2011 0455 32 (e) Reasons why it might: • generate employment • earn foreign currency • improve the current account position • contribute to economic growth • increase tax revenue. Reasons why it might not: • may push up the exchange rate and make other products less internationally competitive • may damage areas of natural beauty • lower demand for diamonds in the future • risk of overspecialisation. Up to 4 marks for a one-sided approach or a list-like approach. [7]
Question 2
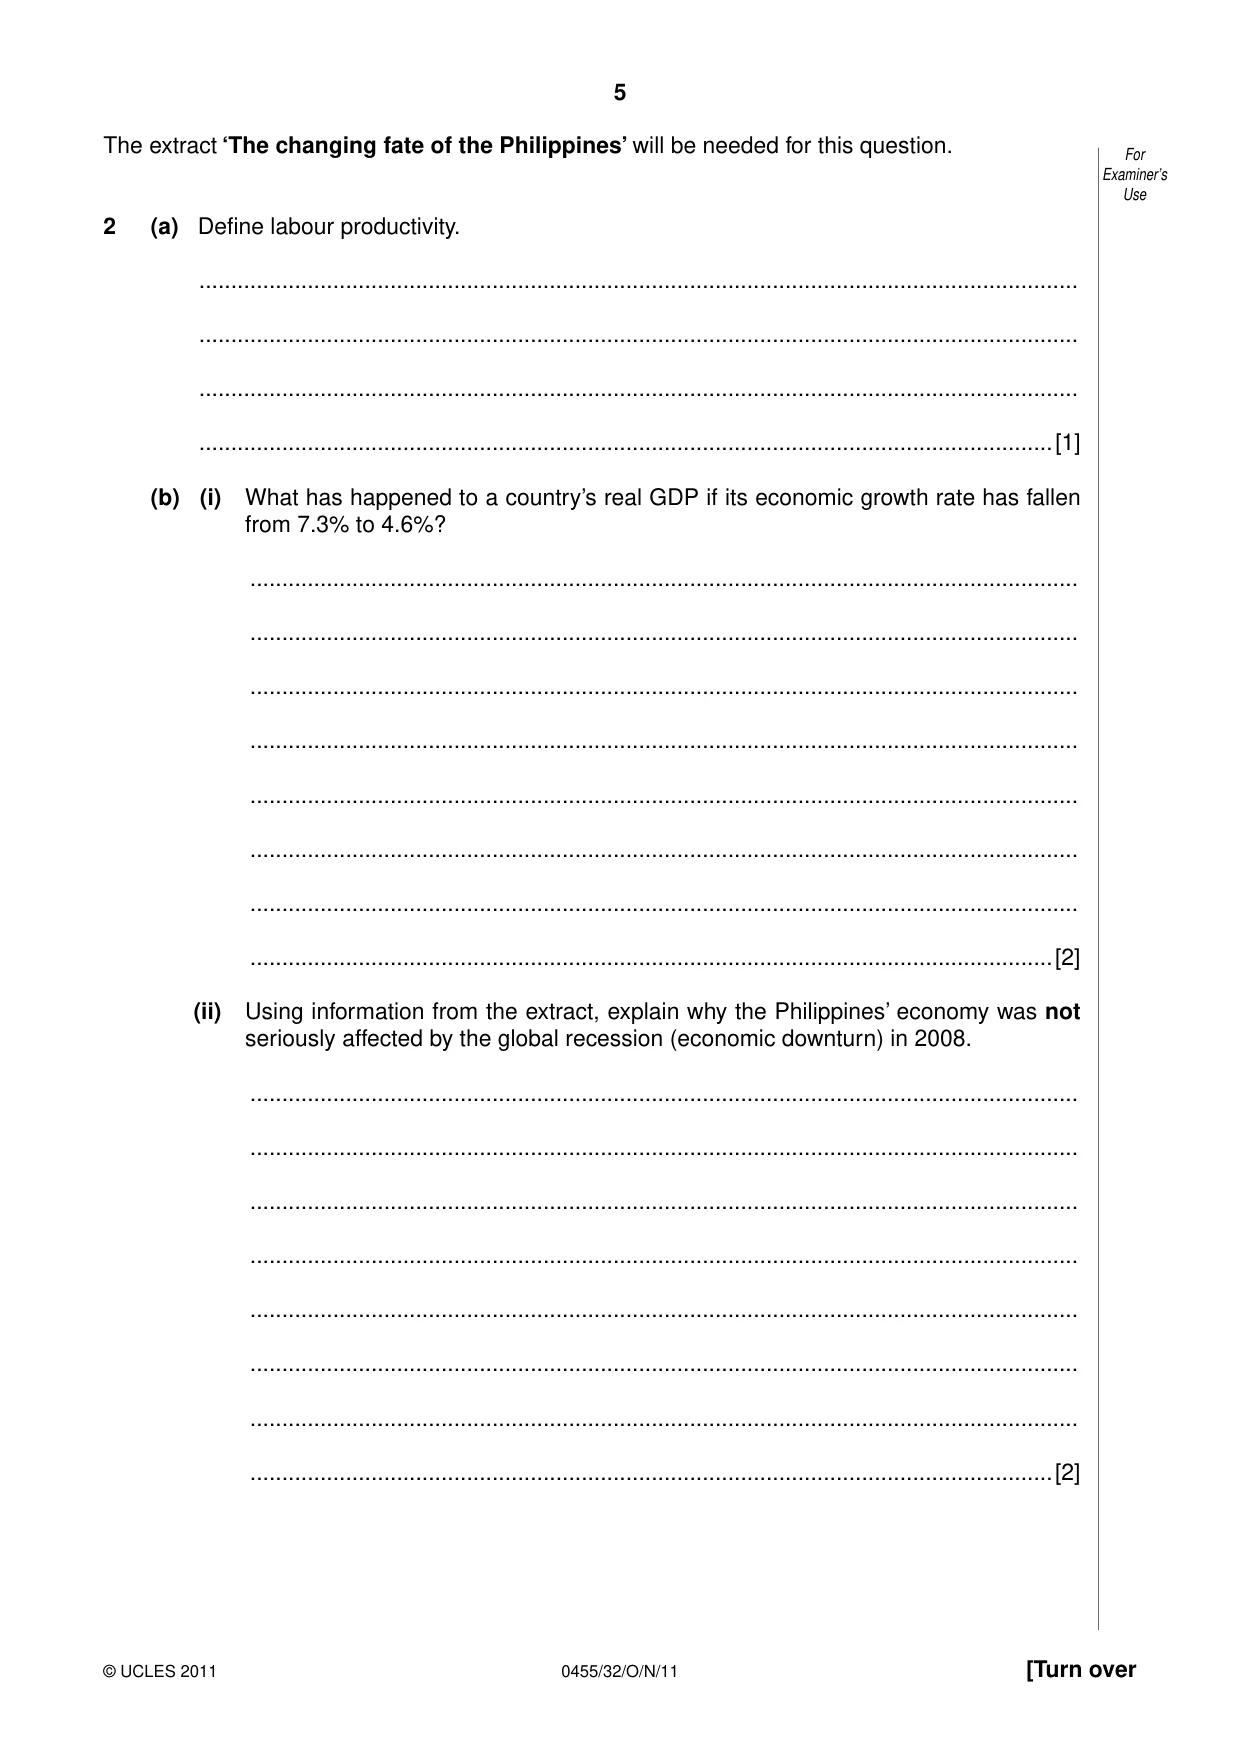
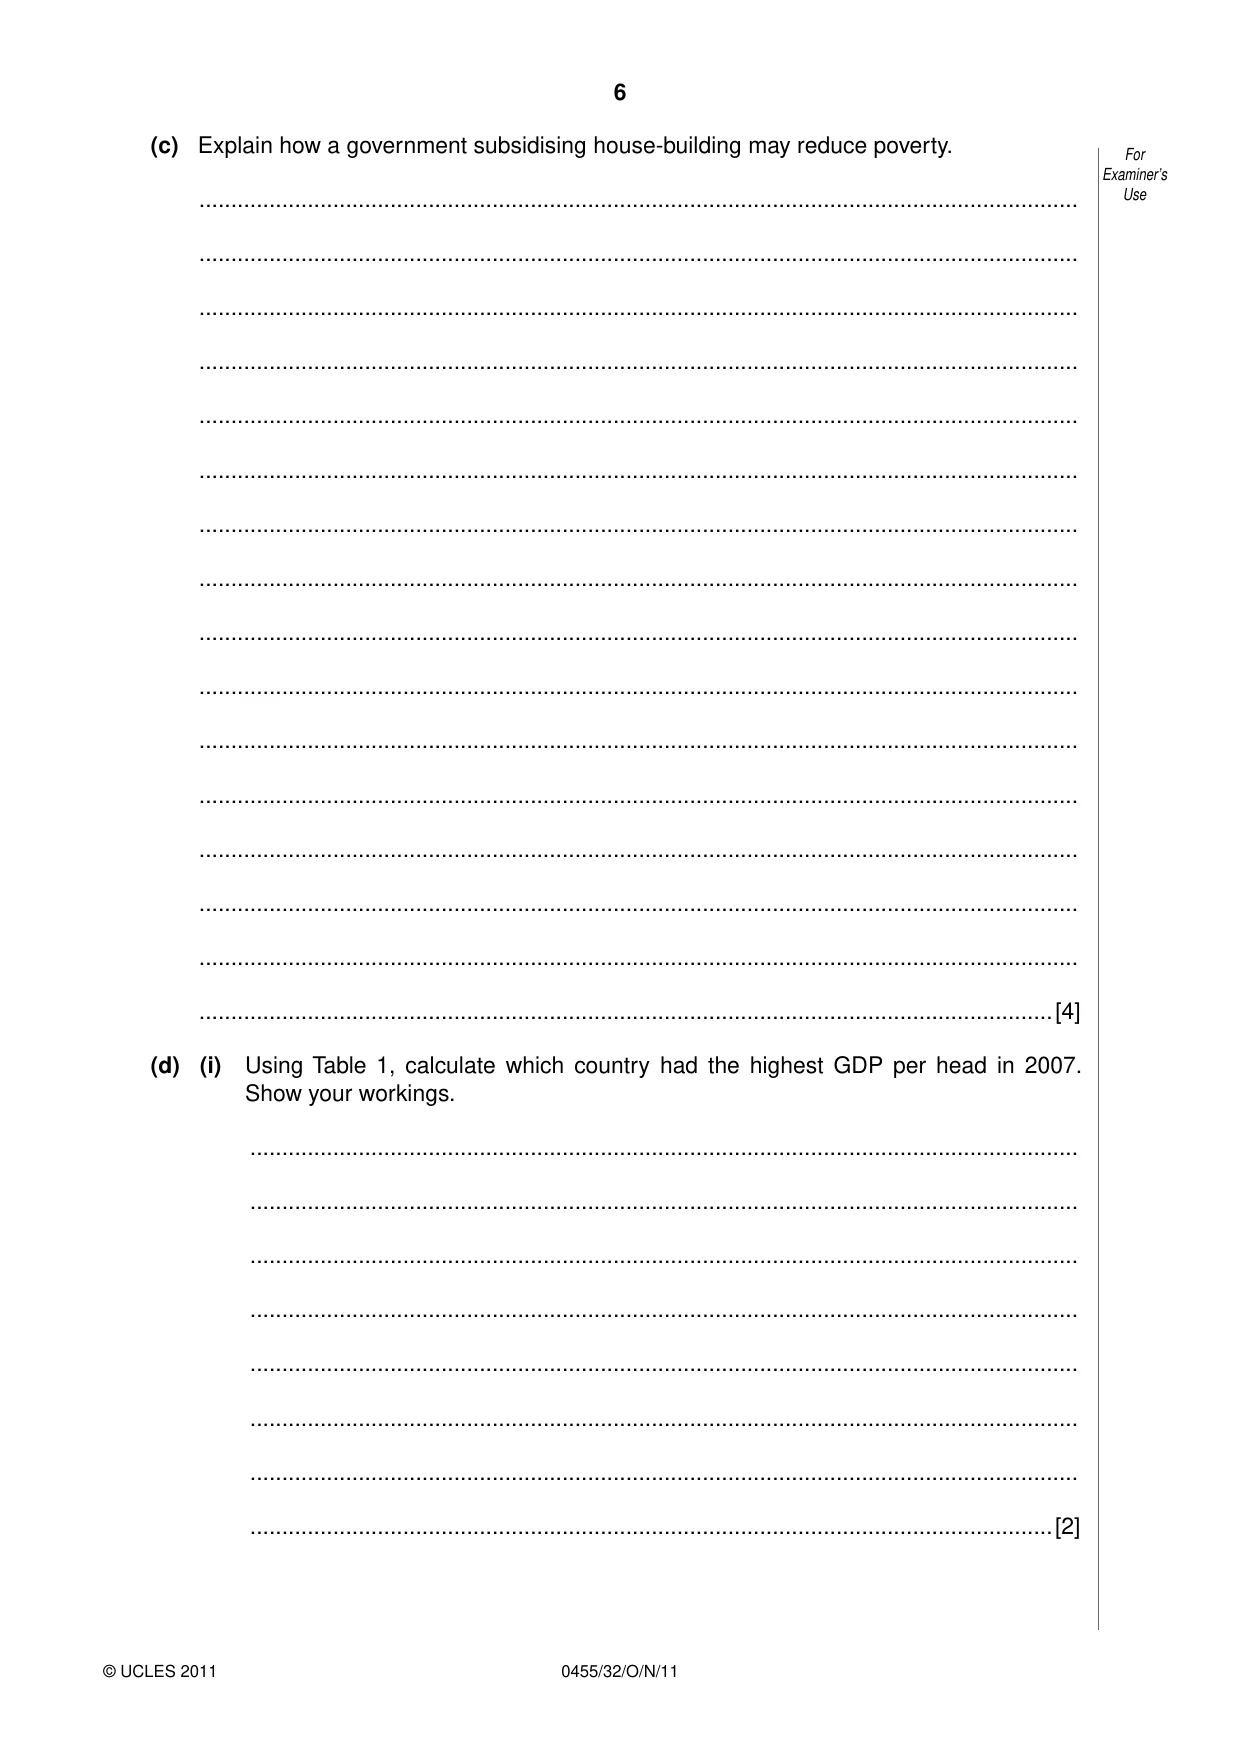
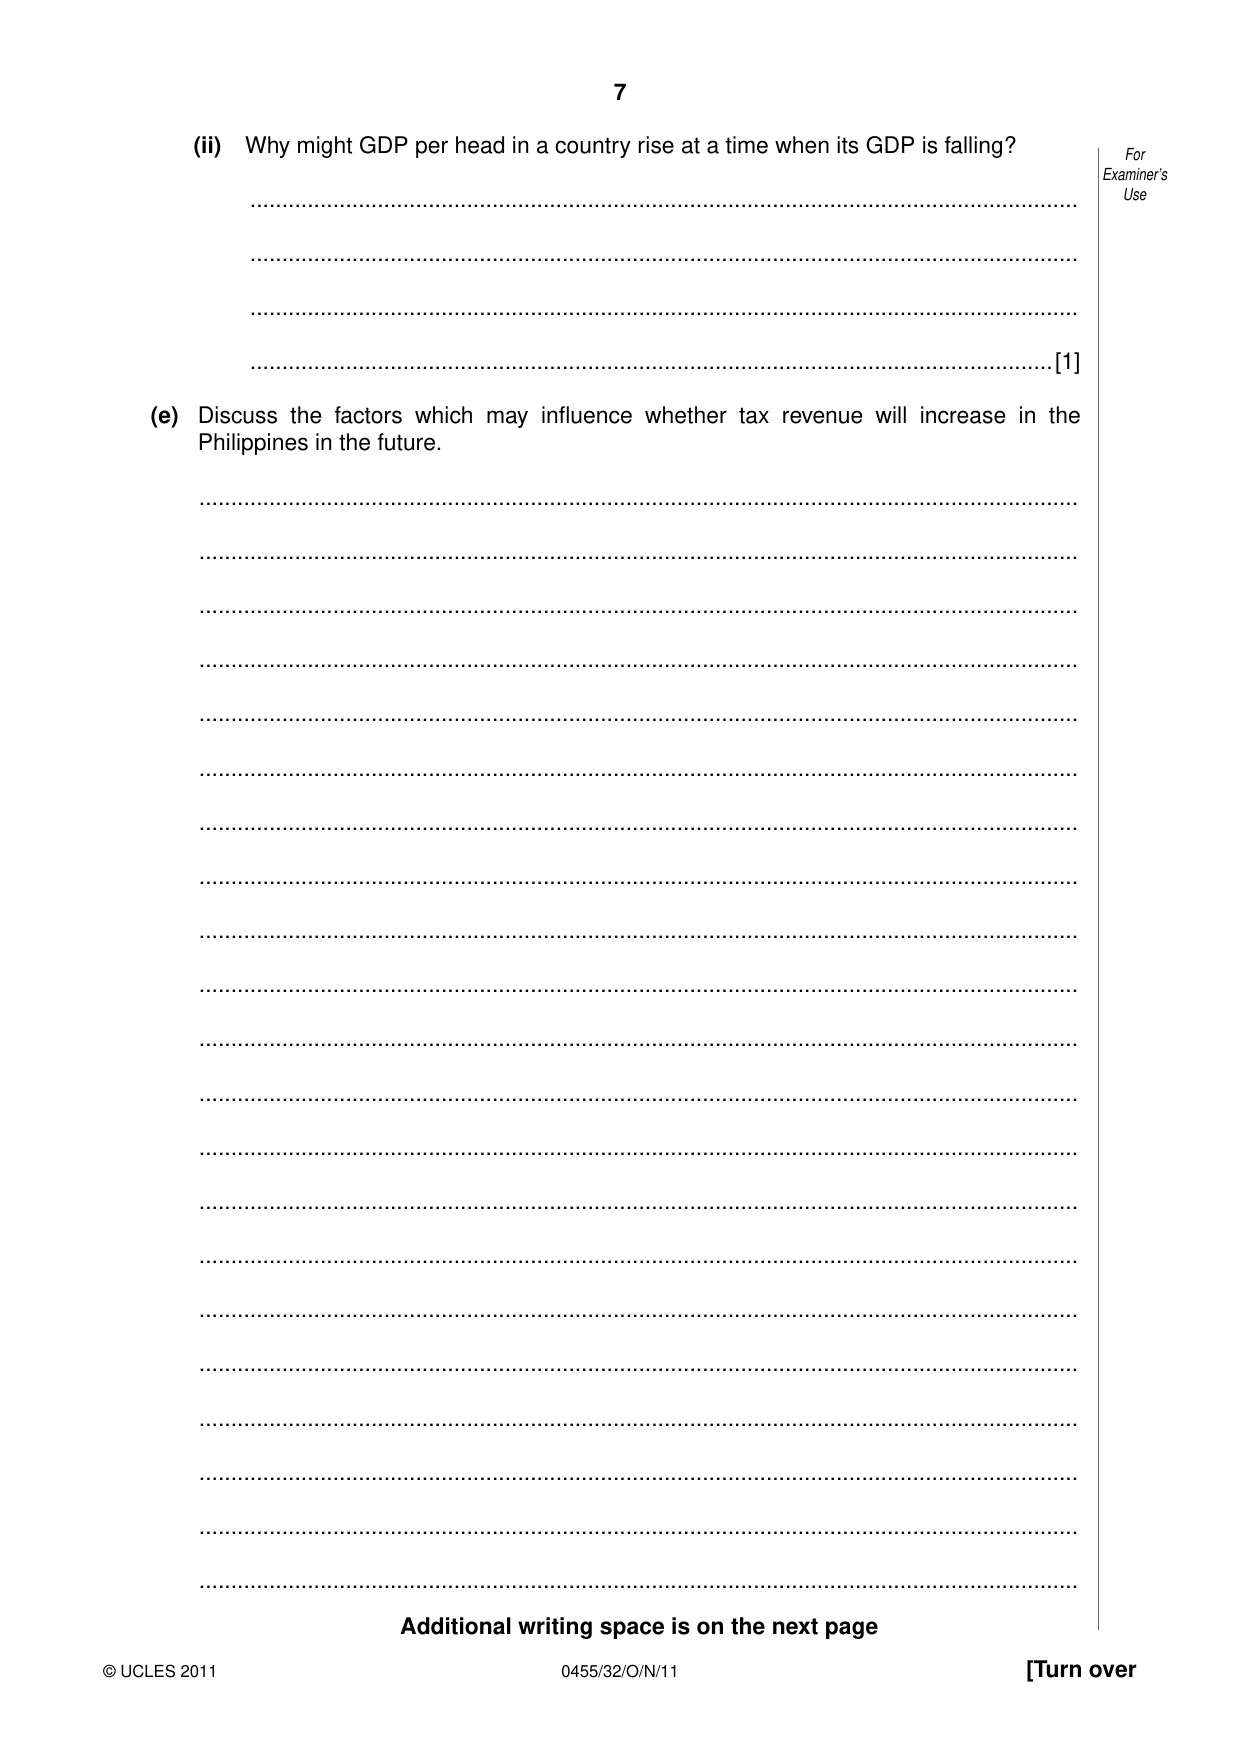
2 (a) Define labour productivity. .......................................................................................................................................... .......................................................................................................................................... .......................................................................................................................................... ......................................................................................................................................[1] (b) (i) What has happened to a country’s real GDP if its economic growth rate has fallen from 7.3% to 4.6%? .................................................................................................................................. .................................................................................................................................. .................................................................................................................................. .................................................................................................................................. .................................................................................................................................. .................................................................................................................................. .................................................................................................................................. ..............................................................................................................................[2] (ii) Using information from the extract, explain why the Philippines’ economy was not seriously affected by the global recession (economic downturn) in 2008. .................................................................................................................................. .................................................................................................................................. .................................................................................................................................. .................................................................................................................................. .................................................................................................................................. .................................................................................................................................. .................................................................................................................................. ..............................................................................................................................[2] (c) Explain how a government subsidising house-building may reduce poverty. .......................................................................................................................................... .......................................................................................................................................... .......................................................................................................................................... .......................................................................................................................................... .......................................................................................................................................... .......................................................................................................................................... .......................................................................................................................................... .......................................................................................................................................... .......................................................................................................................................... .......................................................................................................................................... .......................................................................................................................................... .......................................................................................................................................... .......................................................................................................................................... .......................................................................................................................................... .......................................................................................................................................... ......................................................................................................................................[4] (d) (i) Using Table 1, calculate which country had the highest GDP per head in 2007. Show your workings. .................................................................................................................................. .................................................................................................................................. .................................................................................................................................. .................................................................................................................................. .................................................................................................................................. .................................................................................................................................. .................................................................................................................................. ..............................................................................................................................[2] (ii) Why might GDP per head in a country rise at a time when its GDP is falling? .................................................................................................................................. .................................................................................................................................. .................................................................................................................................. ..............................................................................................................................[1] (e) Discuss the factors which may influence whether tax revenue will increase in the Philippines in the future. .......................................................................................................................................... .......................................................................................................................................... .......................................................................................................................................... .......................................................................................................................................... .......................................................................................................................................... .......................................................................................................................................... .......................................................................................................................................... .......................................................................................................................................... .......................................................................................................................................... .......................................................................................................................................... .......................................................................................................................................... .......................................................................................................................................... .......................................................................................................................................... .......................................................................................................................................... .......................................................................................................................................... .......................................................................................................................................... .......................................................................................................................................... .......................................................................................................................................... .......................................................................................................................................... .......................................................................................................................................... ..........................................................................................................................................
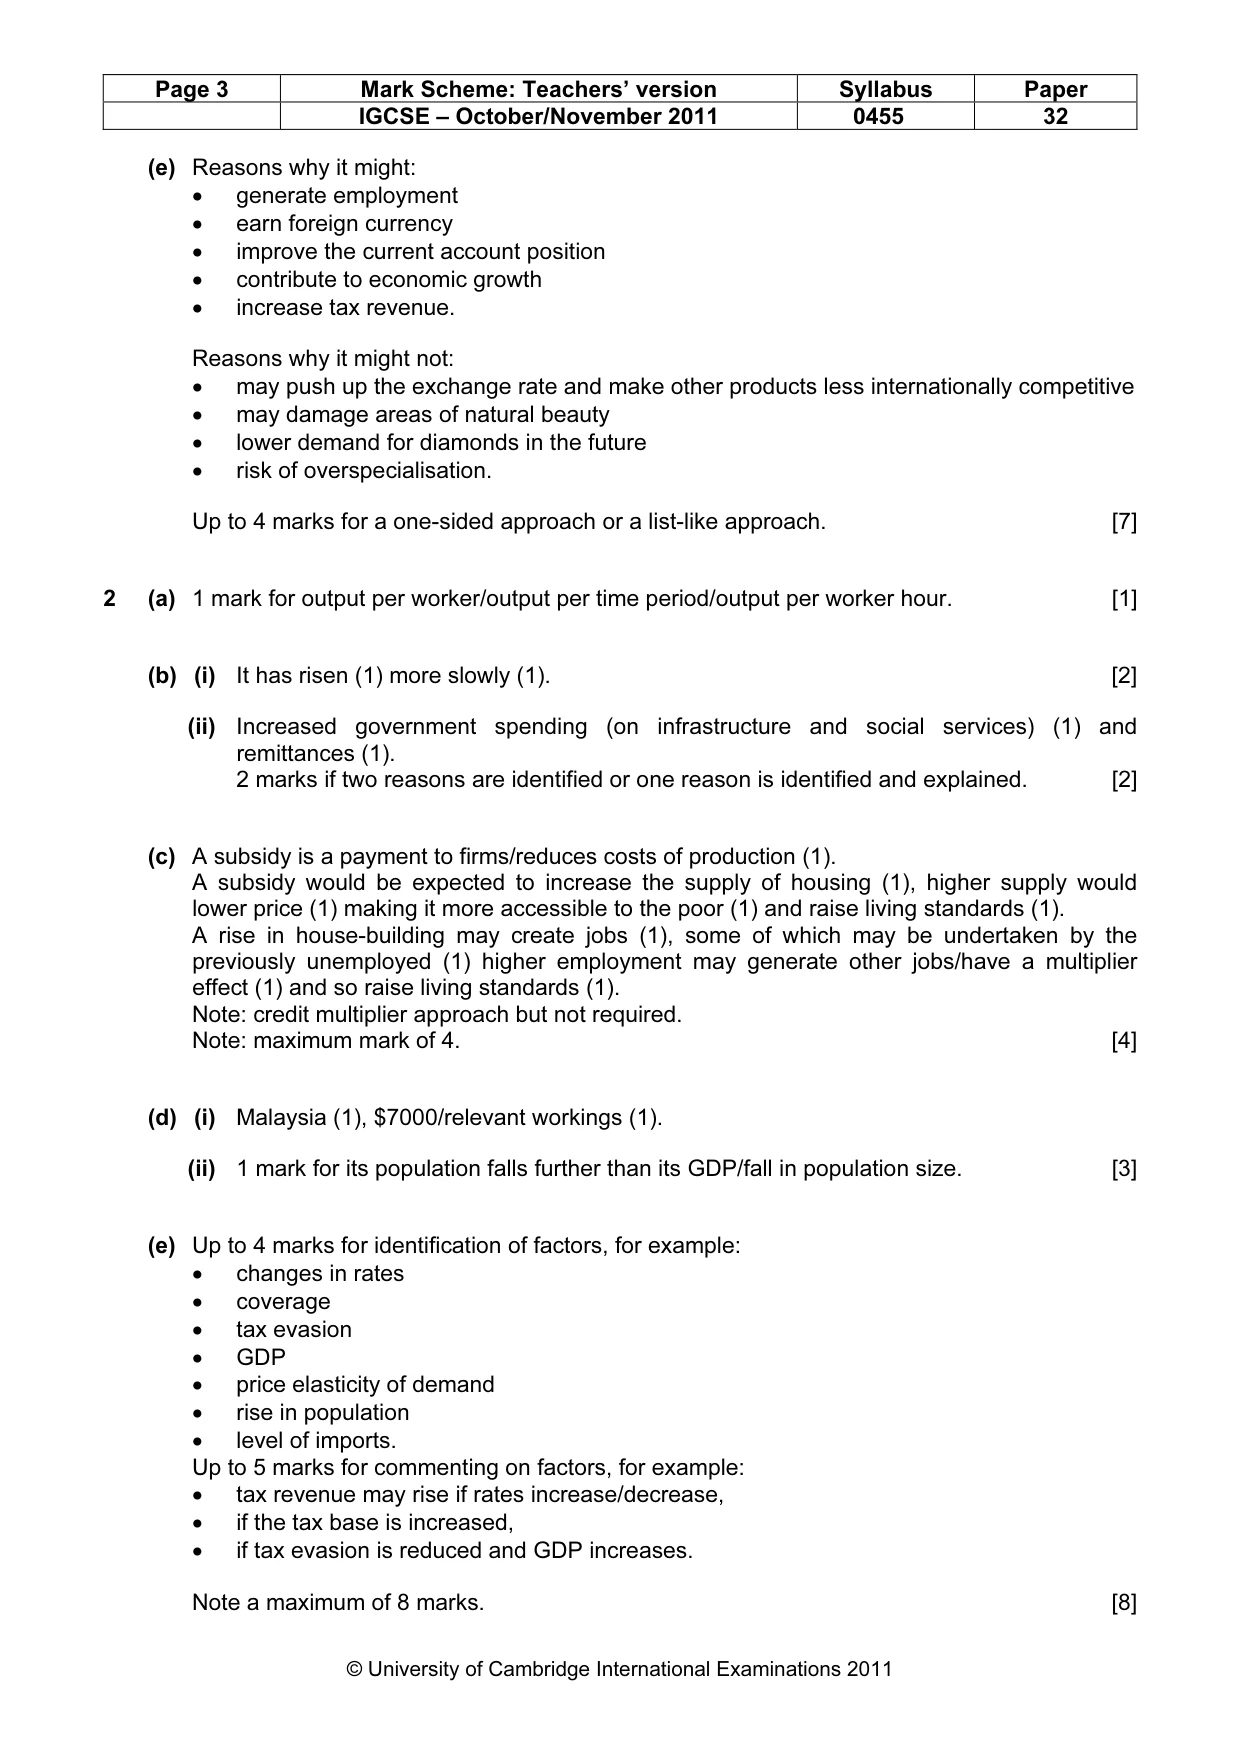
Mark scheme: 2 (a) 1 mark for output per worker/output per time period/output per worker hour. [1] (b) (i) It has risen (1) more slowly (1). [2] (ii) Increased government spending (on infrastructure and social services) (1) and remittances (1). 2 marks if two reasons are identified or one reason is identified and explained. [2] (c) A subsidy is a payment to firms/reduces costs of production (1). A subsidy would be expected to increase the supply of housing (1), higher supply would lower price (1) making it more accessible to the poor (1) and raise living standards (1). A rise in house-building may create jobs (1), some of which may be undertaken by the previously unemployed (1) higher employment may generate other jobs/have a multiplier effect (1) and so raise living standards (1). Note: credit multiplier approach but not required. Note: maximum mark of 4. [4] (d) (i) Malaysia (1), $7000/relevant workings (1). (ii) 1 mark for its population falls further than its GDP/fall in population size. [3] (e) Up to 4 marks for identification of factors, for example: • changes in rates • coverage • tax evasion • GDP • price elasticity of demand • rise in population • level of imports. Up to 5 marks for commenting on factors, for example: • tax revenue may rise if rates increase/decrease, • if the tax base is increased, • if tax evasion is reduced and GDP increases. Note a maximum of 8 marks. [8]
What was in this paper
The subtopics covered by these 2 questions, and how many questions each got. Open one in a new tab to see every Cambridge question on it.
What you needed in this session
Cambridge’s own grade thresholds for 2011 Oct/Nov, Paper 3 · Variant 2. A higher threshold means an easier paper — the bar moves with how the cohort did.