Cambridge IGCSE Economics 0455 — 2010 May/June Paper 3 · Variant 2
0455/32/M/J/10 · 2 questions · 40 marks · ≈45 min
The question paper and its mark scheme, free to read here and free to download. This is Cambridge’s own paper, exactly as it was sat.
Question paper8 pages
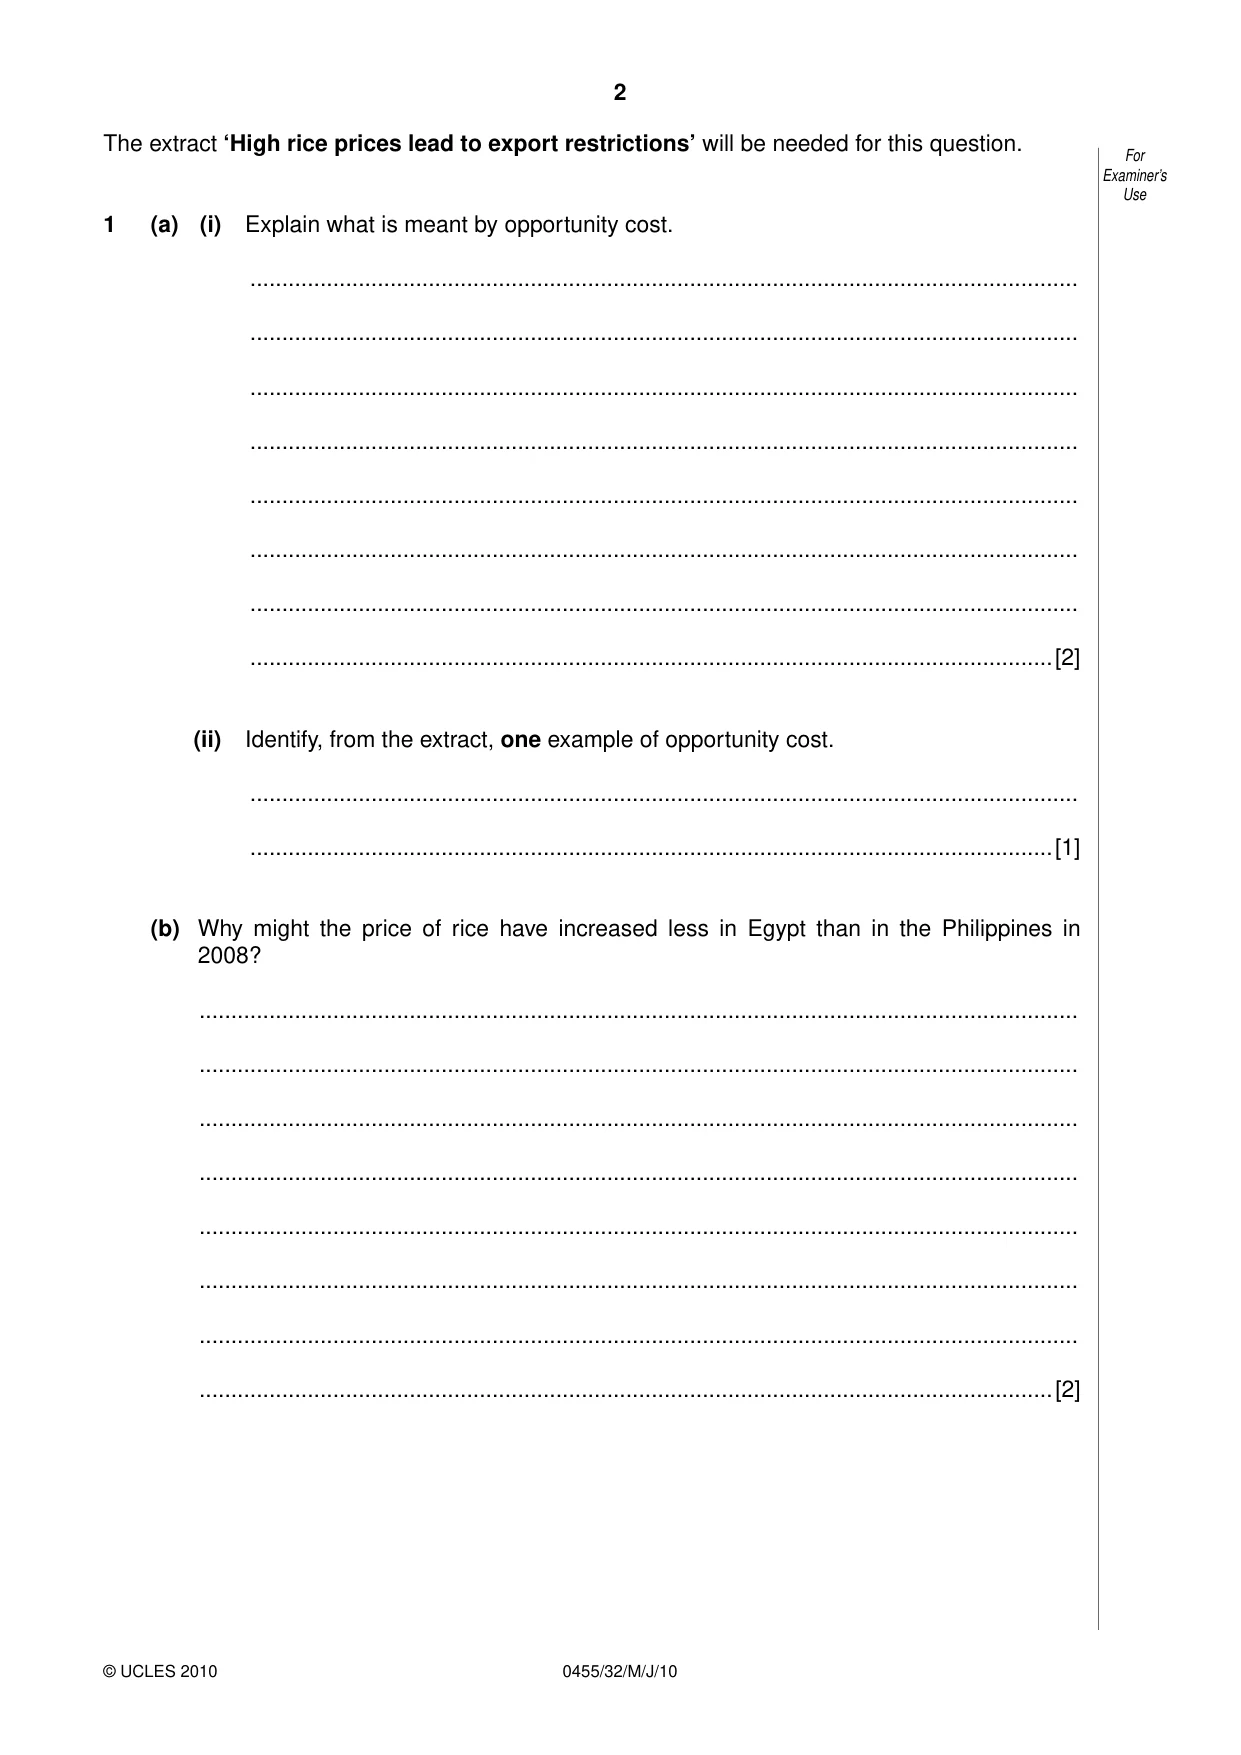
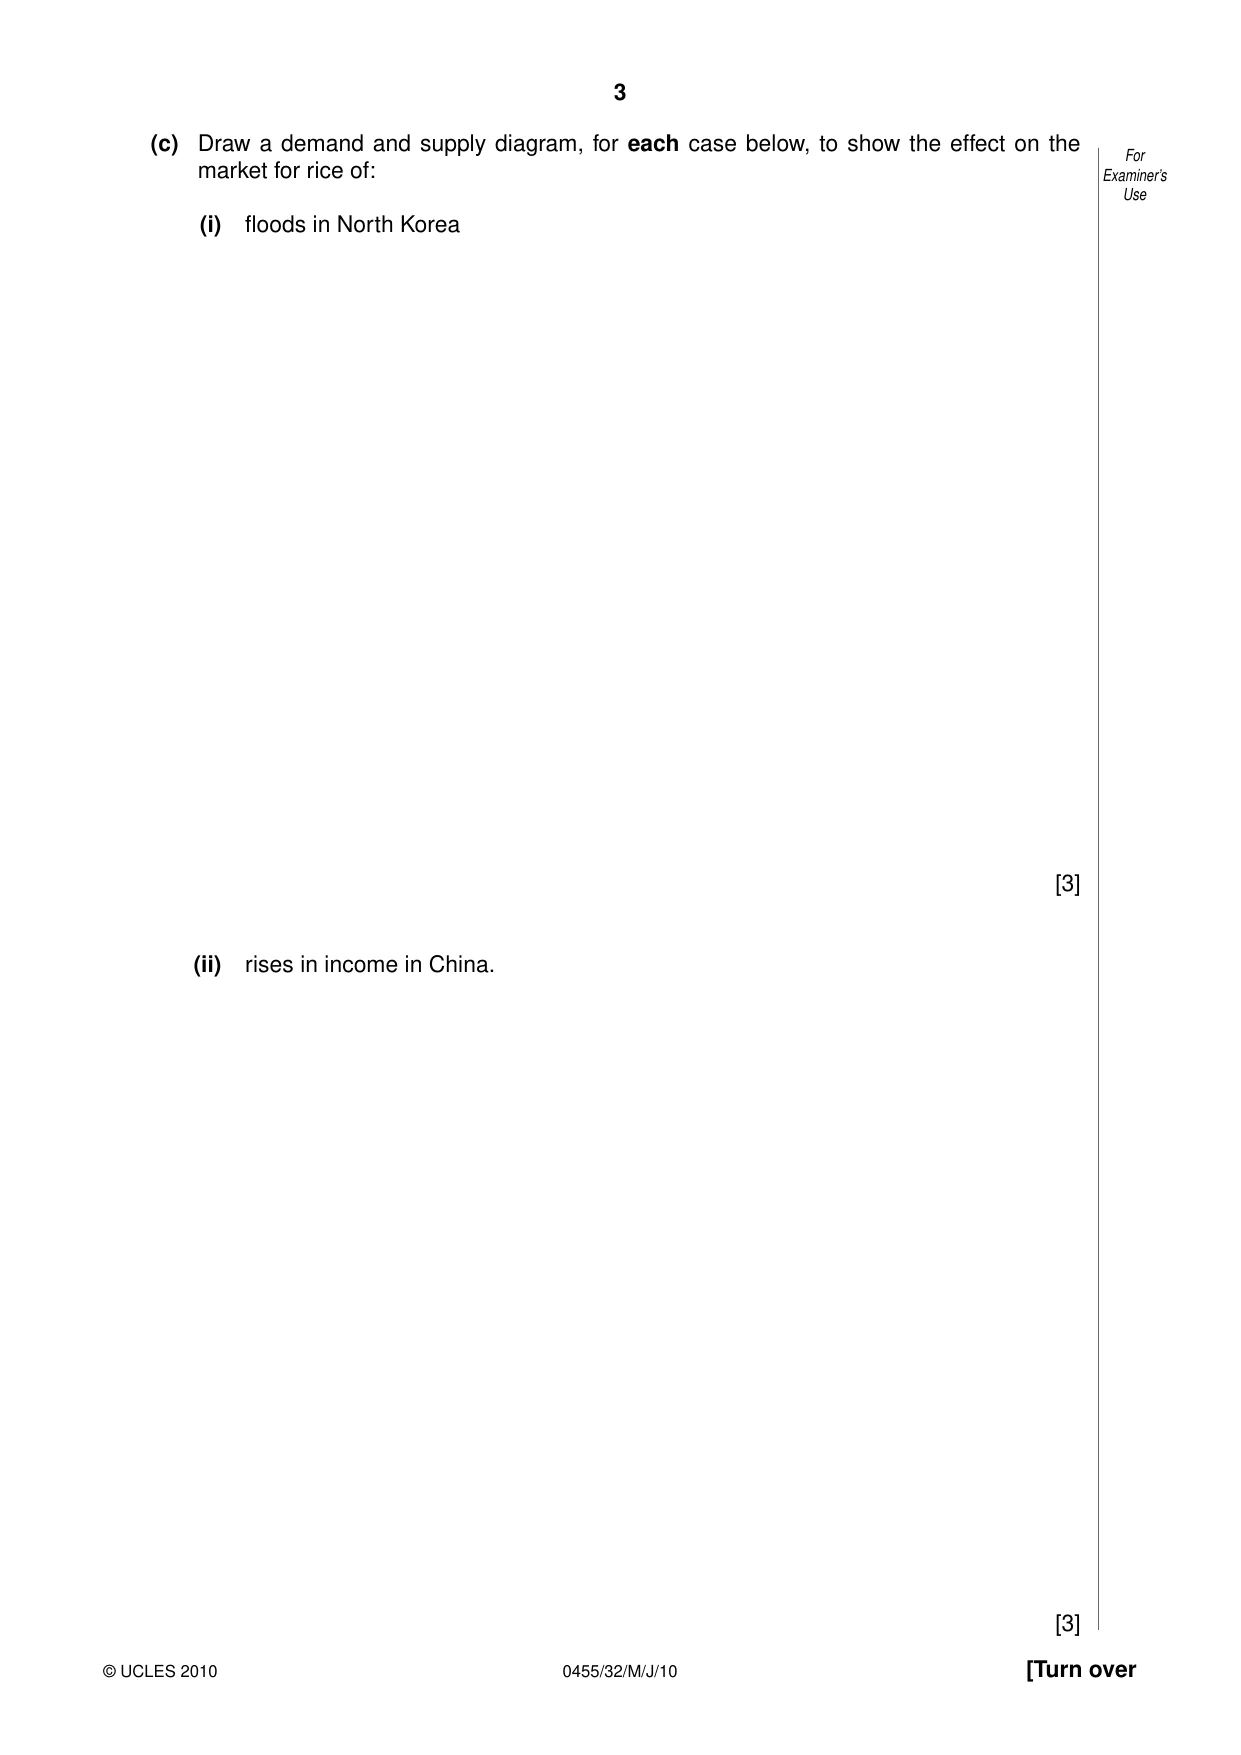
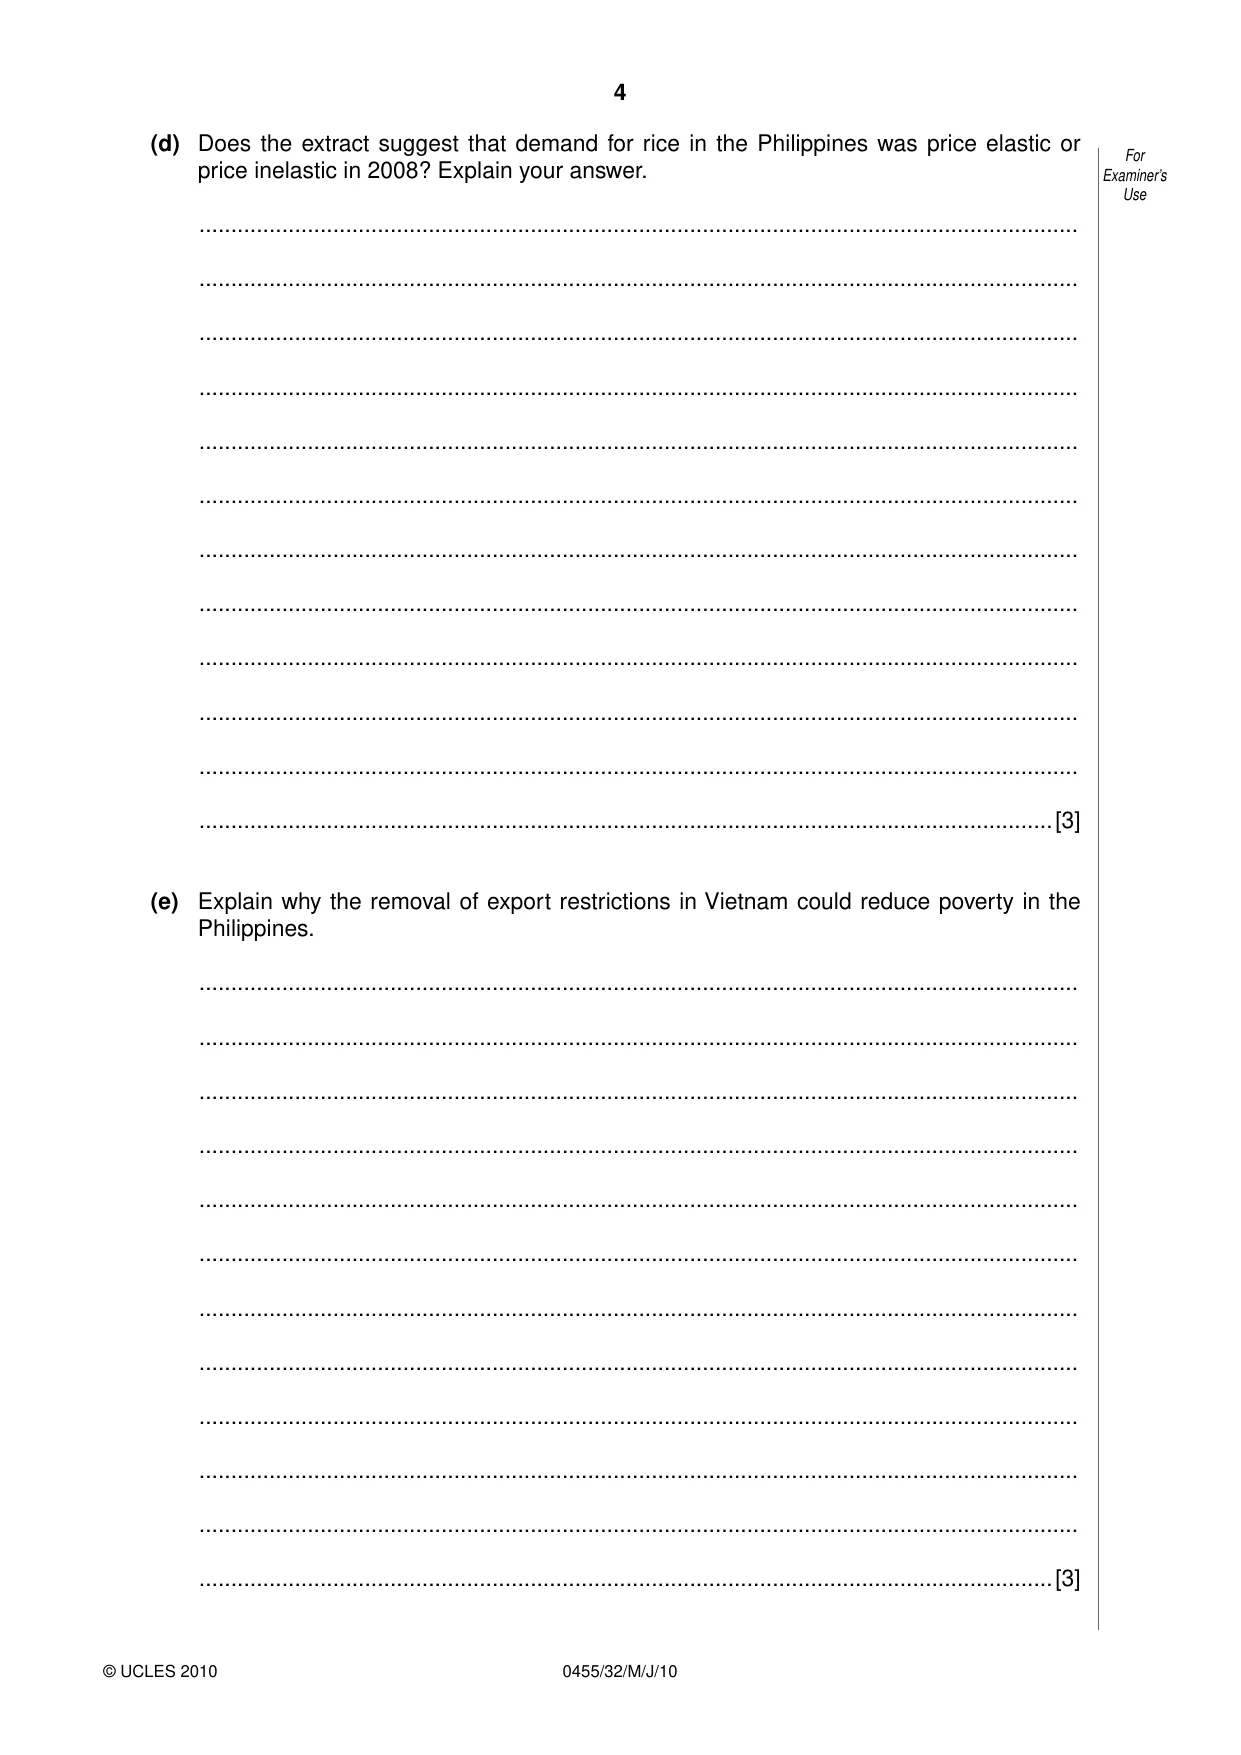
Mark scheme3 pages
Answers below. Sit the paper first if you are practising.
Questions as text
Q1 · Explain what is meant by opportunity cost
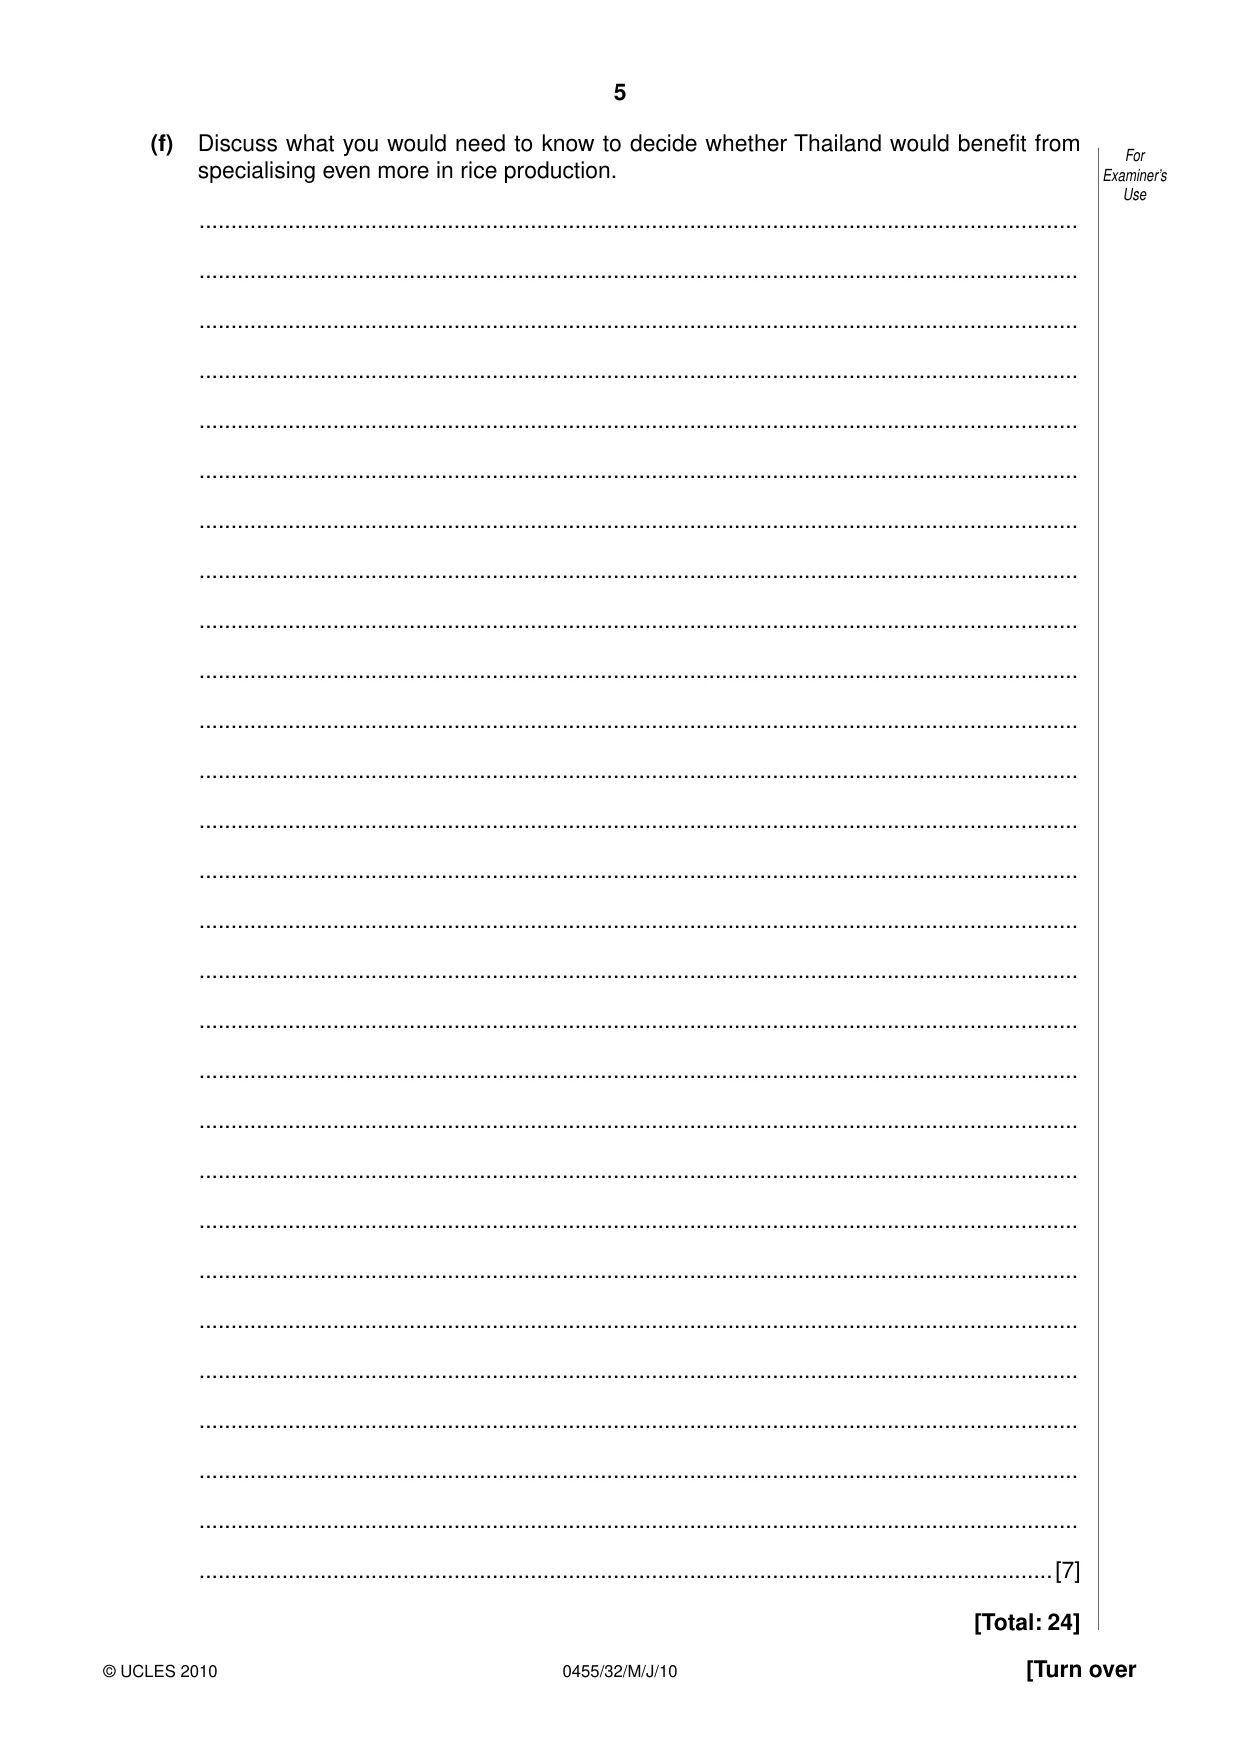
1 (a) (i) Explain what is meant by opportunity cost. .................................................................................................................................. .................................................................................................................................. .................................................................................................................................. .................................................................................................................................. .................................................................................................................................. .................................................................................................................................. .................................................................................................................................. ..............................................................................................................................[2] (ii) Identify, from the extract, one example of opportunity cost. .................................................................................................................................. ..............................................................................................................................[1] (b) Why might the price of rice have increased less in Egypt than in the Philippines in 2008? .......................................................................................................................................... .......................................................................................................................................... .......................................................................................................................................... .......................................................................................................................................... .......................................................................................................................................... .......................................................................................................................................... .......................................................................................................................................... ......................................................................................................................................[2] (c) Draw a demand and supply diagram, for each case below, to show the effect on the market for rice of: (i) floods in North Korea [3] (ii) rises in income in China. [3] (d) Does the extract suggest that demand for rice in the Philippines was price elastic or price inelastic in 2008? Explain your answer. .......................................................................................................................................... .......................................................................................................................................... .......................................................................................................................................... .......................................................................................................................................... .......................................................................................................................................... .......................................................................................................................................... .......................................................................................................................................... .......................................................................................................................................... .......................................................................................................................................... .......................................................................................................................................... .......................................................................................................................................... ......................................................................................................................................[3] (e) Explain why the removal of export restrictions in Vietnam could reduce poverty in the Philippines. .......................................................................................................................................... .......................................................................................................................................... .......................................................................................................................................... .......................................................................................................................................... .......................................................................................................................................... .......................................................................................................................................... .......................................................................................................................................... .......................................................................................................................................... .......................................................................................................................................... .......................................................................................................................................... .......................................................................................................................................... ......................................................................................................................................[3] (f) Discuss what you would need to know to decide whether Thailand would benefit from specialising even more in rice production. .......................................................................................................................................... .......................................................................................................................................... .......................................................................................................................................... .......................................................................................................................................... .......................................................................................................................................... .......................................................................................................................................... .......................................................................................................................................... .......................................................................................................................................... .......................................................................................................................................... .......................................................................................................................................... .......................................................................................................................................... .......................................................................................................................................... .......................................................................................................................................... .......................................................................................................................................... .......................................................................................................................................... .......................................................................................................................................... .......................................................................................................................................... .......................................................................................................................................... .......................................................................................................................................... .......................................................................................................................................... .......................................................................................................................................... .......................................................................................................................................... .......................................................................................................................................... .......................................................................................................................................... .......................................................................................................................................... .......................................................................................................................................... .......................................................................................................................................... ......................................................................................................................................[7] [Total: 24] The extract ‘A social and economic comparison of selected Indian States 2006’ will be needed for this question.
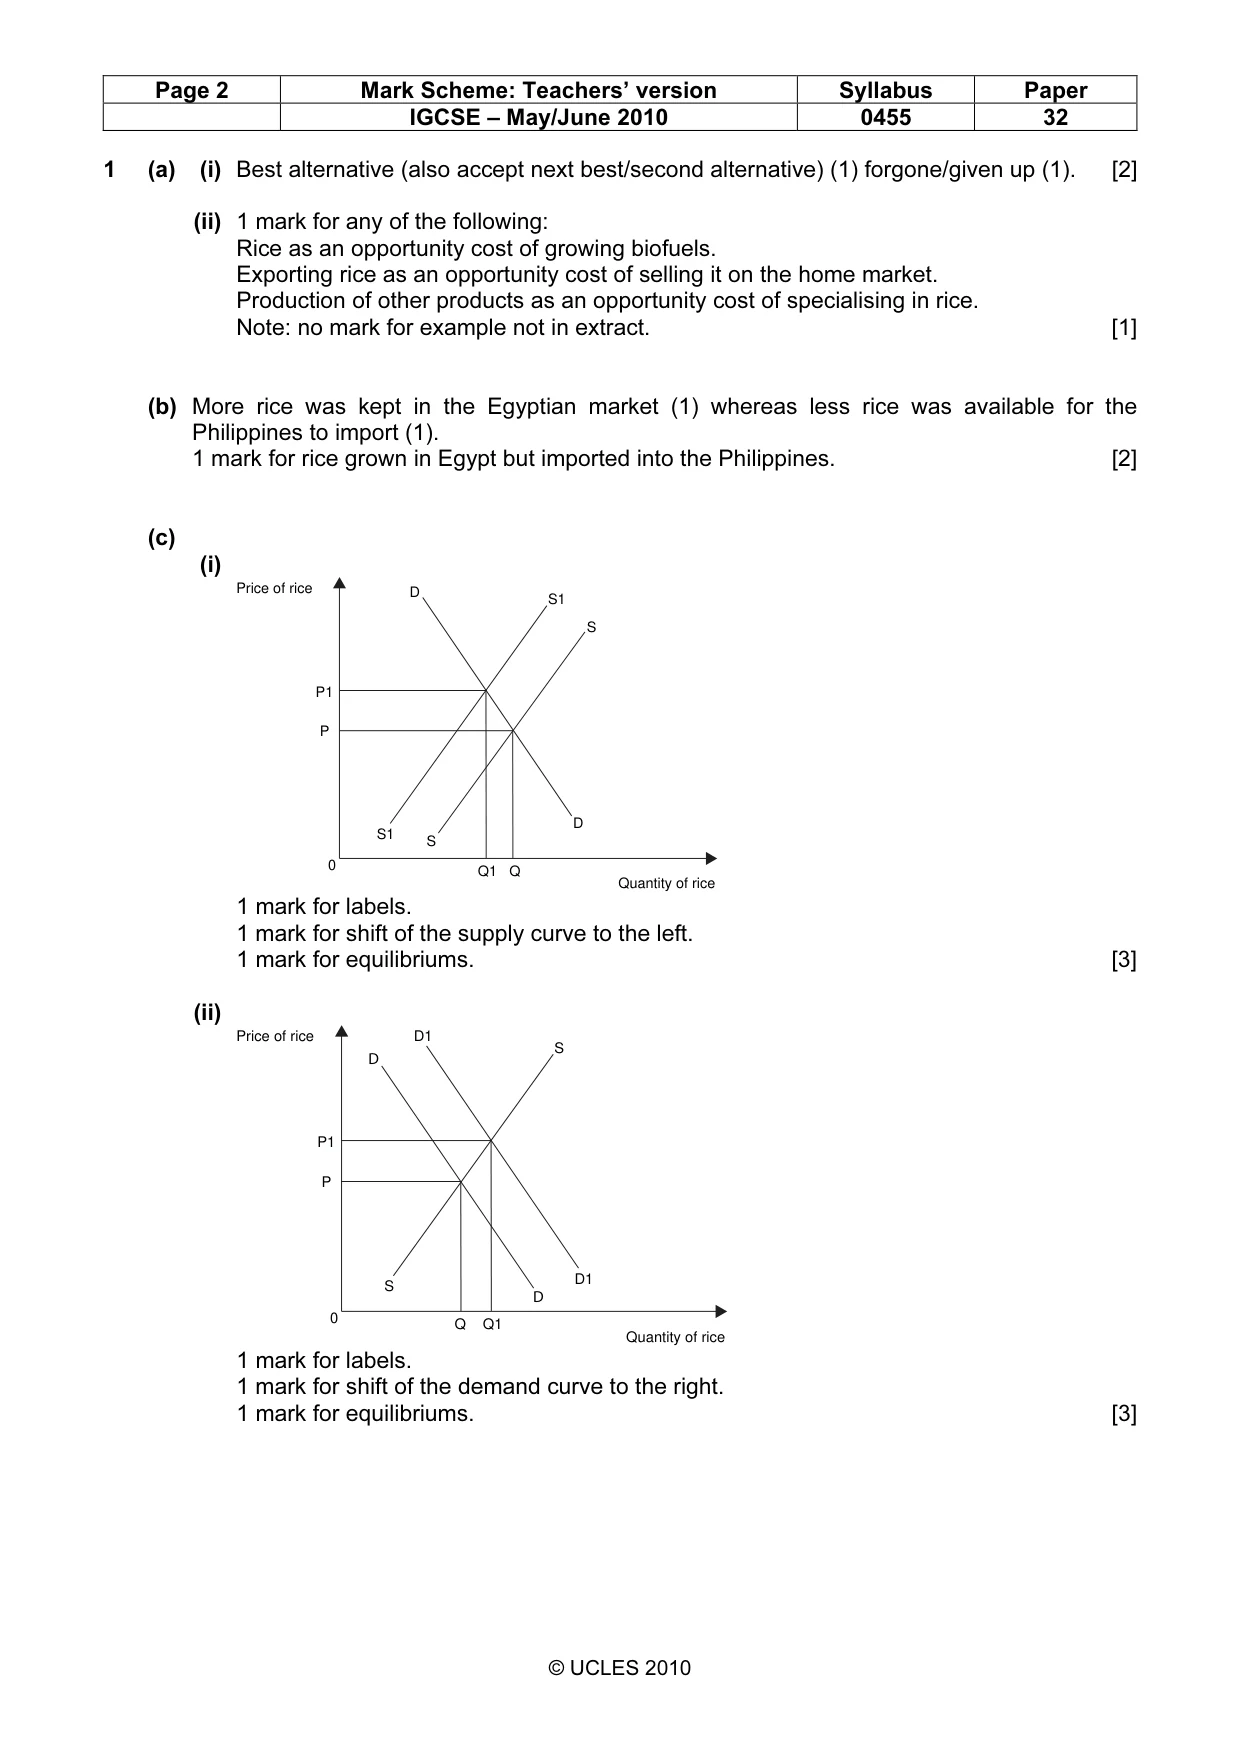
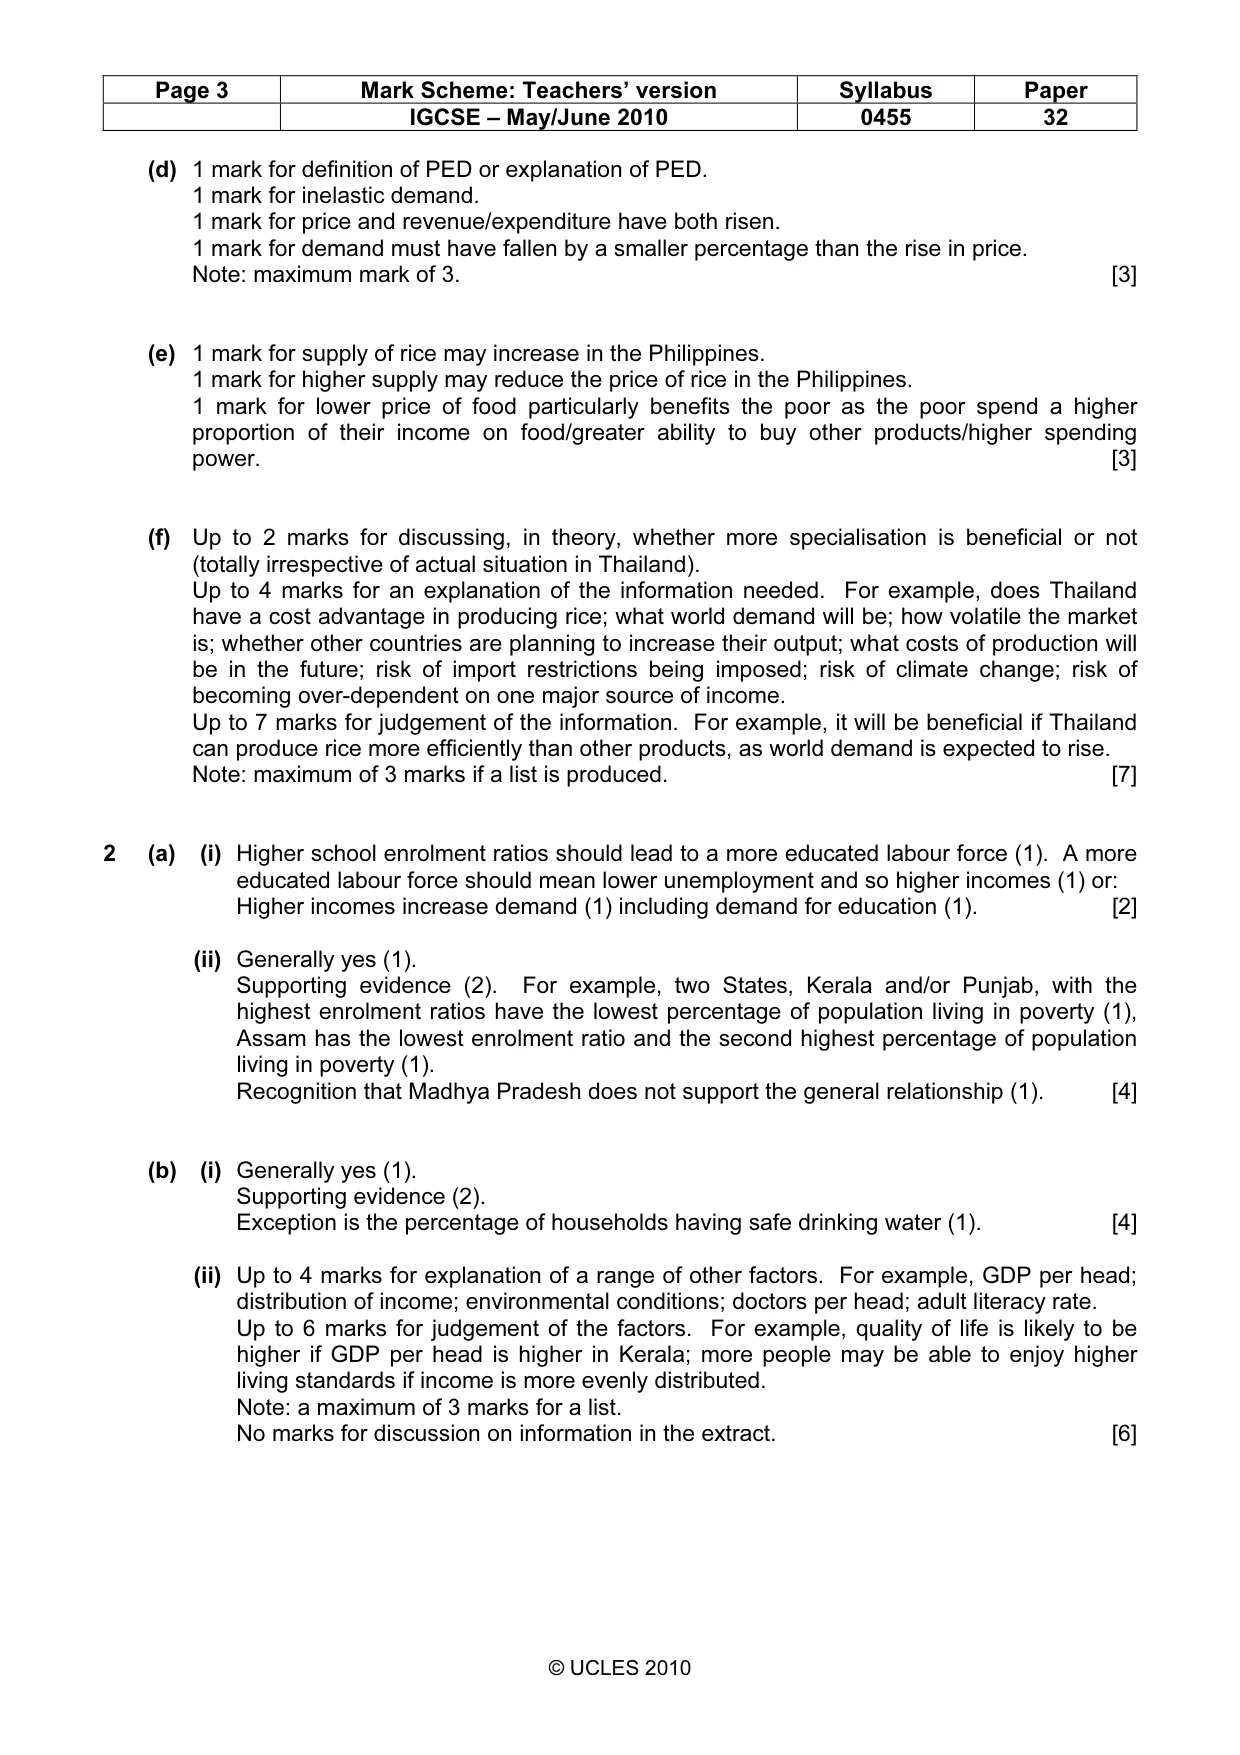
Mark scheme: 1 (a) (i) Best alternative (also accept next best/second alternative) (1) forgone/given up (1). [2] (ii) 1 mark for any of the following: Rice as an opportunity cost of growing biofuels. Exporting rice as an opportunity cost of selling it on the home market. Production of other products as an opportunity cost of specialising in rice. Note: no mark for example not in extract. [1] (b) More rice was kept in the Egyptian market (1) whereas less rice was available for the Philippines to import (1). 1 mark for rice grown in Egypt but imported into the Philippines. [2] (c) (i) Price of rice D S1 S P1 P D S1 S 0 Q1 Q Quantity of rice 1 mark for labels. 1 mark for shift of the supply curve to the left. 1 mark for equilibriums. [3] (ii) Price of rice D1 S D P1 P D1 S D 0 Q Q1 Quantity of rice 1 mark for labels. 1 mark for shift of the demand curve to the right. 1 mark for equilibriums. [3] IGCSE – May/June 2010 0455 32 (d) 1 mark for definition of PED or explanation of PED. 1 mark for inelastic demand. 1 mark for price and revenue/expenditure have both risen. 1 mark for demand must have fallen by a smaller percentage than the rise in price. Note: maximum mark of 3. [3] (e) 1 mark for supply of rice may increase in the Philippines. 1 mark for higher supply may reduce the price of rice in the Philippines. 1 mark for lower price of food particularly benefits the poor as the poor spend a higher proportion of their income on food/greater ability to buy other products/higher spending power. [3] (f) Up to 2 marks for discussing, in theory, whether more specialisation is beneficial or not (totally irrespective of actual situation in Thailand). Up to 4 marks for an explanation of the information needed. For example, does Thailand have a cost advantage in producing rice; what world demand will be; how volatile the market is; whether other countries are planning to increase their output; what costs of production will be in the future; risk of import restrictions being imposed; risk of climate change; risk of becoming over-dependent on one major source of income. Up to 7 marks for judgement of the information. For example, it will be beneficial if Thailand can produce rice more efficiently than other products, as world demand is expected to rise. Note: maximum of 3 marks if a list is produced. [7]
Q2 · Why would economists expect that States with high senior school enrolment ratios would…
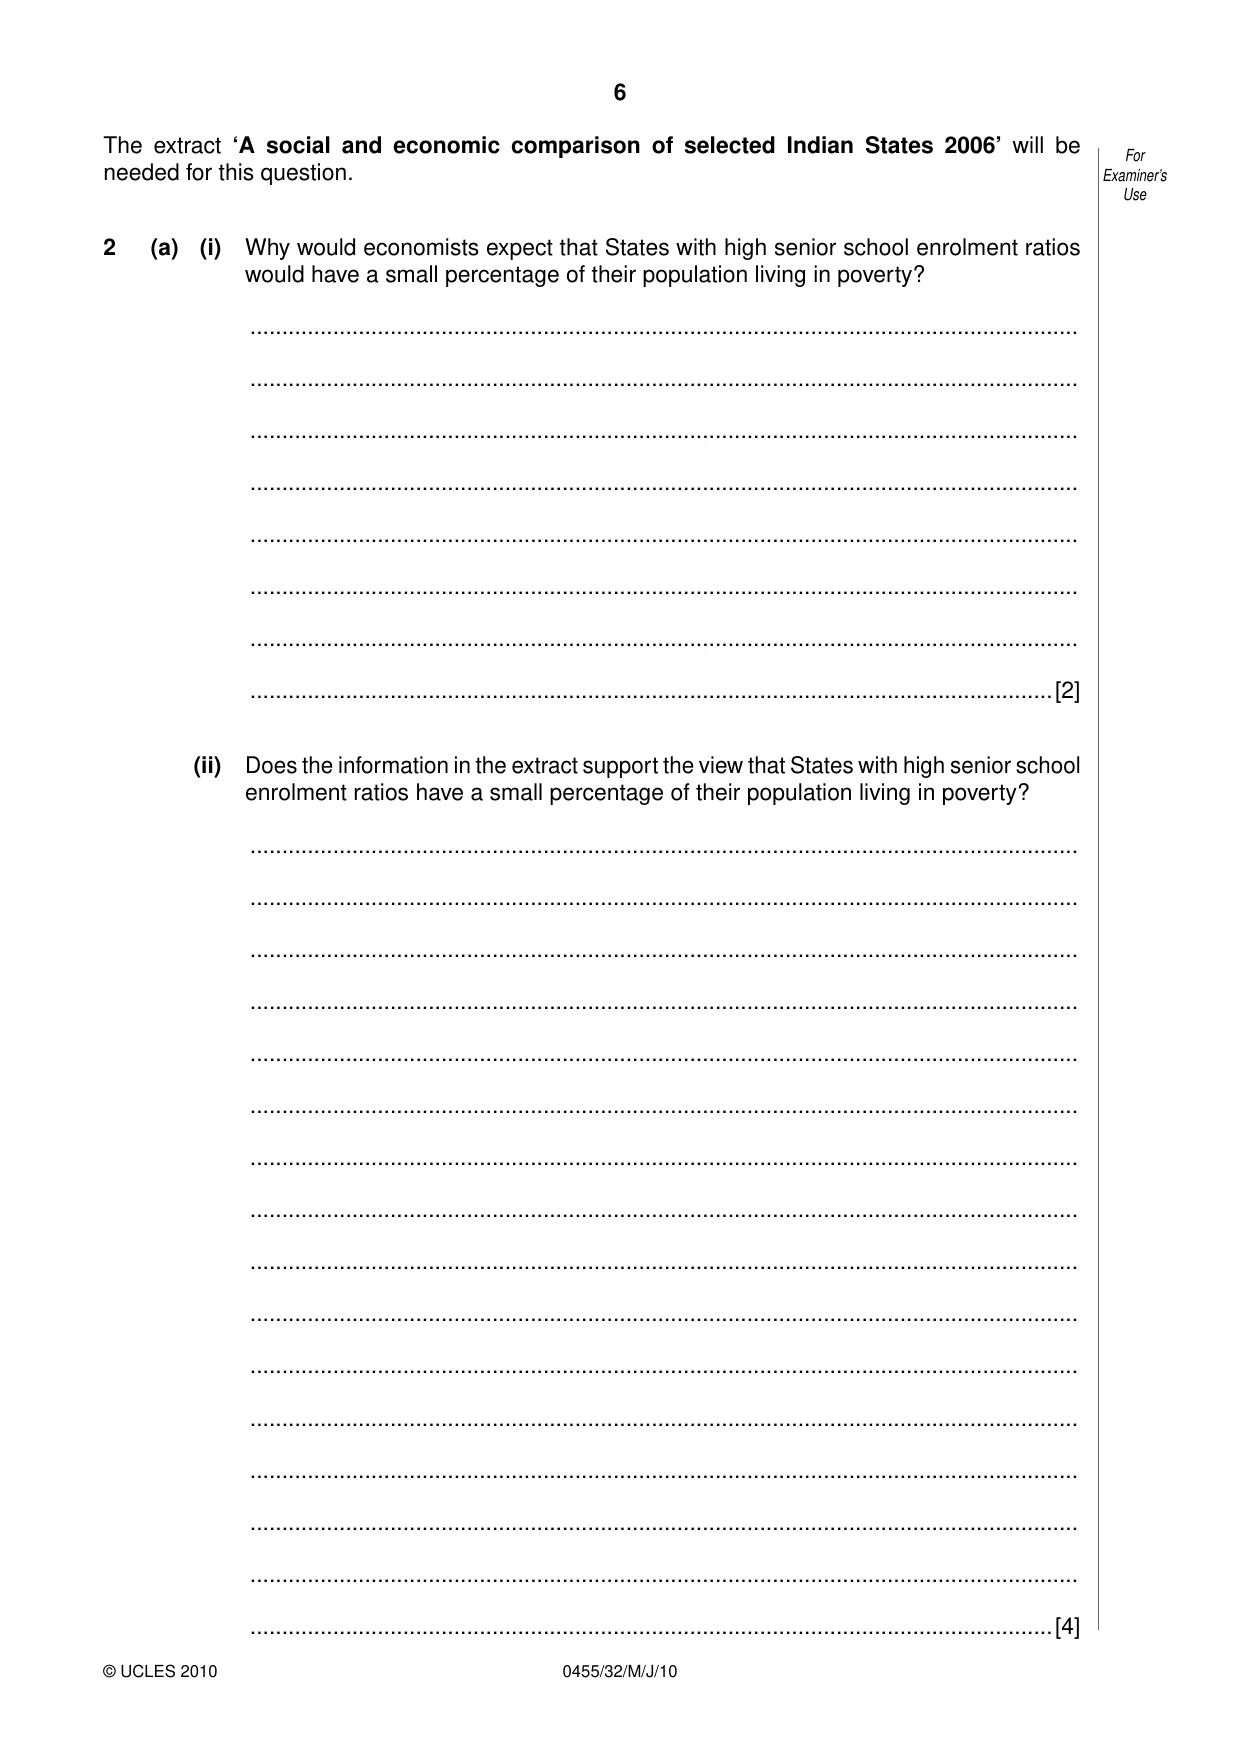
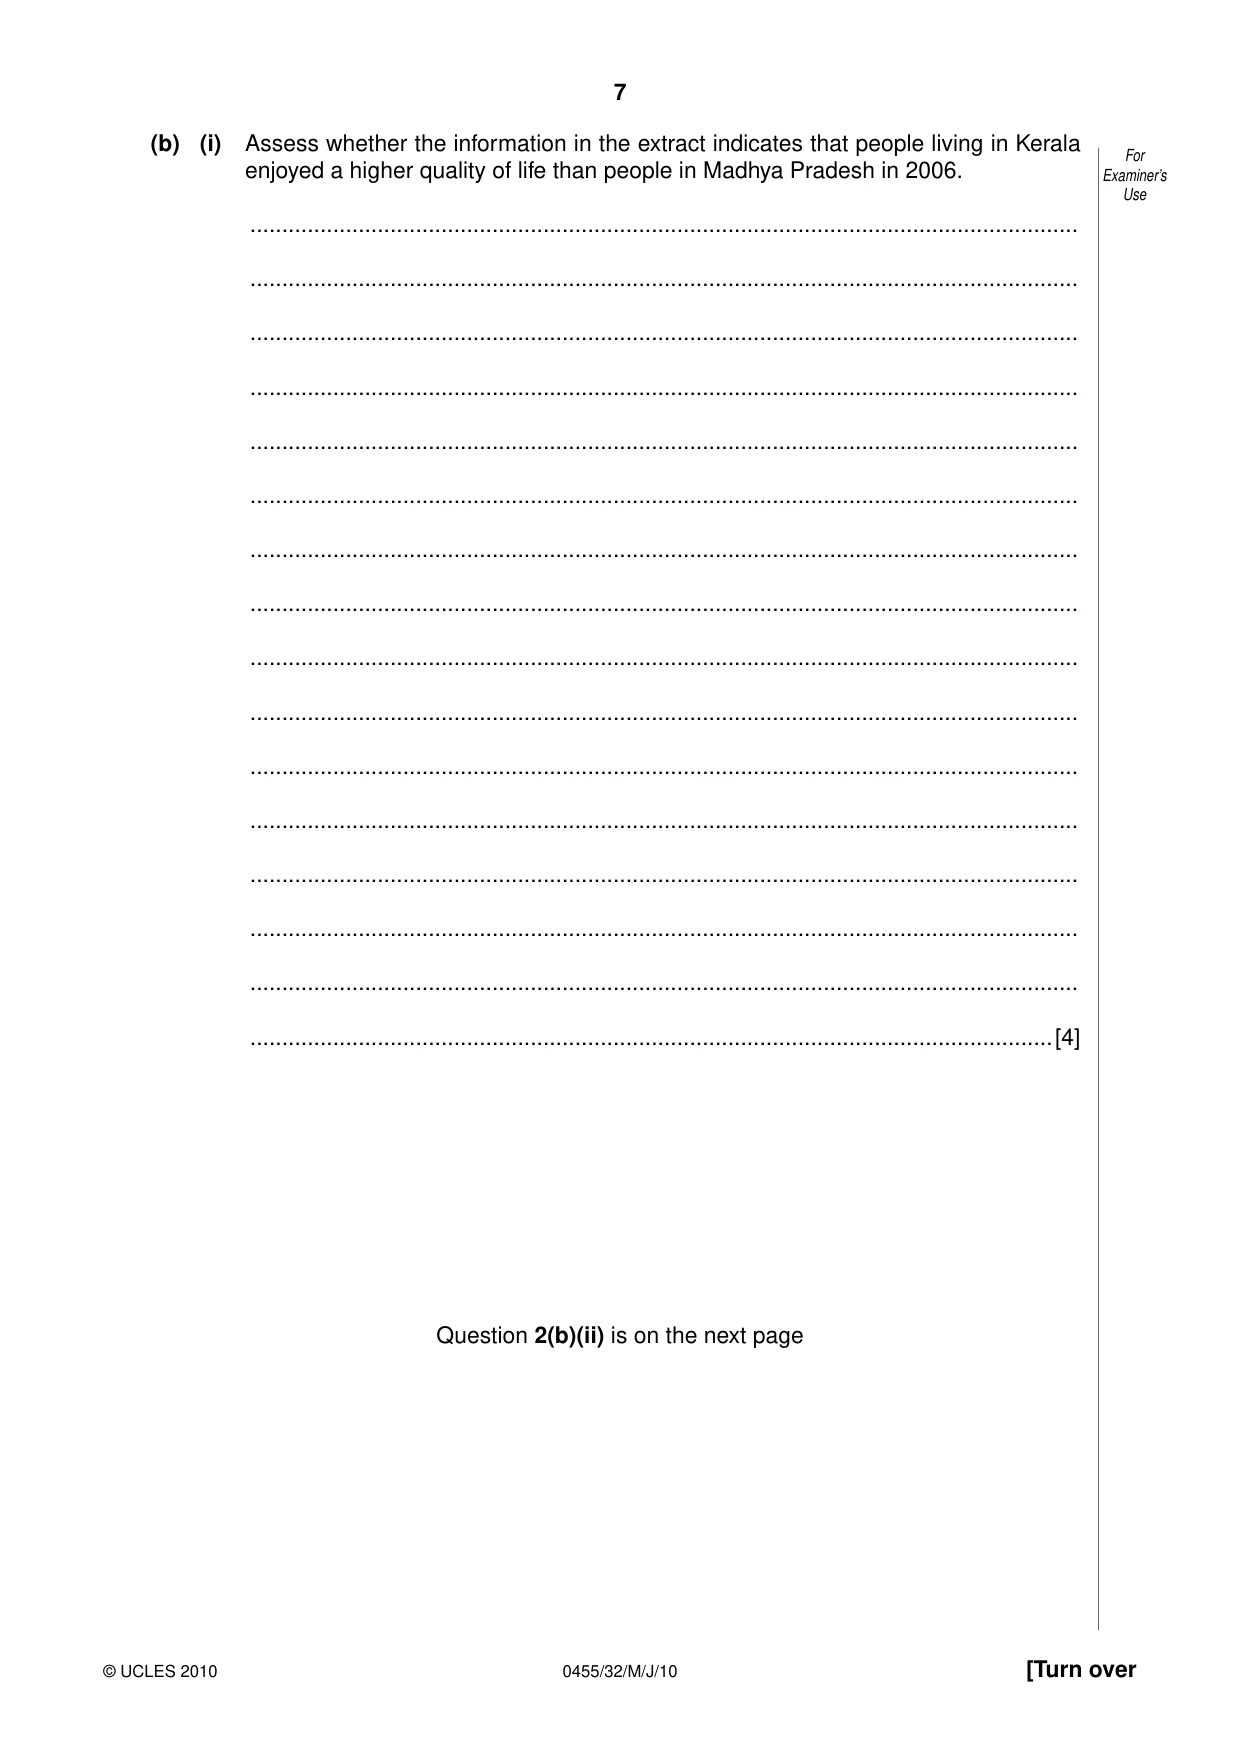
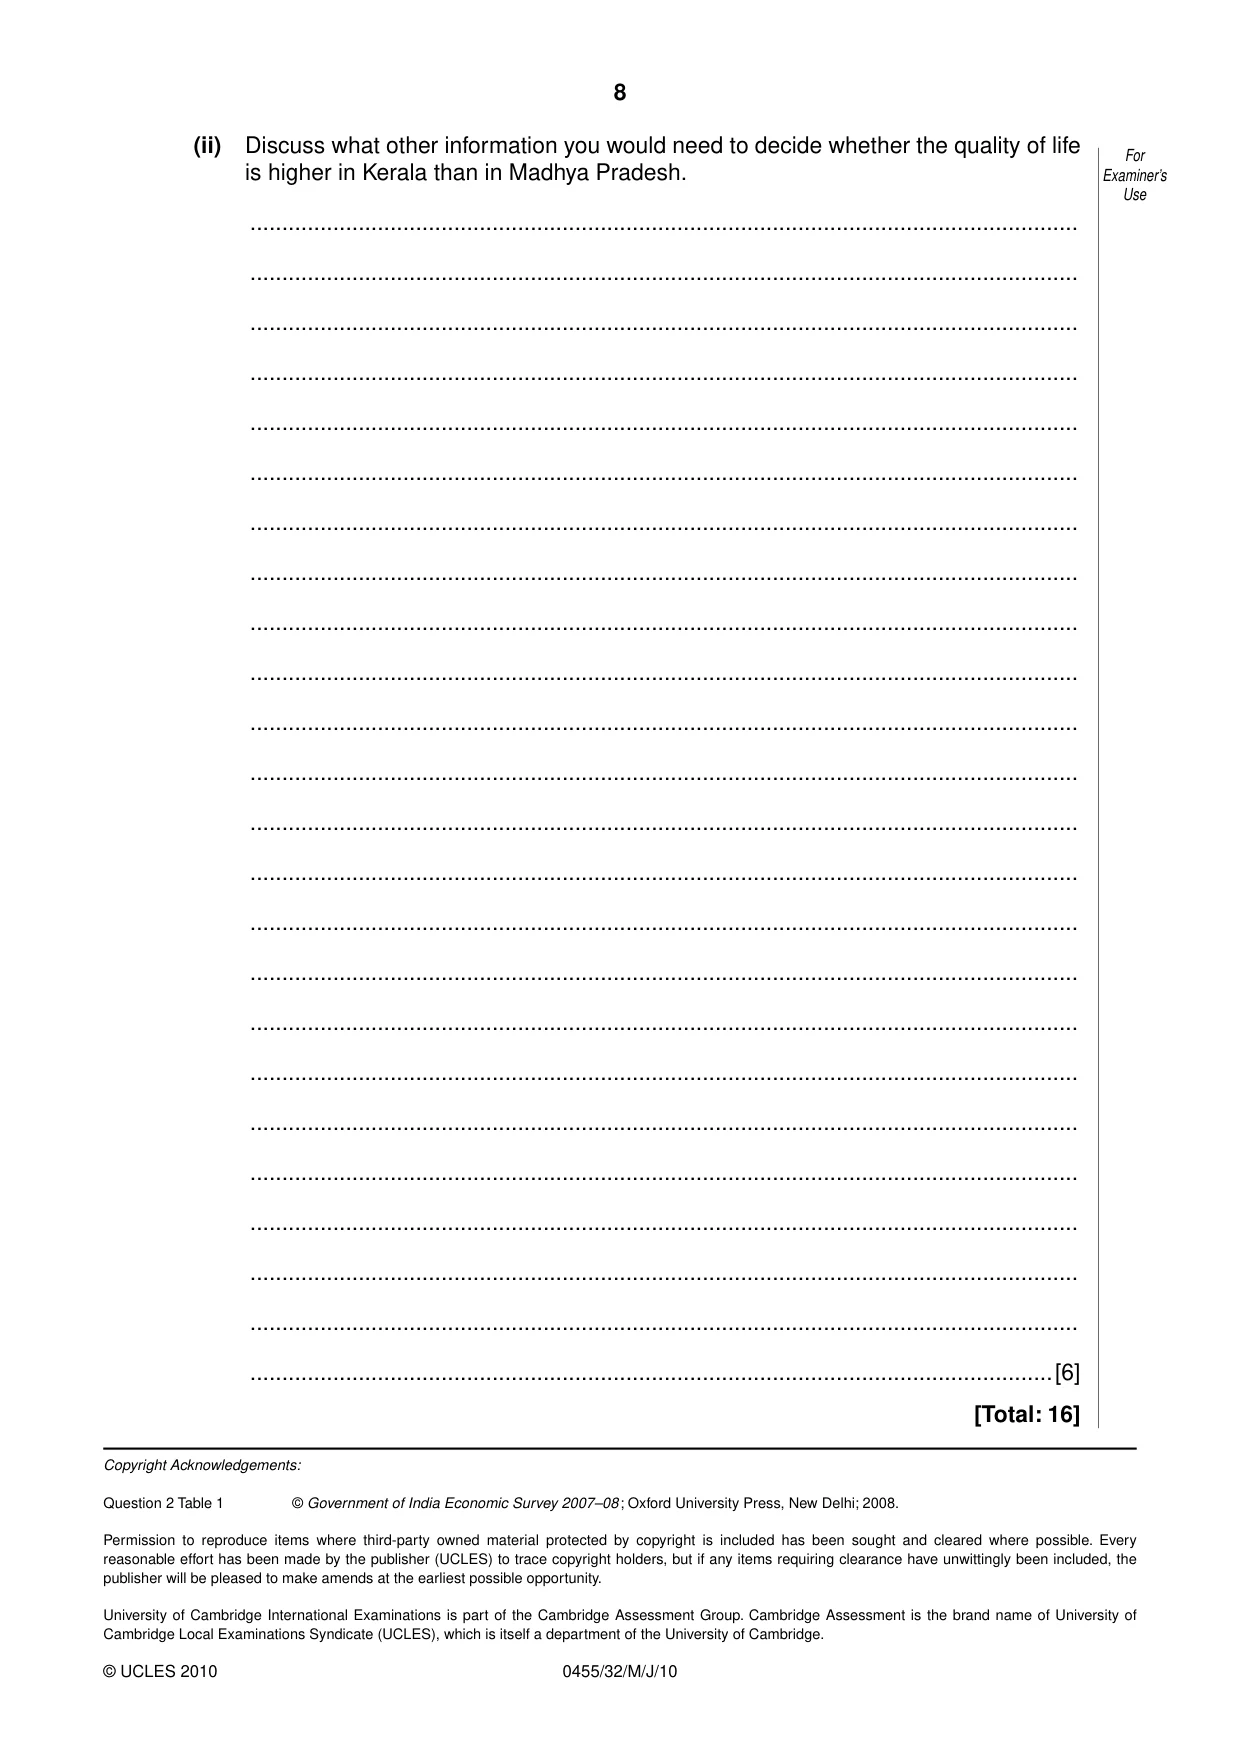
2 (a) (i) Why would economists expect that States with high senior school enrolment ratios would have a small percentage of their population living in poverty? .................................................................................................................................. .................................................................................................................................. .................................................................................................................................. .................................................................................................................................. .................................................................................................................................. .................................................................................................................................. .................................................................................................................................. ..............................................................................................................................[2] (ii) Does the information in the extract support the view that States with high senior school enrolment ratios have a small percentage of their population living in poverty? .................................................................................................................................. .................................................................................................................................. .................................................................................................................................. .................................................................................................................................. .................................................................................................................................. .................................................................................................................................. .................................................................................................................................. .................................................................................................................................. .................................................................................................................................. .................................................................................................................................. .................................................................................................................................. .................................................................................................................................. .................................................................................................................................. .................................................................................................................................. .................................................................................................................................. ..............................................................................................................................[4] (b) (i) Assess whether the information in the extract indicates that people living in Kerala enjoyed a higher quality of life than people in Madhya Pradesh in 2006. .................................................................................................................................. .................................................................................................................................. .................................................................................................................................. .................................................................................................................................. .................................................................................................................................. .................................................................................................................................. .................................................................................................................................. .................................................................................................................................. .................................................................................................................................. .................................................................................................................................. .................................................................................................................................. .................................................................................................................................. .................................................................................................................................. .................................................................................................................................. .................................................................................................................................. ..............................................................................................................................[4] Question 2(b)(ii) is on the next page (ii) Discuss what other information you would need to decide whether the quality of life is higher in Kerala than in Madhya Pradesh. .................................................................................................................................. .................................................................................................................................. .................................................................................................................................. .................................................................................................................................. .................................................................................................................................. .................................................................................................................................. .................................................................................................................................. .................................................................................................................................. .................................................................................................................................. .................................................................................................................................. .................................................................................................................................. .................................................................................................................................. .................................................................................................................................. .................................................................................................................................. .................................................................................................................................. .................................................................................................................................. .................................................................................................................................. .................................................................................................................................. .................................................................................................................................. .................................................................................................................................. .................................................................................................................................. .................................................................................................................................. .................................................................................................................................. ..............................................................................................................................[6] [Total: 16]
Mark scheme: 2 (a) (i) Higher school enrolment ratios should lead to a more educated labour force (1). A more educated labour force should mean lower unemployment and so higher incomes (1) or: Higher incomes increase demand (1) including demand for education (1). [2] (ii) Generally yes (1). Supporting evidence (2). For example, two States, Kerala and/or Punjab, with the highest enrolment ratios have the lowest percentage of population living in poverty (1), Assam has the lowest enrolment ratio and the second highest percentage of population living in poverty (1). Recognition that Madhya Pradesh does not support the general relationship (1). [4] (b) (i) Generally yes (1). Supporting evidence (2). Exception is the percentage of households having safe drinking water (1). [4] (ii) Up to 4 marks for explanation of a range of other factors. For example, GDP per head; distribution of income; environmental conditions; doctors per head; adult literacy rate. Up to 6 marks for judgement of the factors. For example, quality of life is likely to be higher if GDP per head is higher in Kerala; more people may be able to enjoy higher living standards if income is more evenly distributed. Note: a maximum of 3 marks for a list. No marks for discussion on information in the extract. [6]
What was in this paper
The subtopics covered by these 2 questions, and how many questions each got. Open one in a new tab to see every Cambridge question on it.
What you needed in this session
Cambridge’s own grade thresholds for 2010 May/June, Paper 3 · Variant 2. A higher threshold means an easier paper — the bar moves with how the cohort did.