Cambridge IGCSE Economics 0455 — 2008 May/June Paper 6 · Variant 1
0455/61/M/J/08 · 2 questions · 40 marks · ≈45 min
The question paper and its mark scheme, free to read here and free to download. This is Cambridge’s own paper, exactly as it was sat.
Question paper4 pages


Mark scheme2 pages
Answers below. Sit the paper first if you are practising.
Questions as text
Q1 · India’s Postal Service Each year in India 16 billion items of post (mail) are sent
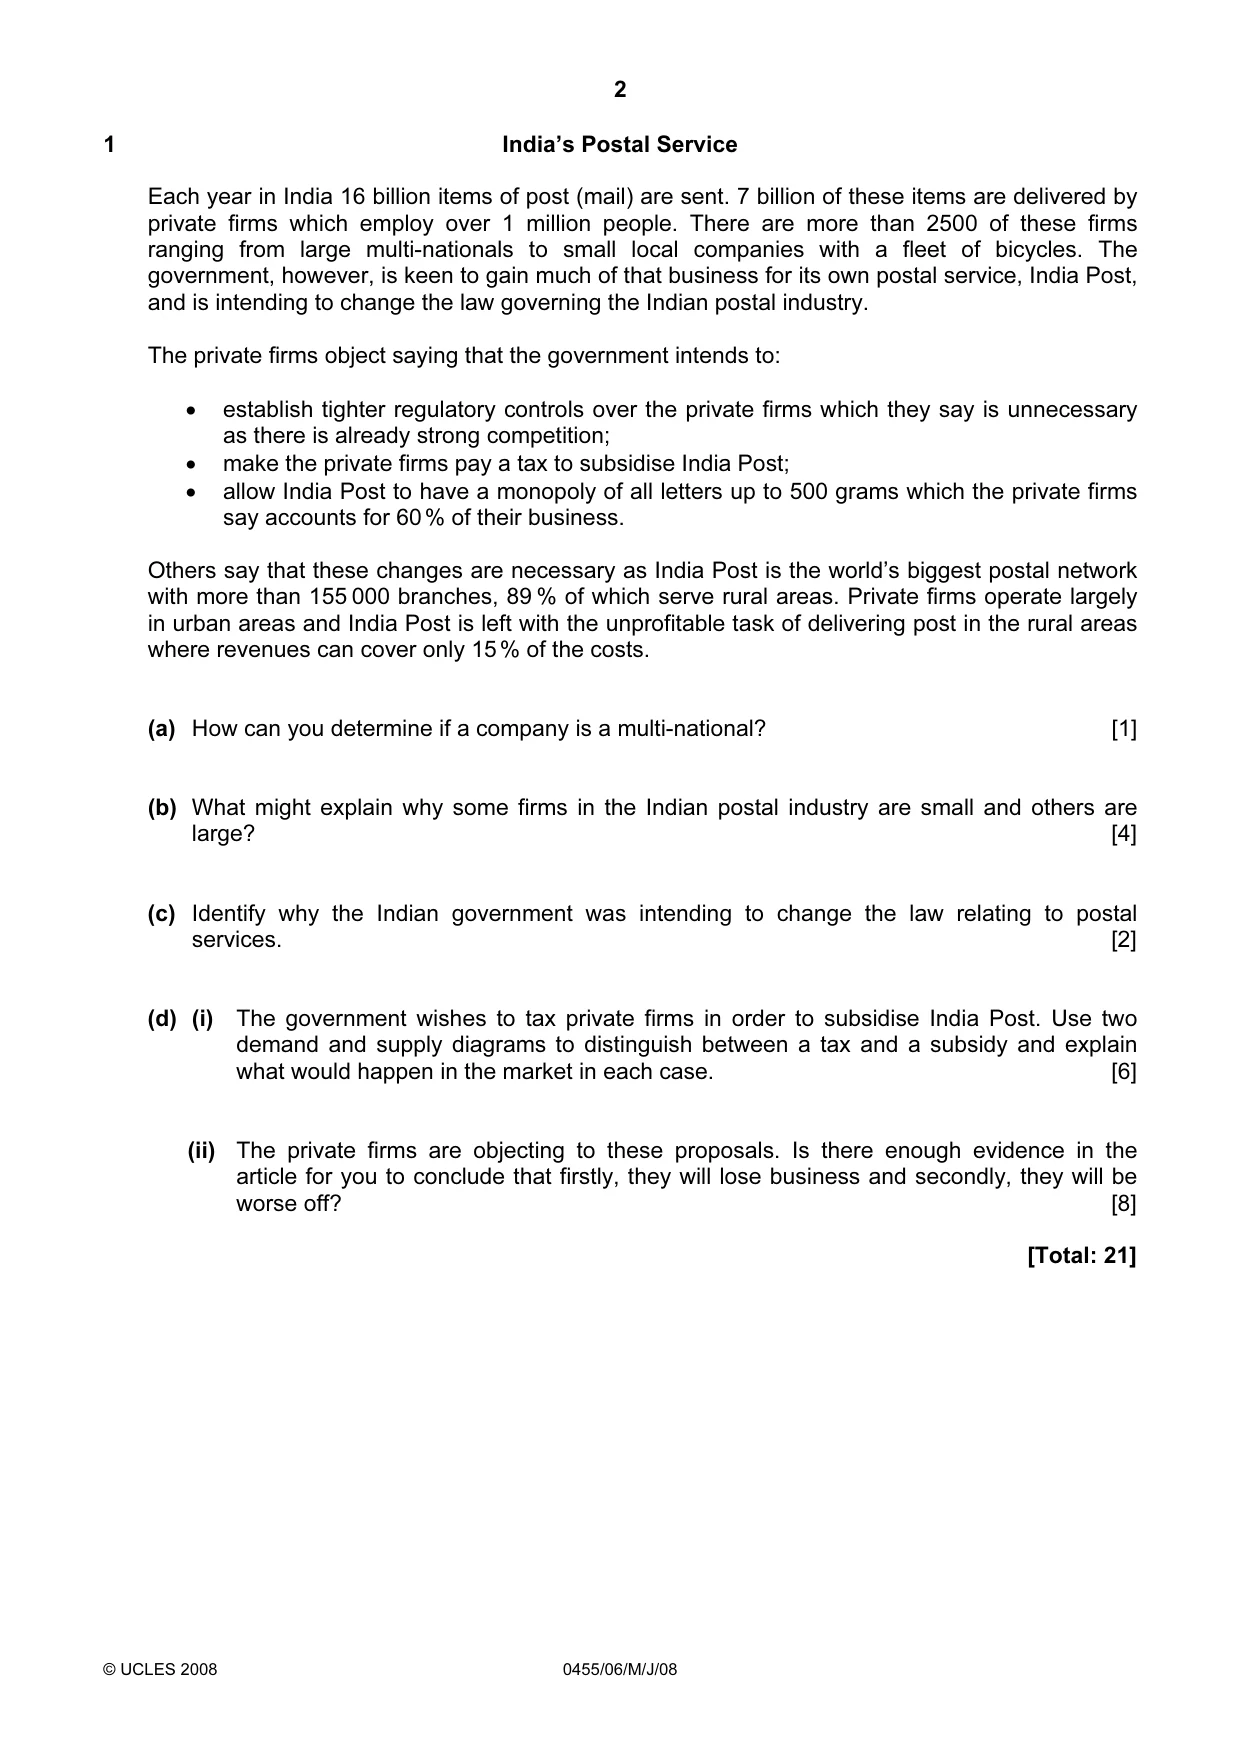
1 India’s Postal Service Each year in India 16 billion items of post (mail) are sent. 7 billion of these items are delivered by private firms which employ over 1 million people. There are more than 2500 of these firms ranging from large multi-nationals to small local companies with a fleet of bicycles. The government, however, is keen to gain much of that business for its own postal service, India Post, and is intending to change the law governing the Indian postal industry. The private firms object saying that the government intends to: • establish tighter regulatory controls over the private firms which they say is unnecessary as there is already strong competition; • make the private firms pay a tax to subsidise India Post; • allow India Post to have a monopoly of all letters up to 500 grams which the private firms say accounts for 60 % of their business. Others say that these changes are necessary as India Post is the world’s biggest postal network with more than 155 000 branches, 89 % of which serve rural areas. Private firms operate largely in urban areas and India Post is left with the unprofitable task of delivering post in the rural areas where revenues can cover only 15 % of the costs. (a) How can you determine if a company is a multi-national? [1] (b) What might explain why some firms in the Indian postal industry are small and others are large? [4] (c) Identify why the Indian government was intending to change the law relating to postal services. [2] (d) (i) The government wishes to tax private firms in order to subsidise India Post. Use two demand and supply diagrams to distinguish between a tax and a subsidy and explain what would happen in the market in each case. [6] (ii) The private firms are objecting to these proposals. Is there enough evidence in the article for you to conclude that firstly, they will lose business and secondly, they will be worse off? [8] [Total: 21]
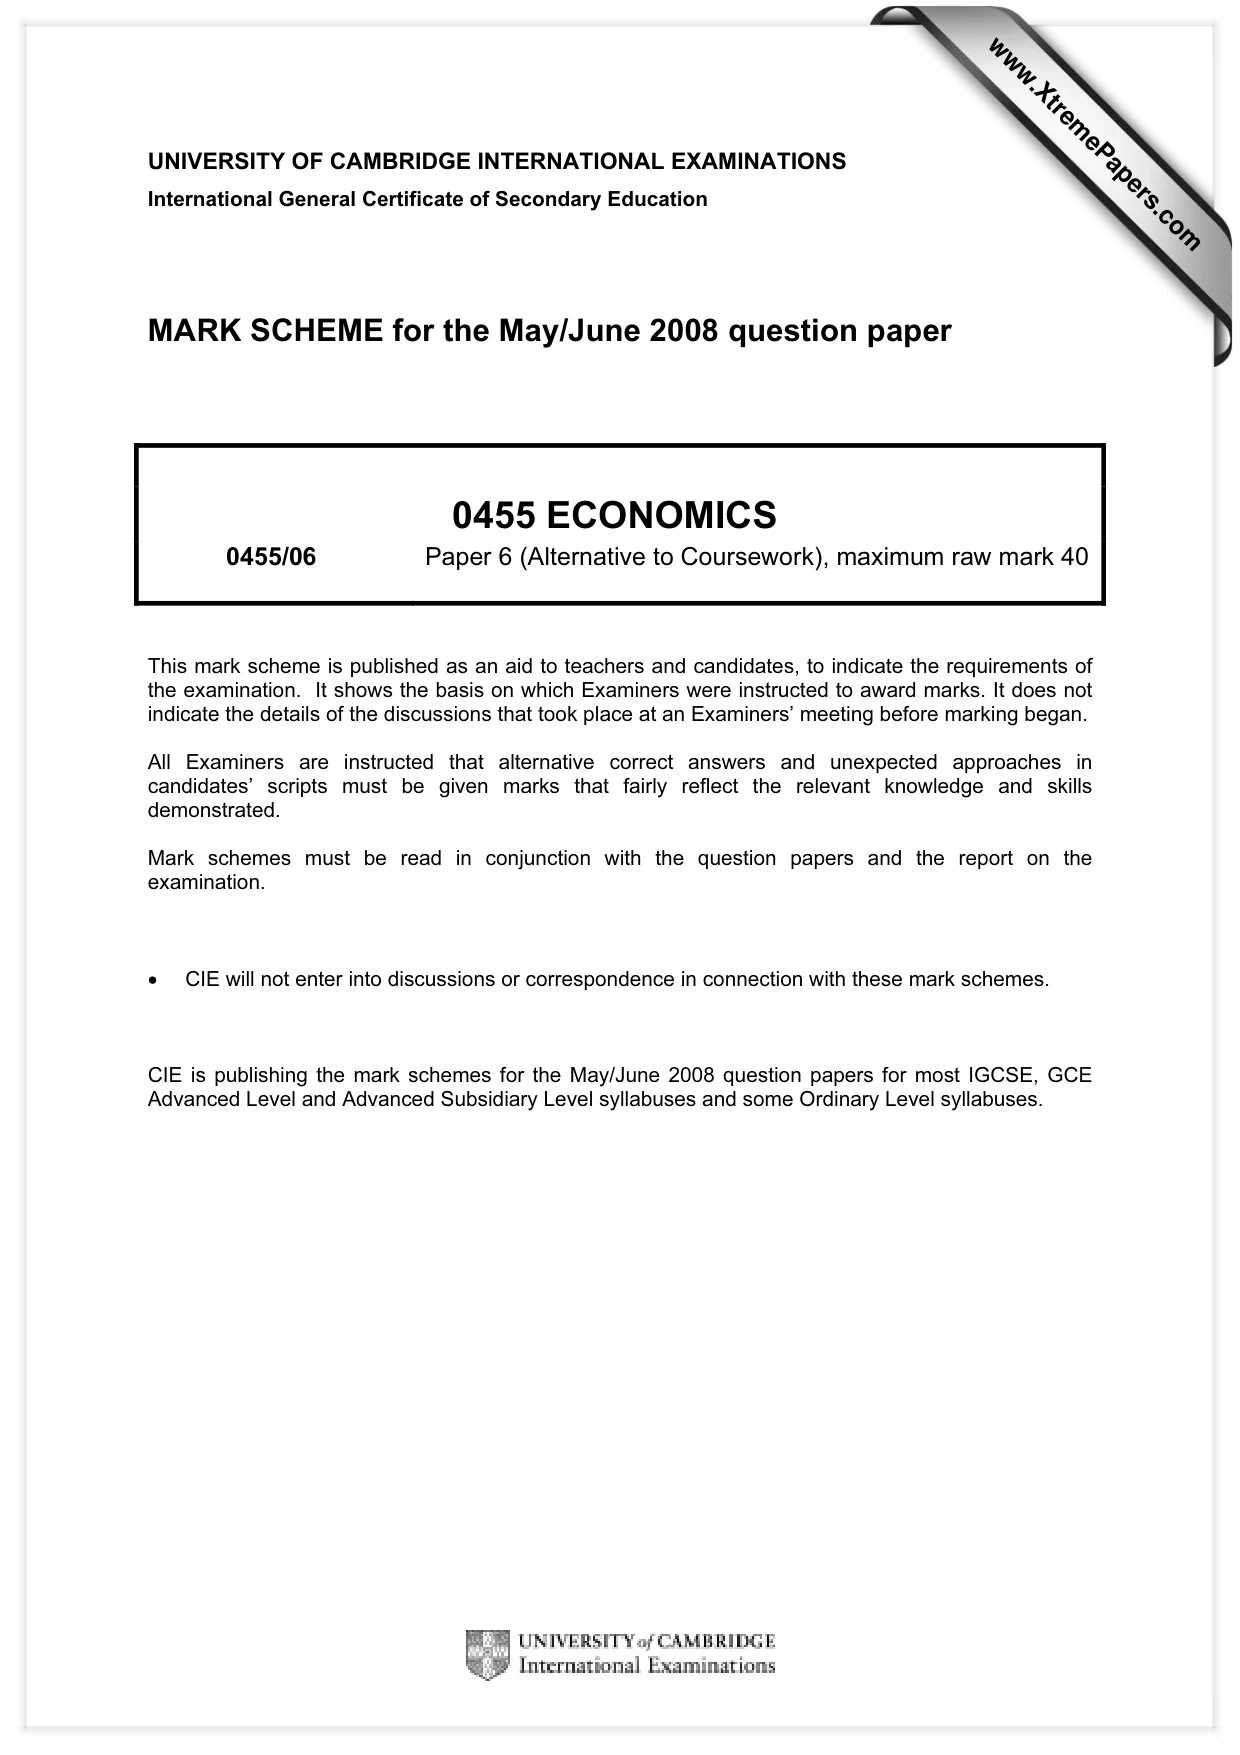
Mark scheme: 1 (a) Consider if the company produces and owns facilities in another country. [1] (b) Size of market, area covered, whether they have organised themselves to operate in large area, whether they were able to raise the necessary finance. [4] (c) Its deliveries were mainly to rural areas (89%) and on average these covered only 15% of the cost. The implication is that the government wishes to gain more revenue. [2] (d) (i) 1 mark for labels, 1 mark for shift of supply for tax, 1 mark for shift for subsidy. 1 mark for showing new equilibrium prices, 2 marks for explanation. [6] (ii) They may not lose business as they may operate in a different area. But even if they keep their business they are likely, initially, to be worse off unless their revenue increases. They may, however, have power to increase their charges and revenue will increase. Whether this happens could depend on the extent of the competition in the industry. They say there is competition and so increases in charges might not be very high. However, there are also proposals for greater regulation, and for allowing India Post a monopoly over some letters. If these are also implemented then they are likely to be worse off. Candidates should form a conclusion even if that is said to be uncertain. No conclusion, maximum of 7 marks. [8]
Q2 · Economic Indicators The table gives some information on Gross Domestic Product (GDP), GDP…
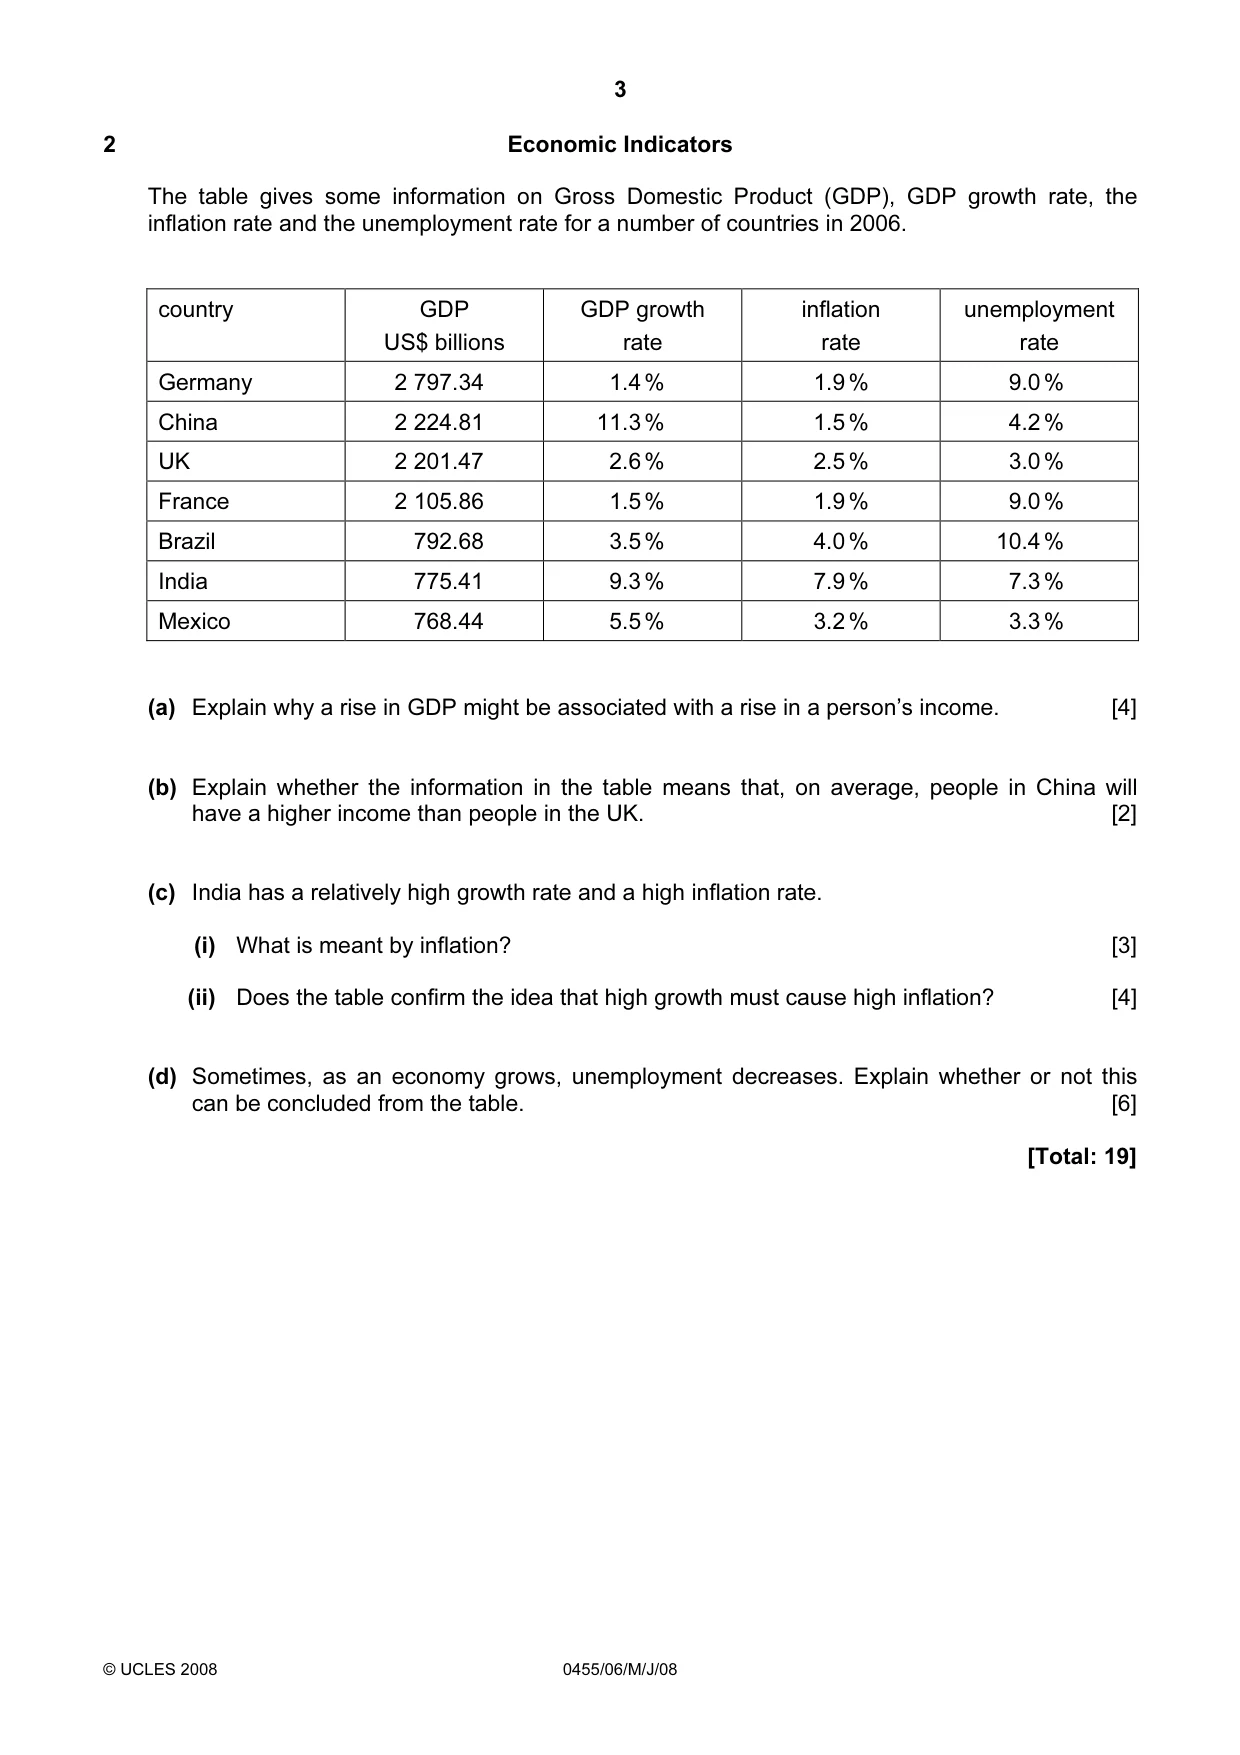
2 Economic Indicators The table gives some information on Gross Domestic Product (GDP), GDP growth rate, the inflation rate and the unemployment rate for a number of countries in 2006. country GDP GDP growth inflation unemployment US$ billions rate rate rate Germany 2 797.34 1.4 % 1.9 % 9.0 % China 2 224.81 11.3 % 1.5 % 4.2 % UK 2 201.47 2.6 % 2.5 % 3.0 % France 2 105.86 1.5 % 1.9 % 9.0 % Brazil 792.68 3.5 % 4.0 % 10.4 % India 775.41 9.3 % 7.9 % 7.3 % Mexico 768.44 5.5 % 3.2 % 3.3 % (a) Explain why a rise in GDP might be associated with a rise in a person’s income. [4] (b) Explain whether the information in the table means that, on average, people in China will have a higher income than people in the UK. [2] (c) India has a relatively high growth rate and a high inflation rate. (i) What is meant by inflation? [3] (ii) Does the table confirm the idea that high growth must cause high inflation? [4] (d) Sometimes, as an economy grows, unemployment decreases. Explain whether or not this can be concluded from the table. [6] [Total: 19]
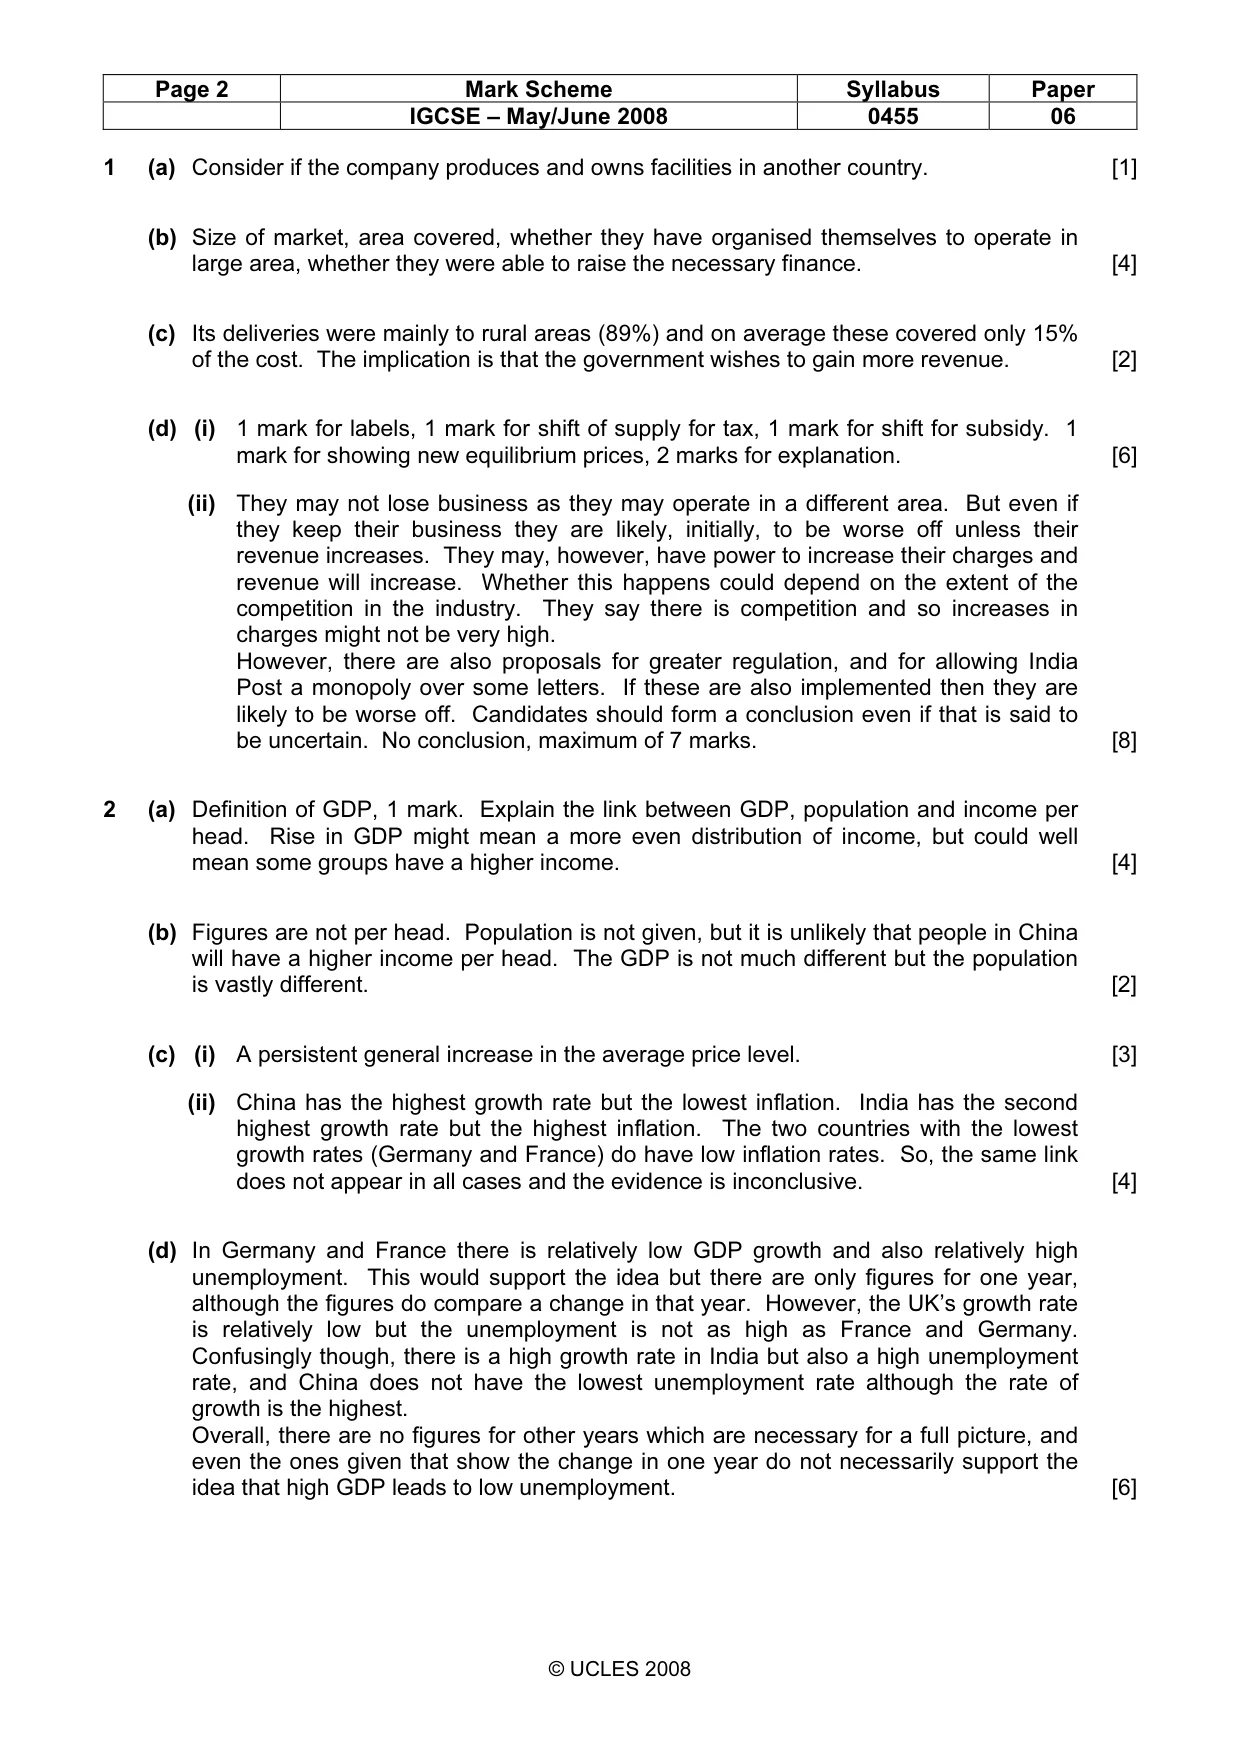
Mark scheme: 2 (a) Definition of GDP, 1 mark. Explain the link between GDP, population and income per head. Rise in GDP might mean a more even distribution of income, but could well mean some groups have a higher income. [4] (b) Figures are not per head. Population is not given, but it is unlikely that people in China will have a higher income per head. The GDP is not much different but the population is vastly different. [2] (c) (i) A persistent general increase in the average price level. [3] (ii) China has the highest growth rate but the lowest inflation. India has the second highest growth rate but the highest inflation. The two countries with the lowest growth rates (Germany and France) do have low inflation rates. So, the same link does not appear in all cases and the evidence is inconclusive. [4] (d) In Germany and France there is relatively low GDP growth and also relatively high unemployment. This would support the idea but there are only figures for one year, although the figures do compare a change in that year. However, the UK’s growth rate is relatively low but the unemployment is not as high as France and Germany. Confusingly though, there is a high growth rate in India but also a high unemployment rate, and China does not have the lowest unemployment rate although the rate of growth is the highest. Overall, there are no figures for other years which are necessary for a full picture, and even the ones given that show the change in one year do not necessarily support the idea that high GDP leads to low unemployment. [6]
What was in this paper
The subtopics covered by these 2 questions, and how many questions each got. Open one in a new tab to see every Cambridge question on it.
What you needed in this session
Cambridge’s own grade thresholds for 2008 May/June, Paper 6 · Variant 1. A higher threshold means an easier paper — the bar moves with how the cohort did.