Cambridge IGCSE Economics 0455 — 2007 May/June Paper 6 · Variant 1
0455/61/M/J/07 · 2 questions · 40 marks · ≈45 min
The question paper and its mark scheme, free to read here and free to download. This is Cambridge’s own paper, exactly as it was sat.
Question paper4 pages
Mark scheme2 pages
Answers below. Sit the paper first if you are practising.
Questions as text
Q1 · Bad to the last drop Drinking bottled water has become popular in developed countries
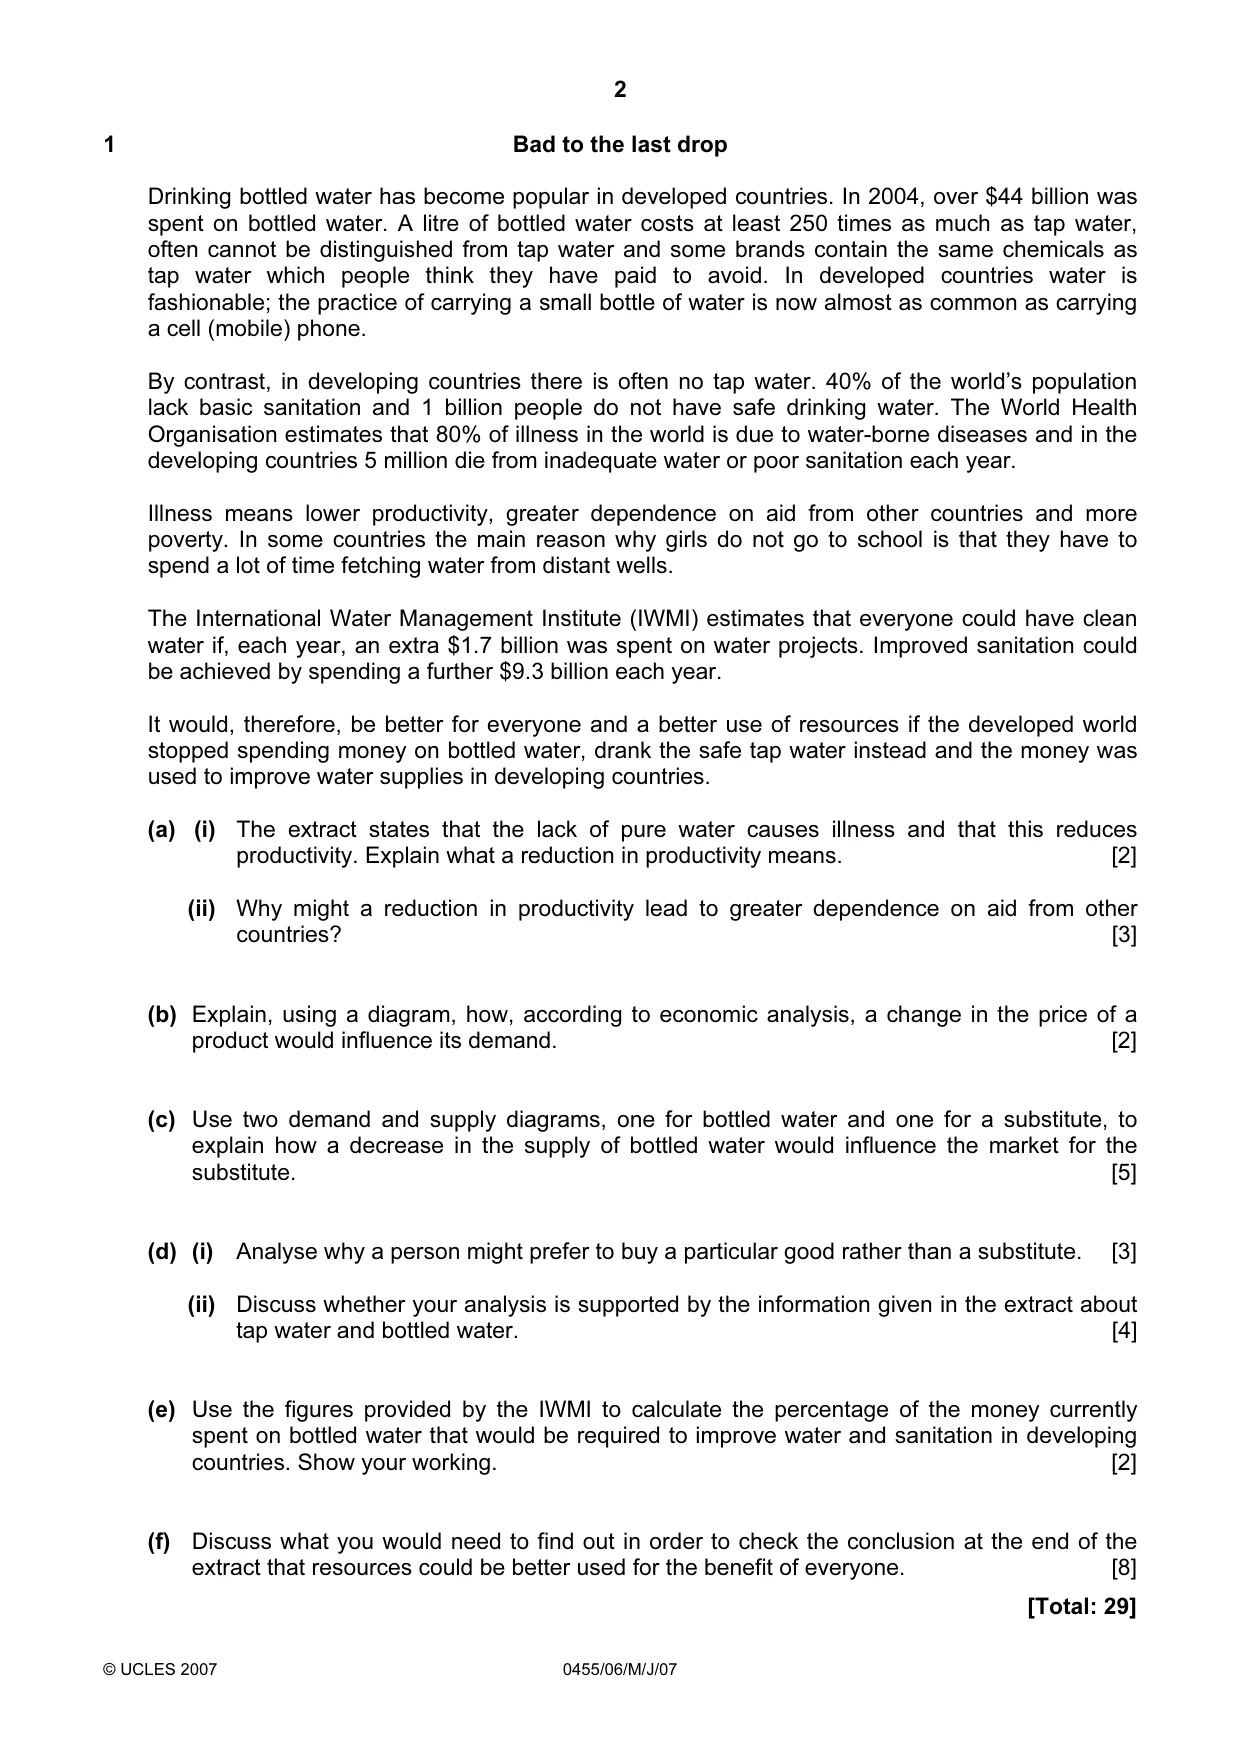
1 Bad to the last drop Drinking bottled water has become popular in developed countries. In 2004, over $44 billion was spent on bottled water. A litre of bottled water costs at least 250 times as much as tap water, often cannot be distinguished from tap water and some brands contain the same chemicals as tap water which people think they have paid to avoid. In developed countries water is fashionable; the practice of carrying a small bottle of water is now almost as common as carrying a cell (mobile) phone. By contrast, in developing countries there is often no tap water. 40% of the world’s population lack basic sanitation and 1 billion people do not have safe drinking water. The World Health Organisation estimates that 80% of illness in the world is due to water-borne diseases and in the developing countries 5 million die from inadequate water or poor sanitation each year. Illness means lower productivity, greater dependence on aid from other countries and more poverty. In some countries the main reason why girls do not go to school is that they have to spend a lot of time fetching water from distant wells. The International Water Management Institute (IWMI) estimates that everyone could have clean water if, each year, an extra $1.7 billion was spent on water projects. Improved sanitation could be achieved by spending a further $9.3 billion each year. It would, therefore, be better for everyone and a better use of resources if the developed world stopped spending money on bottled water, drank the safe tap water instead and the money was used to improve water supplies in developing countries. (a) (i) The extract states that the lack of pure water causes illness and that this reduces productivity. Explain what a reduction in productivity means. [2] (ii) Why might a reduction in productivity lead to greater dependence on aid from other countries? [3] (b) Explain, using a diagram, how, according to economic analysis, a change in the price of a product would influence its demand. [2] (c) Use two demand and supply diagrams, one for bottled water and one for a substitute, to explain how a decrease in the supply of bottled water would influence the market for the substitute. [5] (d) (i) Analyse why a person might prefer to buy a particular good rather than a substitute. [3] (ii) Discuss whether your analysis is supported by the information given in the extract about tap water and bottled water. [4] (e) Use the figures provided by the IWMI to calculate the percentage of the money currently spent on bottled water that would be required to improve water and sanitation in developing countries. Show your working. [2] (f) Discuss what you would need to find out in order to check the conclusion at the end of the extract that resources could be better used for the benefit of everyone. [8] [Total: 29]
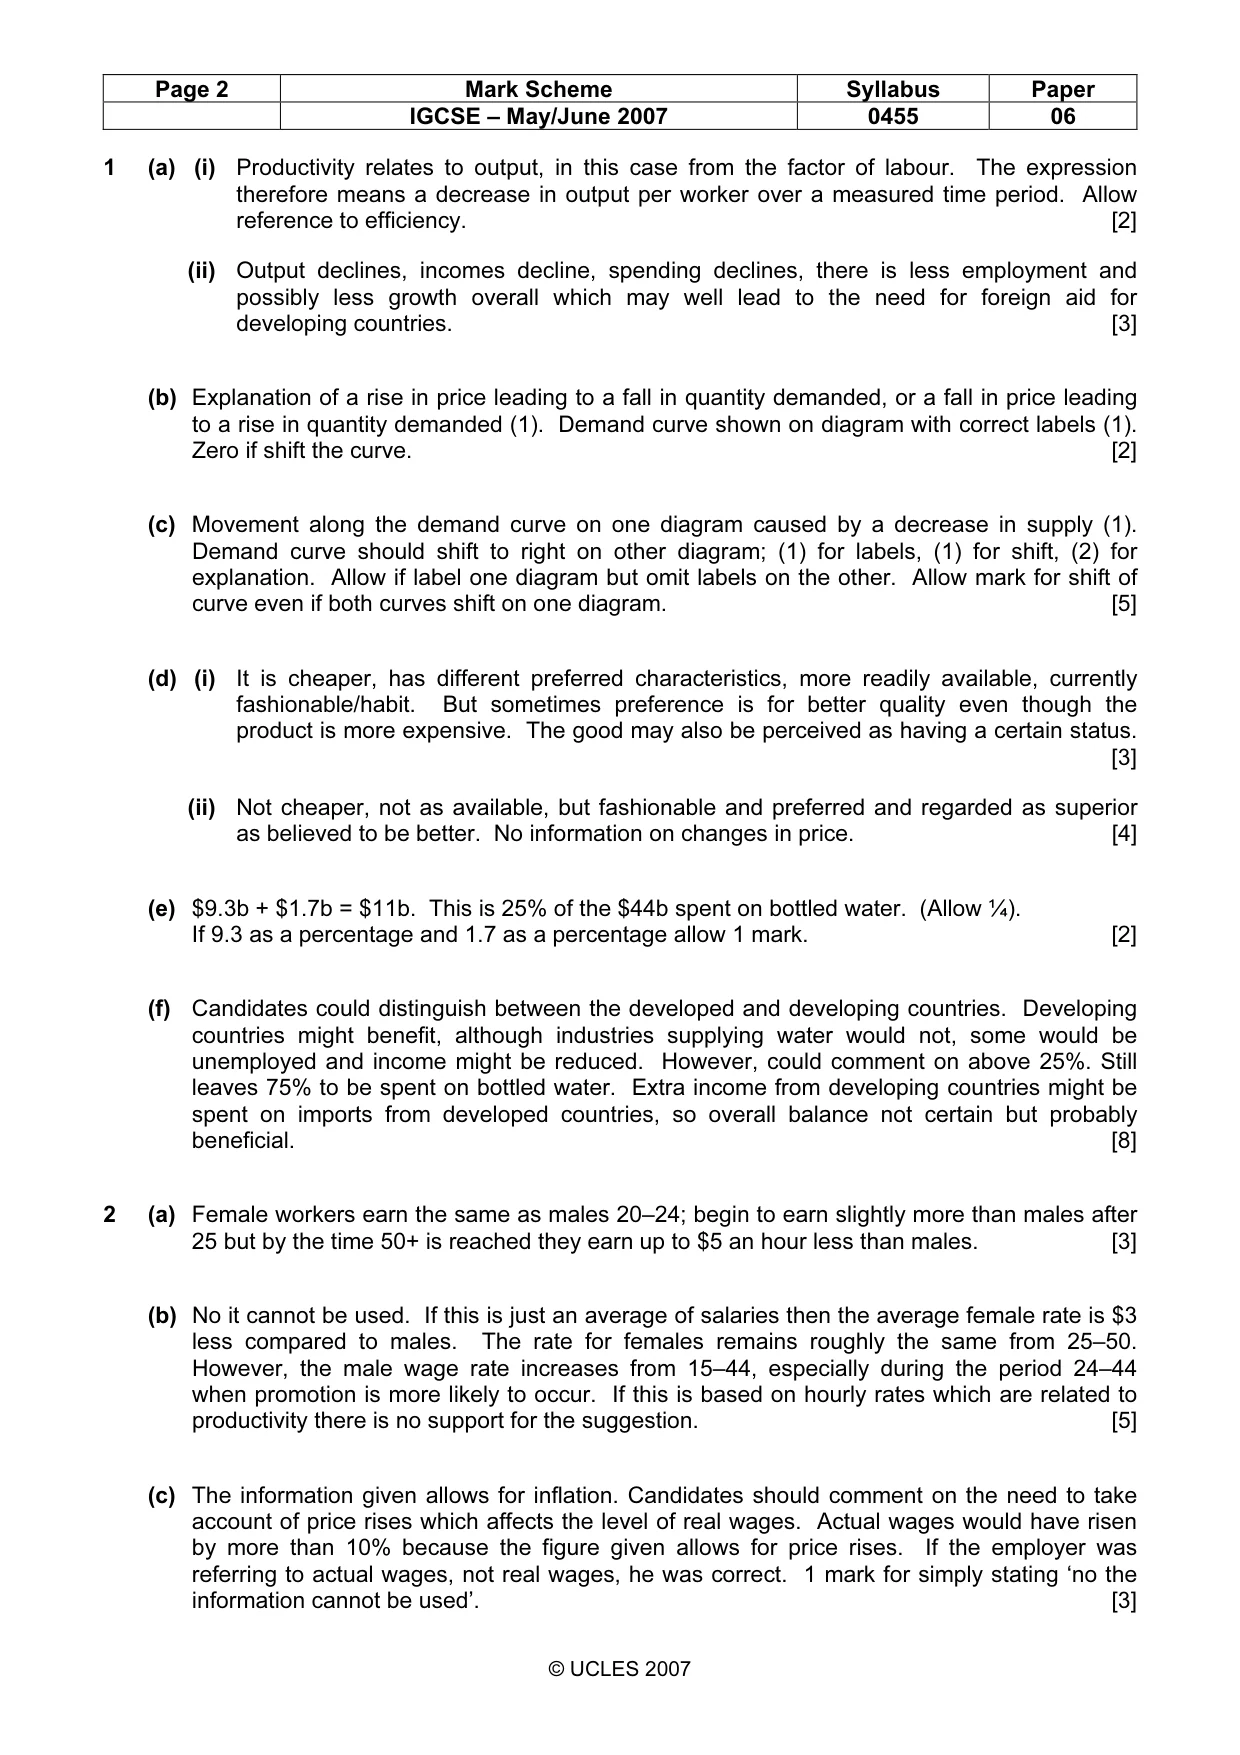
Mark scheme: 1 (a) (i) Productivity relates to output, in this case from the factor of labour. The expression therefore means a decrease in output per worker over a measured time period. Allow reference to efficiency. [2] (ii) Output declines, incomes decline, spending declines, there is less employment and possibly less growth overall which may well lead to the need for foreign aid for developing countries. [3] (b) Explanation of a rise in price leading to a fall in quantity demanded, or a fall in price leading to a rise in quantity demanded (1). Demand curve shown on diagram with correct labels (1). Zero if shift the curve. [2] (c) Movement along the demand curve on one diagram caused by a decrease in supply (1). Demand curve should shift to right on other diagram; (1) for labels, (1) for shift, (2) for explanation. Allow if label one diagram but omit labels on the other. Allow mark for shift of curve even if both curves shift on one diagram. [5] (d) (i) It is cheaper, has different preferred characteristics, more readily available, currently fashionable/habit. But sometimes preference is for better quality even though the product is more expensive. The good may also be perceived as having a certain status. [3] (ii) Not cheaper, not as available, but fashionable and preferred and regarded as superior as believed to be better. No information on changes in price. [4] (e) $9.3b + $1.7b = $11b. This is 25% of the $44b spent on bottled water. (Allow ¼). If 9.3 as a percentage and 1.7 as a percentage allow 1 mark. [2] (f) Candidates could distinguish between the developed and developing countries. Developing countries might benefit, although industries supplying water would not, some would be unemployed and income might be reduced. However, could comment on above 25%. Still leaves 75% to be spent on bottled water. Extra income from developing countries might be spent on imports from developed countries, so overall balance not certain but probably beneficial. [8]
Q2 · Wage Rates in New Zealand In New Zealand in June 2003 the average hourly wage rate was…
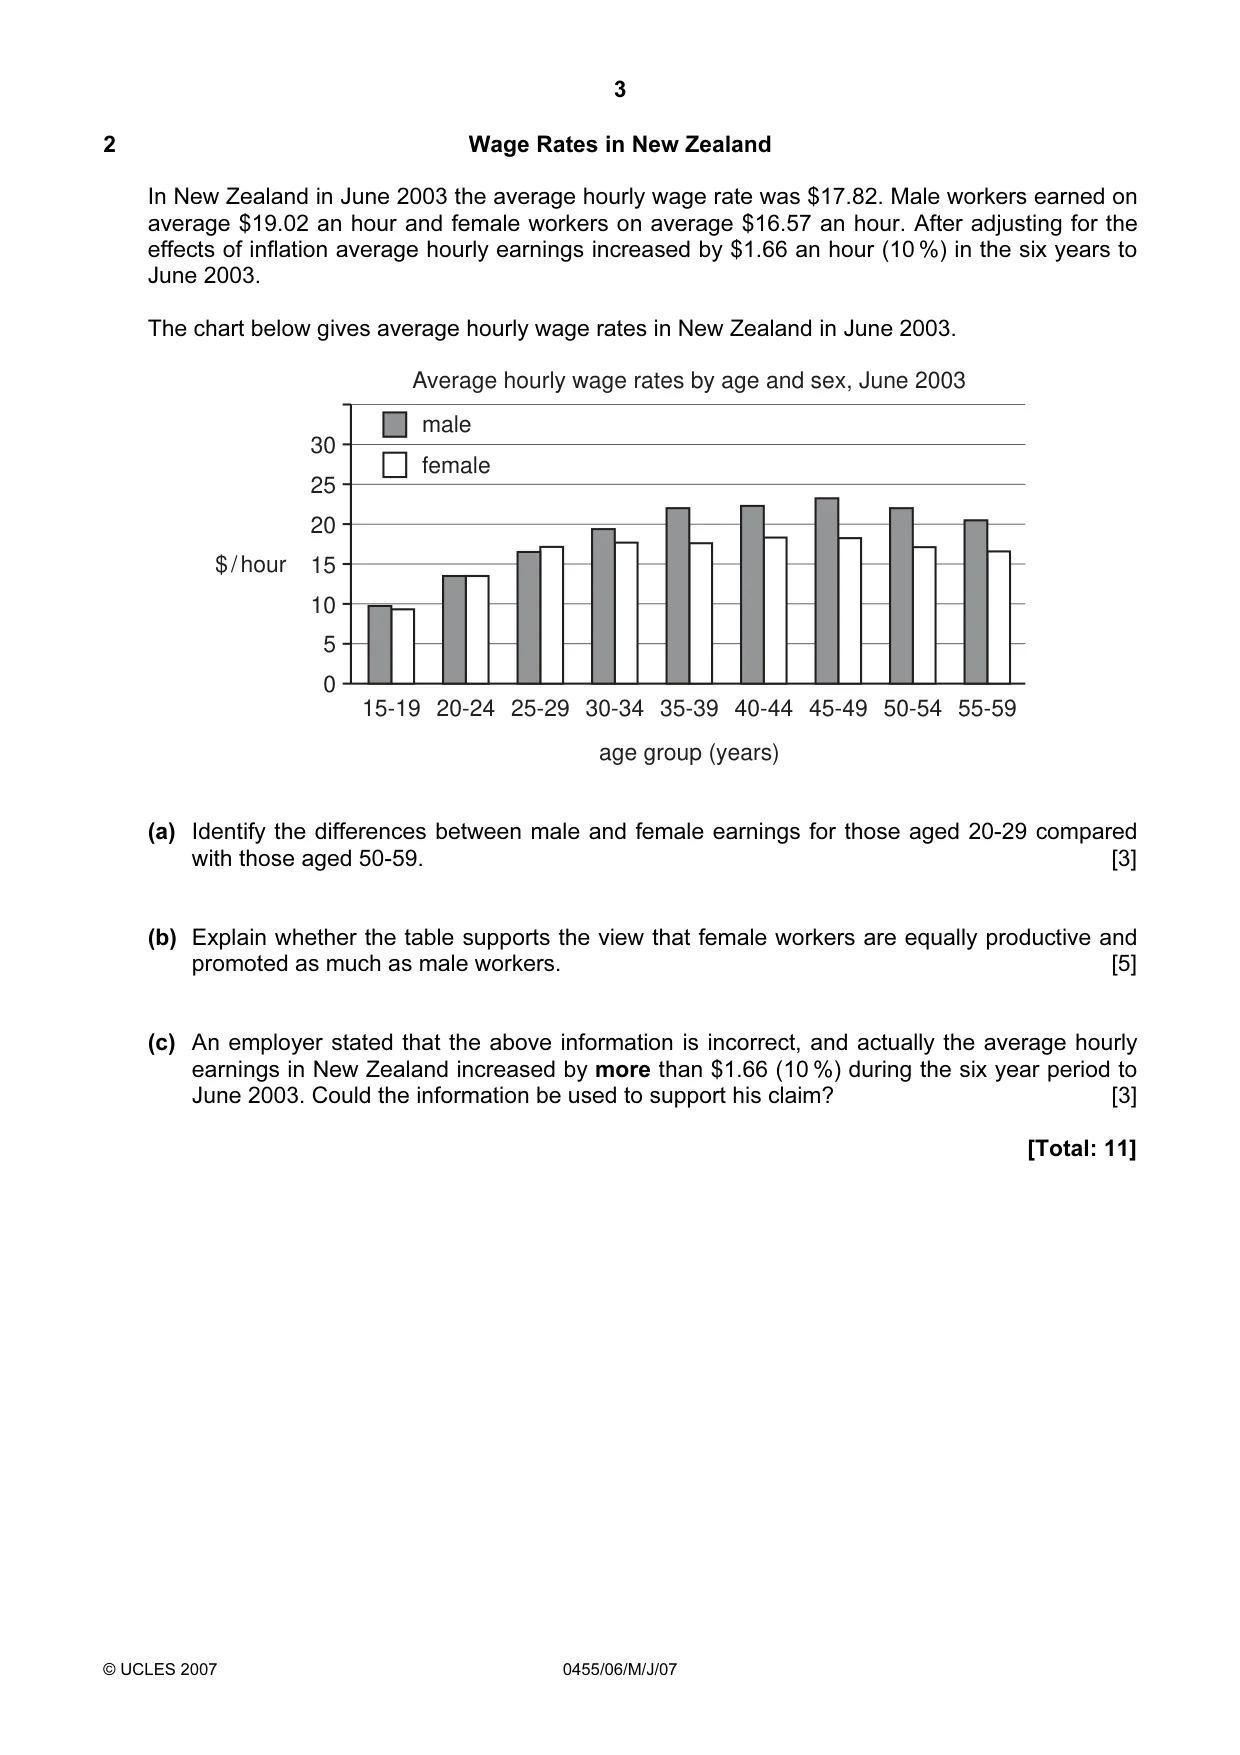
2 Wage Rates in New Zealand In New Zealand in June 2003 the average hourly wage rate was $17.82. Male workers earned on average $19.02 an hour and female workers on average $16.57 an hour. After adjusting for the effects of inflation average hourly earnings increased by $1.66 an hour (10 %) in the six years to June 2003. The chart below gives average hourly wage rates in New Zealand in June 2003. Average hourly wage rates by age and sex, June 2003 male 30 female 25 20 $ / hour 15 10 5 0 15-19 20-24 25-29 30-34 35-39 40-44 45-49 50-54 55-59 age group (years) (a) Identify the differences between male and female earnings for those aged 20-29 compared with those aged 50-59. [3] (b) Explain whether the table supports the view that female workers are equally productive and promoted as much as male workers. [5] (c) An employer stated that the above information is incorrect, and actually the average hourly earnings in New Zealand increased by more than $1.66 (10 %) during the six year period to June 2003. Could the information be used to support his claim? [3] [Total: 11]
Mark scheme: 2 (a) Female workers earn the same as males 20–24; begin to earn slightly more than males after 25 but by the time 50+ is reached they earn up to $5 an hour less than males. [3] (b) No it cannot be used. If this is just an average of salaries then the average female rate is $3 less compared to males. The rate for females remains roughly the same from 25–50. However, the male wage rate increases from 15–44, especially during the period 24–44 when promotion is more likely to occur. If this is based on hourly rates which are related to productivity there is no support for the suggestion. [5] (c) The information given allows for inflation. Candidates should comment on the need to take account of price rises which affects the level of real wages. Actual wages would have risen by more than 10% because the figure given allows for price rises. If the employer was referring to actual wages, not real wages, he was correct. 1 mark for simply stating ‘no the information cannot be used’. [3]
What was in this paper
The subtopics covered by these 2 questions, and how many questions each got. Open one in a new tab to see every Cambridge question on it.
What you needed in this session
Cambridge’s own grade thresholds for 2007 May/June, Paper 6 · Variant 1. A higher threshold means an easier paper — the bar moves with how the cohort did.