Cambridge IGCSE Development Studies 0453 — 2019 Oct/Nov Paper 2 · Variant 1
0453/21/O/N/19 · 80 marks · ≈90 min
The question paper and its mark scheme, free to read here and free to download. This is Cambridge’s own paper, exactly as it was sat.
Question paper20 pages


Mark scheme8 pages
Answers below. Sit the paper first if you are practising.
Paper as text
Question paper, page 1
This document consists of 20 printed pages and 1 Insert. DC (ST/CT) 165065/4 © UCLES 2019 [Turn over Cambridge Assessment International Education Cambridge International General Certificate of Secondary Education * 4 3 8 8 8 5 6 7 1 2 * DEVELOPMENT STUDIES 0453/02 Paper 2 October/November 2019 2 hours Candidates answer on the Question Paper. No Additional Materials are required. READ THESE INSTRUCTIONS FIRST Write your centre number, candidate number and name in the spaces provided. Write in dark blue or black pen. You may use an HB pencil for any diagrams or graphs. Do not use staples, paper clips, glue or correction fluid. DO NOT WRITE IN ANY BARCODES. Answer all the questions. You may not need all the answer lines for your answer. You should read and study the sources before answering the questions. The Insert contains Fig. 3.5, Fig. 3.6 and Fig. 3.7 for Question 3. The Insert is not required by the examiner. At the end of the examination, fasten all your work securely together. The number of marks is given in brackets [ ] at the end of each question or part question.
Question paper, page 2
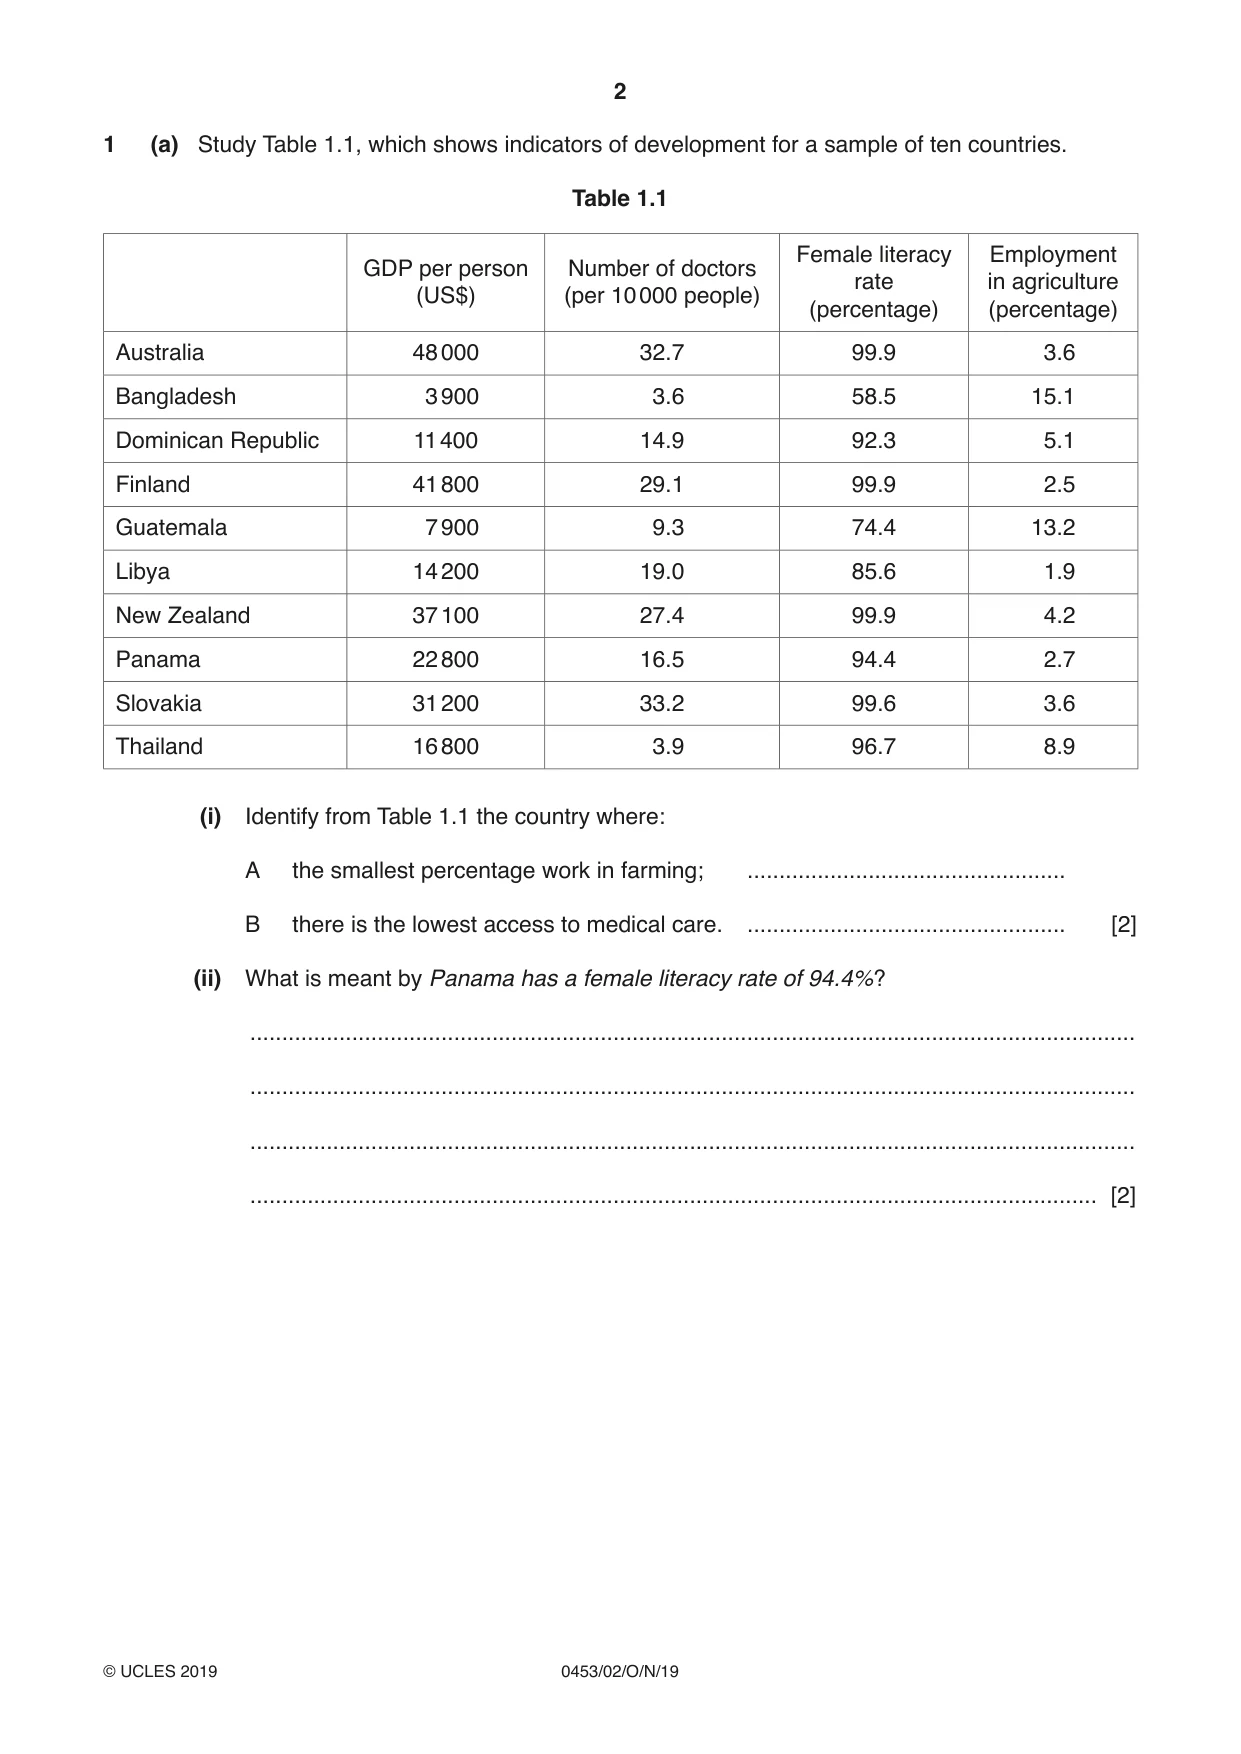
2 0453/02/O/N/19 © UCLES 2019 1 (a) Study Table 1.1, which shows indicators of development for a sample of ten countries. Table 1.1 GDP per person (US$) Number of doctors (per 10 000 people) Female literacy rate (percentage) Employment in agriculture (percentage) Australia 48 000 32.7 99.9 3.6 Bangladesh 3 900 3.6 58.5 15.1 Dominican Republic 11 400 14.9 92.3 5.1 Finland 41 800 29.1 99.9 2.5 Guatemala 7 900 9.3 74.4 13.2 Libya 14 200 19.0 85.6 1.9 New Zealand 37 100 27.4 99.9 4.2 Panama 22 800 16.5 94.4 2.7 Slovakia 31 200 33.2 99.6 3.6 Thailand 16 800 3.9 96.7 8.9 (i) Identify from Table 1.1 the country where: A the smallest percentage work in farming; … B there is the lowest access to medical care. … [2] (ii) What is meant by Panama has a female literacy rate of 94.4%? … … … … [2]
Question paper, page 3
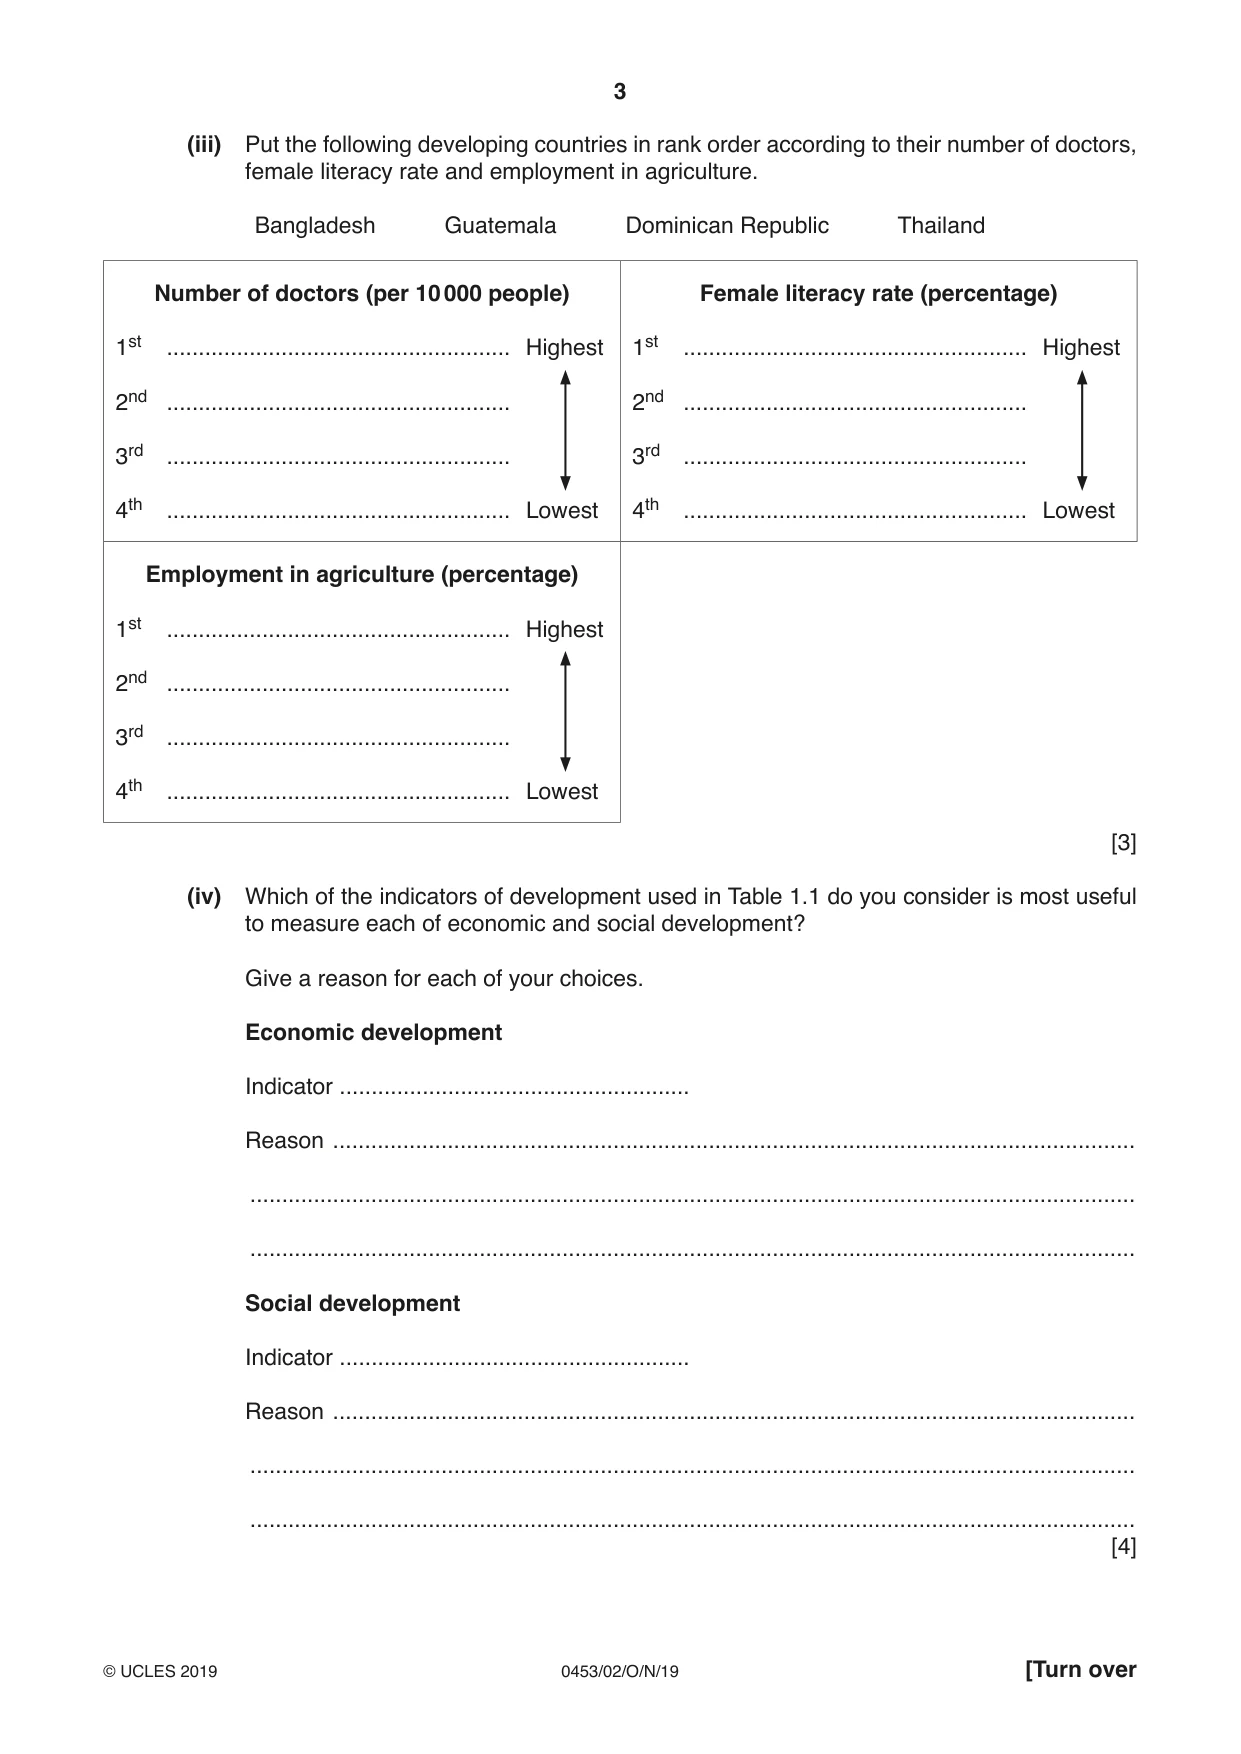
3 0453/02/O/N/19 © UCLES 2019 [Turn over (iii) Put the following developing countries in rank order according to their number of doctors, female literacy rate and employment in agriculture. Bangladesh Guatemala Dominican Republic Thailand Number of doctors (per 10 000 people) 1st … Highest 2nd … 3rd … 4th … Lowest Female literacy rate (percentage) 1st … Highest 2nd … 3rd … 4th … Lowest Employment in agriculture (percentage) 1st … Highest 2nd … 3rd … 4th … Lowest [3] (iv) Which of the indicators of development used in Table 1.1 do you consider is most useful to measure each of economic and social development? Give a reason for each of your choices. Economic development Indicator … Reason … … … Social development Indicator … Reason … … … [4]
Question paper, page 4
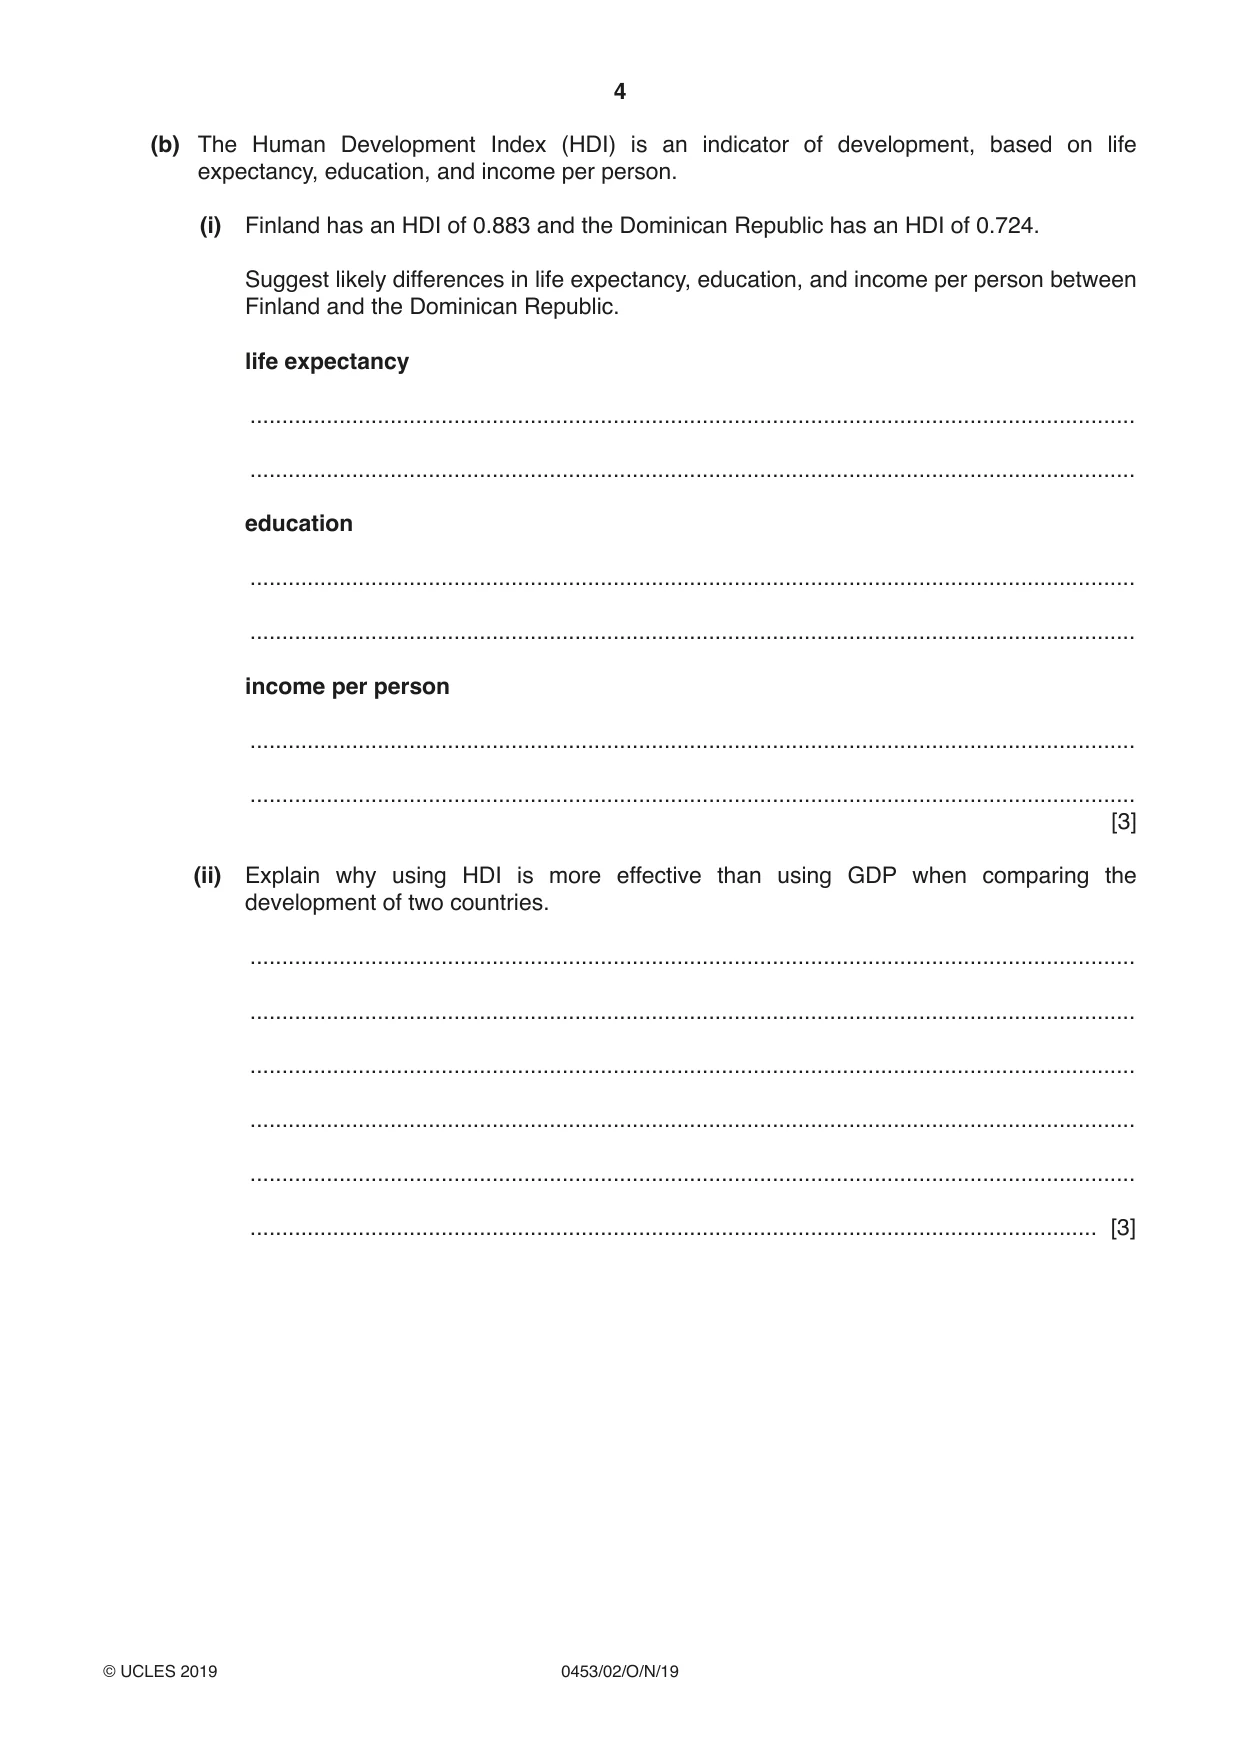
4 0453/02/O/N/19 © UCLES 2019 (b) The Human Development Index (HDI) is an indicator of development, based on life expectancy, education, and income per person. (i) Finland has an HDI of 0.883 and the Dominican Republic has an HDI of 0.724. Suggest likely differences in life expectancy, education, and income per person between Finland and the Dominican Republic. life expectancy … … education … … income per person … … [3] (ii) Explain why using HDI is more effective than using GDP when comparing the development of two countries. … … … … … … [3]
Question paper, page 5
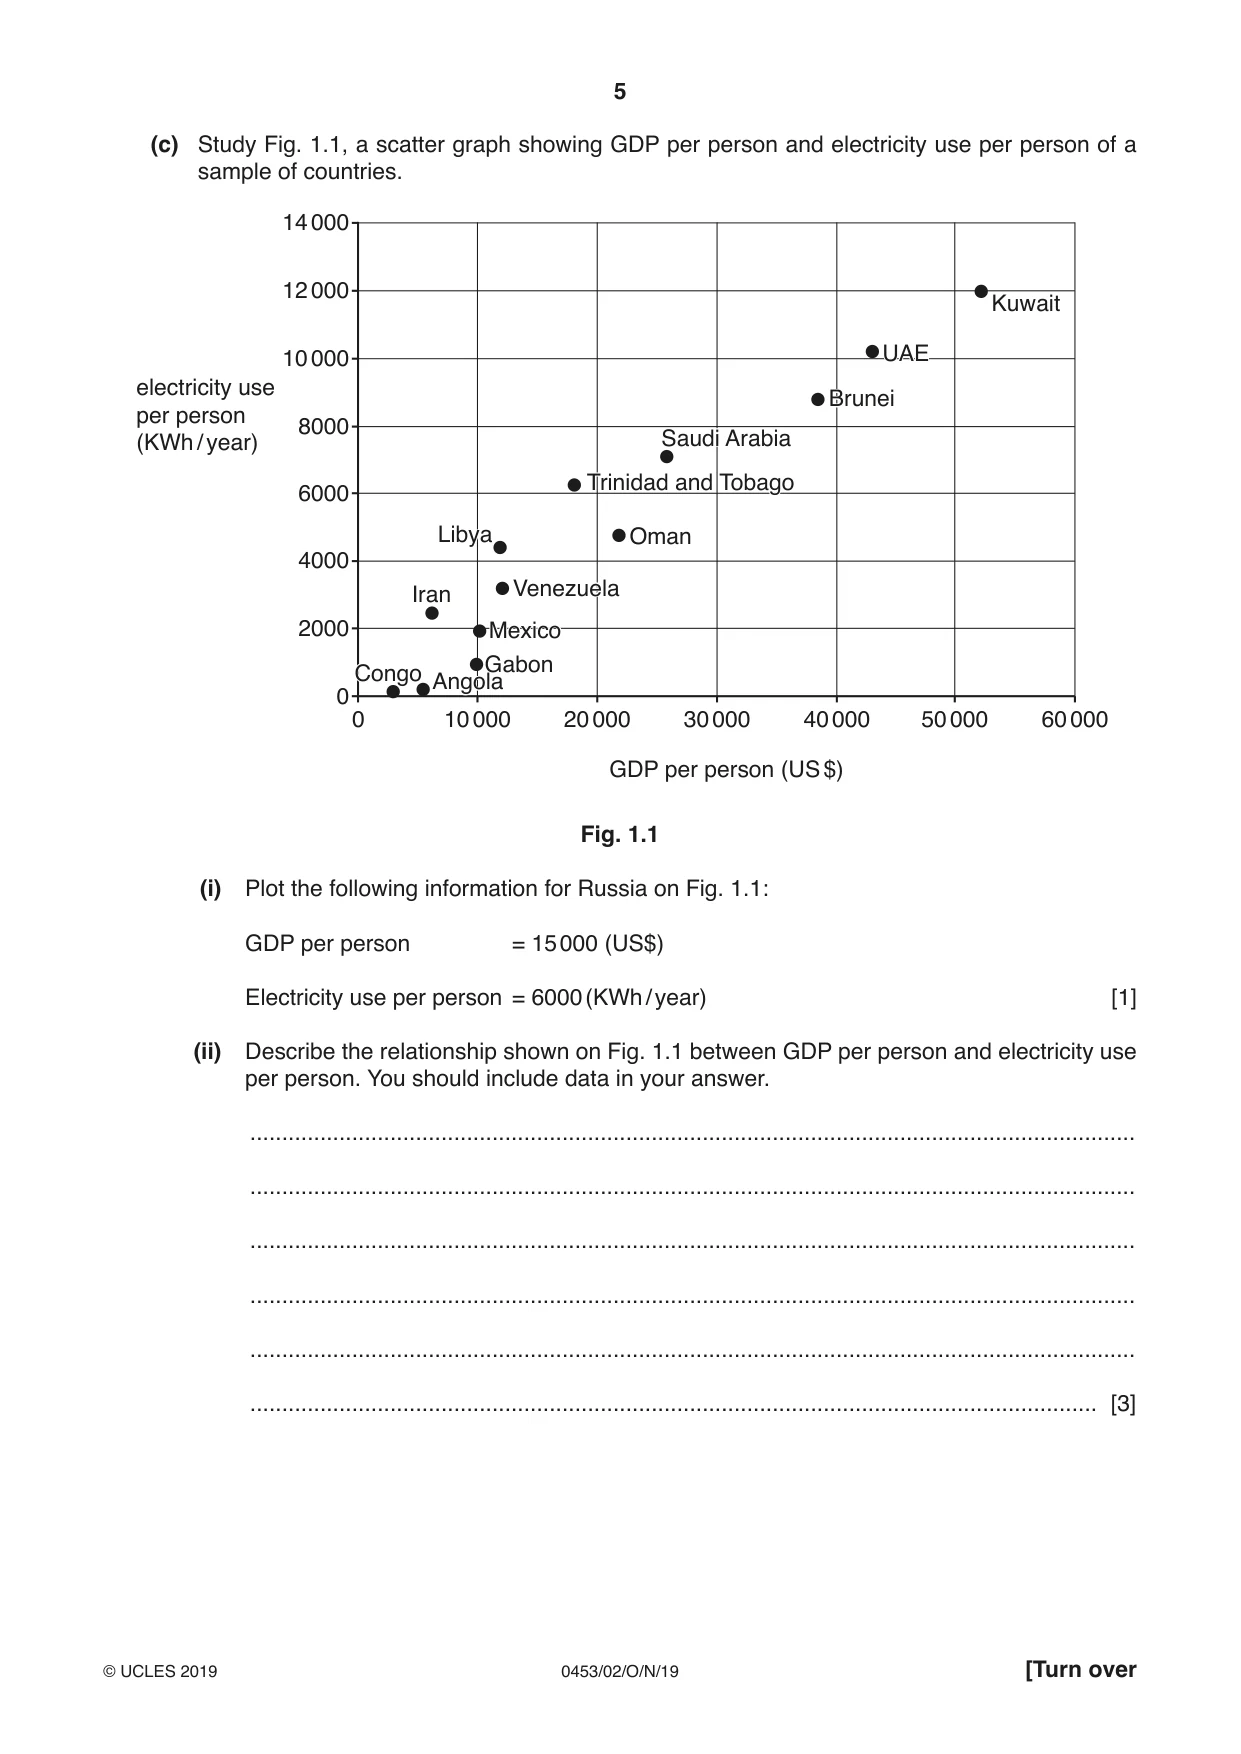
5 0453/02/O/N/19 © UCLES 2019 [Turn over (c) Study Fig. 1.1, a scatter graph showing GDP per person and electricity use per person of a sample of countries. 14 000 12 000 10 000 8000 electricity use per person (KWh / year) 6000 4000 2000 0 0 10 000 20 000 30 000 GDP per person (US $) 40 000 50 000 60 000 Congo Iran Libya Venezuela Oman Saudi Arabia Brunei UAE Kuwait AngolaGabon Mexico Congo Iran Libya Venezuela Oman Saudi Arabia Brunei UAE Kuwait Trinidad and Tobago Trinidad and Tobago Angola Gabon Mexico Fig. 1.1 (i) Plot the following information for Russia on Fig. 1.1: GDP per person = 15 000 (US$) Electricity use per person = 6000 (KWh / year) [1] (ii) Describe the relationship shown on Fig. 1.1 between GDP per person and electricity use per person. You should include data in your answer. … … … … … … [3]
Question paper, page 6
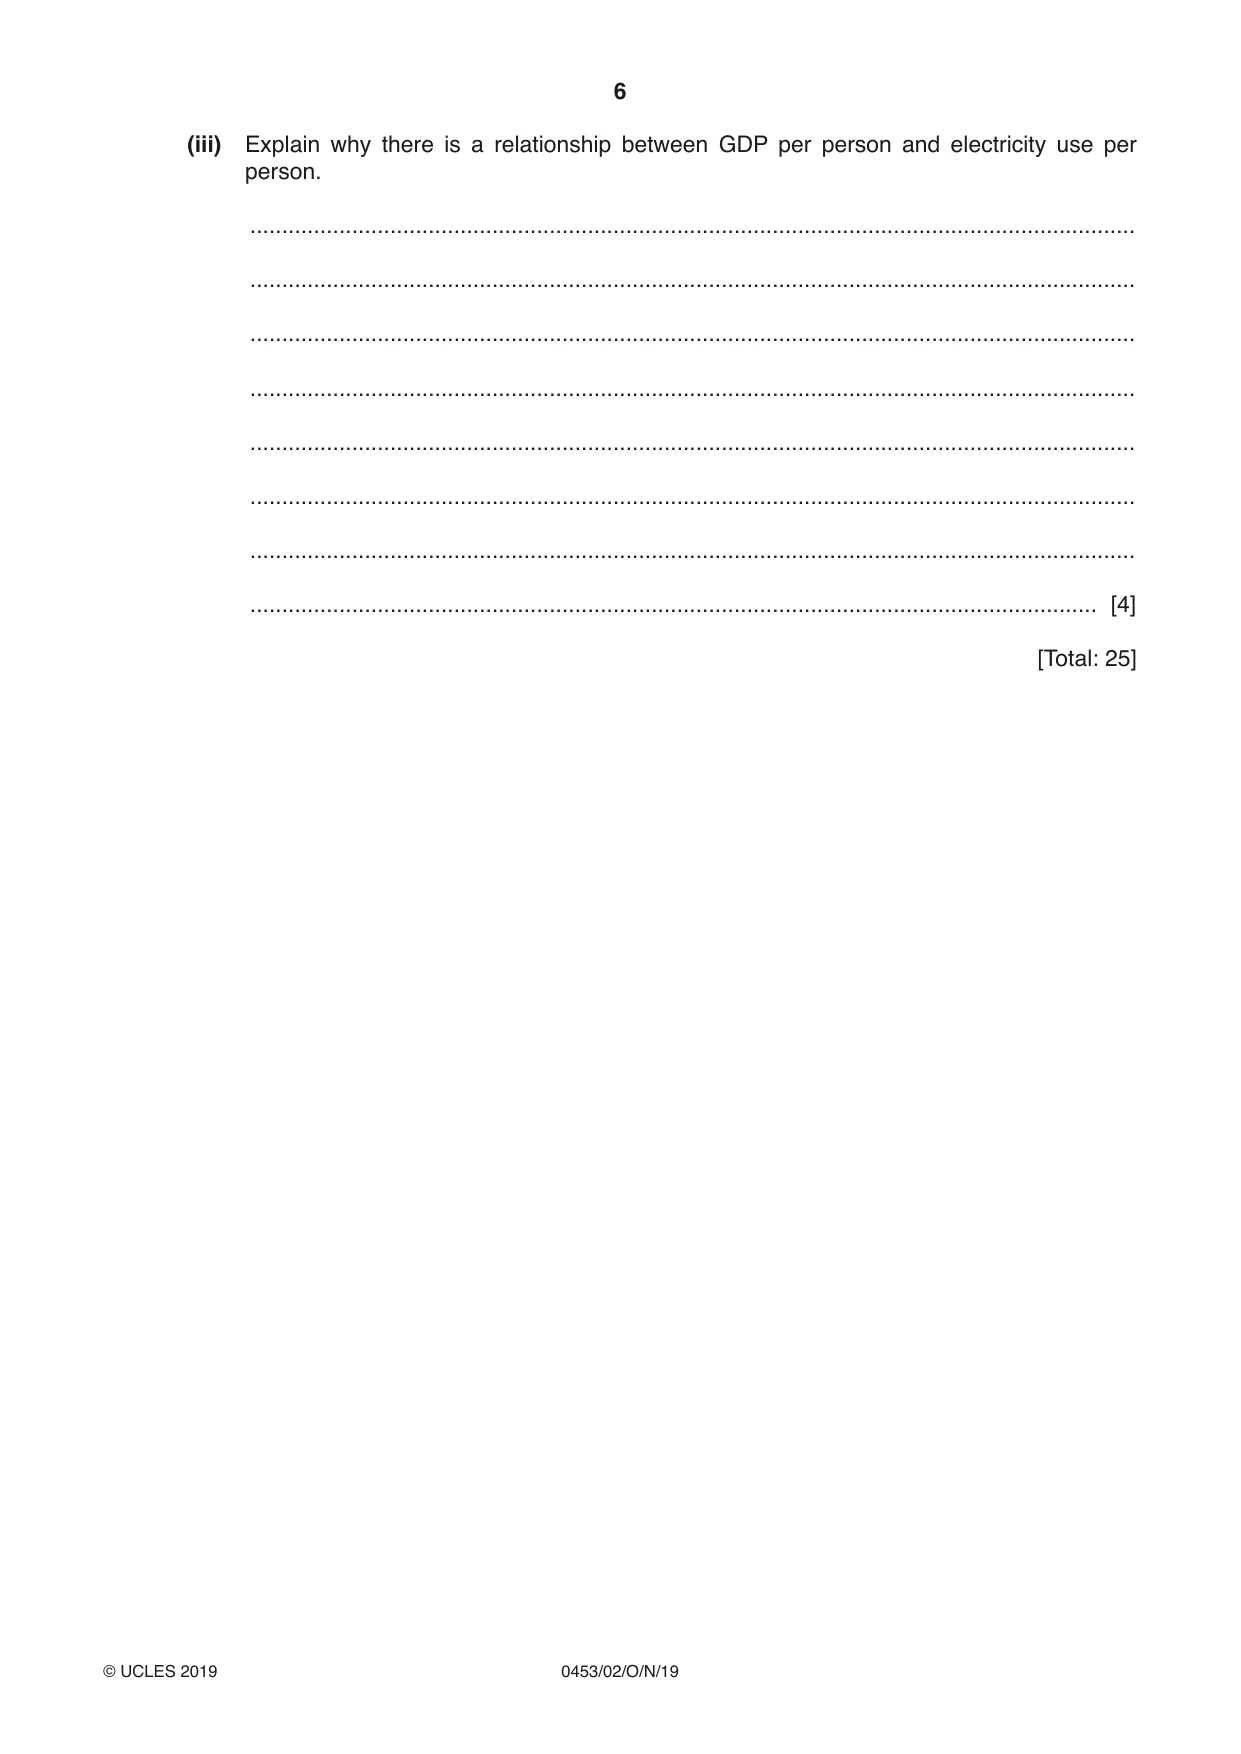
6 0453/02/O/N/19 © UCLES 2019 (iii) Explain why there is a relationship between GDP per person and electricity use per person. … … … … … … … … [4] [Total: 25]
Question paper, page 7
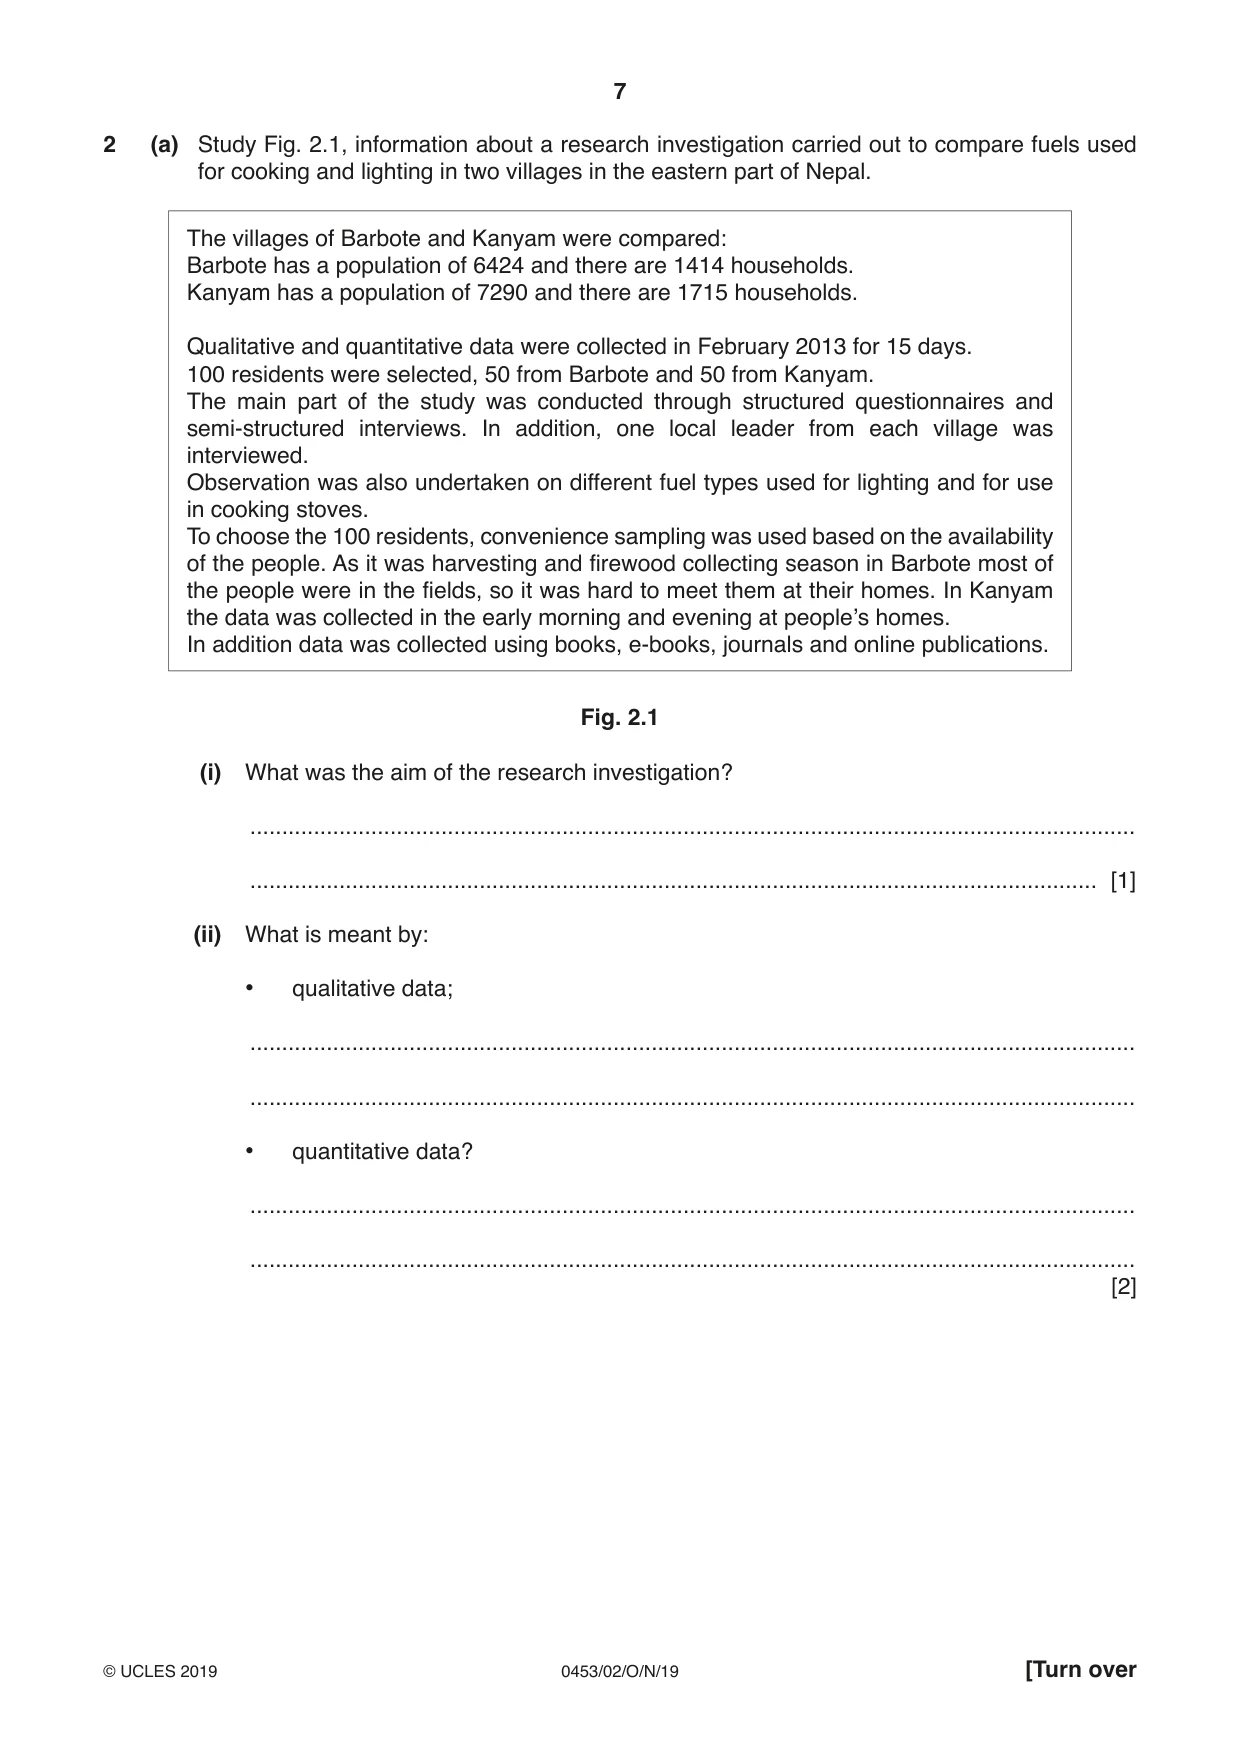
7 0453/02/O/N/19 © UCLES 2019 [Turn over 2 (a) Study Fig. 2.1, information about a research investigation carried out to compare fuels used for cooking and lighting in two villages in the eastern part of Nepal. The villages of Barbote and Kanyam were compared: Barbote has a population of 6424 and there are 1414 households. Kanyam has a population of 7290 and there are 1715 households. Qualitative and quantitative data were collected in February 2013 for 15 days. 100 residents were selected, 50 from Barbote and 50 from Kanyam. The main part of the study was conducted through structured questionnaires and semi-structured interviews. In addition, one local leader from each village was interviewed. Observation was also undertaken on different fuel types used for lighting and for use in cooking stoves. To choose the 100 residents, convenience sampling was used based on the availability of the people. As it was harvesting and firewood collecting season in Barbote most of the people were in the fields, so it was hard to meet them at their homes. In Kanyam the data was collected in the early morning and evening at people’s homes. In addition data was collected using books, e-books, journals and online publications. Fig. 2.1 (i) What was the aim of the research investigation? … … [1] (ii) What is meant by: • qualitative data; … … • quantitative data? … … [2]
Question paper, page 8
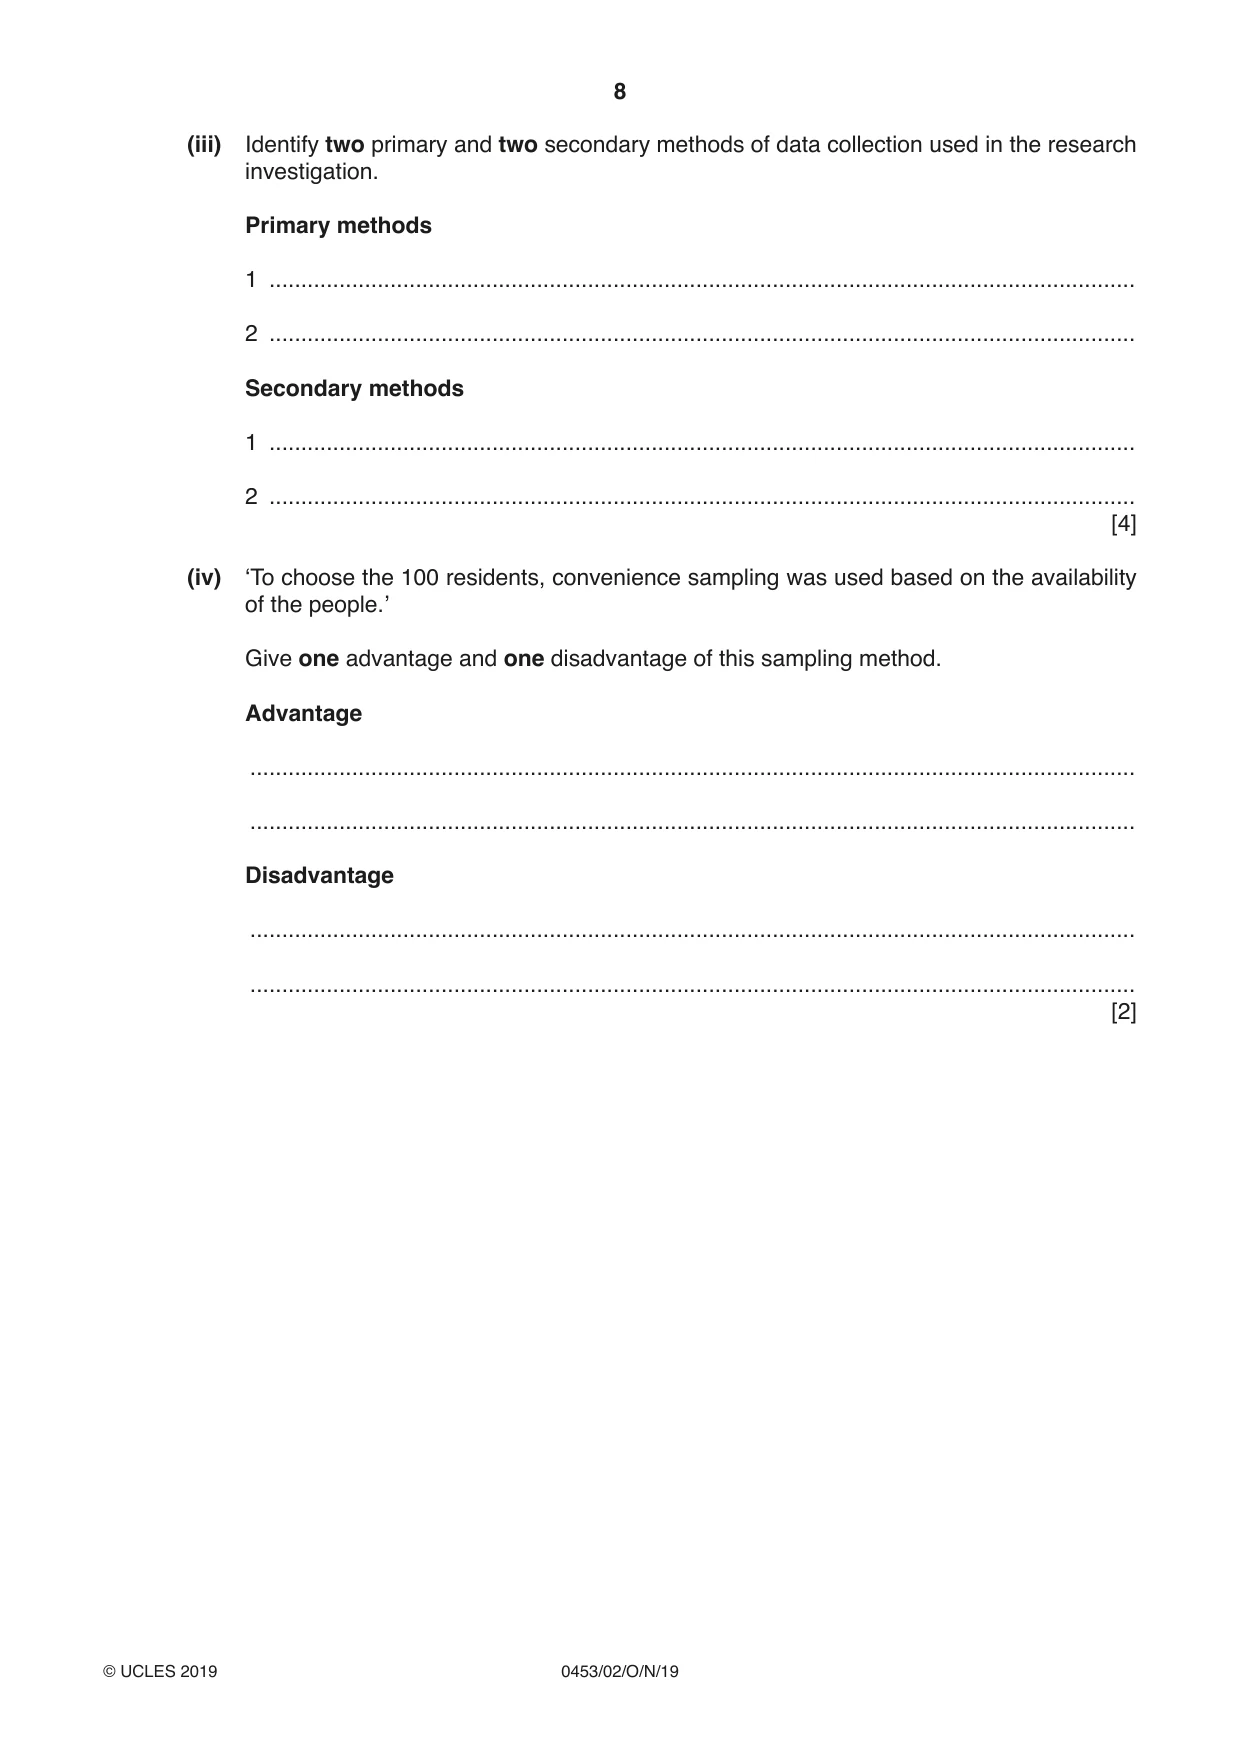
8 0453/02/O/N/19 © UCLES 2019 (iii) Identify two primary and two secondary methods of data collection used in the research investigation. Primary methods 1 … 2 … Secondary methods 1 … 2 … [4] (iv) ‘To choose the 100 residents, convenience sampling was used based on the availability of the people.’ Give one advantage and one disadvantage of this sampling method. Advantage … … Disadvantage … … [2]
Question paper, page 9
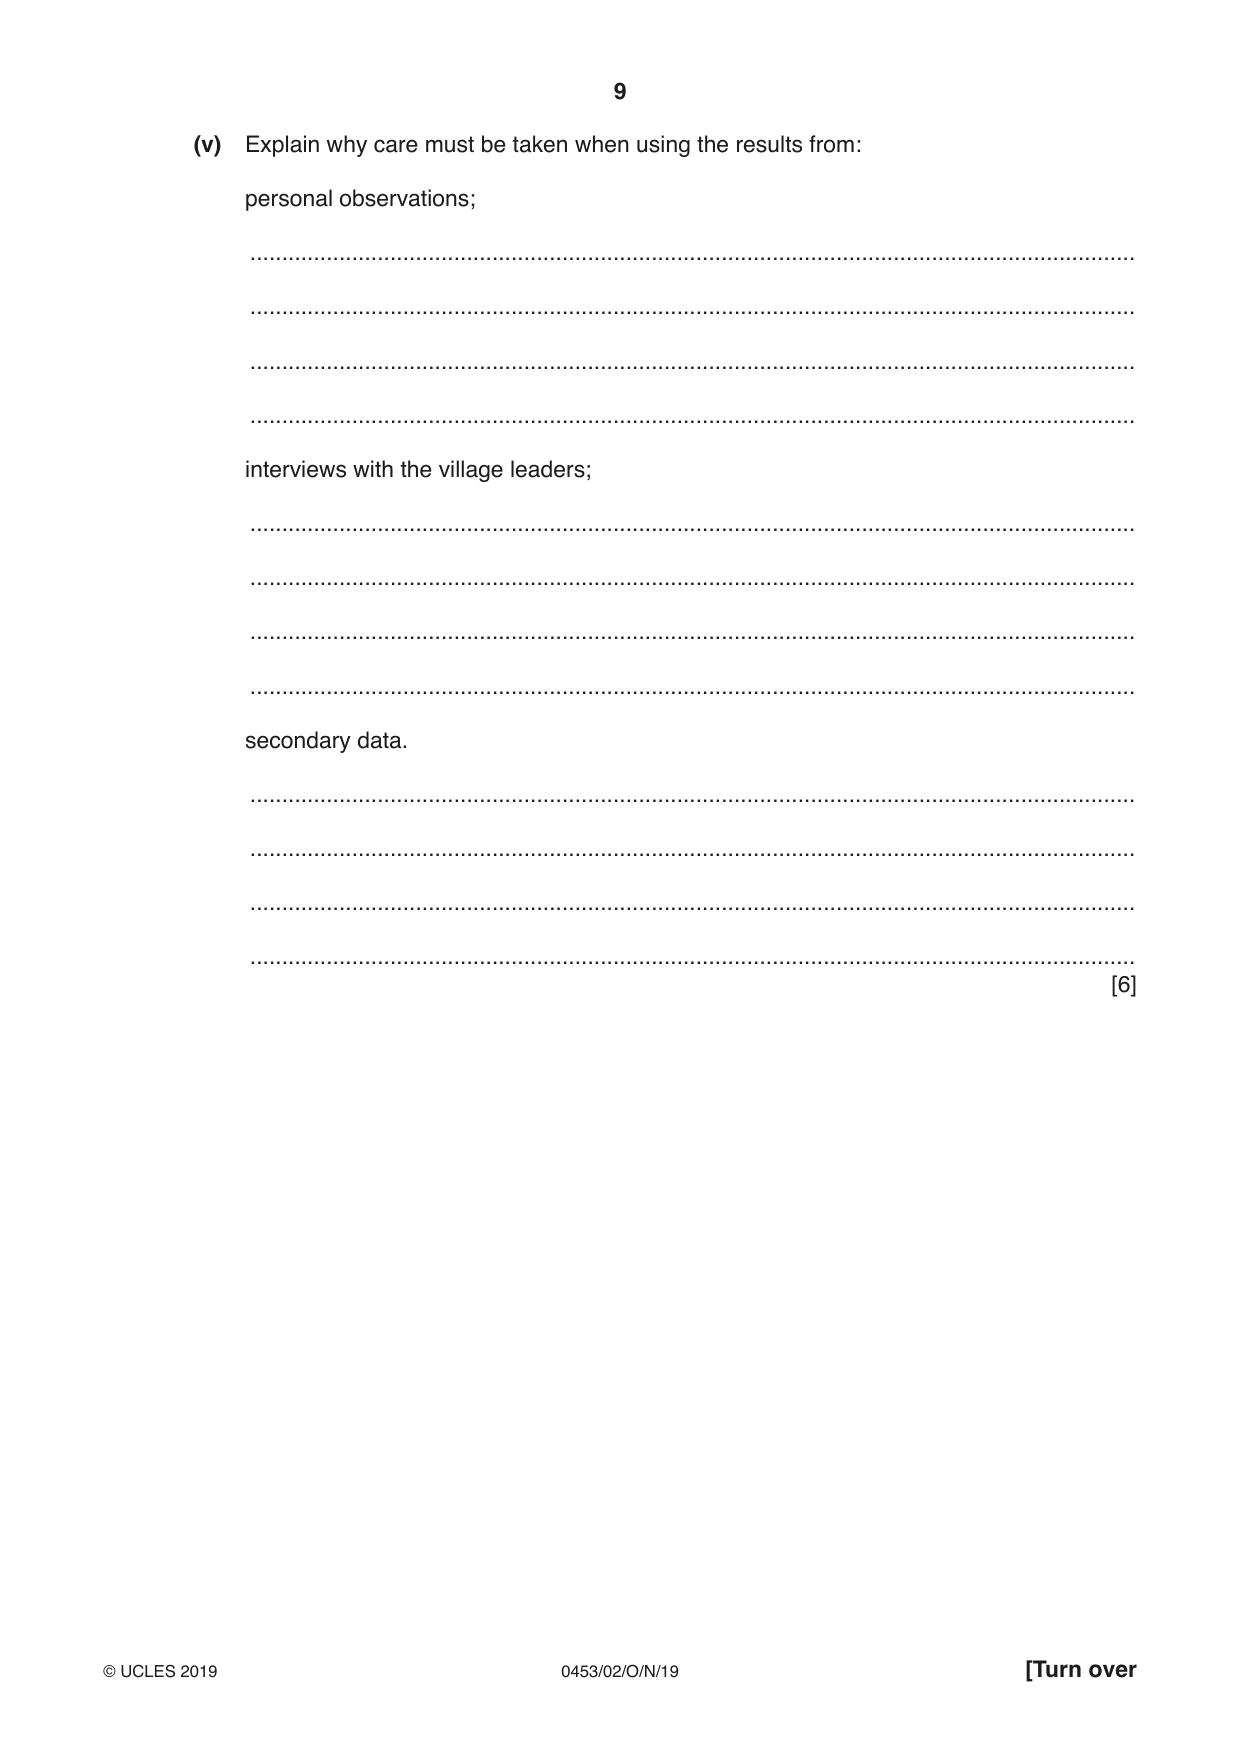
9 0453/02/O/N/19 © UCLES 2019 [Turn over (v) Explain why care must be taken when using the results from: personal observations; … … … … interviews with the village leaders; … … … … secondary data. … … … … [6]
Question paper, page 10
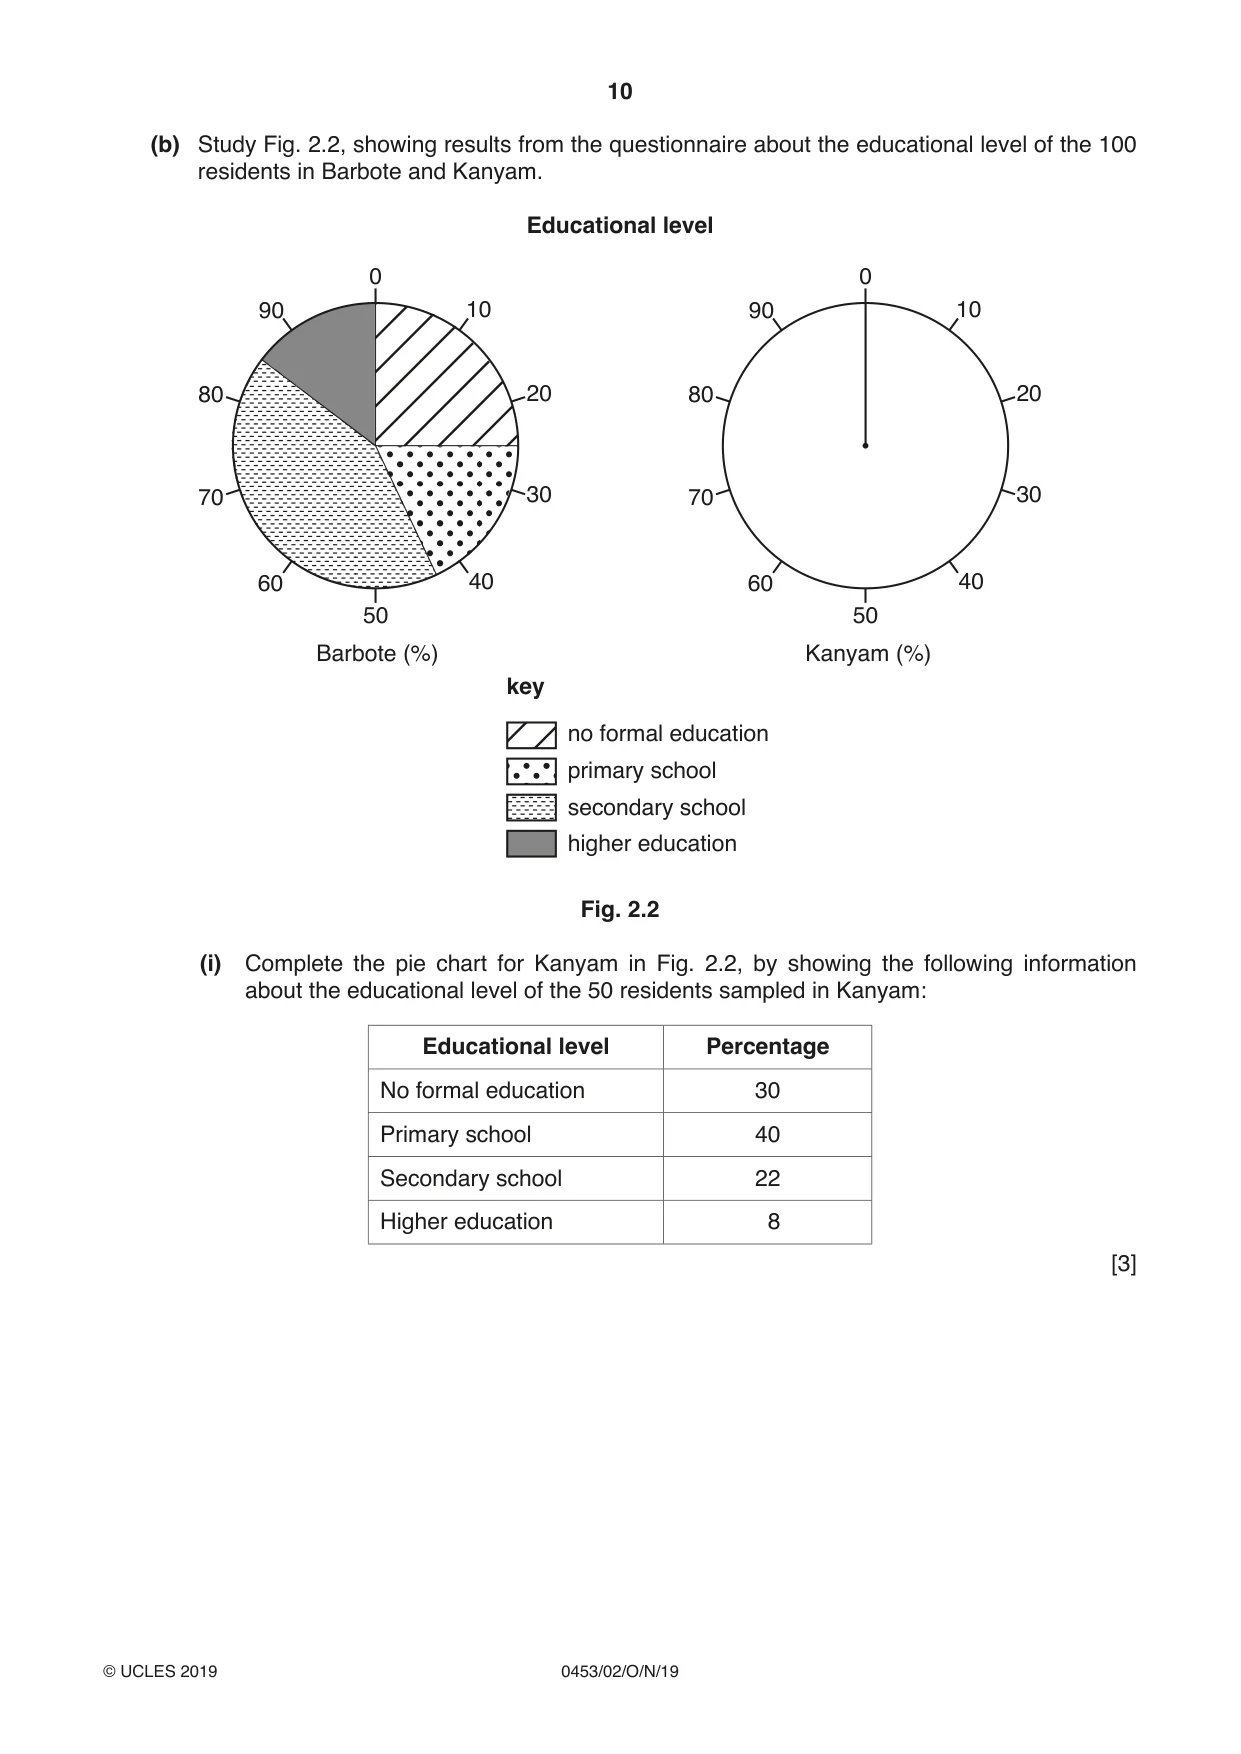
10 0453/02/O/N/19 © UCLES 2019 (b) Study Fig. 2.2, showing results from the questionnaire about the educational level of the 100 residents in Barbote and Kanyam. Educational level 0 50 10 90 80 70 60 20 30 40 0 50 10 90 80 70 60 20 30 40 no formal education primary school secondary school higher education Barbote (%) key Kanyam (%) Fig. 2.2 (i) Complete the pie chart for Kanyam in Fig. 2.2, by showing the following information about the educational level of the 50 residents sampled in Kanyam: Educational level Percentage No formal education 30 Primary school 40 Secondary school 22 Higher education 8 [3]
Question paper, page 11
11 0453/02/O/N/19 © UCLES 2019 [Turn over Question 2 continues on the next page.
Question paper, page 12
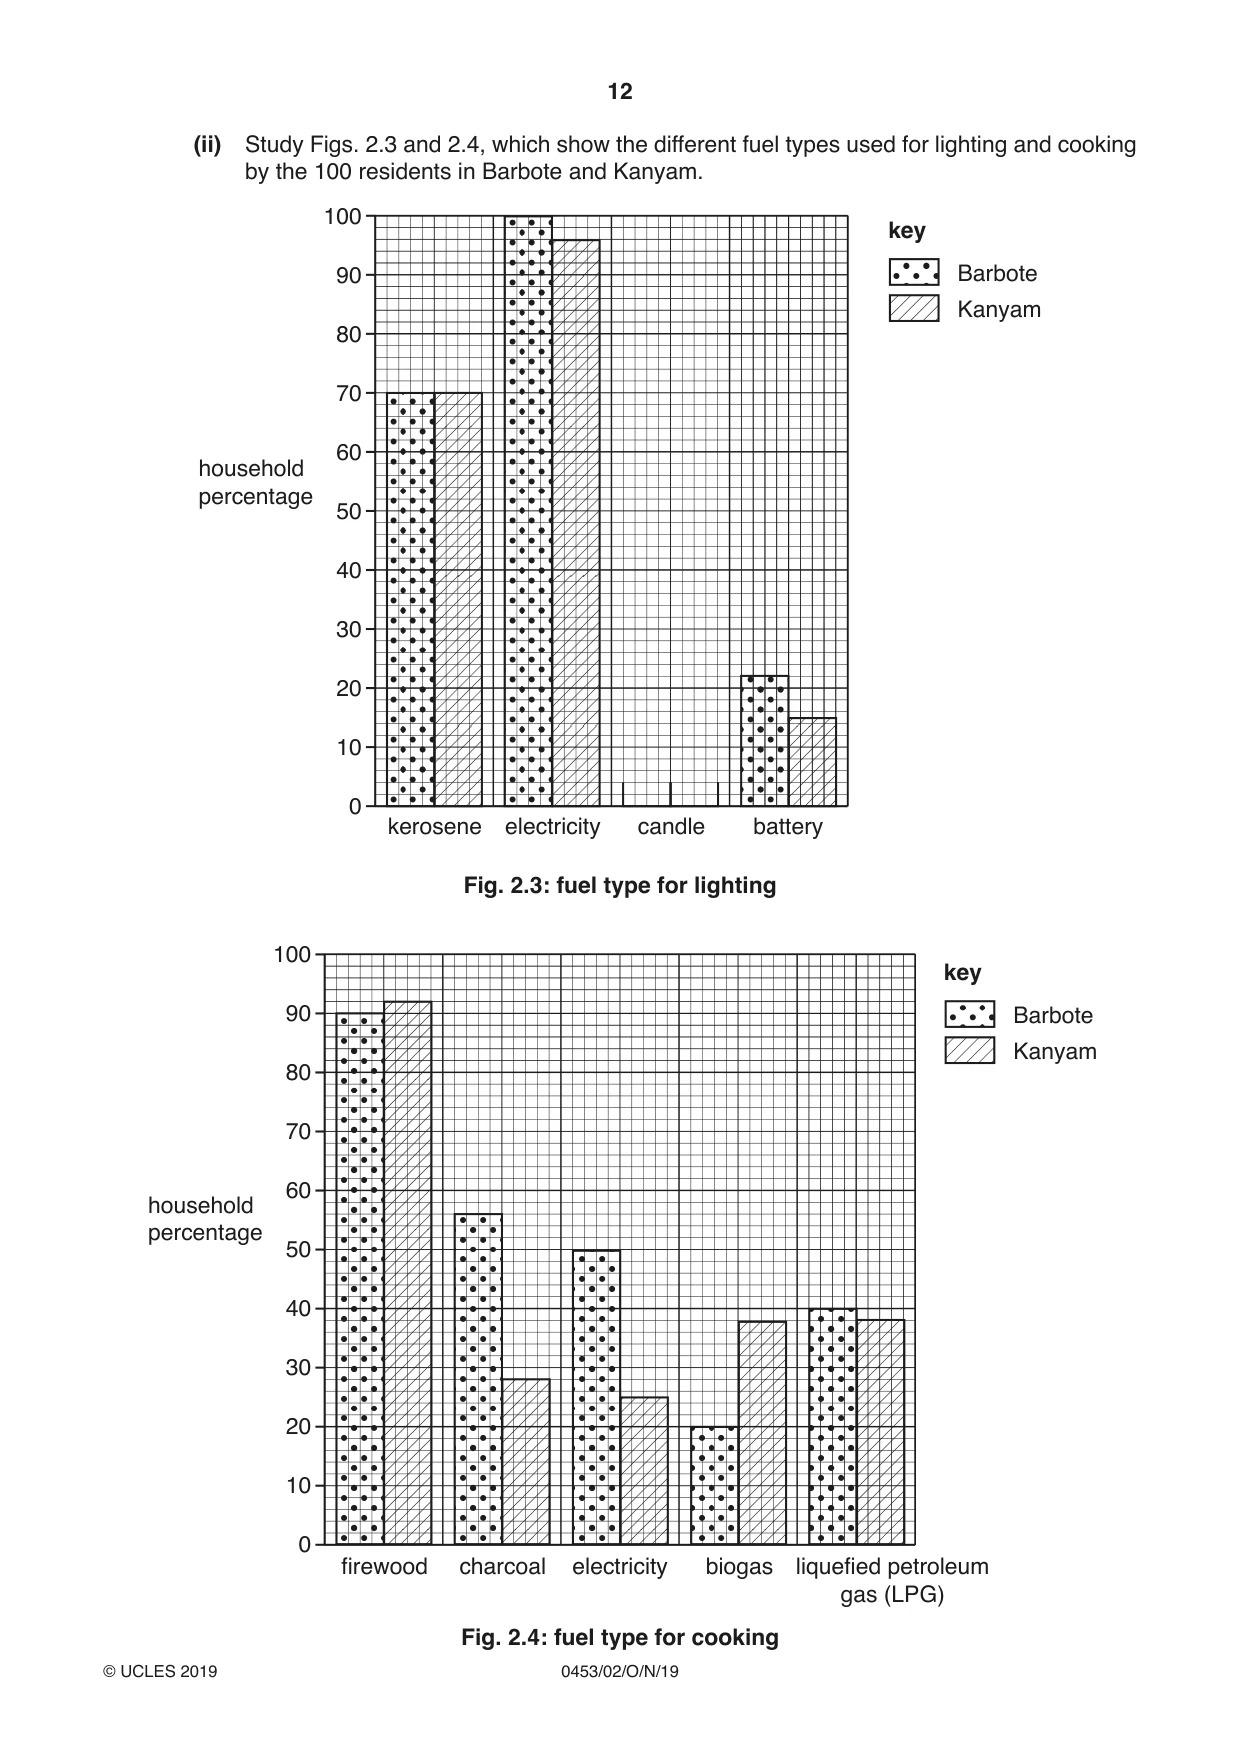
12 0453/02/O/N/19 © UCLES 2019 (ii) Study Figs. 2.3 and 2.4, which show the different fuel types used for lighting and cooking by the 100 residents in Barbote and Kanyam. electricity kerosene candle battery 0 10 20 30 40 50 60 70 80 90 100 household percentage key Barbote Kanyam Fig. 2.3: fuel type for lighting 0 firewood charcoal liquefied petroleum gas (LPG) biogas electricity 10 20 30 40 50 60 70 80 90 100 household percentage key Barbote Kanyam Fig. 2.4: fuel type for cooking
Question paper, page 13
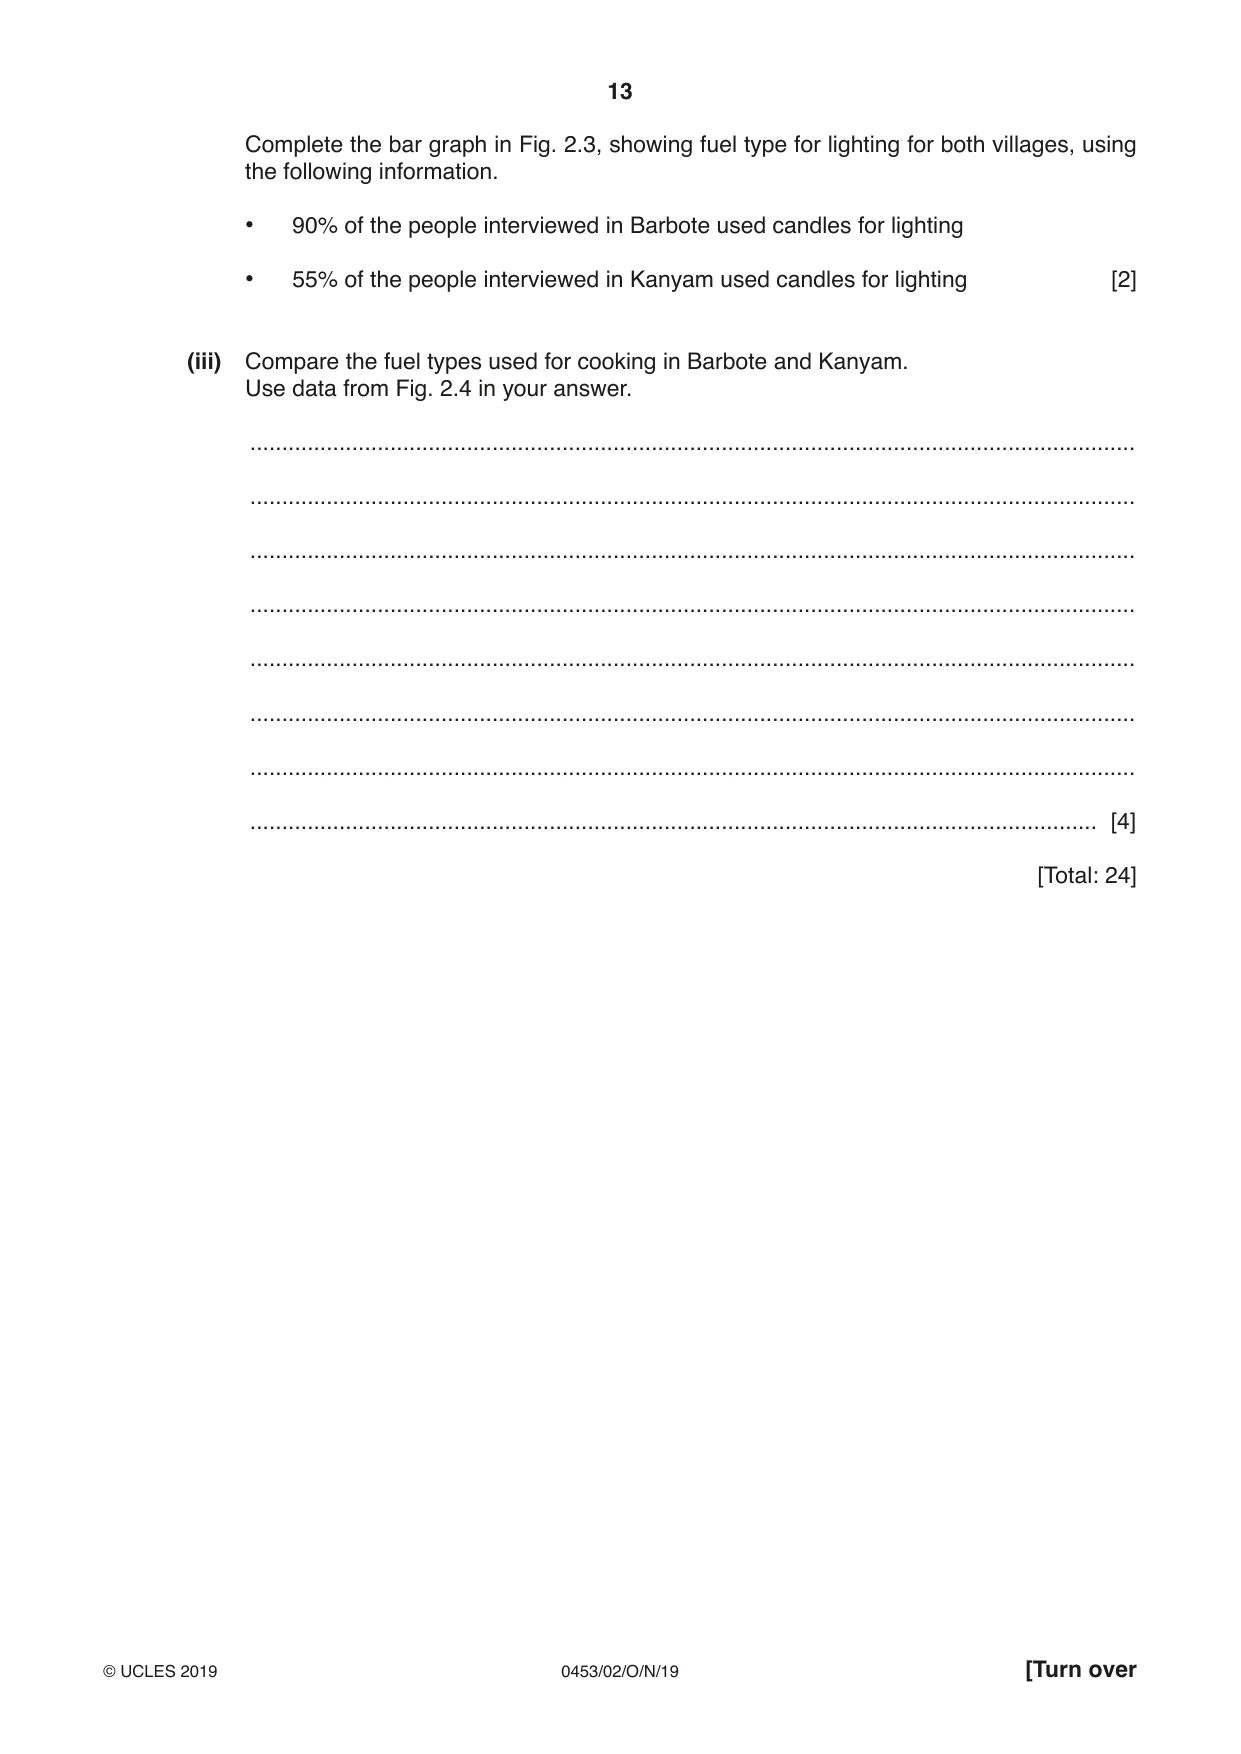
13 0453/02/O/N/19 © UCLES 2019 [Turn over Complete the bar graph in Fig. 2.3, showing fuel type for lighting for both villages, using the following information. • 90% of the people interviewed in Barbote used candles for lighting • 55% of the people interviewed in Kanyam used candles for lighting [2] (iii) Compare the fuel types used for cooking in Barbote and Kanyam. Use data from Fig. 2.4 in your answer. … … … … … … … … [4] [Total: 24]
Question paper, page 14
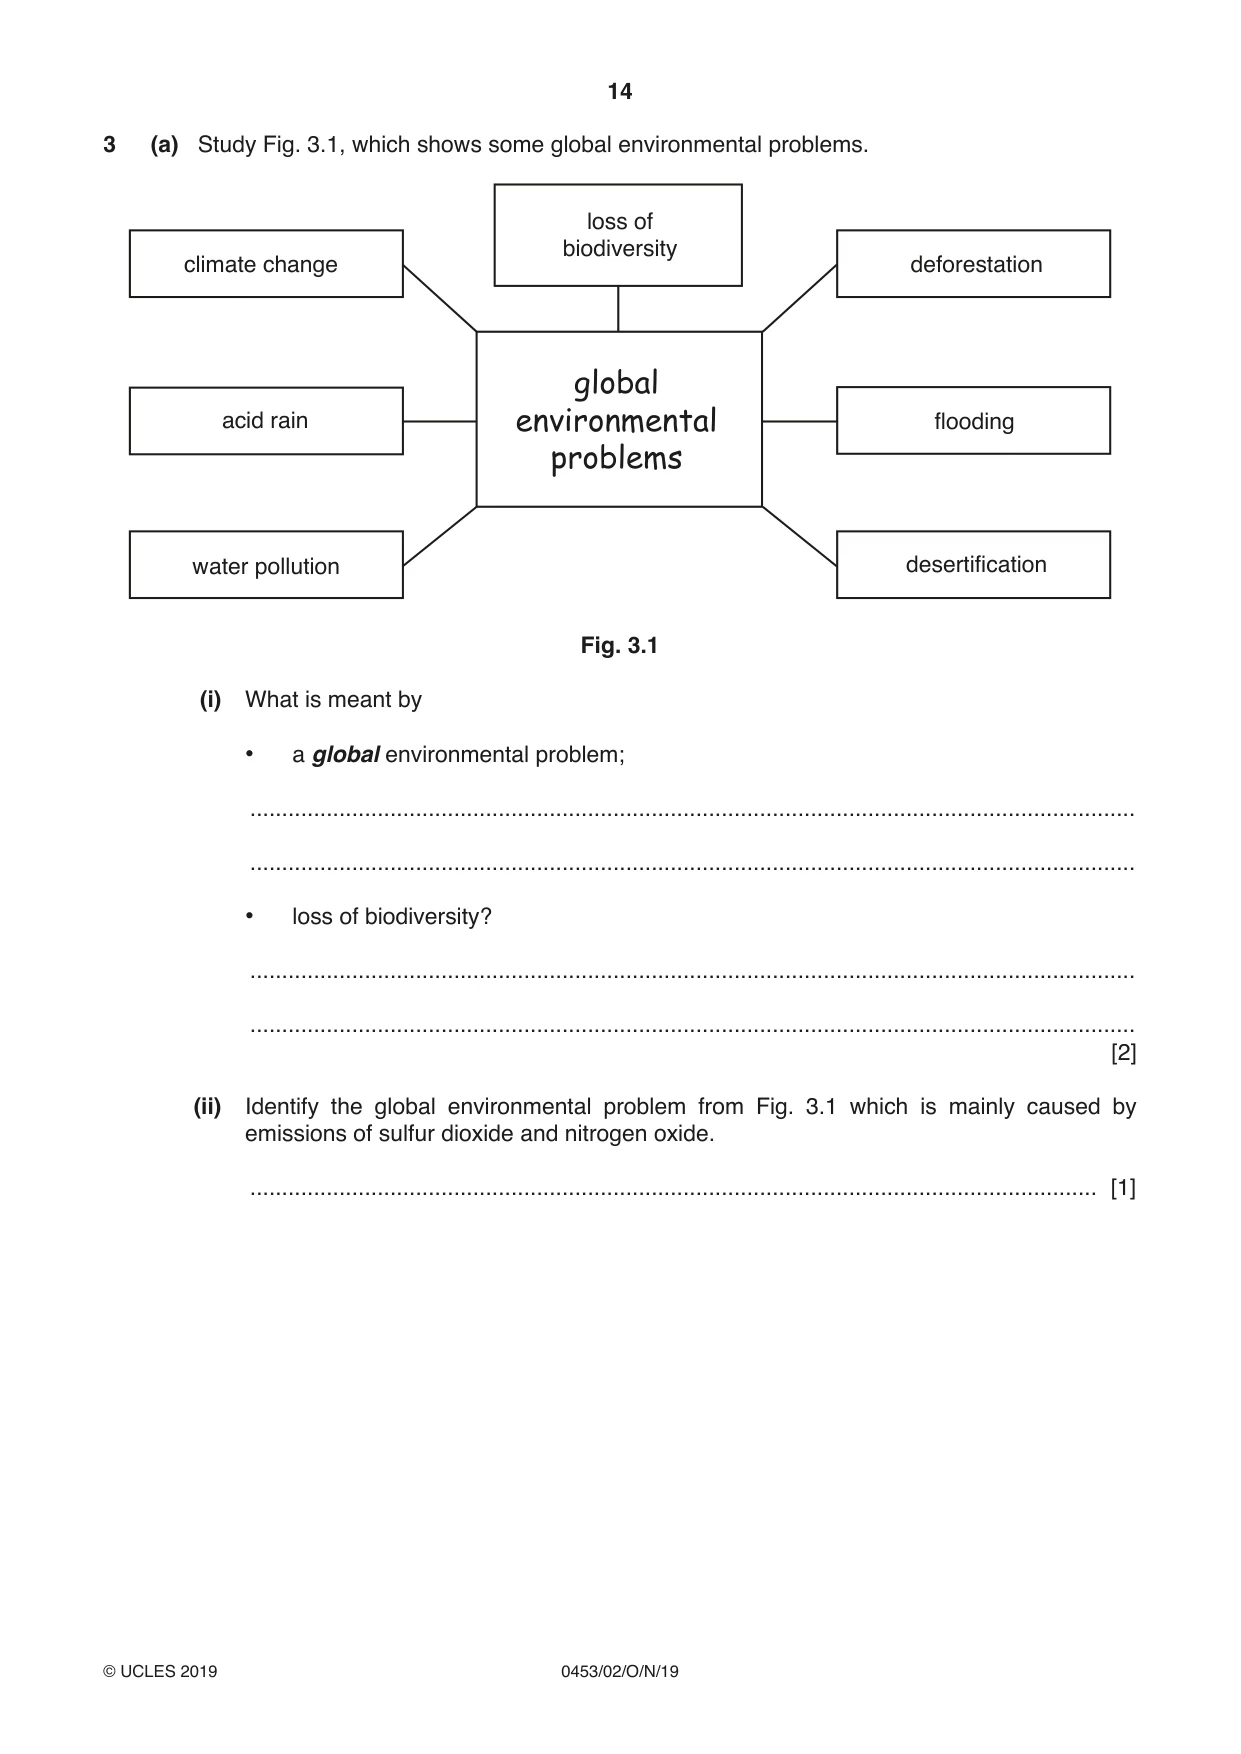
14 0453/02/O/N/19 © UCLES 2019 3 (a) Study Fig. 3.1, which shows some global environmental problems. global environmental problems loss of biodiversity deforestation flooding acid rain water pollution desertification climate change Fig. 3.1 (i) What is meant by • a global environmental problem; … … • loss of biodiversity? … … [2] (ii) Identify the global environmental problem from Fig. 3.1 which is mainly caused by emissions of sulfur dioxide and nitrogen oxide. … [1]
Question paper, page 15
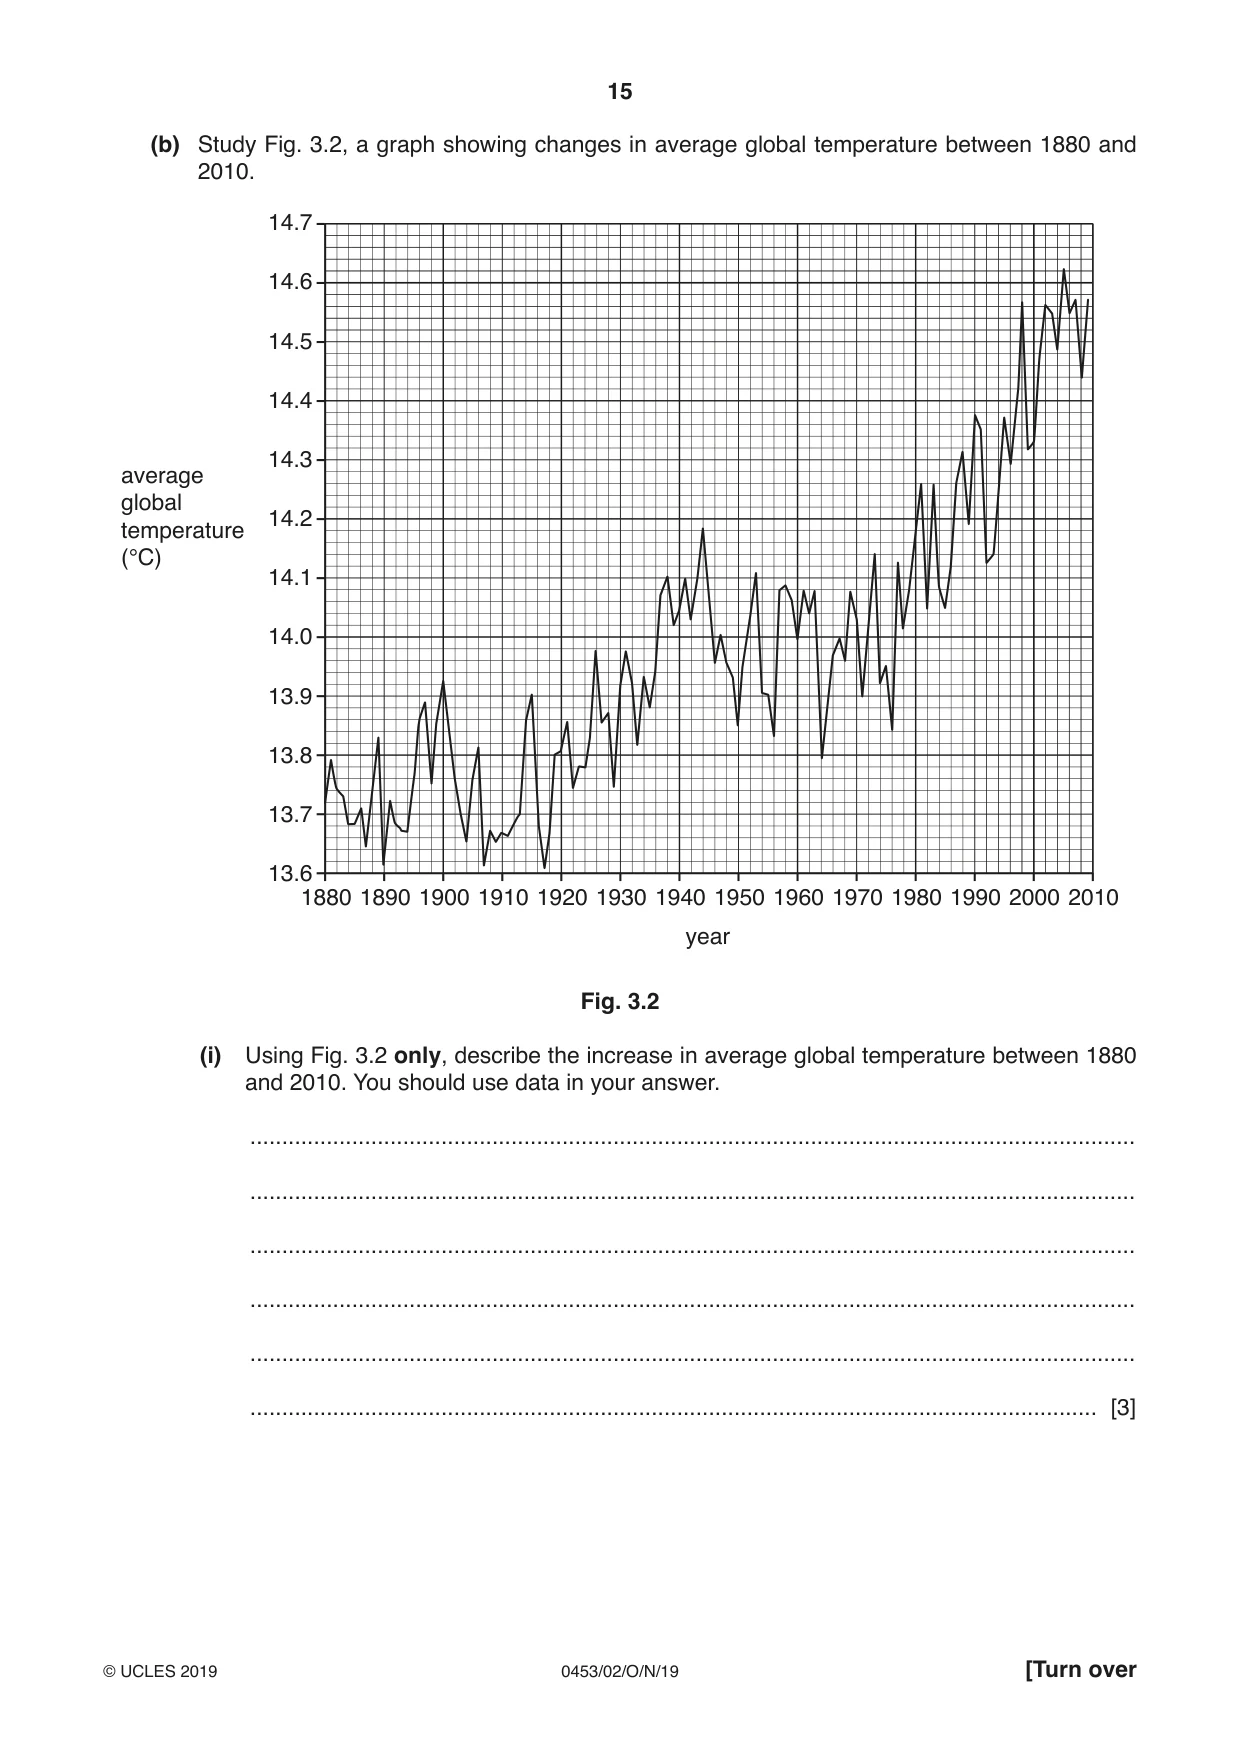
15 0453/02/O/N/19 © UCLES 2019 [Turn over (b) Study Fig. 3.2, a graph showing changes in average global temperature between 1880 and 2010. average global temperature (°C) year 1880 1890 1900 1910 1920 1930 1940 1950 1960 1970 1980 1990 2000 2010 14.7 14.6 14.5 14.4 14.3 14.2 14.1 14.0 13.9 13.8 13.7 13.6 Fig. 3.2 (i) Using Fig. 3.2 only, describe the increase in average global temperature between 1880 and 2010. You should use data in your answer. … … … … … … [3]
Question paper, page 16
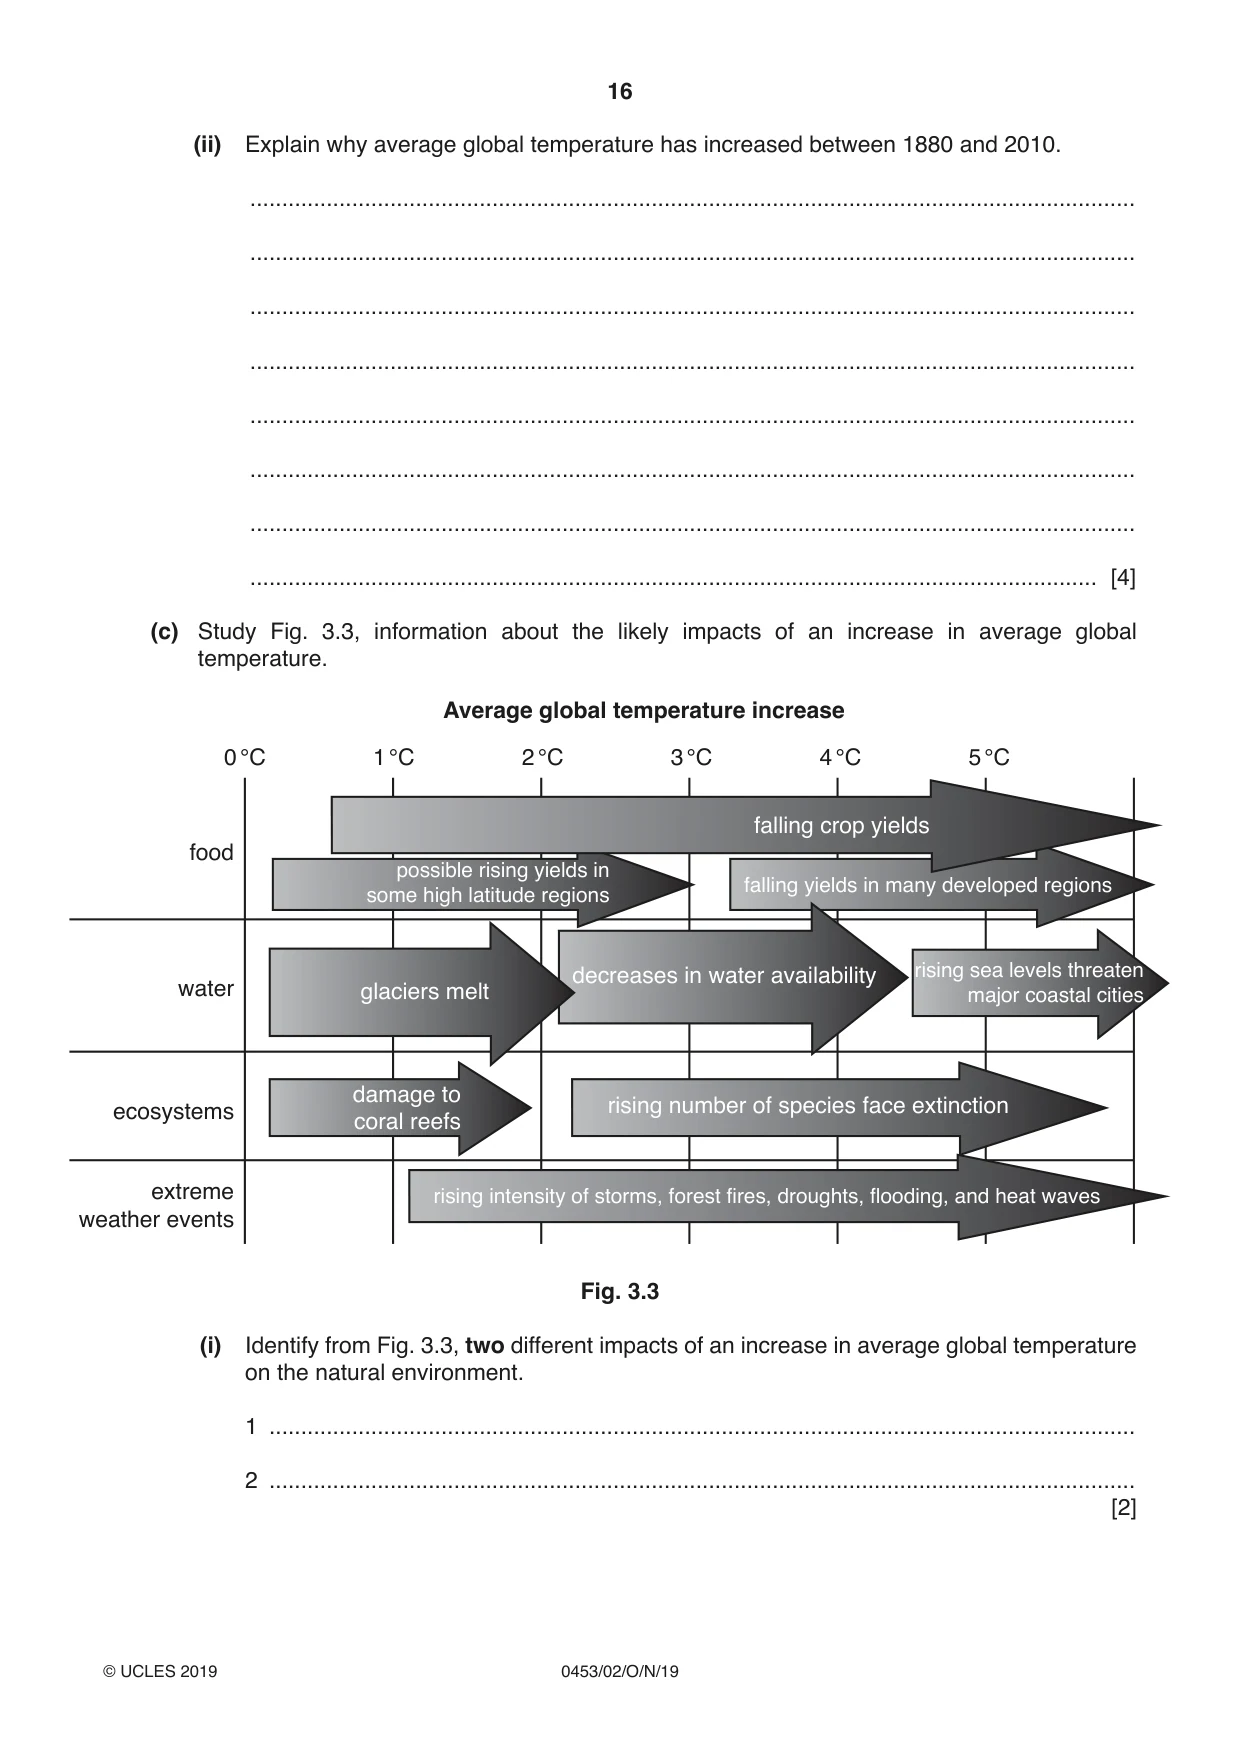
16 0453/02/O/N/19 © UCLES 2019 (ii) Explain why average global temperature has increased between 1880 and 2010. … … … … … … … … [4] (c) Study Fig. 3.3, information about the likely impacts of an increase in average global temperature. Average global temperature increase 0 °C food water ecosystems extreme weather events 1 °C 2 °C 3 °C 4 °C 5 °C falling crop yields possible rising yields in some high latitude regions rising sea levels threaten major coastal cities decreases in water availability rising number of species face extinction rising intensity of storms, forest fires, droughts, flooding, and heat waves glaciers melt damage to coral reefs falling yields in many developed regions Fig. 3.3 (i) Identify from Fig. 3.3, two different impacts of an increase in average global temperature on the natural environment. 1 … 2 … [2]
Question paper, page 17
17 0453/02/O/N/19 © UCLES 2019 [Turn over (ii) Explain why an increase in average global temperature will reduce supplies of food for many people in developing countries. … … … … … [2] (iii) Explain why the governments of some countries are more concerned about an increase in average global temperature than others. … … … … … … … … [4]
Question paper, page 18
18 0453/02/O/N/19 © UCLES 2019 (d) Study Fig. 3.4, an article about the Maldives, a country made up of many islands in the Indian Ocean, along with Fig. 3.5, Fig. 3.6 and Fig. 3.7 (Insert), photographs taken in the Maldives. Looking down from a seaplane flying above the Maldives, the coral islands are spread across the water. We land at a remote island, Maduvvari, with the vice-president of the Maldives, Mohamed Waheed. Maduvvari is home to about 2000 people. The vice-president takes me to a beach that used to be a road. It has now been covered by the sea, and houses nearby are crumbling into the water. They are dredging sand from the lagoon to build temporary flood barriers. “How long do you think this island can be inhabited?” I ask. “Not more than 20 years,” he says, “then we will have to abandon it. Children in the primary school now will not be able to live here, many will emigrate to other islands.” The vice-president has warned that people might have to emigrate to a new country unless sea-level rise can be prevented. So this week he announced that the Maldives hoped to become the world’s first country to meet all its energy needs from renewable sources, like wind and solar power. Another possible solution is to build high artificial islands. About 80% of the country’s land is less than a metre above sea level, but on the island of Hulhumale you can actually look down on the sea from a height. The whole island has been raised and reclaimed using sand, concrete and shingle, to protect it from storm surges and higher tides, which could provide a solution that will allow people to continue living in the Maldives for hundreds of years. “We’re proposing big new islands which are built up to three metres high in seven different parts of the country,” he says. “That will be enough for the entire Maldives population, 300 000 people. The people who don’t want to move to other countries can move to higher ground within the Maldives.” Fig. 3.4 The government of the Maldives is concerned about the impacts of rising sea levels caused by increasing average global temperature. Study Fig. 3.8, which shows information about four possible strategies being considered to reduce the impact of rising sea levels. Strategy A Use renewable energy supplies, such as wind and solar power. Strategy B Give grants to the local authorities to build flood barriers around all islands. Strategy C Build new islands in seven different parts of the country to a height of 3 metres above sea level. Strategy D Encourage emigration to other countries. Fig. 3.8
Question paper, page 19
19 0453/02/O/N/19 © UCLES 2019 [Turn over (i) Explain why strategy A will not be very effective to reduce the problems caused in the Maldives by rising sea levels. … … … … … … … … [4] Question 3(d)(ii) is printed on the next page. Permission to reproduce items where third-party owned material protected by copyright is included has been sought and cleared where possible. Every reasonable effort has been made by the publisher (UCLES) to trace copyright holders, but if any items requiring clearance have unwittingly been included, the publisher will be pleased to make amends at the earliest possible opportunity. To avoid the issue of disclosure of answer-related information to candidates, all copyright acknowledgements are reproduced online in the Cambridge Assessment International Education Copyright Acknowledgements Booklet. This is produced for each series of examinations and is freely available to download at www.cambridgeinternational.org after the live examination series. Cambridge Assessment International Education is part of the Cambridge Assessment Group. Cambridge Assessment is the brand name of the University of Cambridge Local Examinations Syndicate (UCLES), which itself is a department of the University of Cambridge.
Question paper, page 20
20 0453/02/O/N/19 © UCLES 2019 (ii) Which strategy, B, C or D, do you think will be most effective? Explain your reasons for choosing this strategy. You should do this by describing the advantages of the strategy you have chosen and the disadvantages of the two strategies you have rejected. Strategy chosen … … … … … … … … … … … … … … … … … … … … … … … … [9] [Total: 31]
Mark scheme, page 1
This document consists of 8 printed pages. © UCLES 2019 [Turn over Cambridge Assessment International Education Cambridge International General Certificate of Secondary Education DEVELOPMENT STUDIES 0453/02 Paper 2 October/November 2019 MARK SCHEME Maximum Mark: 80 Published This mark scheme is published as an aid to teachers and candidates, to indicate the requirements of the examination. It shows the basis on which Examiners were instructed to award marks. It does not indicate the details of the discussions that took place at an Examiners’ meeting before marking began, which would have considered the acceptability of alternative answers. Mark schemes should be read in conjunction with the question paper and the Principal Examiner Report for Teachers. Cambridge International will not enter into discussions about these mark schemes. Cambridge International is publishing the mark schemes for the October/November 2019 series for most Cambridge IGCSE™, Cambridge International A and AS Level components and some Cambridge O Level components.
Mark scheme, page 2
0453/02 Cambridge IGCSE – Mark Scheme PUBLISHED October/November 2019 © UCLES 2019 Page 2 of 8 Generic Marking Principles These general marking principles must be applied by all examiners when marking candidate answers. They should be applied alongside the specific content of the mark scheme or generic level descriptors for a question. Each question paper and mark scheme will also comply with these marking principles. GENERIC MARKING PRINCIPLE 1: Marks must be awarded in line with: • the specific content of the mark scheme or the generic level descriptors for the question • the specific skills defined in the mark scheme or in the generic level descriptors for the question • the standard of response required by a candidate as exemplified by the standardisation scripts. GENERIC MARKING PRINCIPLE 2: Marks awarded are always whole marks (not half marks, or other fractions). GENERIC MARKING PRINCIPLE 3: Marks must be awarded positively: • marks are awarded for correct/valid answers, as defined in the mark scheme. However, credit is given for valid answers which go beyond the scope of the syllabus and mark scheme, referring to your Team Leader as appropriate • marks are awarded when candidates clearly demonstrate what they know and can do • marks are not deducted for errors • marks are not deducted for omissions • answers should only be judged on the quality of spelling, punctuation and grammar when these features are specifically assessed by the question as indicated by the mark scheme. The meaning, however, should be unambiguous. GENERIC MARKING PRINCIPLE 4: Rules must be applied consistently e.g. in situations where candidates have not followed instructions or in the application of generic level descriptors. GENERIC MARKING PRINCIPLE 5: Marks should be awarded using the full range of marks defined in the mark scheme for the question (however; the use of the full mark range may be limited according to the quality of the candidate responses seen). GENERIC MARKING PRINCIPLE 6: Marks awarded are based solely on the requirements as defined in the mark scheme. Marks should not be awarded with grade thresholds or grade descriptors in mind.
Mark scheme, page 3
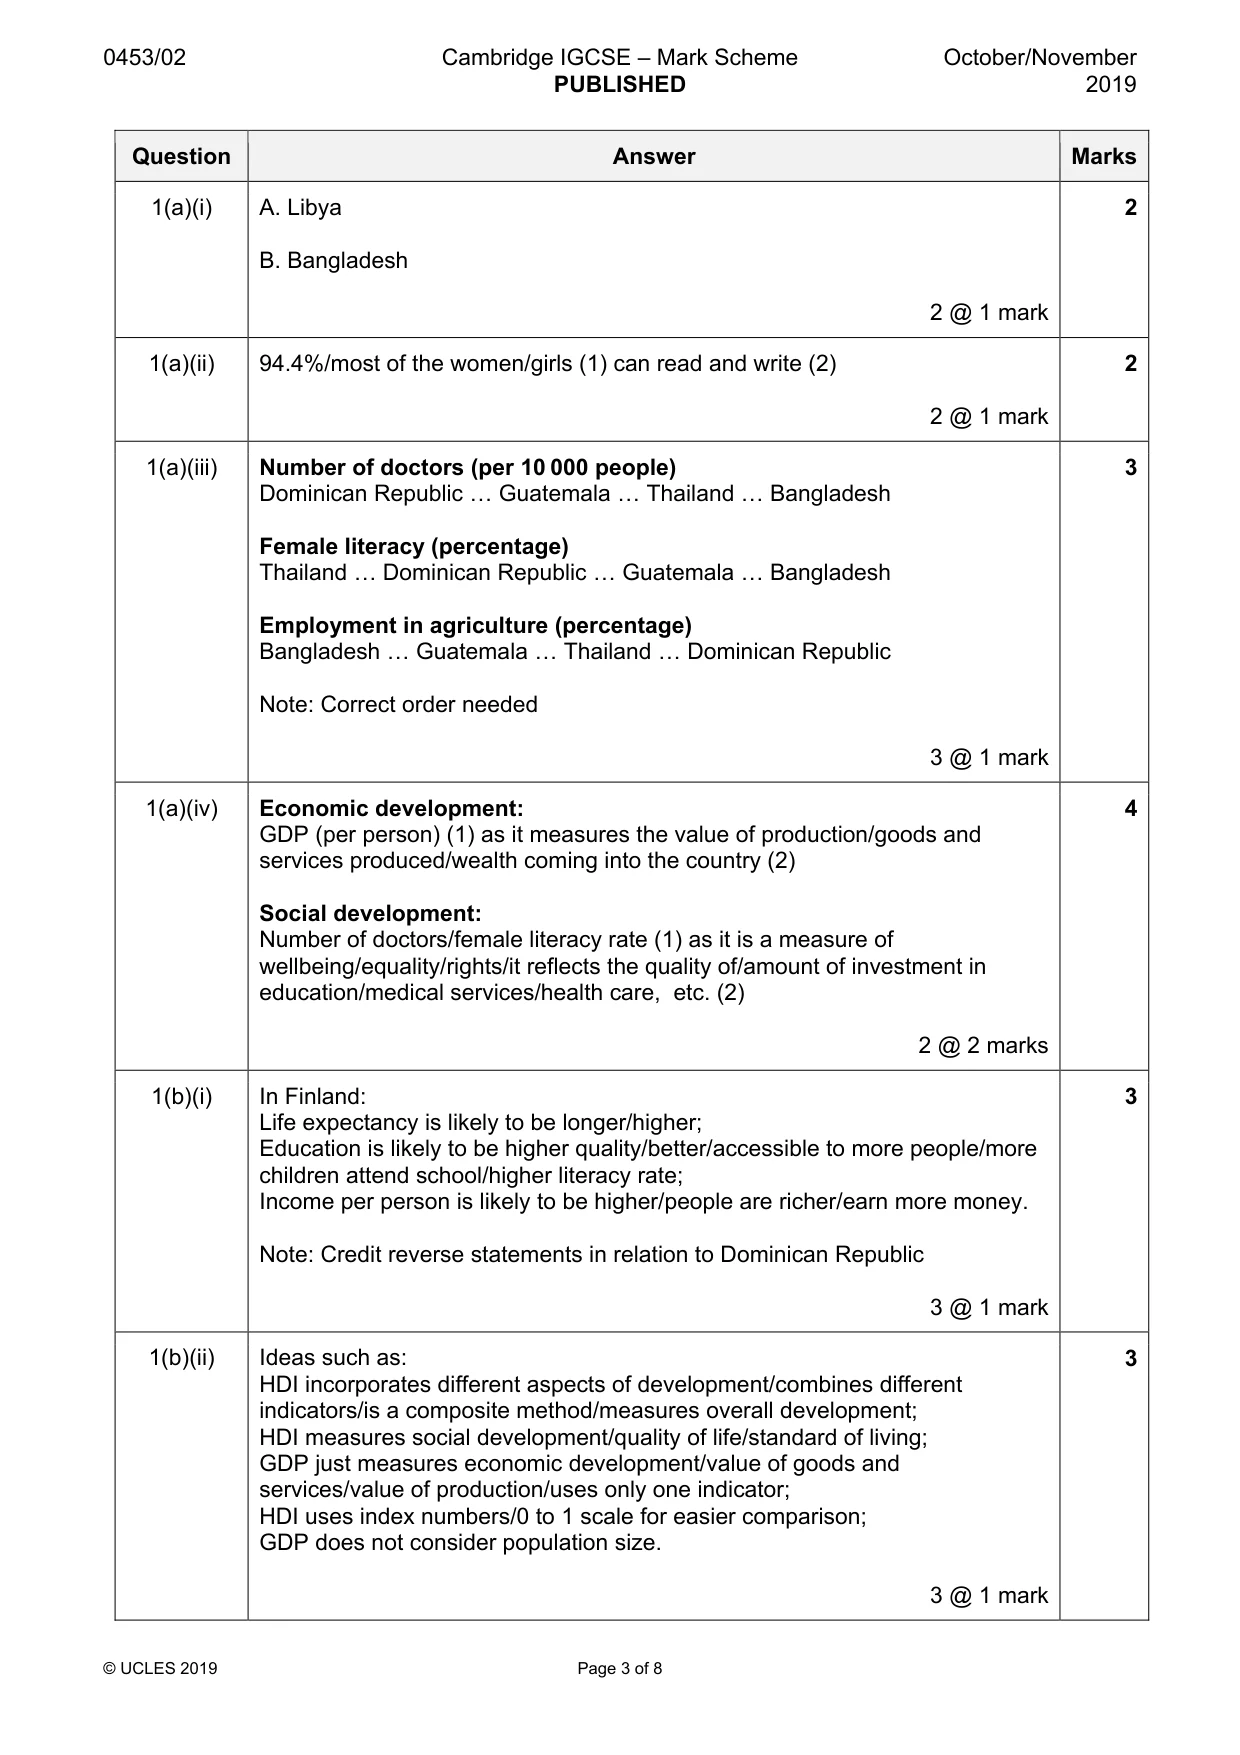
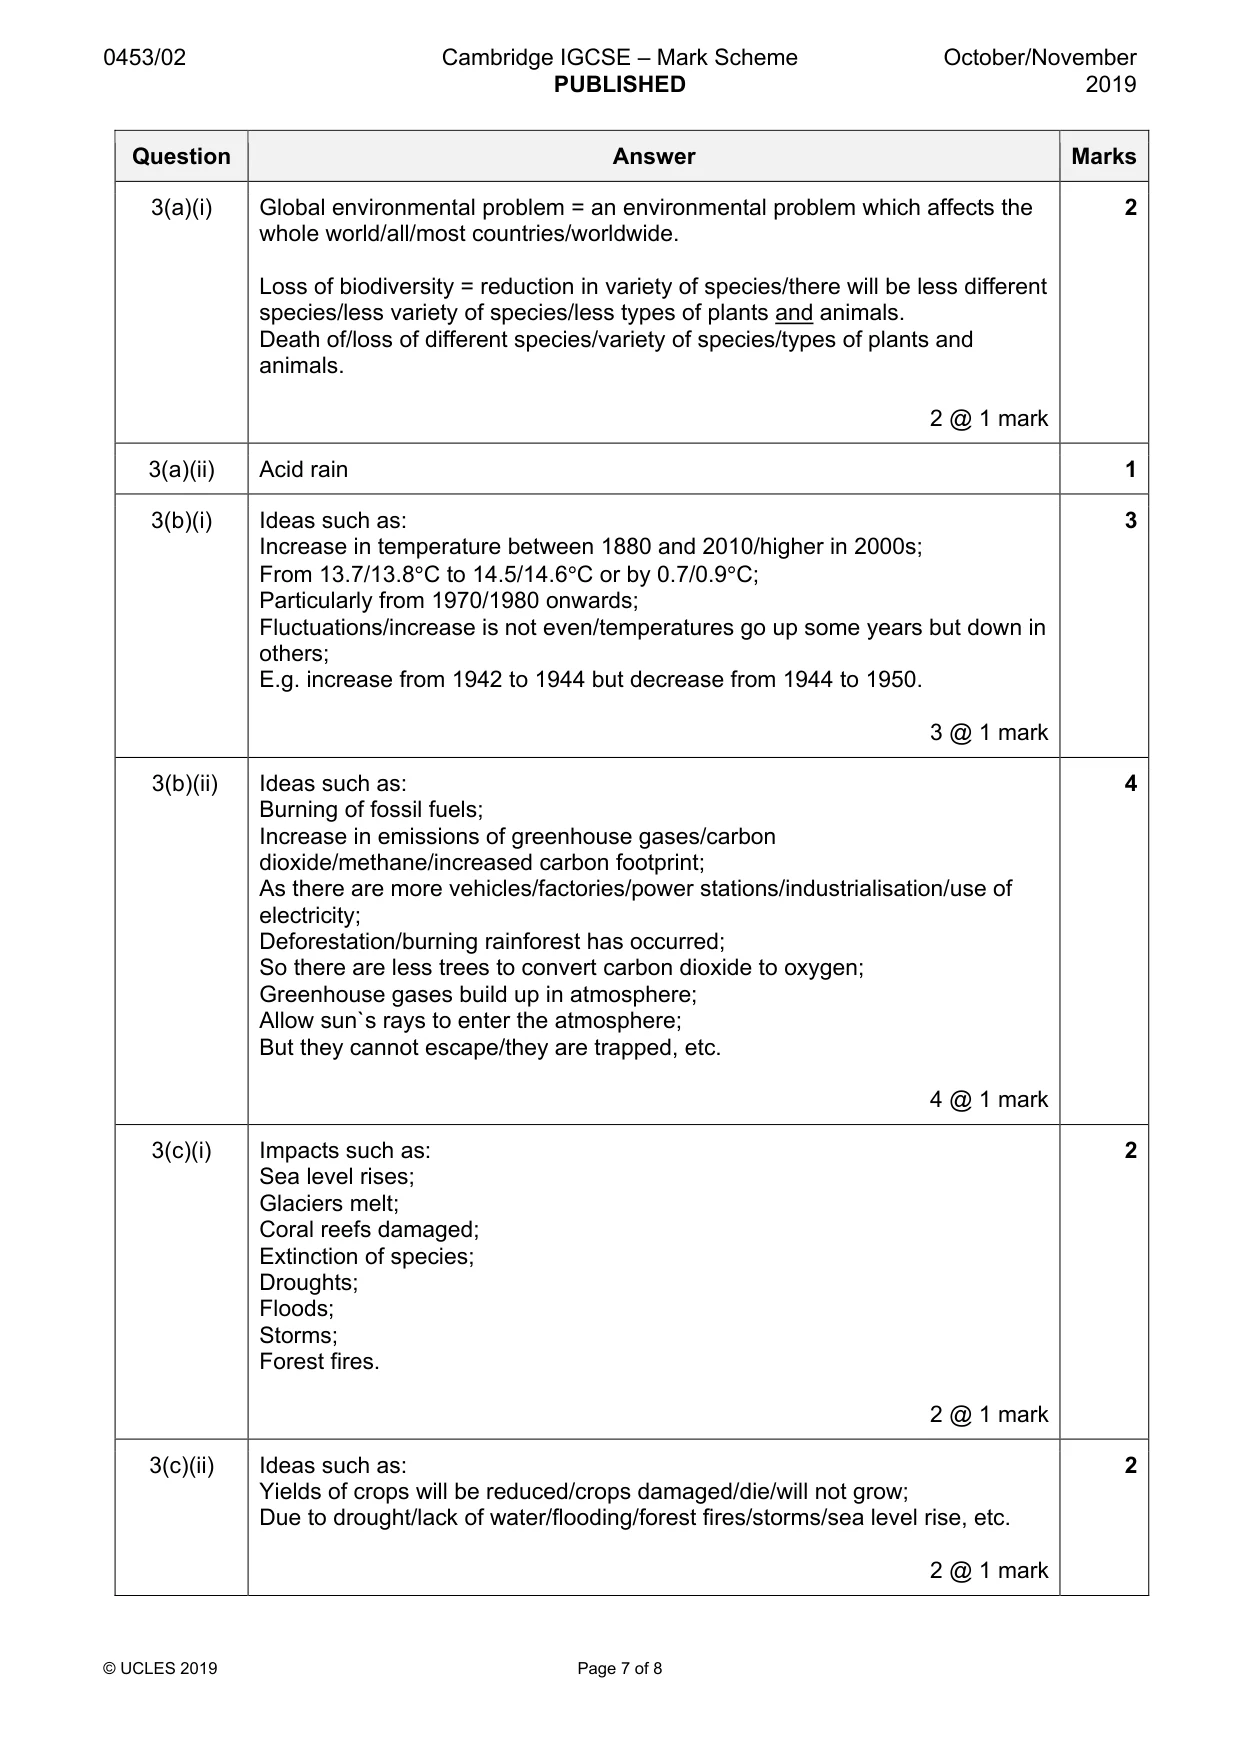
0453/02 Cambridge IGCSE – Mark Scheme PUBLISHED October/November 2019 © UCLES 2019 Page 3 of 8 Question Answer Marks 1(a)(i) A. Libya B. Bangladesh 2 @ 1 mark 2 1(a)(ii) 94.4%/most of the women/girls (1) can read and write (2) 2 @ 1 mark 2 1(a)(iii) Number of doctors (per 10 000 people) Dominican Republic « Guatemala « Thailand « Bangladesh Female literacy (percentage) Thailand « Dominican Republic « Guatemala « Bangladesh Employment in agriculture (percentage) Bangladesh « Guatemala « Thailand « Dominican Republic Note: Correct order needed 3 @ 1 mark 3 1(a)(iv) Economic development: GDP (per person) (1) as it measures the value of production/goods and services produced/wealth coming into the country (2) Social development: Number of doctors/female literacy rate (1) as it is a measure of wellbeing/equality/rights/it reflects the quality of/amount of investment in education/medical services/health care, etc. (2) 2 @ 2 marks 4 1(b)(i) In Finland: Life expectancy is likely to be longer/higher; Education is likely to be higher quality/better/accessible to more people/more children attend school/higher literacy rate; Income per person is likely to be higher/people are richer/earn more money. Note: Credit reverse statements in relation to Dominican Republic 3 @ 1 mark 3 1(b)(ii) Ideas such as: HDI incorporates different aspects of development/combines different indicators/is a composite method/measures overall development; HDI measures social development/quality of life/standard of living; GDP just measures economic development/value of goods and services/value of production/uses only one indicator; HDI uses index numbers/0 to 1 scale for easier comparison; GDP does not consider population size. 3 @ 1 mark 3
Mark scheme, page 4
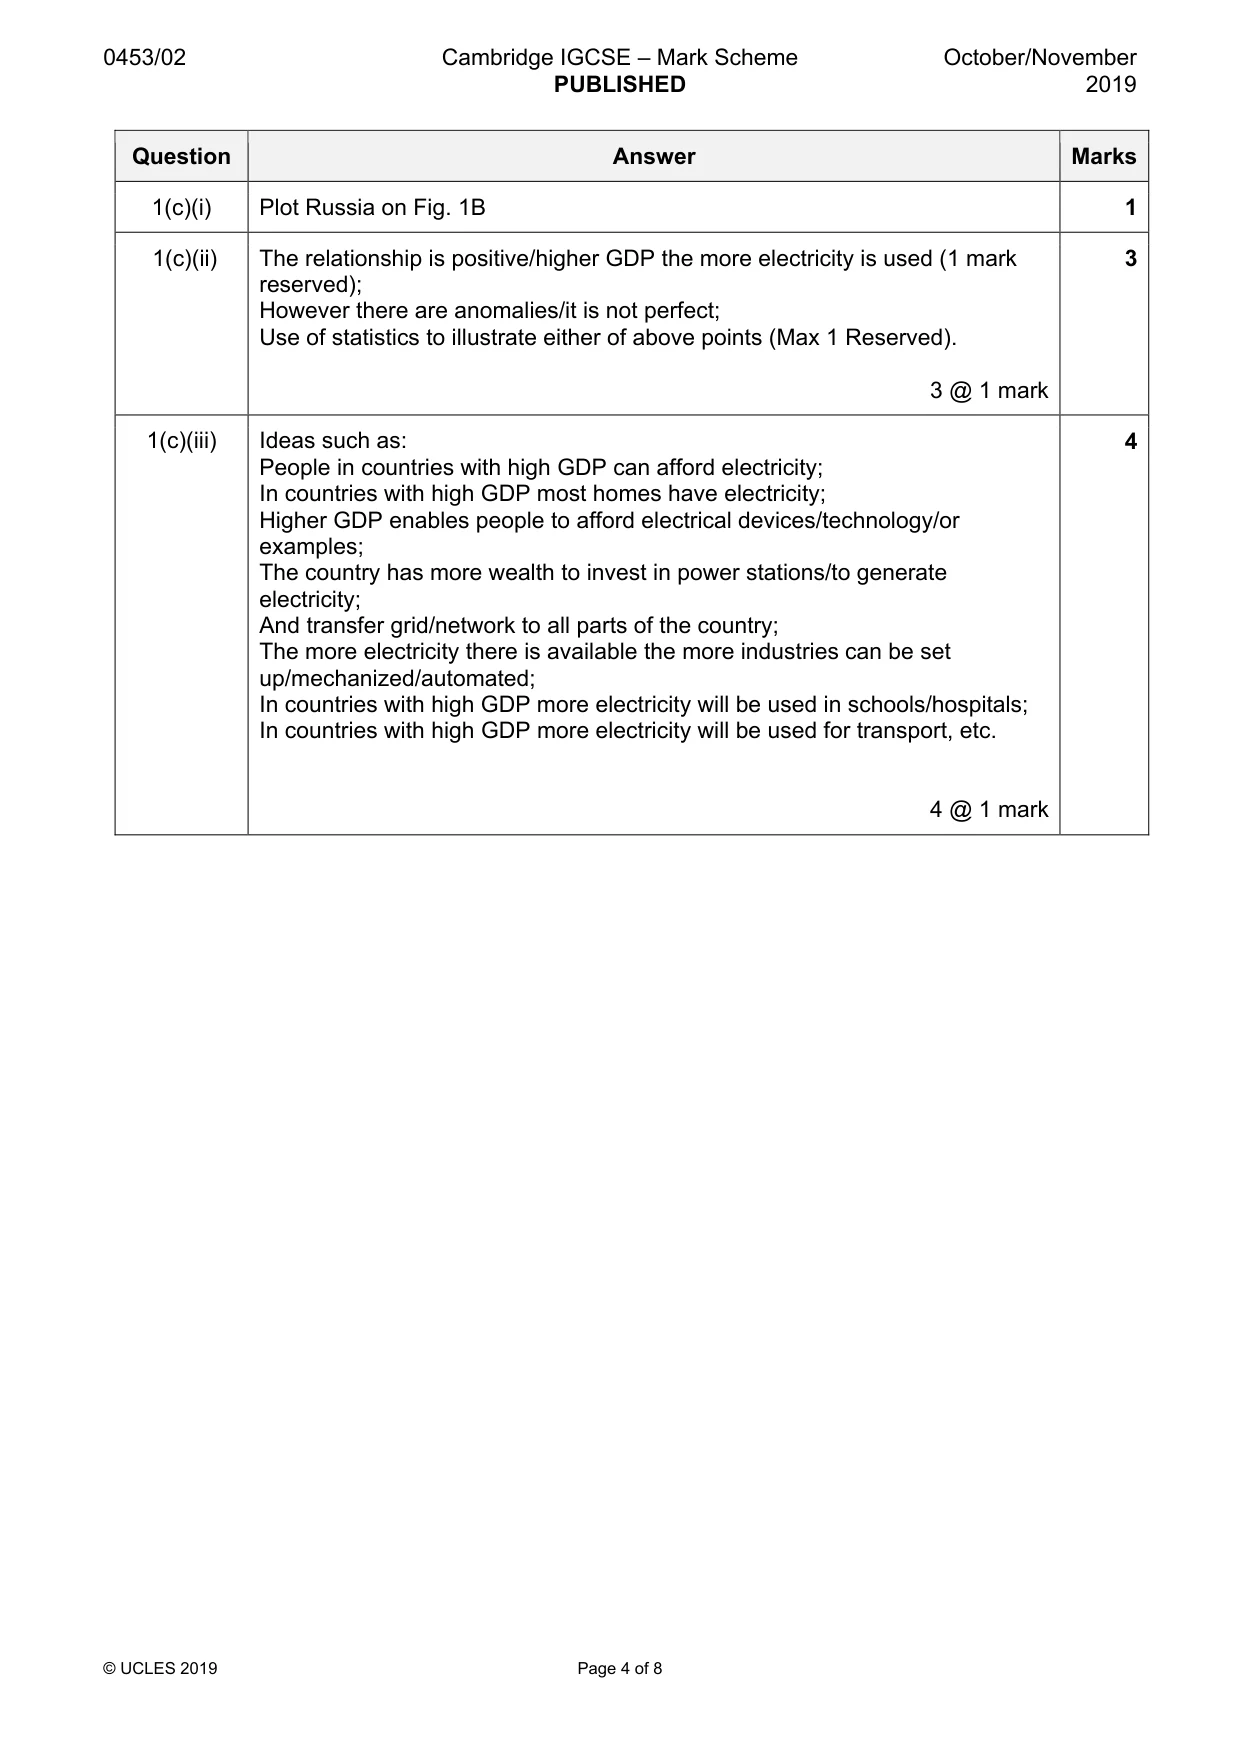
0453/02 Cambridge IGCSE – Mark Scheme PUBLISHED October/November 2019 © UCLES 2019 Page 4 of 8 Question Answer Marks 1(c)(i) Plot Russia on Fig. 1B 1 1(c)(ii) The relationship is positive/higher GDP the more electricity is used (1 mark reserved); However there are anomalies/it is not perfect; Use of statistics to illustrate either of above points (Max 1 Reserved). 3 @ 1 mark 3 1(c)(iii) Ideas such as: People in countries with high GDP can afford electricity; In countries with high GDP most homes have electricity; Higher GDP enables people to afford electrical devices/technology/or examples; The country has more wealth to invest in power stations/to generate electricity; And transfer grid/network to all parts of the country; The more electricity there is available the more industries can be set up/mechanized/automated; In countries with high GDP more electricity will be used in schools/hospitals; In countries with high GDP more electricity will be used for transport, etc. 4 @ 1 mark 4
Mark scheme, page 5
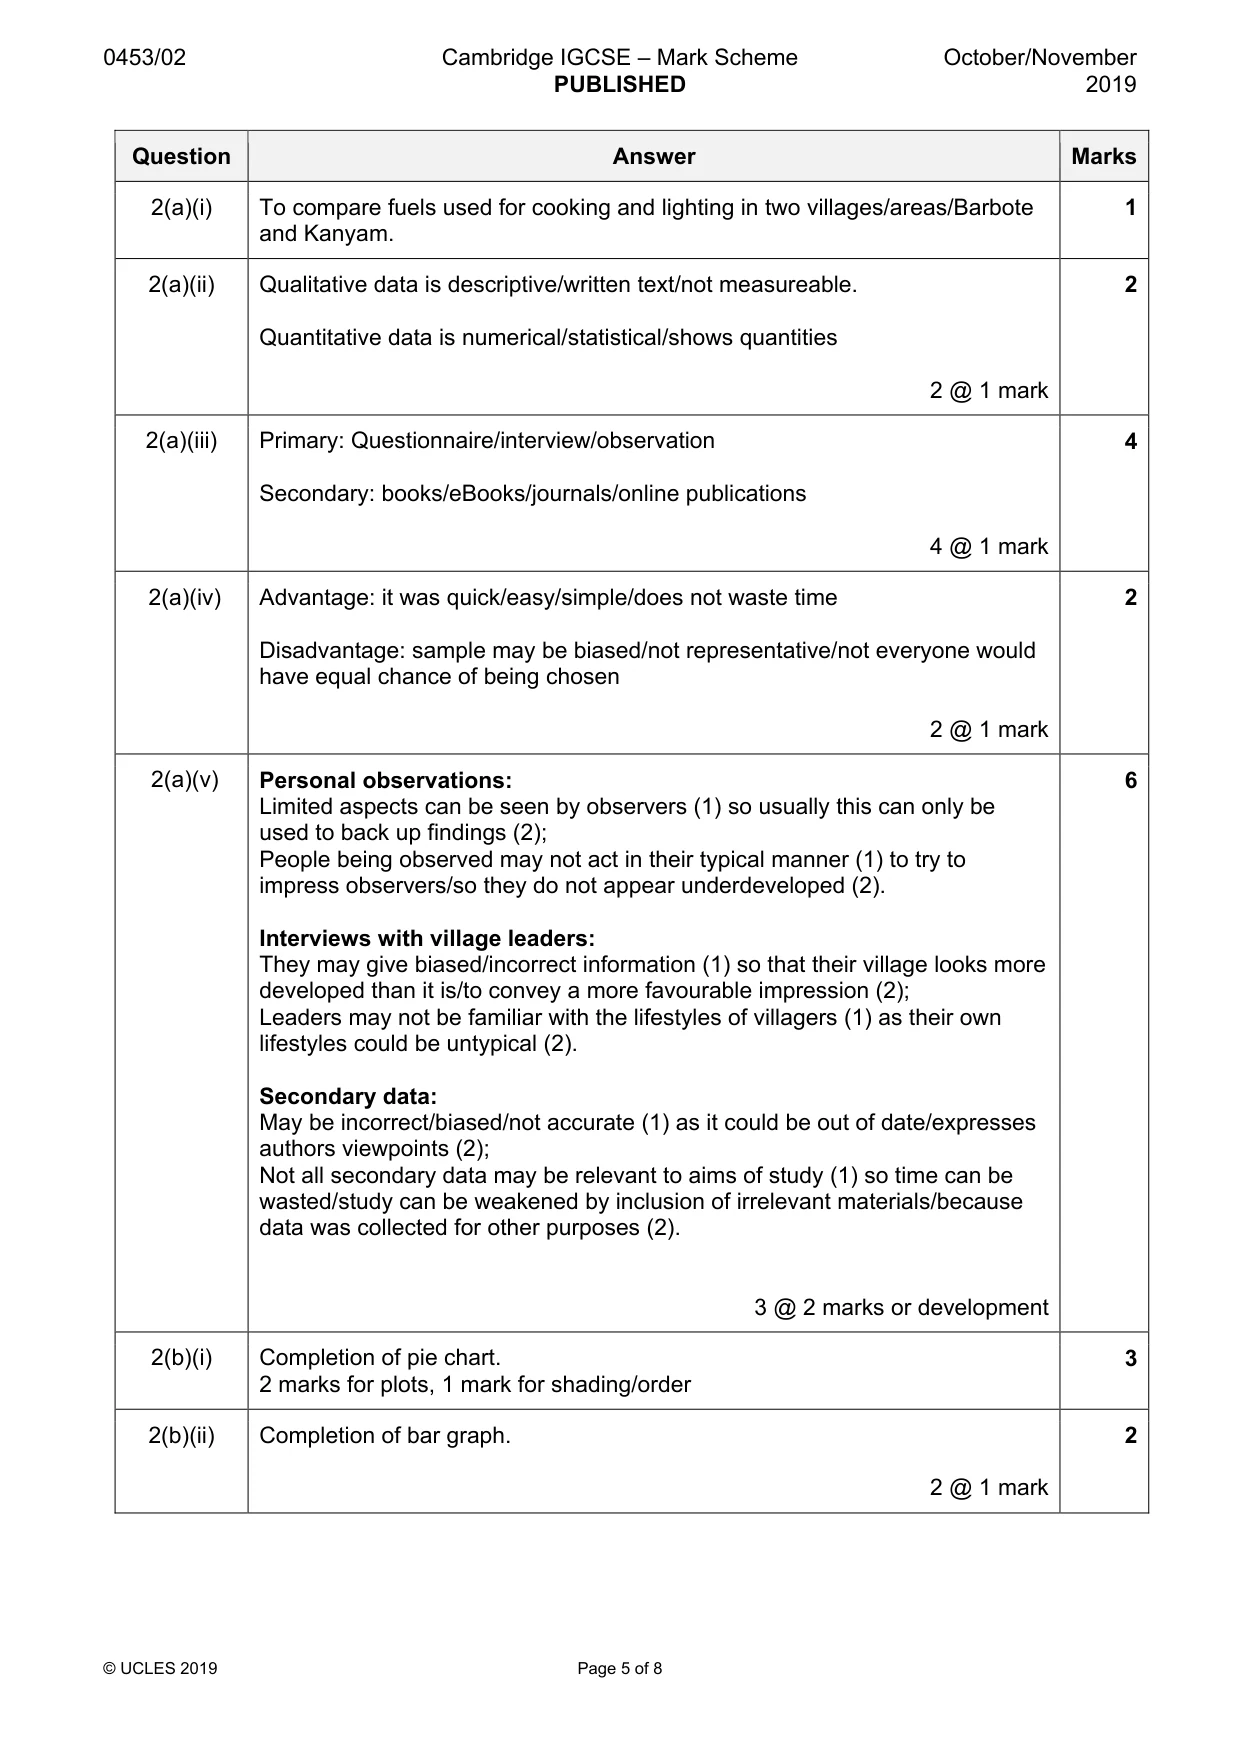
0453/02 Cambridge IGCSE – Mark Scheme PUBLISHED October/November 2019 © UCLES 2019 Page 5 of 8 Question Answer Marks 2(a)(i) To compare fuels used for cooking and lighting in two villages/areas/Barbote and Kanyam. 1 2(a)(ii) Qualitative data is descriptive/written text/not measureable. Quantitative data is numerical/statistical/shows quantities 2 @ 1 mark 2 2(a)(iii) Primary: Questionnaire/interview/observation Secondary: books/eBooks/journals/online publications 4 @ 1 mark 4 2(a)(iv) Advantage: it was quick/easy/simple/does not waste time Disadvantage: sample may be biased/not representative/not everyone would have equal chance of being chosen 2 @ 1 mark 2 2(a)(v) Personal observations: Limited aspects can be seen by observers (1) so usually this can only be used to back up findings (2); People being observed may not act in their typical manner (1) to try to impress observers/so they do not appear underdeveloped (2). Interviews with village leaders: They may give biased/incorrect information (1) so that their village looks more developed than it is/to convey a more favourable impression (2); Leaders may not be familiar with the lifestyles of villagers (1) as their own lifestyles could be untypical (2). Secondary data: May be incorrect/biased/not accurate (1) as it could be out of date/expresses authors viewpoints (2); Not all secondary data may be relevant to aims of study (1) so time can be wasted/study can be weakened by inclusion of irrelevant materials/because data was collected for other purposes (2). 3 @ 2 marks or development 6 2(b)(i) Completion of pie chart. 2 marks for plots, 1 mark for shading/order 3 2(b)(ii) Completion of bar graph. 2 @ 1 mark 2
Mark scheme, page 6
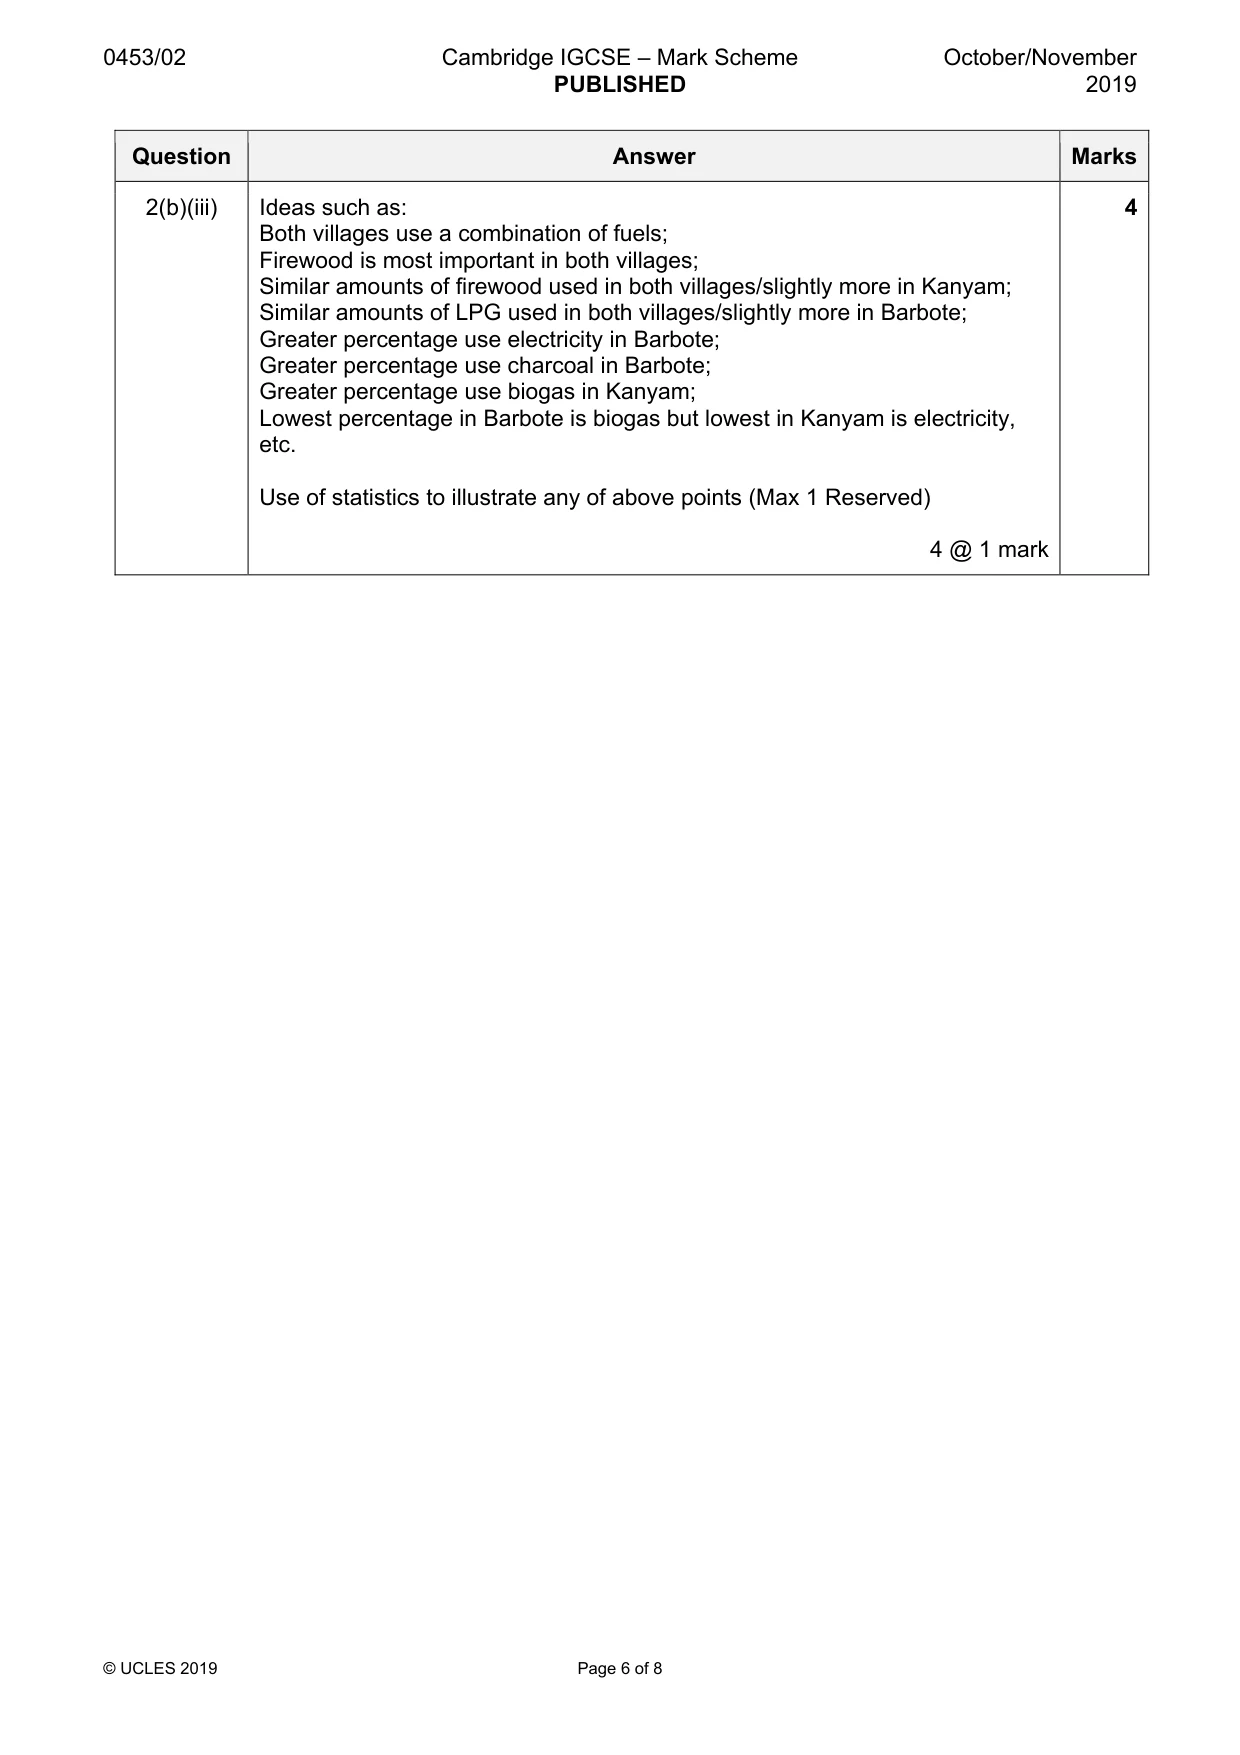
0453/02 Cambridge IGCSE – Mark Scheme PUBLISHED October/November 2019 © UCLES 2019 Page 6 of 8 Question Answer Marks 2(b)(iii) Ideas such as: Both villages use a combination of fuels; Firewood is most important in both villages; Similar amounts of firewood used in both villages/slightly more in Kanyam; Similar amounts of LPG used in both villages/slightly more in Barbote; Greater percentage use electricity in Barbote; Greater percentage use charcoal in Barbote; Greater percentage use biogas in Kanyam; Lowest percentage in Barbote is biogas but lowest in Kanyam is electricity, etc. Use of statistics to illustrate any of above points (Max 1 Reserved) 4 @ 1 mark 4
Mark scheme, page 7
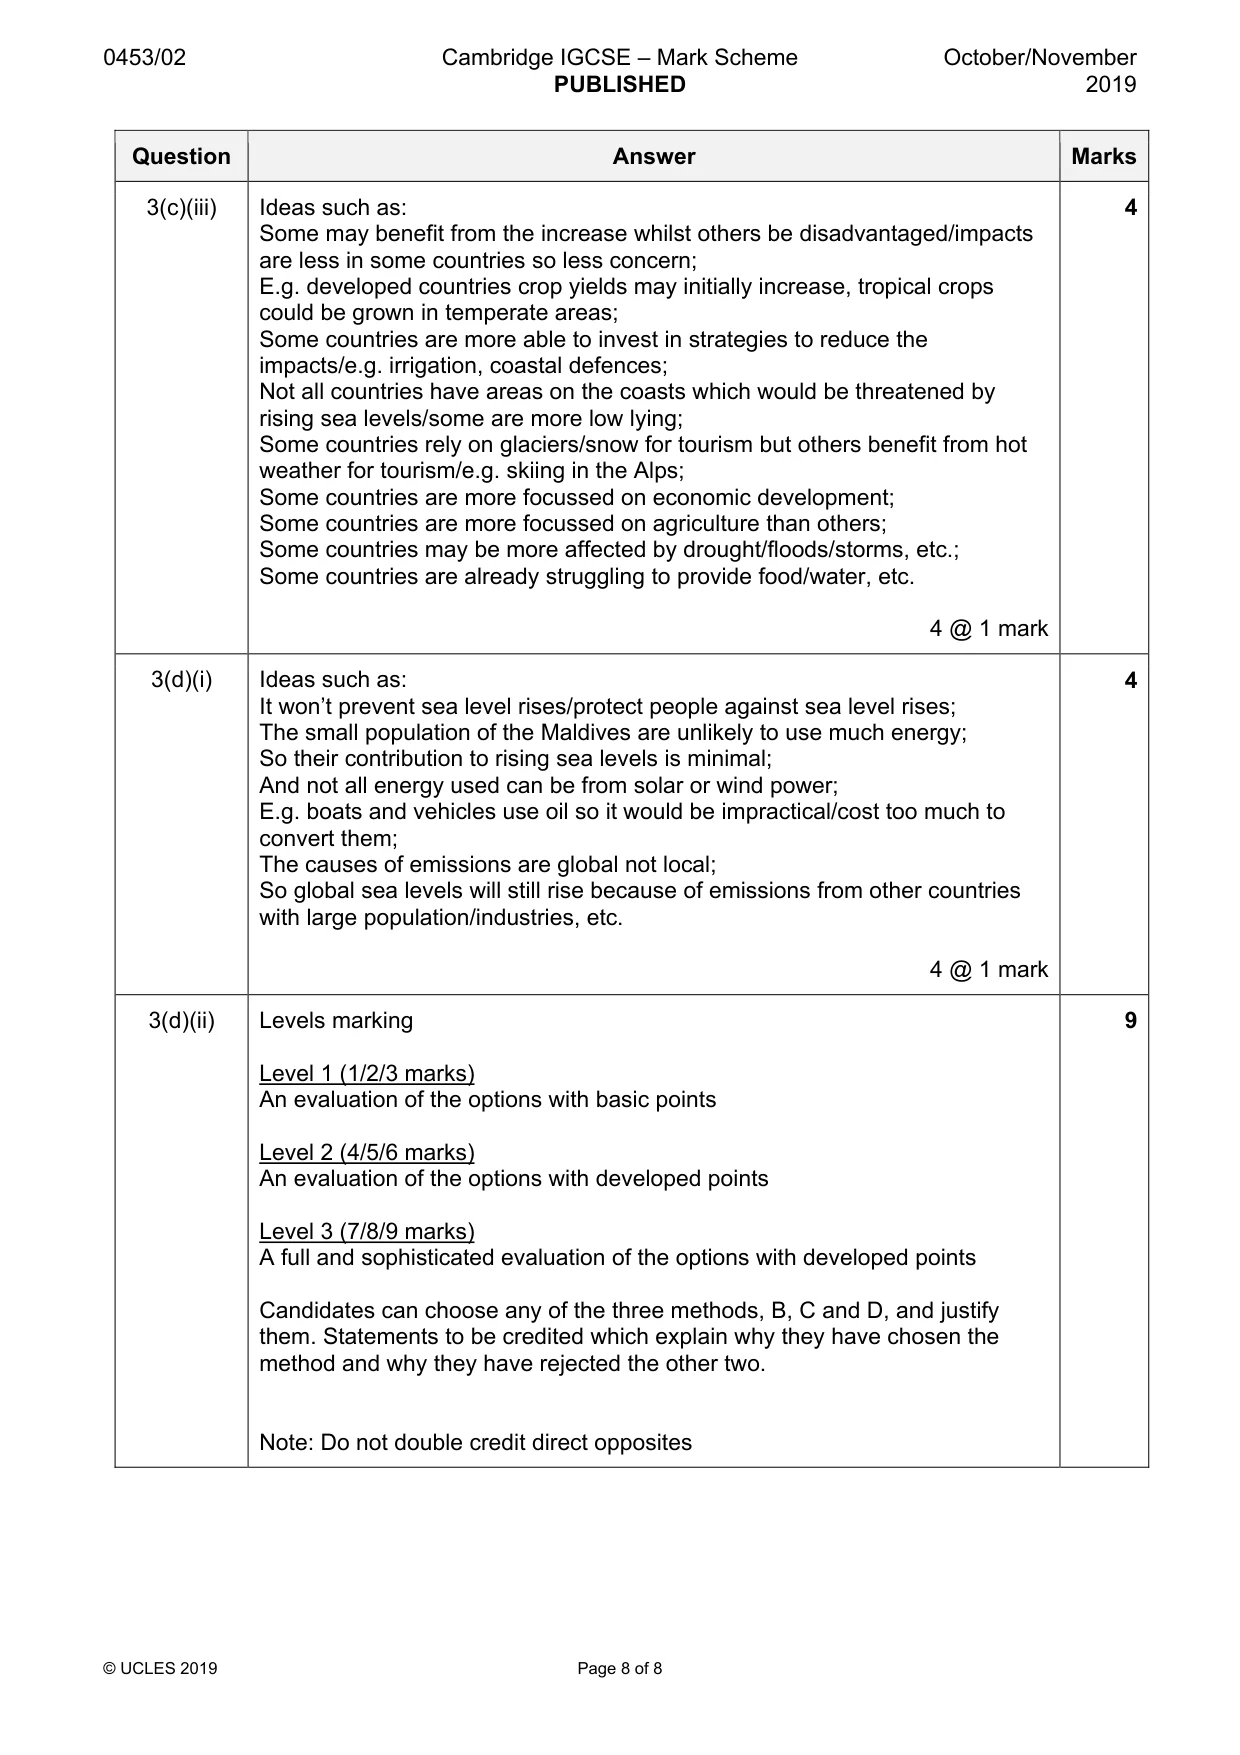
0453/02 Cambridge IGCSE – Mark Scheme PUBLISHED October/November 2019 © UCLES 2019 Page 7 of 8 Question Answer Marks 3(a)(i) Global environmental problem = an environmental problem which affects the whole world/all/most countries/worldwide. Loss of biodiversity = reduction in variety of species/there will be less different species/less variety of species/less types of plants and animals. Death of/loss of different species/variety of species/types of plants and animals. 2 @ 1 mark 2 3(a)(ii) Acid rain 1 3(b)(i) Ideas such as: Increase in temperature between 1880 and 2010/higher in 2000s; From 13.7/13.8°C to 14.5/14.6°C or by 0.7/0.9°C; Particularly from 1970/1980 onwards; Fluctuations/increase is not even/temperatures go up some years but down in others; E.g. increase from 1942 to 1944 but decrease from 1944 to 1950. 3 @ 1 mark 3 3(b)(ii) Ideas such as: Burning of fossil fuels; Increase in emissions of greenhouse gases/carbon dioxide/methane/increased carbon footprint; As there are more vehicles/factories/power stations/industrialisation/use of electricity; Deforestation/burning rainforest has occurred; So there are less trees to convert carbon dioxide to oxygen; Greenhouse gases build up in atmosphere; Allow sun`s rays to enter the atmosphere; But they cannot escape/they are trapped, etc. 4 @ 1 mark 4 3(c)(i) Impacts such as: Sea level rises; Glaciers melt; Coral reefs damaged; Extinction of species; Droughts; Floods; Storms; Forest fires. 2 @ 1 mark 2 3(c)(ii) Ideas such as: Yields of crops will be reduced/crops damaged/die/will not grow; Due to drought/lack of water/flooding/forest fires/storms/sea level rise, etc. 2 @ 1 mark 2
Mark scheme, page 8
0453/02 Cambridge IGCSE – Mark Scheme PUBLISHED October/November 2019 © UCLES 2019 Page 8 of 8 Question Answer Marks 3(c)(iii) Ideas such as: Some may benefit from the increase whilst others be disadvantaged/impacts are less in some countries so less concern; E.g. developed countries crop yields may initially increase, tropical crops could be grown in temperate areas; Some countries are more able to invest in strategies to reduce the impacts/e.g. irrigation, coastal defences; Not all countries have areas on the coasts which would be threatened by rising sea levels/some are more low lying; Some countries rely on glaciers/snow for tourism but others benefit from hot weather for tourism/e.g. skiing in the Alps; Some countries are more focussed on economic development; Some countries are more focussed on agriculture than others; Some countries may be more affected by drought/floods/storms, etc.; Some countries are already struggling to provide food/water, etc. 4 @ 1 mark 4 3(d)(i) Ideas such as: It won’t prevent sea level rises/protect people against sea level rises; The small population of the Maldives are unlikely to use much energy; So their contribution to rising sea levels is minimal; And not all energy used can be from solar or wind power; E.g. boats and vehicles use oil so it would be impractical/cost too much to convert them; The causes of emissions are global not local; So global sea levels will still rise because of emissions from other countries with large population/industries, etc. 4 @ 1 mark 4 3(d)(ii) Levels marking Level 1 (1/2/3 marks) An evaluation of the options with basic points Level 2 (4/5/6 marks) An evaluation of the options with developed points Level 3 (7/8/9 marks) A full and sophisticated evaluation of the options with developed points Candidates can choose any of the three methods, B, C and D, and justify them. Statements to be credited which explain why they have chosen the method and why they have rejected the other two. Note: Do not double credit direct opposites 9
What you needed in this session
Cambridge’s own grade thresholds for 2019 Oct/Nov, Paper 2 · Variant 1. A higher threshold means an easier paper — the bar moves with how the cohort did.