Cambridge IGCSE Development Studies 0453 — 2017 Oct/Nov Paper 2 · Variant 1
0453/21/O/N/17 · 80 marks · ≈90 min
The question paper and its mark scheme, free to read here and free to download. This is Cambridge’s own paper, exactly as it was sat.
Question paper20 pages



Mark scheme12 pages
Answers below. Sit the paper first if you are practising.
Paper as text
Question paper, page 1
* 4 7 0 4 0 0 1 0 1 5 * This document consists of 18 printed pages, 2 blank pages and 1 Insert. DC (NF/SW) 135696/2 © UCLES 2017 [Turn over Cambridge International Examinations Cambridge International General Certificate of Secondary Education DEVELOPMENT STUDIES 0453/02 Paper 2 October/November 2017 2 hours Candidates answer on the Question Paper. Additional Materials: Ruler READ THESE INSTRUCTIONS FIRST Write your Centre number, candidate number and name on all the work you hand in. Write in dark blue or black pen. You may use an HB pencil for any diagrams, graphs or rough working. Do not use staples, paper clips, glue or correction fluid. DO NOT WRITE IN ANY BARCODES. Answer all the questions. You may not need all the answer lines for your answer. You should read and study the sources before answering the questions. The Insert contains Fig. 4 for Question 2(a) and Fig. 5 for Question 2(b). The Insert is not required by the Examiner. It can be kept by the Centre and used as a teaching resource. At the end of the examination, fasten all your work securely together. The number of marks is given in brackets [ ] at the end of each question or part question.
Question paper, page 2
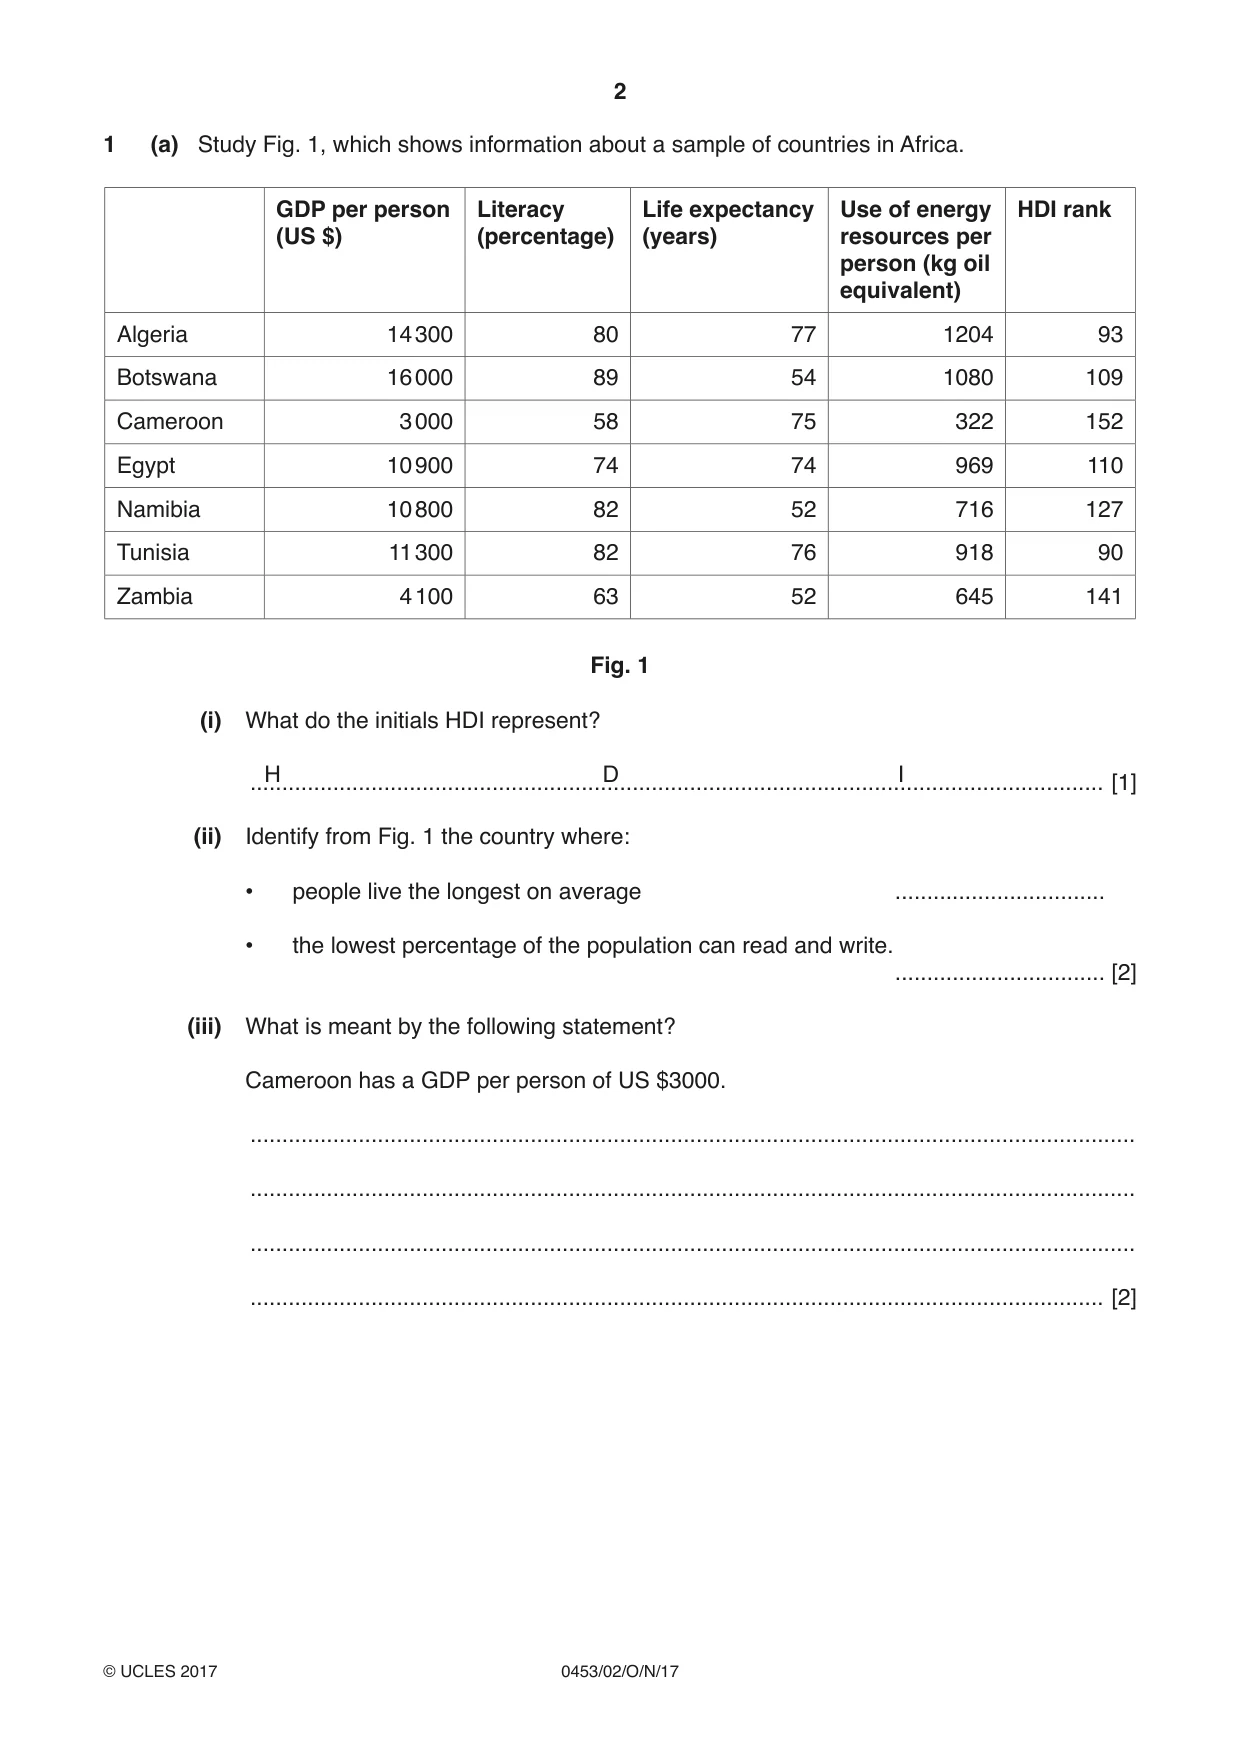
2 0453/02/O/N/17 © UCLES 2017 1 (a) Study Fig. 1, which shows information about a sample of countries in Africa. GDP per person (US $) Literacy (percentage) Life expectancy (years) Use of energy resources per person (kg oil equivalent) HDI rank Algeria 14 300 80 77 1204 93 Botswana 16 000 89 54 1080 109 Cameroon 3 000 58 75 322 152 Egypt 10 900 74 74 969 110 Namibia 10 800 82 52 716 127 Tunisia 11 300 82 76 918 90 Zambia 4 100 63 52 645 141 Fig. 1 (i) What do the initials HDI represent? H D I … [1] (ii) Identify from Fig. 1 the country where: • people live the longest on average … • the lowest percentage of the population can read and write. … [2] (iii) What is meant by the following statement? Cameroon has a GDP per person of US $3000. … … … … [2]
Question paper, page 3
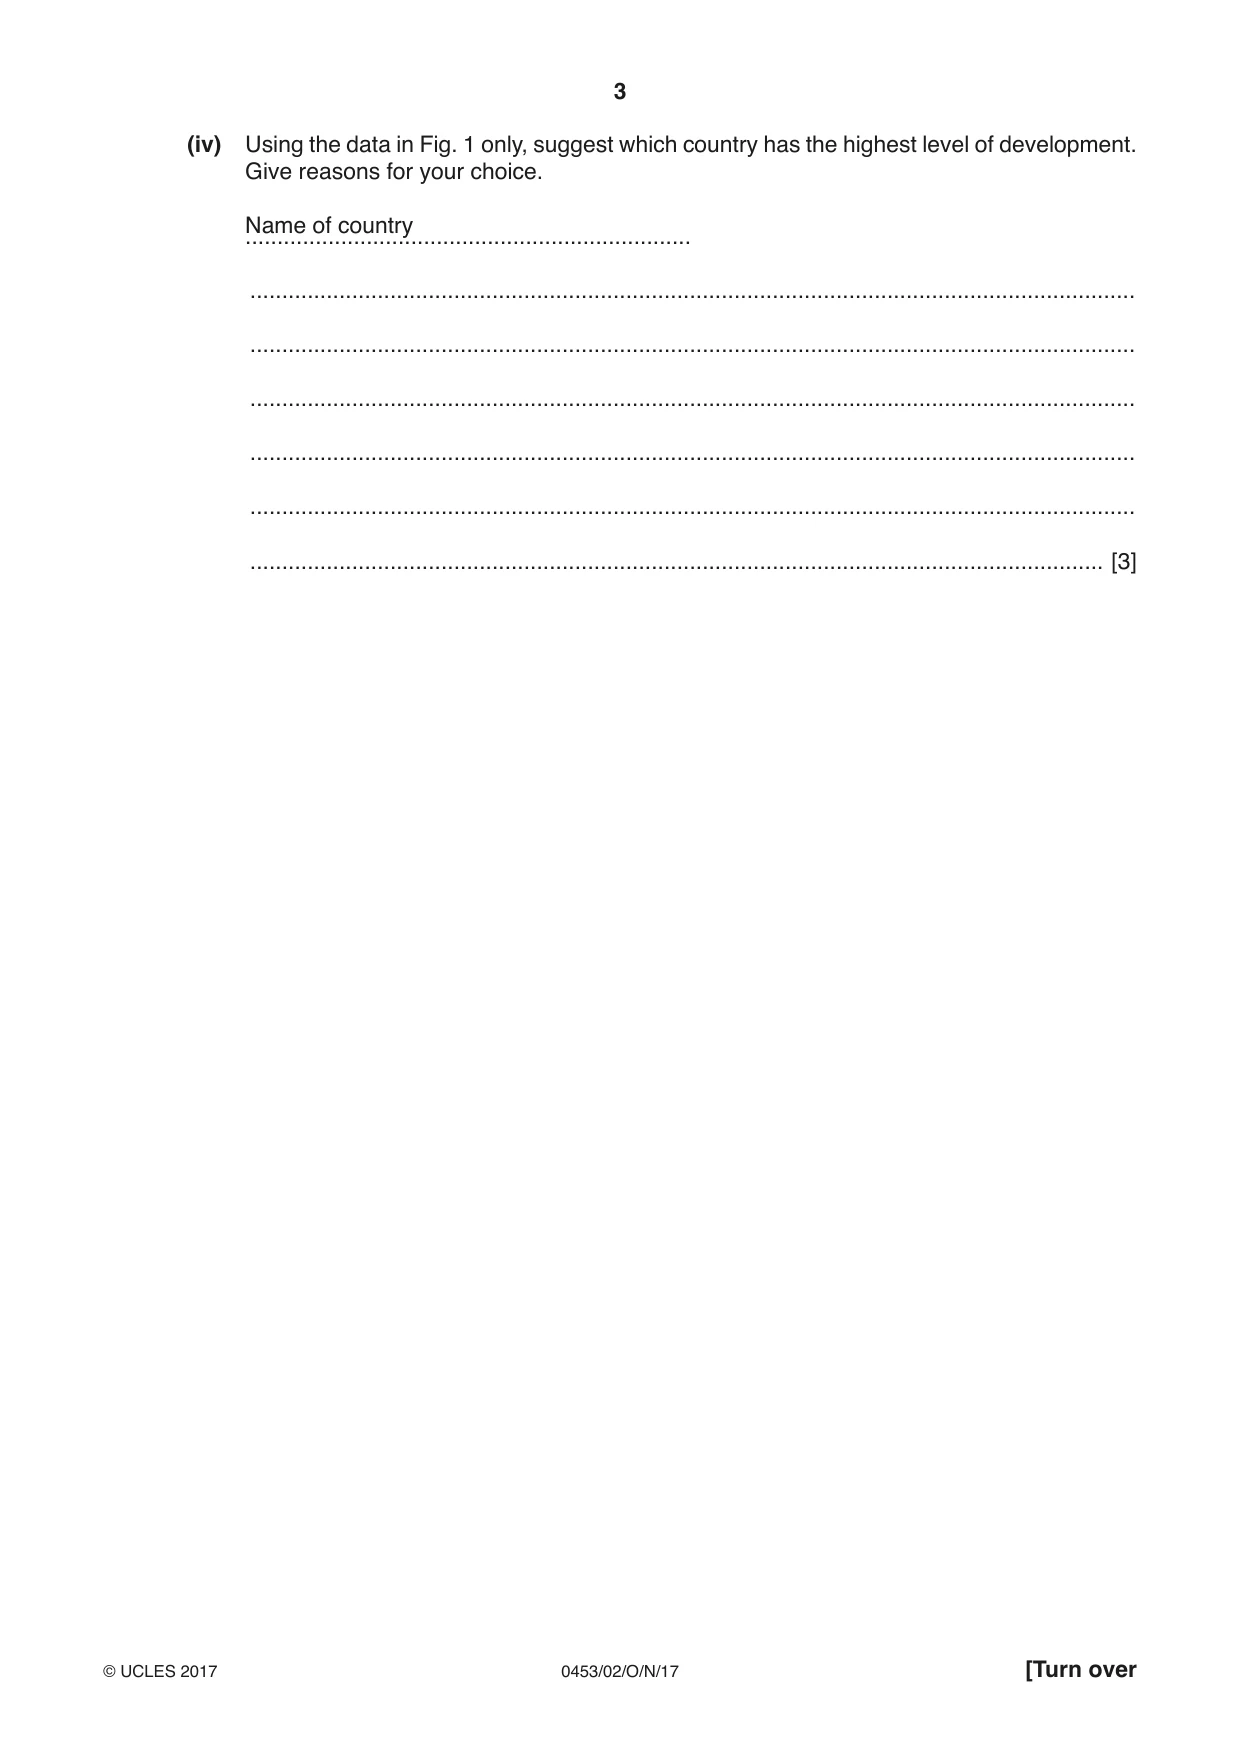
3 0453/02/O/N/17 © UCLES 2017 [Turn over (iv) Using the data in Fig. 1 only, suggest which country has the highest level of development. Give reasons for your choice. Name of country … … … … … … … [3]
Question paper, page 4
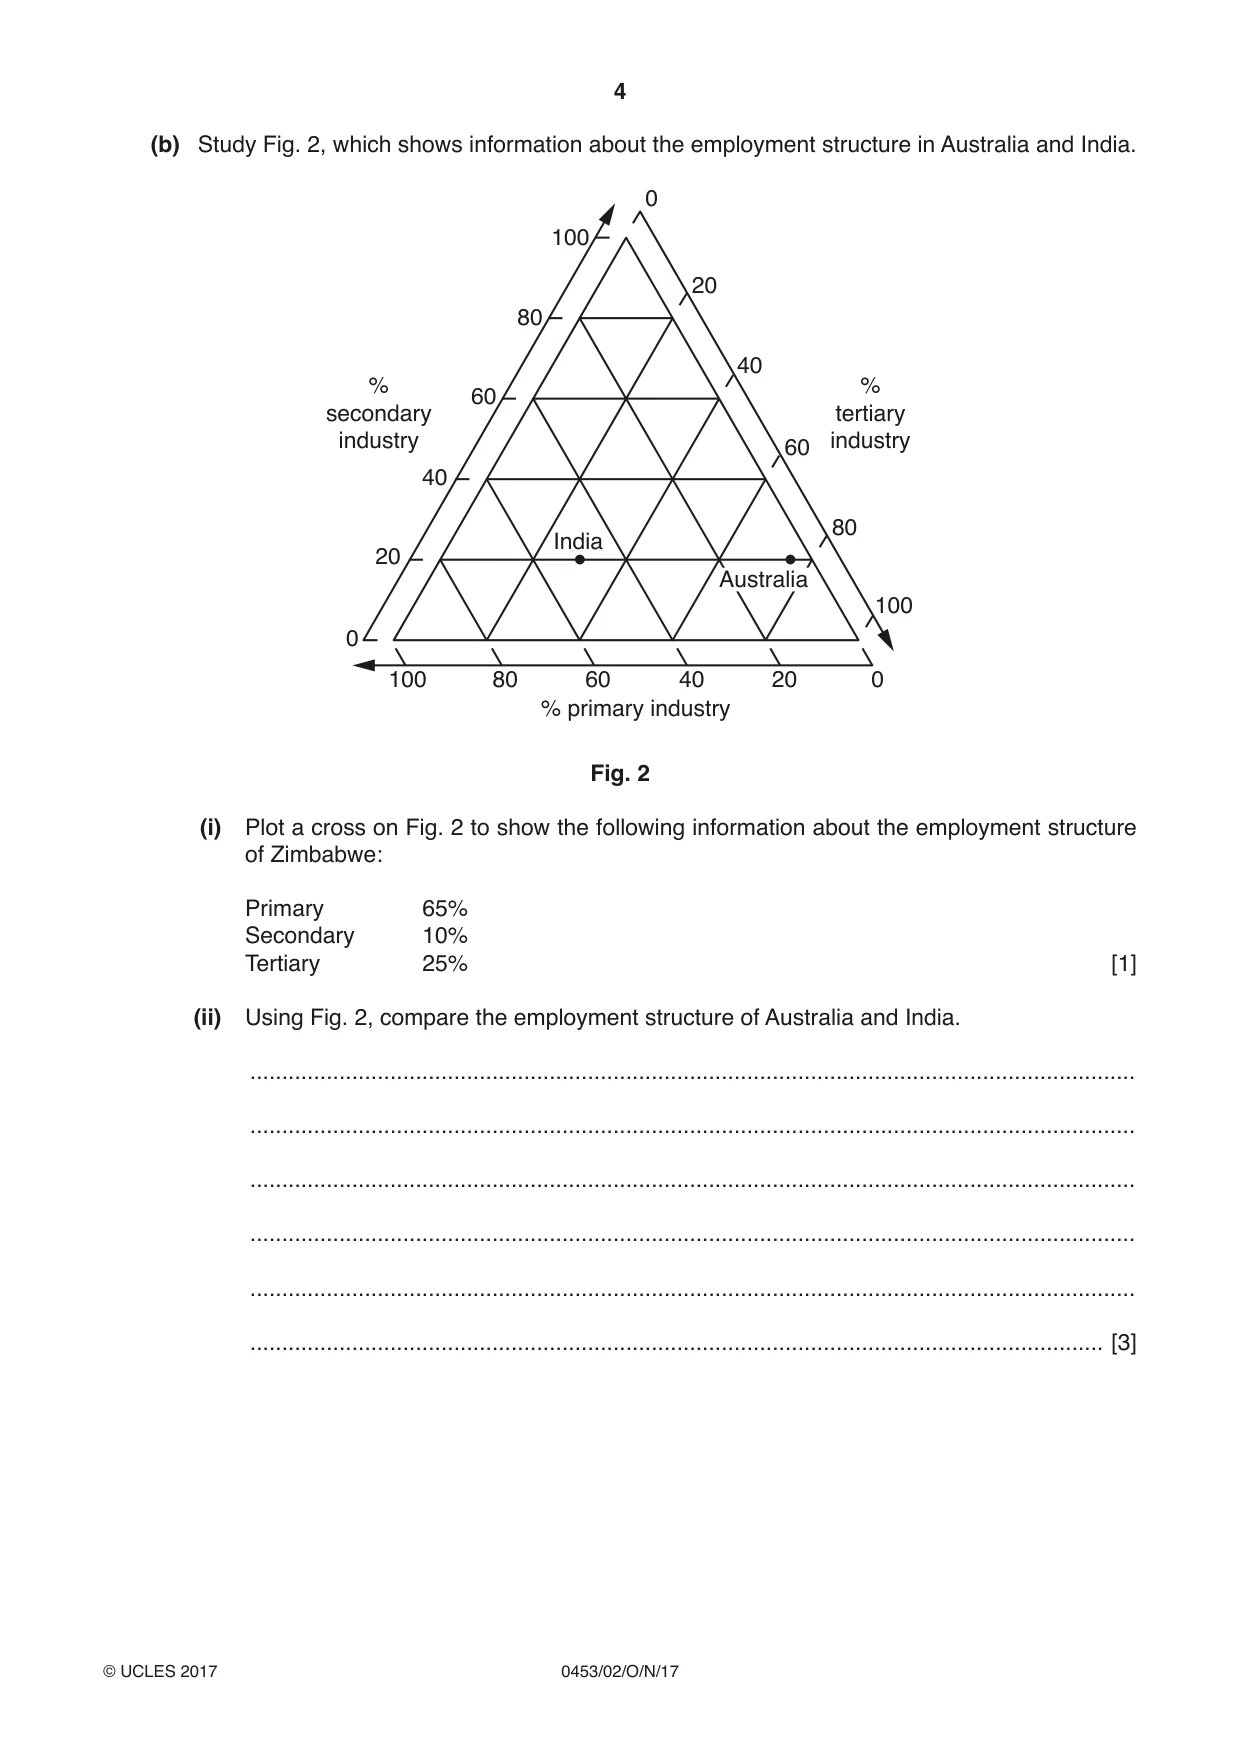
4 0453/02/O/N/17 © UCLES 2017 (b) Study Fig. 2, which shows information about the employment structure in Australia and India. 80 100 60 40 20 0 20 0 20 0 40 60 80 100 40 60 % secondary industry % tertiary industry % primary industry 80 100 Australia India Fig. 2 (i) Plot a cross on Fig. 2 to show the following information about the employment structure of Zimbabwe: Primary 65% Secondary 10% Tertiary 25% [1] (ii) Using Fig. 2, compare the employment structure of Australia and India. … … … … … … [3]
Question paper, page 5
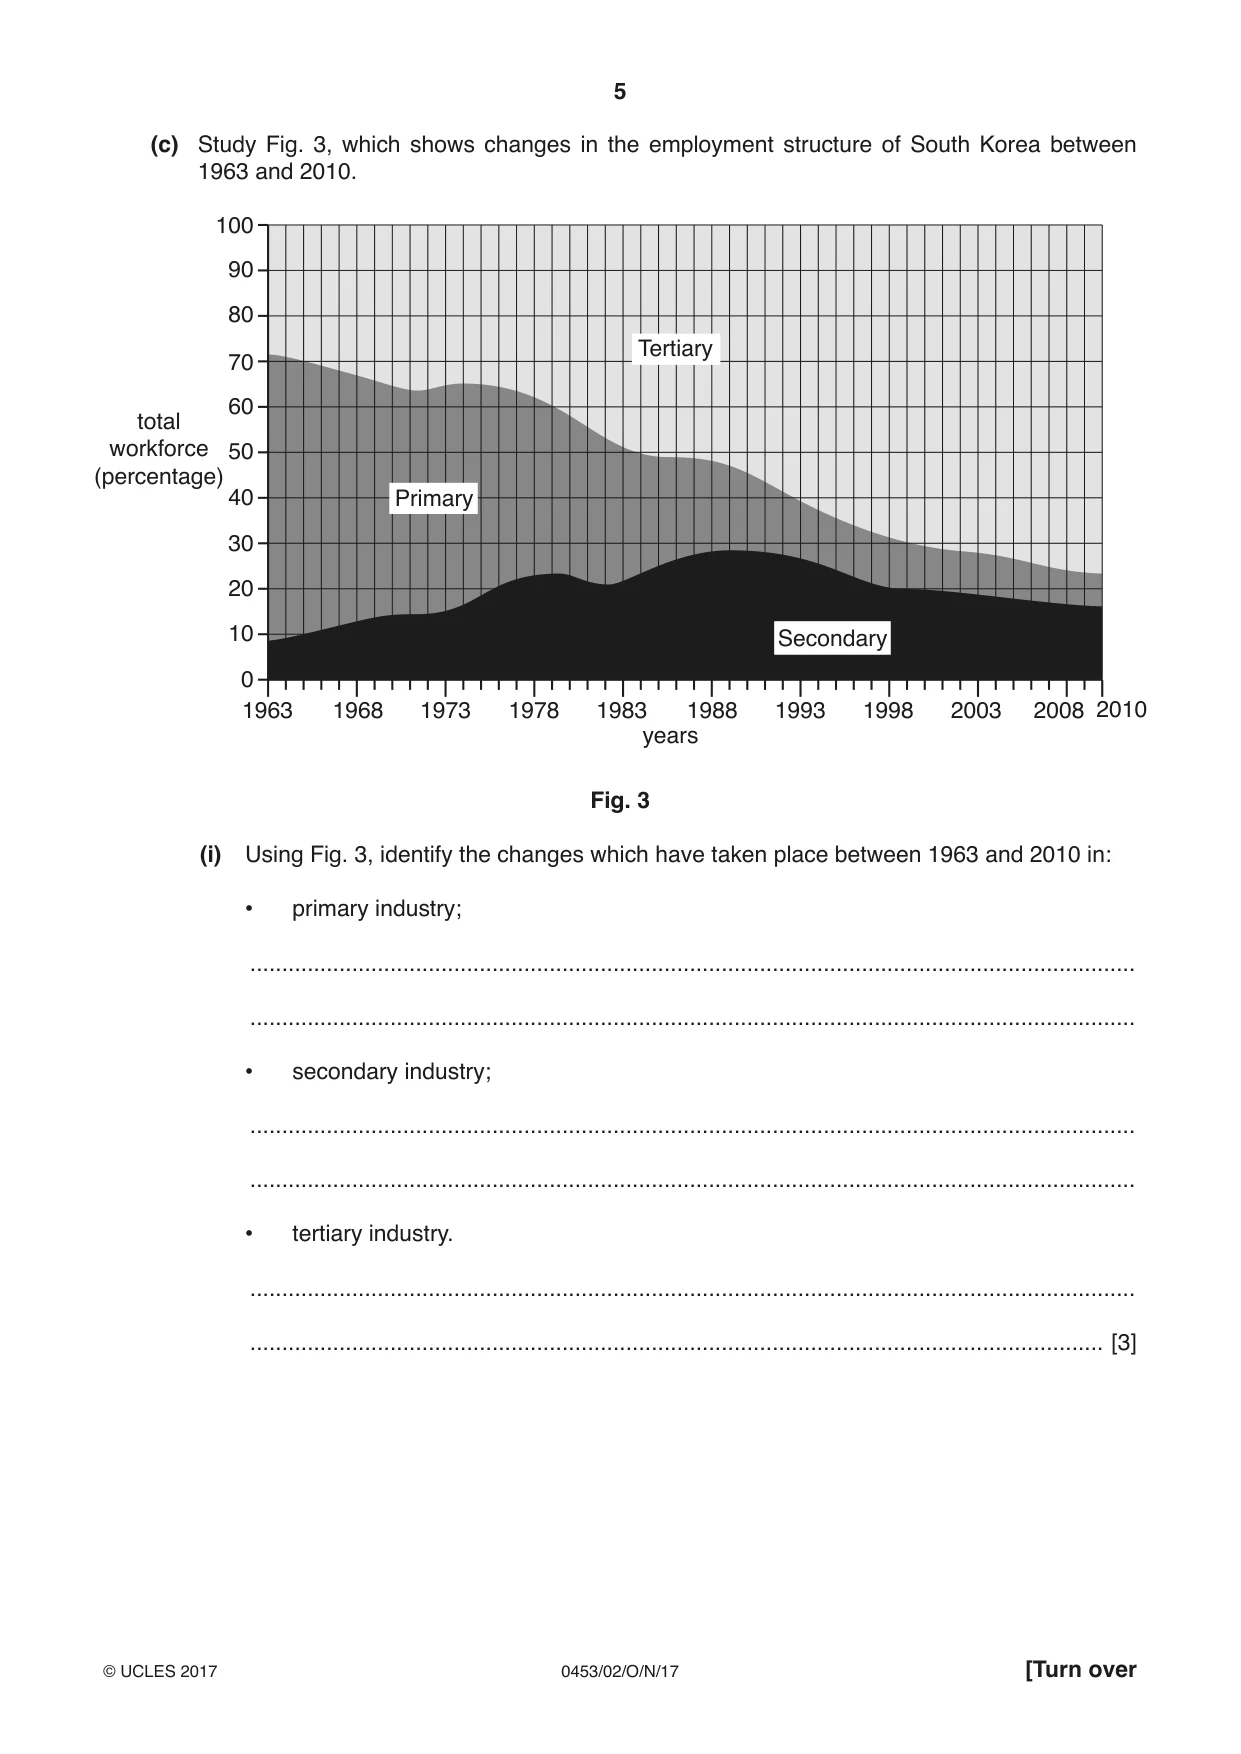
5 0453/02/O/N/17 © UCLES 2017 [Turn over (c) Study Fig. 3, which shows changes in the employment structure of South Korea between 1963 and 2010. 100 0 1963 1968 1973 1978 1983 1988 years total workforce (percentage) 1993 1998 2003 2008 2010 10 20 30 40 50 60 70 80 90 Secondary Primary Tertiary Fig. 3 (i) Using Fig. 3, identify the changes which have taken place between 1963 and 2010 in: • primary industry; … … • secondary industry; … … • tertiary industry. … … [3]
Question paper, page 6
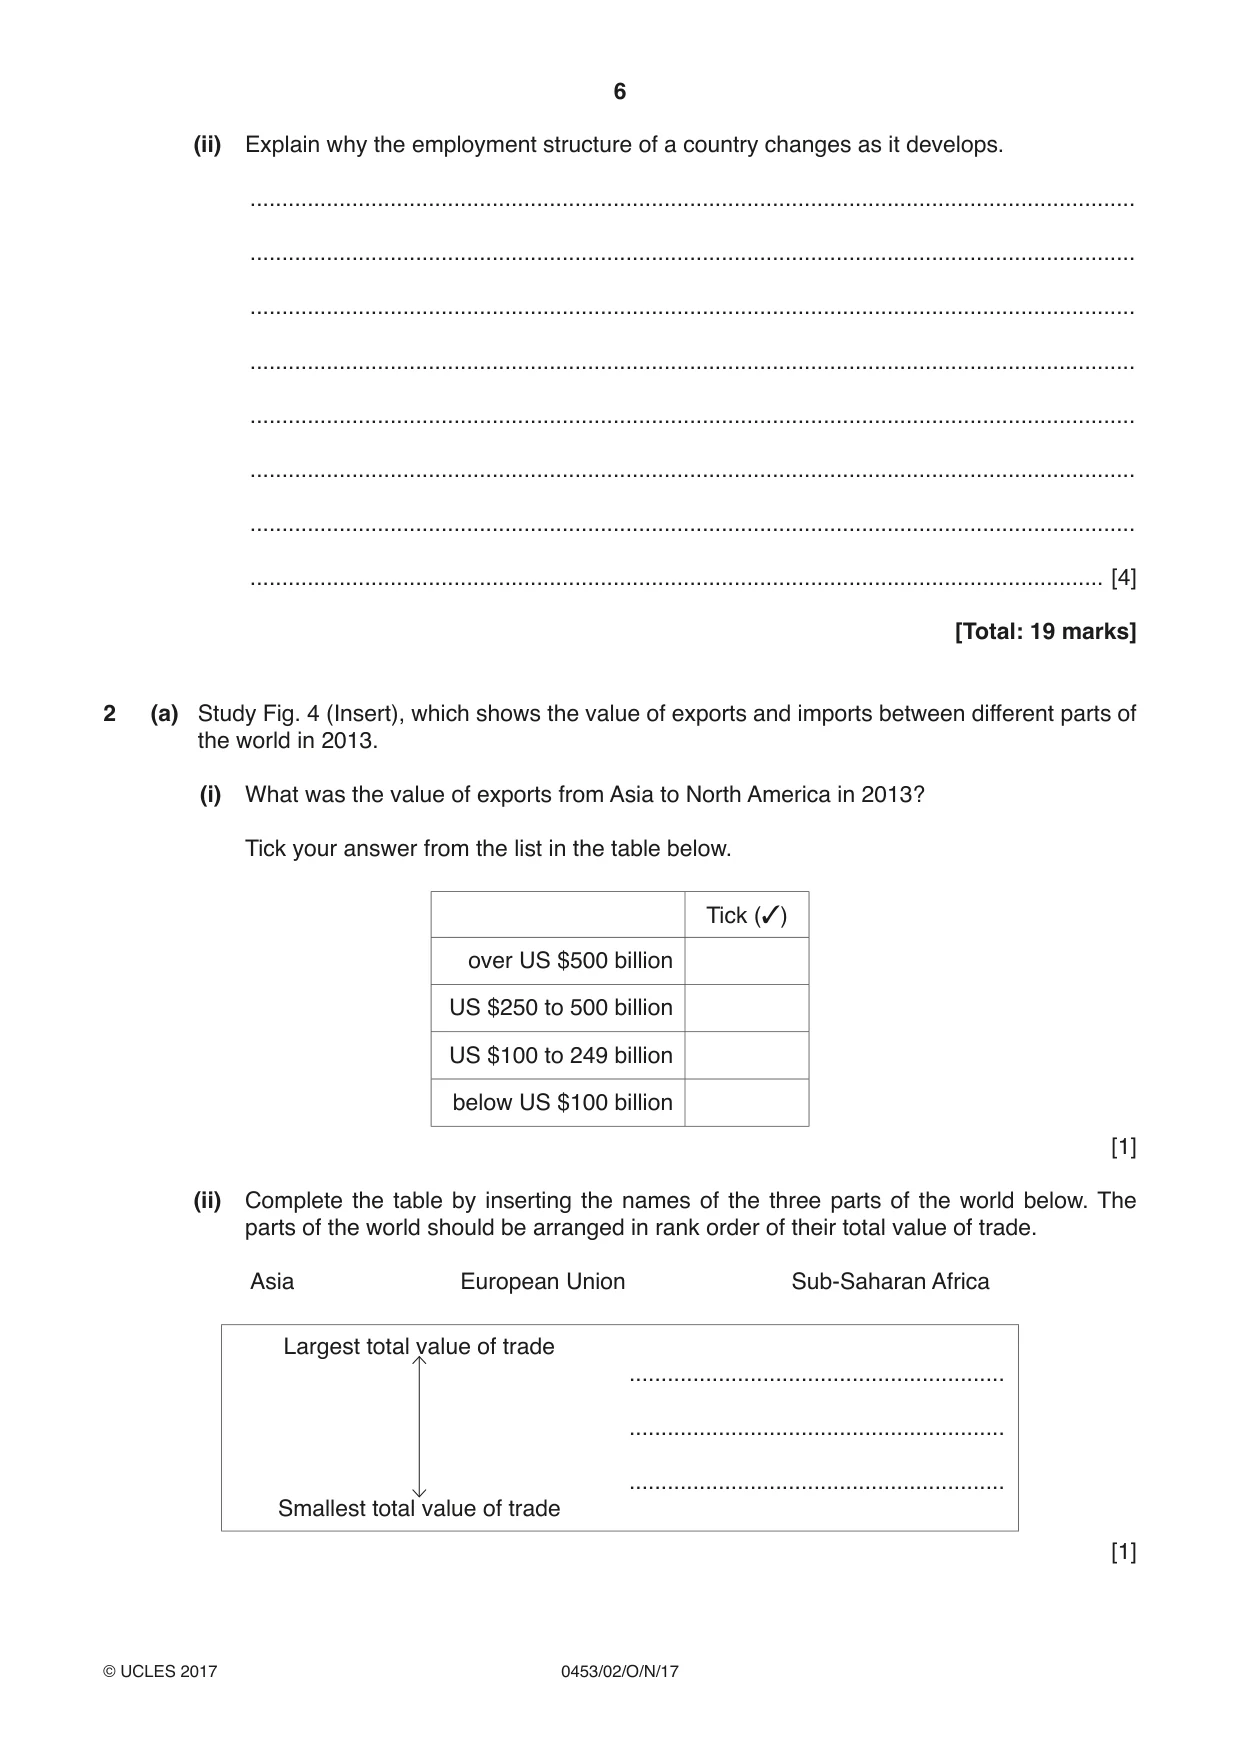
6 0453/02/O/N/17 © UCLES 2017 (ii) Explain why the employment structure of a country changes as it develops. … … … … … … … … [4] [Total: 19 marks] 2 (a) Study Fig. 4 (Insert), which shows the value of exports and imports between different parts of the world in 2013. (i) What was the value of exports from Asia to North America in 2013? Tick your answer from the list in the table below. Tick (✓) over US $500 billion US $250 to 500 billion US $100 to 249 billion below US $100 billion [1] (ii) Complete the table by inserting the names of the three parts of the world below. The parts of the world should be arranged in rank order of their total value of trade. Asia European Union Sub-Saharan Africa Largest total value of trade Smallest total value of trade … … … [1]
Question paper, page 7
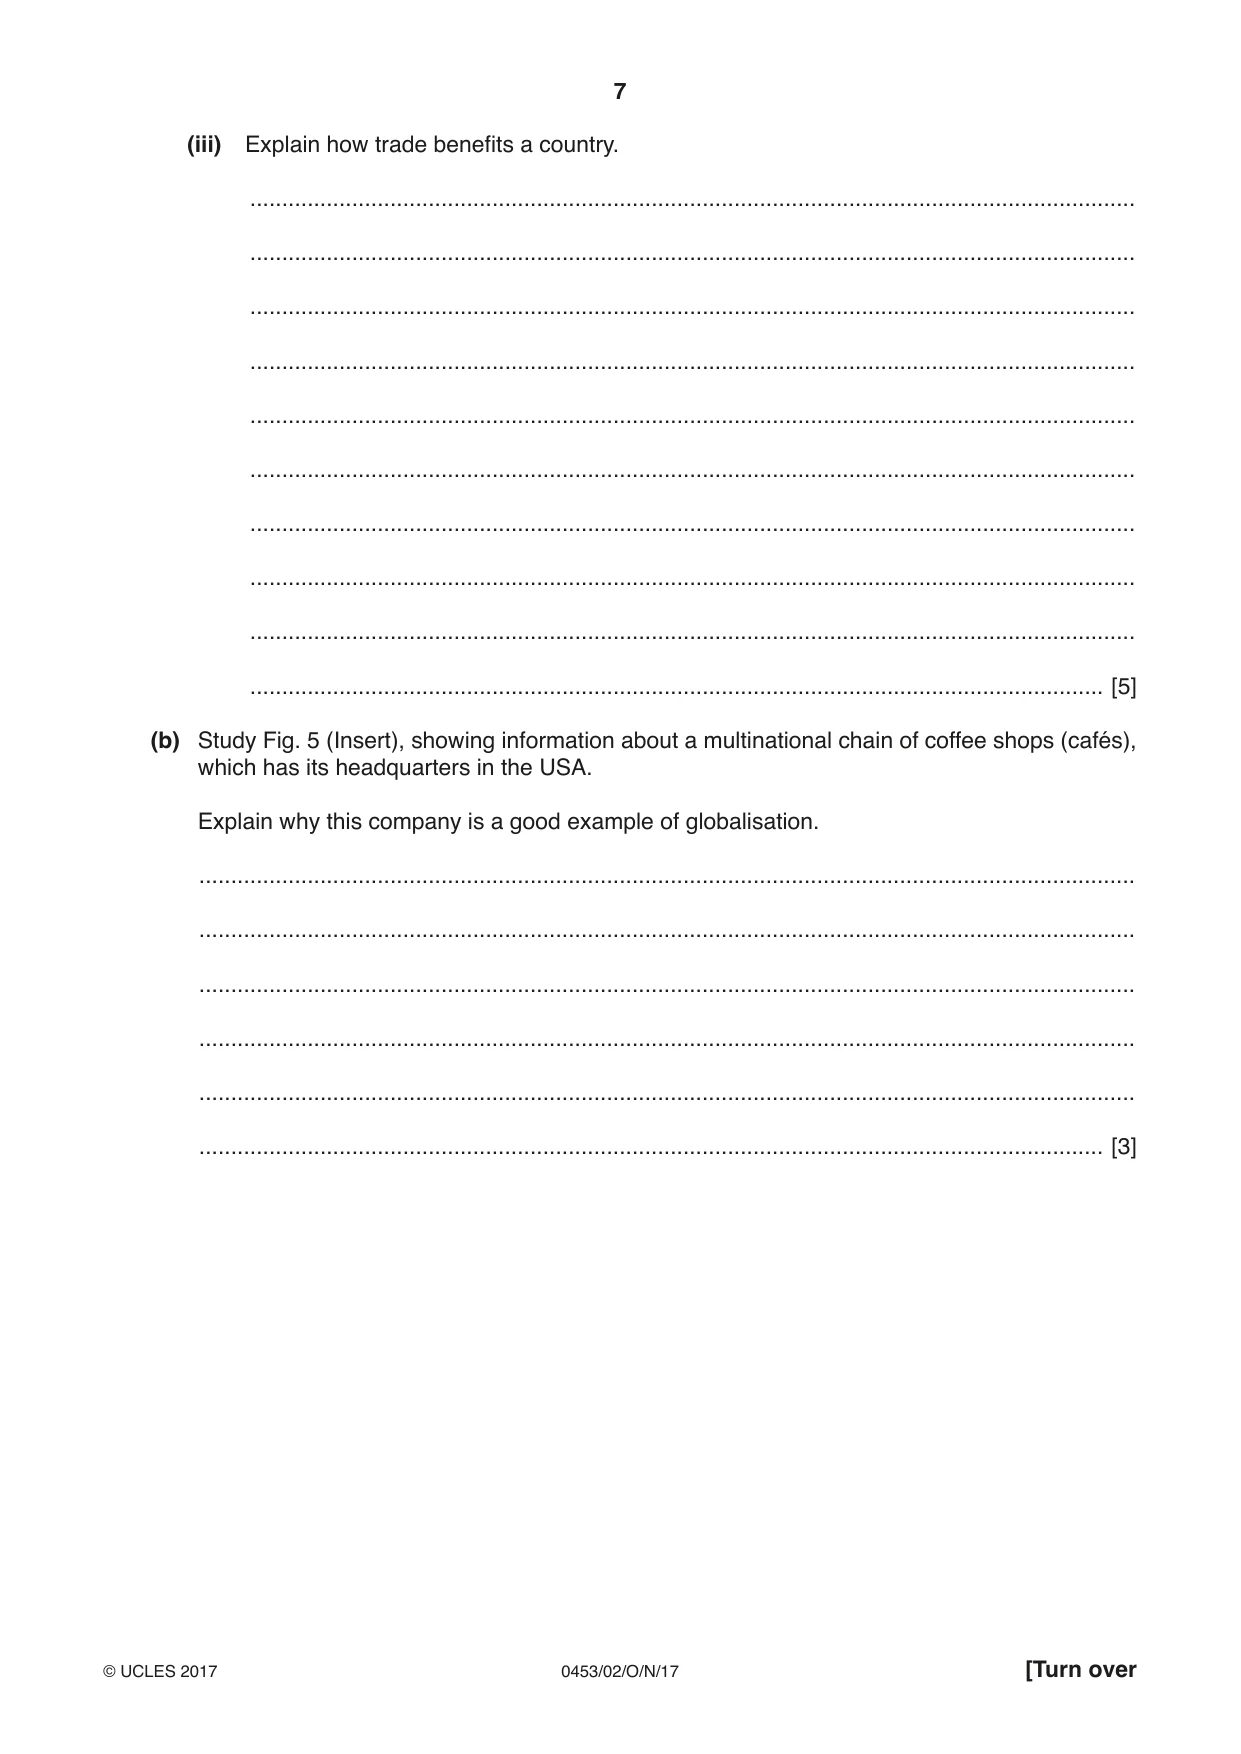
7 0453/02/O/N/17 © UCLES 2017 [Turn over (iii) Explain how trade benefits a country. … … … … … … … … … … [5] (b) Study Fig. 5 (Insert), showing information about a multinational chain of coffee shops (cafés), which has its headquarters in the USA. Explain why this company is a good example of globalisation. … … … … … … [3]
Question paper, page 8
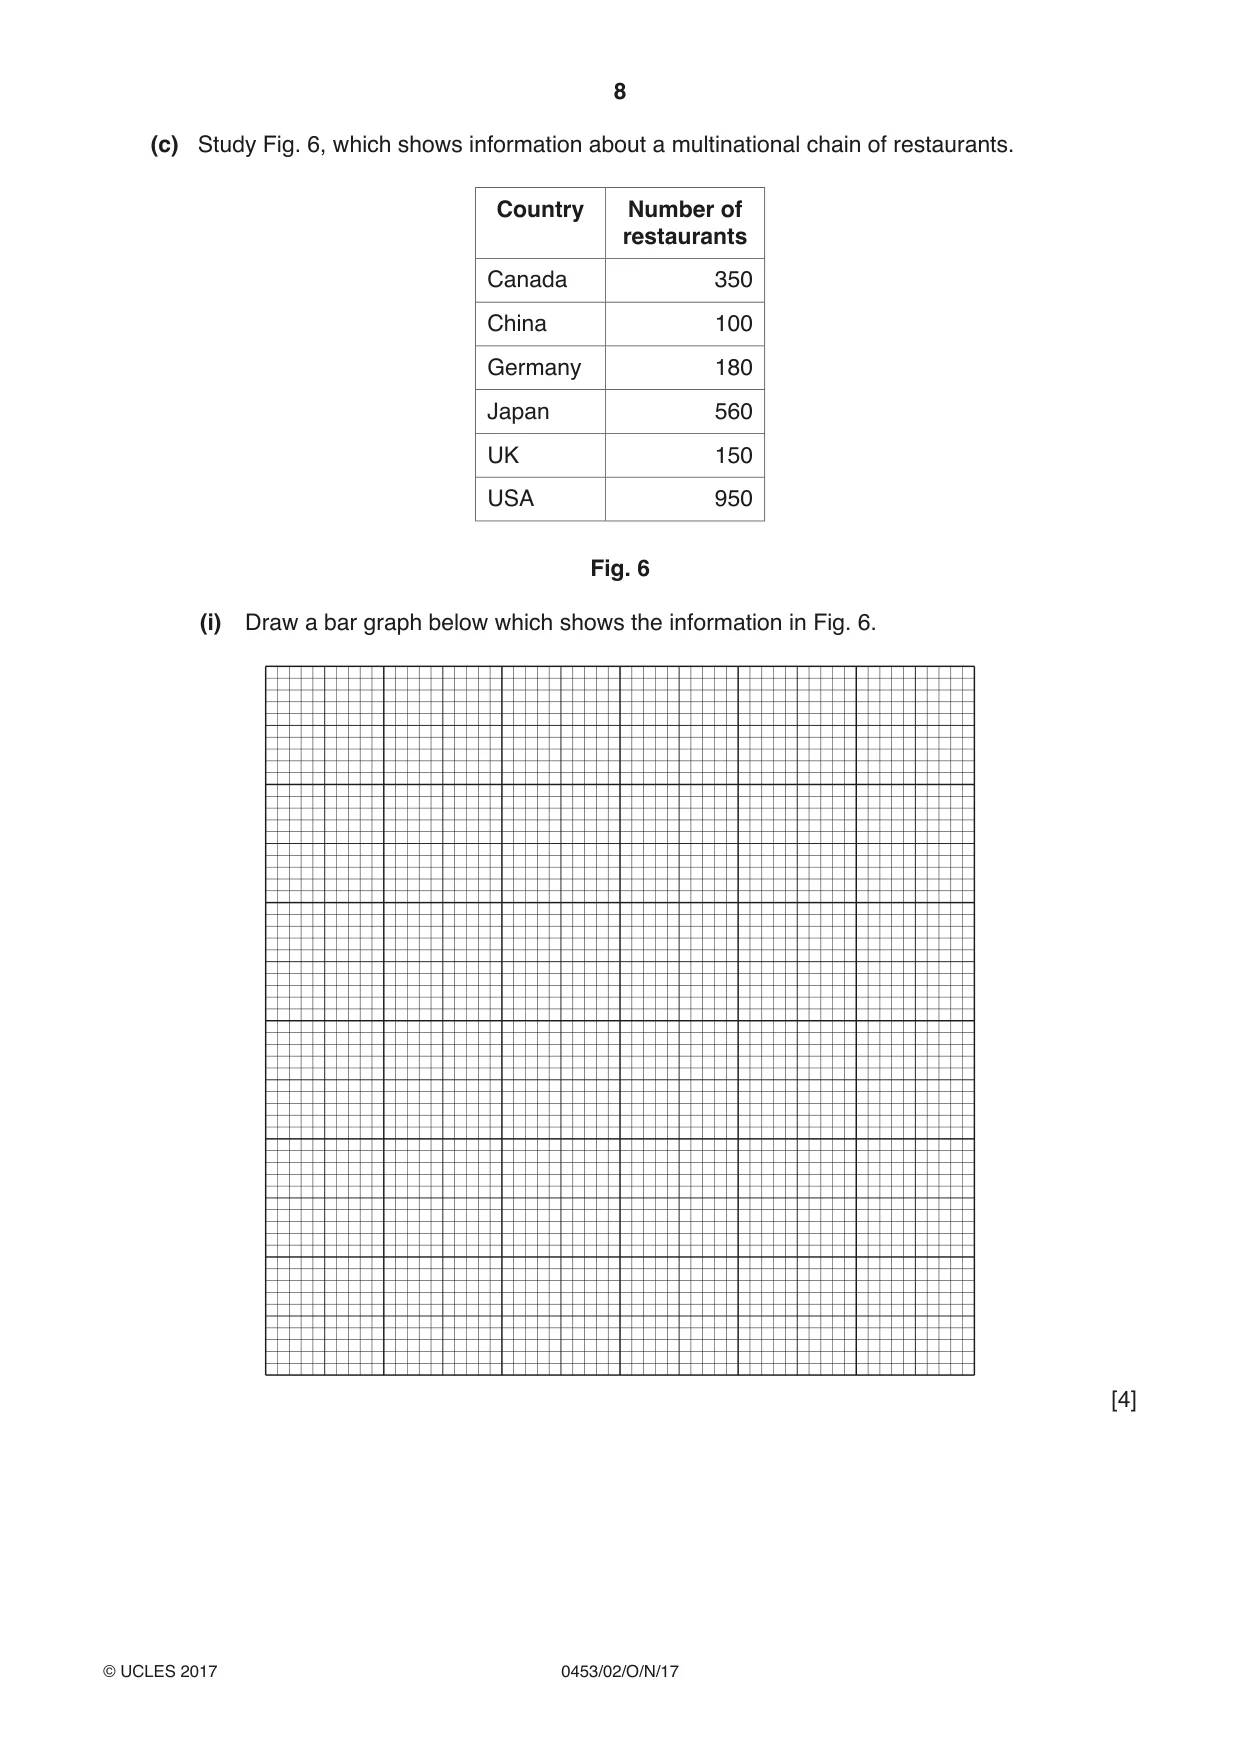
8 0453/02/O/N/17 © UCLES 2017 (c) Study Fig. 6, which shows information about a multinational chain of restaurants. Country Number of restaurants Canada 350 China 100 Germany 180 Japan 560 UK 150 USA 950 Fig. 6 (i) Draw a bar graph below which shows the information in Fig. 6. [4]
Question paper, page 9
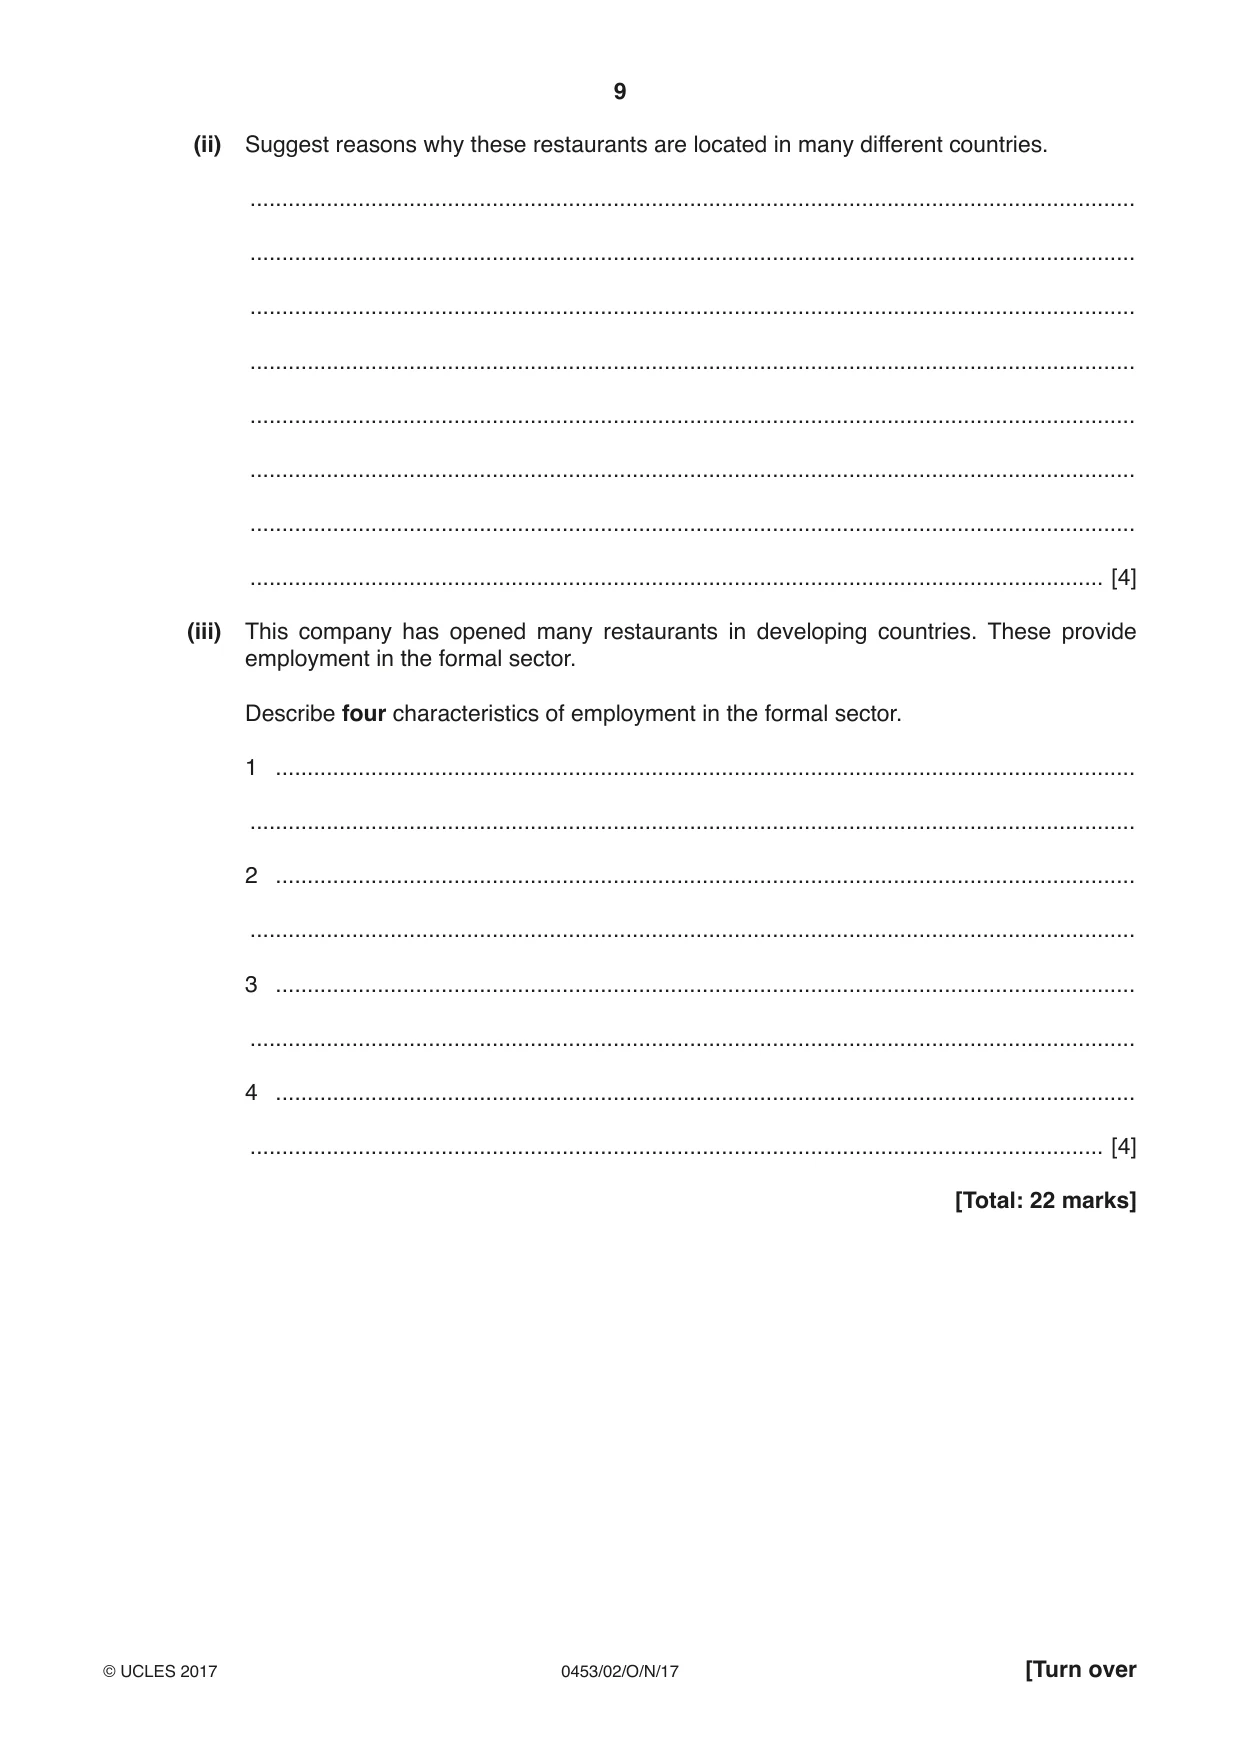
9 0453/02/O/N/17 © UCLES 2017 [Turn over (ii) Suggest reasons why these restaurants are located in many different countries. … … … … … … … … [4] (iii) This company has opened many restaurants in developing countries. These provide employment in the formal sector. Describe four characteristics of employment in the formal sector. 1 … … 2 … … 3 … … 4 … … [4] [Total: 22 marks]
Question paper, page 10
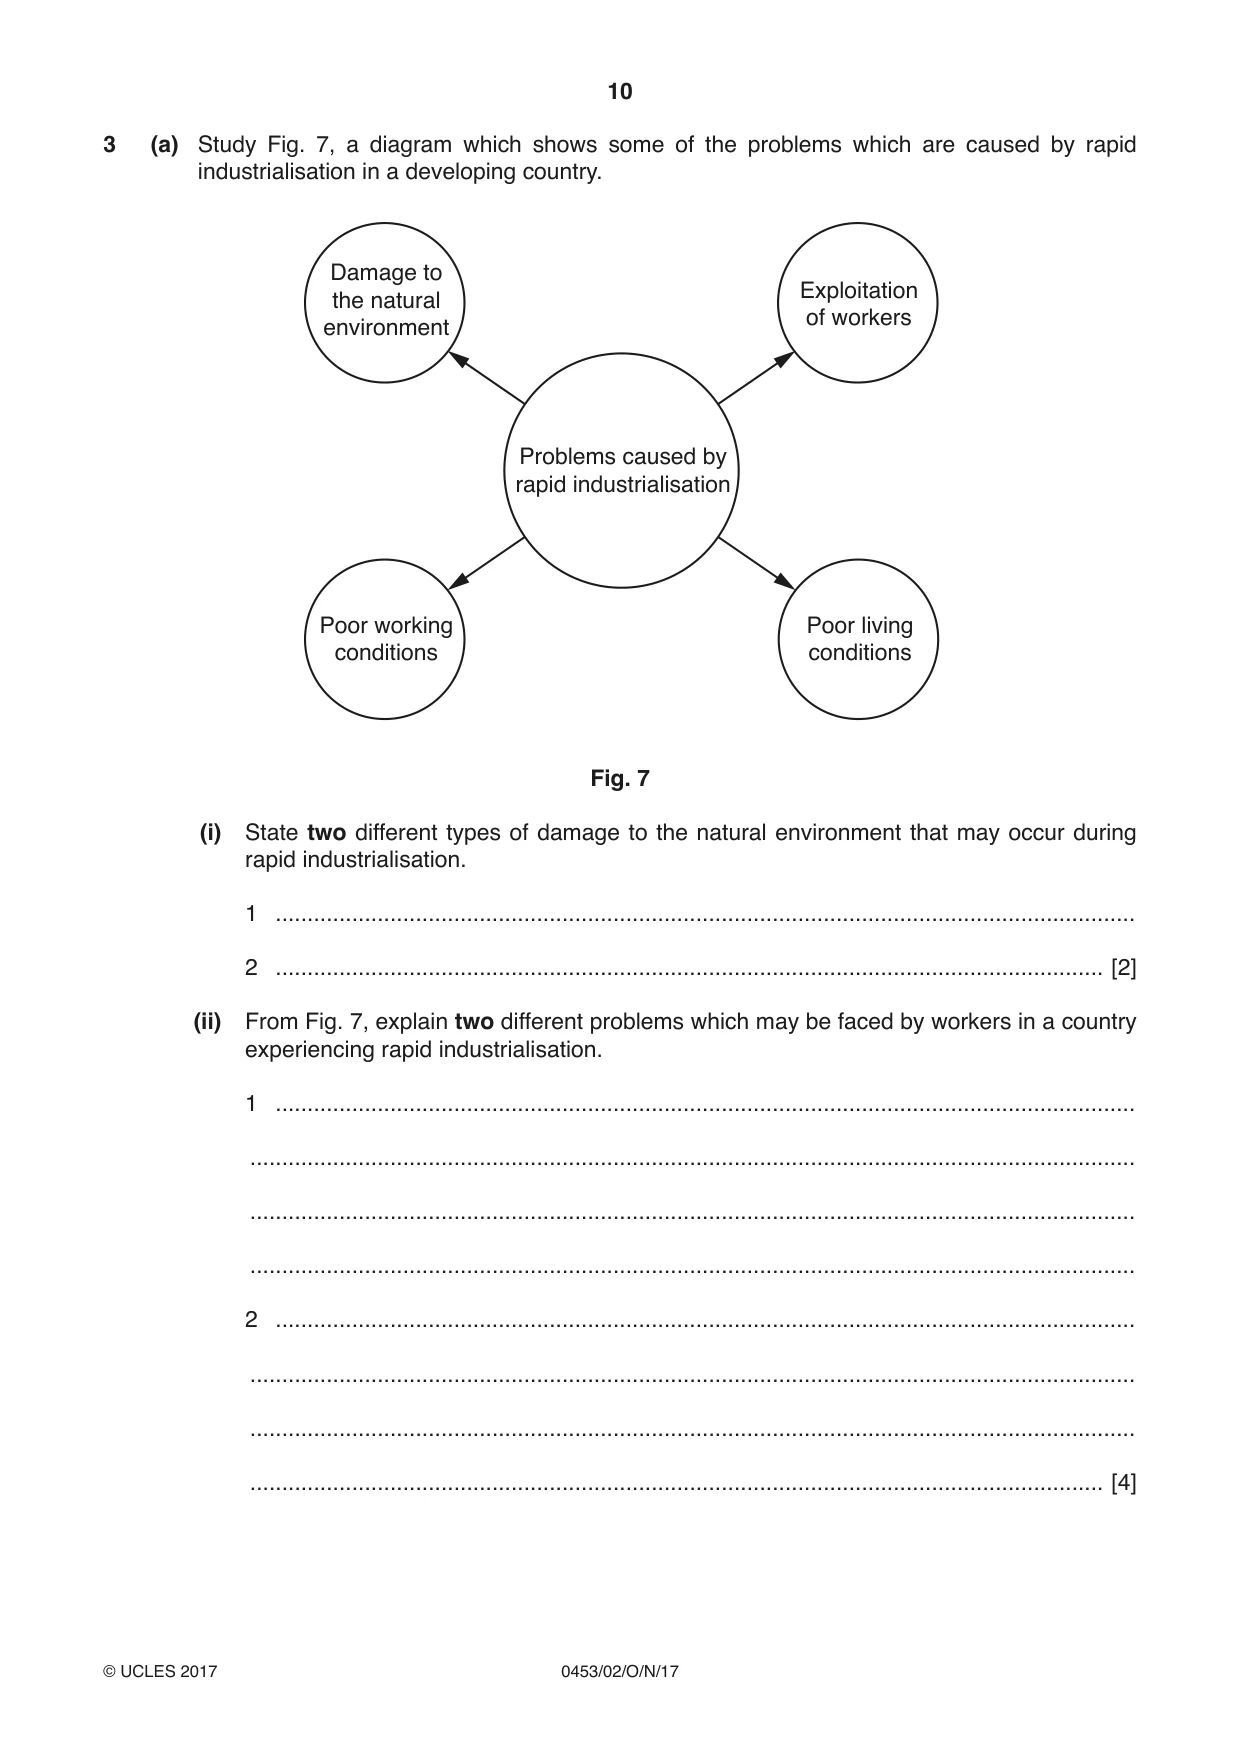
10 0453/02/O/N/17 © UCLES 2017 3 (a) Study Fig. 7, a diagram which shows some of the problems which are caused by rapid industrialisation in a developing country. Damage to the natural environment Exploitation of workers Poor working conditions Poor living conditions Problems caused by rapid industrialisation Fig. 7 (i) State two different types of damage to the natural environment that may occur during rapid industrialisation. 1 … 2 … [2] (ii) From Fig. 7, explain two different problems which may be faced by workers in a country experiencing rapid industrialisation. 1 … … … … 2 … … … … [4]
Question paper, page 11
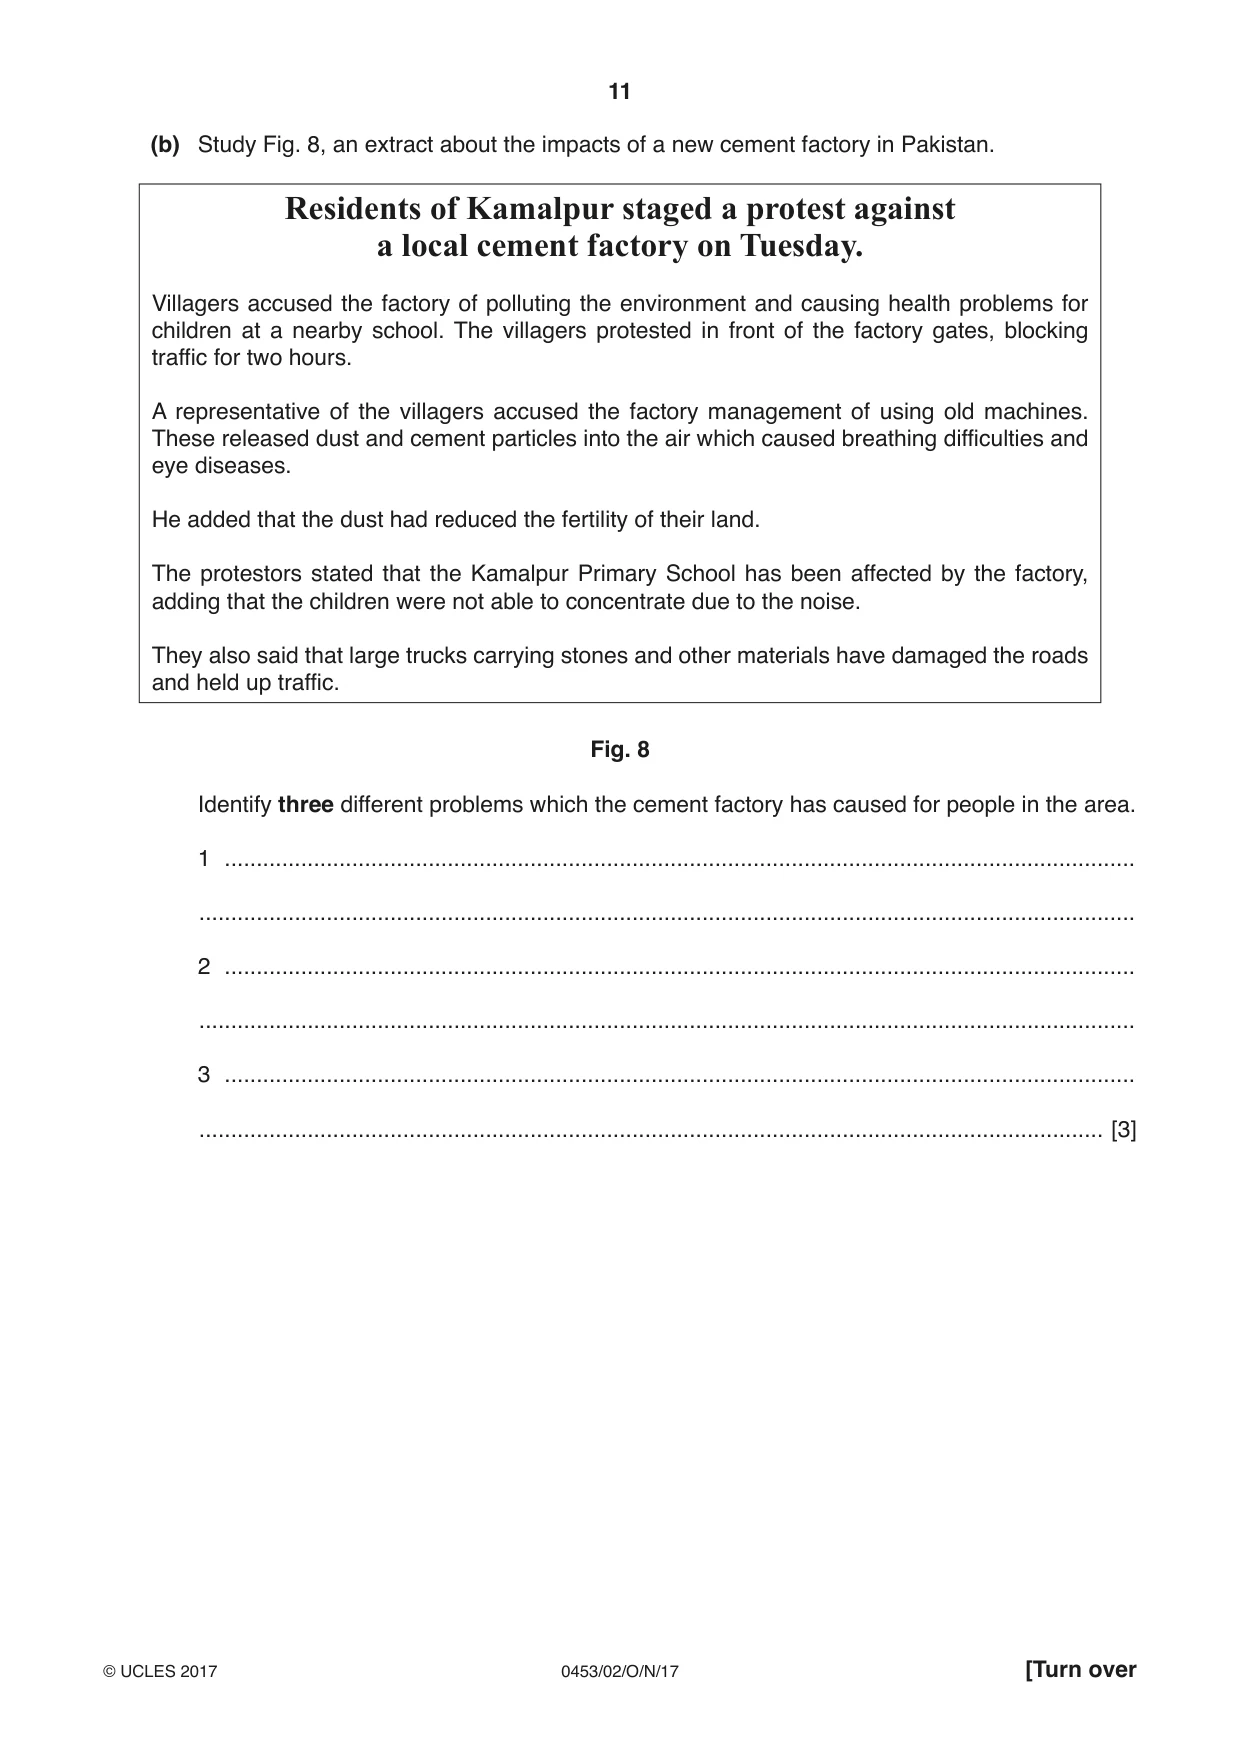
11 0453/02/O/N/17 © UCLES 2017 [Turn over (b) Study Fig. 8, an extract about the impacts of a new cement factory in Pakistan. Residents of Kamalpur staged a protest against a local cement factory on Tuesday. Villagers accused the factory of polluting the environment and causing health problems for children at a nearby school. The villagers protested in front of the factory gates, blocking traffic for two hours. A representative of the villagers accused the factory management of using old machines. These released dust and cement particles into the air which caused breathing difficulties and eye diseases. He added that the dust had reduced the fertility of their land. The protestors stated that the Kamalpur Primary School has been affected by the factory, adding that the children were not able to concentrate due to the noise. They also said that large trucks carrying stones and other materials have damaged the roads and held up traffic. Fig. 8 Identify three different problems which the cement factory has caused for people in the area. 1 … … 2 … … 3 … … [3]
Question paper, page 12
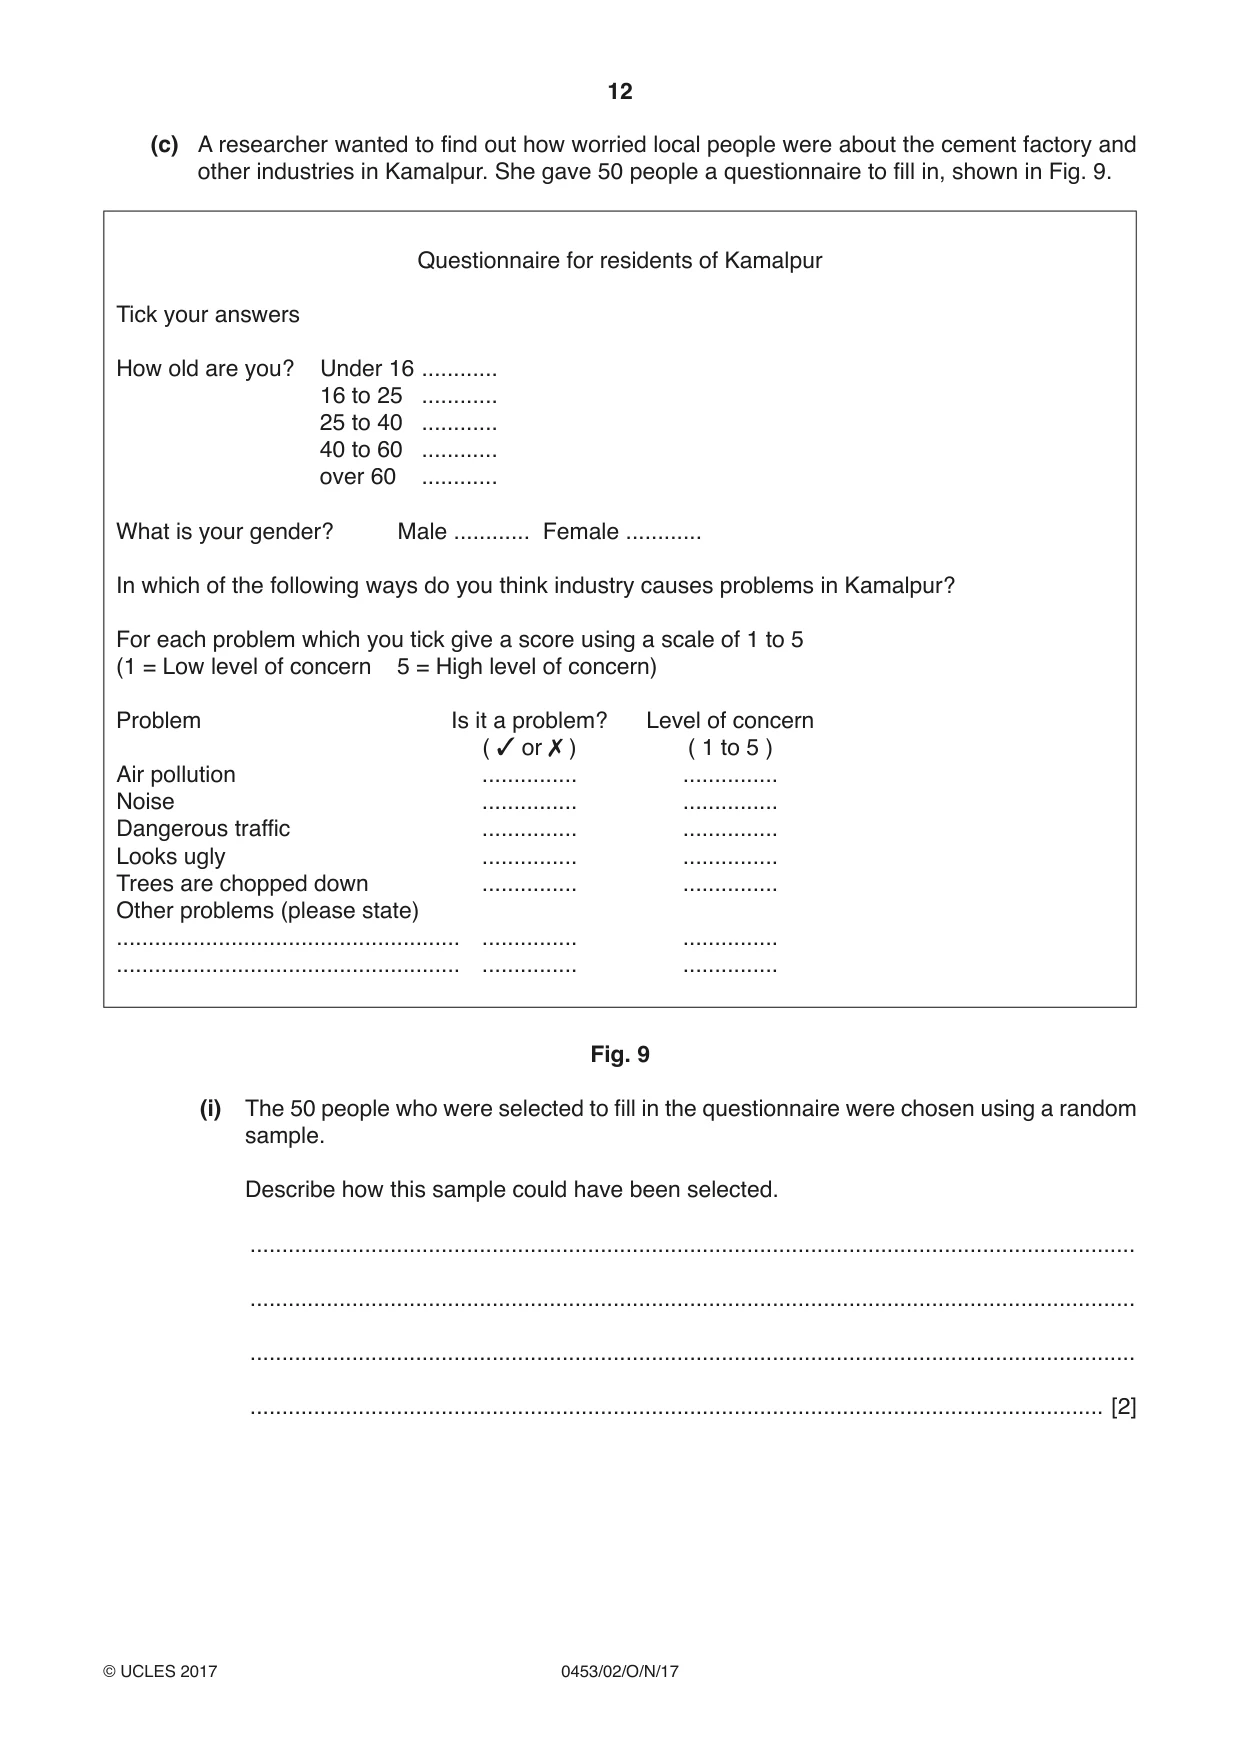
12 0453/02/O/N/17 © UCLES 2017 (c) A researcher wanted to find out how worried local people were about the cement factory and other industries in Kamalpur. She gave 50 people a questionnaire to fill in, shown in Fig. 9. Questionnaire for residents of Kamalpur Tick your answers How old are you? Under 16 … 16 to 25 … 25 to 40 … 40 to 60 … over 60 … What is your gender? Male … Female … In which of the following ways do you think industry causes problems in Kamalpur? For each problem which you tick give a score using a scale of 1 to 5 (1 = Low level of concern 5 = High level of concern) Problem Is it a problem? Level of concern ( ✓ or ✗ ) ( 1 to 5 ) Air pollution … … Noise … … Dangerous traffic … … Looks ugly … … Trees are chopped down … … Other problems (please state) … … … … … … Fig. 9 (i) The 50 people who were selected to fill in the questionnaire were chosen using a random sample. Describe how this sample could have been selected. … … … … [2]
Question paper, page 13
13 0453/02/O/N/17 © UCLES 2017 [Turn over (ii) The researcher wanted to find out how worried people were about each impact of industry in the area. Use your own words to explain how she did this. … … … … [2] (iii) Do you think this was a good questionnaire? Give reasons for your opinion. … … … … … … [3] (iv) Suggest reasons why some people in Kamalpur will be more worried than others about the impacts of industry in the area. … … … … … … [3]
Question paper, page 14
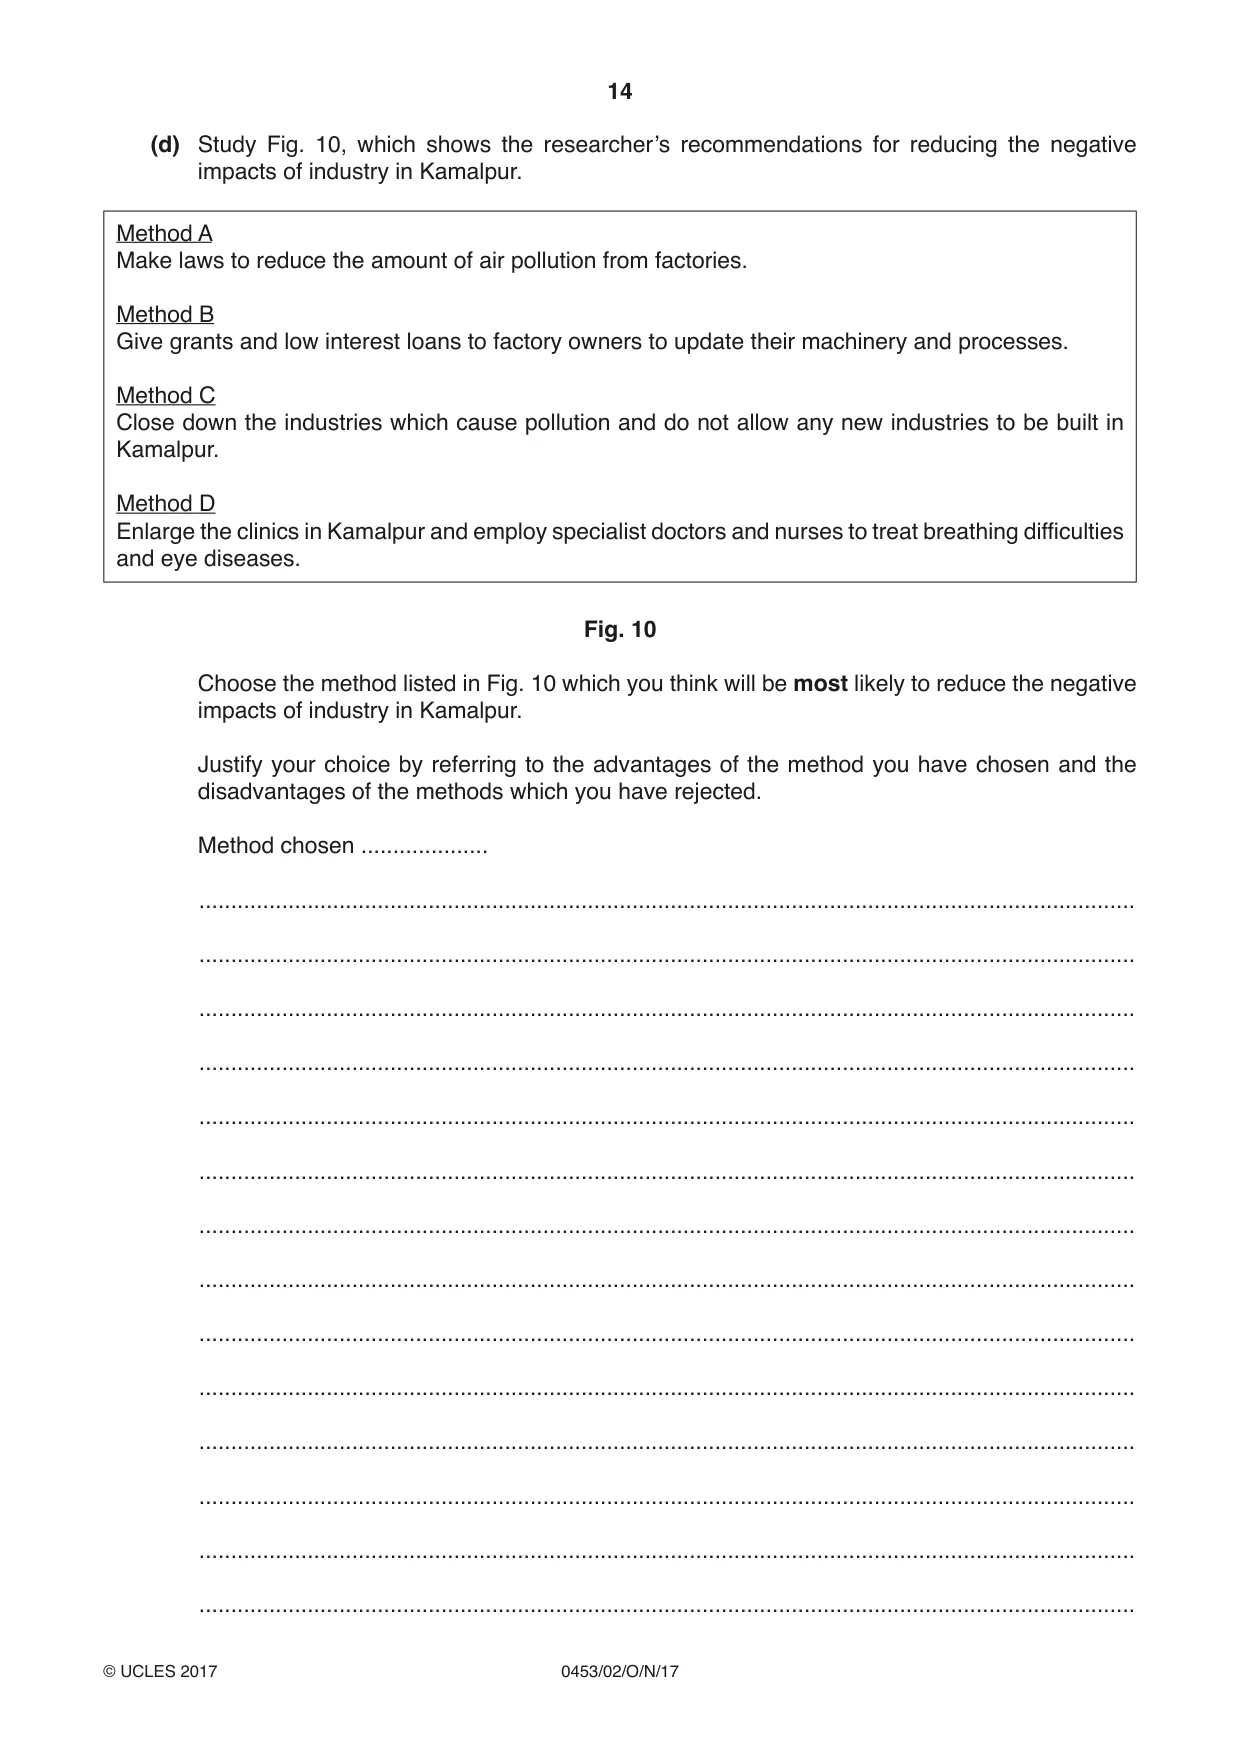
14 0453/02/O/N/17 © UCLES 2017 (d) Study Fig. 10, which shows the researcher’s recommendations for reducing the negative impacts of industry in Kamalpur. Method A Make laws to reduce the amount of air pollution from factories. Method B Give grants and low interest loans to factory owners to update their machinery and processes. Method C Close down the industries which cause pollution and do not allow any new industries to be built in Kamalpur. Method D Enlarge the clinics in Kamalpur and employ specialist doctors and nurses to treat breathing difficulties and eye diseases. Fig. 10 Choose the method listed in Fig. 10 which you think will be most likely to reduce the negative impacts of industry in Kamalpur. Justify your choice by referring to the advantages of the method you have chosen and the disadvantages of the methods which you have rejected. Method chosen … … … … … … … … … … … … … … …
Question paper, page 15
15 0453/02/O/N/17 © UCLES 2017 [Turn over … … … … [6] [Total: 25 marks]
Question paper, page 16
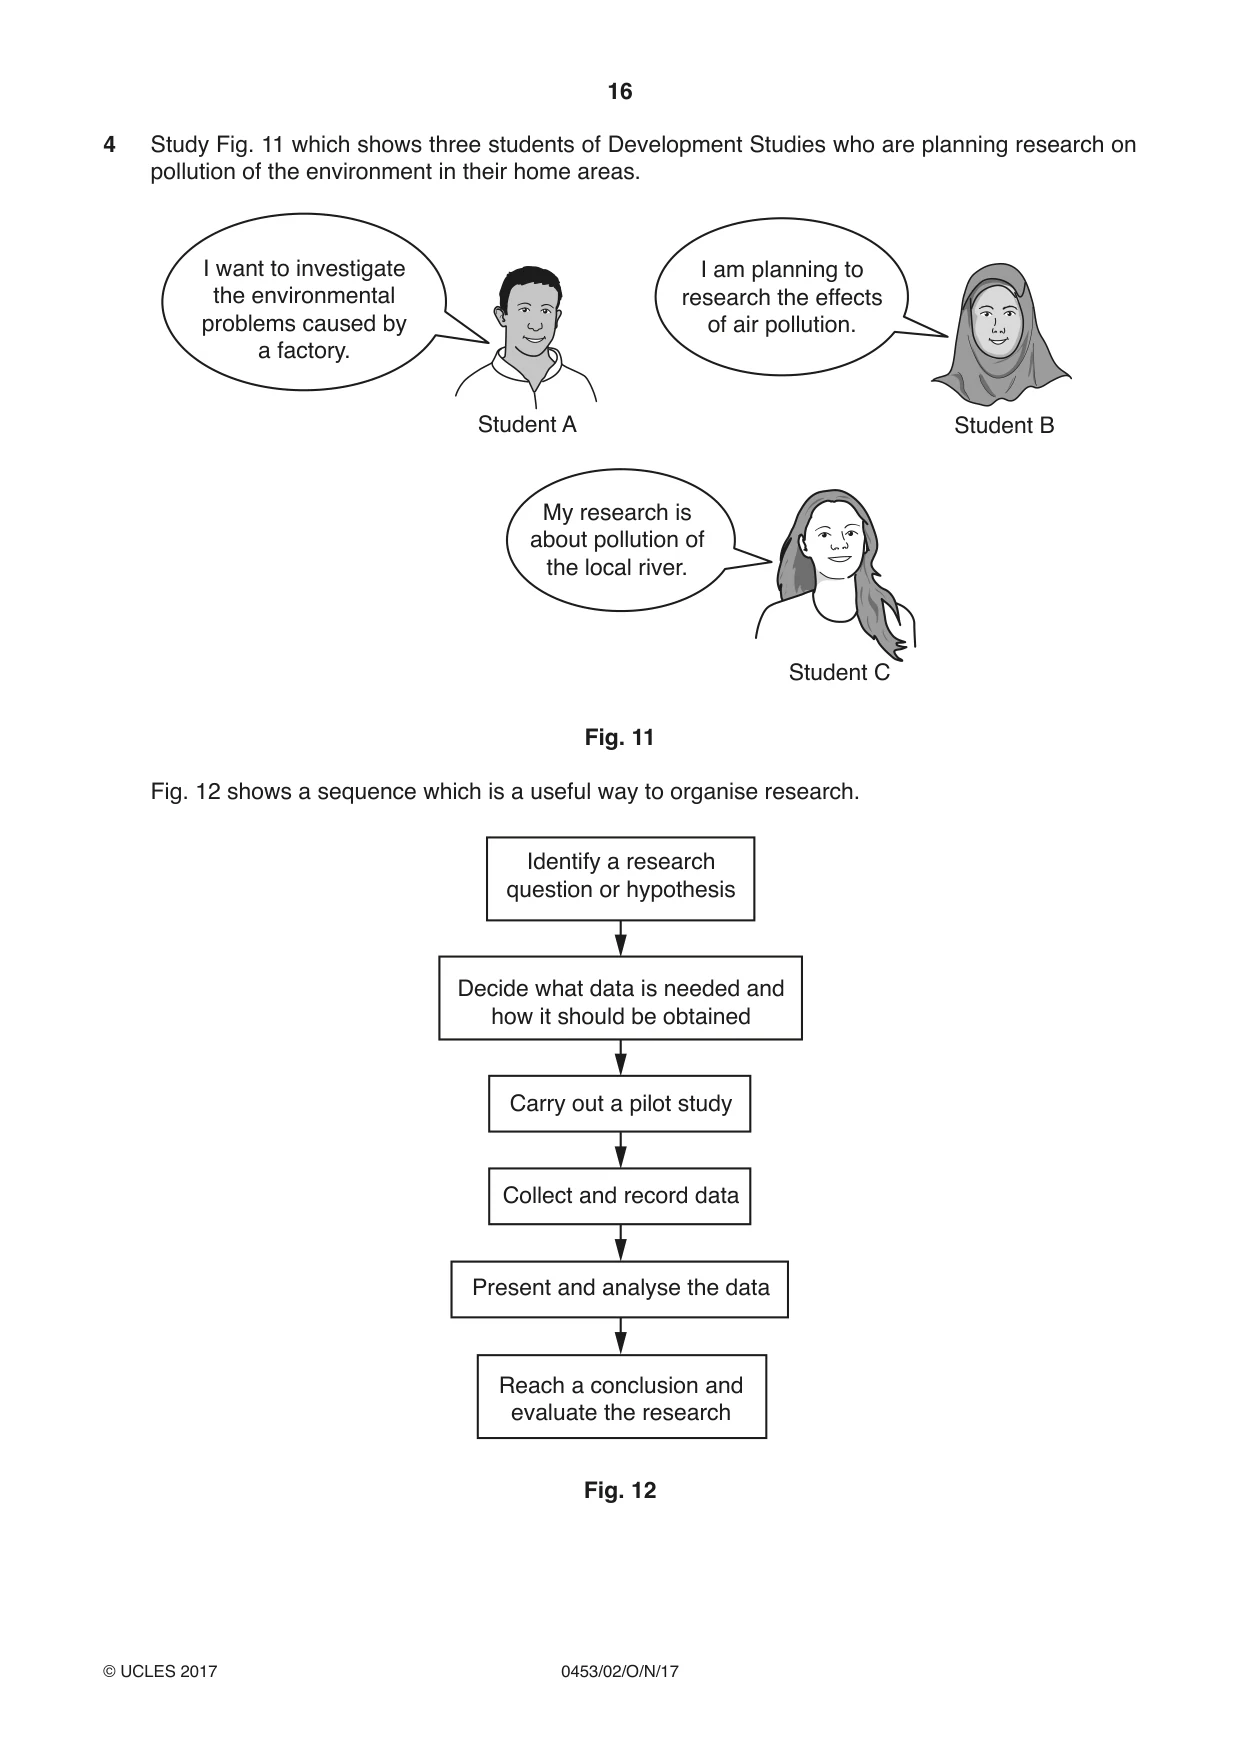
16 0453/02/O/N/17 © UCLES 2017 4 Study Fig. 11 which shows three students of Development Studies who are planning research on pollution of the environment in their home areas. I want to investigate the environmental problems caused by a factory. I am planning to research the effects of air pollution. My research is about pollution of the local river. Student A Student B Student C Fig. 11 Fig. 12 shows a sequence which is a useful way to organise research. Identify a research question or hypothesis Decide what data is needed and how it should be obtained Carry out a pilot study Collect and record data Present and analyse the data Reach a conclusion and evaluate the research Fig. 12
Question paper, page 17
17 0453/02/O/N/17 © UCLES 2017 [Turn over (a) Choose one of the students from Fig. 11, A, B or C, and write down the letter of that student. Describe how the student could carry out the research. Use the ideas in Fig. 12 to organise your answer. Letter of student chosen … … … … … … … … … … … … … … … … … … … … … … … … … … [9]
Question paper, page 18
18 0453/02/O/N/17 © UCLES 2017 (b) Describe any difficulties the student might have carrying out the chosen research. … … … … … … … … … … [5] [Total: 14 marks]
Question paper, page 19
19 0453/02/O/N/17 © UCLES 2017 BLANK PAGE
Question paper, page 20
20 0453/02/O/N/17 © UCLES 2017 BLANK PAGE Permission to reproduce items where third-party owned material protected by copyright is included has been sought and cleared where possible. Every reasonable effort has been made by the publisher (UCLES) to trace copyright holders, but if any items requiring clearance have unwittingly been included, the publisher will be pleased to make amends at the earliest possible opportunity. To avoid the issue of disclosure of answer-related information to candidates, all copyright acknowledgements are reproduced online in the Cambridge International Examinations Copyright Acknowledgements Booklet. This is produced for each series of examinations and is freely available to download at www.cie.org.uk after the live examination series. Cambridge International Examinations is part of the Cambridge Assessment Group. Cambridge Assessment is the brand name of University of Cambridge Local Examinations Syndicate (UCLES), which is itself a department of the University of Cambridge.
Mark scheme, page 1
® IGCSE is a registered trademark. This document consists of 12 printed pages. © UCLES 2017 [Turn over Cambridge Assessment International Education Cambridge International General Certificate of Secondary Education DEVELOPMENT STUDIES 0453/02 Paper 2 October/November 2017 MARK SCHEME Maximum Mark: 80 Published This mark scheme is published as an aid to teachers and candidates, to indicate the requirements of the examination. It shows the basis on which Examiners were instructed to award marks. It does not indicate the details of the discussions that took place at an Examiners’ meeting before marking began, which would have considered the acceptability of alternative answers. Mark schemes should be read in conjunction with the question paper and the Principal Examiner Report for Teachers. Cambridge International will not enter into discussions about these mark schemes. Cambridge International is publishing the mark schemes for the October/November 2017 series for most Cambridge IGCSE®, Cambridge International A and AS Level components and some Cambridge O Level components.
Mark scheme, page 2
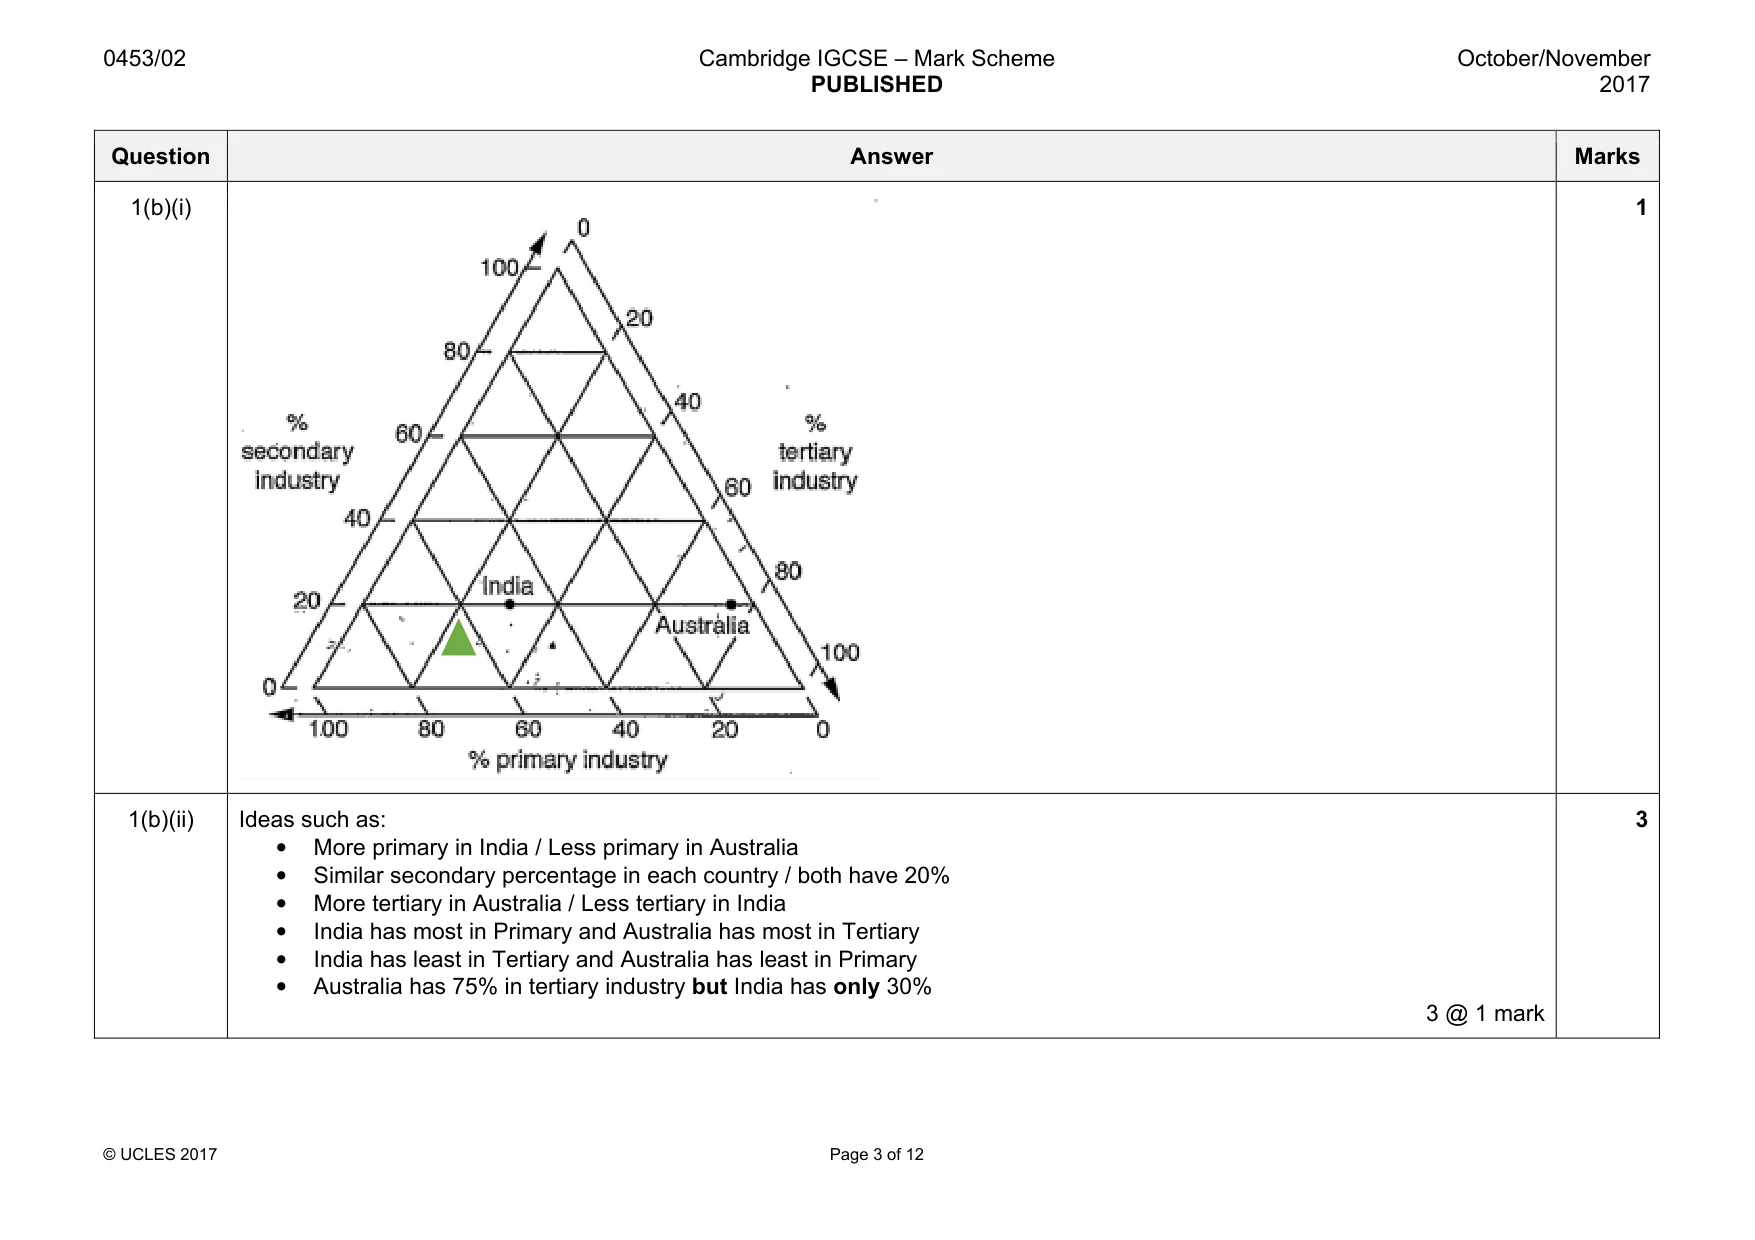
0453/02 Cambridge IGCSE – Mark Scheme PUBLISHED October/November 2017 © UCLES 2017 Page 2 of 12 Question Answer Marks 1(a)(i) Human Development Index 1 1(a)(ii) Algeria Cameroon 2 @ 1 mark 2 1(a)(iii) 2 marks for a full answer: The average amount of goods and services produced per person per year in Cameroon is US $3000 1 mark for reference to the amount / value of goods / services or countries income produced in one year 2nd mark for further information – per person / US $3000 2 @ 1 mark 2 1(a)(iv) Algeria and Tunisia are likely answers with Botswana as another possibility. No marks for country choice; the marks are to be awarded for reasoning. Tunisia / Algeria has: • high HDI rank • high GDP per capita • high life expectancy • high literacy / number of people that can read and write • uses large amount of energy per person etc Botswana has: • high GDP per capita • high literacy / number of people that can read and write • relatively high use of energy per person 3 @ 1 mark 3
Mark scheme, page 3
0453/02 Cambridge IGCSE – Mark Scheme PUBLISHED October/November 2017 © UCLES 2017 Page 3 of 12 Question Answer Marks 1(b)(i) 1 1(b)(ii) Ideas such as: • More primary in India / Less primary in Australia • Similar secondary percentage in each country / both have 20% • More tertiary in Australia / Less tertiary in India • India has most in Primary and Australia has most in Tertiary • India has least in Tertiary and Australia has least in Primary • Australia has 75% in tertiary industry but India has only 30% 3 @ 1 mark 3
Mark scheme, page 4
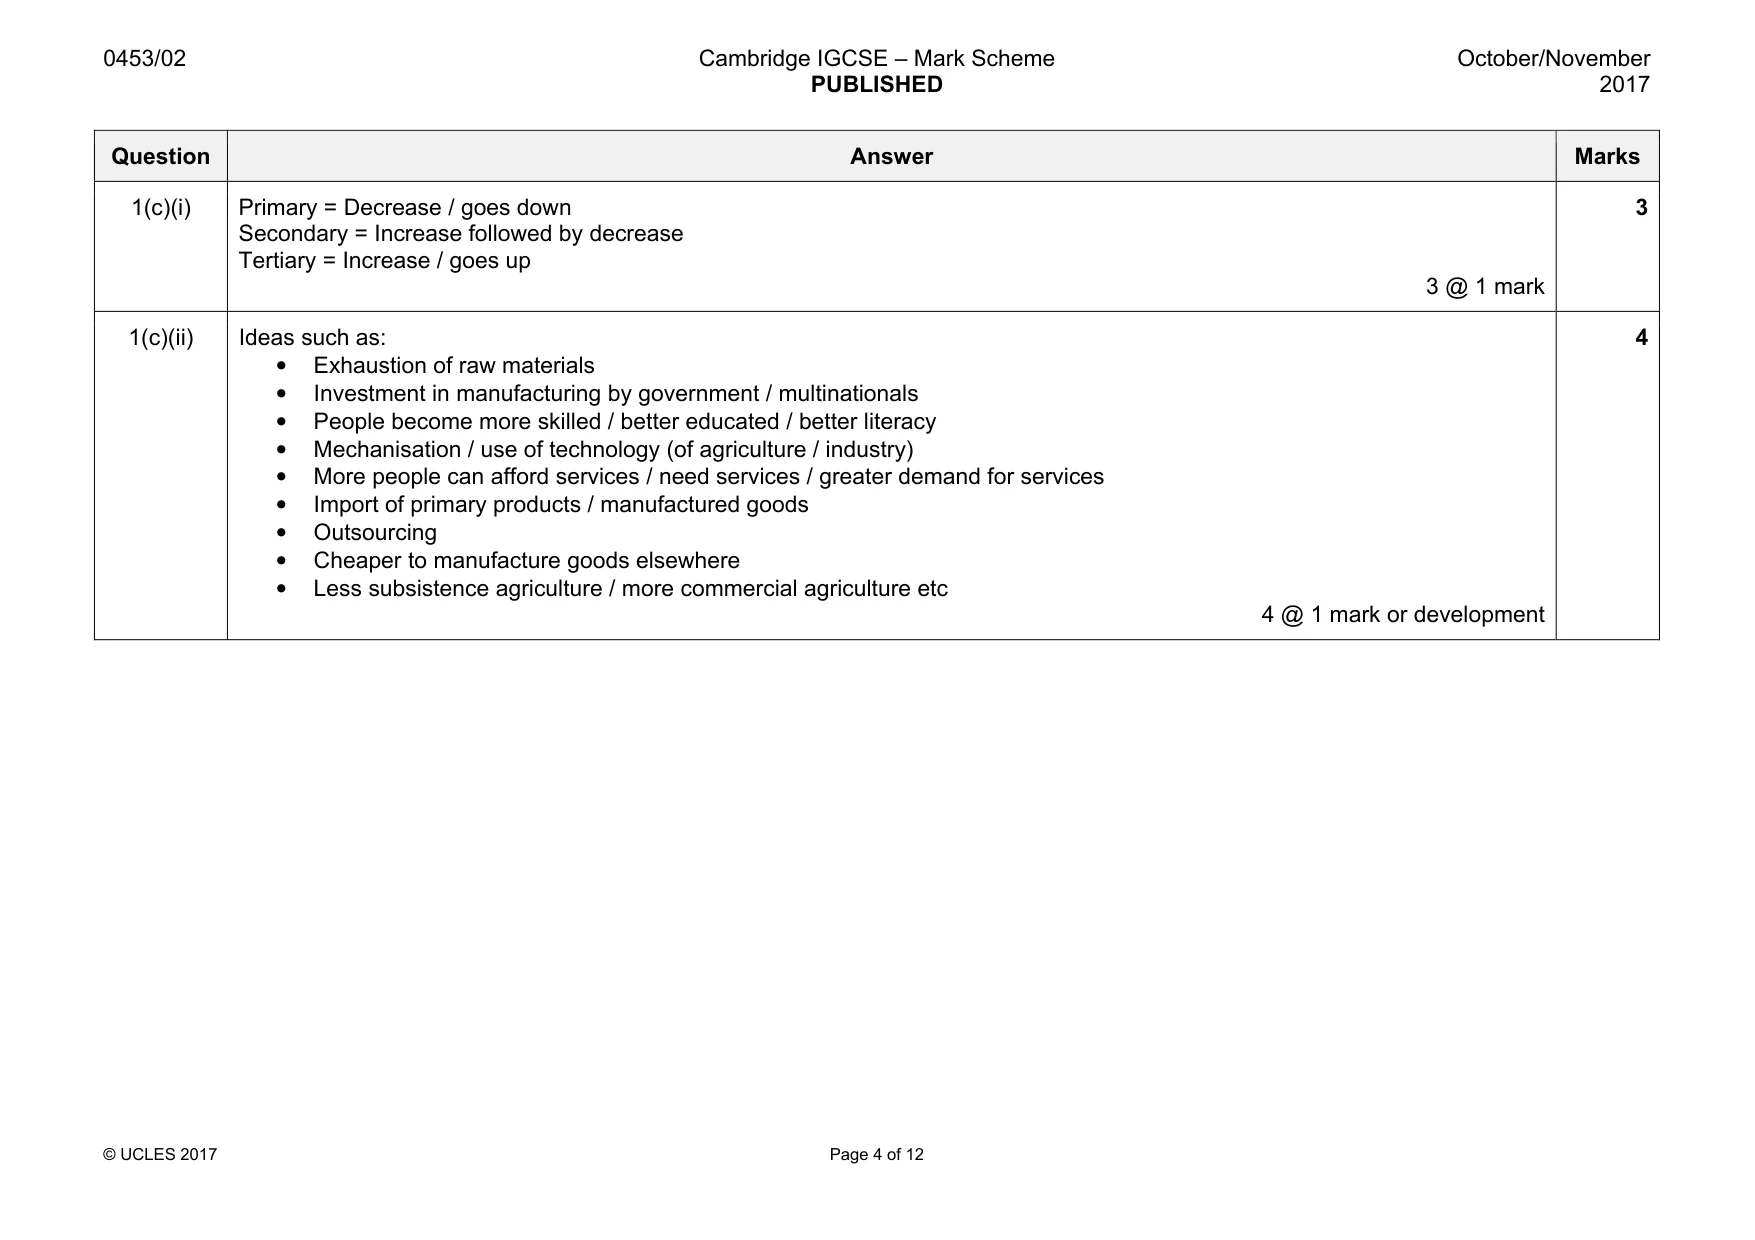
0453/02 Cambridge IGCSE – Mark Scheme PUBLISHED October/November 2017 © UCLES 2017 Page 4 of 12 Question Answer Marks 1(c)(i) Primary = Decrease / goes down Secondary = Increase followed by decrease Tertiary = Increase / goes up 3 @ 1 mark 3 1(c)(ii) Ideas such as: • Exhaustion of raw materials • Investment in manufacturing by government / multinationals • People become more skilled / better educated / better literacy • Mechanisation / use of technology (of agriculture / industry) • More people can afford services / need services / greater demand for services • Import of primary products / manufactured goods • Outsourcing • Cheaper to manufacture goods elsewhere • Less subsistence agriculture / more commercial agriculture etc 4 @ 1 mark or development 4
Mark scheme, page 5
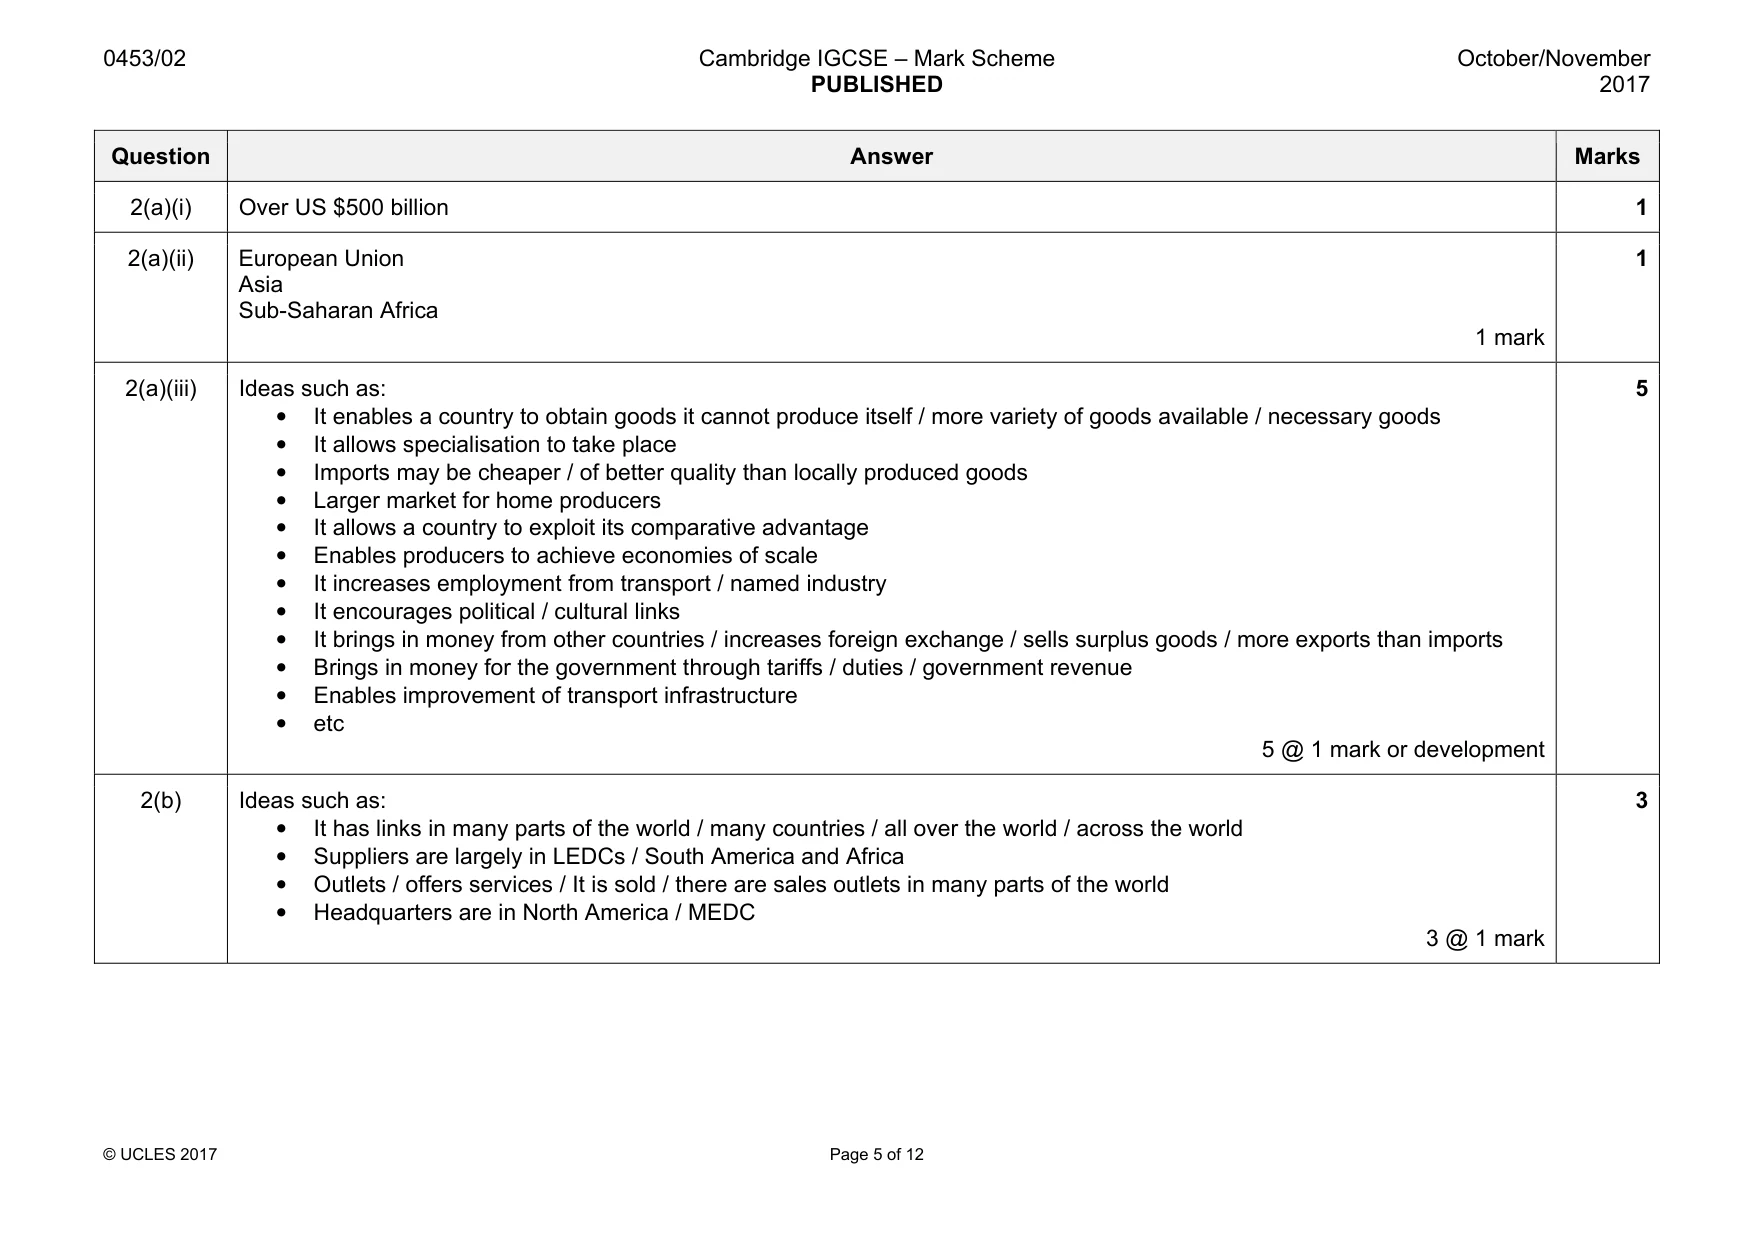
0453/02 Cambridge IGCSE – Mark Scheme PUBLISHED October/November 2017 © UCLES 2017 Page 5 of 12 Question Answer Marks 2(a)(i) Over US $500 billion 1 2(a)(ii) European Union Asia Sub-Saharan Africa 1 mark 1 2(a)(iii) Ideas such as: • It enables a country to obtain goods it cannot produce itself / more variety of goods available / necessary goods • It allows specialisation to take place • Imports may be cheaper / of better quality than locally produced goods • Larger market for home producers • It allows a country to exploit its comparative advantage • Enables producers to achieve economies of scale • It increases employment from transport / named industry • It encourages political / cultural links • It brings in money from other countries / increases foreign exchange / sells surplus goods / more exports than imports • Brings in money for the government through tariffs / duties / government revenue • Enables improvement of transport infrastructure • etc 5 @ 1 mark or development 5 2(b) Ideas such as: • It has links in many parts of the world / many countries / all over the world / across the world • Suppliers are largely in LEDCs / South America and Africa • Outlets / offers services / It is sold / there are sales outlets in many parts of the world • Headquarters are in North America / MEDC 3 @ 1 mark 3
Mark scheme, page 6
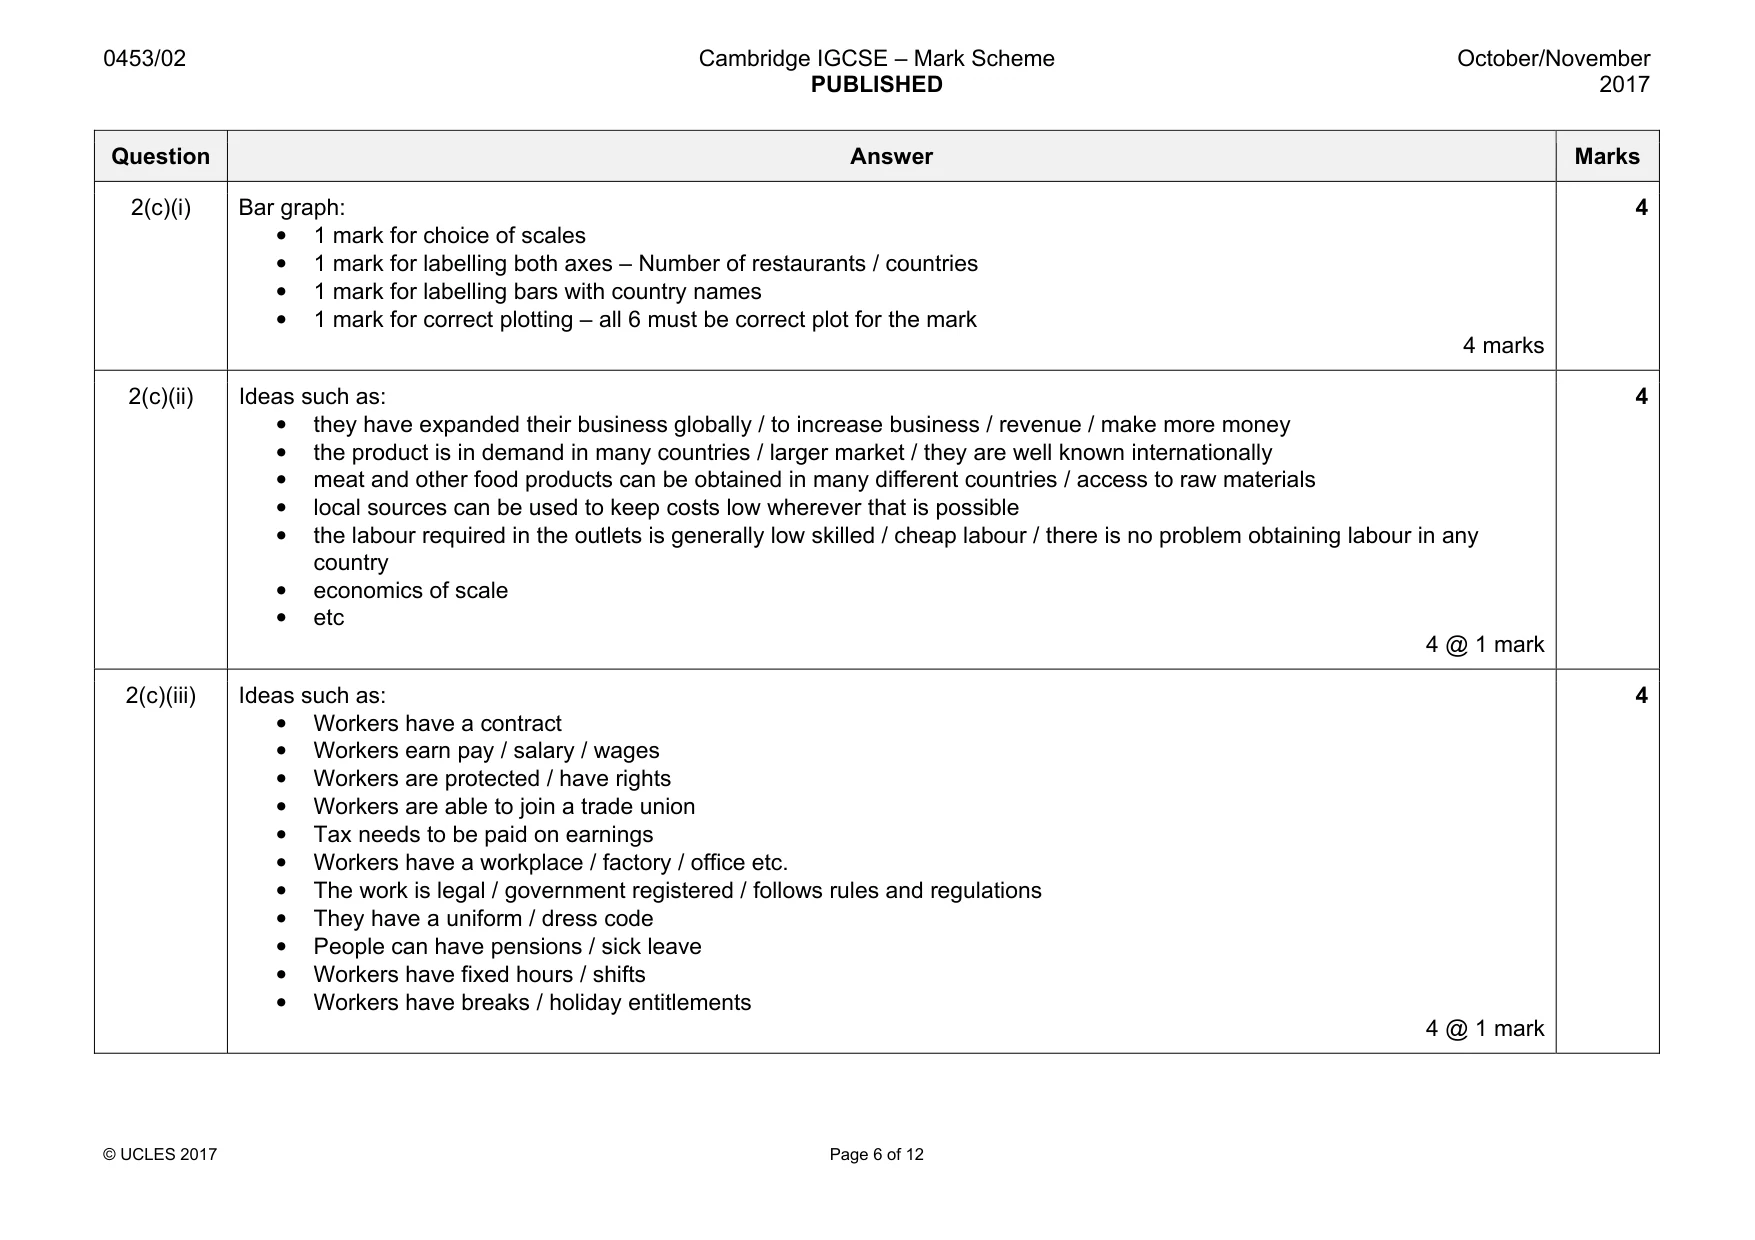
0453/02 Cambridge IGCSE – Mark Scheme PUBLISHED October/November 2017 © UCLES 2017 Page 6 of 12 Question Answer Marks 2(c)(i) Bar graph: • 1 mark for choice of scales • 1 mark for labelling both axes – Number of restaurants / countries • 1 mark for labelling bars with country names • 1 mark for correct plotting – all 6 must be correct plot for the mark 4 marks 4 2(c)(ii) Ideas such as: • they have expanded their business globally / to increase business / revenue / make more money • the product is in demand in many countries / larger market / they are well known internationally • meat and other food products can be obtained in many different countries / access to raw materials • local sources can be used to keep costs low wherever that is possible • the labour required in the outlets is generally low skilled / cheap labour / there is no problem obtaining labour in any country • economics of scale • etc 4 @ 1 mark 4 2(c)(iii) Ideas such as: • Workers have a contract • Workers earn pay / salary / wages • Workers are protected / have rights • Workers are able to join a trade union • Tax needs to be paid on earnings • Workers have a workplace / factory / office etc. • The work is legal / government registered / follows rules and regulations • They have a uniform / dress code • People can have pensions / sick leave • Workers have fixed hours / shifts • Workers have breaks / holiday entitlements 4 @ 1 mark 4
Mark scheme, page 7
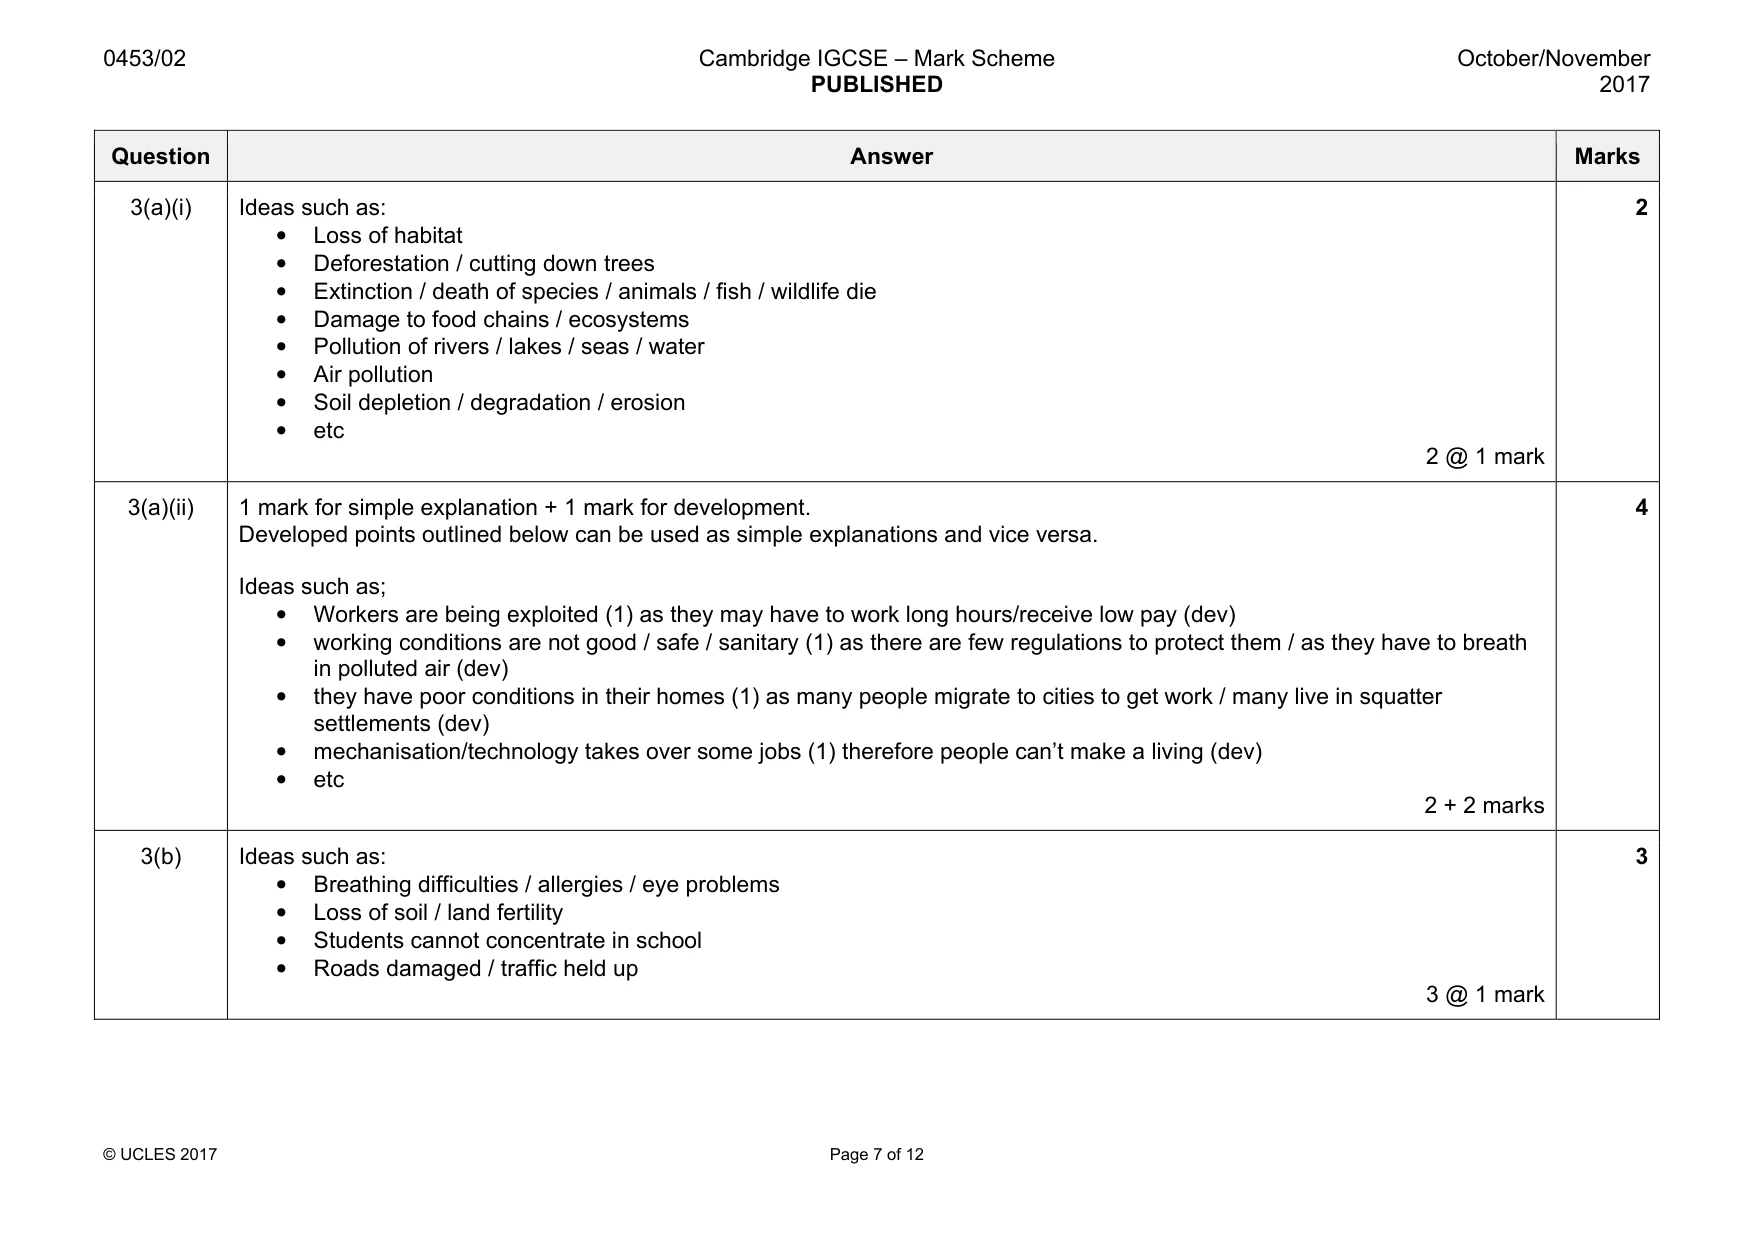
0453/02 Cambridge IGCSE – Mark Scheme PUBLISHED October/November 2017 © UCLES 2017 Page 7 of 12 Question Answer Marks 3(a)(i) Ideas such as: • Loss of habitat • Deforestation / cutting down trees • Extinction / death of species / animals / fish / wildlife die • Damage to food chains / ecosystems • Pollution of rivers / lakes / seas / water • Air pollution • Soil depletion / degradation / erosion • etc 2 @ 1 mark 2 3(a)(ii) 1 mark for simple explanation + 1 mark for development. Developed points outlined below can be used as simple explanations and vice versa. Ideas such as; • Workers are being exploited (1) as they may have to work long hours/receive low pay (dev) • working conditions are not good / safe / sanitary (1) as there are few regulations to protect them / as they have to breath in polluted air (dev) • they have poor conditions in their homes (1) as many people migrate to cities to get work / many live in squatter settlements (dev) • mechanisation/technology takes over some jobs (1) therefore people can’t make a living (dev) • etc 2 + 2 marks 4 3(b) Ideas such as: • Breathing difficulties / allergies / eye problems • Loss of soil / land fertility • Students cannot concentrate in school • Roads damaged / traffic held up 3 @ 1 mark 3
Mark scheme, page 8
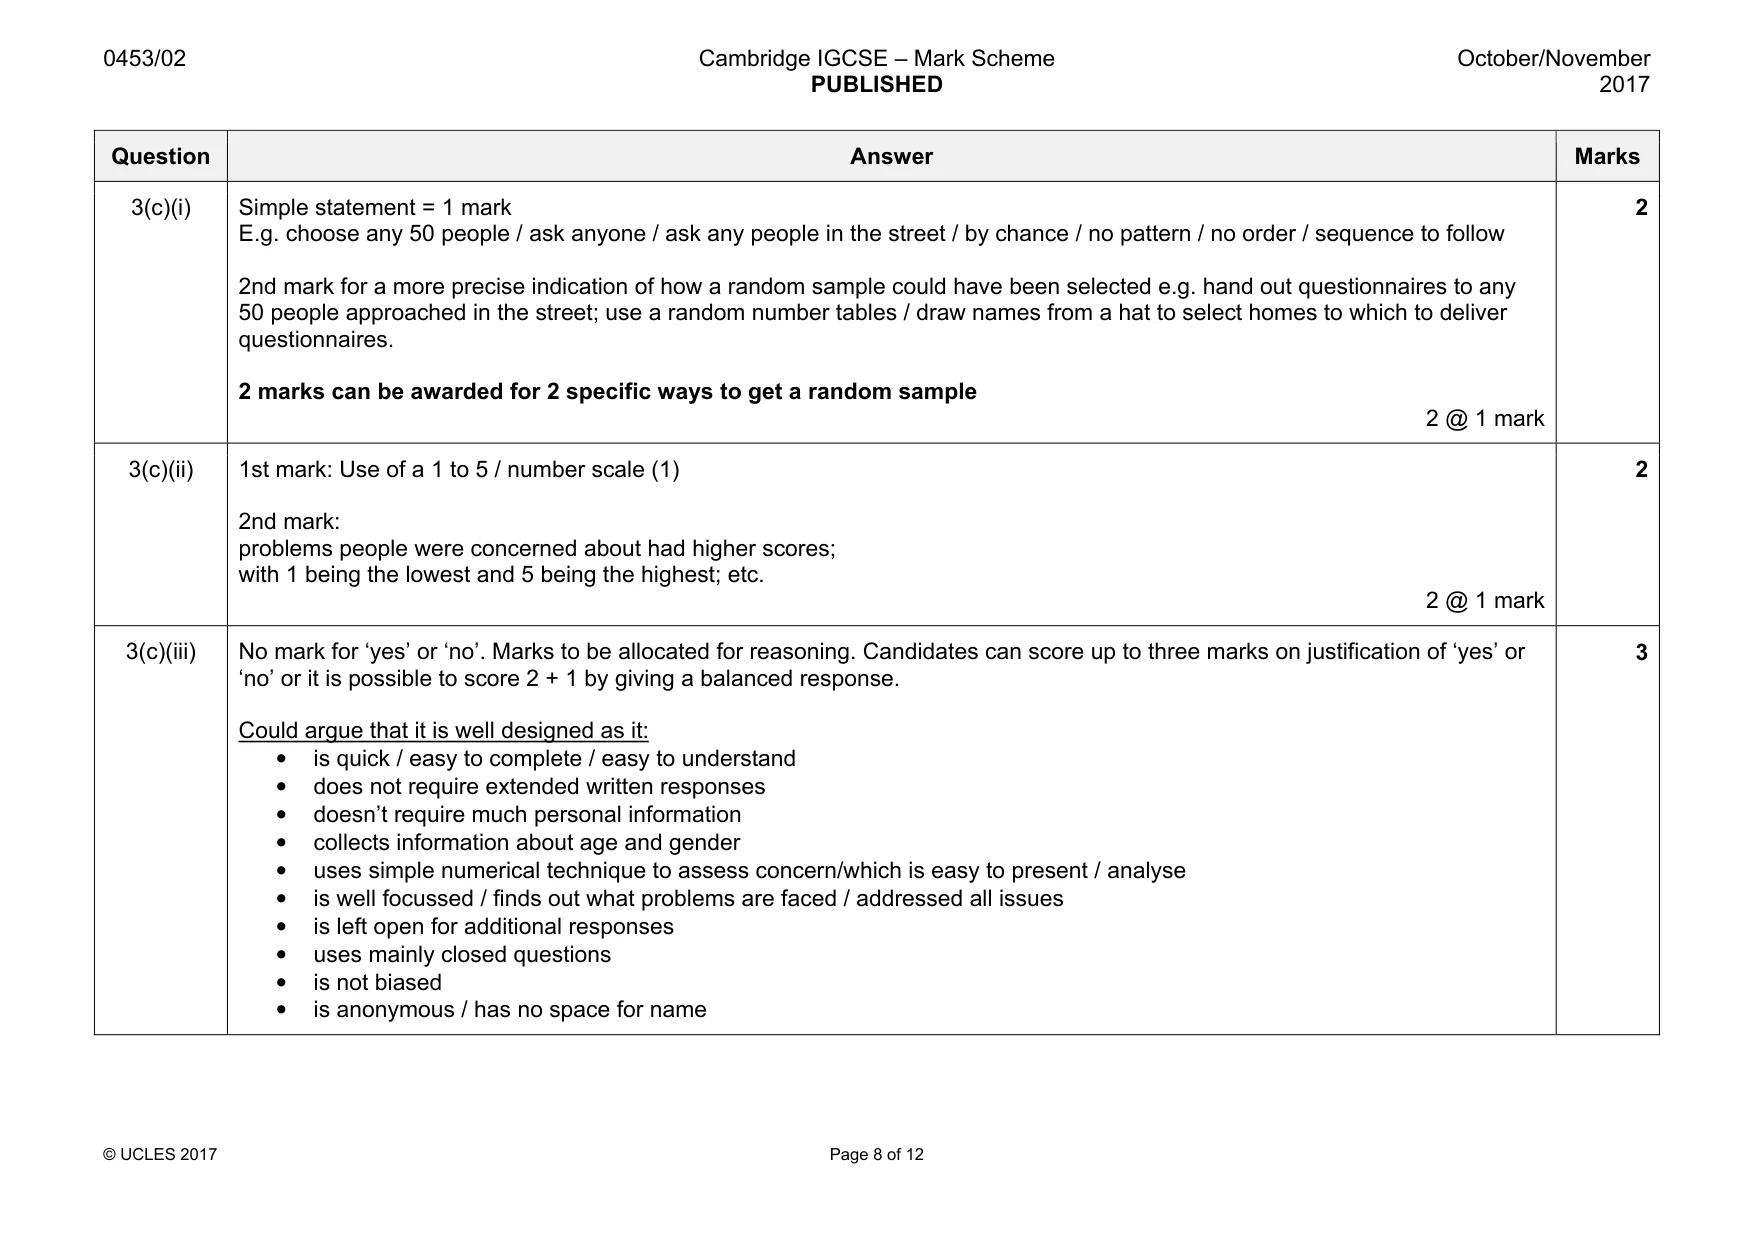
0453/02 Cambridge IGCSE – Mark Scheme PUBLISHED October/November 2017 © UCLES 2017 Page 8 of 12 Question Answer Marks 3(c)(i) Simple statement = 1 mark E.g. choose any 50 people / ask anyone / ask any people in the street / by chance / no pattern / no order / sequence to follow 2nd mark for a more precise indication of how a random sample could have been selected e.g. hand out questionnaires to any 50 people approached in the street; use a random number tables / draw names from a hat to select homes to which to deliver questionnaires. 2 marks can be awarded for 2 specific ways to get a random sample 2 @ 1 mark 2 3(c)(ii) 1st mark: Use of a 1 to 5 / number scale (1) 2nd mark: problems people were concerned about had higher scores; with 1 being the lowest and 5 being the highest; etc. 2 @ 1 mark 2 3(c)(iii) No mark for ‘yes’ or ‘no’. Marks to be allocated for reasoning. Candidates can score up to three marks on justification of ‘yes’ or ‘no’ or it is possible to score 2 + 1 by giving a balanced response. Could argue that it is well designed as it: • is quick / easy to complete / easy to understand • does not require extended written responses • doesn’t require much personal information • collects information about age and gender • uses simple numerical technique to assess concern/which is easy to present / analyse • is well focussed / finds out what problems are faced / addressed all issues • is left open for additional responses • uses mainly closed questions • is not biased • is anonymous / has no space for name 3
Mark scheme, page 9
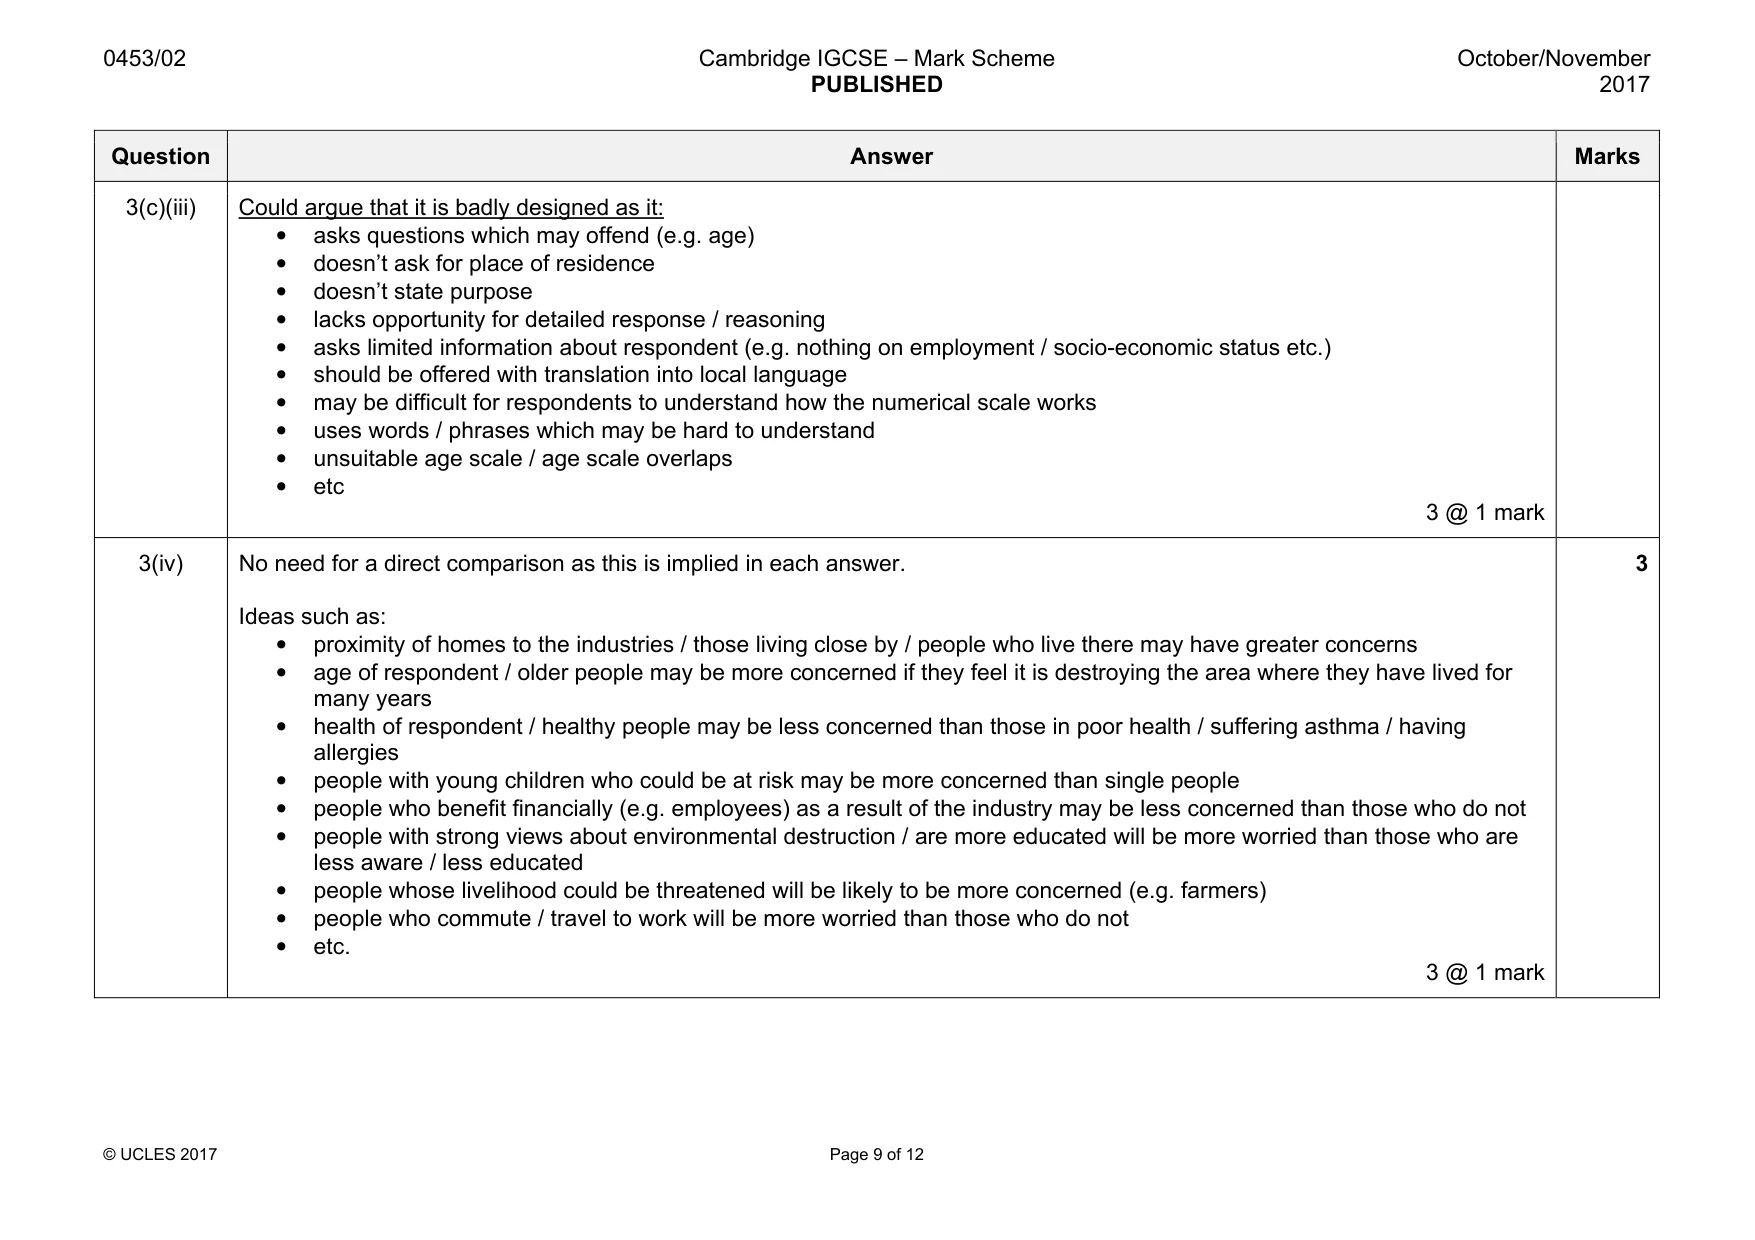
0453/02 Cambridge IGCSE – Mark Scheme PUBLISHED October/November 2017 © UCLES 2017 Page 9 of 12 Question Answer Marks 3(c)(iii) Could argue that it is badly designed as it: • asks questions which may offend (e.g. age) • doesn’t ask for place of residence • doesn’t state purpose • lacks opportunity for detailed response / reasoning • asks limited information about respondent (e.g. nothing on employment / socio-economic status etc.) • should be offered with translation into local language • may be difficult for respondents to understand how the numerical scale works • uses words / phrases which may be hard to understand • unsuitable age scale / age scale overlaps • etc 3 @ 1 mark 3(iv) No need for a direct comparison as this is implied in each answer. Ideas such as: • proximity of homes to the industries / those living close by / people who live there may have greater concerns • age of respondent / older people may be more concerned if they feel it is destroying the area where they have lived for many years • health of respondent / healthy people may be less concerned than those in poor health / suffering asthma / having allergies • people with young children who could be at risk may be more concerned than single people • people who benefit financially (e.g. employees) as a result of the industry may be less concerned than those who do not • people with strong views about environmental destruction / are more educated will be more worried than those who are less aware / less educated • people whose livelihood could be threatened will be likely to be more concerned (e.g. farmers) • people who commute / travel to work will be more worried than those who do not • etc. 3 @ 1 mark 3
Mark scheme, page 10
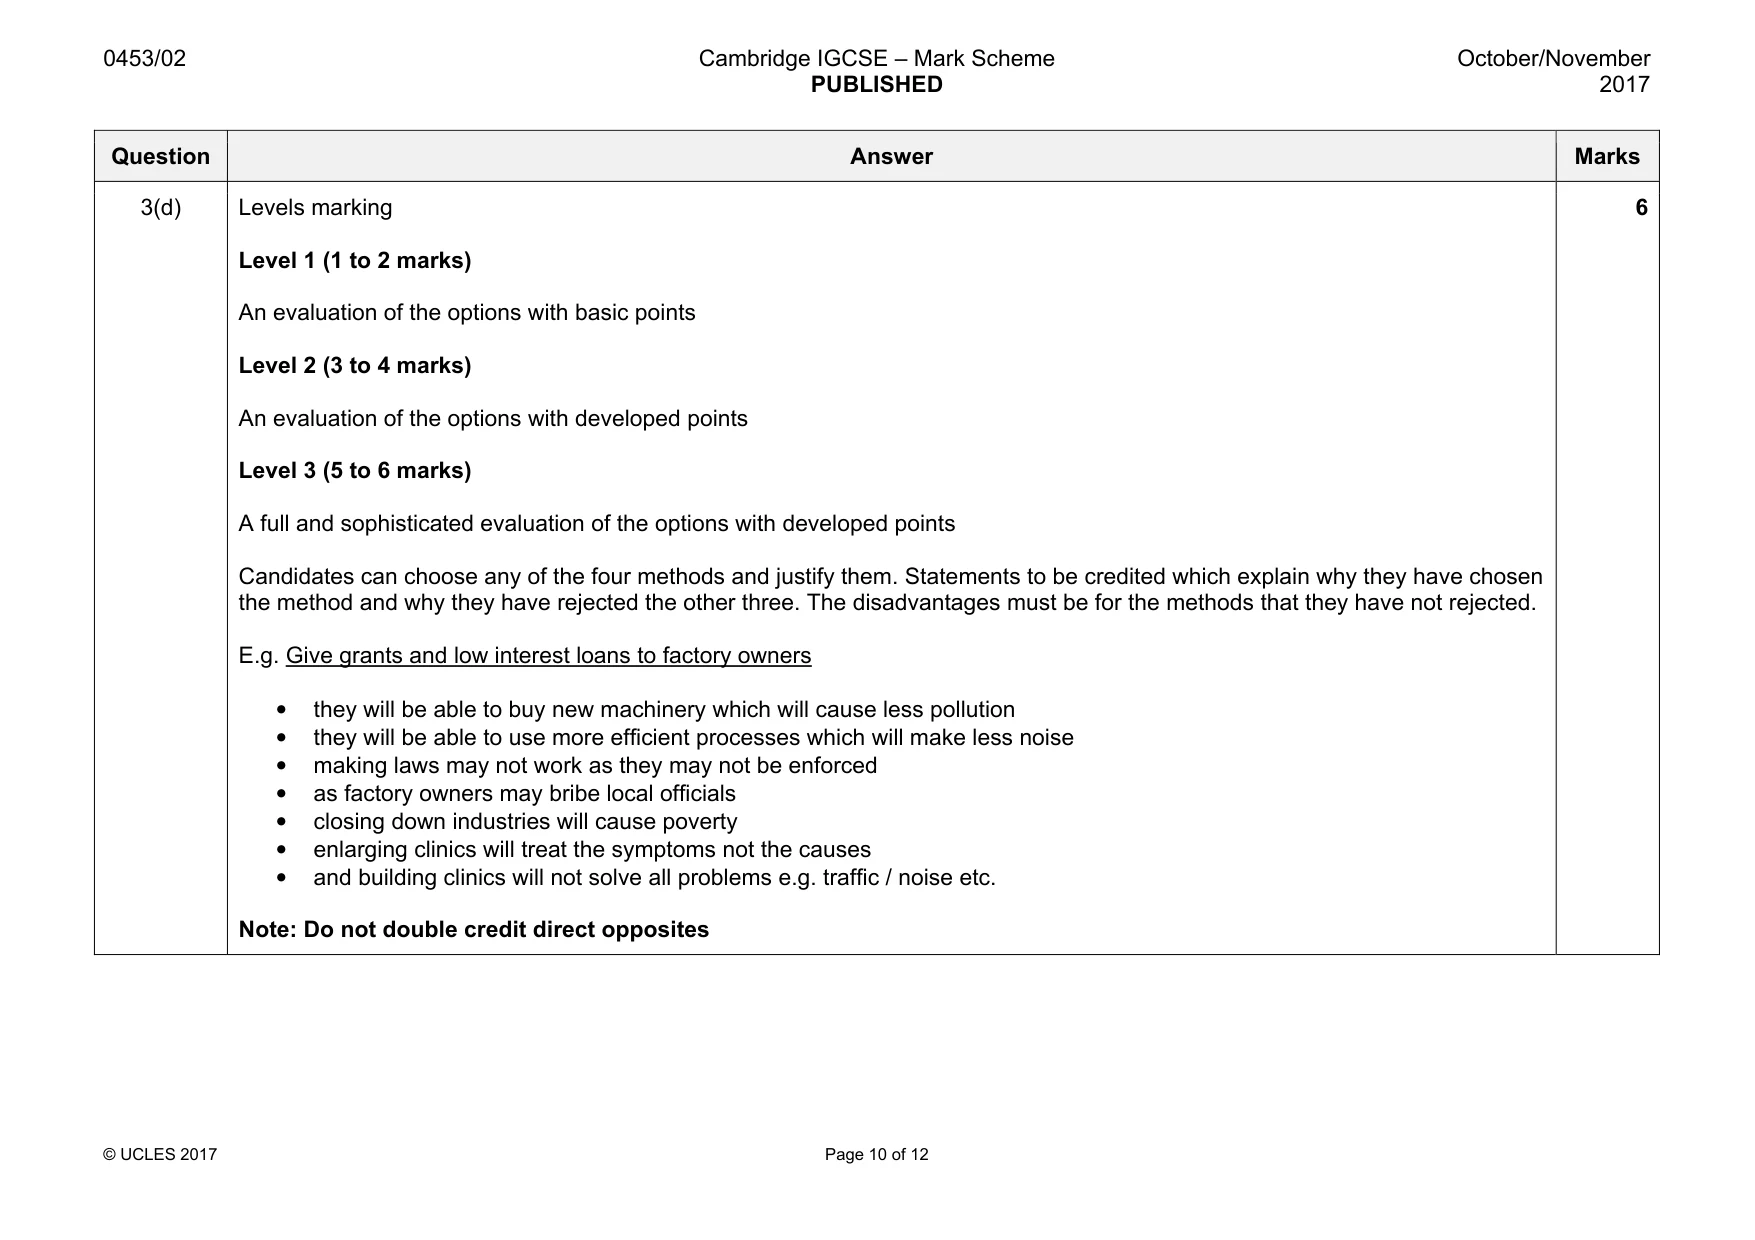
0453/02 Cambridge IGCSE – Mark Scheme PUBLISHED October/November 2017 © UCLES 2017 Page 10 of 12 Question Answer Marks 3(d) Levels marking Level 1 (1 to 2 marks) An evaluation of the options with basic points Level 2 (3 to 4 marks) An evaluation of the options with developed points Level 3 (5 to 6 marks) A full and sophisticated evaluation of the options with developed points Candidates can choose any of the four methods and justify them. Statements to be credited which explain why they have chosen the method and why they have rejected the other three. The disadvantages must be for the methods that they have not rejected. E.g. Give grants and low interest loans to factory owners • they will be able to buy new machinery which will cause less pollution • they will be able to use more efficient processes which will make less noise • making laws may not work as they may not be enforced • as factory owners may bribe local officials • closing down industries will cause poverty • enlarging clinics will treat the symptoms not the causes • and building clinics will not solve all problems e.g. traffic / noise etc. Note: Do not double credit direct opposites 6
Mark scheme, page 11
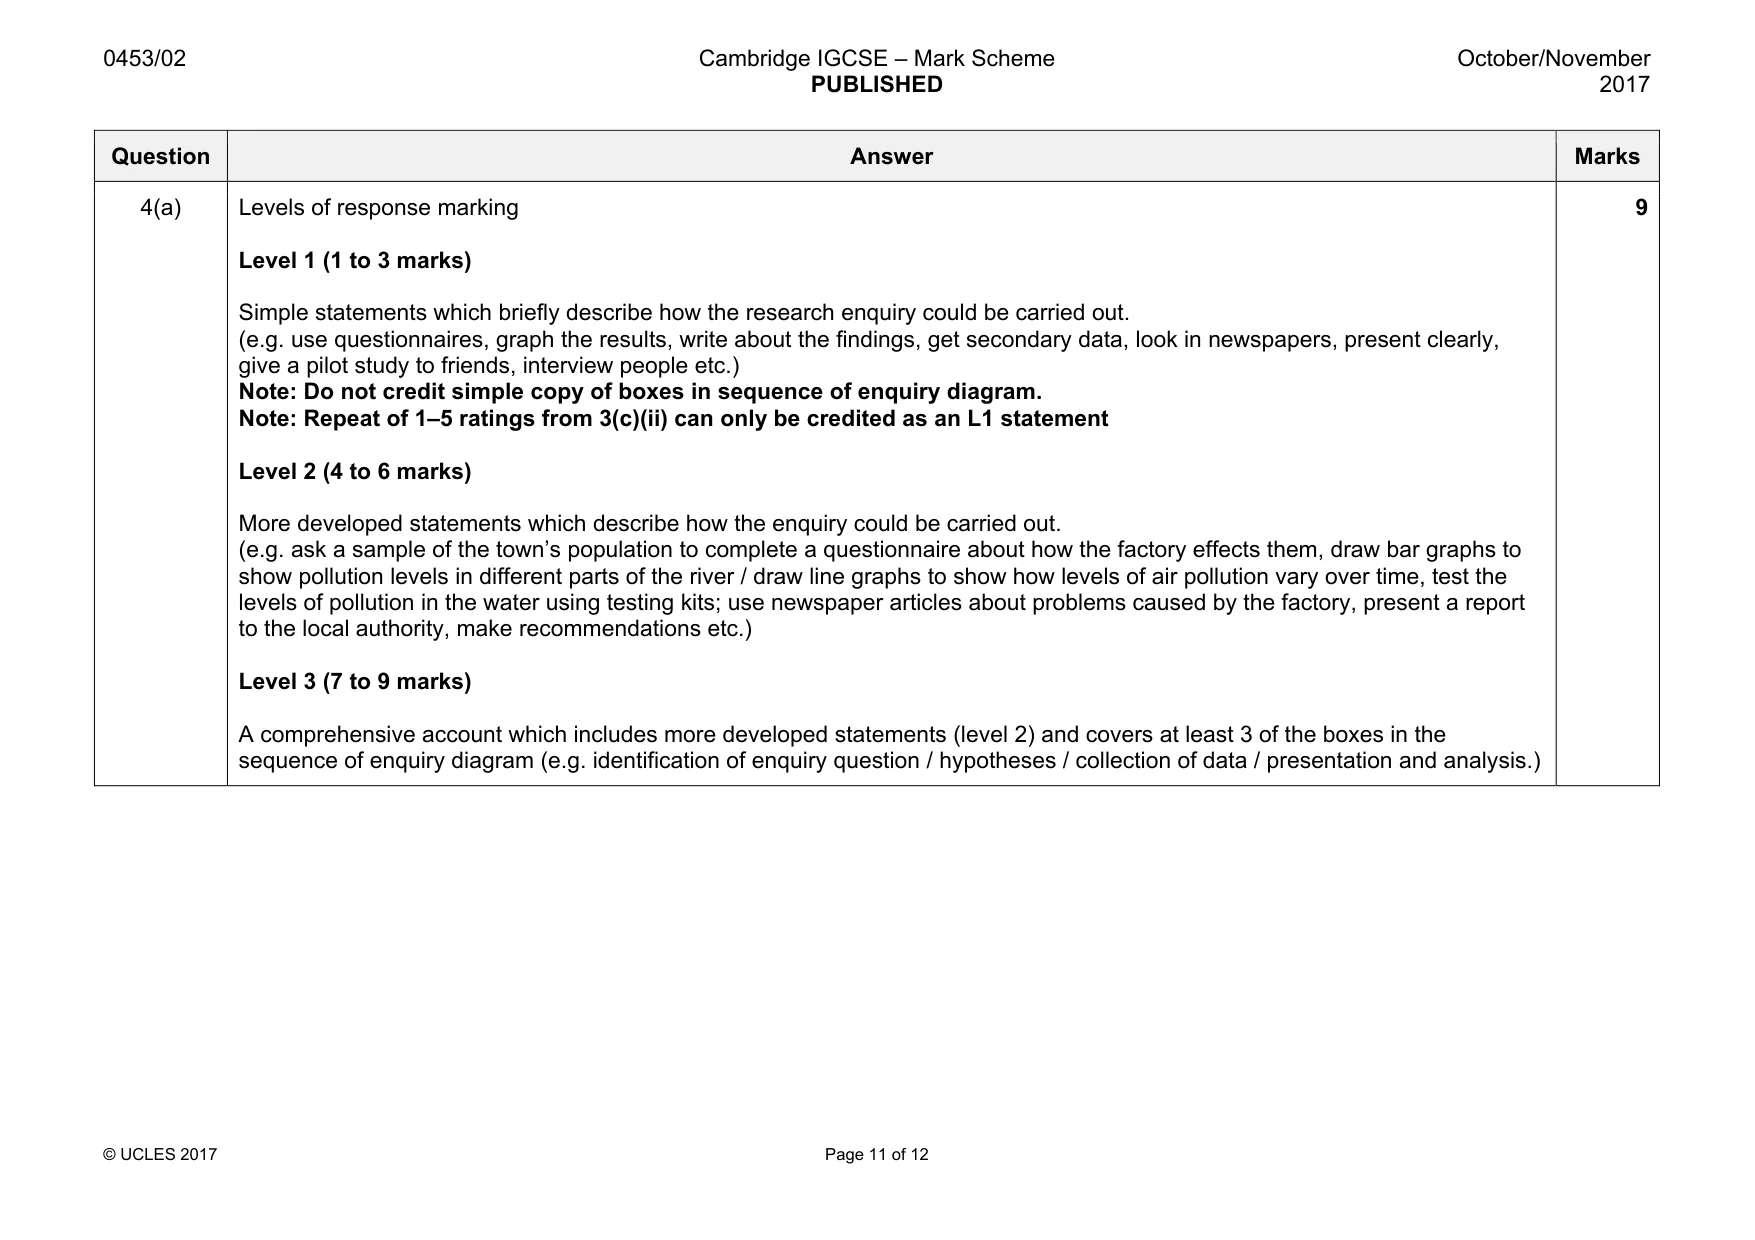
0453/02 Cambridge IGCSE – Mark Scheme PUBLISHED October/November 2017 © UCLES 2017 Page 11 of 12 Question Answer Marks 4(a) Levels of response marking Level 1 (1 to 3 marks) Simple statements which briefly describe how the research enquiry could be carried out. (e.g. use questionnaires, graph the results, write about the findings, get secondary data, look in newspapers, present clearly, give a pilot study to friends, interview people etc.) Note: Do not credit simple copy of boxes in sequence of enquiry diagram. Note: Repeat of 1–5 ratings from 3(c)(ii) can only be credited as an L1 statement Level 2 (4 to 6 marks) More developed statements which describe how the enquiry could be carried out. (e.g. ask a sample of the town’s population to complete a questionnaire about how the factory effects them, draw bar graphs to show pollution levels in different parts of the river / draw line graphs to show how levels of air pollution vary over time, test the levels of pollution in the water using testing kits; use newspaper articles about problems caused by the factory, present a report to the local authority, make recommendations etc.) Level 3 (7 to 9 marks) A comprehensive account which includes more developed statements (level 2) and covers at least 3 of the boxes in the sequence of enquiry diagram (e.g. identification of enquiry question / hypotheses / collection of data / presentation and analysis.) 9
Mark scheme, page 12
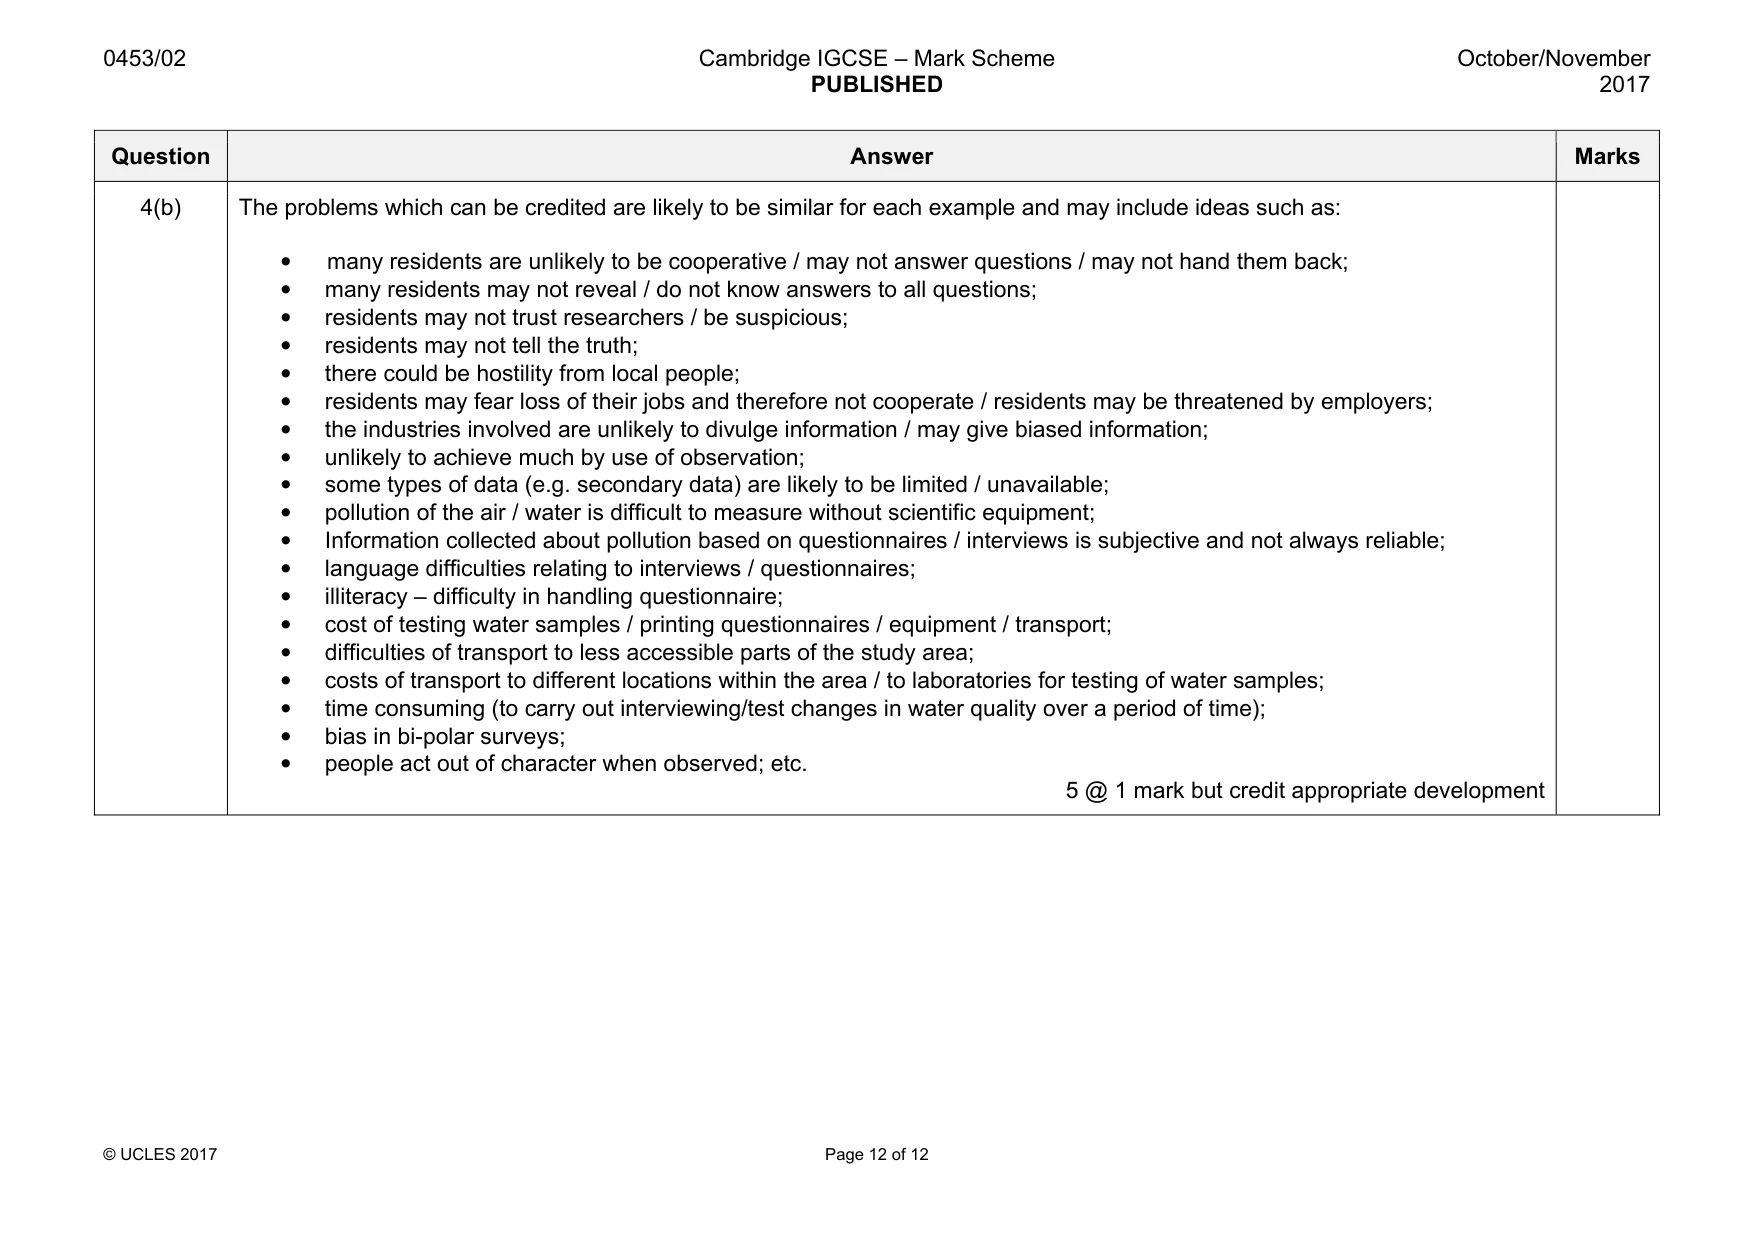
0453/02 Cambridge IGCSE – Mark Scheme PUBLISHED October/November 2017 © UCLES 2017 Page 12 of 12 Question Answer Marks 4(b) The problems which can be credited are likely to be similar for each example and may include ideas such as: • many residents are unlikely to be cooperative / may not answer questions / may not hand them back; • many residents may not reveal / do not know answers to all questions; • residents may not trust researchers / be suspicious; • residents may not tell the truth; • there could be hostility from local people; • residents may fear loss of their jobs and therefore not cooperate / residents may be threatened by employers; • the industries involved are unlikely to divulge information / may give biased information; • unlikely to achieve much by use of observation; • some types of data (e.g. secondary data) are likely to be limited / unavailable; • pollution of the air / water is difficult to measure without scientific equipment; • Information collected about pollution based on questionnaires / interviews is subjective and not always reliable; • language difficulties relating to interviews / questionnaires; • illiteracy – difficulty in handling questionnaire; • cost of testing water samples / printing questionnaires / equipment / transport; • difficulties of transport to less accessible parts of the study area; • costs of transport to different locations within the area / to laboratories for testing of water samples; • time consuming (to carry out interviewing/test changes in water quality over a period of time); • bias in bi-polar surveys; • people act out of character when observed; etc. 5 @ 1 mark but credit appropriate development
What you needed in this session
Cambridge’s own grade thresholds for 2017 Oct/Nov, Paper 2 · Variant 1. A higher threshold means an easier paper — the bar moves with how the cohort did.