Cambridge IGCSE Development Studies 0453 — 2012 Oct/Nov Paper 2 · Variant 1
0453/21/O/N/12 · 80 marks · ≈90 min
The question paper and its mark scheme, free to read here and free to download. This is Cambridge’s own paper, exactly as it was sat.
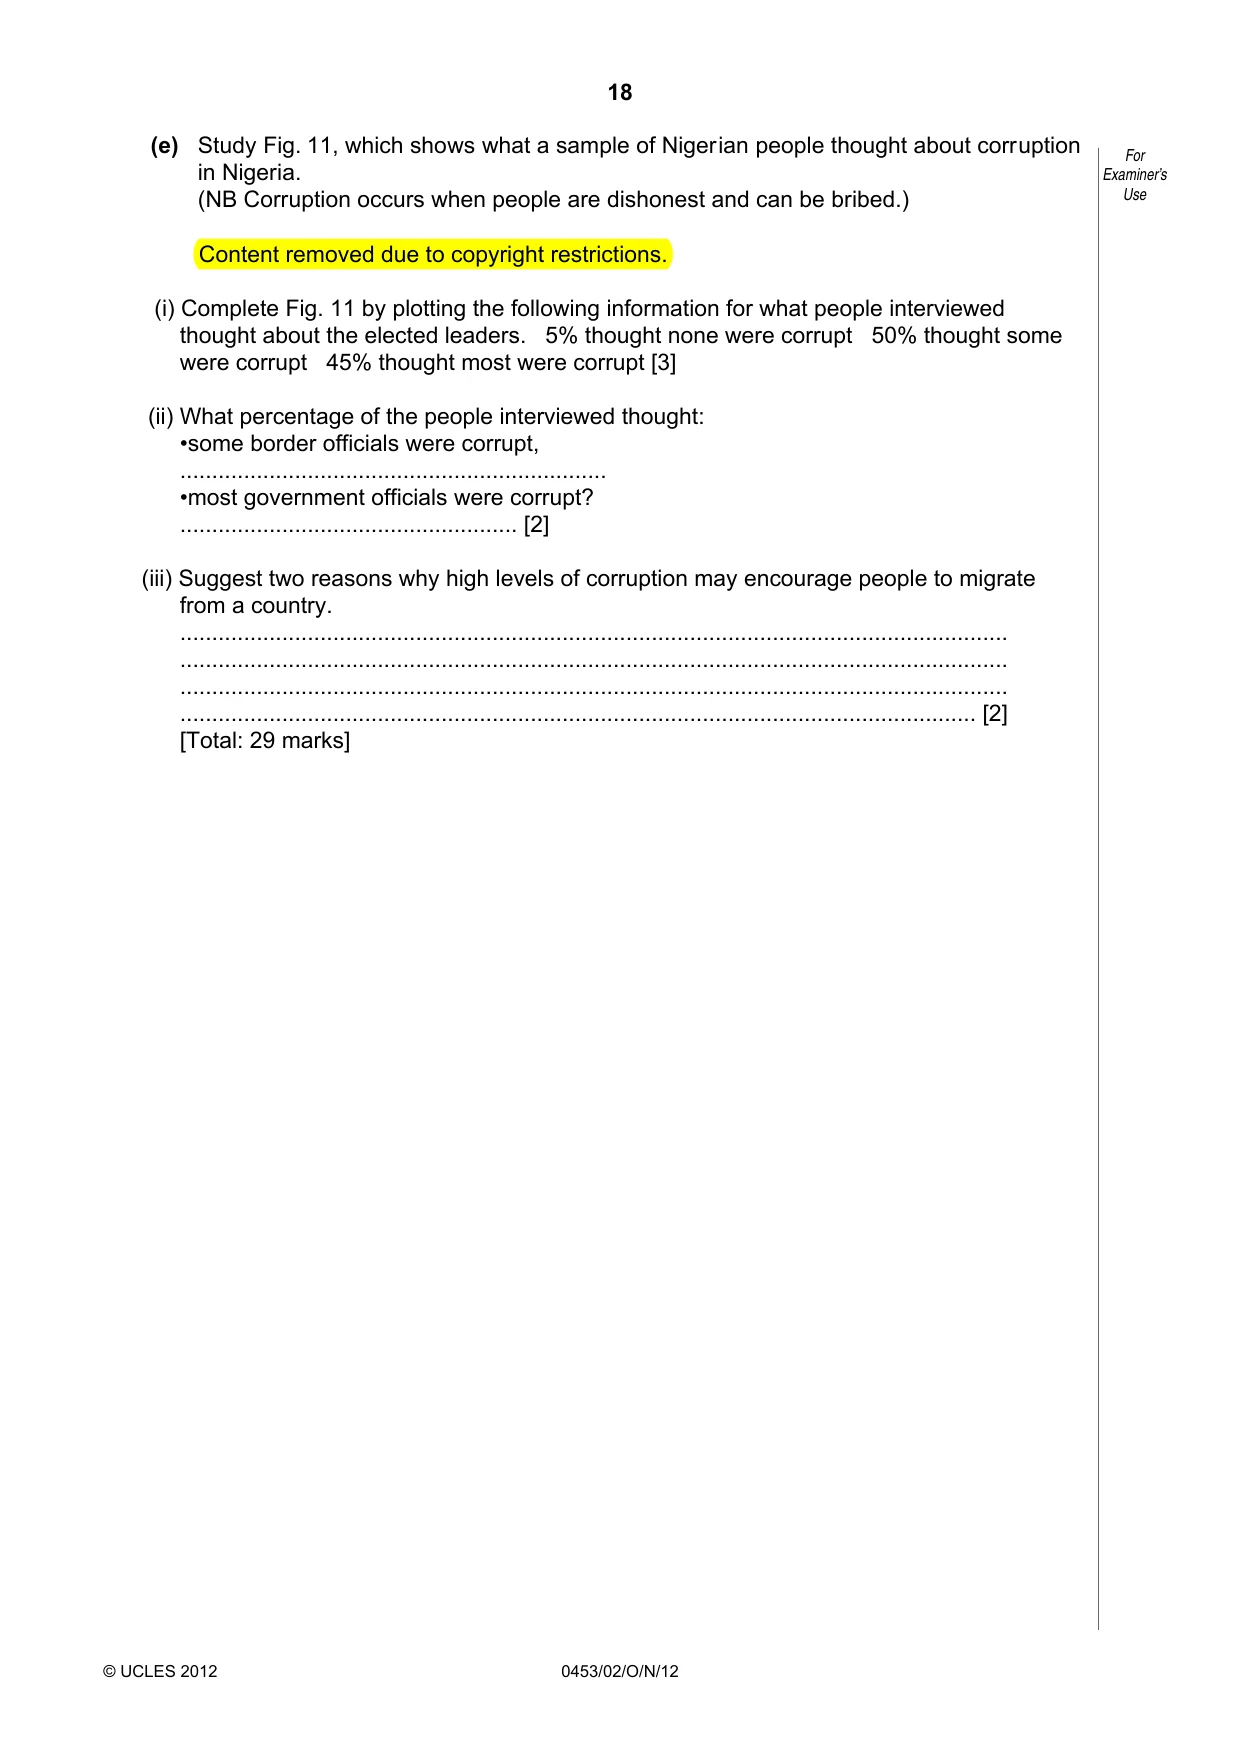
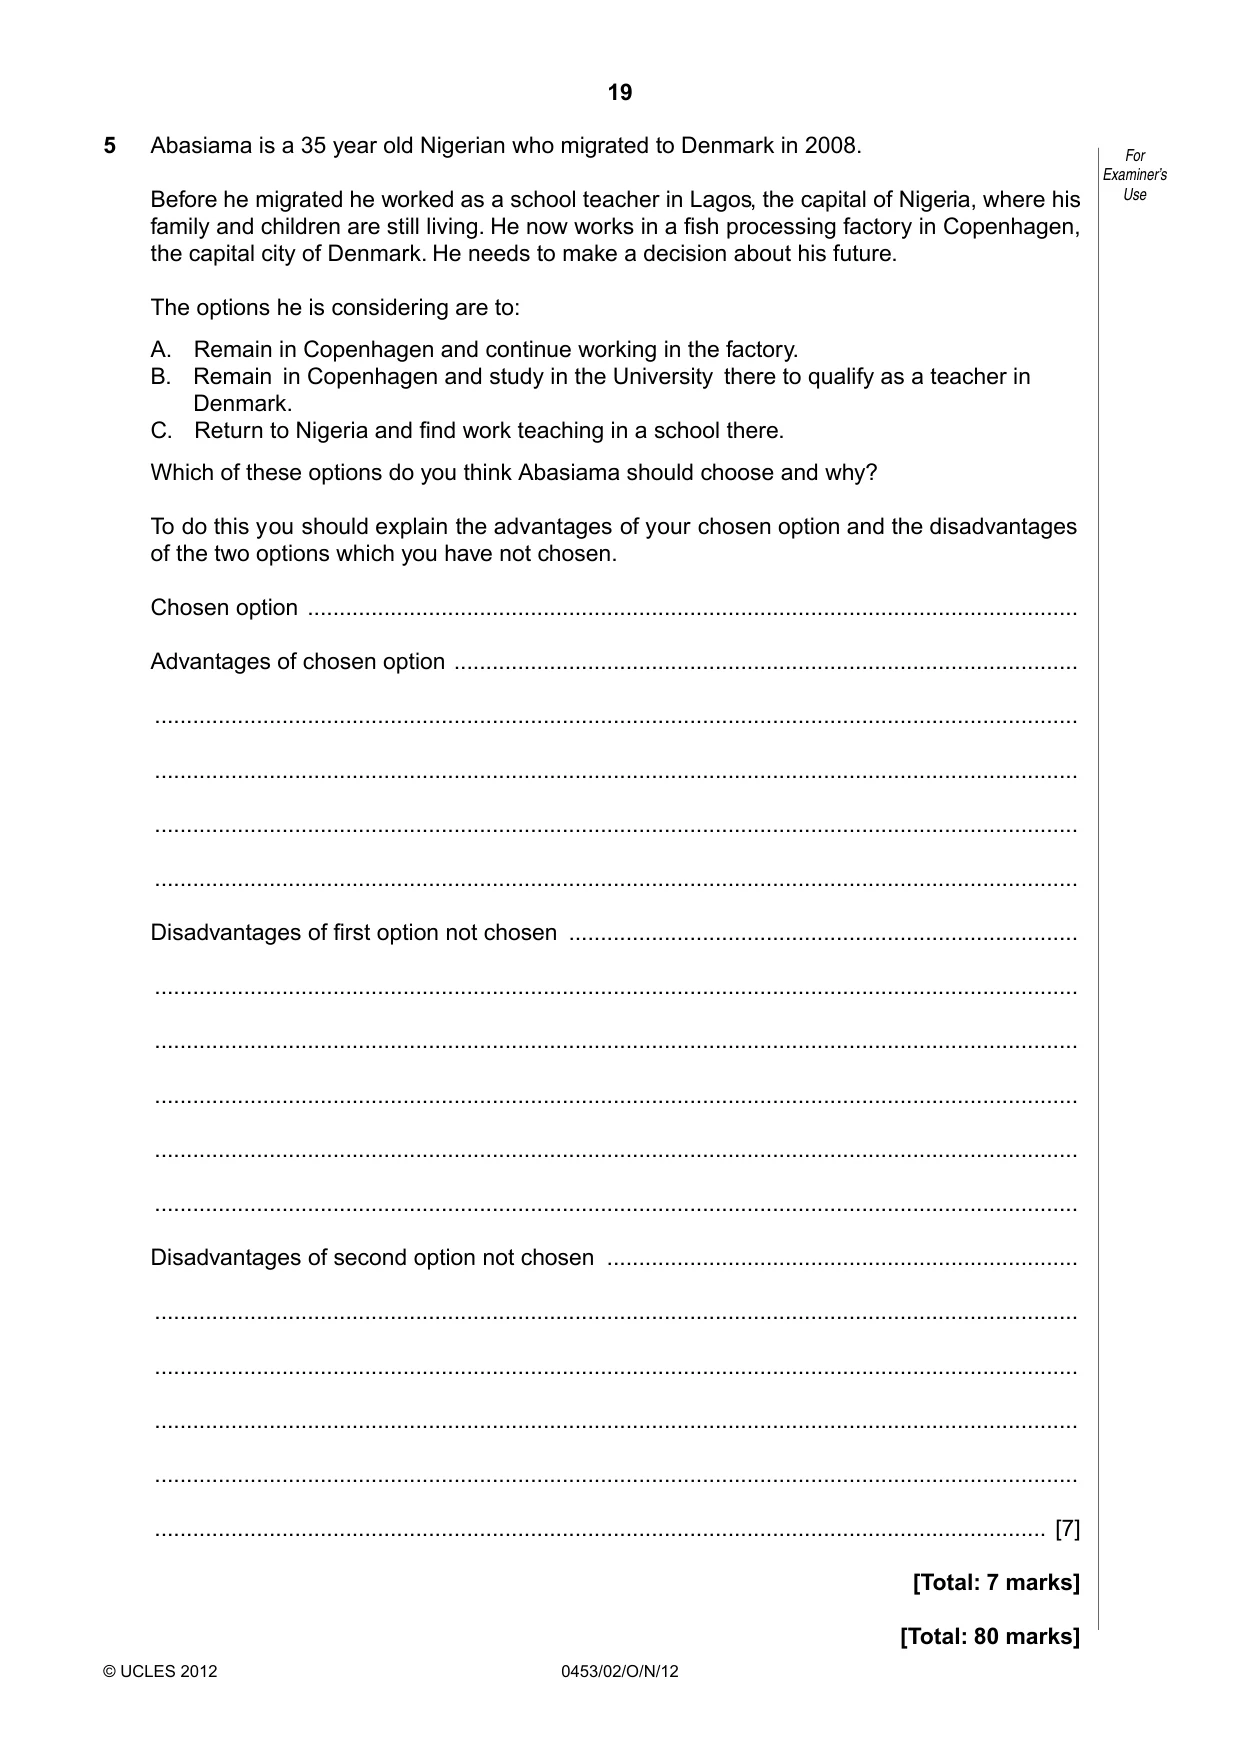
Question paper20 pages


Mark scheme9 pages
Answers below. Sit the paper first if you are practising.
Paper as text
Question paper, page 1
This document consists of 19 printed pages and 1 blank page. DC [NF/CGW) 49948/5 © UCLES 2012 [Turn over UNIVERSITY OF CAMBRIDGE INTERNATIONAL EXAMINATIONS International General Certificate of Secondary Education * 5 6 9 6 0 5 8 5 6 8 * DEVELOPMENT STUDIES 0453/02 Paper 2 October/November 2012 2 hours Candidates answer on the Question Paper. Additional Materials: Ruler READ THESE INSTRUCTIONS FIRST Write your Centre number, candidate number and name on all the work you hand in. Write in dark blue or black pen. You may use a soft pencil for any diagrams, graphs or rough working. Do not use staples, paper clips, highlighters, glue or correction fluid. DO NOT WRITE IN ANY BARCODES. Answer all the questions. You may not need all the answer lines for your answer. You should read and study the sources before answering the questions. At the end of the examination, fasten all your work securely together. The number of marks is given in brackets [ ] at the end of each question or part question. For Examiner’s Use 1 2 3 4 5 Total
Question paper, page 2
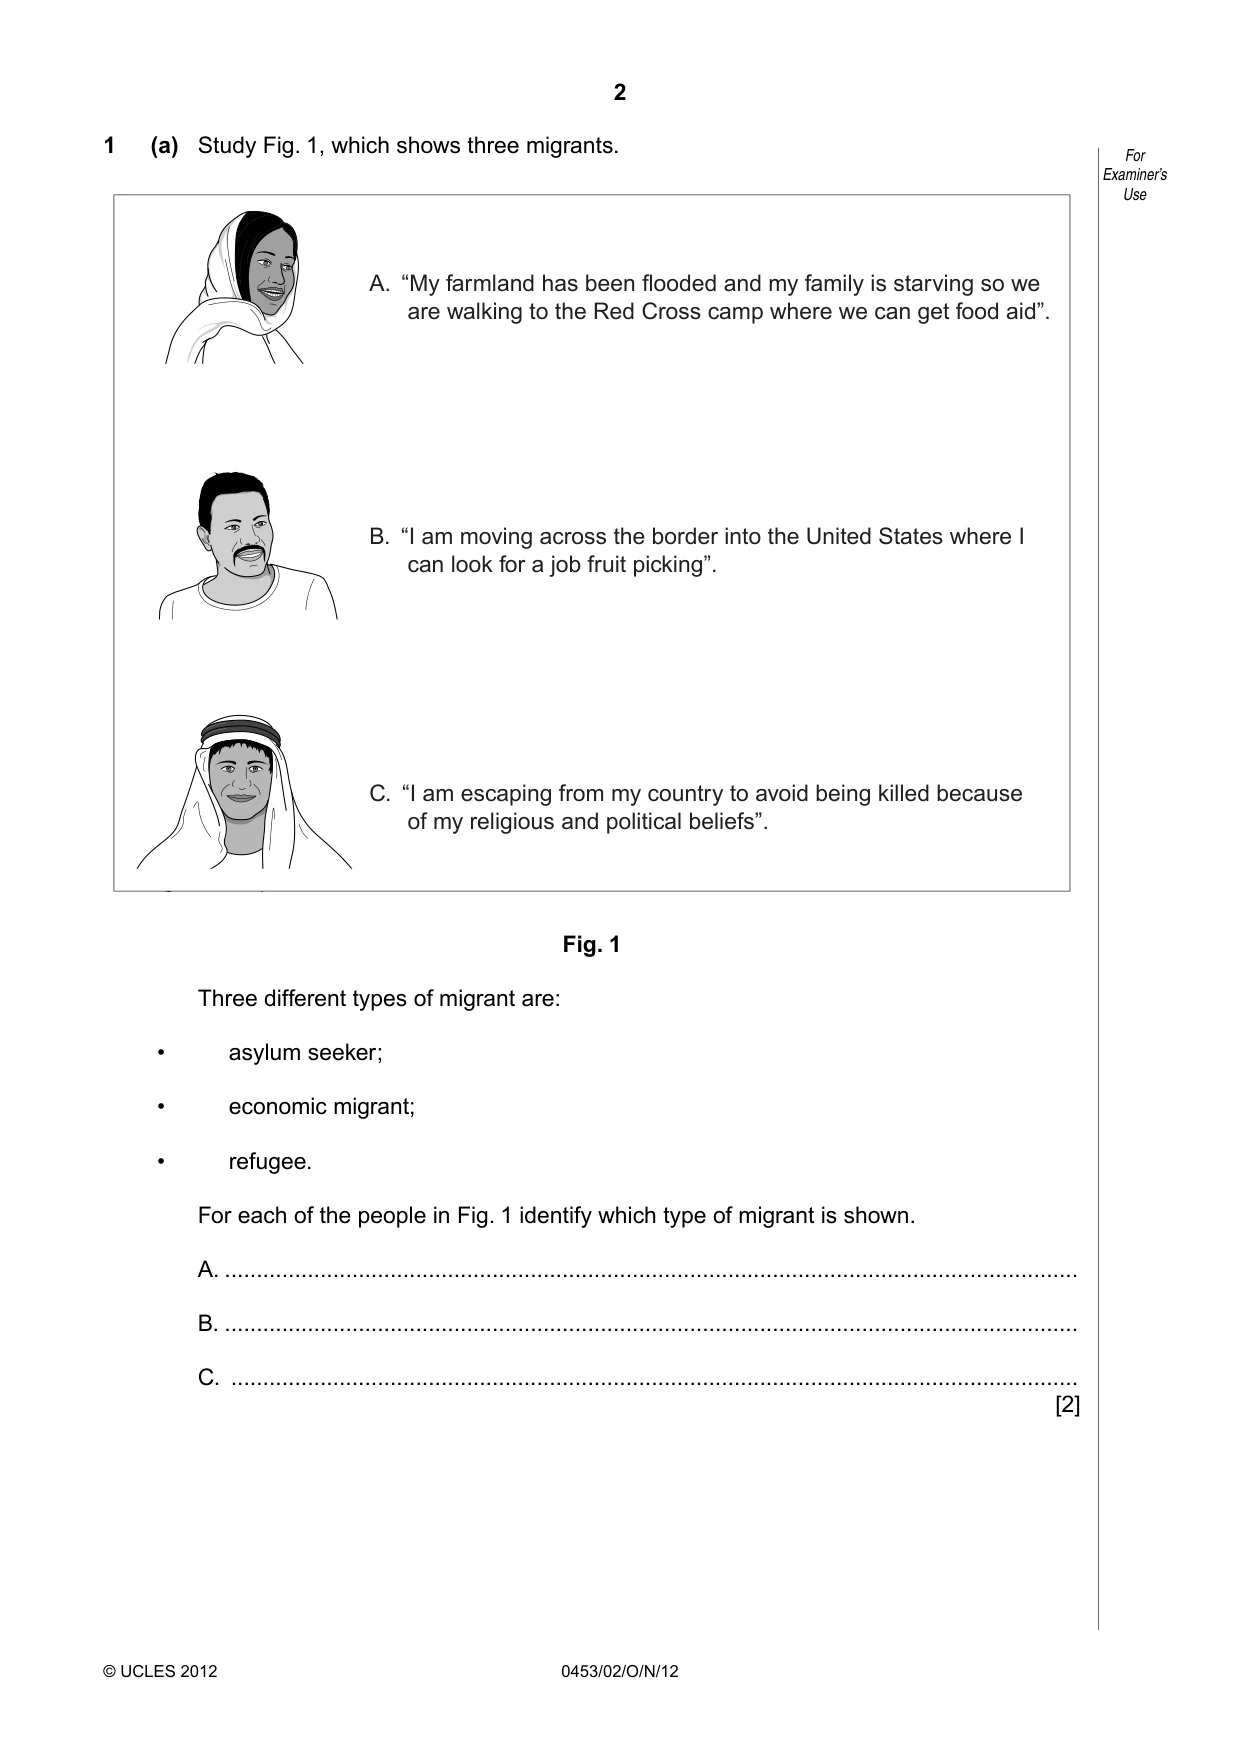
2 0453/02/O/N/12 © UCLES 2012 For Examiner’s Use 1 (a) Study Fig. 1, which shows three migrants. A. “My farmland has been flooded and my family is starving so we are walking to the Red Cross camp where we can get food aid”. B. “I am moving across the border into the United States where I can look for a job fruit picking”. C. “I am escaping from my country to avoid being killed because of my religious and political beliefs”. Fig. 1 Three different types of migrant are: • asylum seeker; • economic migrant; • refugee. For each of the people in Fig. 1 identify which type of migrant is shown. A. … B. … C. … [2]
Question paper, page 3
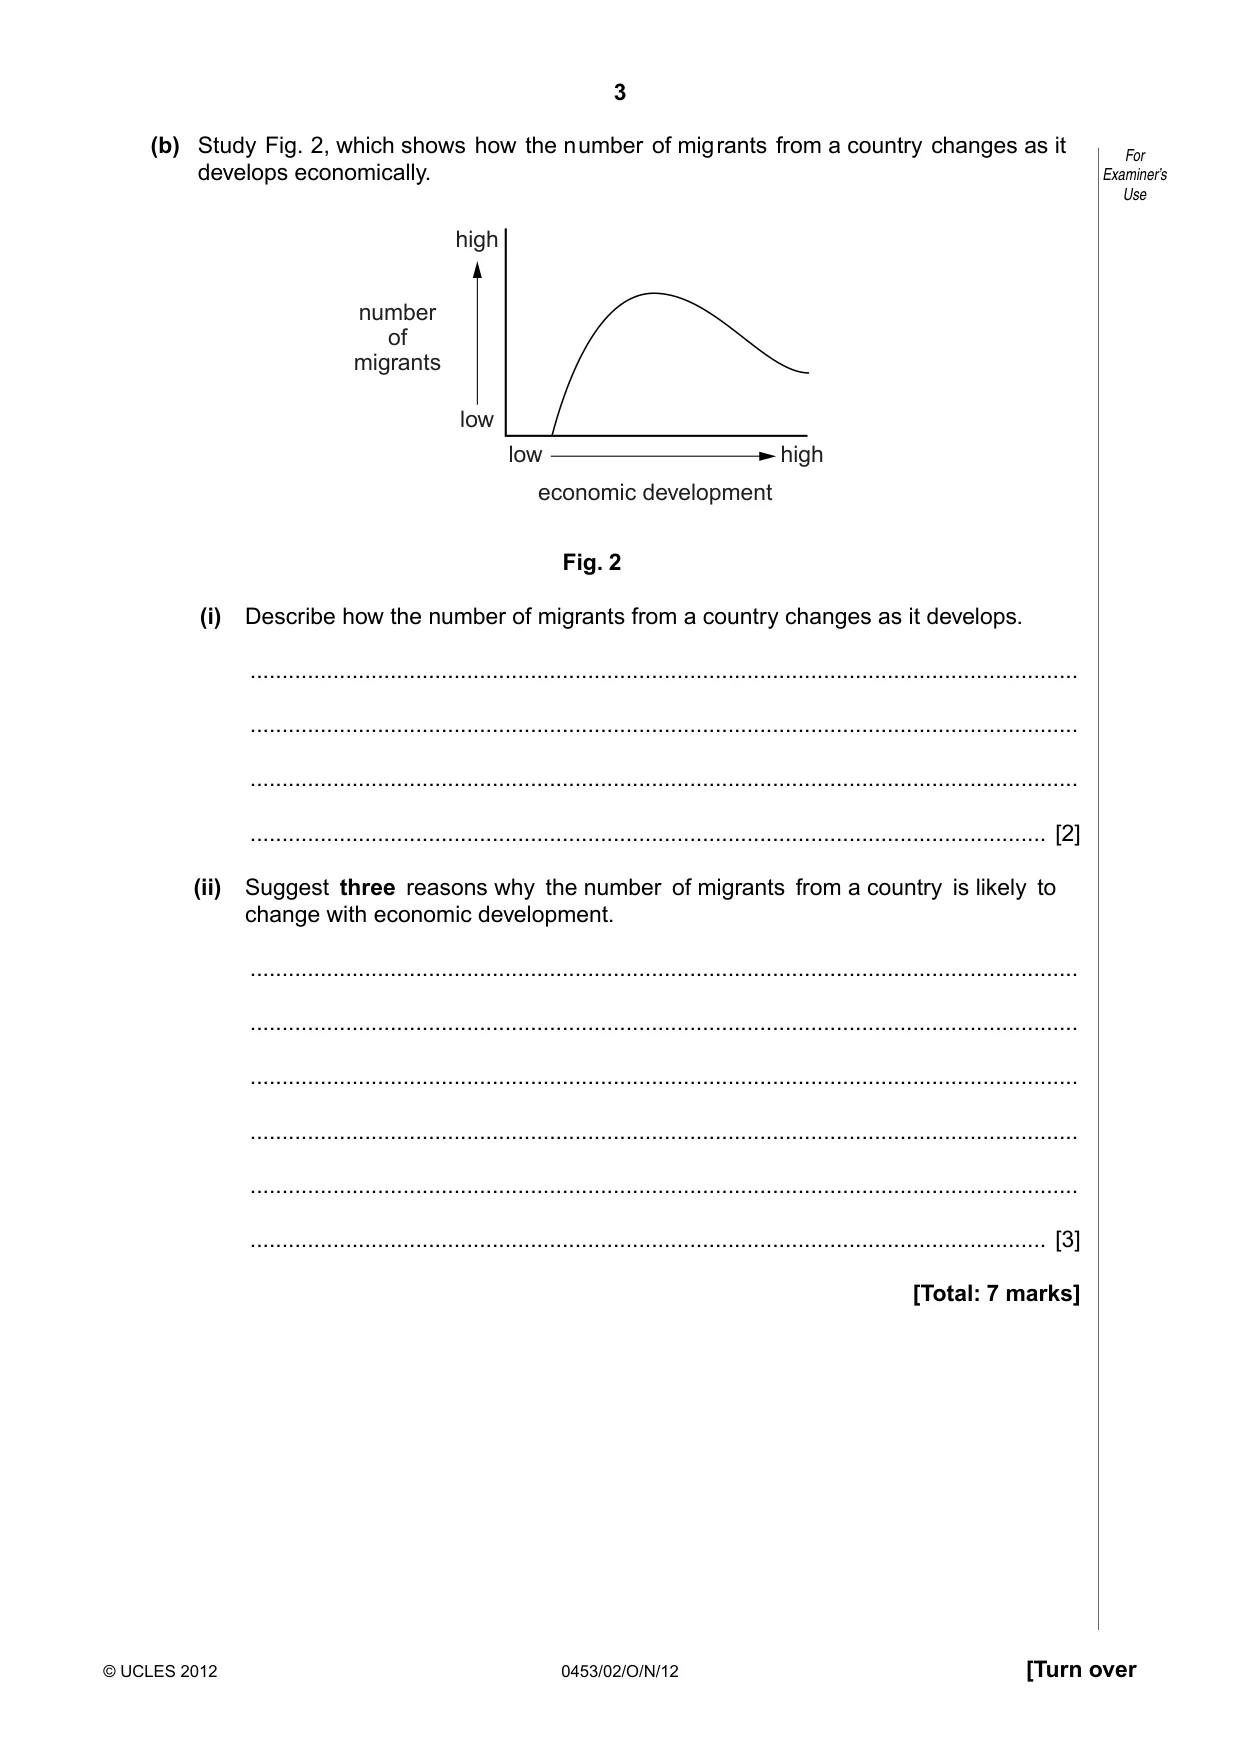
3 0453/02/O/N/12 © UCLES 2012 [Turn over For Examiner’s Use (b) Study Fig. 2, which shows how the number of migrants from a country changes as it develops economically. low high economic development number of migrants low high Fig. 2 (i) Describe how the number of migrants from a country changes as it develops. … … … … [2] (ii) Suggest three reasons why the number of migrants from a country is likely to change with economic development. … … … … … … [3] [Total: 7 marks]
Question paper, page 4
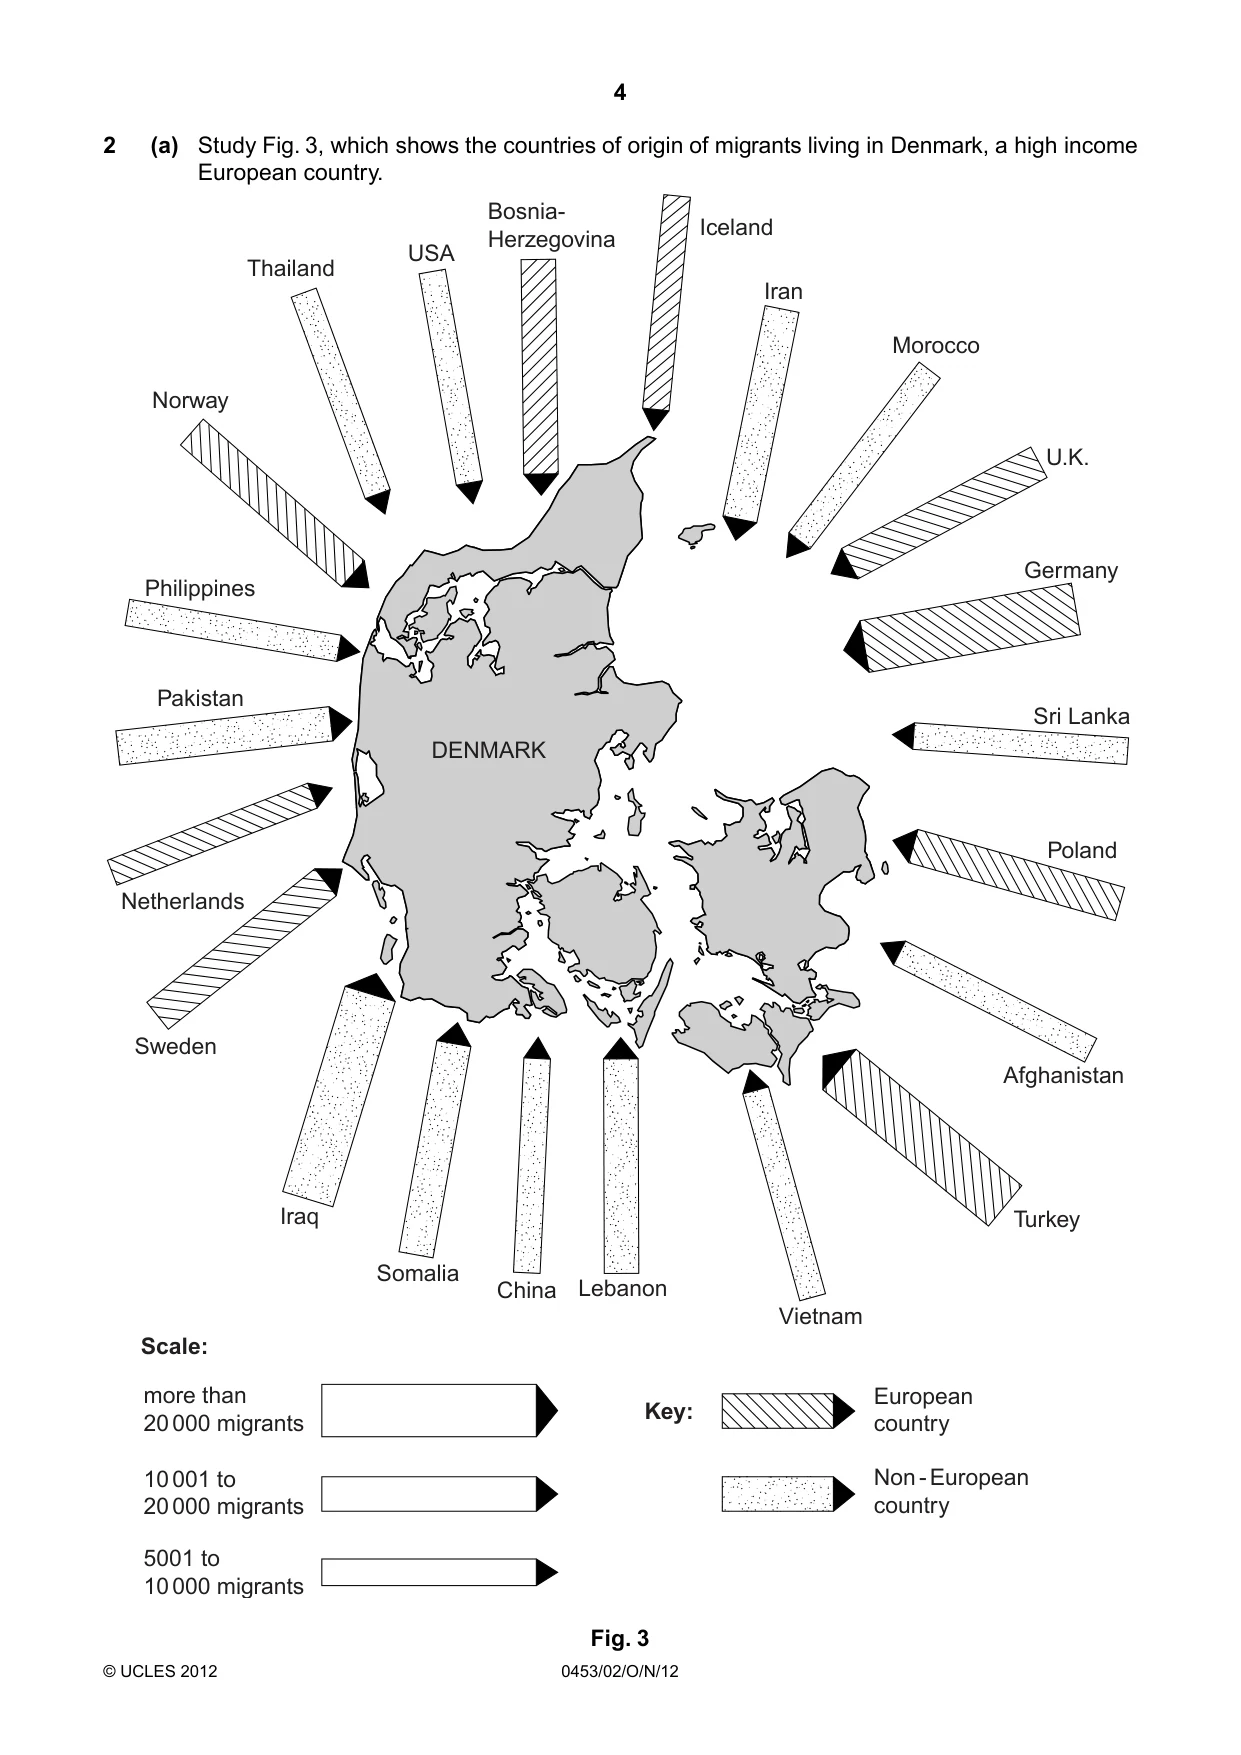
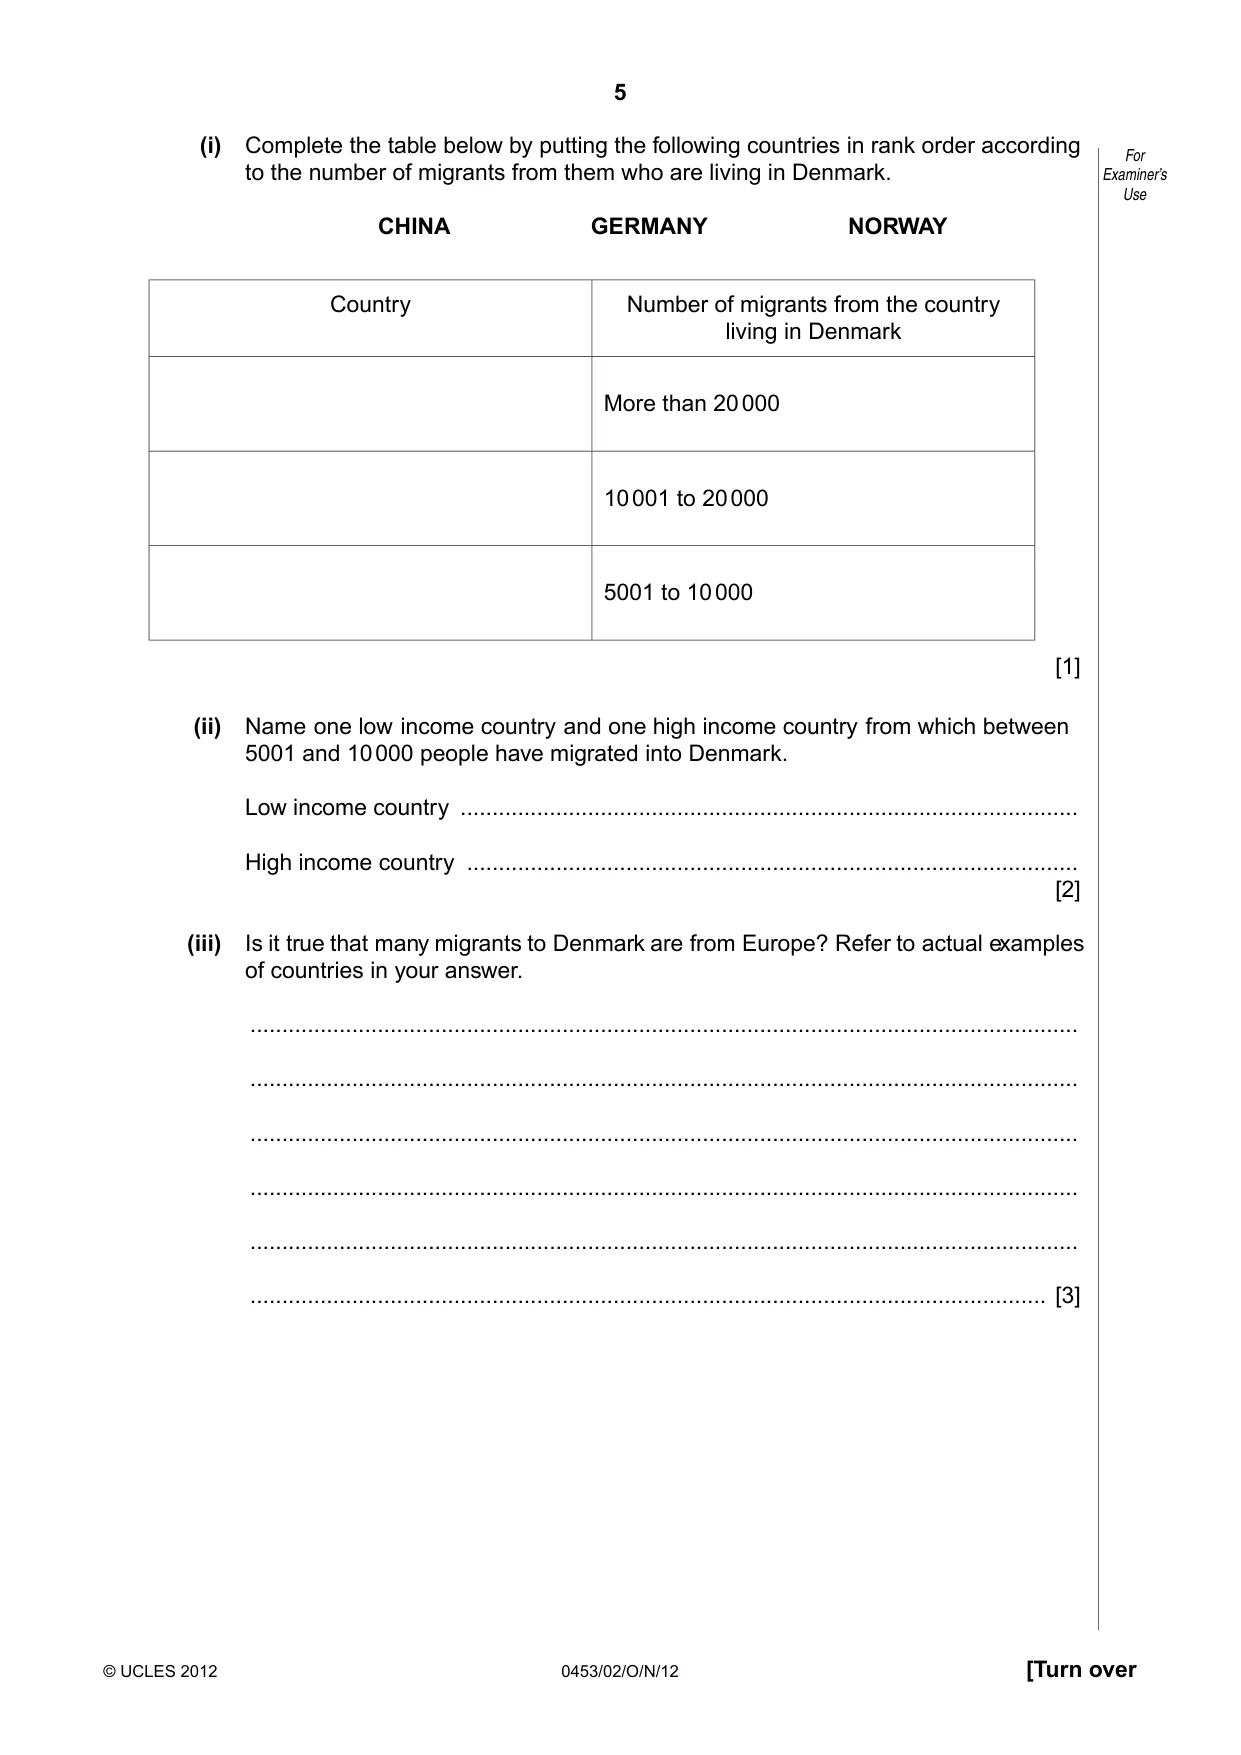
4 0453/02/O/N/12 © UCLES 2012 2 (a) Study Fig. 3, which shows the countries of origin of migrants living in Denmark, a high income European country. USA Thailand Norway Philippines Pakistan DENMARK Netherlands Sweden Iraq Scale: Key: more than 20 000 migrants European country Non - European country 10 001 to 20 000 migrants 5001 to 10 000 migrants Somalia China Lebanon Vietnam Turkey Afghanistan Poland Sri Lanka Germany Iceland Iran Morocco U.K. Bosnia- Herzegovina Fig. 3
Question paper, page 5
5 0453/02/O/N/12 © UCLES 2012 [Turn over For Examiner’s Use (i) Complete the table below by putting the following countries in rank order according to the number of migrants from them who are living in Denmark. CHINA GERMANY NORWAY Country Number of migrants from the country living in Denmark More than 20 000 10 001 to 20 000 5001 to 10 000 [1] (ii) Name one low income country and one high income country from which between 5001 and 10 000 people have migrated into Denmark. Low income country … High income country … [2] (iii) Is it true that many migrants to Denmark are from Europe? Refer to actual examples of countries in your answer. … … … … … … [3]
Question paper, page 6
6 0453/02/O/N/12 © UCLES 2012 For Examiner’s Use (b) Study Fig. 4, which shows the number of immigrants to and emigrants from Denmark between 1980 and 2006. Content removed due to copyright restrictions. (i) Compare the pattern of immigrants to and emigrants from Denmark between 1980 and 2006. Refer to statistics and years in your answer. [5]
Question paper, page 7
7 0453/02/O/N/12 © UCLES 2012 [Turn over For Examiner’s Use (ii) Suggest two benefits for countries of receiving large numbers of immigrants. 1 … … 2 … … [2] (iii) Describe three impacts for a low income country of large numbers of people migrating away from it. 1 … … 2 … … 3 … … [3] [Total: 16 marks]
Question paper, page 8
8 0453/02/O/N/12 © UCLES 2012 For Examiner’s Use 3 (a) Study Fig. 5, which shows information about a research investigation carried out in Denmark. Content removed due to copyright restrictions. (i) The main aim of the investigation was to find out why some Nigerian people had migrated to Denmark. Use your own words to state the other two aims of the investigation. 1 … … 2 … … [2] (ii) Describe three possible problems of using data from the Internet in research investigations. 1 … … 2 … … 3 … … [3] (iii) What is the difference between an open-ended question and a closed question? … … [2]
Question paper, page 9
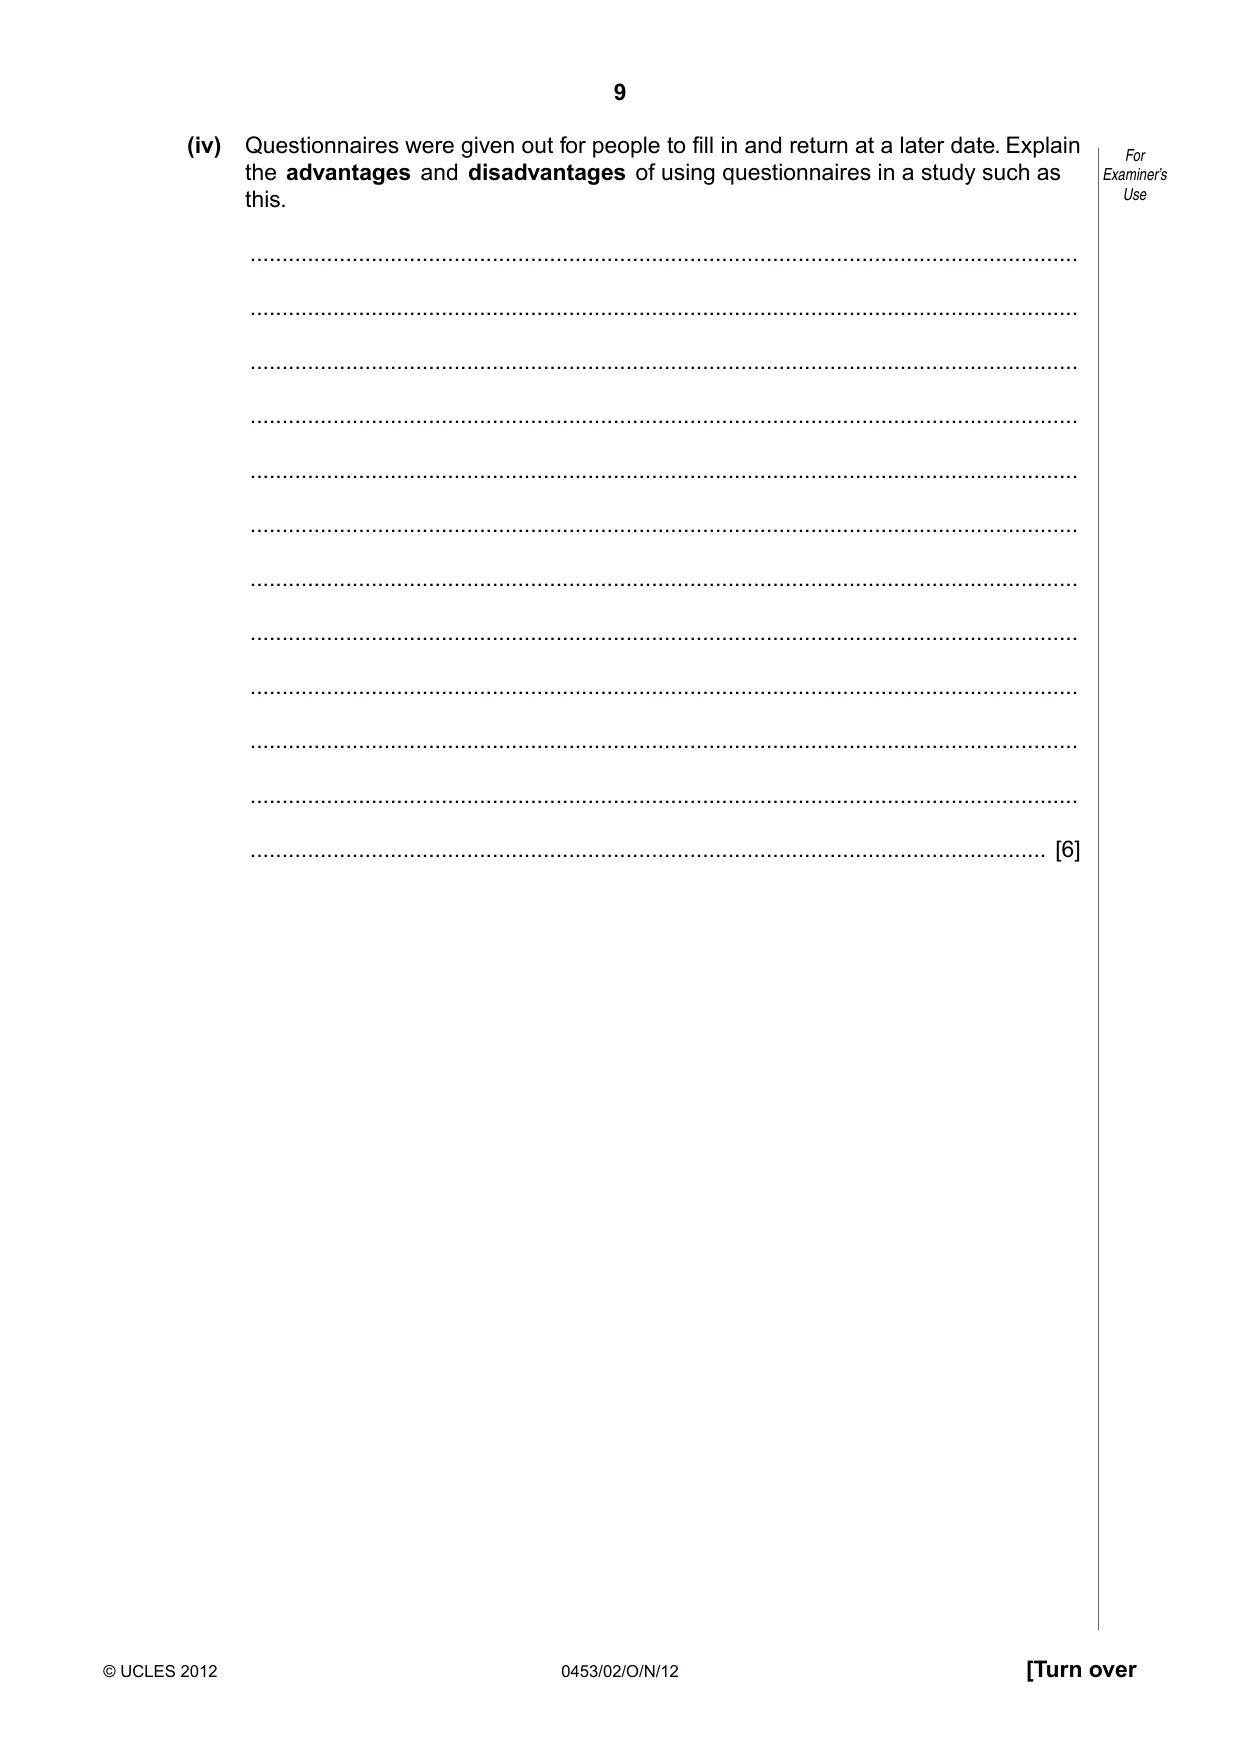
9 0453/02/O/N/12 © UCLES 2012 [Turn over For Examiner’s Use (iv) Questionnaires were given out for people to fill in and return at a later date. Explain the advantages and disadvantages of using questionnaires in a study such as this. … … … … … … … … … … … … [6]
Question paper, page 10
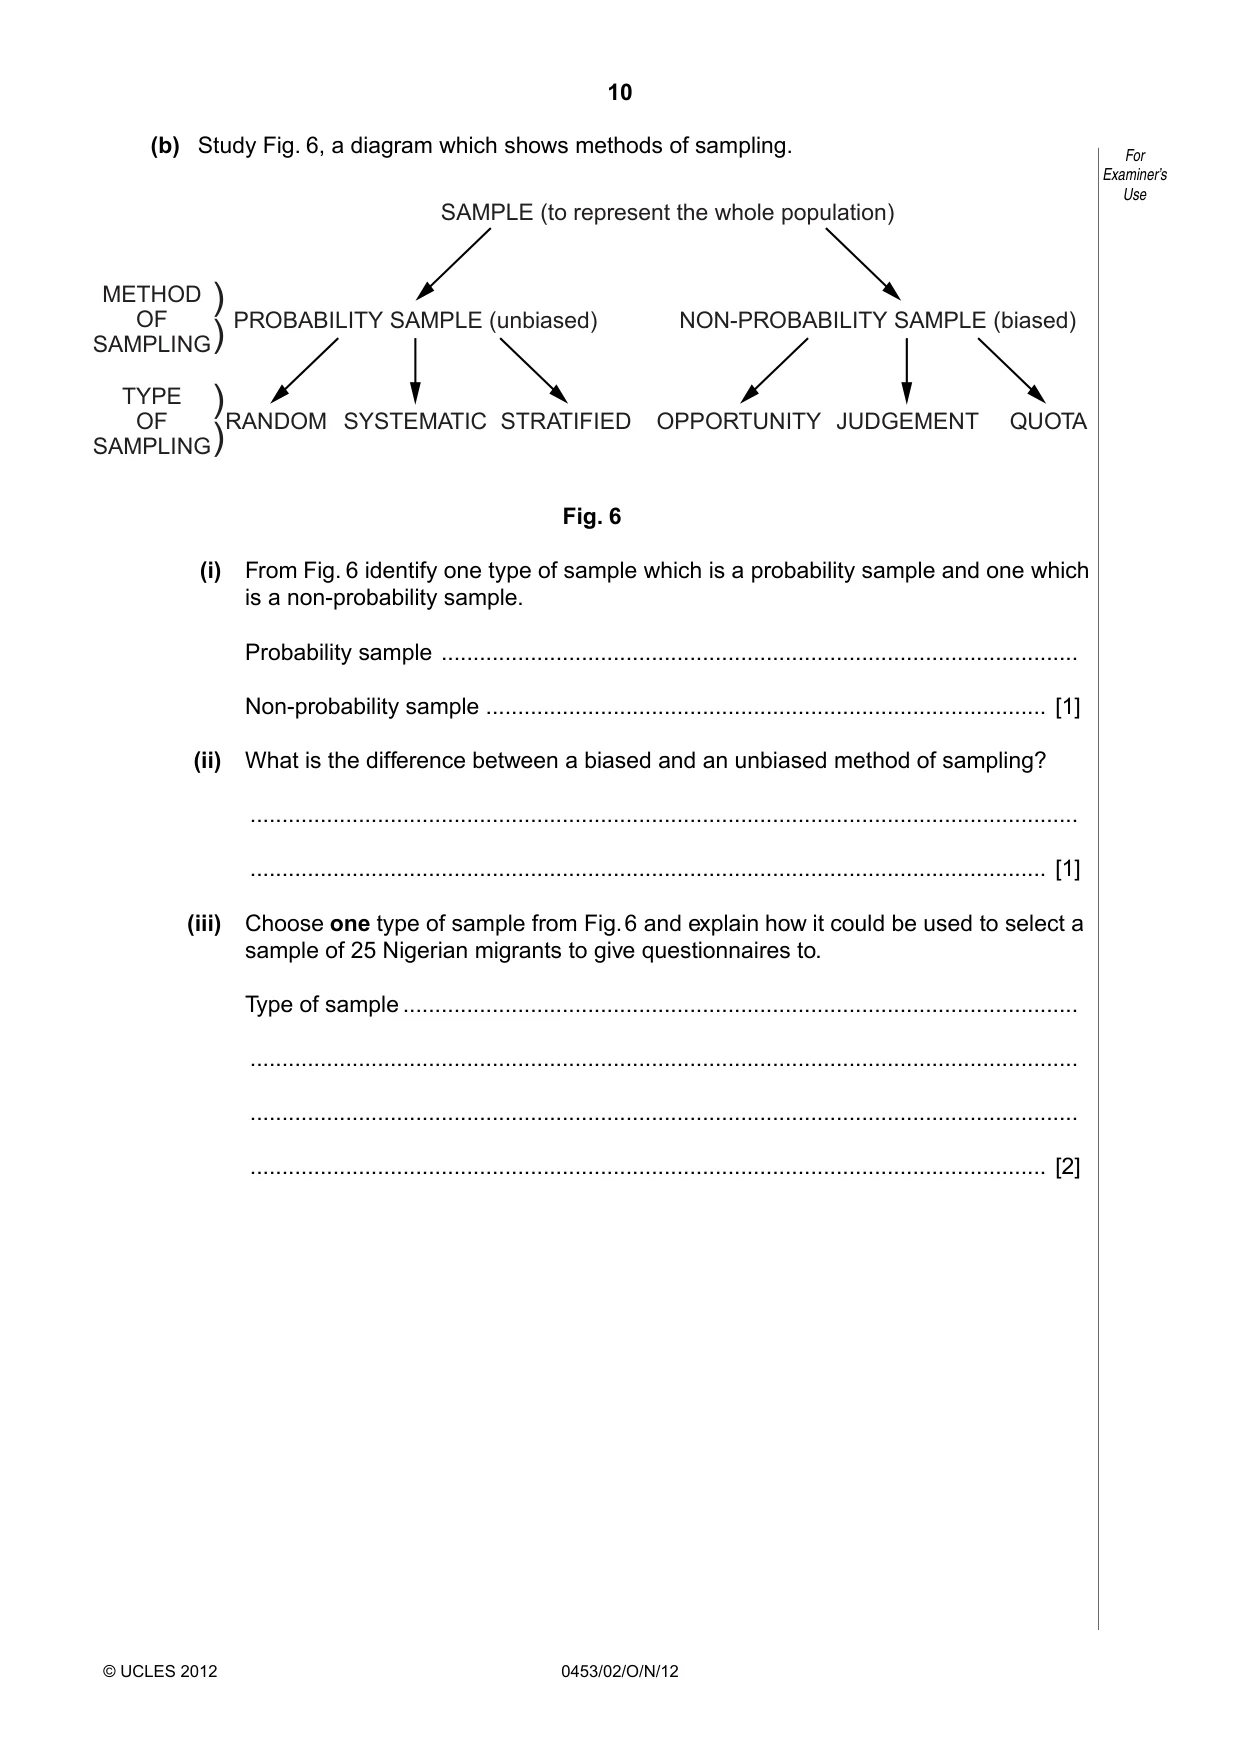
10 0453/02/O/N/12 © UCLES 2012 For Examiner’s Use (b) Study Fig. 6, a diagram which shows methods of sampling. SAMPLE (to represent the whole population) PROBABILITY SAMPLE (unbiased) METHOD OF SAMPLING ) ) ) ) TYPE OF SAMPLING RANDOM SYSTEMATIC STRATIFIED OPPORTUNITY JUDGEMENT QUOTA NON-PROBABILITY SAMPLE (biased) Fig. 6 (i) From Fig. 6 identify one type of sample which is a probability sample and one which is a non-probability sample. Probability sample … Non-probability sample … [1] (ii) What is the difference between a biased and an unbiased method of sampling? … … [1] (iii) Choose one type of sample from Fig. 6 and explain how it could be used to select a sample of 25 Nigerian migrants to give questionnaires to. Type of sample … … … … [2]
Question paper, page 11
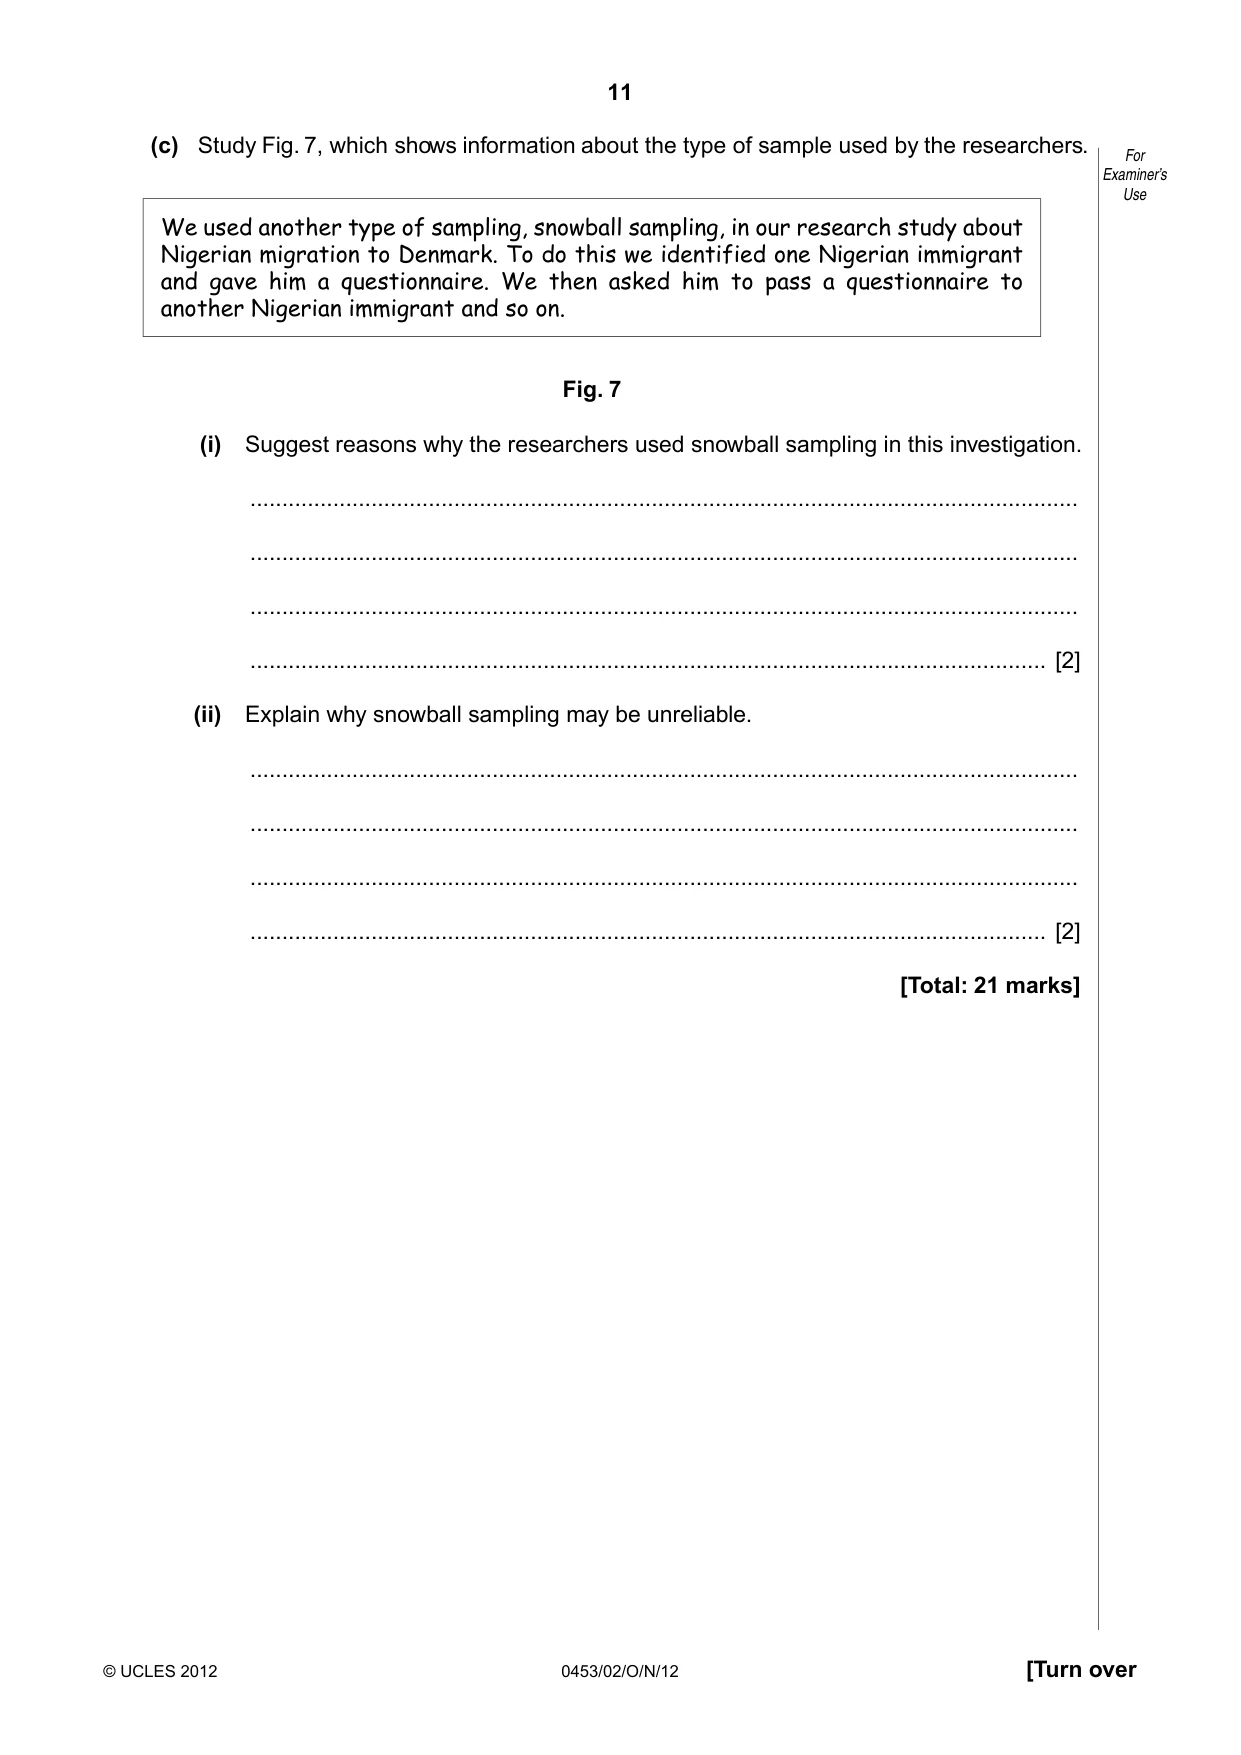
11 0453/02/O/N/12 © UCLES 2012 [Turn over For Examiner’s Use (c) Study Fig. 7, which shows information about the type of sample used by the researchers. We used another type of sampling, snowball sampling, in our research study about Nigerian migration to Denmark. To do this we identified one Nigerian immigrant and gave him a questionnaire. We then asked him to pass a questionnaire to another Nigerian immigrant and so on. Fig. 7 (i) Suggest reasons why the researchers used snowball sampling in this investigation. … … … … [2] (ii) Explain why snowball sampling may be unreliable. … … … … [2] [Total: 21 marks]
Question paper, page 12
12 0453/02/O/N/12 © UCLES 2012 For Examiner’s Use 4 (a) The main aim of the investigation was to find out why some Nigeruan people had migrated to Denmark. The researchers found out that the three most important push and pull factors were: PUSHES – Poverty – Lack of safety – Corruption PULLS – Employment – Social benefits – Education (i) What is meant by the terms ‘push factor’ and ‘pull factor’? Push Factor … … Pull Factor … … [2]
Question paper, page 13
13 0453/02/O/N/12 © UCLES 2012 [Turn over For Examiner’s Use (ii) Explain fully why poverty and employment are factors which encourage migration from low income countries to high income countries. … … … … … … … … [4]
Question paper, page 14
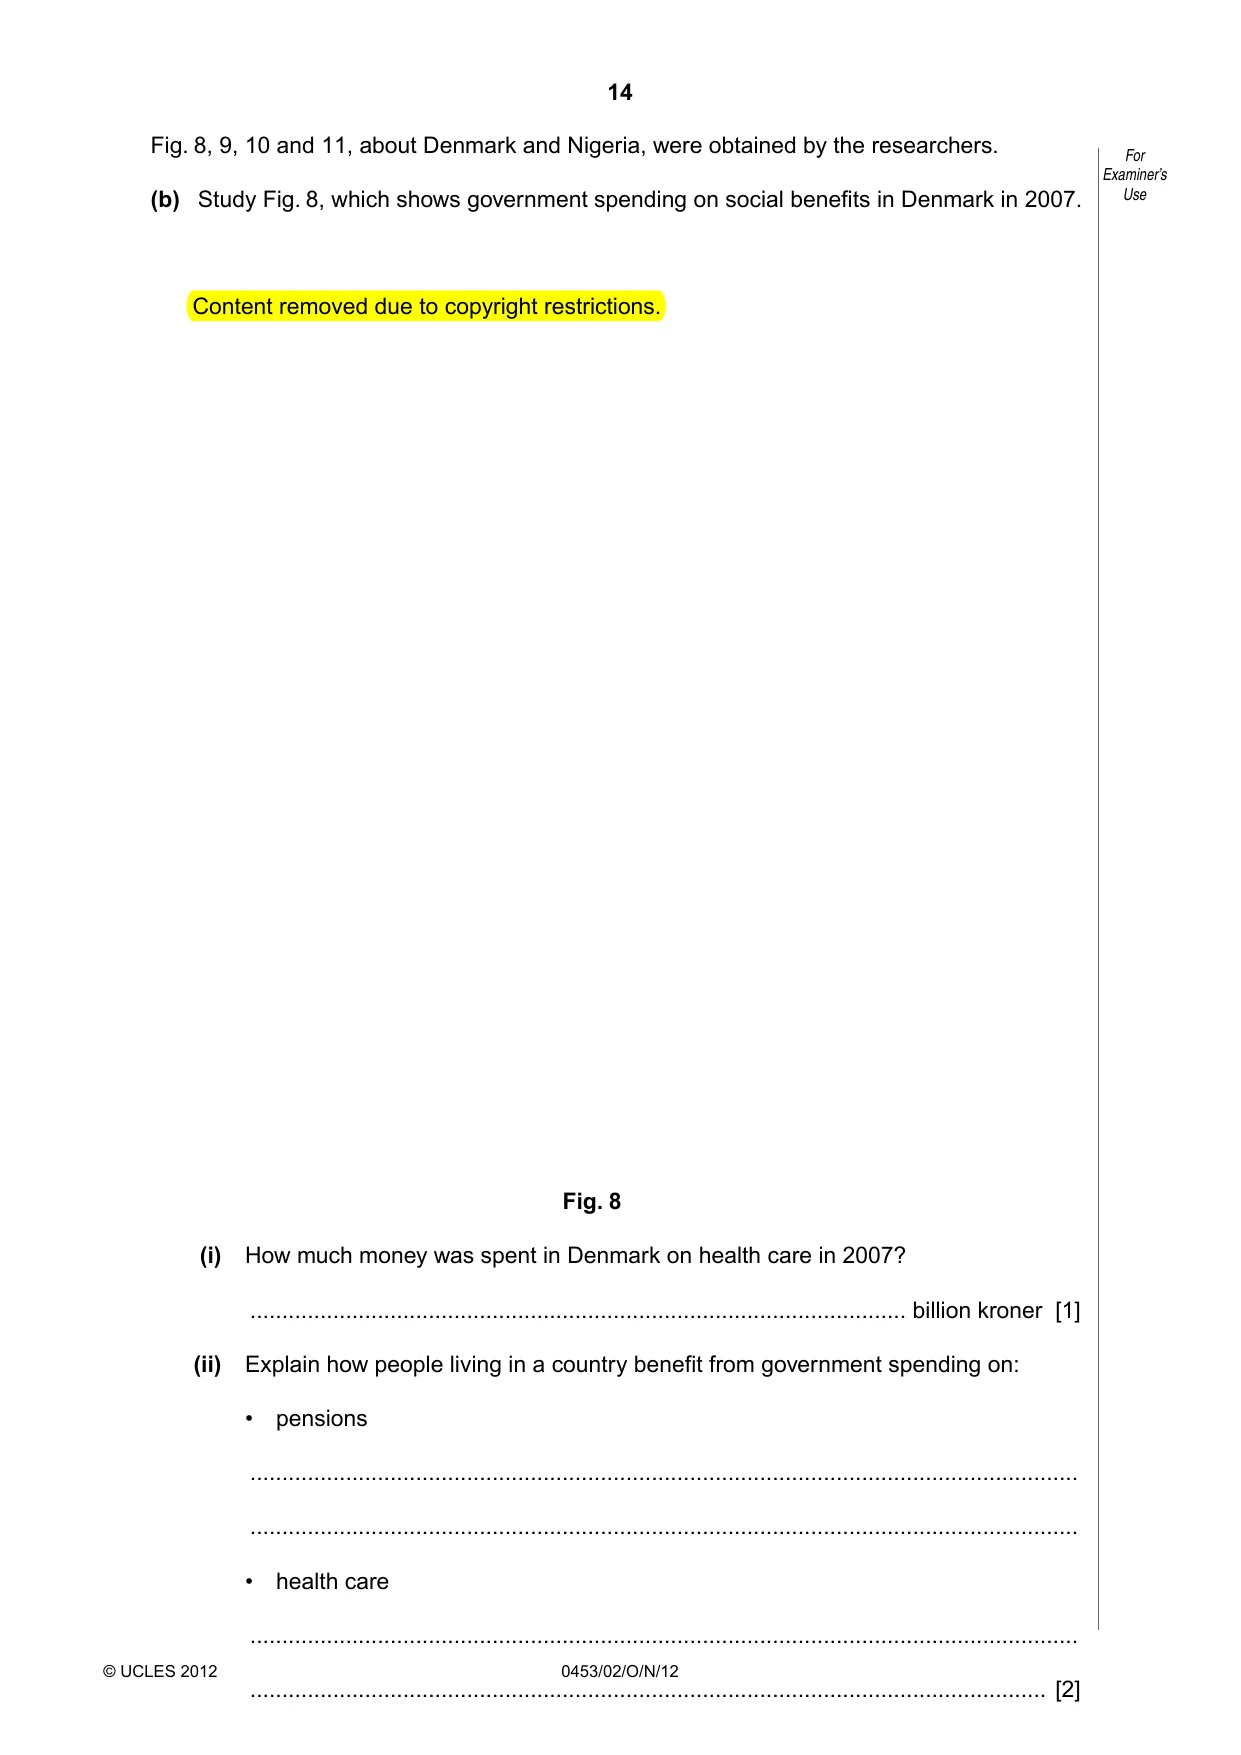
14 0453/02/O/N/12 © UCLES 2012 For Examiner’s Use Fig. 8, 9, 10 and 11, about Denmark and Nigeria, were obtained by the researchers. (b) Study Fig. 8, which shows government spending on social benefits in Denmark in 2007. Content removed due to copyright restrictions. Fig. 8 (i) How much money was spent in Denmark on health care in 2007? … billion kroner [1] (ii) Explain how people living in a country benefit from government spending on: • pensions … … • health care … … [2]
Question paper, page 15
15 0453/02/O/N/12 © UCLES 2012 [Turn over For Examiner’s Use (c) Study Fig. 9, which shows information about safety on the roads in Nigeria and Denmark in 2004. Content removed due to copyright restrictions. To what extent do you think the statistics in Fig. 9 help to support the findings of the researchers about why Nigerian people had migrated to Denmark? Give reasons for your answer. [5]
Question paper, page 16
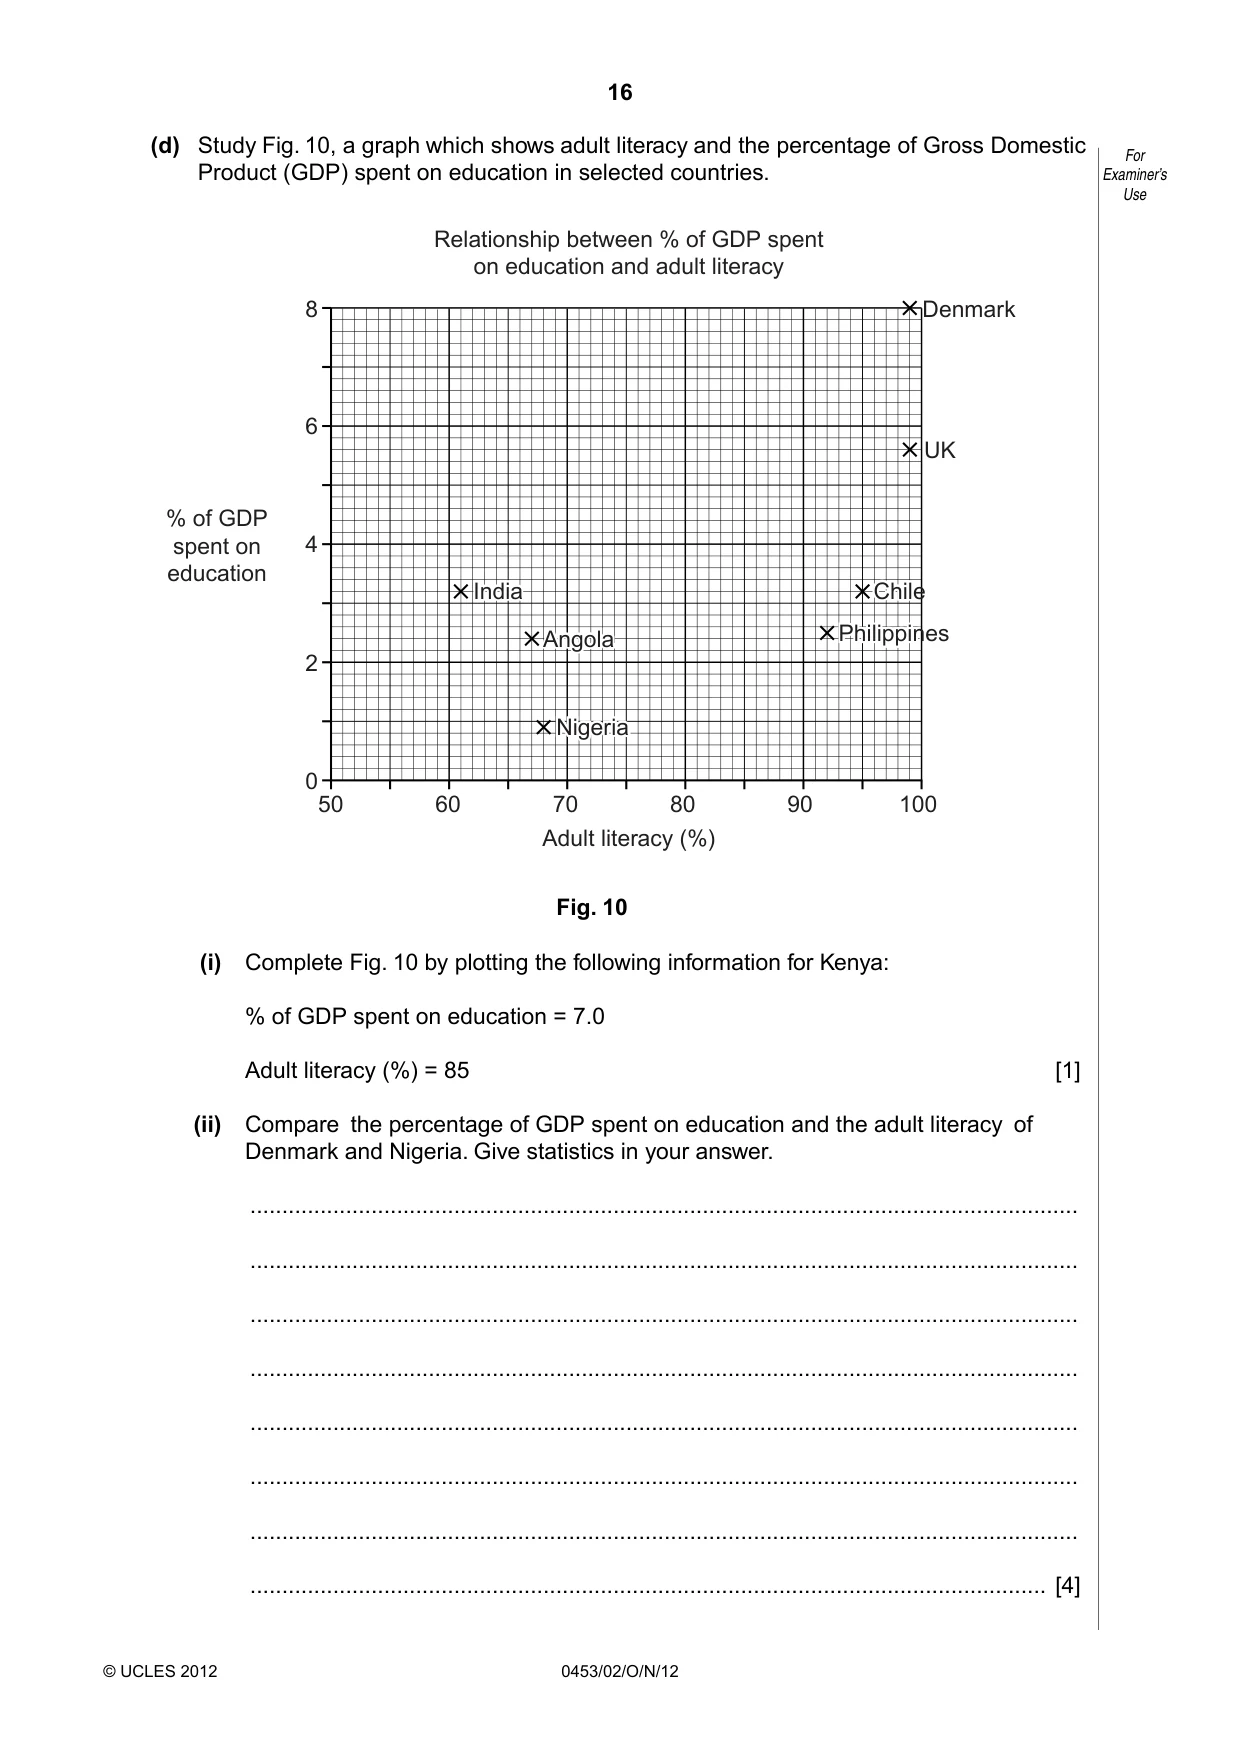
16 0453/02/O/N/12 © UCLES 2012 For Examiner’s Use (d) Study Fig. 10, a graph which shows adult literacy and the percentage of Gross Domestic Product (GDP) spent on education in selected countries. Angola Nigeria Chile India Philippines 0 2 4 % of GDP spent on education 6 50 60 70 80 90 100 8 Relationship between % of GDP spent on education and adult literacy Adult literacy (%) Angola Nigeria Denmark UK Chile India Philippines Fig. 10 (i) Complete Fig. 10 by plotting the following information for Kenya: % of GDP spent on education = 7.0 Adult literacy (%) = 85 [1] (ii) Compare the percentage of GDP spent on education and the adult literacy of Denmark and Nigeria. Give statistics in your answer. … … … … … … … … [4]
Question paper, page 17
17 0453/02/O/N/12 © UCLES 2012 [Turn over For Examiner’s Use (iii) What type of relationship is shown between adult literacy and the percentage of GDP spent on education? Refer to countries and statistics in your answer. … … … … … … [3]
Question paper, page 18
18 0453/02/O/N/12 © UCLES 2012 For Examiner’s Use (e) Study Fig. 11, which shows what a sample of Nigerian people thought about corruption in Nigeria. (NB Corruption occurs when people are dishonest and can be bribed.) Content removed due to copyright restrictions. (i) Complete Fig. 11 by plotting the following information for what people interviewed thought about the elected leaders. 5% thought none were corrupt 50% thought some were corrupt 45% thought most were corrupt [3] (ii) What percentage of the people interviewed thought: •some border officials were corrupt, … •most government officials were corrupt? … [2] (iii) Suggest two reasons why high levels of corruption may encourage people to migrate from a country. … … … … [2] [Total: 29 marks]
Question paper, page 19
19 0453/02/O/N/12 © UCLES 2012 For Examiner’s Use 5 Abasiama is a 35 year old Nigerian who migrated to Denmark in 2008. Before he migrated he worked as a school teacher in Lagos, the capital of Nigeria, where his family and children are still living. He now works in a fish processing factory in Copenhagen, the capital city of Denmark. He needs to make a decision about his future. The options he is considering are to: A. Remain in Copenhagen and continue working in the factory. B. Remain in Copenhagen and study in the University there to qualify as a teacher in Denmark. C. Return to Nigeria and find work teaching in a school there. Which of these options do you think Abasiama should choose and why? To do this you should explain the advantages of your chosen option and the disadvantages of the two options which you have not chosen. Chosen option … Advantages of chosen option … … … … … Disadvantages of first option not chosen … … … … … … Disadvantages of second option not chosen … … … … … … [7] [Total: 7 marks] [Total: 80 marks]
Question paper, page 20
20 0453/02/O/N/12 © UCLES 2012 BLANK PAGE Copyright Acknowledgements: Question 2b Fig. 4 © AMENDED; http://diggy.ruc.dk/bitstream/1800/3189/1/Reasons%20for%20Nigerian%20people%20migration%20to%20Europe.pdf. Question 3a Fig. 5 © AMENDED; http://diggy.ruc.dk/bitstream/1800/3189/1/Reasons%20for%20Nigerian%20people%20migration%20to%20Europe.pdf. Question 4 Fig. 8 © AMENDED; http://diggy.ruc.dk/bitstream/1800/3189/1/Reasons%20for%20Nigerian%20people%20migration%20to%20Europe.pdf. Question 4 Fig. 9 © AMENDED; http://diggy.ruc.dk/bitstream/1800/3189/1/Reasons%20for%20Nigerian%20people%20migration%20to%20Europe.pdf. Question 4e Fig. 11 © AMENDED; http://diggy.ruc.dk/bitstream/1800/3189/1/Reasons%20for%20Nigerian%20people%20migration%20to%20Europe.pdf. Permission to reproduce items where third-party owned material protected by copyright is included has been sought and cleared where possible. Every reasonable effort has been made by the publisher (UCLES) to trace copyright holders, but if any items requiring clearance have unwittingly been included, the publisher will be pleased to make amends at the earliest possible opportunity. University of Cambridge International Examinations is part of the Cambridge Assessment Group. Cambridge Assessment is the brand name of University of Cambridge Local Examinations Syndicate (UCLES), which is itself a department of the University of Cambridge.
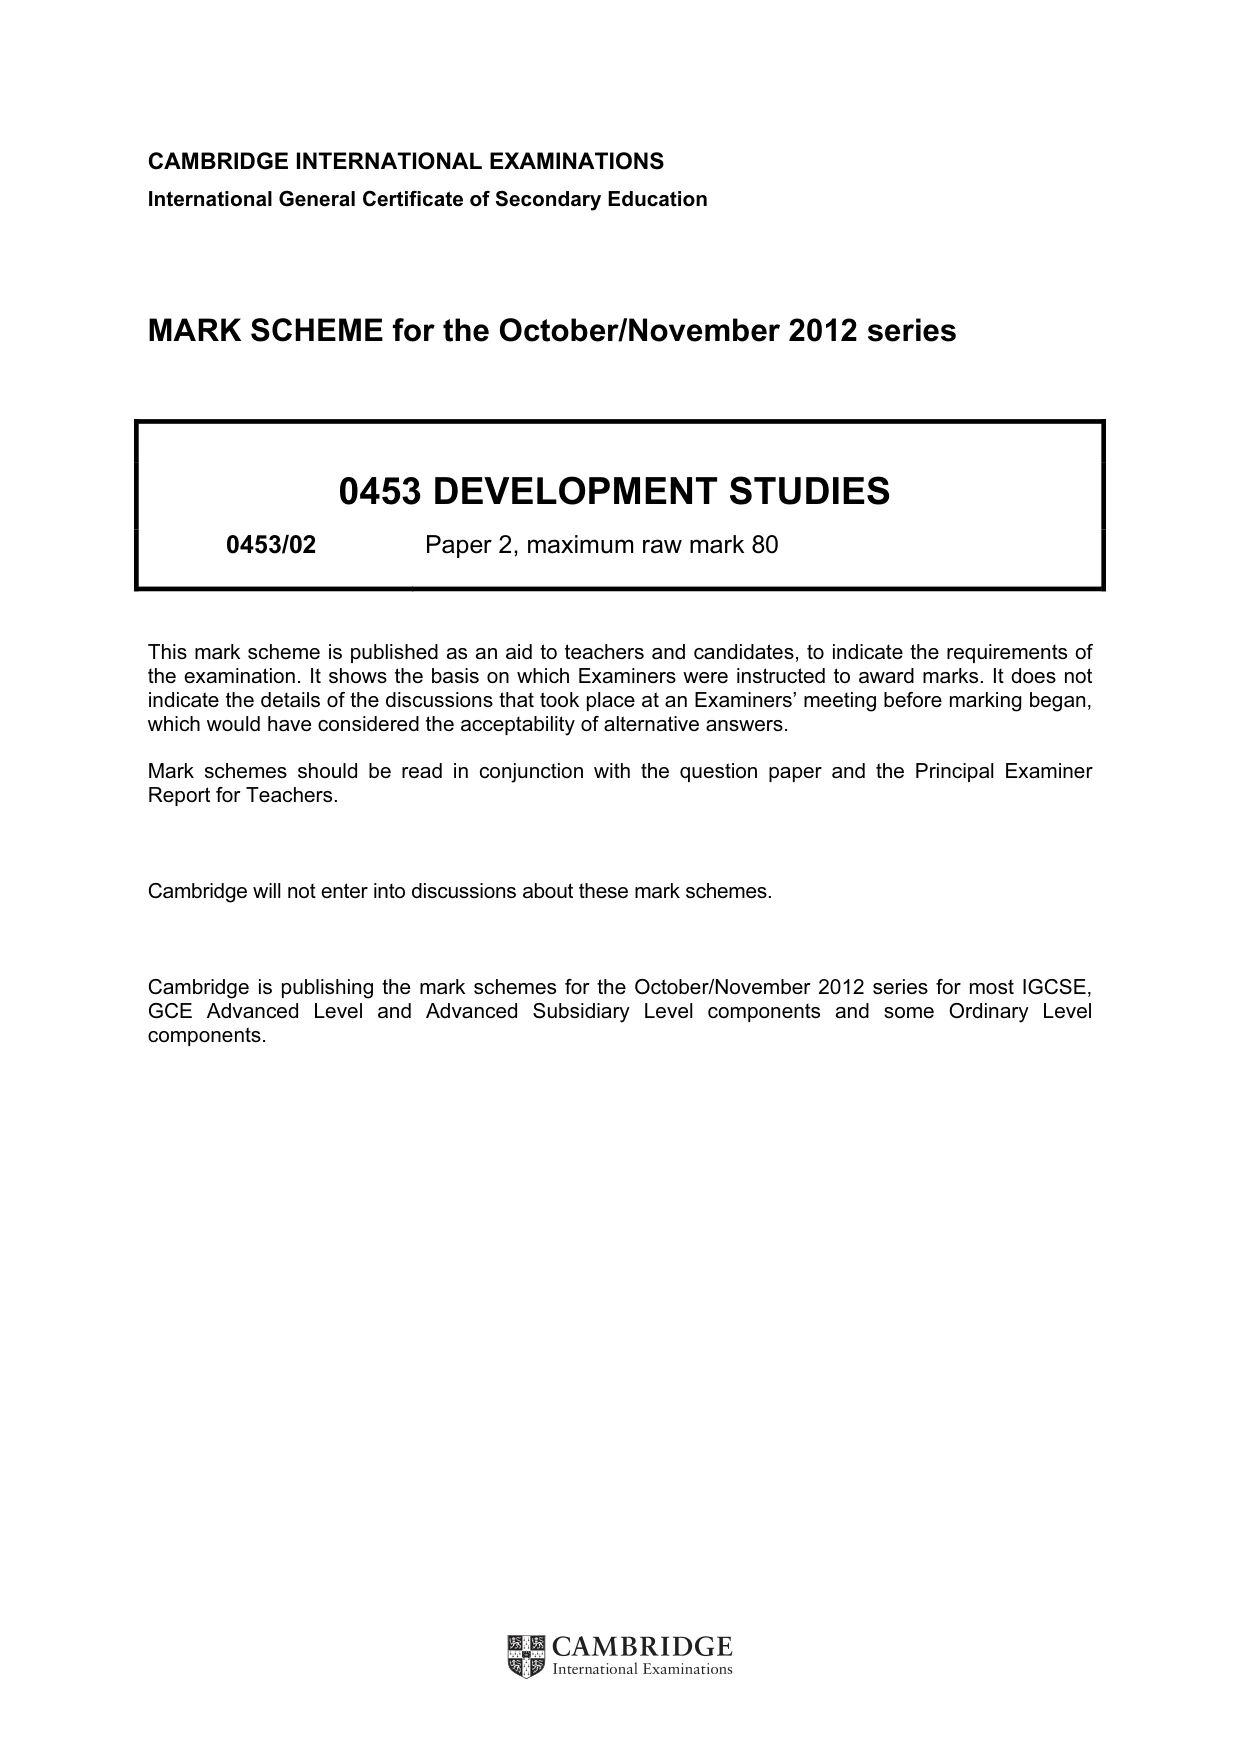
Mark scheme, page 1
CAMBRIDGE INTERNATIONAL EXAMINATIONS International General Certificate of Secondary Education MARK SCHEME for the October/November 2012 series 0453 DEVELOPMENT STUDIES 0453/02 Paper 2, maximum raw mark 80 This mark scheme is published as an aid to teachers and candidates, to indicate the requirements of the examination. It shows the basis on which Examiners were instructed to award marks. It does not indicate the details of the discussions that took place at an Examiners’ meeting before marking began, which would have considered the acceptability of alternative answers. Mark schemes should be read in conjunction with the question paper and the Principal Examiner Report for Teachers. Cambridge will not enter into discussions about these mark schemes. Cambridge is publishing the mark schemes for the October/November 2012 series for most IGCSE, GCE Advanced Level and Advanced Subsidiary Level components and some Ordinary Level components.
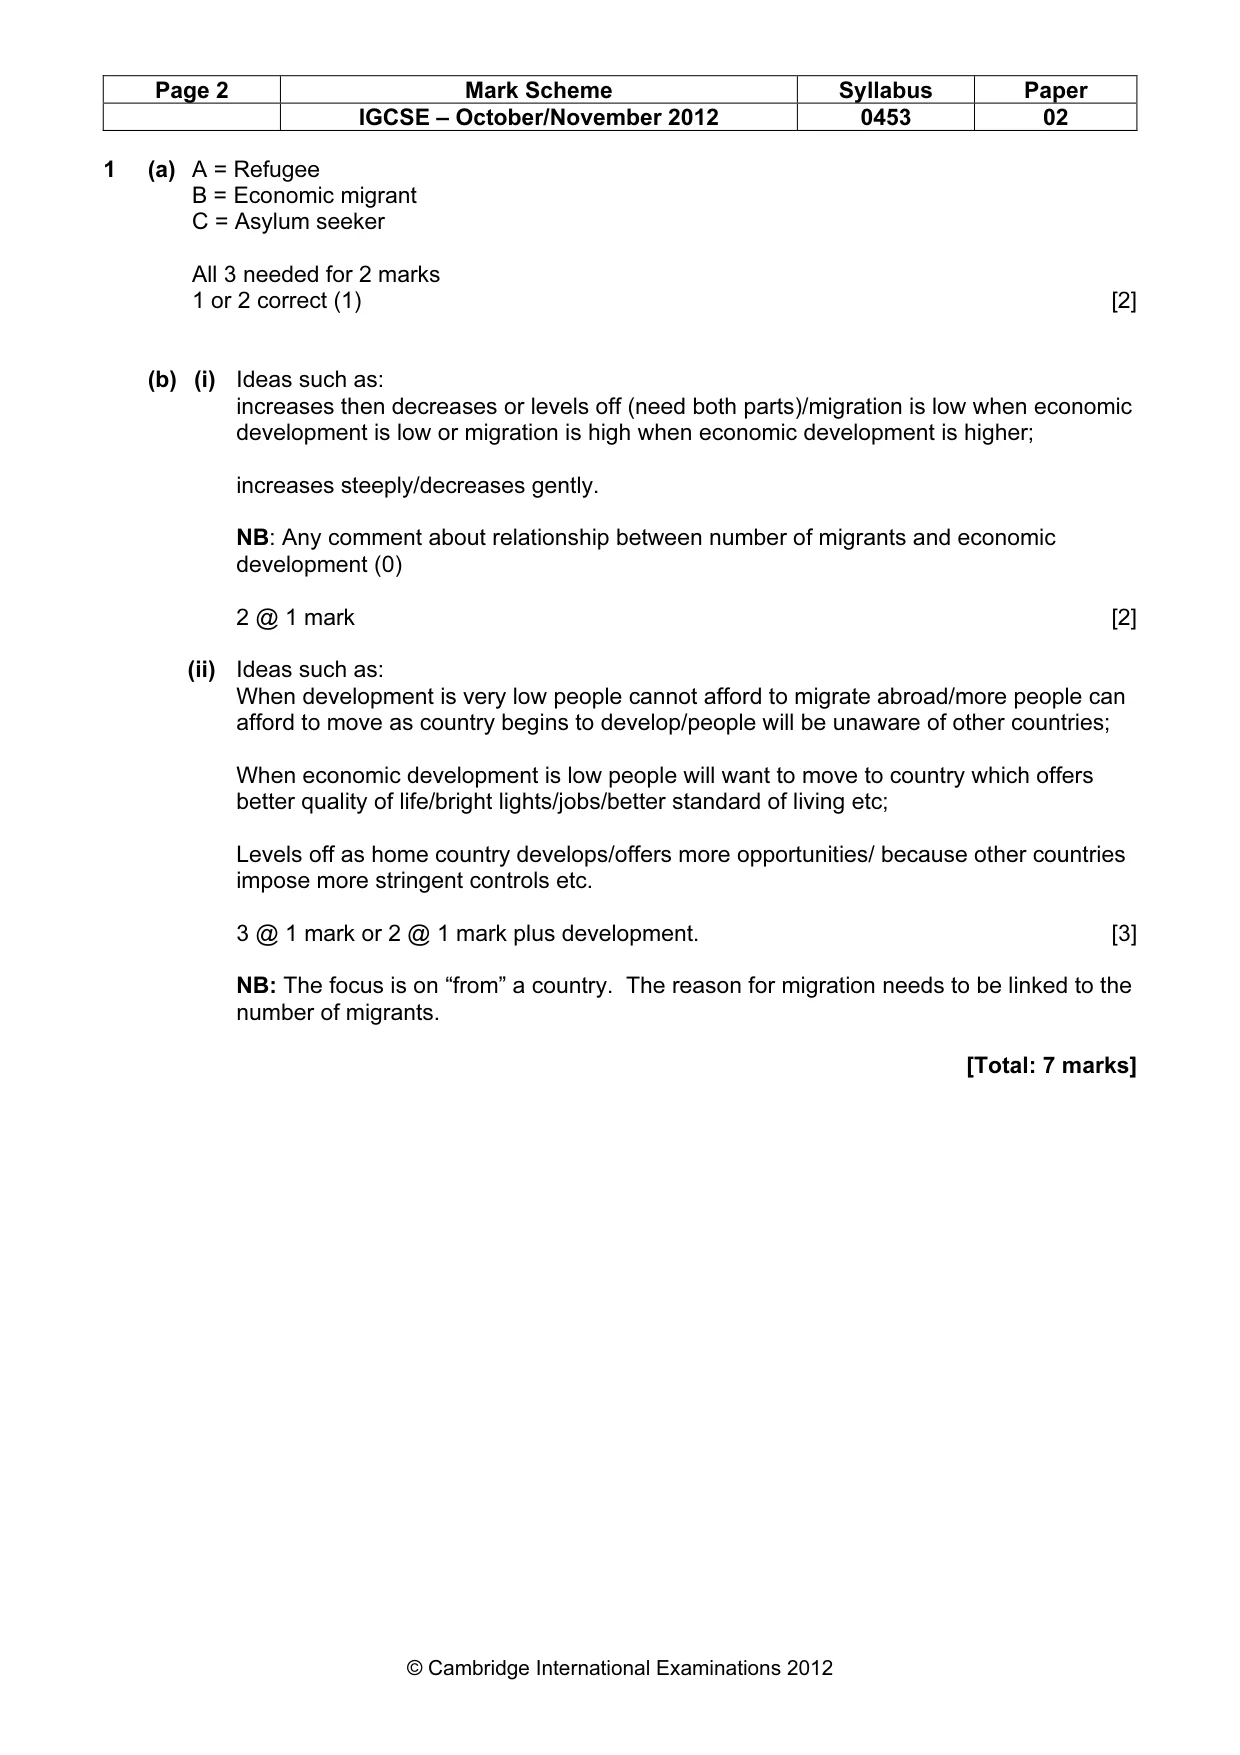
Mark scheme, page 2
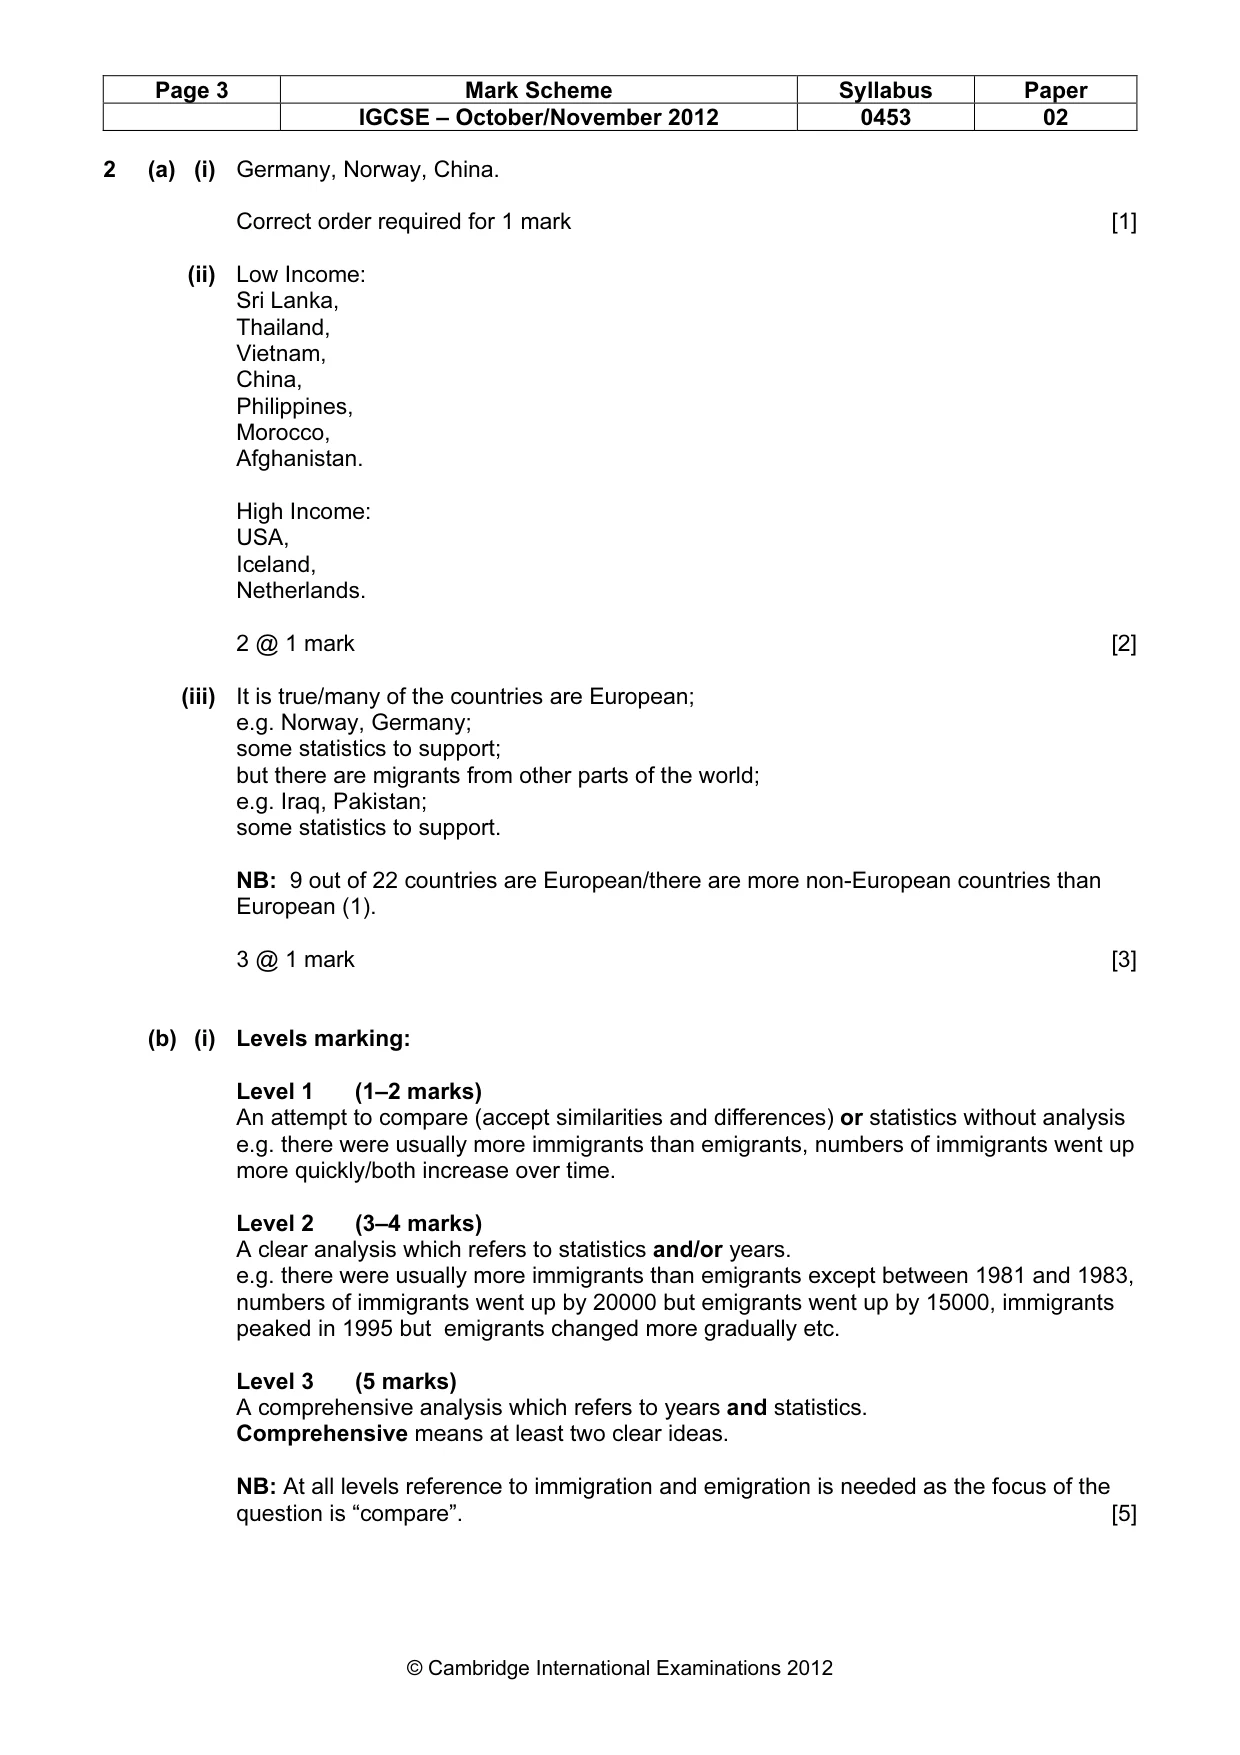
Page 2 Mark Scheme Syllabus Paper IGCSE – October/November 2012 0453 02 © Cambridge International Examinations 2012 1 (a) A = Refugee B = Economic migrant C = Asylum seeker All 3 needed for 2 marks 1 or 2 correct (1) [2] (b) (i) Ideas such as: increases then decreases or levels off (need both parts)/migration is low when economic development is low or migration is high when economic development is higher; increases steeply/decreases gently. NB: Any comment about relationship between number of migrants and economic development (0) 2 @ 1 mark [2] (ii) Ideas such as: When development is very low people cannot afford to migrate abroad/more people can afford to move as country begins to develop/people will be unaware of other countries; When economic development is low people will want to move to country which offers better quality of life/bright lights/jobs/better standard of living etc; Levels off as home country develops/offers more opportunities/ because other countries impose more stringent controls etc. 3 @ 1 mark or 2 @ 1 mark plus development. [3] NB: The focus is on “from” a country. The reason for migration needs to be linked to the number of migrants. [Total: 7 marks]
Mark scheme, page 3
Page 3 Mark Scheme Syllabus Paper IGCSE – October/November 2012 0453 02 © Cambridge International Examinations 2012 2 (a) (i) Germany, Norway, China. Correct order required for 1 mark [1] (ii) Low Income: Sri Lanka, Thailand, Vietnam, China, Philippines, Morocco, Afghanistan. High Income: USA, Iceland, Netherlands. 2 @ 1 mark [2] (iii) It is true/many of the countries are European; e.g. Norway, Germany; some statistics to support; but there are migrants from other parts of the world; e.g. Iraq, Pakistan; some statistics to support. NB: 9 out of 22 countries are European/there are more non-European countries than European (1). 3 @ 1 mark [3] (b) (i) Levels marking: Level 1 (1–2 marks) An attempt to compare (accept similarities and differences) or statistics without analysis e.g. there were usually more immigrants than emigrants, numbers of immigrants went up more quickly/both increase over time. Level 2 (3–4 marks) A clear analysis which refers to statistics and/or years. e.g. there were usually more immigrants than emigrants except between 1981 and 1983, numbers of immigrants went up by 20000 but emigrants went up by 15000, immigrants peaked in 1995 but emigrants changed more gradually etc. Level 3 (5 marks) A comprehensive analysis which refers to years and statistics. Comprehensive means at least two clear ideas. NB: At all levels reference to immigration and emigration is needed as the focus of the question is “compare”. [5]
Mark scheme, page 4
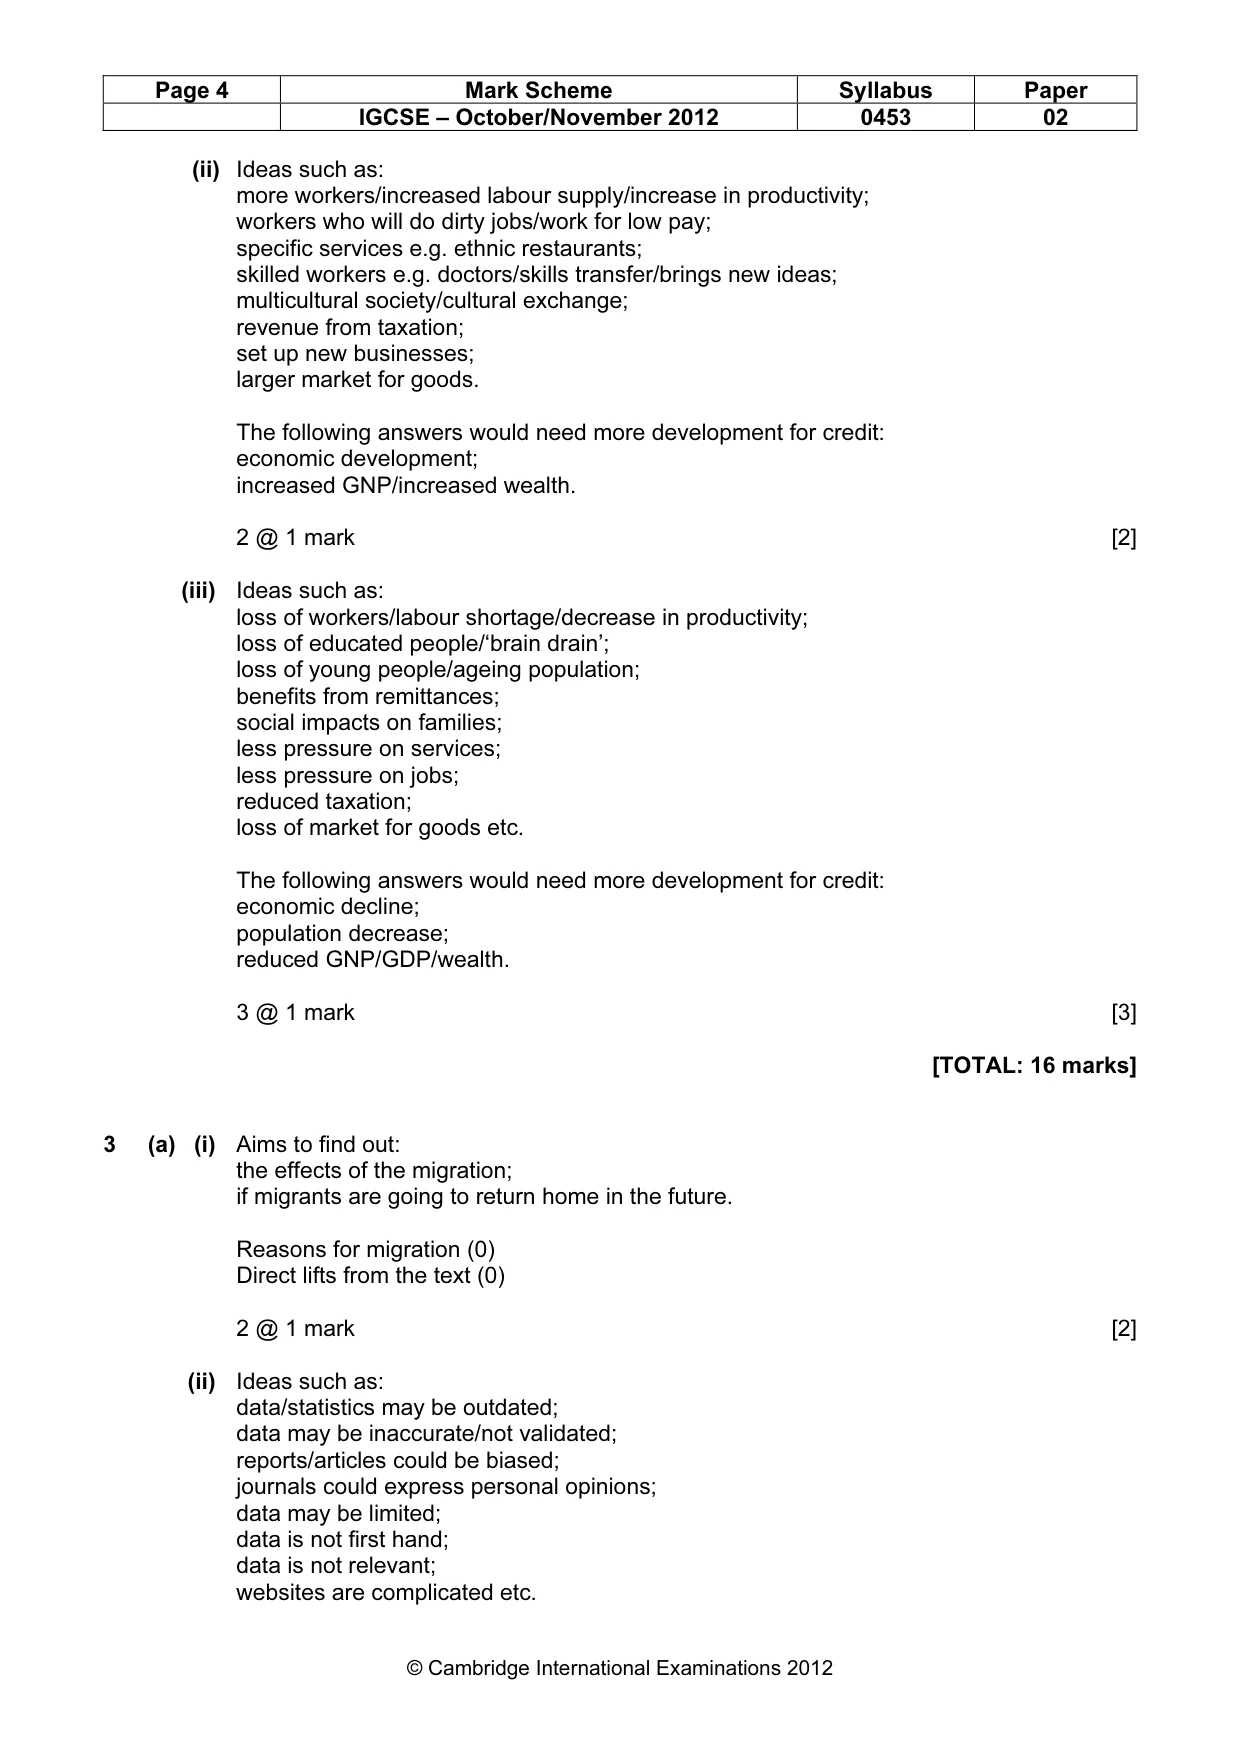
Page 4 Mark Scheme Syllabus Paper IGCSE – October/November 2012 0453 02 © Cambridge International Examinations 2012 (ii) Ideas such as: more workers/increased labour supply/increase in productivity; workers who will do dirty jobs/work for low pay; specific services e.g. ethnic restaurants; skilled workers e.g. doctors/skills transfer/brings new ideas; multicultural society/cultural exchange; revenue from taxation; set up new businesses; larger market for goods. The following answers would need more development for credit: economic development; increased GNP/increased wealth. 2 @ 1 mark [2] (iii) Ideas such as: loss of workers/labour shortage/decrease in productivity; loss of educated people/‘brain drain’; loss of young people/ageing population; benefits from remittances; social impacts on families; less pressure on services; less pressure on jobs; reduced taxation; loss of market for goods etc. The following answers would need more development for credit: economic decline; population decrease; reduced GNP/GDP/wealth. 3 @ 1 mark [3] [TOTAL: 16 marks] 3 (a) (i) Aims to find out: the effects of the migration; if migrants are going to return home in the future. Reasons for migration (0) Direct lifts from the text (0) 2 @ 1 mark [2] (ii) Ideas such as: data/statistics may be outdated; data may be inaccurate/not validated; reports/articles could be biased; journals could express personal opinions; data may be limited; data is not first hand; data is not relevant; websites are complicated etc.
Mark scheme, page 5
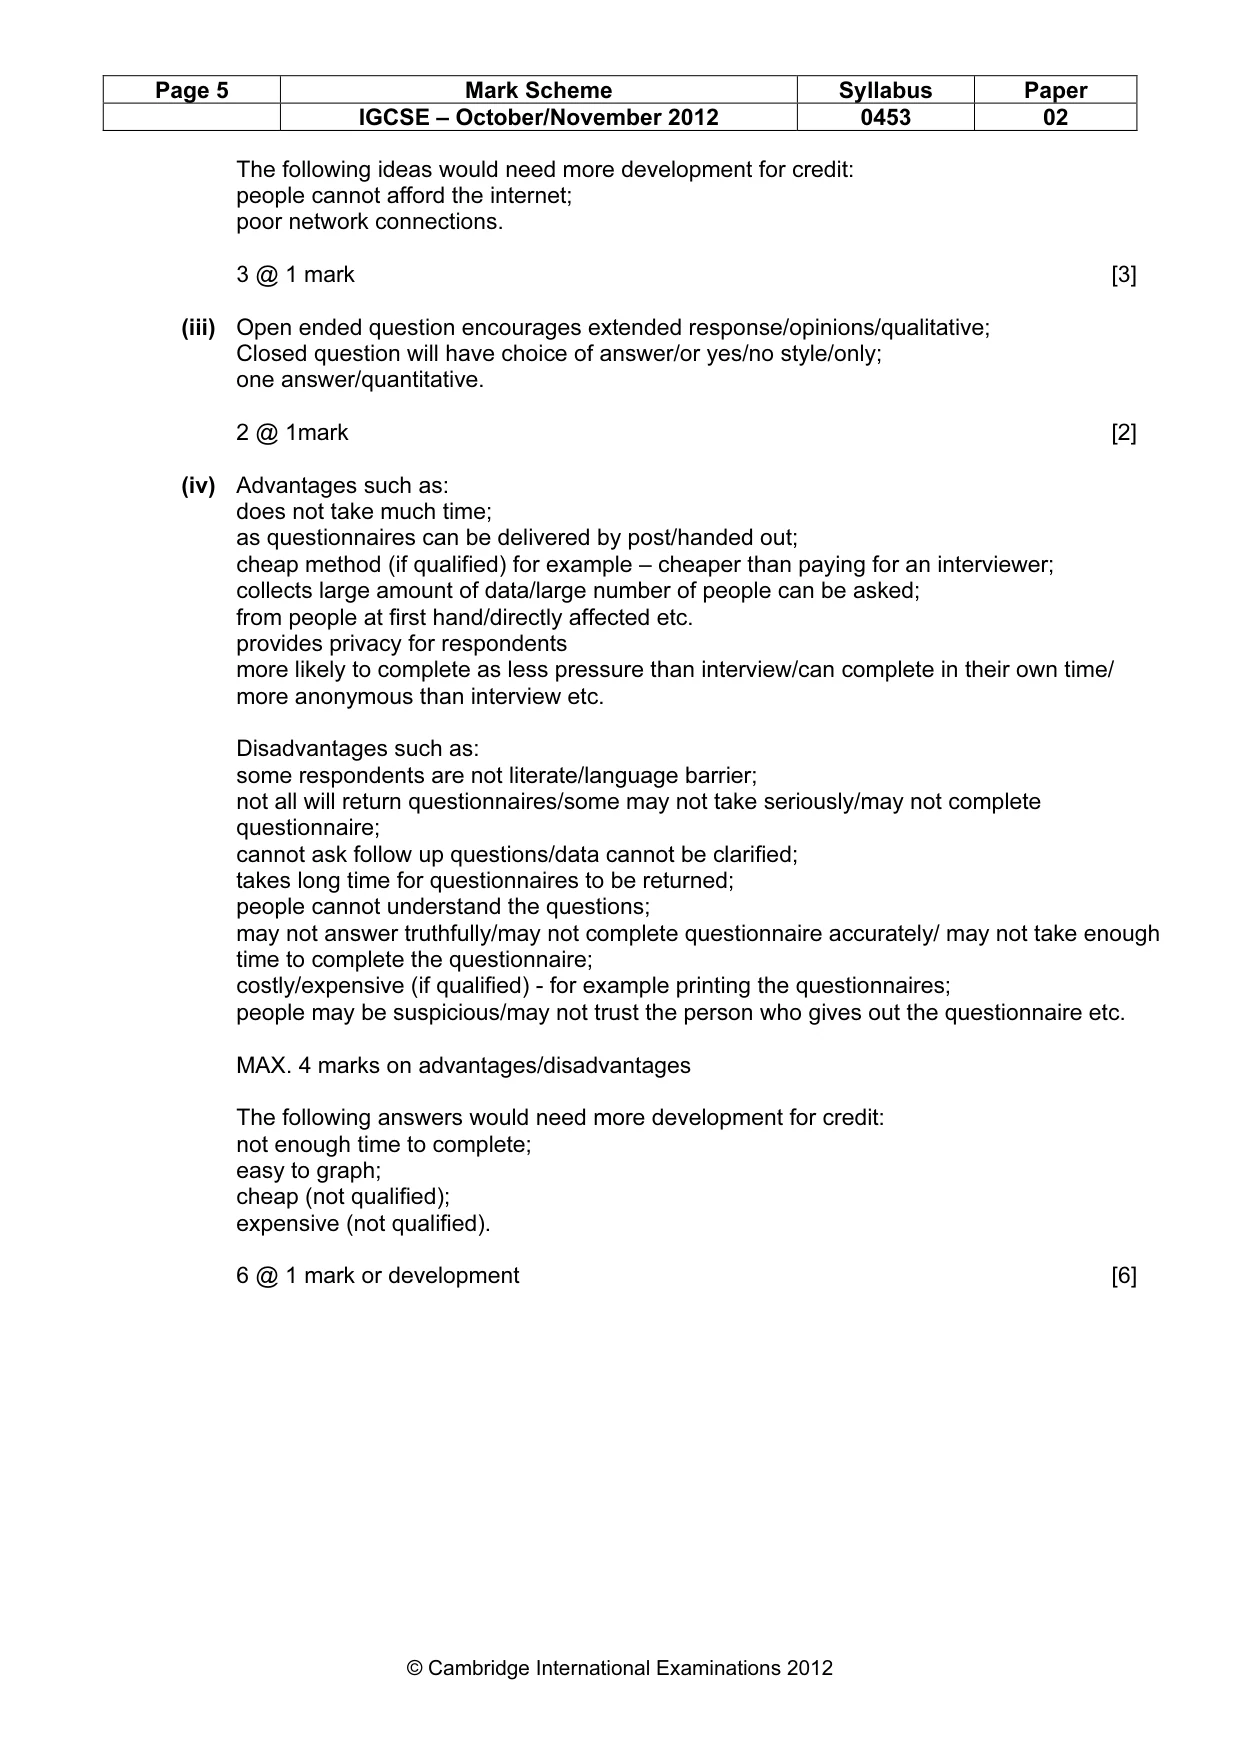
Page 5 Mark Scheme Syllabus Paper IGCSE – October/November 2012 0453 02 © Cambridge International Examinations 2012 The following ideas would need more development for credit: people cannot afford the internet; poor network connections. 3 @ 1 mark [3] (iii) Open ended question encourages extended response/opinions/qualitative; Closed question will have choice of answer/or yes/no style/only; one answer/quantitative. 2 @ 1mark [2] (iv) Advantages such as: does not take much time; as questionnaires can be delivered by post/handed out; cheap method (if qualified) for example – cheaper than paying for an interviewer; collects large amount of data/large number of people can be asked; from people at first hand/directly affected etc. provides privacy for respondents more likely to complete as less pressure than interview/can complete in their own time/ more anonymous than interview etc. Disadvantages such as: some respondents are not literate/language barrier; not all will return questionnaires/some may not take seriously/may not complete questionnaire; cannot ask follow up questions/data cannot be clarified; takes long time for questionnaires to be returned; people cannot understand the questions; may not answer truthfully/may not complete questionnaire accurately/ may not take enough time to complete the questionnaire; costly/expensive (if qualified) - for example printing the questionnaires; people may be suspicious/may not trust the person who gives out the questionnaire etc. MAX. 4 marks on advantages/disadvantages The following answers would need more development for credit: not enough time to complete; easy to graph; cheap (not qualified); expensive (not qualified). 6 @ 1 mark or development [6]
Mark scheme, page 6
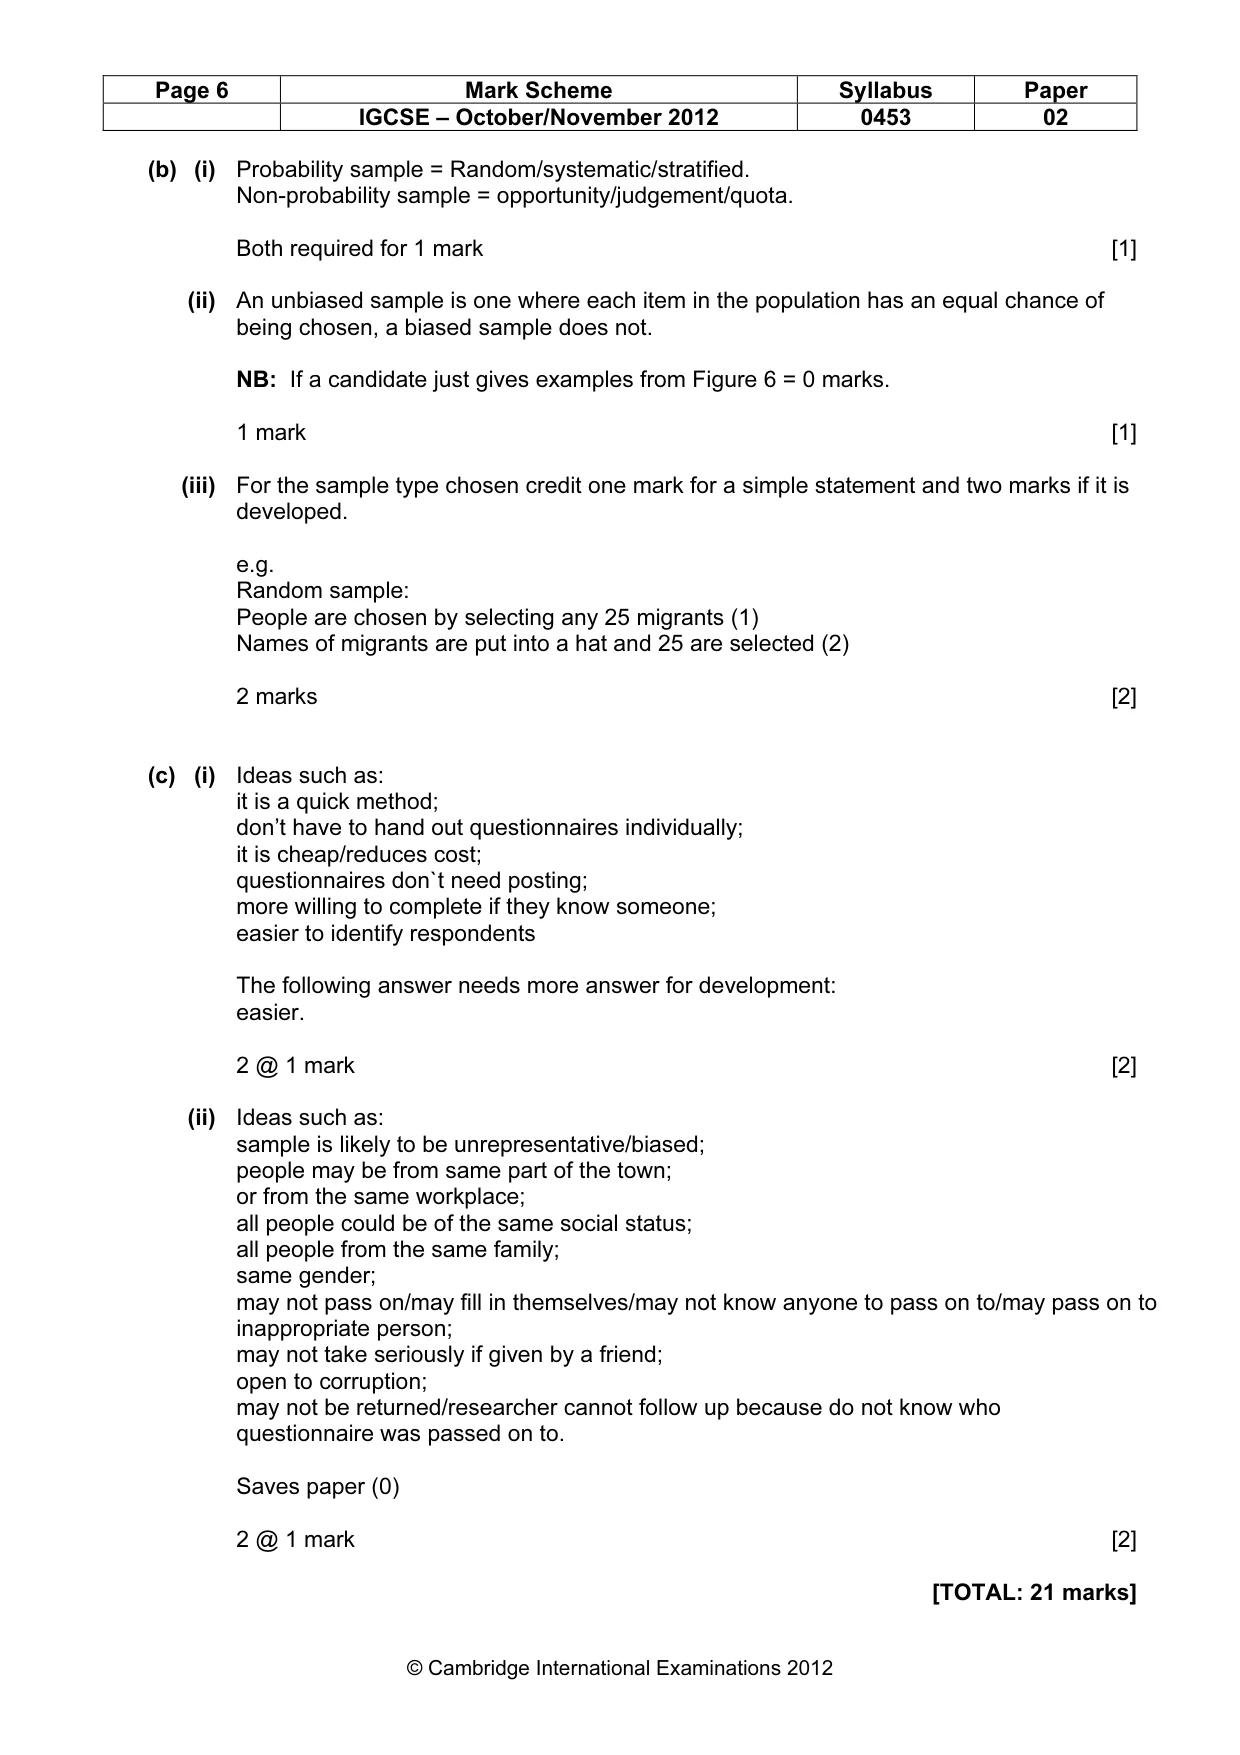
Page 6 Mark Scheme Syllabus Paper IGCSE – October/November 2012 0453 02 © Cambridge International Examinations 2012 (b) (i) Probability sample = Random/systematic/stratified. Non-probability sample = opportunity/judgement/quota. Both required for 1 mark [1] (ii) An unbiased sample is one where each item in the population has an equal chance of being chosen, a biased sample does not. NB: If a candidate just gives examples from Figure 6 = 0 marks. 1 mark [1] (iii) For the sample type chosen credit one mark for a simple statement and two marks if it is developed. e.g. Random sample: People are chosen by selecting any 25 migrants (1) Names of migrants are put into a hat and 25 are selected (2) 2 marks [2] (c) (i) Ideas such as: it is a quick method; don’t have to hand out questionnaires individually; it is cheap/reduces cost; questionnaires don`t need posting; more willing to complete if they know someone; easier to identify respondents The following answer needs more answer for development: easier. 2 @ 1 mark [2] (ii) Ideas such as: sample is likely to be unrepresentative/biased; people may be from same part of the town; or from the same workplace; all people could be of the same social status; all people from the same family; same gender; may not pass on/may fill in themselves/may not know anyone to pass on to/may pass on to inappropriate person; may not take seriously if given by a friend; open to corruption; may not be returned/researcher cannot follow up because do not know who questionnaire was passed on to. Saves paper (0) 2 @ 1 mark [2] [TOTAL: 21 marks]
Mark scheme, page 7
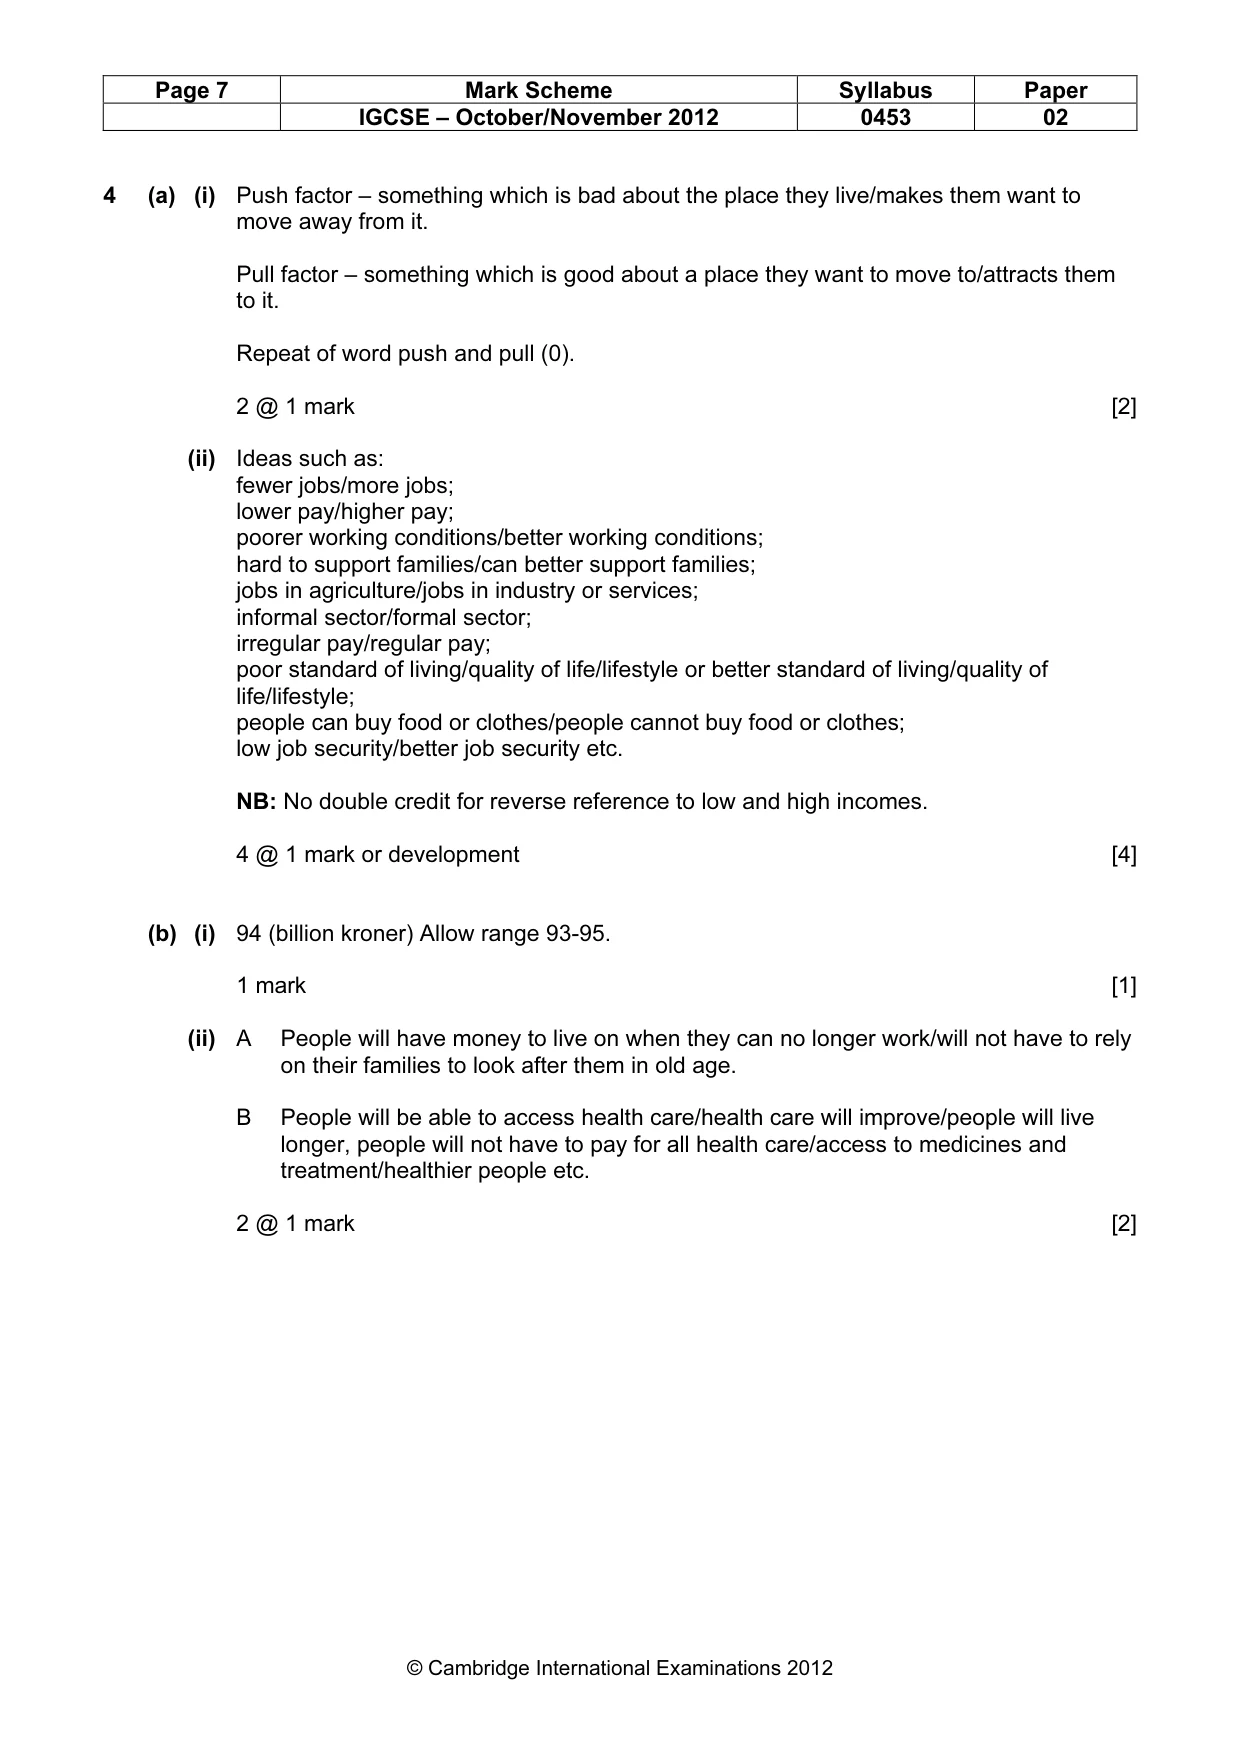
Page 7 Mark Scheme Syllabus Paper IGCSE – October/November 2012 0453 02 © Cambridge International Examinations 2012 4 (a) (i) Push factor – something which is bad about the place they live/makes them want to move away from it. Pull factor – something which is good about a place they want to move to/attracts them to it. Repeat of word push and pull (0). 2 @ 1 mark [2] (ii) Ideas such as: fewer jobs/more jobs; lower pay/higher pay; poorer working conditions/better working conditions; hard to support families/can better support families; jobs in agriculture/jobs in industry or services; informal sector/formal sector; irregular pay/regular pay; poor standard of living/quality of life/lifestyle or better standard of living/quality of life/lifestyle; people can buy food or clothes/people cannot buy food or clothes; low job security/better job security etc. NB: No double credit for reverse reference to low and high incomes. 4 @ 1 mark or development [4] (b) (i) 94 (billion kroner) Allow range 93-95. 1 mark [1] (ii) A People will have money to live on when they can no longer work/will not have to rely on their families to look after them in old age. B People will be able to access health care/health care will improve/people will live longer, people will not have to pay for all health care/access to medicines and treatment/healthier people etc. 2 @ 1 mark [2]
Mark scheme, page 8
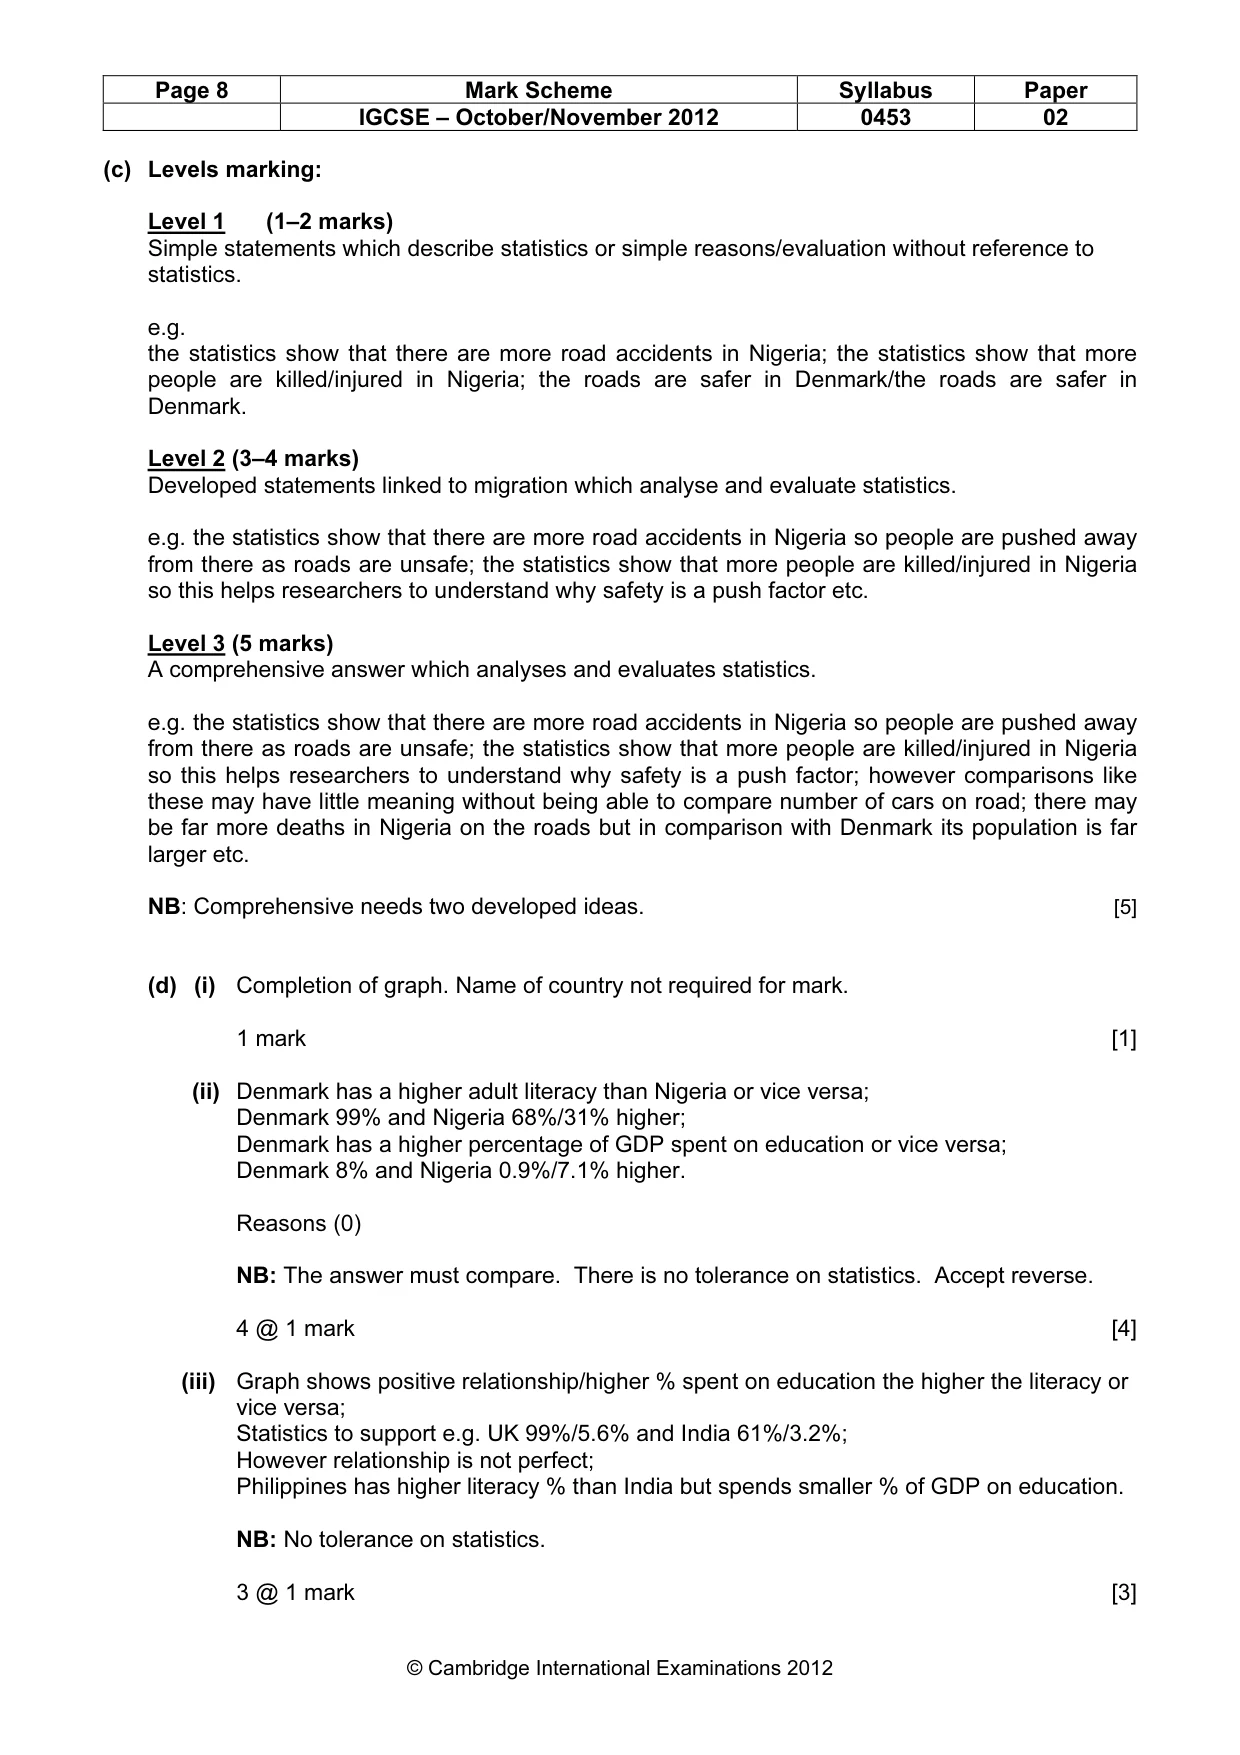
Page 8 Mark Scheme Syllabus Paper IGCSE – October/November 2012 0453 02 © Cambridge International Examinations 2012 (c) Levels marking: Level 1 (1–2 marks) Simple statements which describe statistics or simple reasons/evaluation without reference to statistics. e.g. the statistics show that there are more road accidents in Nigeria; the statistics show that more people are killed/injured in Nigeria; the roads are safer in Denmark/the roads are safer in Denmark. Level 2 (3–4 marks) Developed statements linked to migration which analyse and evaluate statistics. e.g. the statistics show that there are more road accidents in Nigeria so people are pushed away from there as roads are unsafe; the statistics show that more people are killed/injured in Nigeria so this helps researchers to understand why safety is a push factor etc. Level 3 (5 marks) A comprehensive answer which analyses and evaluates statistics. e.g. the statistics show that there are more road accidents in Nigeria so people are pushed away from there as roads are unsafe; the statistics show that more people are killed/injured in Nigeria so this helps researchers to understand why safety is a push factor; however comparisons like these may have little meaning without being able to compare number of cars on road; there may be far more deaths in Nigeria on the roads but in comparison with Denmark its population is far larger etc. NB: Comprehensive needs two developed ideas. [5] (d) (i) Completion of graph. Name of country not required for mark. 1 mark [1] (ii) Denmark has a higher adult literacy than Nigeria or vice versa; Denmark 99% and Nigeria 68%/31% higher; Denmark has a higher percentage of GDP spent on education or vice versa; Denmark 8% and Nigeria 0.9%/7.1% higher. Reasons (0) NB: The answer must compare. There is no tolerance on statistics. Accept reverse. 4 @ 1 mark [4] (iii) Graph shows positive relationship/higher % spent on education the higher the literacy or vice versa; Statistics to support e.g. UK 99%/5.6% and India 61%/3.2%; However relationship is not perfect; Philippines has higher literacy % than India but spends smaller % of GDP on education. NB: No tolerance on statistics. 3 @ 1 mark [3]
Mark scheme, page 9
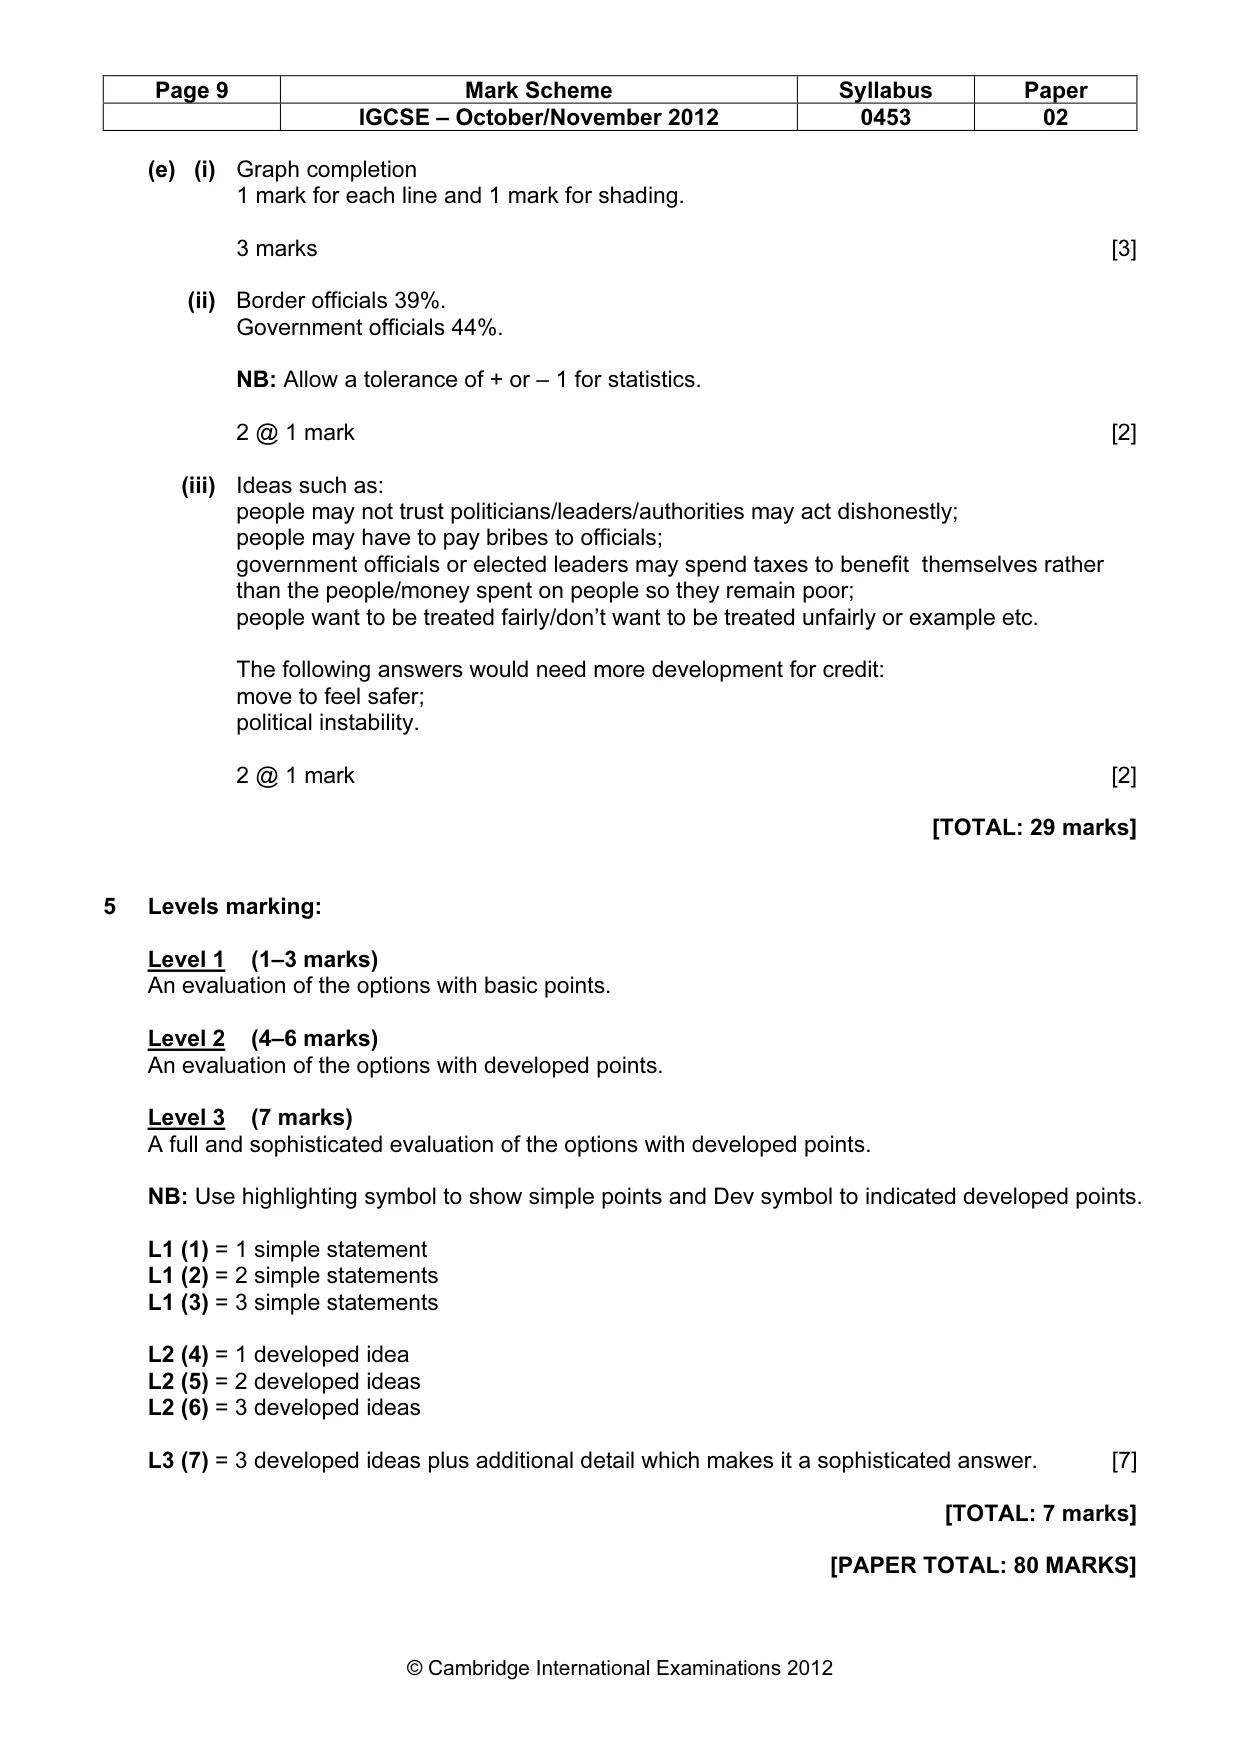
Page 9 Mark Scheme Syllabus Paper IGCSE – October/November 2012 0453 02 © Cambridge International Examinations 2012 (e) (i) Graph completion 1 mark for each line and 1 mark for shading. 3 marks [3] (ii) Border officials 39%. Government officials 44%. NB: Allow a tolerance of + or – 1 for statistics. 2 @ 1 mark [2] (iii) Ideas such as: people may not trust politicians/leaders/authorities may act dishonestly; people may have to pay bribes to officials; government officials or elected leaders may spend taxes to benefit themselves rather than the people/money spent on people so they remain poor; people want to be treated fairly/don’t want to be treated unfairly or example etc. The following answers would need more development for credit: move to feel safer; political instability. 2 @ 1 mark [2] [TOTAL: 29 marks] 5 Levels marking: Level 1 (1–3 marks) An evaluation of the options with basic points. Level 2 (4–6 marks) An evaluation of the options with developed points. Level 3 (7 marks) A full and sophisticated evaluation of the options with developed points. NB: Use highlighting symbol to show simple points and Dev symbol to indicated developed points. L1 (1) = 1 simple statement L1 (2) = 2 simple statements L1 (3) = 3 simple statements L2 (4) = 1 developed idea L2 (5) = 2 developed ideas L2 (6) = 3 developed ideas L3 (7) = 3 developed ideas plus additional detail which makes it a sophisticated answer. [7] [TOTAL: 7 marks] [PAPER TOTAL: 80 MARKS]
What you needed in this session
Cambridge’s own grade thresholds for 2012 Oct/Nov, Paper 2 · Variant 1. A higher threshold means an easier paper — the bar moves with how the cohort did.