Cambridge IGCSE Development Studies 0453 — 2016 Oct/Nov Paper 2 · Variant 1
0453/21/O/N/16 · 80 marks · ≈90 min
The question paper and its mark scheme, free to read here and free to download. This is Cambridge’s own paper, exactly as it was sat.
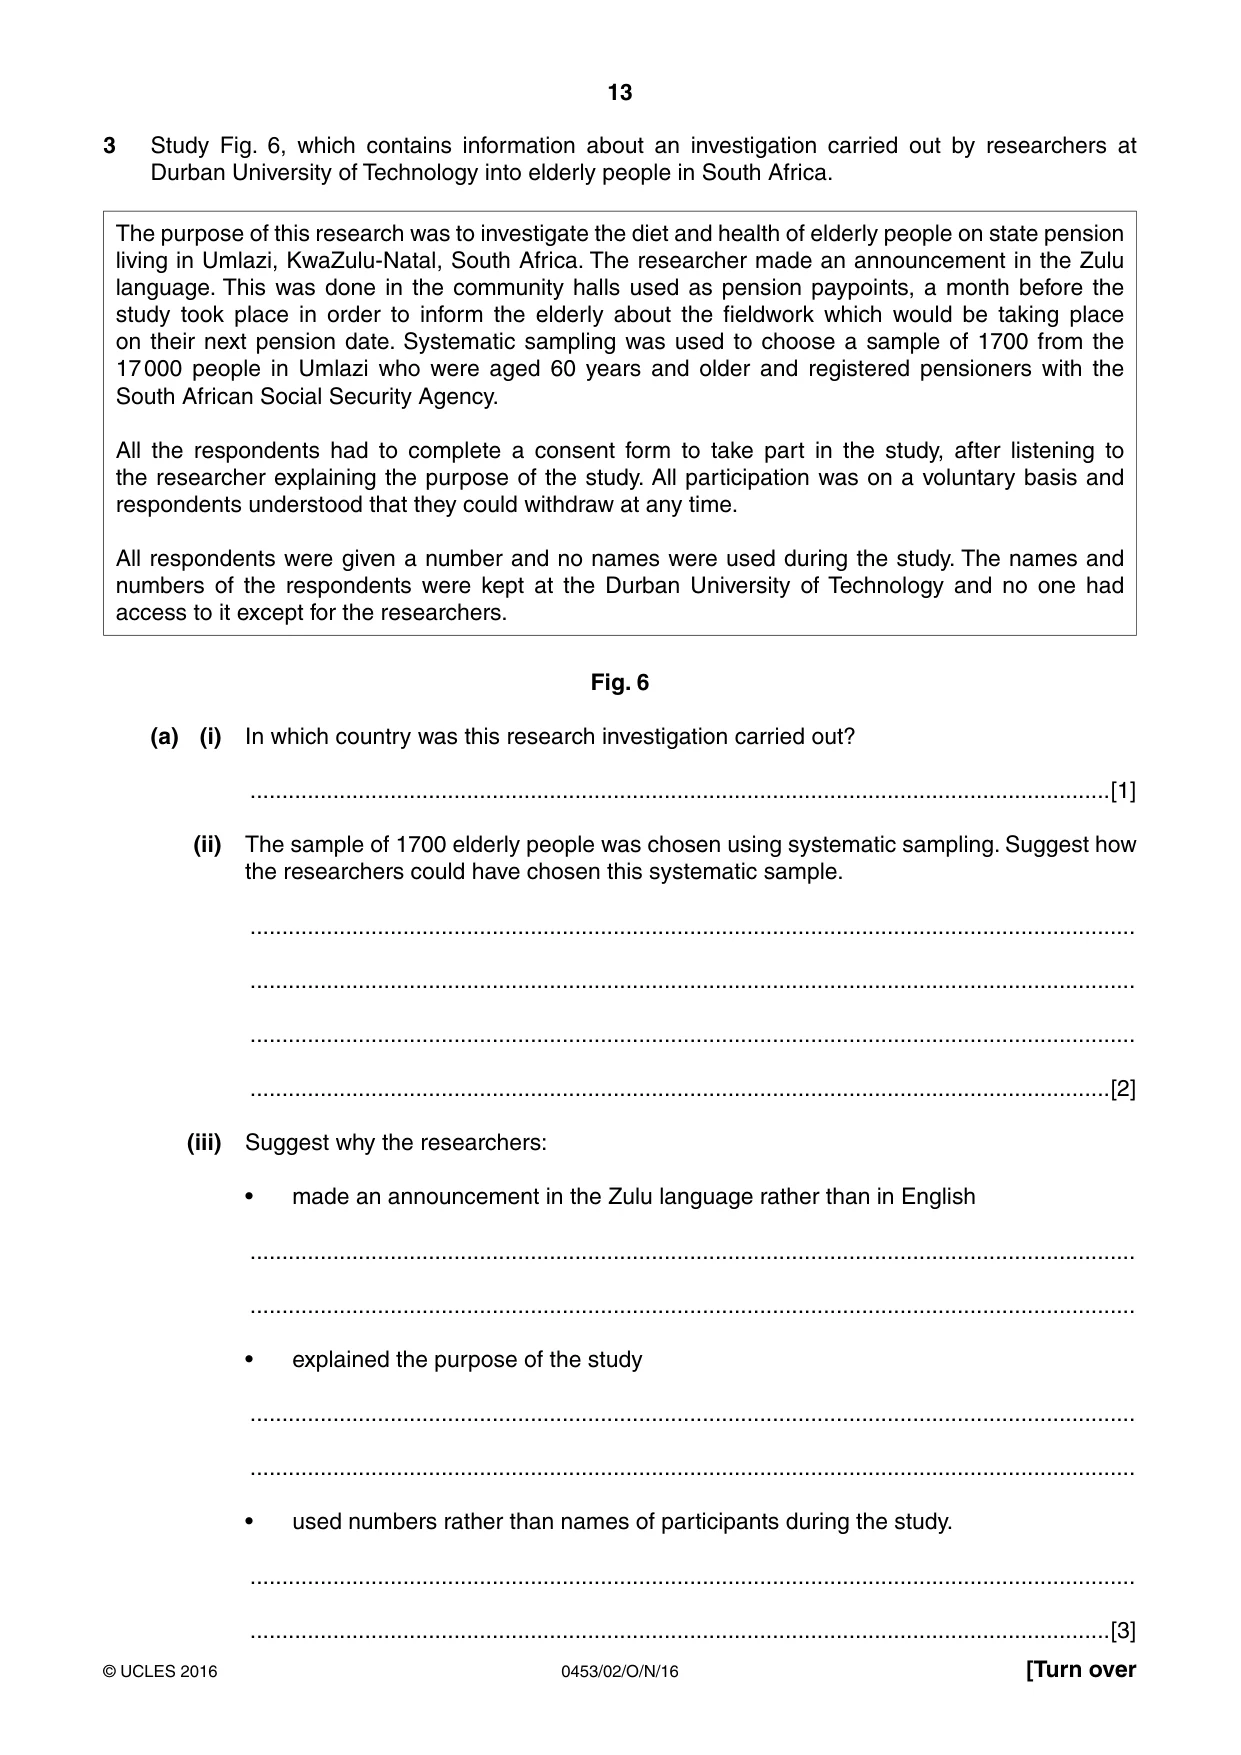
Question paper20 pages







Mark scheme9 pages
Answers below. Sit the paper first if you are practising.
Paper as text
Question paper, page 1
This document consists of 17 printed pages and 3 blank pages. DC (LEG/SG) 115843/3 © UCLES 2016 [Turn over Cambridge International Examinations Cambridge International General Certificate of Secondary Education * 3 4 7 0 3 8 5 7 9 9 * DEVELOPMENT STUDIES 0453/02 Paper 2 October/November 2016 2 hours Candidates answer on the Question Paper. Additional Materials: Ruler READ THESE INSTRUCTIONS FIRST Write your Centre number, candidate number and name on all the work you hand in. Write in dark blue or black pen. You may use an HB pencil for any diagrams, graphs or rough working. Do not use staples, paper clips, glue or correction fluid. DO NOT WRITE IN ANY BARCODES. Answer all the questions. You may not need all the answer lines for your answer. You should read and study the sources before answering the questions. At the end of the examination, fasten all your work securely together. The number of marks is given in brackets [ ] at the end of each question or part question.
Question paper, page 2
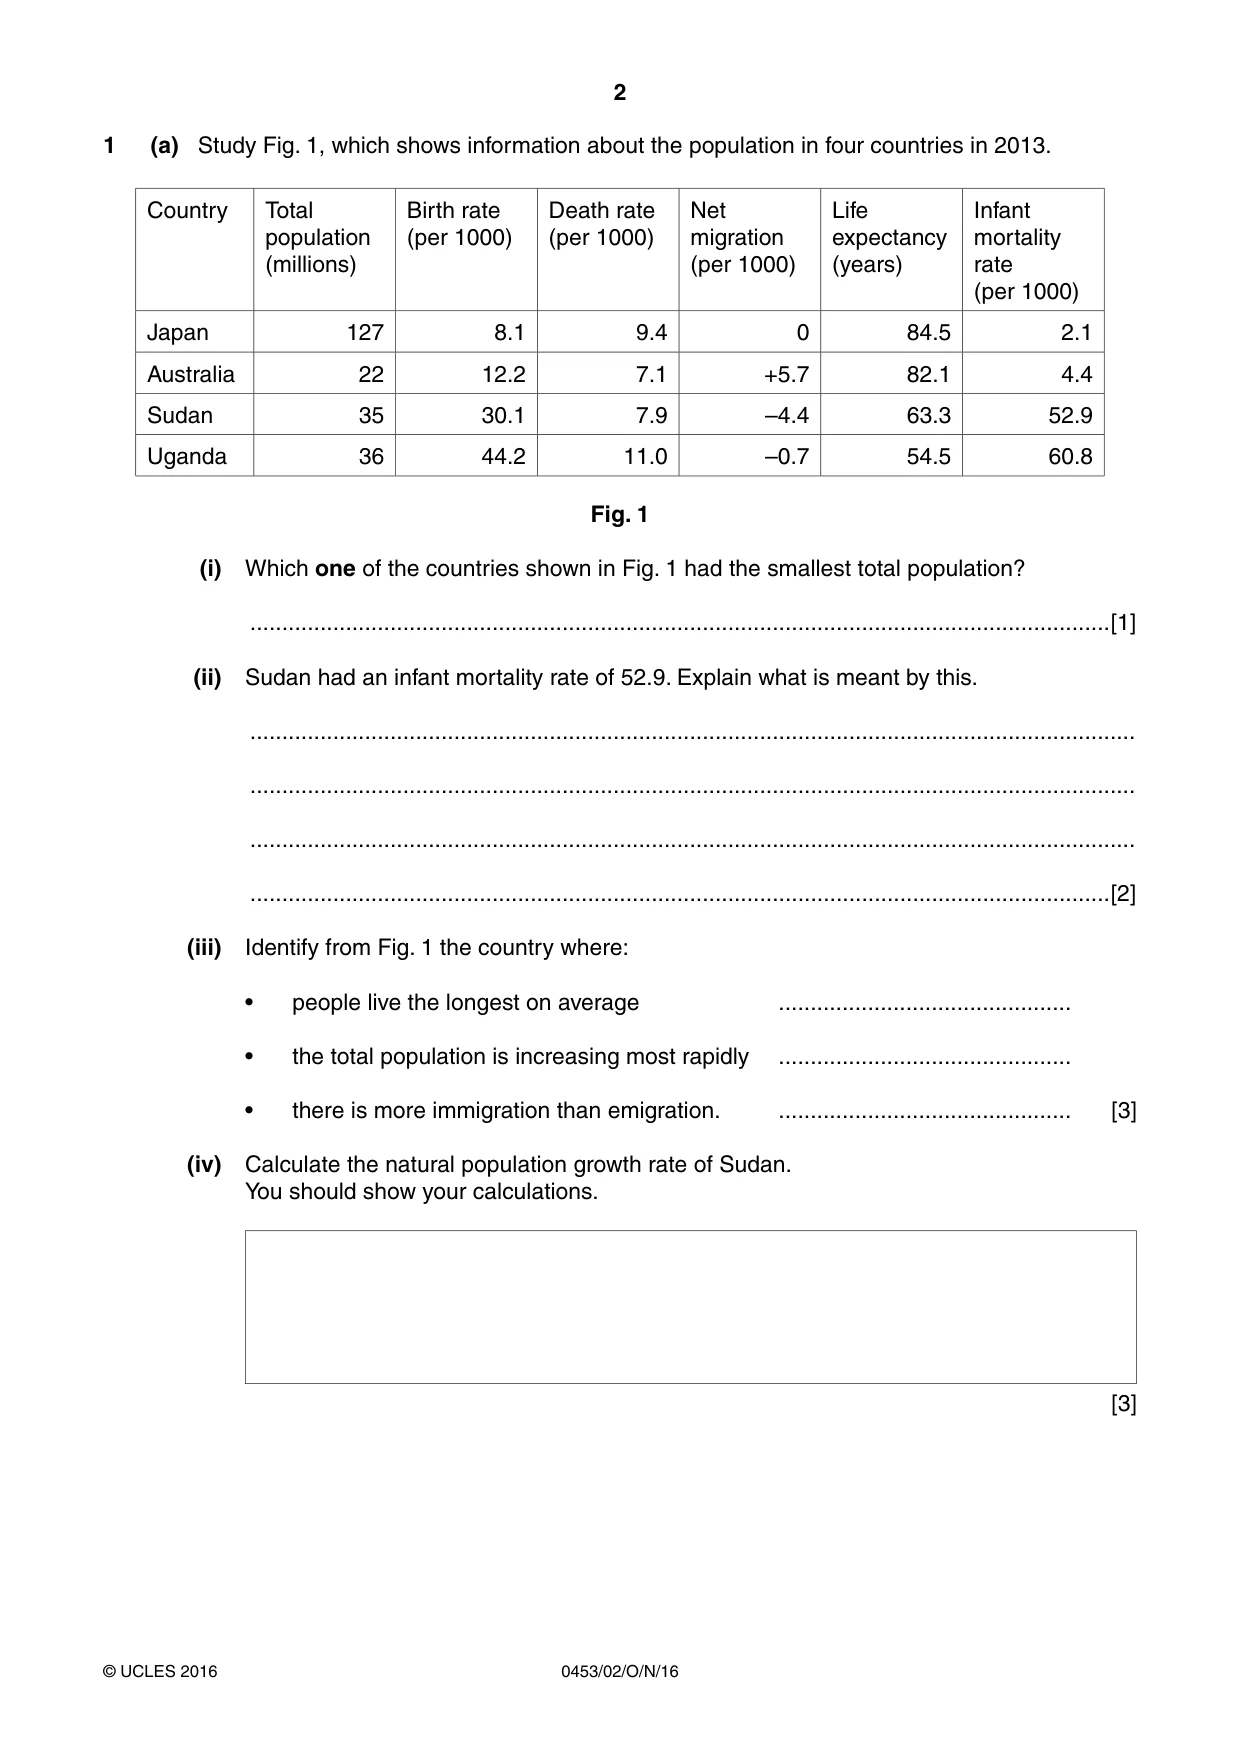
2 0453/02/O/N/16 © UCLES 2016 1 (a) Study Fig. 1, which shows information about the population in four countries in 2013. Country Total population (millions) Birth rate (per 1000) Death rate (per 1000) Net migration (per 1000) Life expectancy (years) Infant mortality rate (per 1000) Japan 127 8.1 9.4 0 84.5 2.1 Australia 22 12.2 7.1 +5.7 82.1 4.4 Sudan 35 30.1 7.9 –4.4 63.3 52.9 Uganda 36 44.2 11.0 –0.7 54.5 60.8 Fig. 1 (i) Which one of the countries shown in Fig. 1 had the smallest total population? …[1] (ii) Sudan had an infant mortality rate of 52.9. Explain what is meant by this. … … … …[2] (iii) Identify from Fig. 1 the country where: • people live the longest on average … • the total population is increasing most rapidly … • there is more immigration than emigration. … [3] (iv) Calculate the natural population growth rate of Sudan. You should show your calculations. [3]
Question paper, page 3
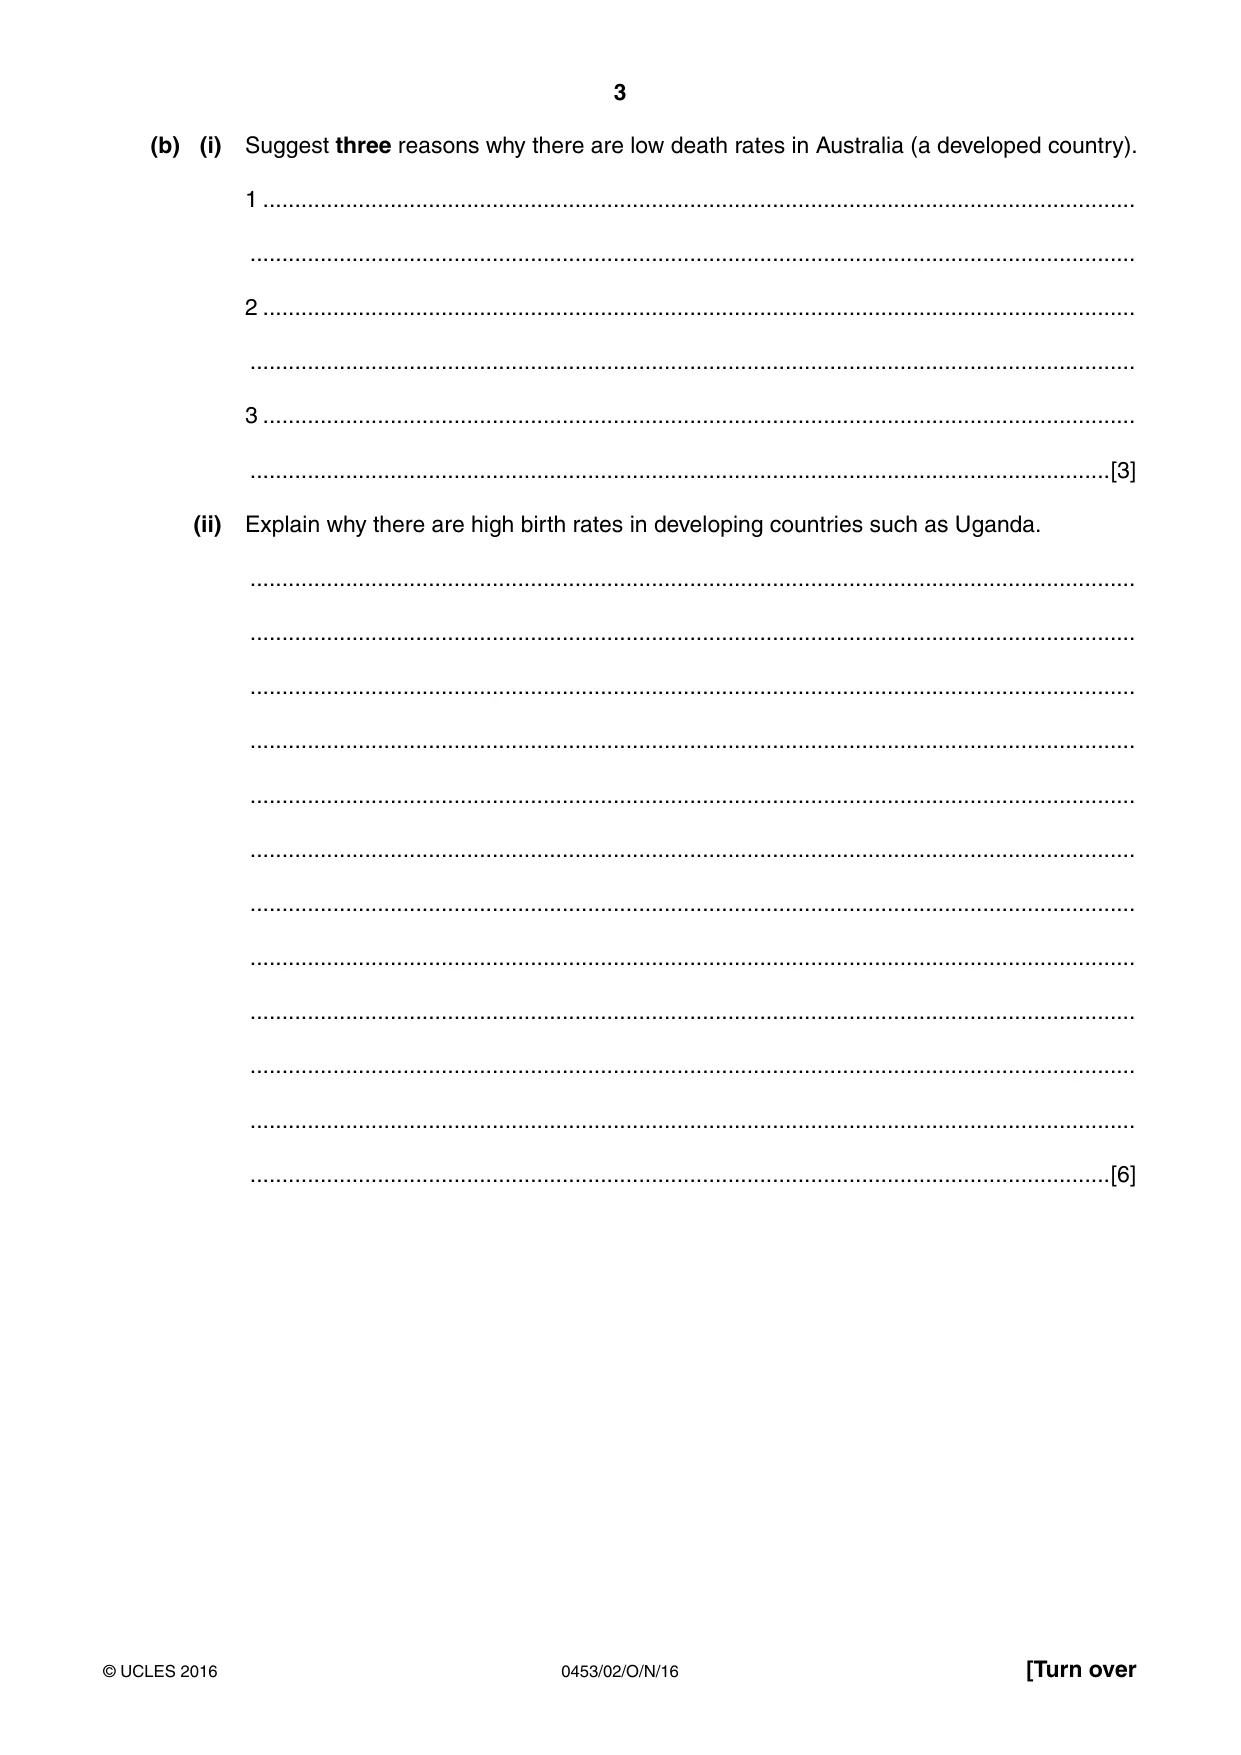
3 0453/02/O/N/16 © UCLES 2016 [Turn over (b) (i) Suggest three reasons why there are low death rates in Australia (a developed country). 1 … … 2 … … 3 … …[3] (ii) Explain why there are high birth rates in developing countries such as Uganda. … … … … … … … … … … … …[6]
Question paper, page 4
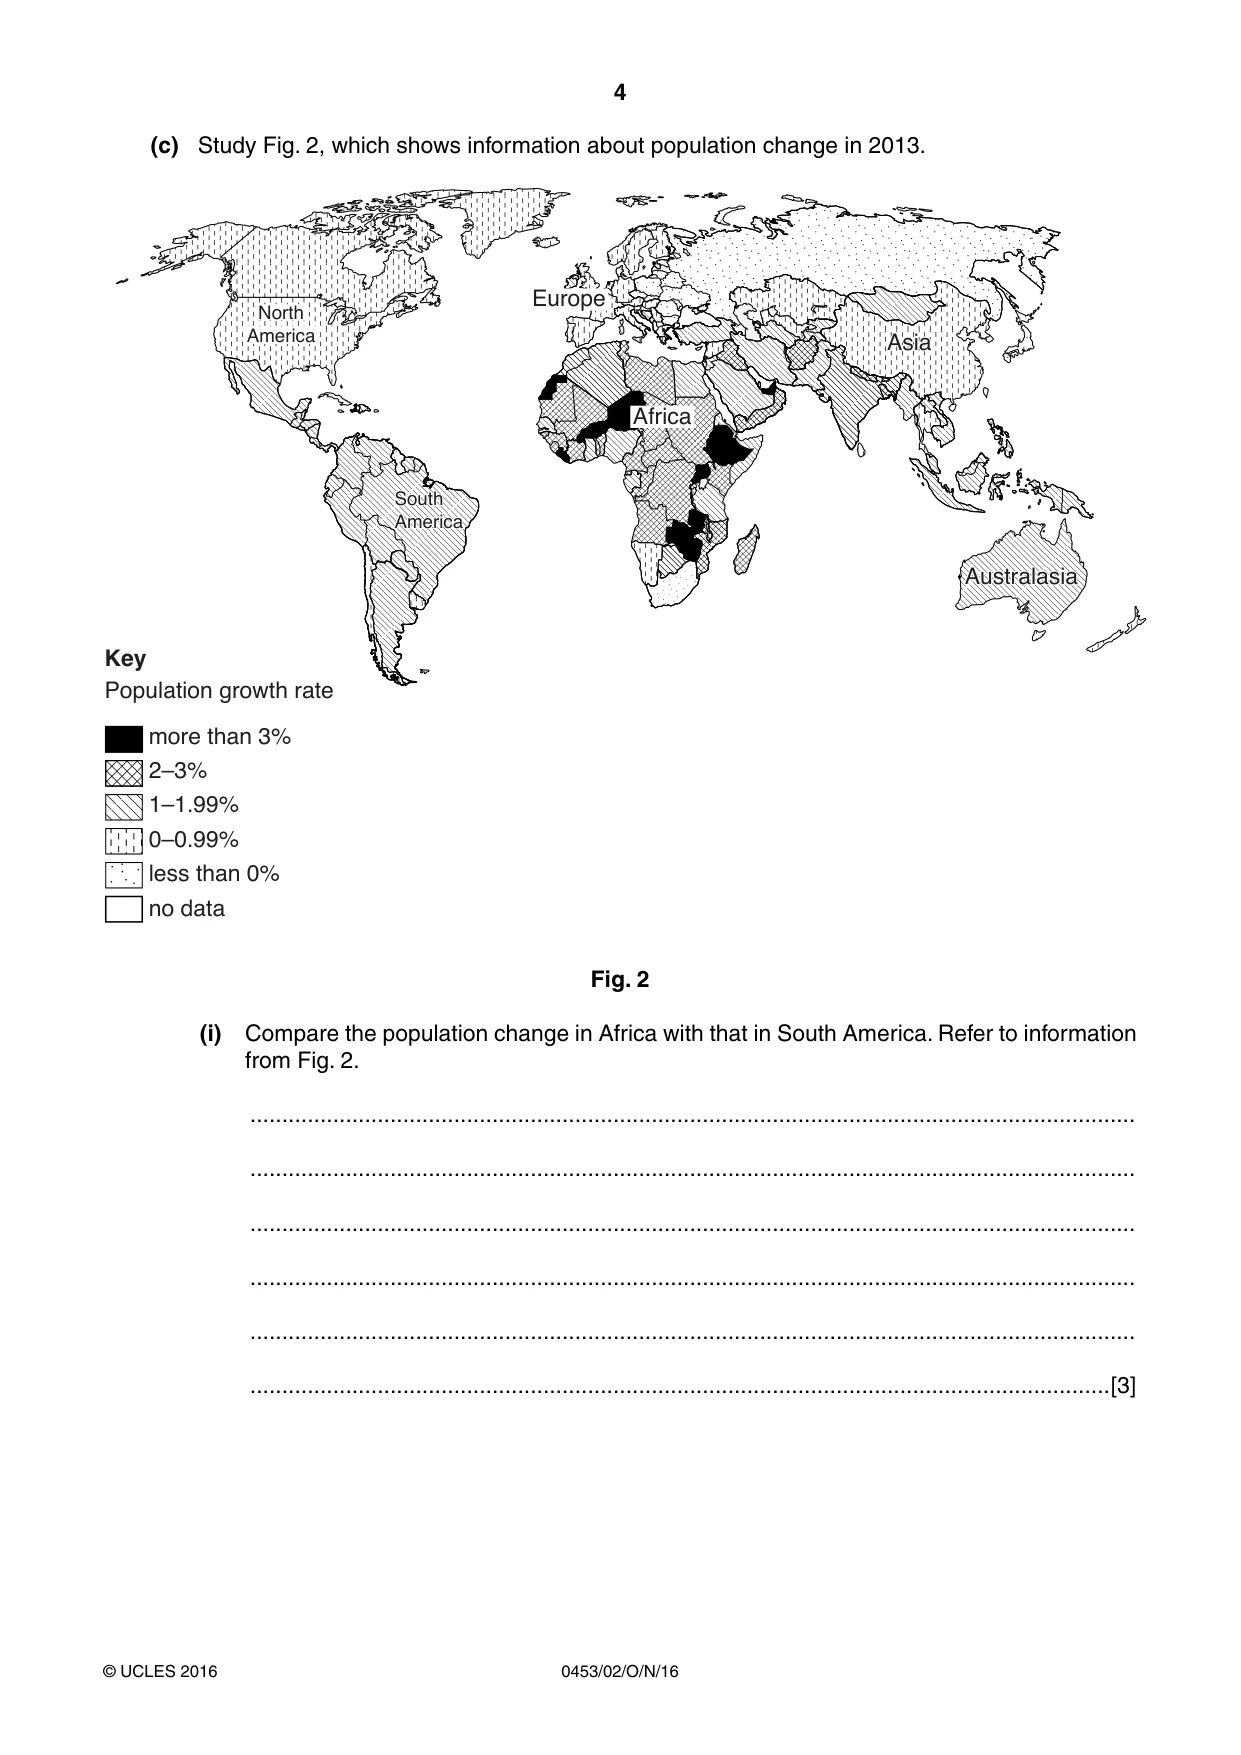
4 0453/02/O/N/16 © UCLES 2016 (c) Study Fig. 2, which shows information about population change in 2013. less than 0% 0–0.99% 1–1.99% 2–3% more than 3% no data Population growth rate Key Africa Europe North America South America South America Asia Asia Australasia Australasia Fig. 2 (i) Compare the population change in Africa with that in South America. Refer to information from Fig. 2. … … … … … …[3]
Question paper, page 5
5 0453/02/O/N/16 © UCLES 2016 [Turn over (ii) Explain why the governments of many developing countries are aiming to reduce their rates of population growth. … … … … … … … … … … … … … … … … … …[6]
Question paper, page 6
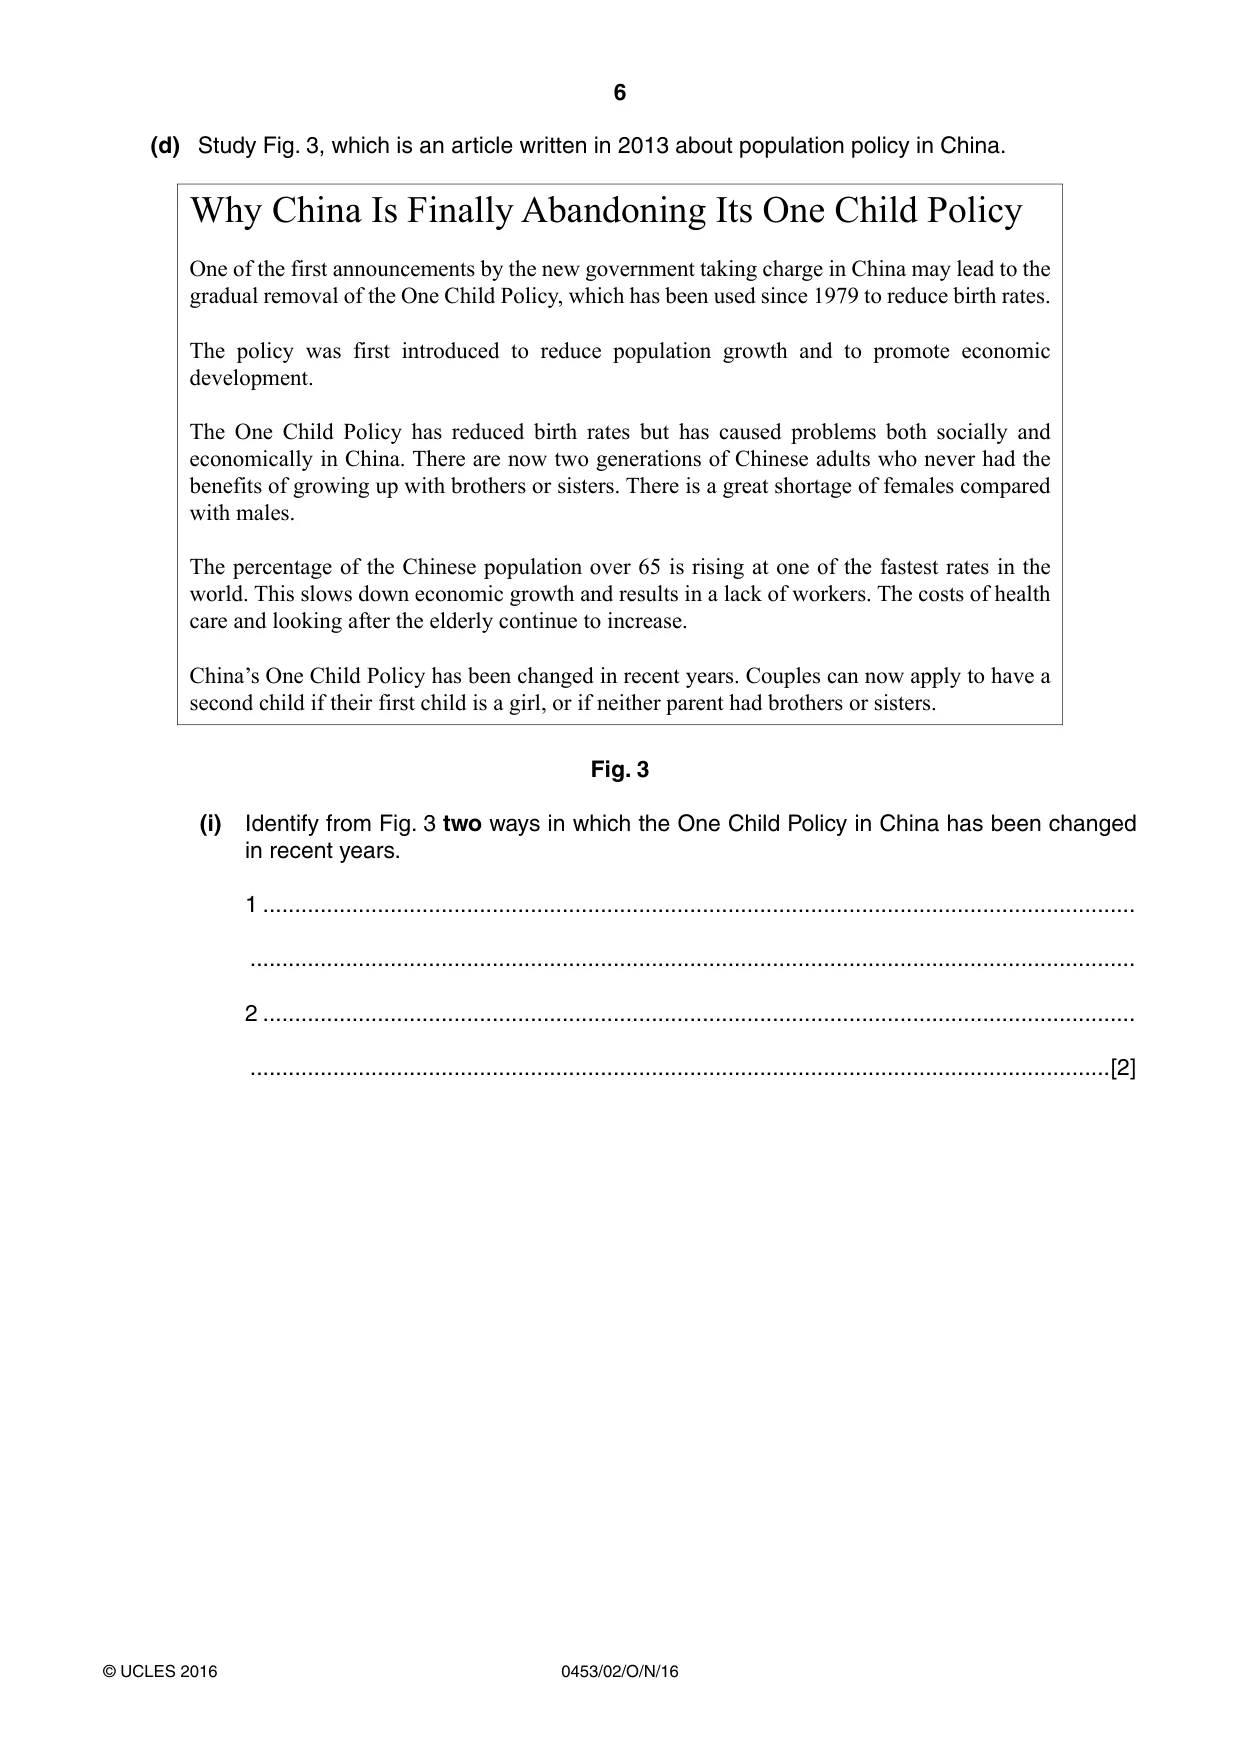
6 0453/02/O/N/16 © UCLES 2016 (d) Study Fig. 3, which is an article written in 2013 about population policy in China. Why China Is Finally Abandoning Its One Child Policy One of the first announcements by the new government taking charge in China may lead to the gradual removal of the One Child Policy, which has been used since 1979 to reduce birth rates. The policy was first introduced to reduce population growth and to promote economic development. The One Child Policy has reduced birth rates but has caused problems both socially and economically in China. There are now two generations of Chinese adults who never had the benefits of growing up with brothers or sisters. There is a great shortage of females compared with males. The percentage of the Chinese population over 65 is rising at one of the fastest rates in the world. This slows down economic growth and results in a lack of workers. The costs of health care and looking after the elderly continue to increase. China’s One Child Policy has been changed in recent years. Couples can now apply to have a second child if their first child is a girl, or if neither parent had brothers or sisters. Fig. 3 (i) Identify from Fig. 3 two ways in which the One Child Policy in China has been changed in recent years. 1 … … 2 … …[2]
Question paper, page 7
7 0453/02/O/N/16 © UCLES 2016 [Turn over (ii) Explain how social and economic problems might be reduced in China as a result of these decisions to change the One Child Policy. … … … … … … … … … … … … … … … … … …[6] [Total: 35 marks]
Question paper, page 8
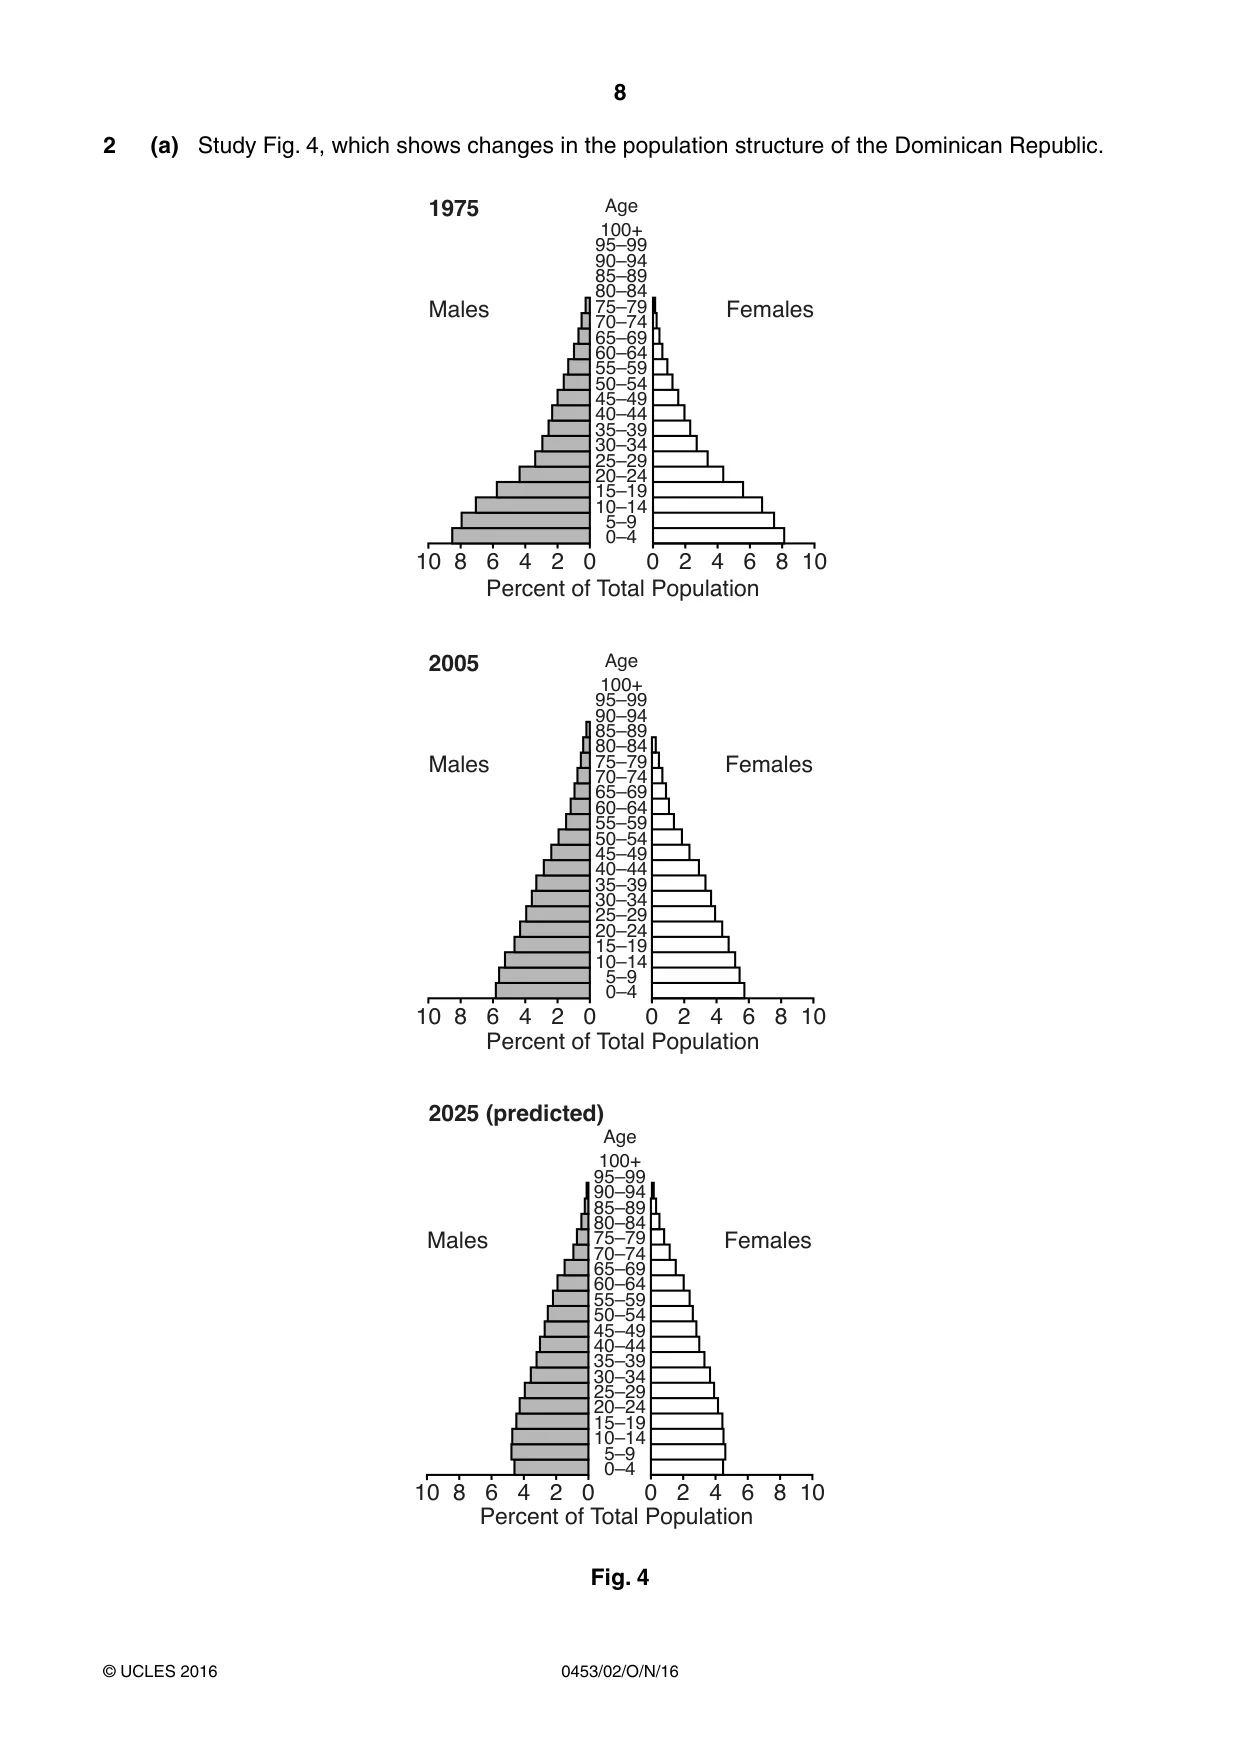
8 0453/02/O/N/16 © UCLES 2016 2 (a) Study Fig. 4, which shows changes in the population structure of the Dominican Republic. 10 8 6 4 2 0 0 2 4 6 8 10 Percent of Total Population Males Females 1975 10 8 6 4 2 0 0 2 4 6 8 10 Percent of Total Population Males Females 2005 10 8 6 4 2 0 0 2 4 6 8 10 Percent of Total Population Males Females 2025 (predicted) Age 100+ 95–99 90–94 85–89 80–84 75–79 70–74 65–69 60–64 55–59 50–54 45–49 40–44 35–39 30–34 25–29 20–24 15–19 10–14 5–9 0–4 Age 100+ 95–99 90–94 85–89 80–84 75–79 70–74 65–69 60–64 55–59 50–54 45–49 40–44 35–39 30–34 25–29 20–24 15–19 10–14 5–9 0–4 Age 100+ 95–99 90–94 85–89 80–84 75–79 70–74 65–69 60–64 55–59 50–54 45–49 40–44 35–39 30–34 25–29 20–24 15–19 10–14 5–9 0–4 Fig. 4
Question paper, page 9
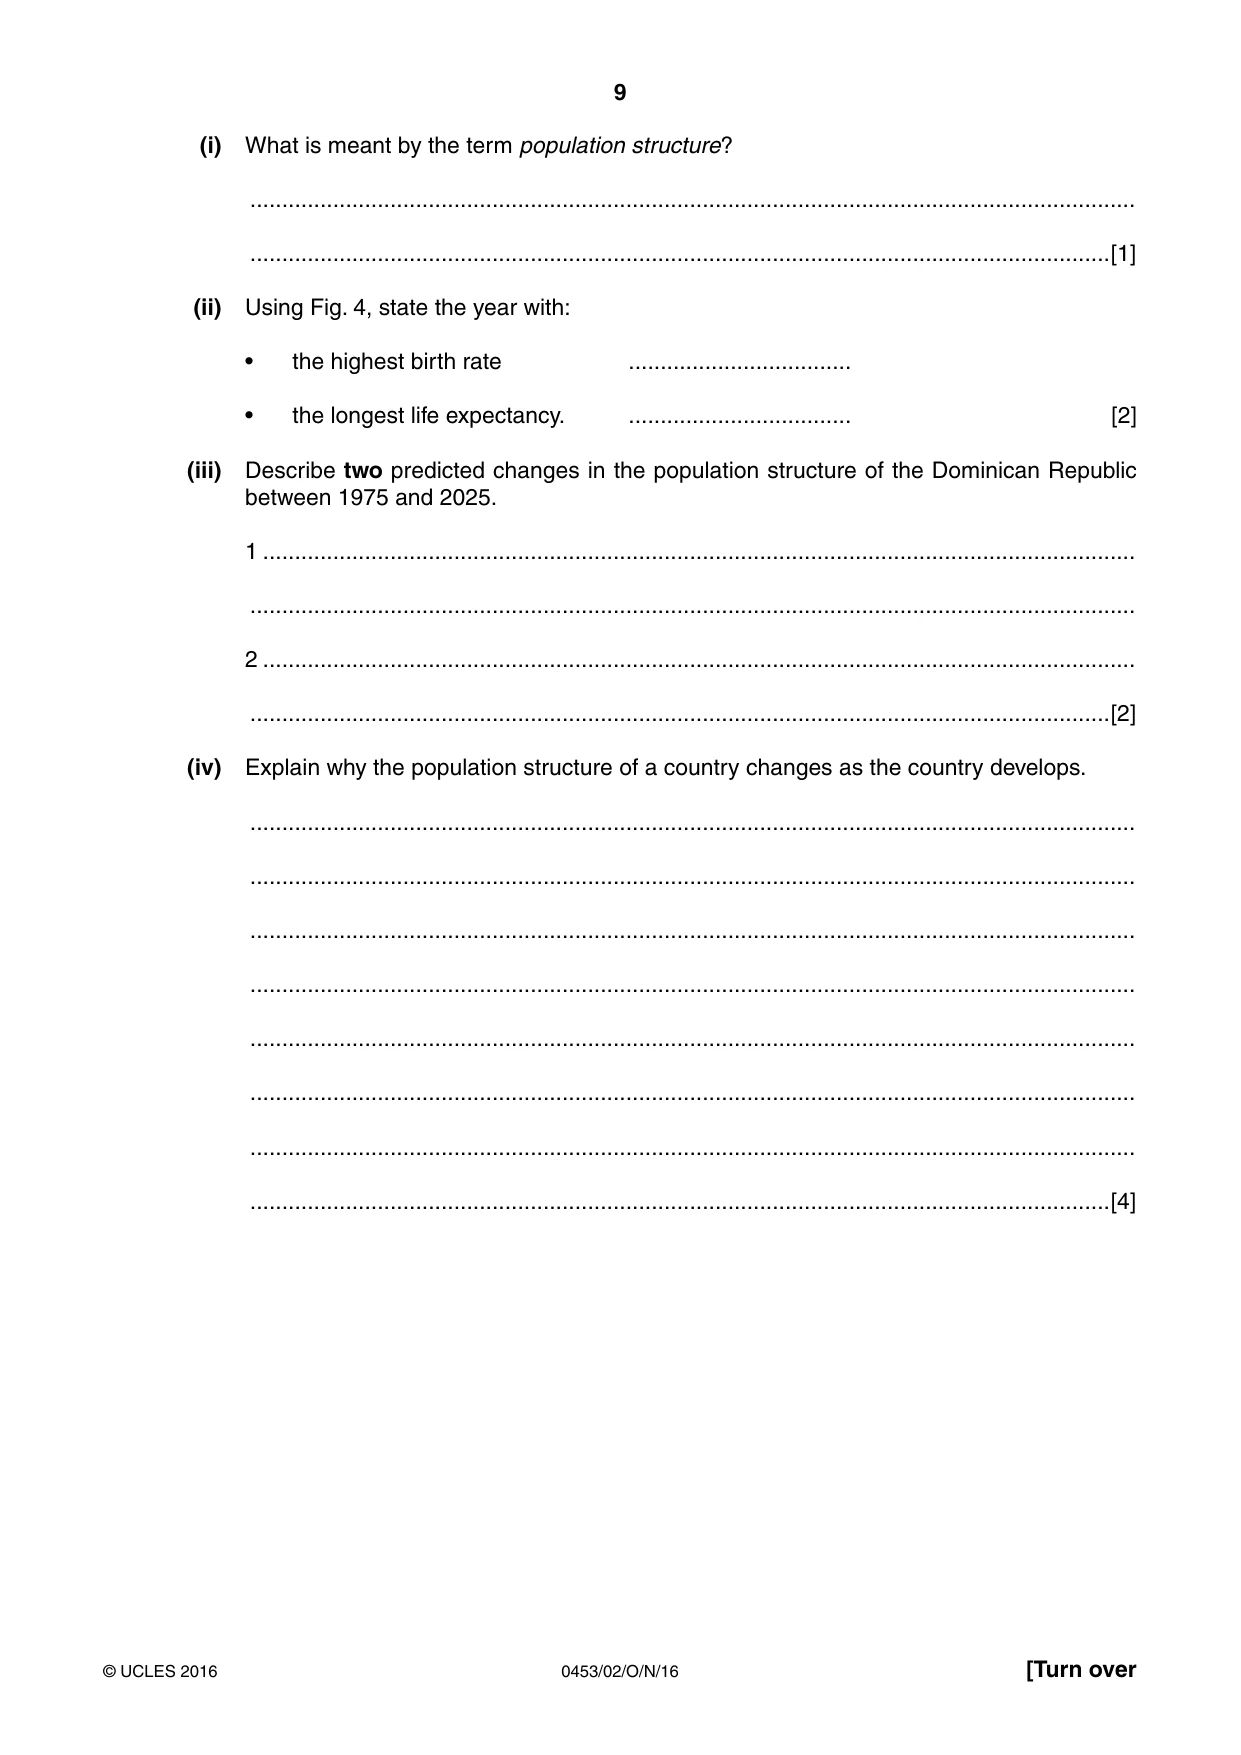
9 0453/02/O/N/16 © UCLES 2016 [Turn over (i) What is meant by the term population structure? … …[1] (ii) Using Fig. 4, state the year with: • the highest birth rate … • the longest life expectancy. … [2] (iii) Describe two predicted changes in the population structure of the Dominican Republic between 1975 and 2025. 1 … … 2 … …[2] (iv) Explain why the population structure of a country changes as the country develops. … … … … … … … …[4]
Question paper, page 10
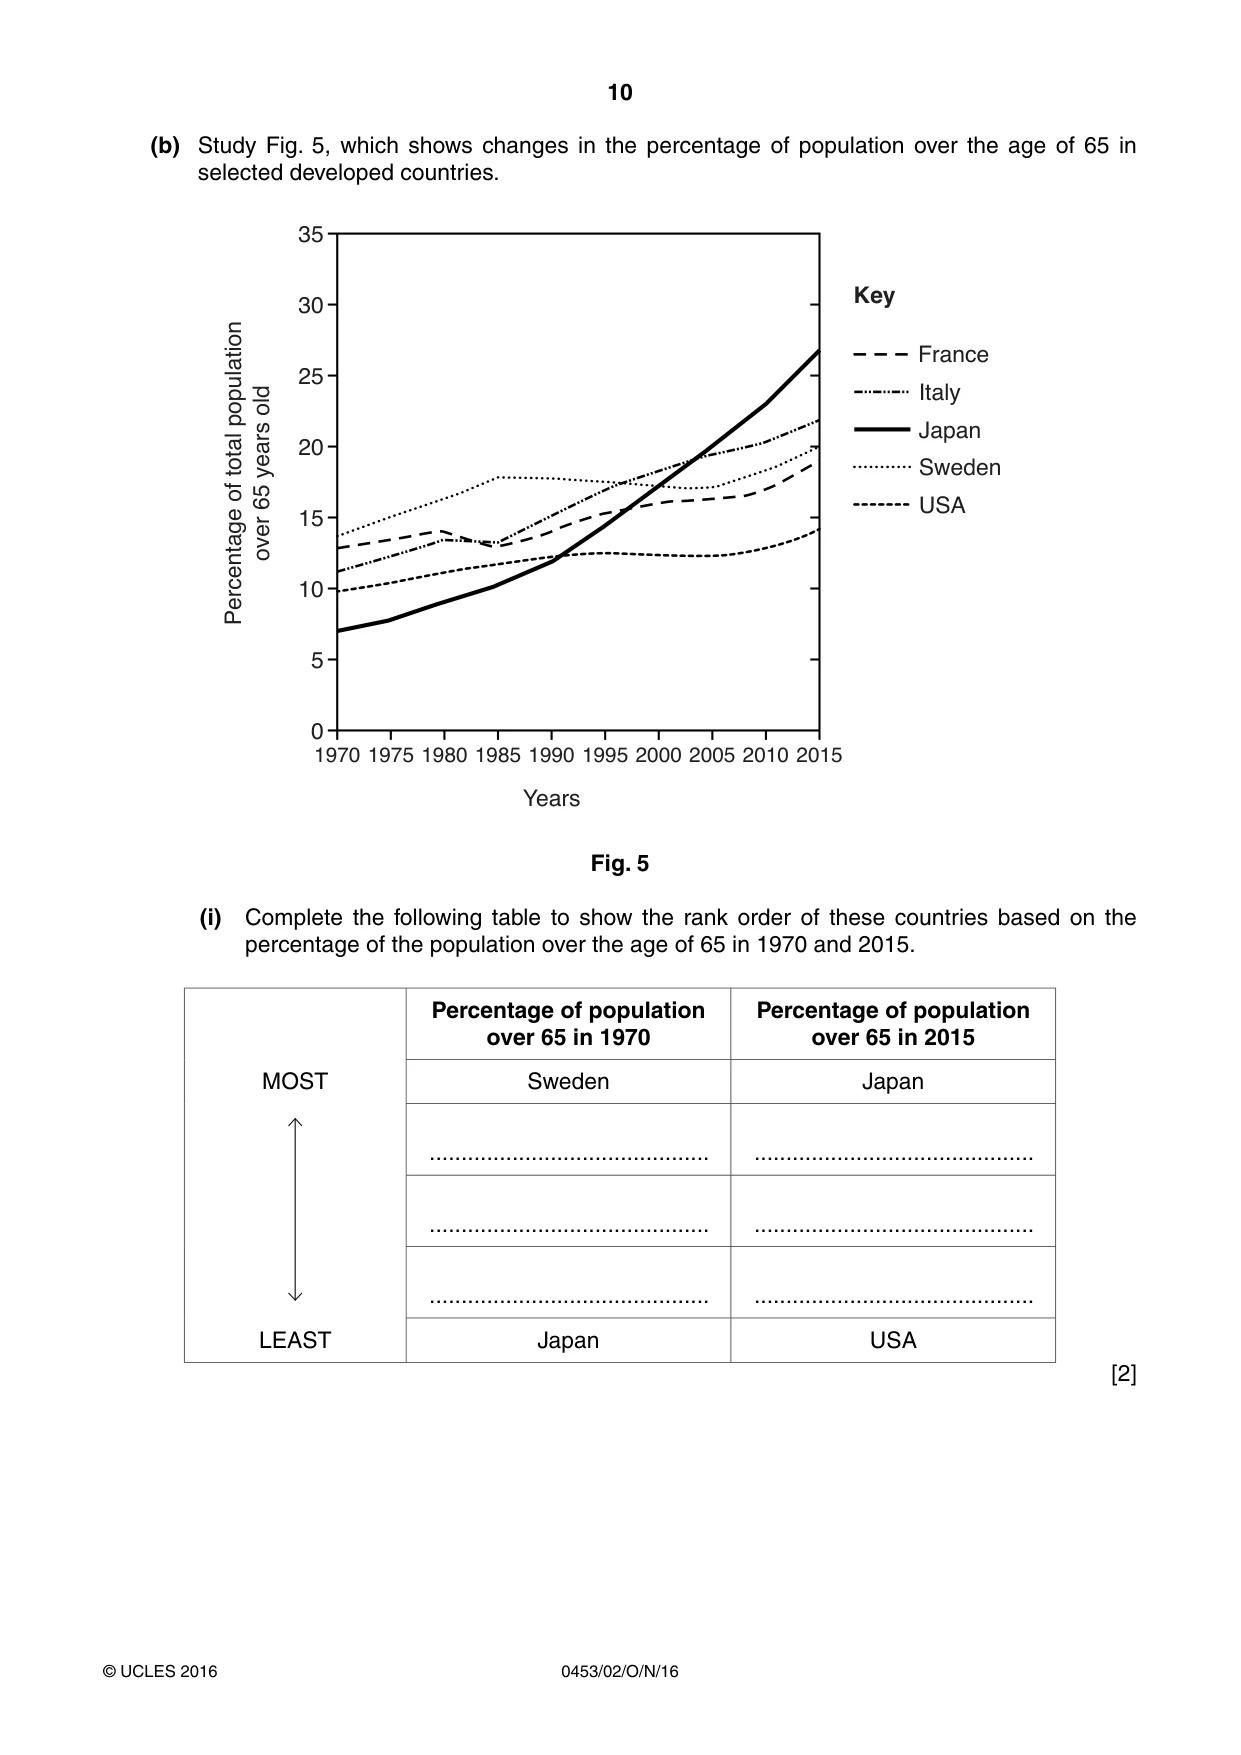
10 0453/02/O/N/16 © UCLES 2016 (b) Study Fig. 5, which shows changes in the percentage of population over the age of 65 in selected developed countries. 35 30 25 20 15 10 5 0 1970 1975 1980 1985 1990 1995 2000 2005 2010 2015 USA Sweden Italy Japan France Percentage of total population over 65 years old Years Key Fig. 5 (i) Complete the following table to show the rank order of these countries based on the percentage of the population over the age of 65 in 1970 and 2015. Percentage of population over 65 in 1970 Percentage of population over 65 in 2015 MOST Sweden Japan … … … … … … LEAST Japan USA [2]
Question paper, page 11
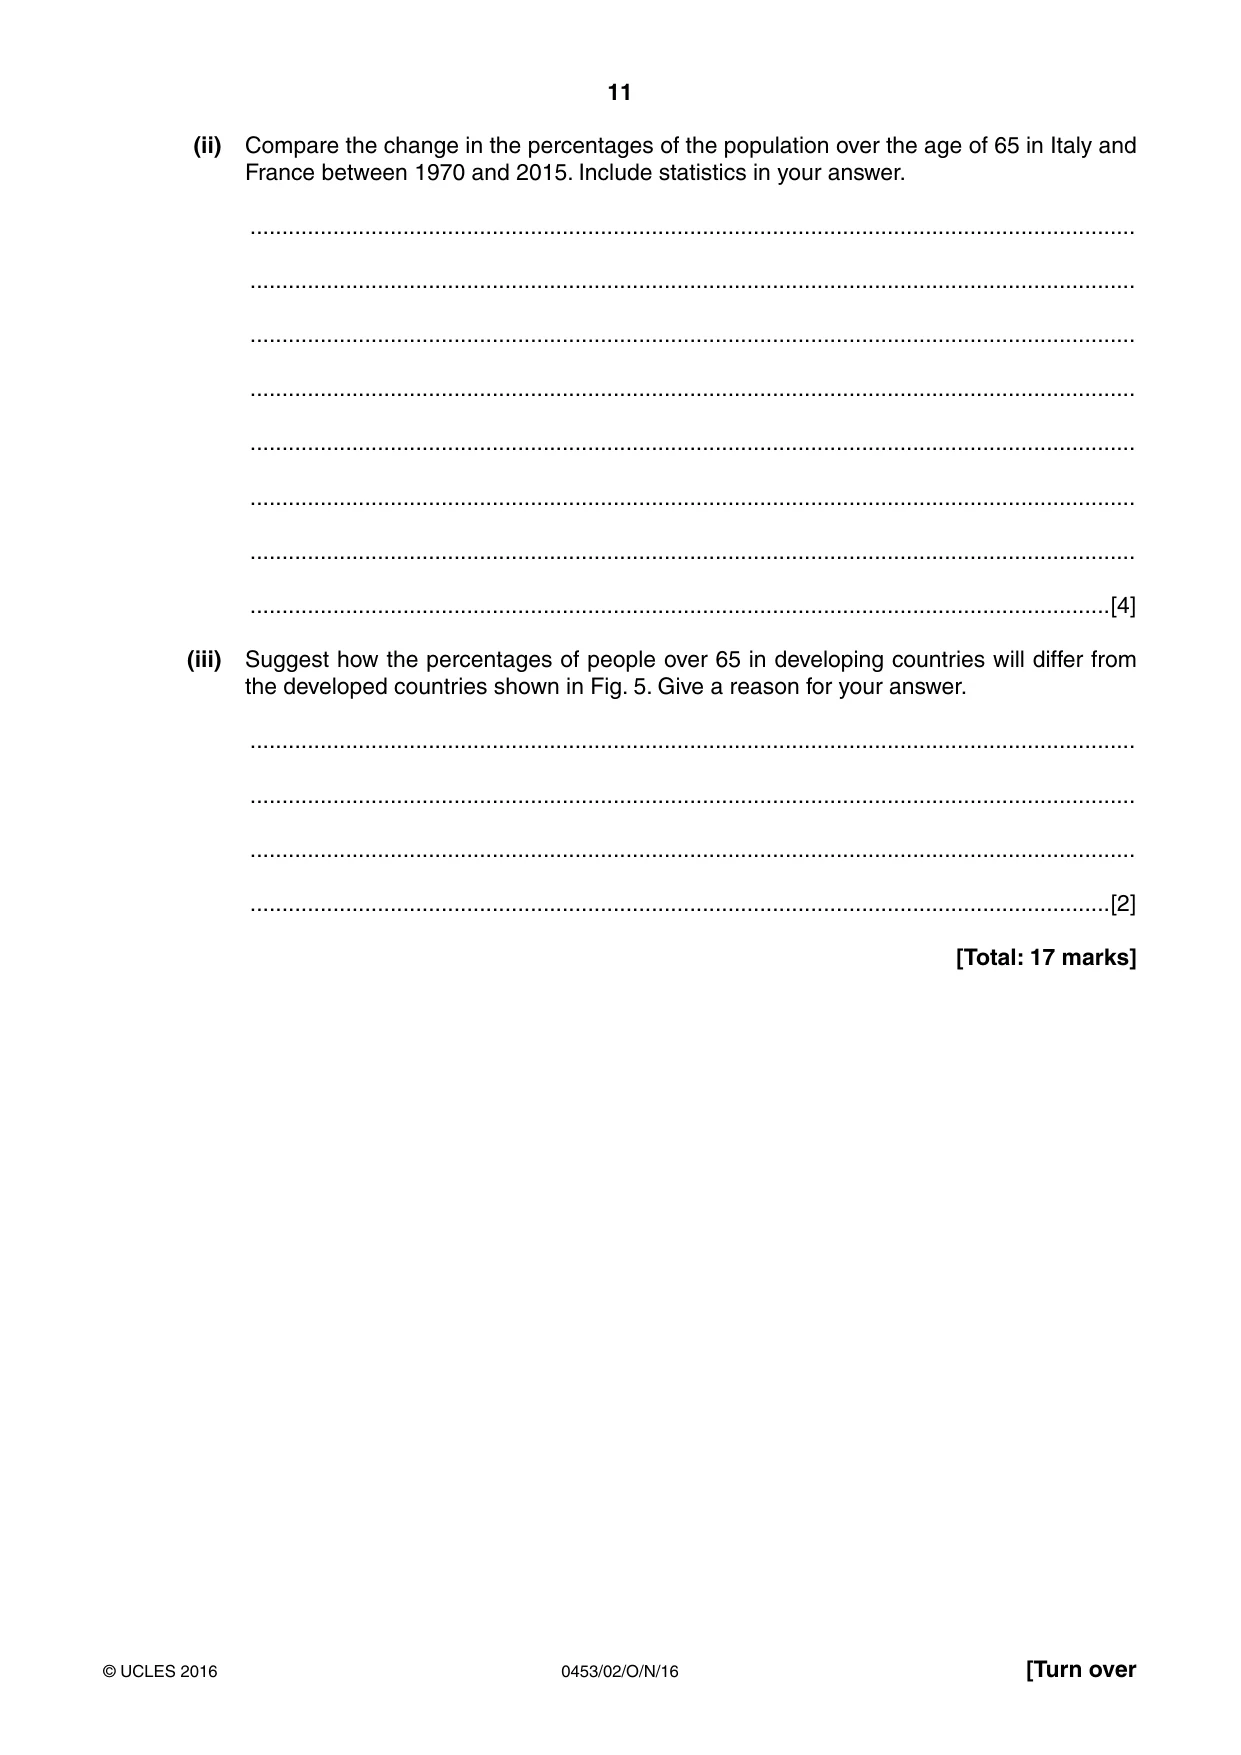
11 0453/02/O/N/16 © UCLES 2016 [Turn over (ii) Compare the change in the percentages of the population over the age of 65 in Italy and France between 1970 and 2015. Include statistics in your answer. … … … … … … … …[4] (iii) Suggest how the percentages of people over 65 in developing countries will differ from the developed countries shown in Fig. 5. Give a reason for your answer. … … … …[2] [Total: 17 marks]
Question paper, page 12
12 0453/02/O/N/16 © UCLES 2016 BLANK PAGE
Question paper, page 13
13 0453/02/O/N/16 © UCLES 2016 [Turn over 3 Study Fig. 6, which contains information about an investigation carried out by researchers at Durban University of Technology into elderly people in South Africa. The purpose of this research was to investigate the diet and health of elderly people on state pension living in Umlazi, KwaZulu-Natal, South Africa. The researcher made an announcement in the Zulu language. This was done in the community halls used as pension paypoints, a month before the study took place in order to inform the elderly about the fieldwork which would be taking place on their next pension date. Systematic sampling was used to choose a sample of 1700 from the 17 000 people in Umlazi who were aged 60 years and older and registered pensioners with the South African Social Security Agency. All the respondents had to complete a consent form to take part in the study, after listening to the researcher explaining the purpose of the study. All participation was on a voluntary basis and respondents understood that they could withdraw at any time. All respondents were given a number and no names were used during the study. The names and numbers of the respondents were kept at the Durban University of Technology and no one had access to it except for the researchers. Fig. 6 (a) (i) In which country was this research investigation carried out? …[1] (ii) The sample of 1700 elderly people was chosen using systematic sampling. Suggest how the researchers could have chosen this systematic sample. … … … …[2] (iii) Suggest why the researchers: • made an announcement in the Zulu language rather than in English … … • explained the purpose of the study … … • used numbers rather than names of participants during the study. … …[3]
Question paper, page 14
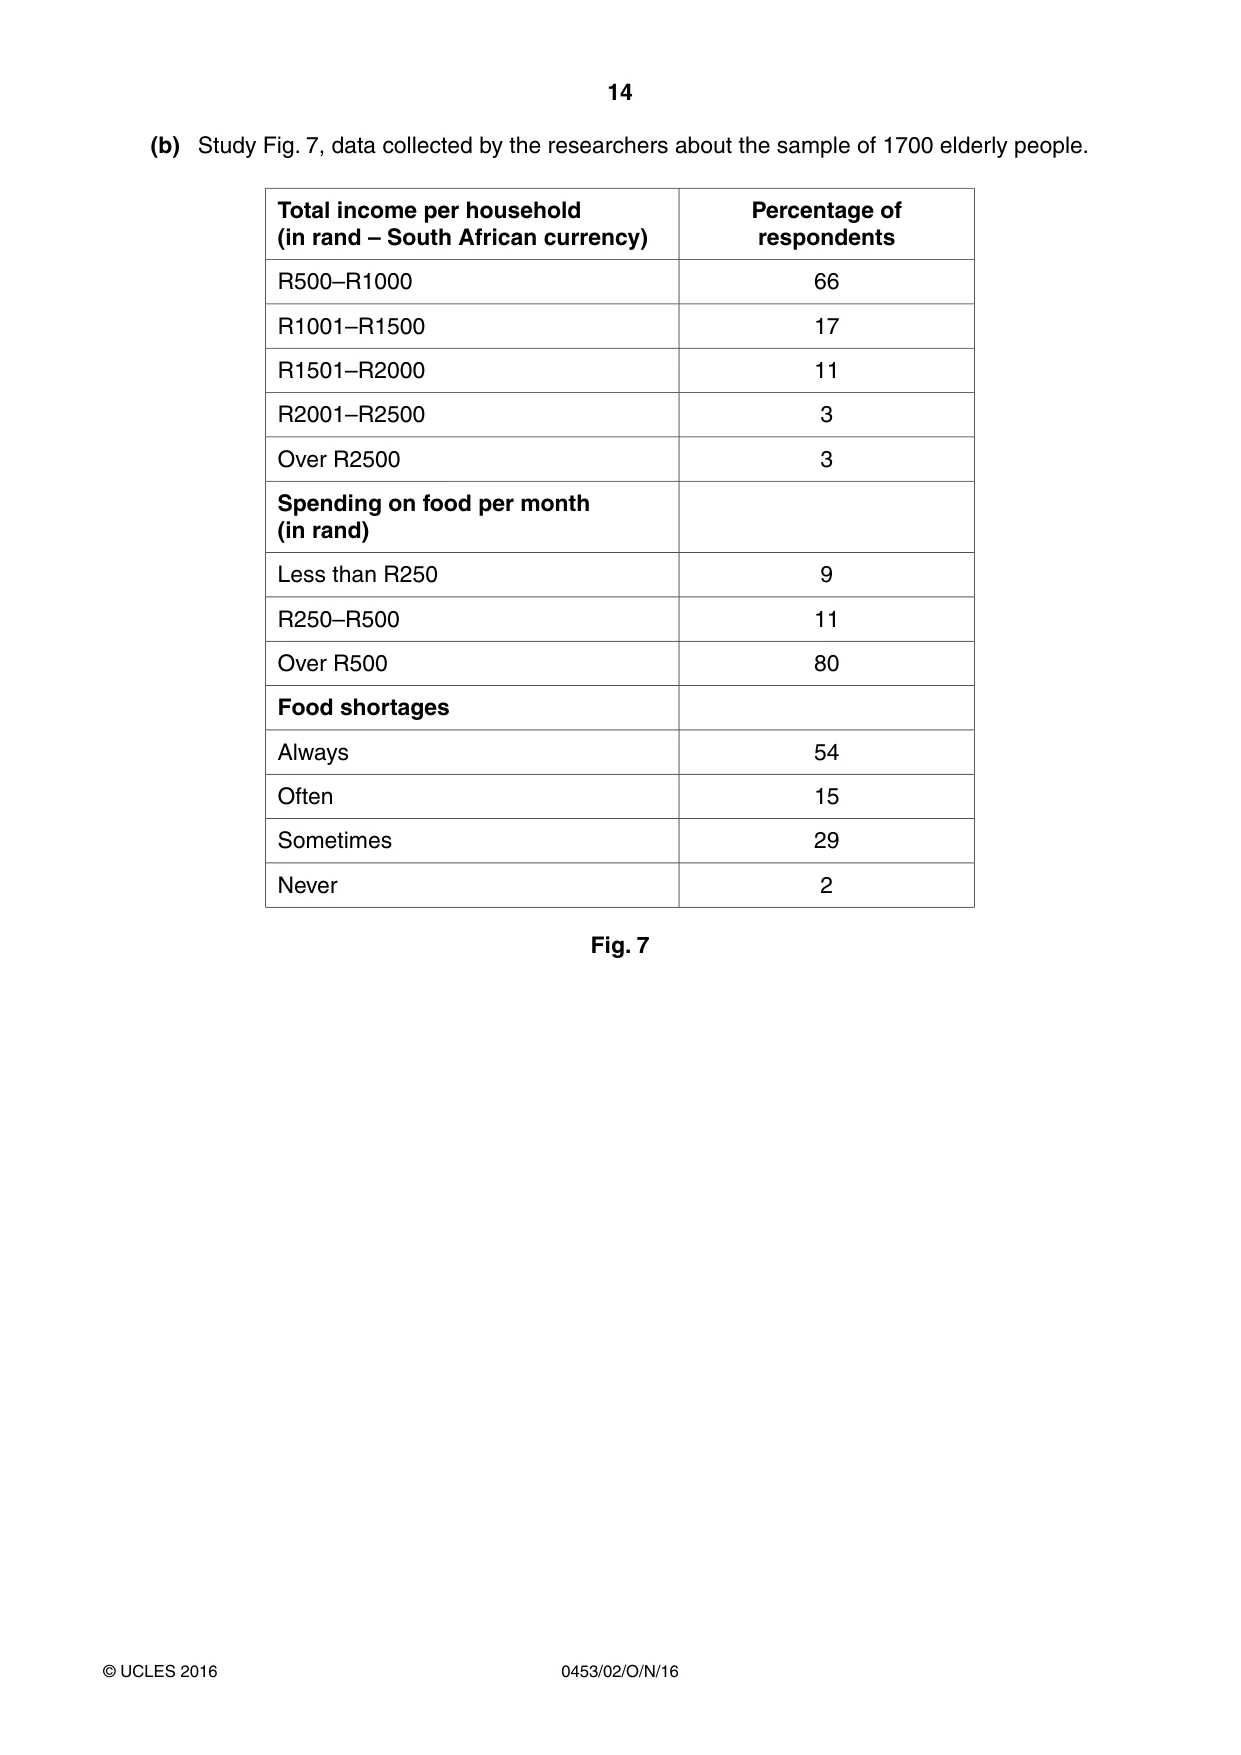
14 0453/02/O/N/16 © UCLES 2016 (b) Study Fig. 7, data collected by the researchers about the sample of 1700 elderly people. Total income per household (in rand – South African currency) Percentage of respondents R500–R1000 66 R1001–R1500 17 R1501–R2000 11 R2001–R2500 3 Over R2500 3 Spending on food per month (in rand) Less than R250 9 R250–R500 11 Over R500 80 Food shortages Always 54 Often 15 Sometimes 29 Never 2 Fig. 7
Question paper, page 15
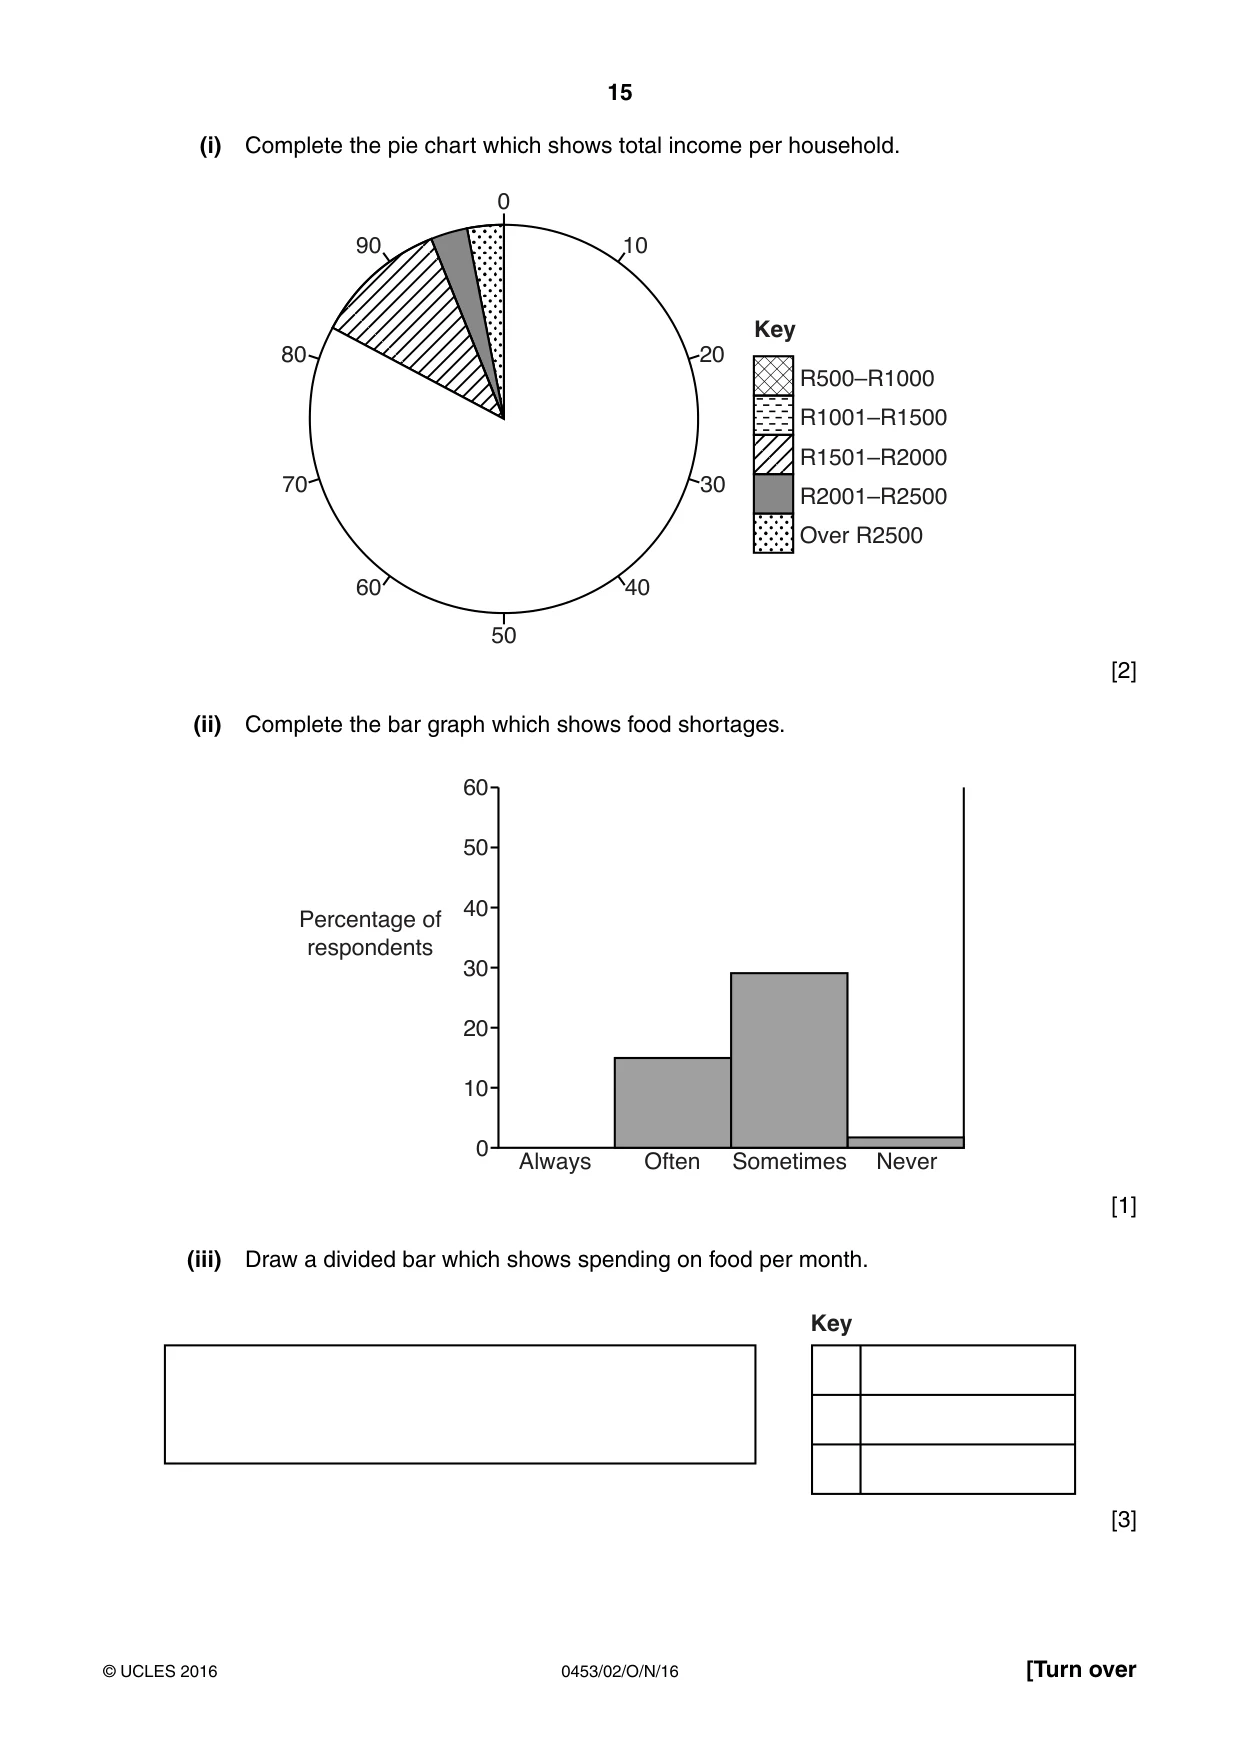
15 0453/02/O/N/16 © UCLES 2016 [Turn over (i) Complete the pie chart which shows total income per household. Key R500–R1000 R1001–R1500 R1501–R2000 R2001–R2500 Over R2500 0 10 90 40 60 20 80 30 70 50 [2] (ii) Complete the bar graph which shows food shortages. 60 50 40 30 20 10 0 Always Often Sometimes Never Percentage of respondents [1] (iii) Draw a divided bar which shows spending on food per month. Key [3]
Question paper, page 16
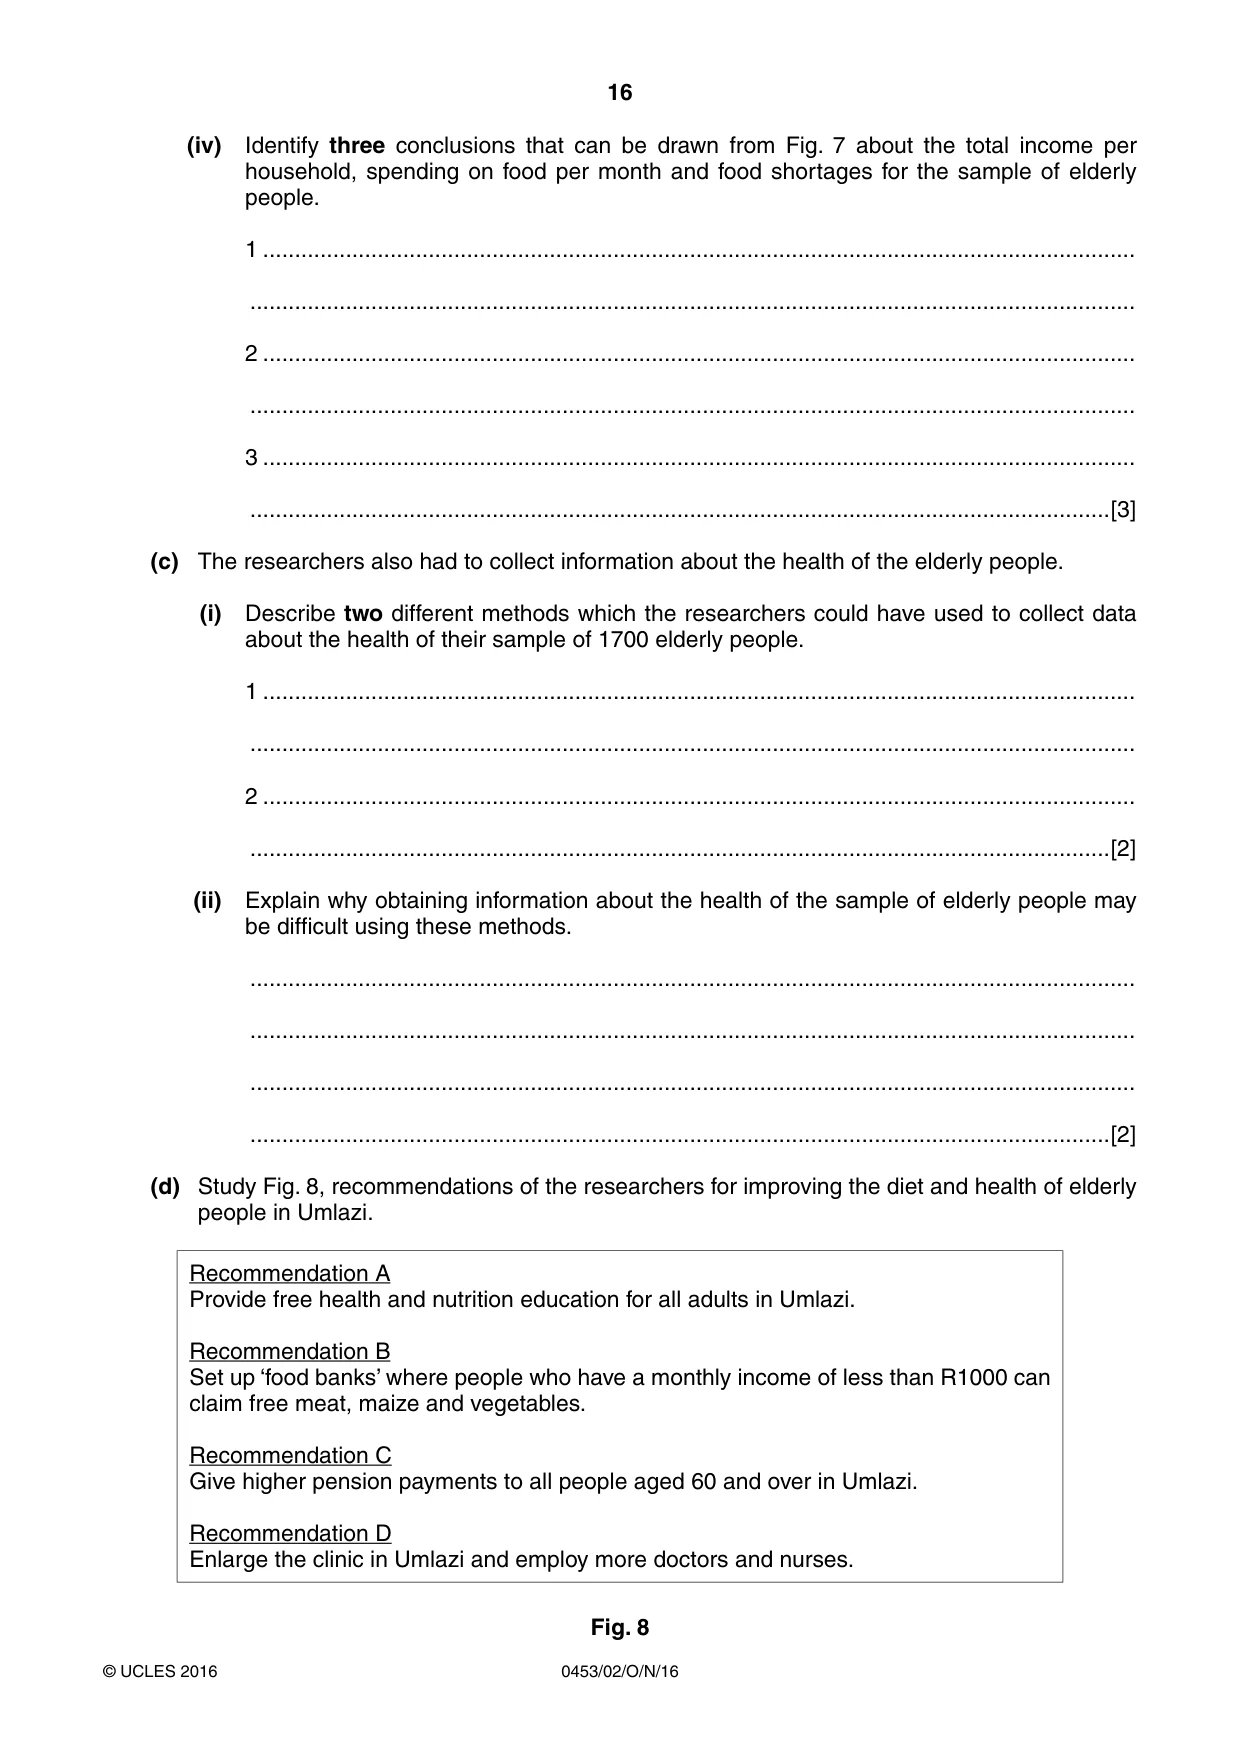
16 0453/02/O/N/16 © UCLES 2016 (iv) Identify three conclusions that can be drawn from Fig. 7 about the total income per household, spending on food per month and food shortages for the sample of elderly people. 1 … … 2 … … 3 … …[3] (c) The researchers also had to collect information about the health of the elderly people. (i) Describe two different methods which the researchers could have used to collect data about the health of their sample of 1700 elderly people. 1 … … 2 … …[2] (ii) Explain why obtaining information about the health of the sample of elderly people may be difficult using these methods. … … … …[2] (d) Study Fig. 8, recommendations of the researchers for improving the diet and health of elderly people in Umlazi. Recommendation A Provide free health and nutrition education for all adults in Umlazi. Recommendation B Set up ‘food banks’ where people who have a monthly income of less than R1000 can claim free meat, maize and vegetables. Recommendation C Give higher pension payments to all people aged 60 and over in Umlazi. Recommendation D Enlarge the clinic in Umlazi and employ more doctors and nurses. Fig. 8
Question paper, page 17
17 0453/02/O/N/16 © UCLES 2016 [Turn over (i) Choose the recommendation listed in Fig. 8 which you think will be most likely to improve both the diet and health of elderly people in Umlazi. Explain your reasons for choosing this recommendation. You should do this by describing the advantages of the recommendation you have chosen and the disadvantages of the recommendations you have rejected. Recommendation chosen: … … … … … … … … … … … … … … … … … …[6]
Question paper, page 18
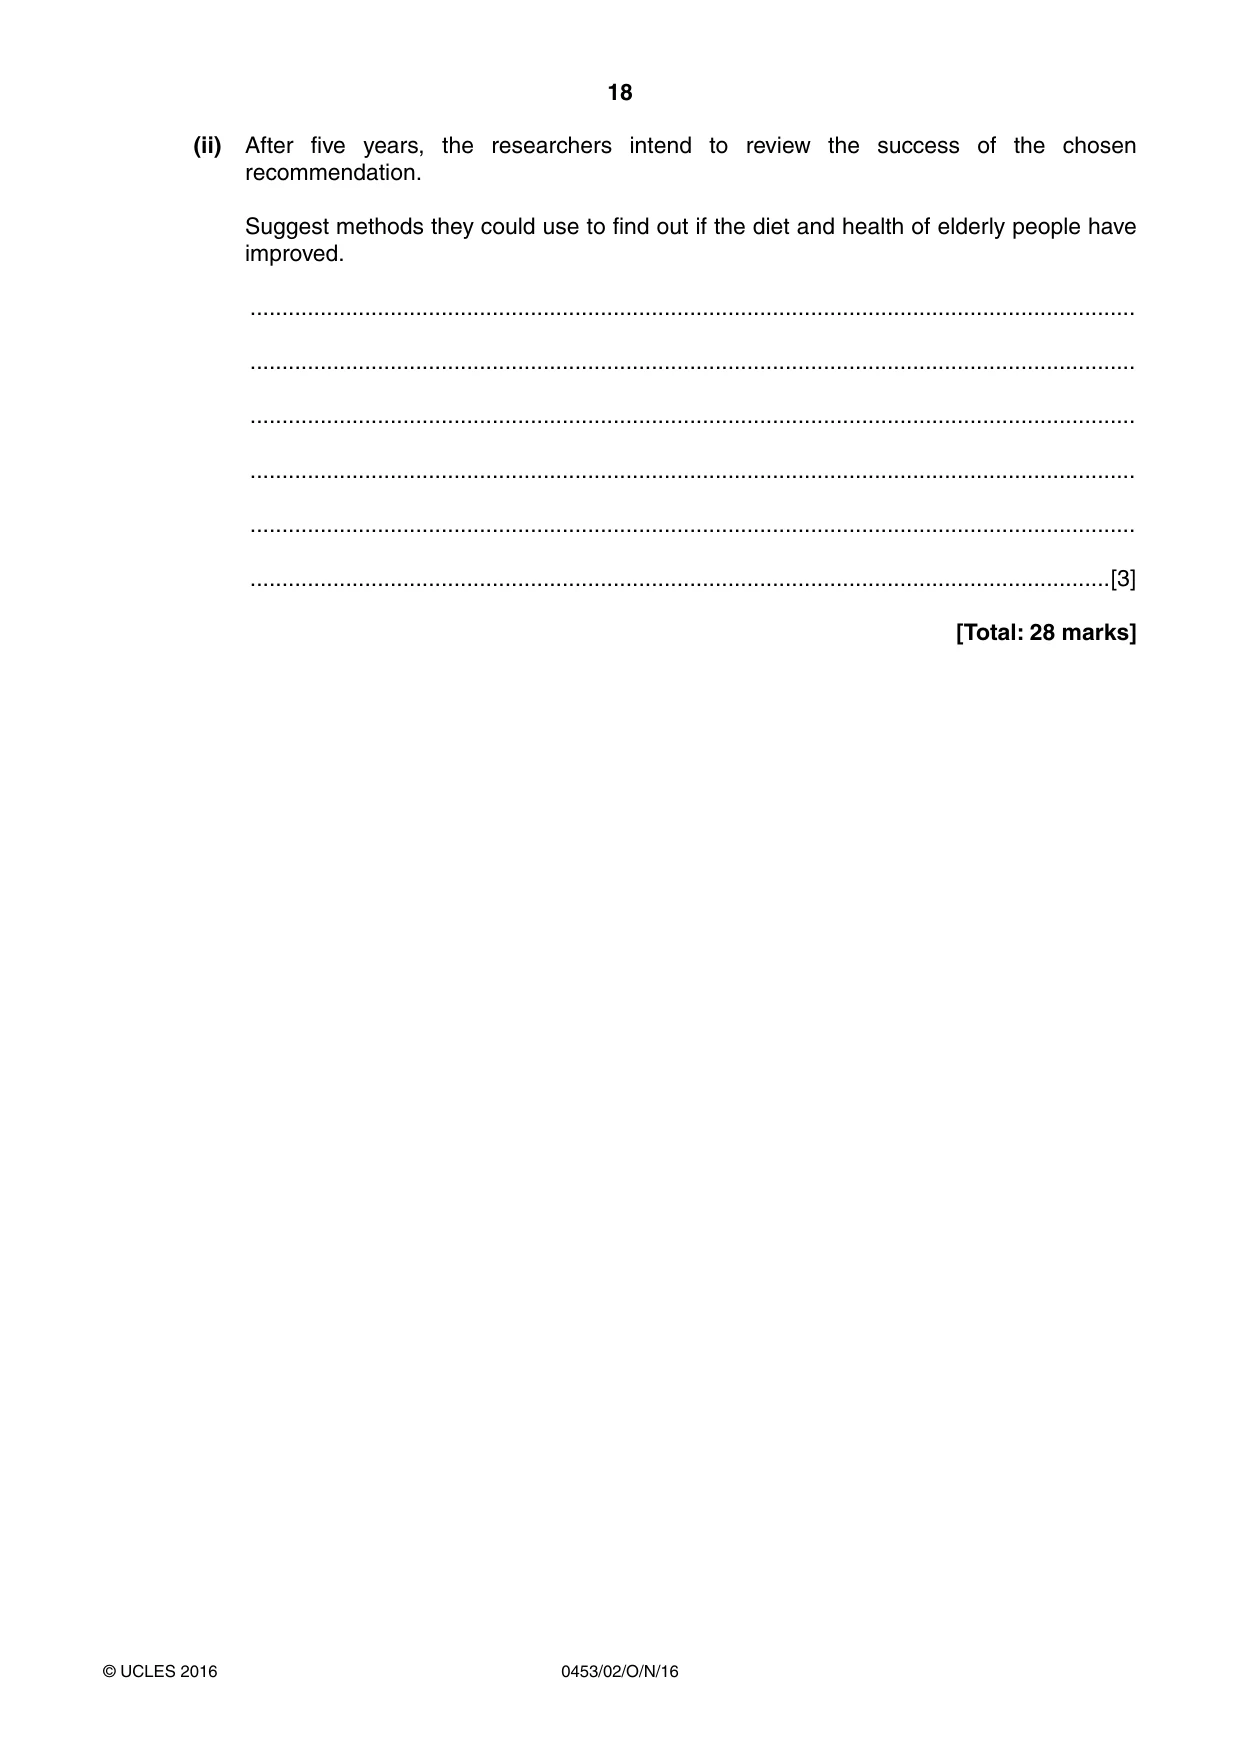
18 0453/02/O/N/16 © UCLES 2016 (ii) After five years, the researchers intend to review the success of the chosen recommendation. Suggest methods they could use to find out if the diet and health of elderly people have improved. … … … … … …[3] [Total: 28 marks]
Question paper, page 19
19 0453/02/O/N/16 © UCLES 2016 BLANK PAGE
Question paper, page 20
20 0453/02/O/N/16 © UCLES 2016 Permission to reproduce items where third-party owned material protected by copyright is included has been sought and cleared where possible. Every reasonable effort has been made by the publisher (UCLES) to trace copyright holders, but if any items requiring clearance have unwittingly been included, the publisher will be pleased to make amends at the earliest possible opportunity. To avoid the issue of disclosure of answer-related information to candidates, all copyright acknowledgements are reproduced online in the Cambridge International Examinations Copyright Acknowledgements Booklet. This is produced for each series of examinations and is freely available to download at www.cie.org.uk after the live examination series. Cambridge International Examinations is part of the Cambridge Assessment Group. Cambridge Assessment is the brand name of University of Cambridge Local Examinations Syndicate (UCLES), which is itself a department of the University of Cambridge. BLANK PAGE
Mark scheme, page 1
® IGCSE is the registered trademark of Cambridge International Examinations. This document consists of 9 printed pages. © UCLES 2016 [Turn over Cambridge International Examinations Cambridge International General Certificate of Secondary Education DEVELOPMENT STUDIES 0453/02 Paper 2 October/November 2016 MARK SCHEME Maximum Mark: 80 Published This mark scheme is published as an aid to teachers and candidates, to indicate the requirements of the examination. It shows the basis on which Examiners were instructed to award marks. It does not indicate the details of the discussions that took place at an Examiners’ meeting before marking began, which would have considered the acceptability of alternative answers. Mark schemes should be read in conjunction with the question paper and the Principal Examiner Report for Teachers. Cambridge will not enter into discussions about these mark schemes. Cambridge is publishing the mark schemes for the October/November 2016 series for most Cambridge IGCSE®, Cambridge International A and AS Level components and some Cambridge O Level components.
Mark scheme, page 2
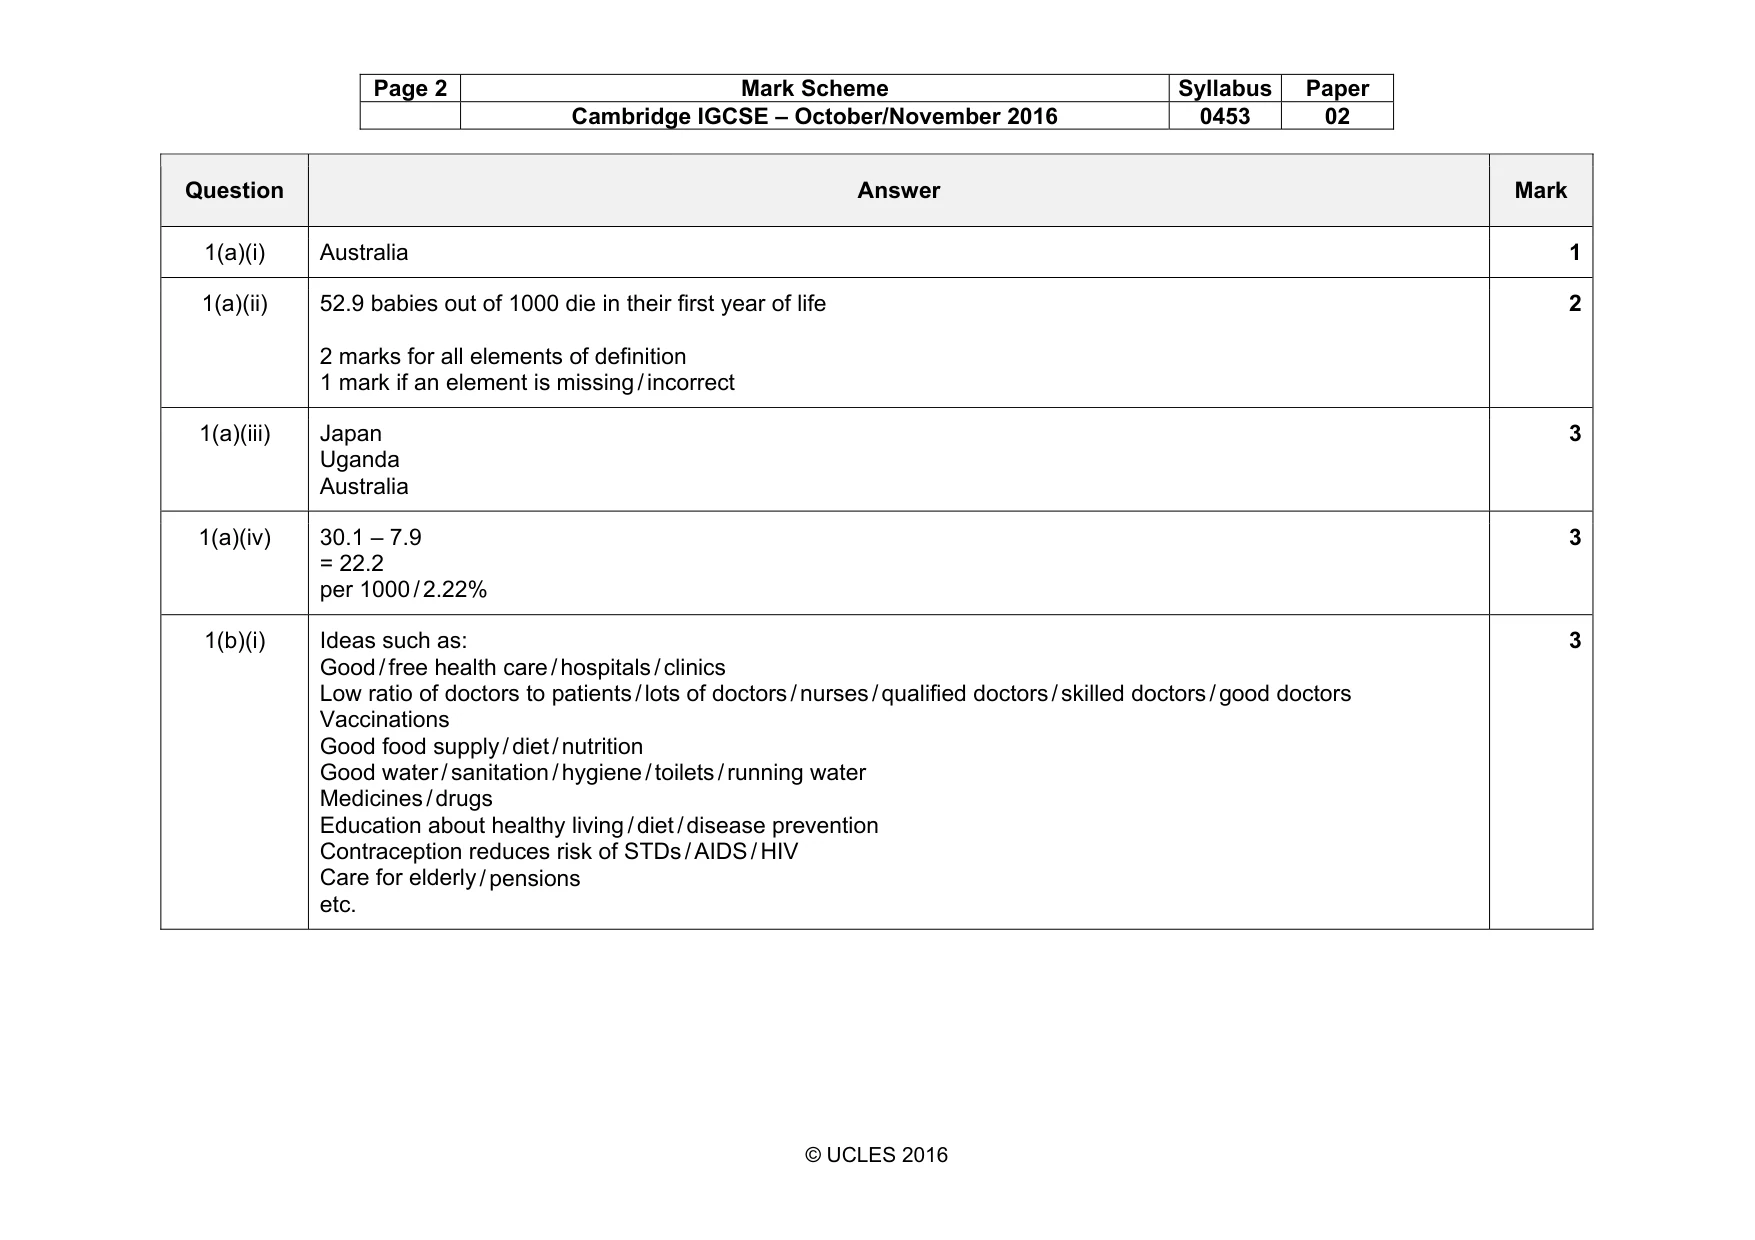
Page 2 Mark Scheme Syllabus Paper Cambridge IGCSE – October/November 2016 0453 02 © UCLES 2016 Question Answer Mark 1(a)(i) Australia 1 1(a)(ii) 52.9 babies out of 1000 die in their first year of life 2 marks for all elements of definition 1 mark if an element is missing / incorrect 2 1(a)(iii) Japan Uganda Australia 3 1(a)(iv) 30.1 – 7.9 = 22.2 per 1000 / 2.22% 3 1(b)(i) Ideas such as: Good / free health care / hospitals / clinics Low ratio of doctors to patients / lots of doctors / nurses / qualified doctors / skilled doctors / good doctors Vaccinations Good food supply / diet / nutrition Good water / sanitation / hygiene / toilets / running water Medicines / drugs Education about healthy living / diet / disease prevention Contraception reduces risk of STDs / AIDS / HIV Care for elderly / pensions etc. 3
Mark scheme, page 3
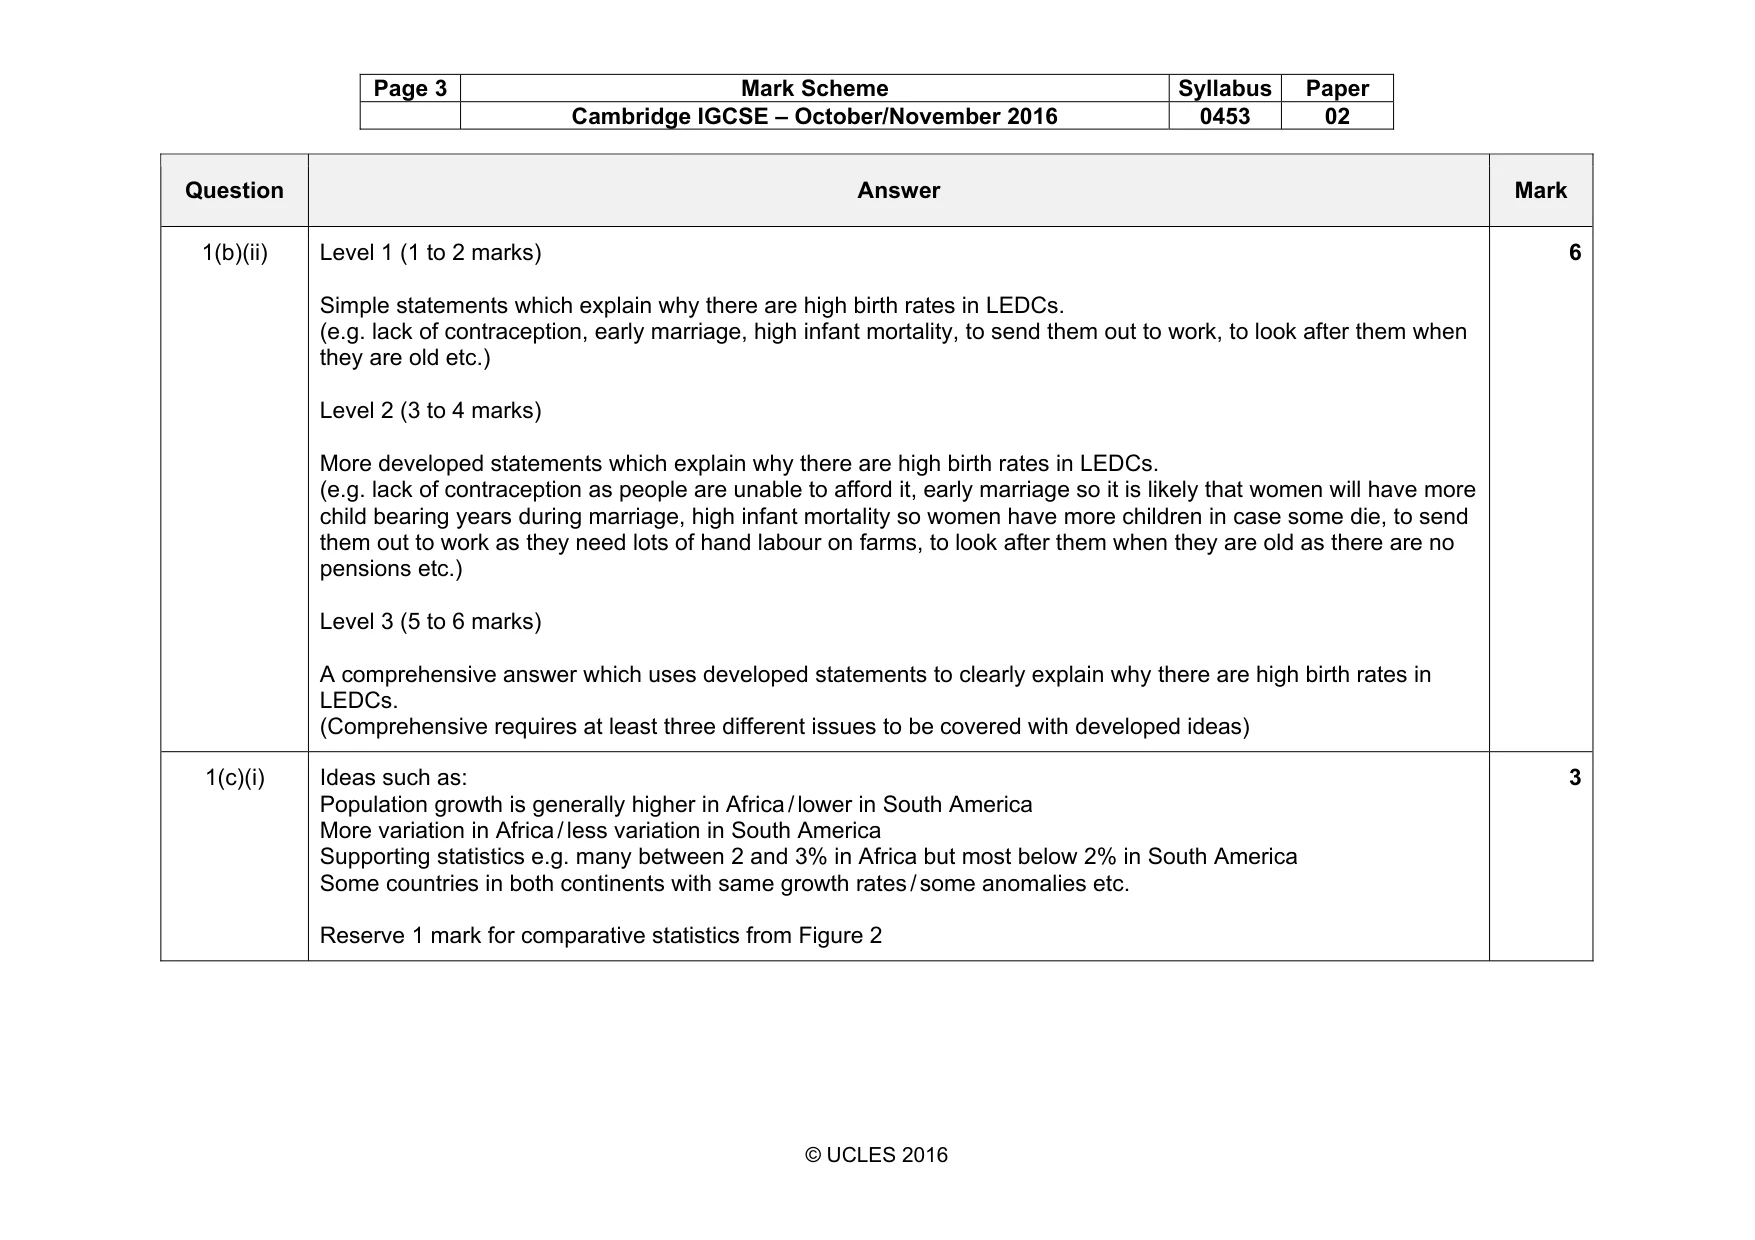
Page 3 Mark Scheme Syllabus Paper Cambridge IGCSE – October/November 2016 0453 02 © UCLES 2016 Question Answer Mark 1(b)(ii) Level 1 (1 to 2 marks) Simple statements which explain why there are high birth rates in LEDCs. (e.g. lack of contraception, early marriage, high infant mortality, to send them out to work, to look after them when they are old etc.) Level 2 (3 to 4 marks) More developed statements which explain why there are high birth rates in LEDCs. (e.g. lack of contraception as people are unable to afford it, early marriage so it is likely that women will have more child bearing years during marriage, high infant mortality so women have more children in case some die, to send them out to work as they need lots of hand labour on farms, to look after them when they are old as there are no pensions etc.) Level 3 (5 to 6 marks) A comprehensive answer which uses developed statements to clearly explain why there are high birth rates in LEDCs. (Comprehensive requires at least three different issues to be covered with developed ideas) 6 1(c)(i) Ideas such as: Population growth is generally higher in Africa / lower in South America More variation in Africa / less variation in South America Supporting statistics e.g. many between 2 and 3% in Africa but most below 2% in South America Some countries in both continents with same growth rates / some anomalies etc. Reserve 1 mark for comparative statistics from Figure 2 3
Mark scheme, page 4
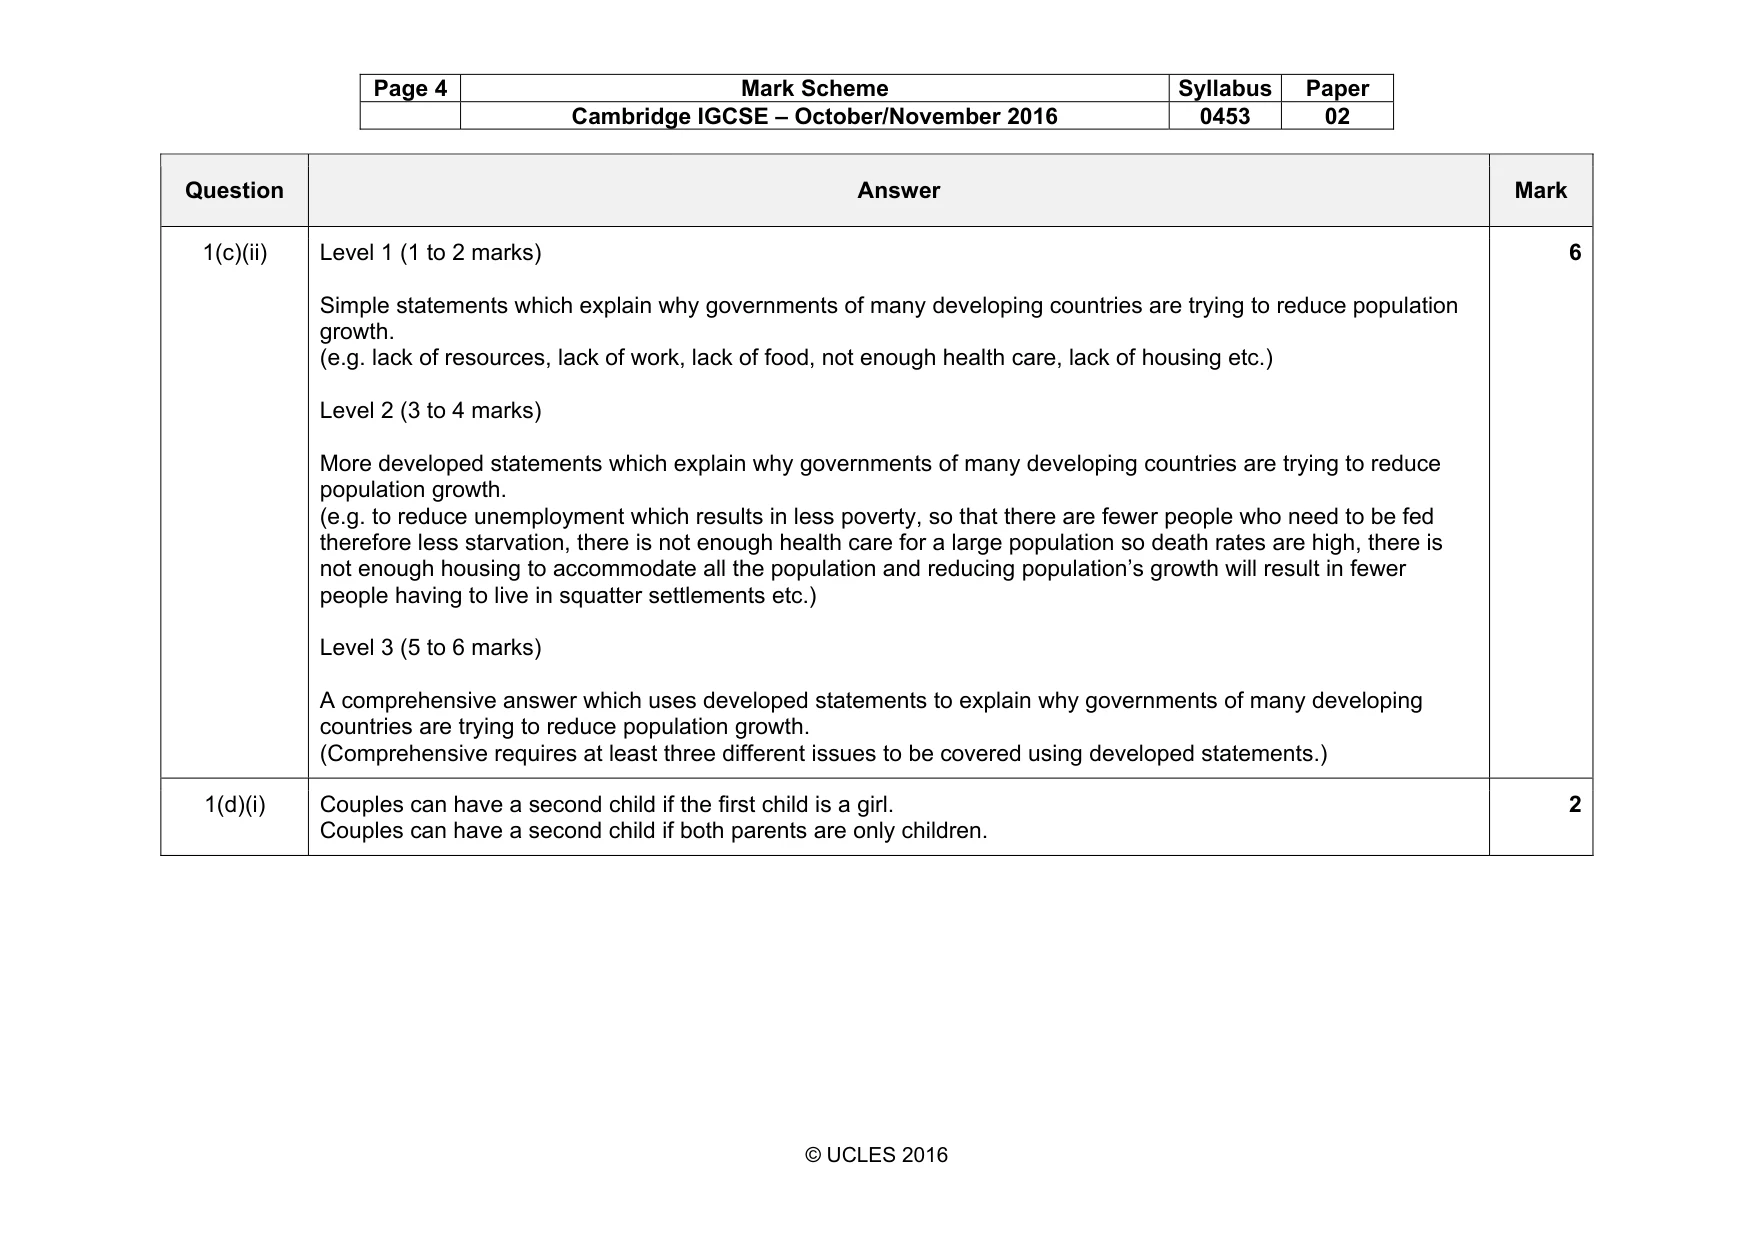
Page 4 Mark Scheme Syllabus Paper Cambridge IGCSE – October/November 2016 0453 02 © UCLES 2016 Question Answer Mark 1(c)(ii) Level 1 (1 to 2 marks) Simple statements which explain why governments of many developing countries are trying to reduce population growth. (e.g. lack of resources, lack of work, lack of food, not enough health care, lack of housing etc.) Level 2 (3 to 4 marks) More developed statements which explain why governments of many developing countries are trying to reduce population growth. (e.g. to reduce unemployment which results in less poverty, so that there are fewer people who need to be fed therefore less starvation, there is not enough health care for a large population so death rates are high, there is not enough housing to accommodate all the population and reducing population’s growth will result in fewer people having to live in squatter settlements etc.) Level 3 (5 to 6 marks) A comprehensive answer which uses developed statements to explain why governments of many developing countries are trying to reduce population growth. (Comprehensive requires at least three different issues to be covered using developed statements.) 6 1(d)(i) Couples can have a second child if the first child is a girl. Couples can have a second child if both parents are only children. 2
Mark scheme, page 5
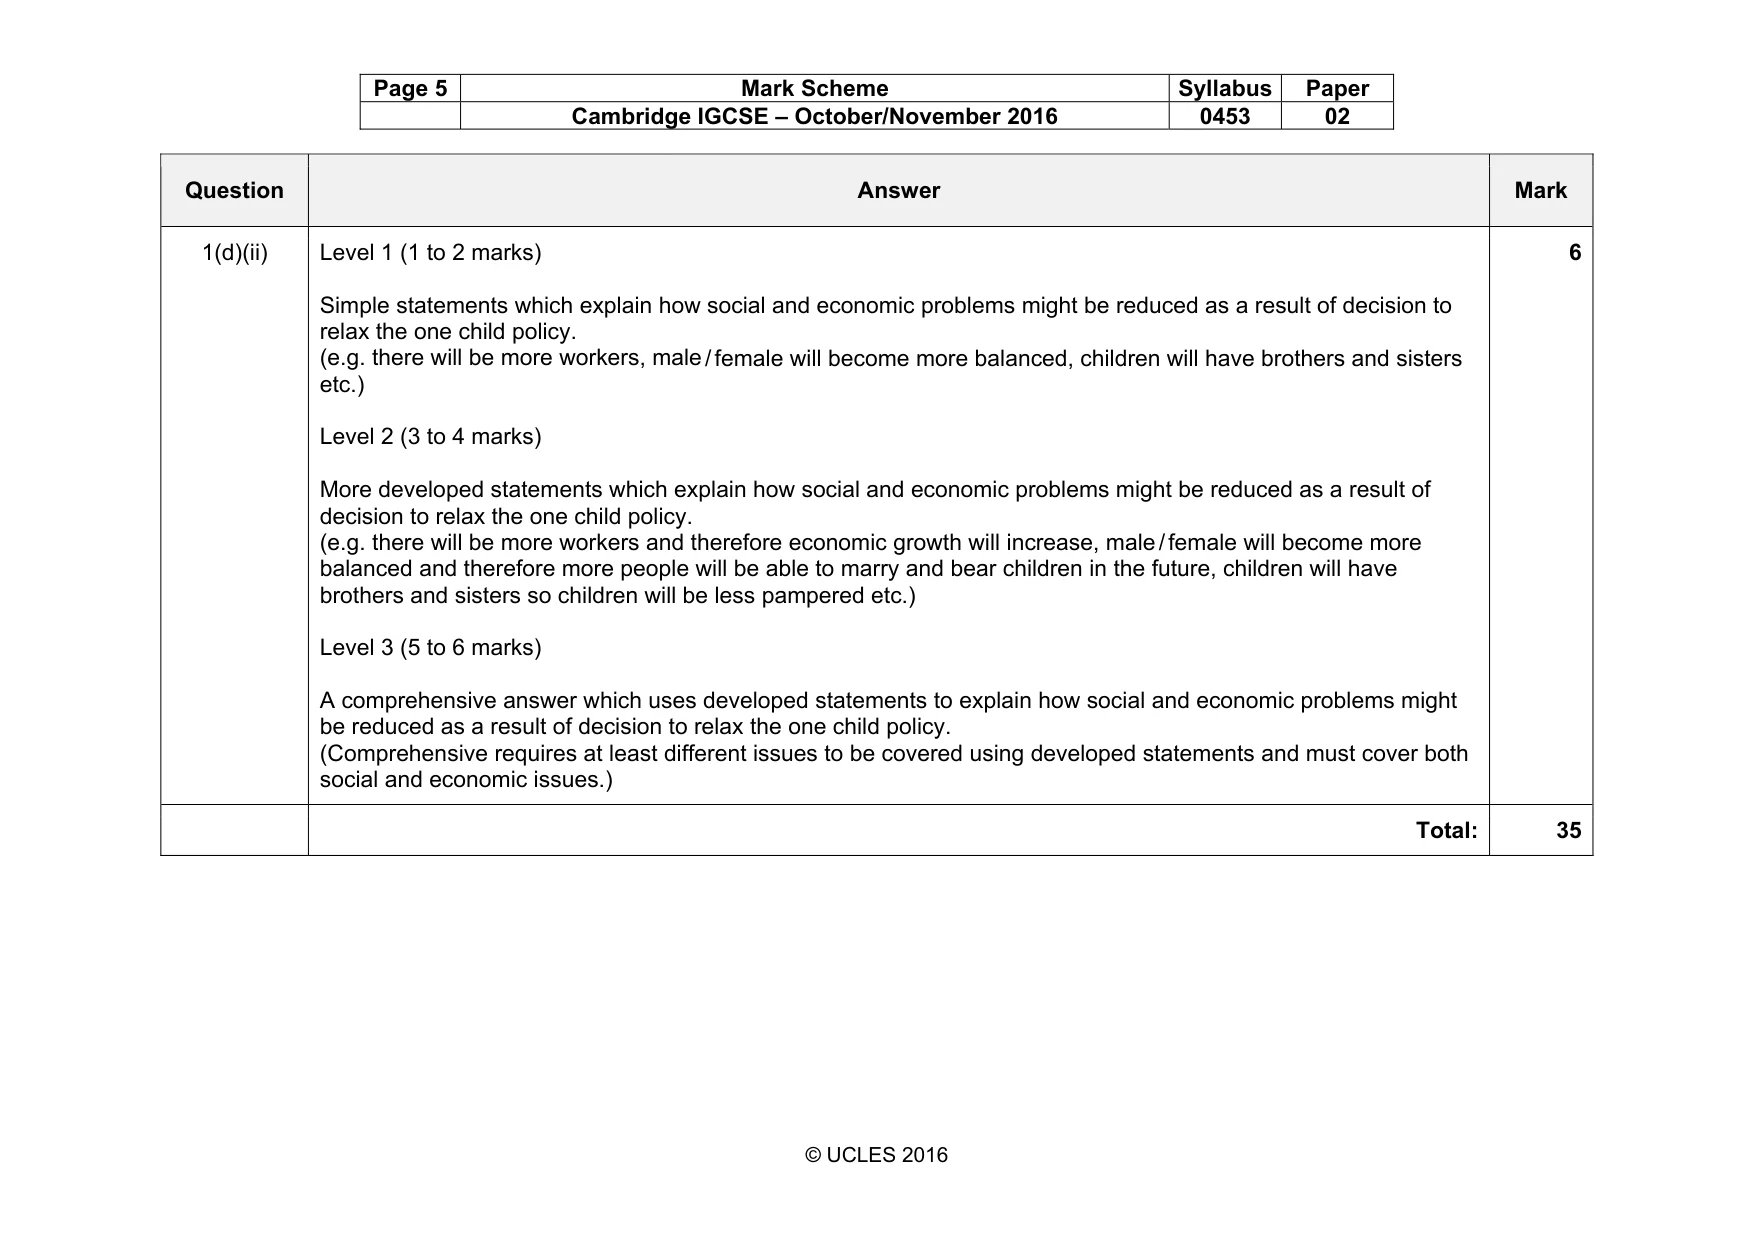
Page 5 Mark Scheme Syllabus Paper Cambridge IGCSE – October/November 2016 0453 02 © UCLES 2016 Question Answer Mark 1(d)(ii) Level 1 (1 to 2 marks) Simple statements which explain how social and economic problems might be reduced as a result of decision to relax the one child policy. (e.g. there will be more workers, male / female will become more balanced, children will have brothers and sisters etc.) Level 2 (3 to 4 marks) More developed statements which explain how social and economic problems might be reduced as a result of decision to relax the one child policy. (e.g. there will be more workers and therefore economic growth will increase, male / female will become more balanced and therefore more people will be able to marry and bear children in the future, children will have brothers and sisters so children will be less pampered etc.) Level 3 (5 to 6 marks) A comprehensive answer which uses developed statements to explain how social and economic problems might be reduced as a result of decision to relax the one child policy. (Comprehensive requires at least different issues to be covered using developed statements and must cover both social and economic issues.) 6 Total: 35
Mark scheme, page 6
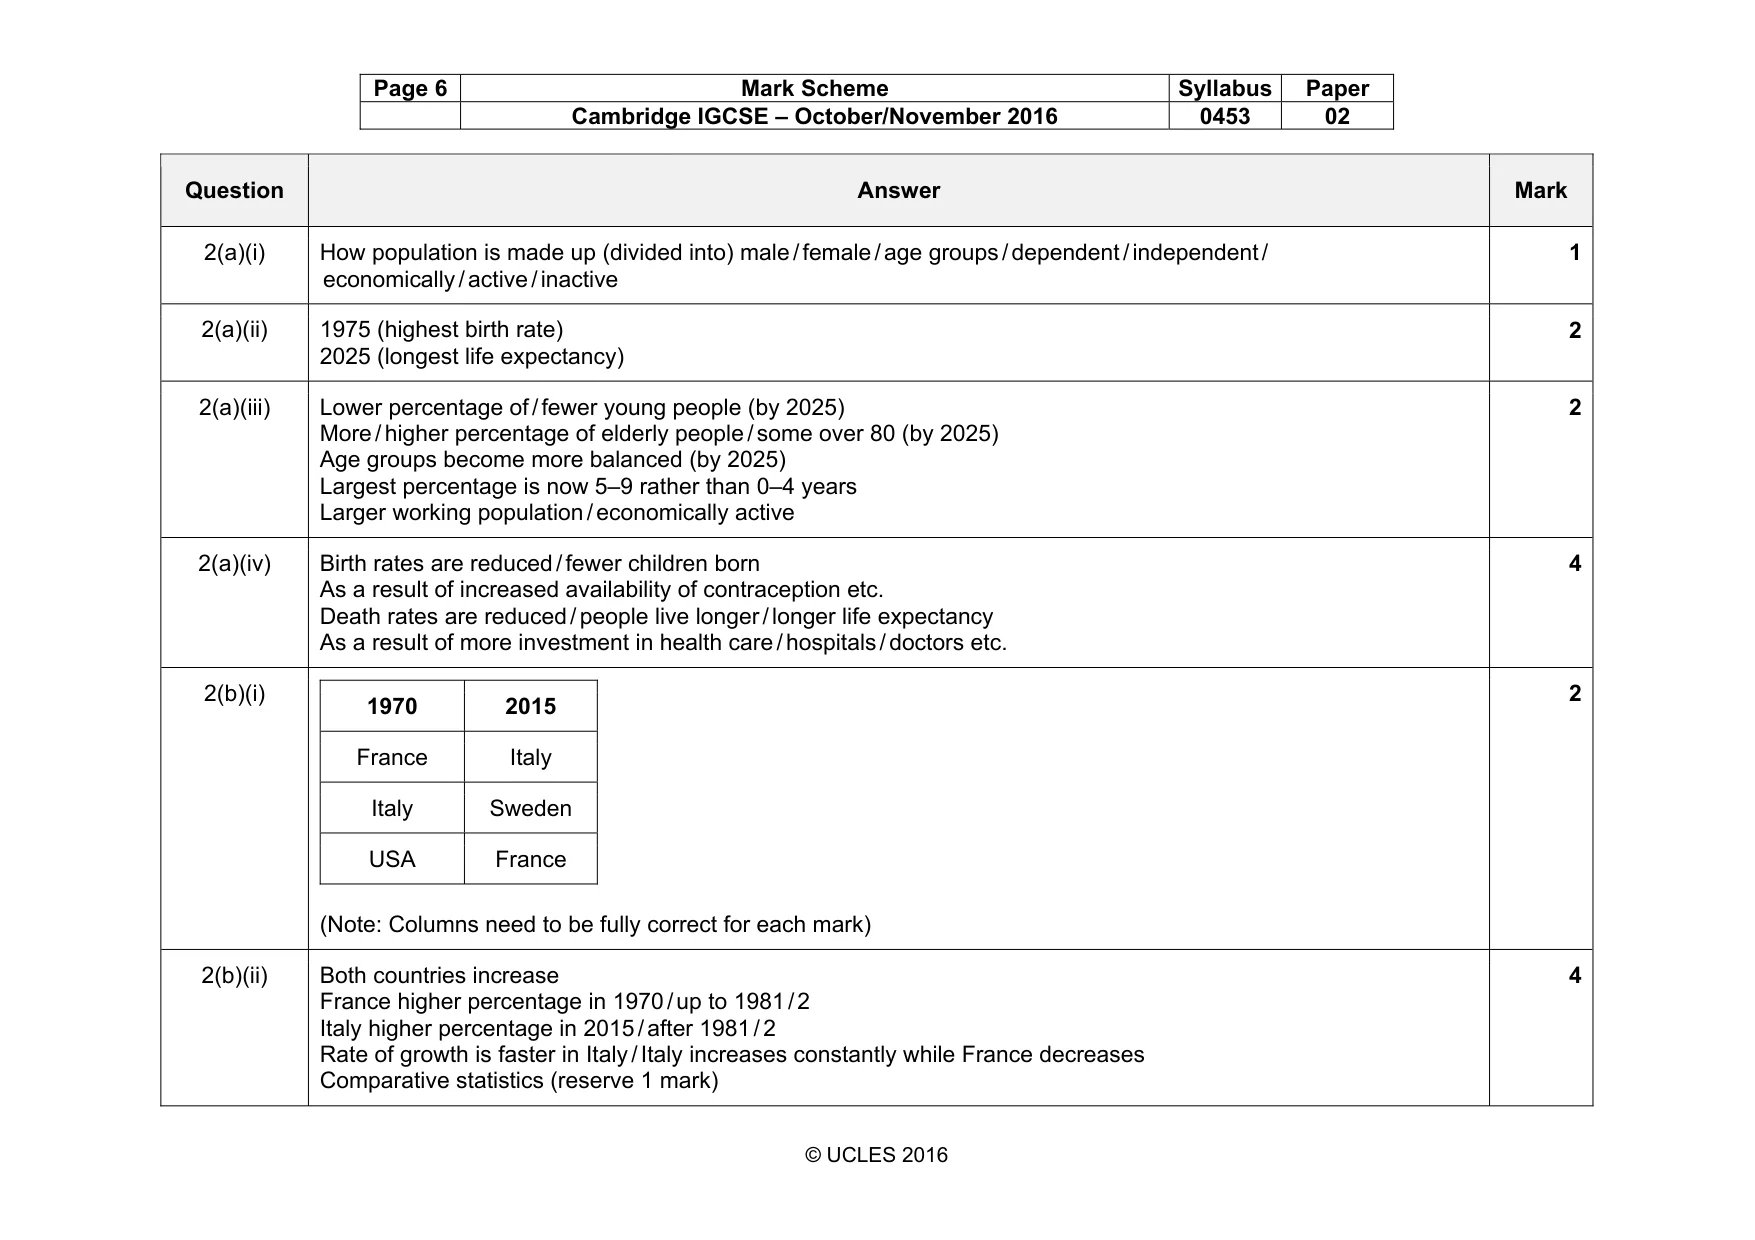
Page 6 Mark Scheme Syllabus Paper Cambridge IGCSE – October/November 2016 0453 02 © UCLES 2016 Question Answer Mark 2(a)(i) How population is made up (divided into) male / female / age groups / dependent / independent / economically / active / inactive 1 2(a)(ii) 1975 (highest birth rate) 2025 (longest life expectancy) 2 2(a)(iii) Lower percentage of / fewer young people (by 2025) More / higher percentage of elderly people / some over 80 (by 2025) Age groups become more balanced (by 2025) Largest percentage is now 5–9 rather than 0–4 years Larger working population / economically active 2 2(a)(iv) Birth rates are reduced / fewer children born As a result of increased availability of contraception etc. Death rates are reduced / people live longer / longer life expectancy As a result of more investment in health care / hospitals / doctors etc. 4 2(b)(i) 1970 2015 France Italy Italy Sweden USA France (Note: Columns need to be fully correct for each mark) 2 2(b)(ii) Both countries increase France higher percentage in 1970 / up to 1981 / 2 Italy higher percentage in 2015 / after 1981 / 2 Rate of growth is faster in Italy / Italy increases constantly while France decreases Comparative statistics (reserve 1 mark) 4
Mark scheme, page 7
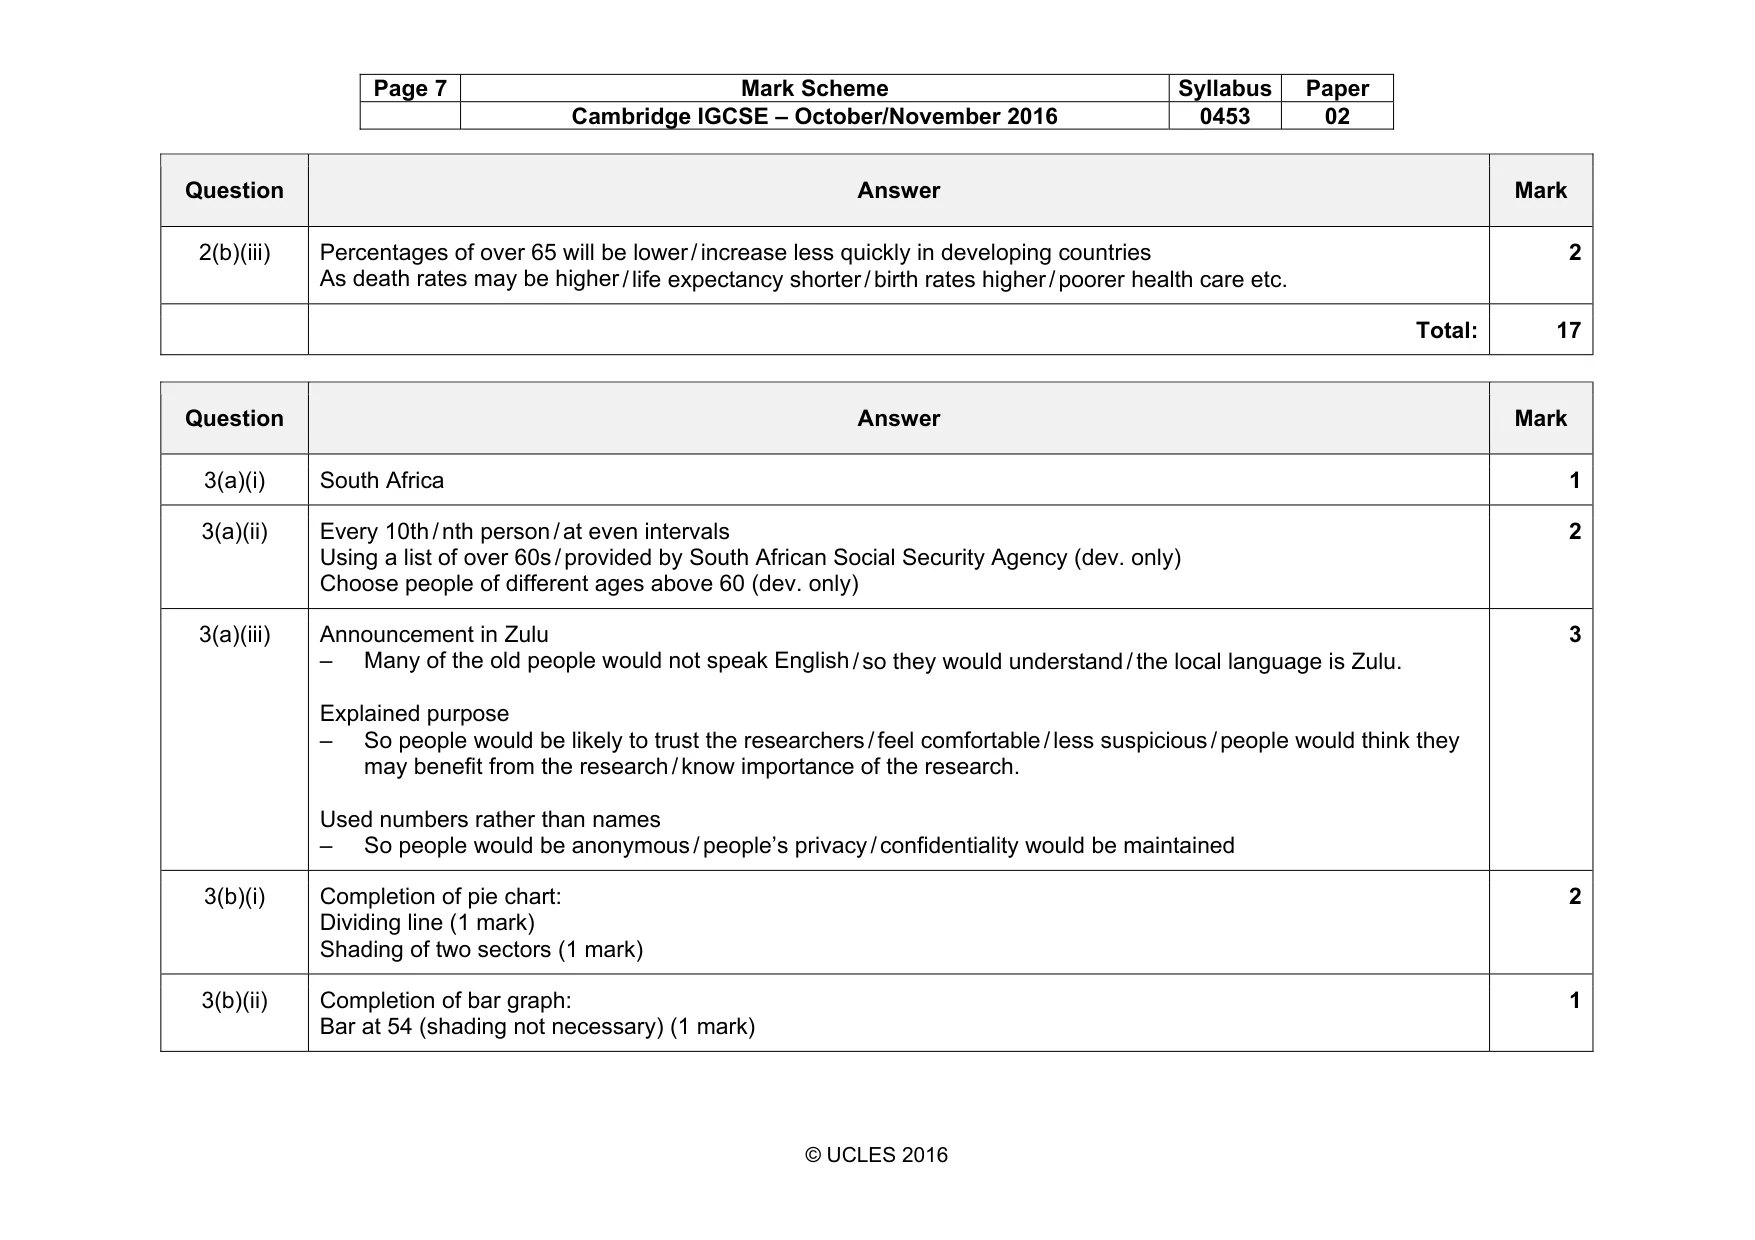
Page 7 Mark Scheme Syllabus Paper Cambridge IGCSE – October/November 2016 0453 02 © UCLES 2016 Question Answer Mark 2(b)(iii) Percentages of over 65 will be lower / increase less quickly in developing countries As death rates may be higher / life expectancy shorter / birth rates higher / poorer health care etc. 2 Total: 17 Question Answer Mark 3(a)(i) South Africa 1 3(a)(ii) Every 10th / nth person / at even intervals Using a list of over 60s / provided by South African Social Security Agency (dev. only) Choose people of different ages above 60 (dev. only) 2 3(a)(iii) Announcement in Zulu – Many of the old people would not speak English / so they would understand / the local language is Zulu. Explained purpose – So people would be likely to trust the researchers / feel comfortable / less suspicious / people would think they may benefit from the research / know importance of the research. Used numbers rather than names – So people would be anonymous / people’s privacy / confidentiality would be maintained 3 3(b)(i) Completion of pie chart: Dividing line (1 mark) Shading of two sectors (1 mark) 2 3(b)(ii) Completion of bar graph: Bar at 54 (shading not necessary) (1 mark) 1
Mark scheme, page 8
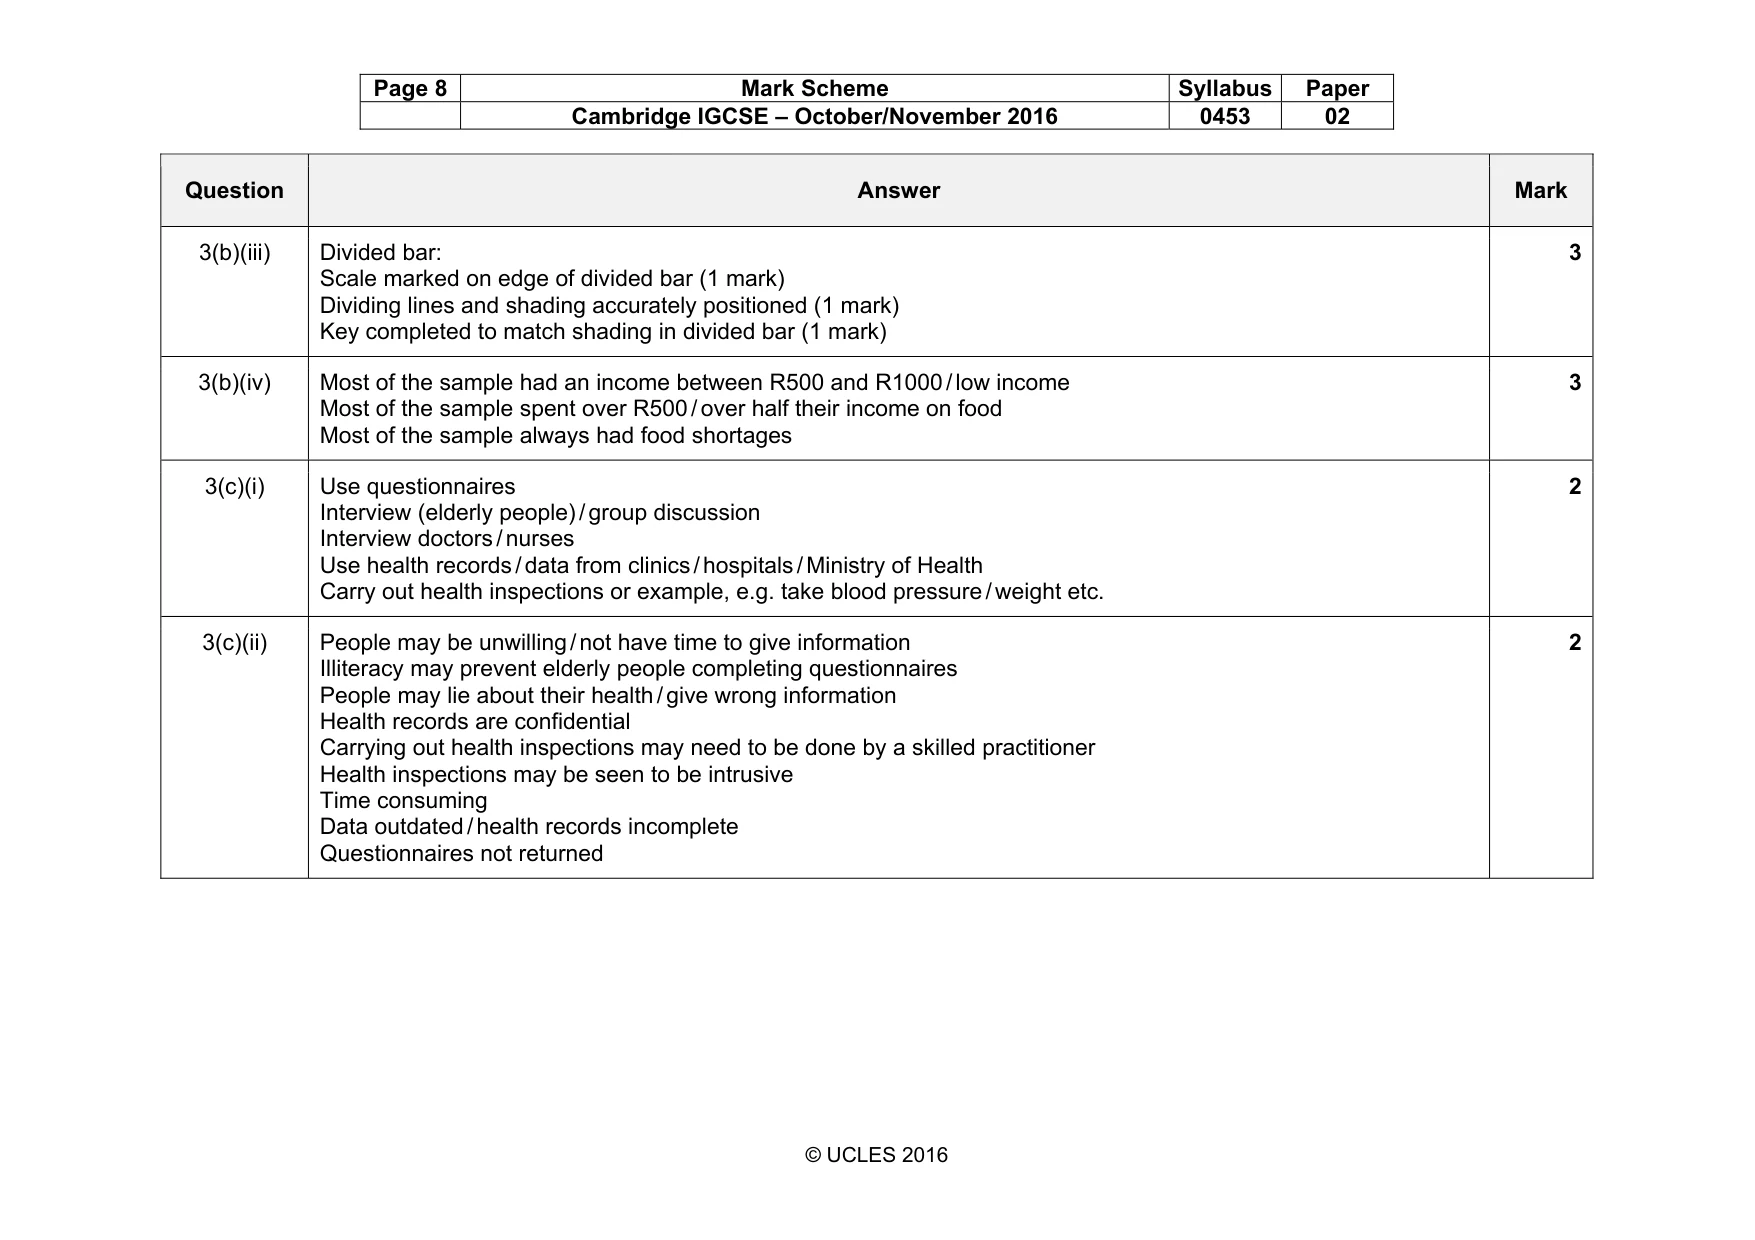
Page 8 Mark Scheme Syllabus Paper Cambridge IGCSE – October/November 2016 0453 02 © UCLES 2016 Question Answer Mark 3(b)(iii) Divided bar: Scale marked on edge of divided bar (1 mark) Dividing lines and shading accurately positioned (1 mark) Key completed to match shading in divided bar (1 mark) 3 3(b)(iv) Most of the sample had an income between R500 and R1000 / low income Most of the sample spent over R500 / over half their income on food Most of the sample always had food shortages 3 3(c)(i) Use questionnaires Interview (elderly people) / group discussion Interview doctors / nurses Use health records / data from clinics / hospitals / Ministry of Health Carry out health inspections or example, e.g. take blood pressure / weight etc. 2 3(c)(ii) People may be unwilling / not have time to give information Illiteracy may prevent elderly people completing questionnaires People may lie about their health / give wrong information Health records are confidential Carrying out health inspections may need to be done by a skilled practitioner Health inspections may be seen to be intrusive Time consuming Data outdated / health records incomplete Questionnaires not returned 2
Mark scheme, page 9
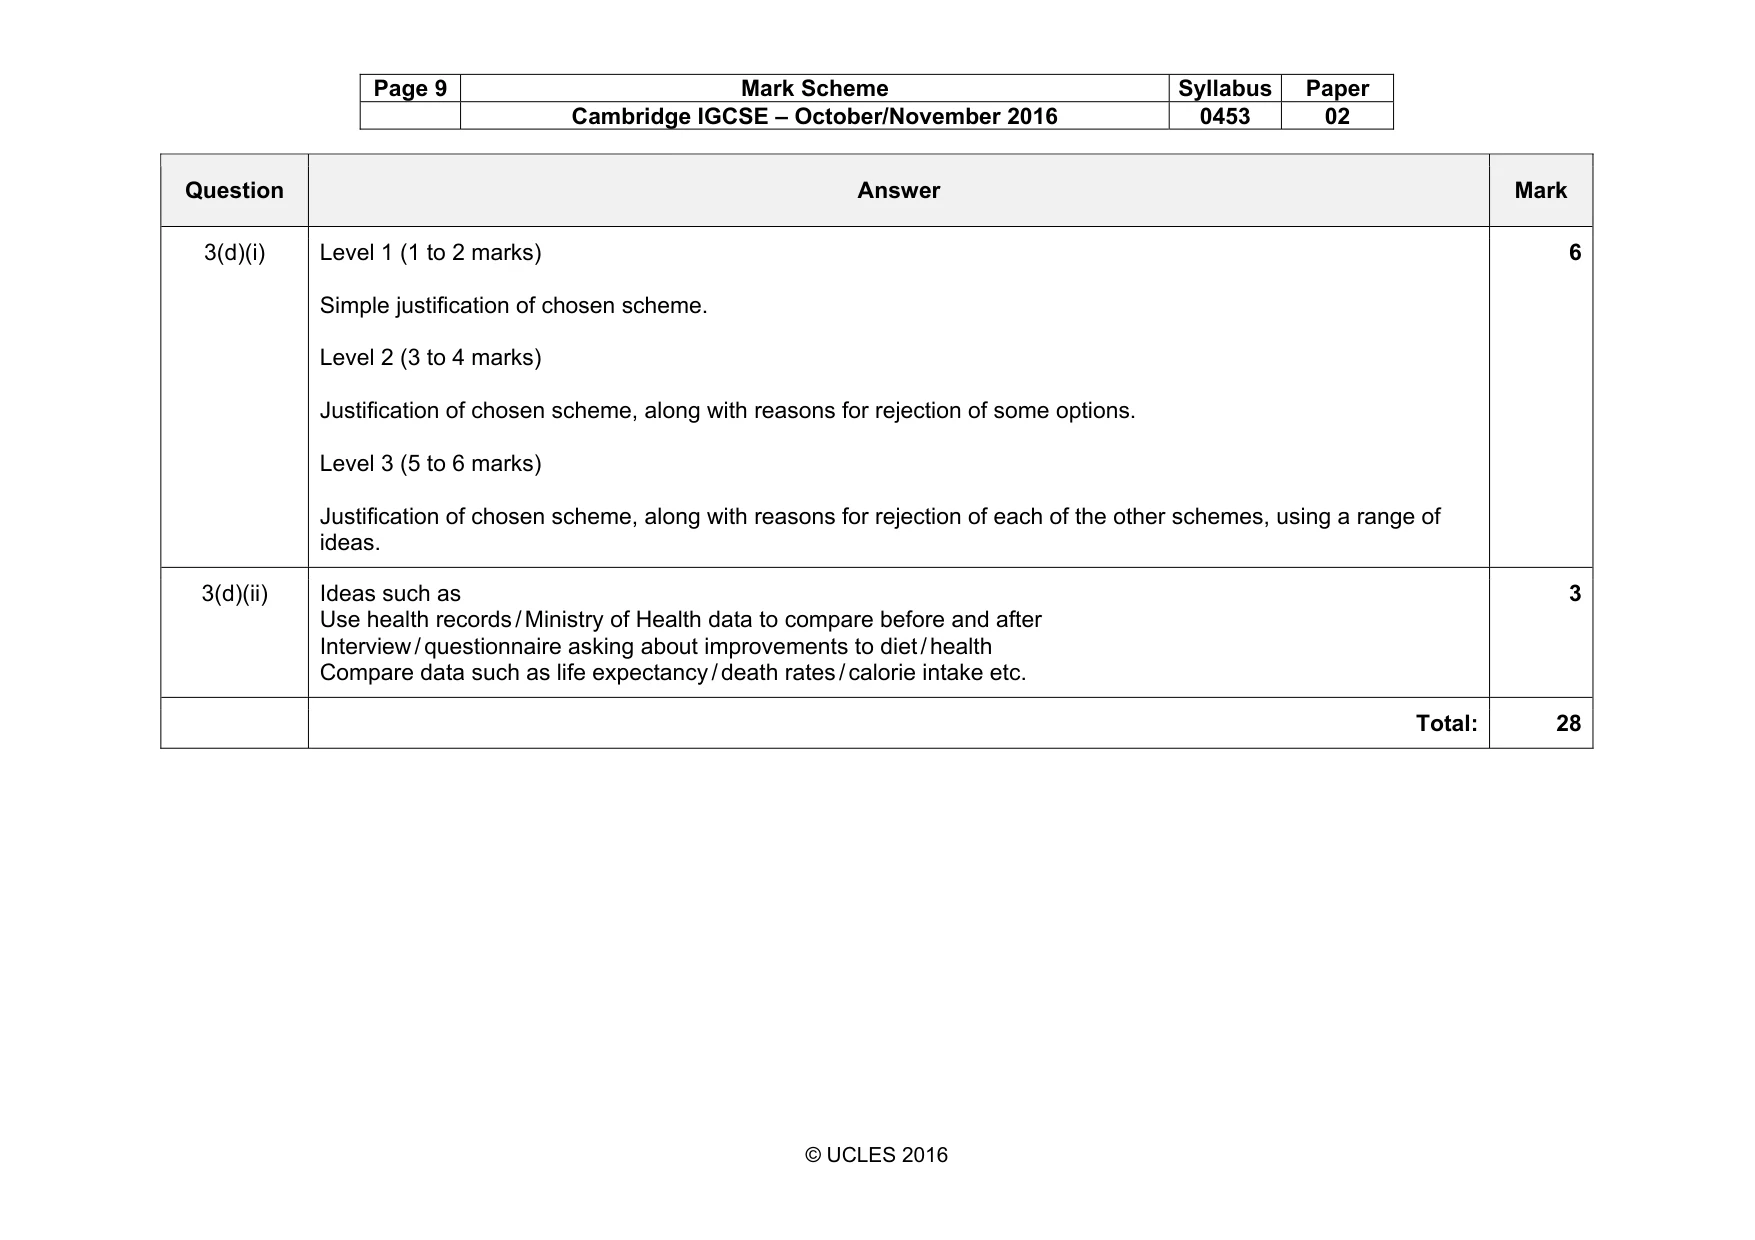
Page 9 Mark Scheme Syllabus Paper Cambridge IGCSE – October/November 2016 0453 02 © UCLES 2016 Question Answer Mark 3(d)(i) Level 1 (1 to 2 marks) Simple justification of chosen scheme. Level 2 (3 to 4 marks) Justification of chosen scheme, along with reasons for rejection of some options. Level 3 (5 to 6 marks) Justification of chosen scheme, along with reasons for rejection of each of the other schemes, using a range of ideas. 6 3(d)(ii) Ideas such as Use health records / Ministry of Health data to compare before and after Interview / questionnaire asking about improvements to diet / health Compare data such as life expectancy / death rates / calorie intake etc. 3 Total: 28
What you needed in this session
Cambridge’s own grade thresholds for 2016 Oct/Nov, Paper 2 · Variant 1. A higher threshold means an easier paper — the bar moves with how the cohort did.