Cambridge IGCSE Development Studies 0453 — 2013 Oct/Nov Paper 2 · Variant 1
0453/21/O/N/13 · 80 marks · ≈90 min
The question paper and its mark scheme, free to read here and free to download. This is Cambridge’s own paper, exactly as it was sat.
Question paper16 pages
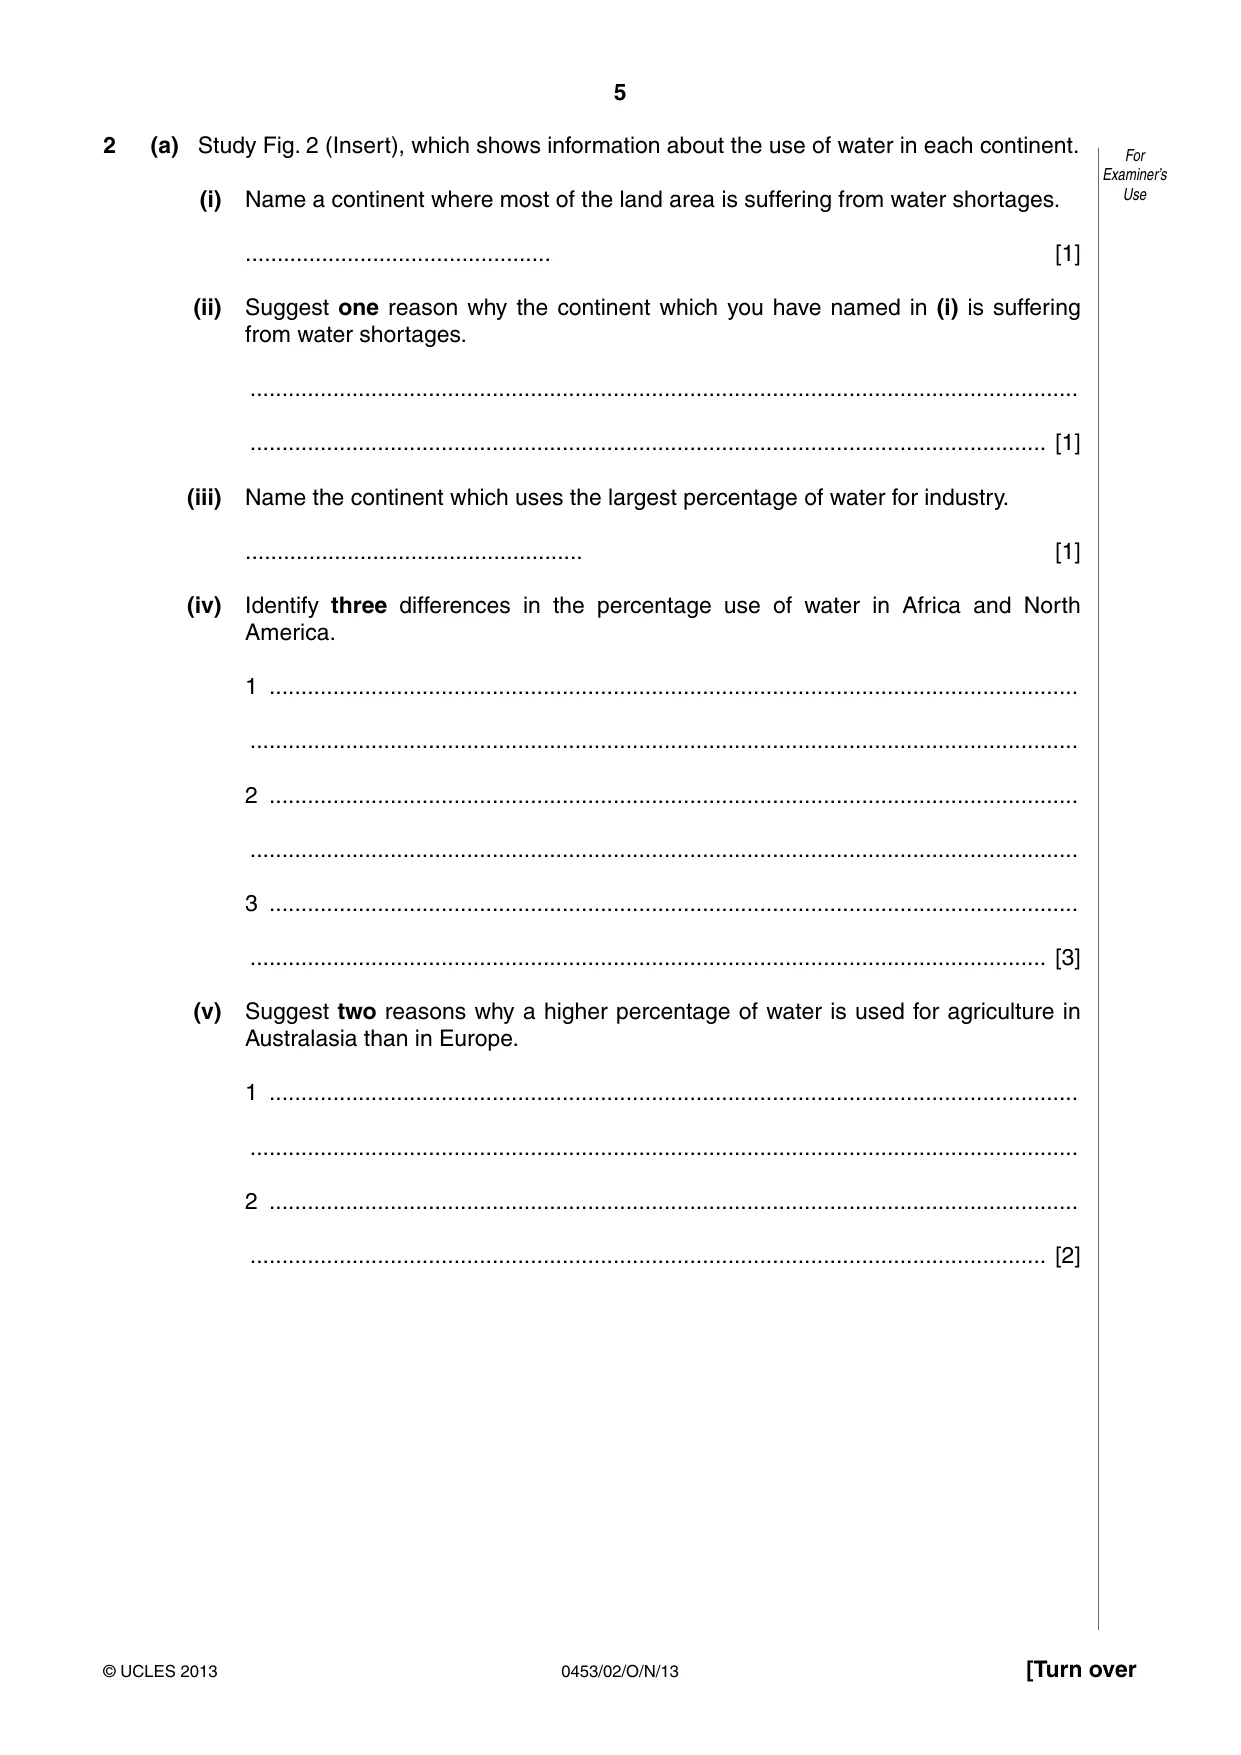
Mark scheme11 pages
Answers below. Sit the paper first if you are practising.
Paper as text
Question paper, page 1
This document consists of 16 printed pages and 1 insert. DC (NF/CGW) 64113/3 © UCLES 2013 [Turn over UNIVERSITY OF CAMBRIDGE INTERNATIONAL EXAMINATIONS International General Certificate of Secondary Education * 7 7 8 6 9 0 1 2 0 5 * DEVELOPMENT STUDIES 0453/02 Paper 2 October/November 2013 2 hours Candidates answer on the Question Paper. Additional Materials: Ruler READ THESE INSTRUCTIONS FIRST Write your Centre number, candidate number and name on all the work you hand in. Write in dark blue or black pen. You may use a soft pencil for any diagrams, graphs or rough working. Do not use staples, paper clips, highlighters, glue or correction fluid. DO NOT WRITE IN ANY BARCODES. Answer all the questions. You may not need all the answer lines for your answer. You should read and study the sources before answering the questions. The Insert contains Fig. 2 for Question 2. The Insert is not required by the Examiner. It can be kept by the Centre and used as a teaching resource. At the end of the examination, fasten all your work securely together including any additional paper that you may have used. The number of marks is given in brackets [ ] at the end of each question or part question. For Examiner’s Use 1 2 3 4 Total
Question paper, page 2
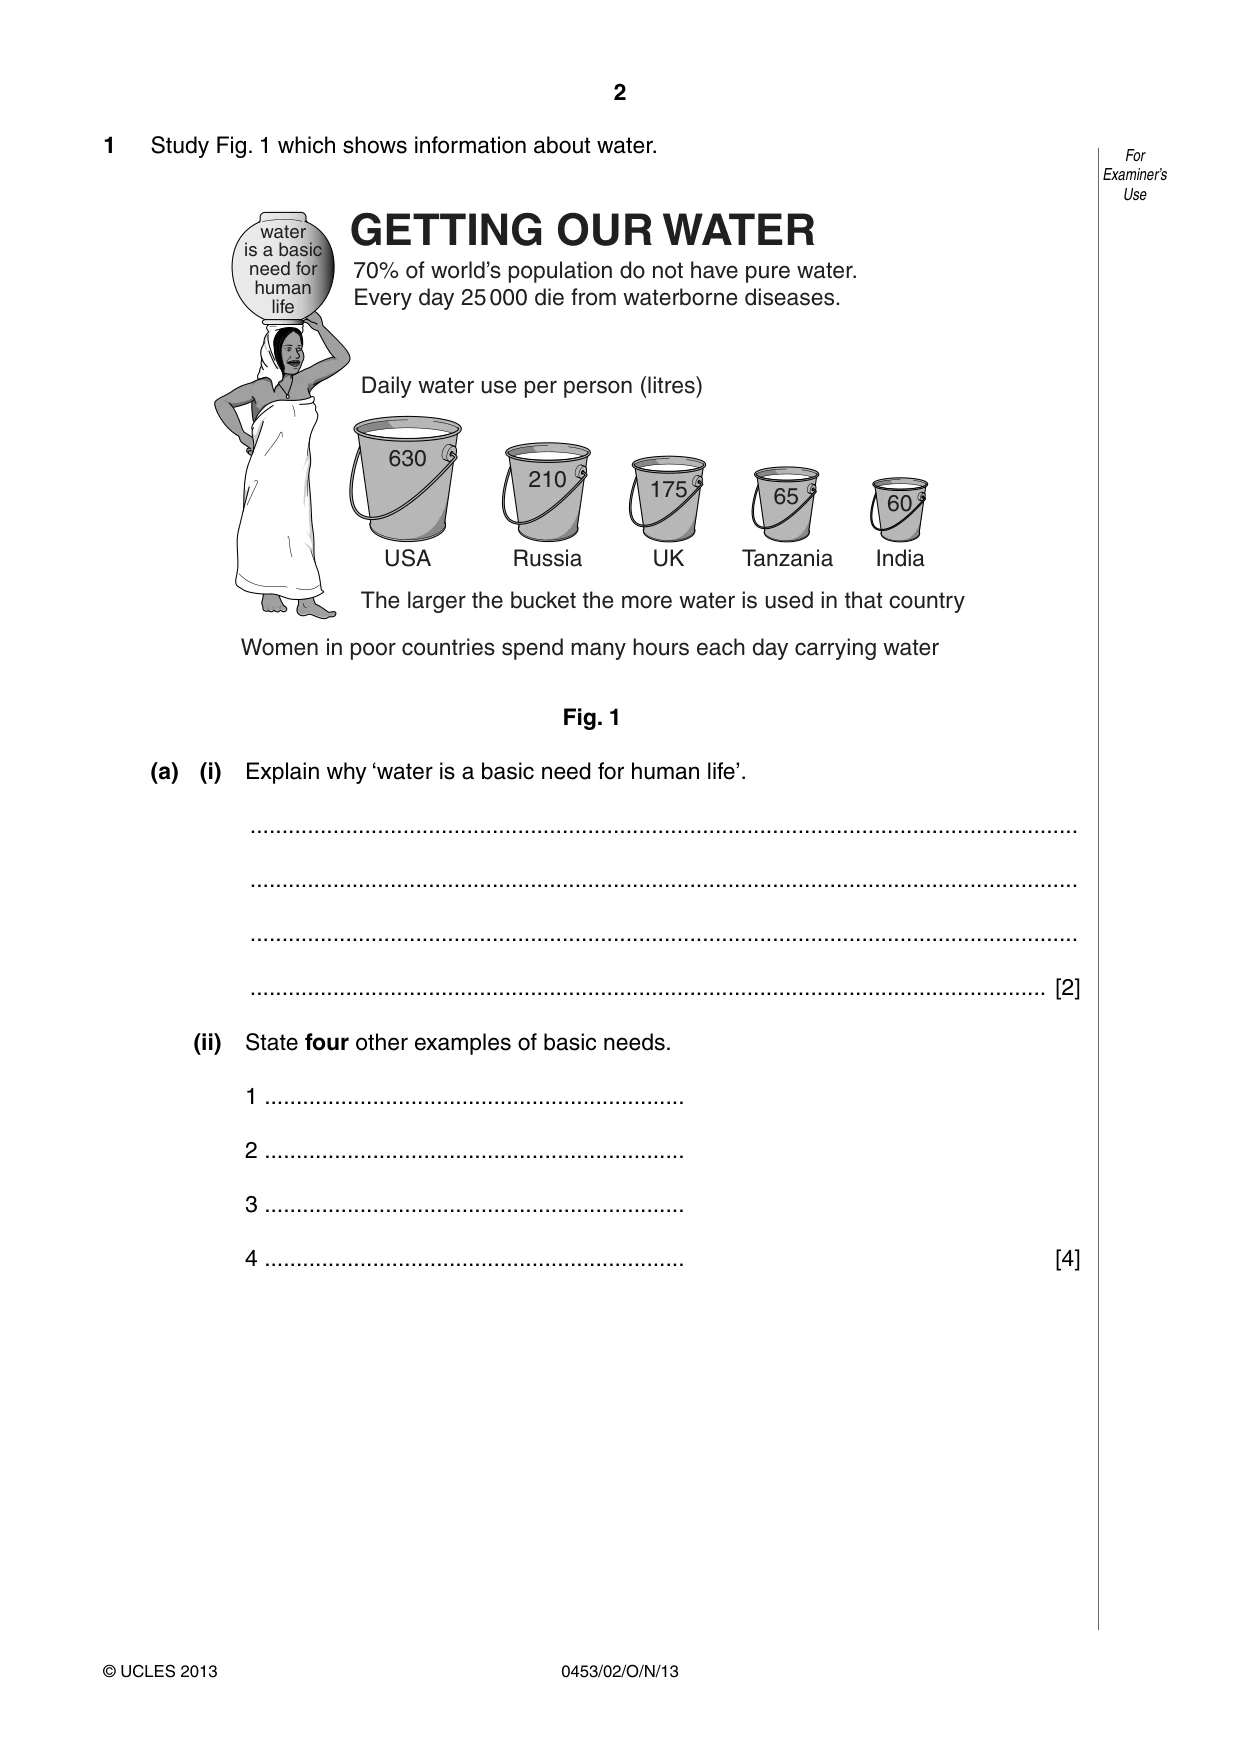
2 0453/02/O/N/13 © UCLES 2013 For Examiner’s Use 1 Study Fig. 1 which shows information about water. USA 630 210 175 65 60 70% of world’s population do not have pure water. Every day 25 000 die from waterborne diseases. Daily water use per person (litres) The larger the bucket the more water is used in that country Women in poor countries spend many hours each day carrying water Russia UK Tanzania India GETTING OUR WATER water is a basic need for human life Fig. 1 (a) (i) Explain why ‘water is a basic need for human life’. … … … … [2] (ii) State four other examples of basic needs. 1 … 2 … 3 … 4 … [4]
Question paper, page 3
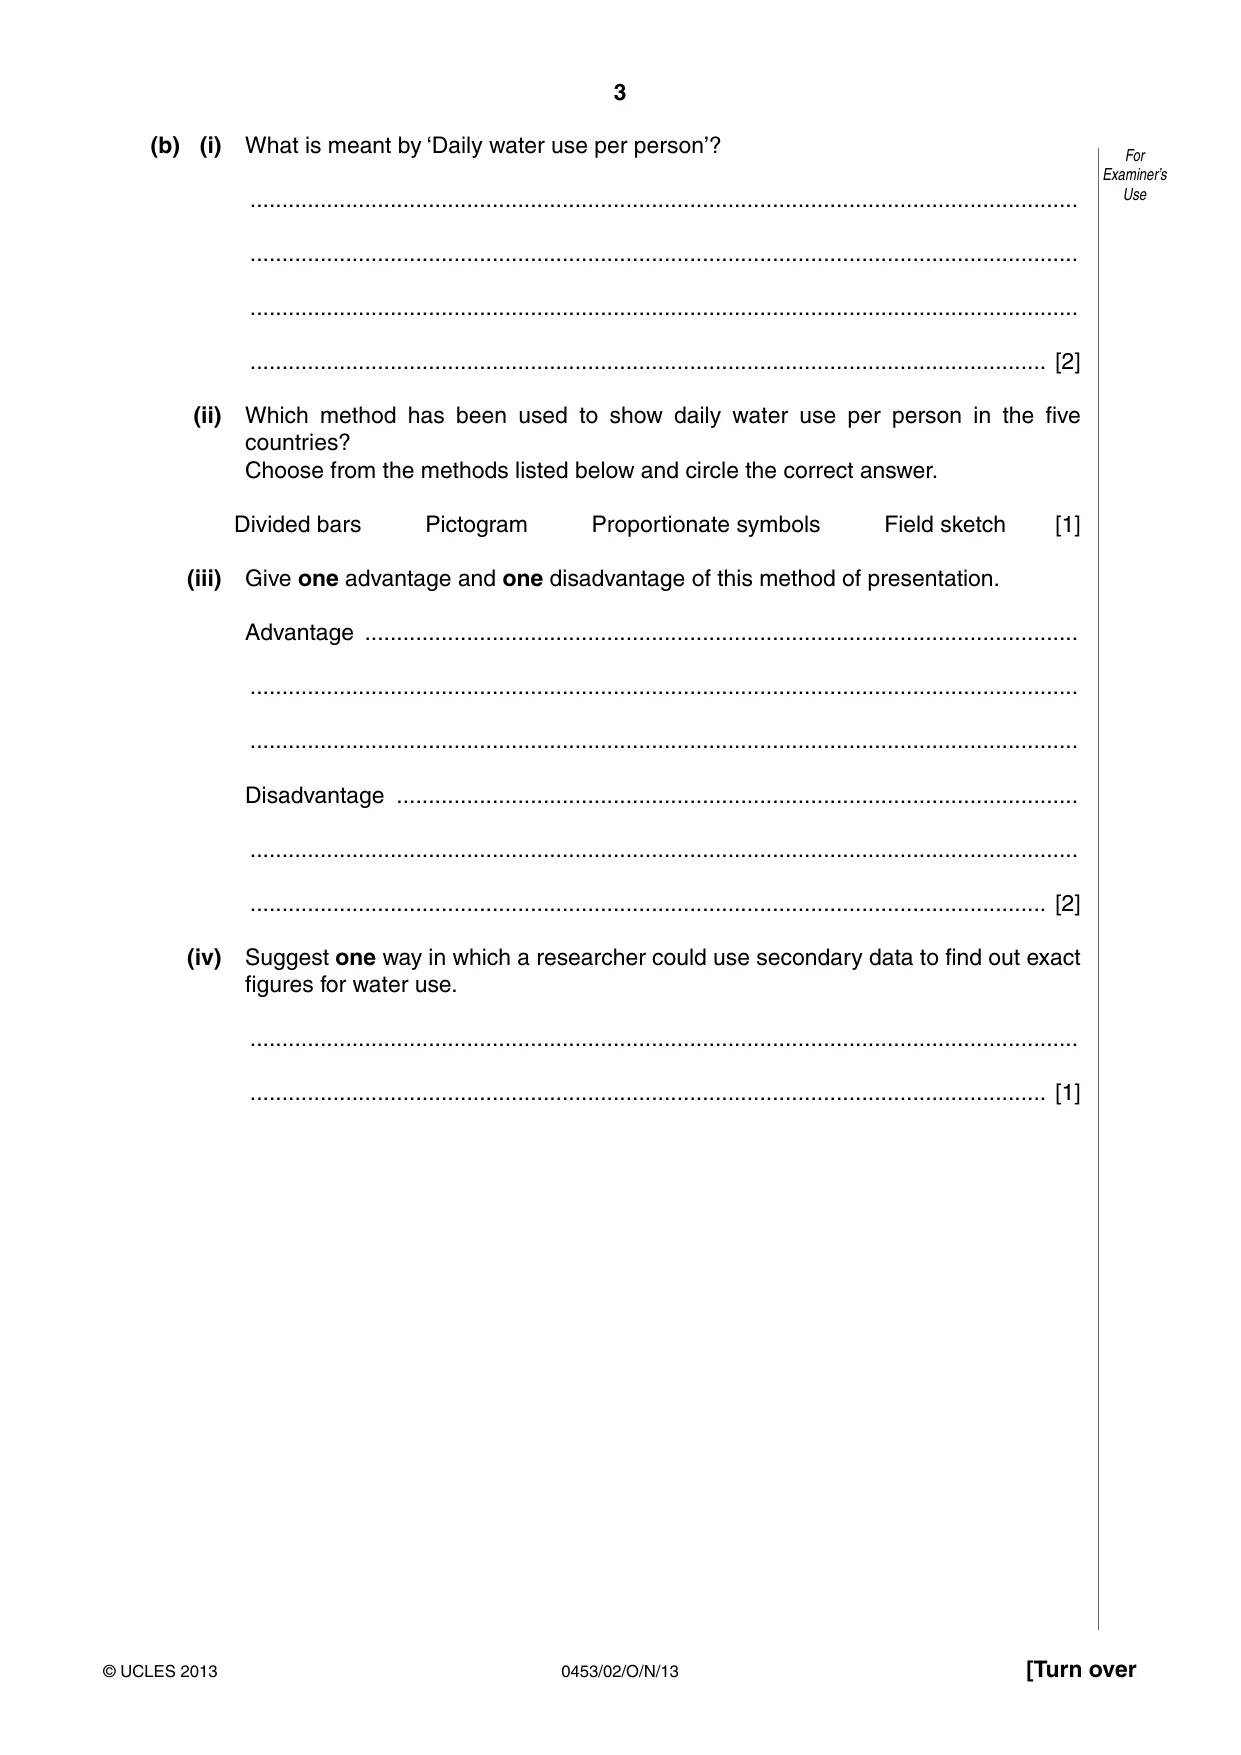
3 0453/02/O/N/13 © UCLES 2013 [Turn over For Examiner’s Use (b) (i) What is meant by ‘Daily water use per person’? … … … … [2] (ii) Which method has been used to show daily water use per person in the five countries? Choose from the methods listed below and circle the correct answer. Divided bars Pictogram Proportionate symbols Field sketch [1] (iii) Give one advantage and one disadvantage of this method of presentation. Advantage … … … Disadvantage … … … [2] (iv) Suggest one way in which a researcher could use secondary data to find out exact figures for water use. … … [1]
Question paper, page 4
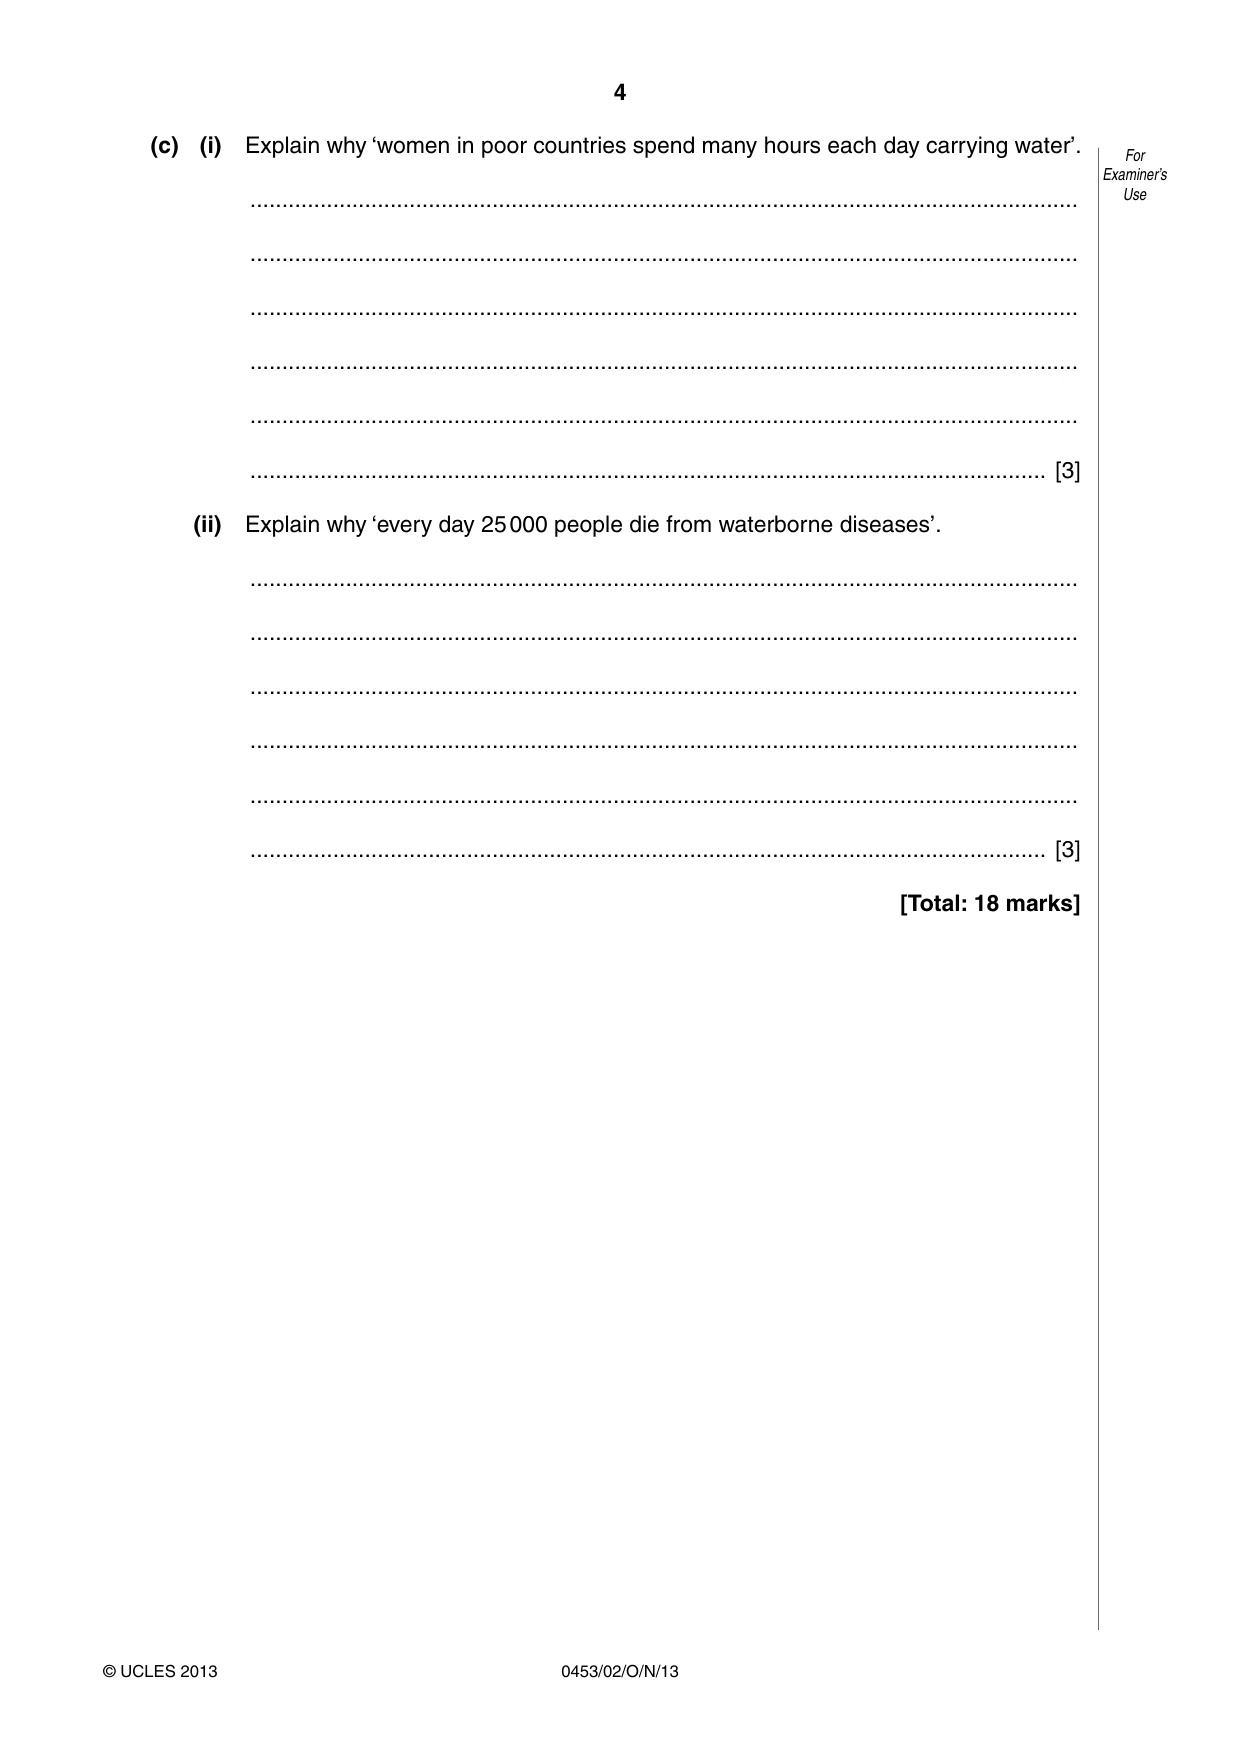
4 0453/02/O/N/13 © UCLES 2013 For Examiner’s Use (c) (i) Explain why ‘women in poor countries spend many hours each day carrying water’. … … … … … … [3] (ii) Explain why ‘every day 25 000 people die from waterborne diseases’. … … … … … … [3] [Total: 18 marks]
Question paper, page 5
5 0453/02/O/N/13 © UCLES 2013 [Turn over For Examiner’s Use 2 (a) Study Fig. 2 (Insert), which shows information about the use of water in each continent. (i) Name a continent where most of the land area is suffering from water shortages. … [1] (ii) Suggest one reason why the continent which you have named in (i) is suffering from water shortages. … … [1] (iii) Name the continent which uses the largest percentage of water for industry. … [1] (iv) Identify three differences in the percentage use of water in Africa and North America. 1 … … 2 … … 3 … … [3] (v) Suggest two reasons why a higher percentage of water is used for agriculture in Australasia than in Europe. 1 … … 2 … … [2]
Question paper, page 6
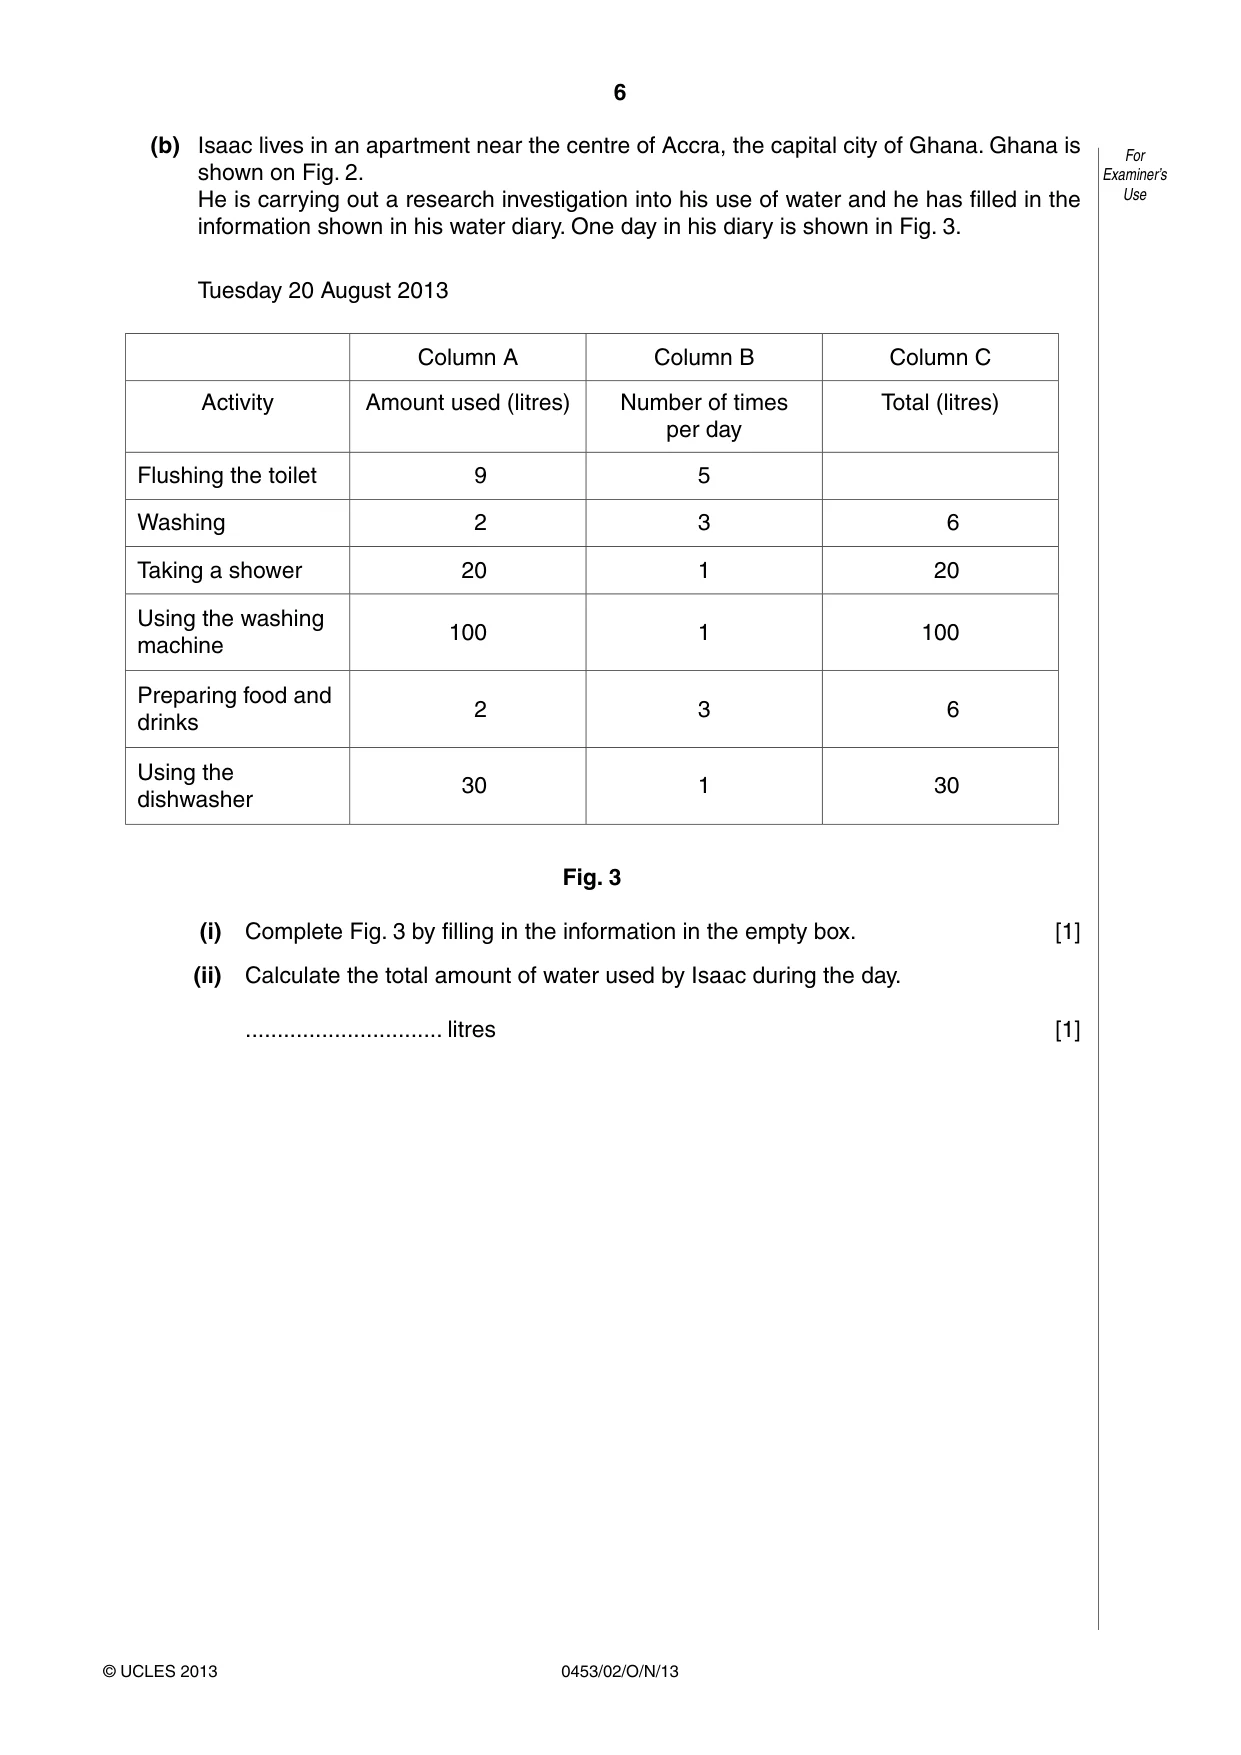
6 0453/02/O/N/13 © UCLES 2013 For Examiner’s Use (b) Isaac lives in an apartment near the centre of Accra, the capital city of Ghana. Ghana is shown on Fig. 2. He is carrying out a research investigation into his use of water and he has filled in the information shown in his water diary. One day in his diary is shown in Fig. 3. Tuesday 20 August 2013 Column A Column B Column C Activity Amount used (litres) Number of times per day Total (litres) Flushing the toilet 9 5 Washing 2 3 6 Taking a shower 20 1 20 Using the washing machine 100 1 100 Preparing food and drinks 2 3 6 Using the dishwasher 30 1 30 Fig. 3 (i) Complete Fig. 3 by filling in the information in the empty box. [1] (ii) Calculate the total amount of water used by Isaac during the day. … litres [1]
Question paper, page 7
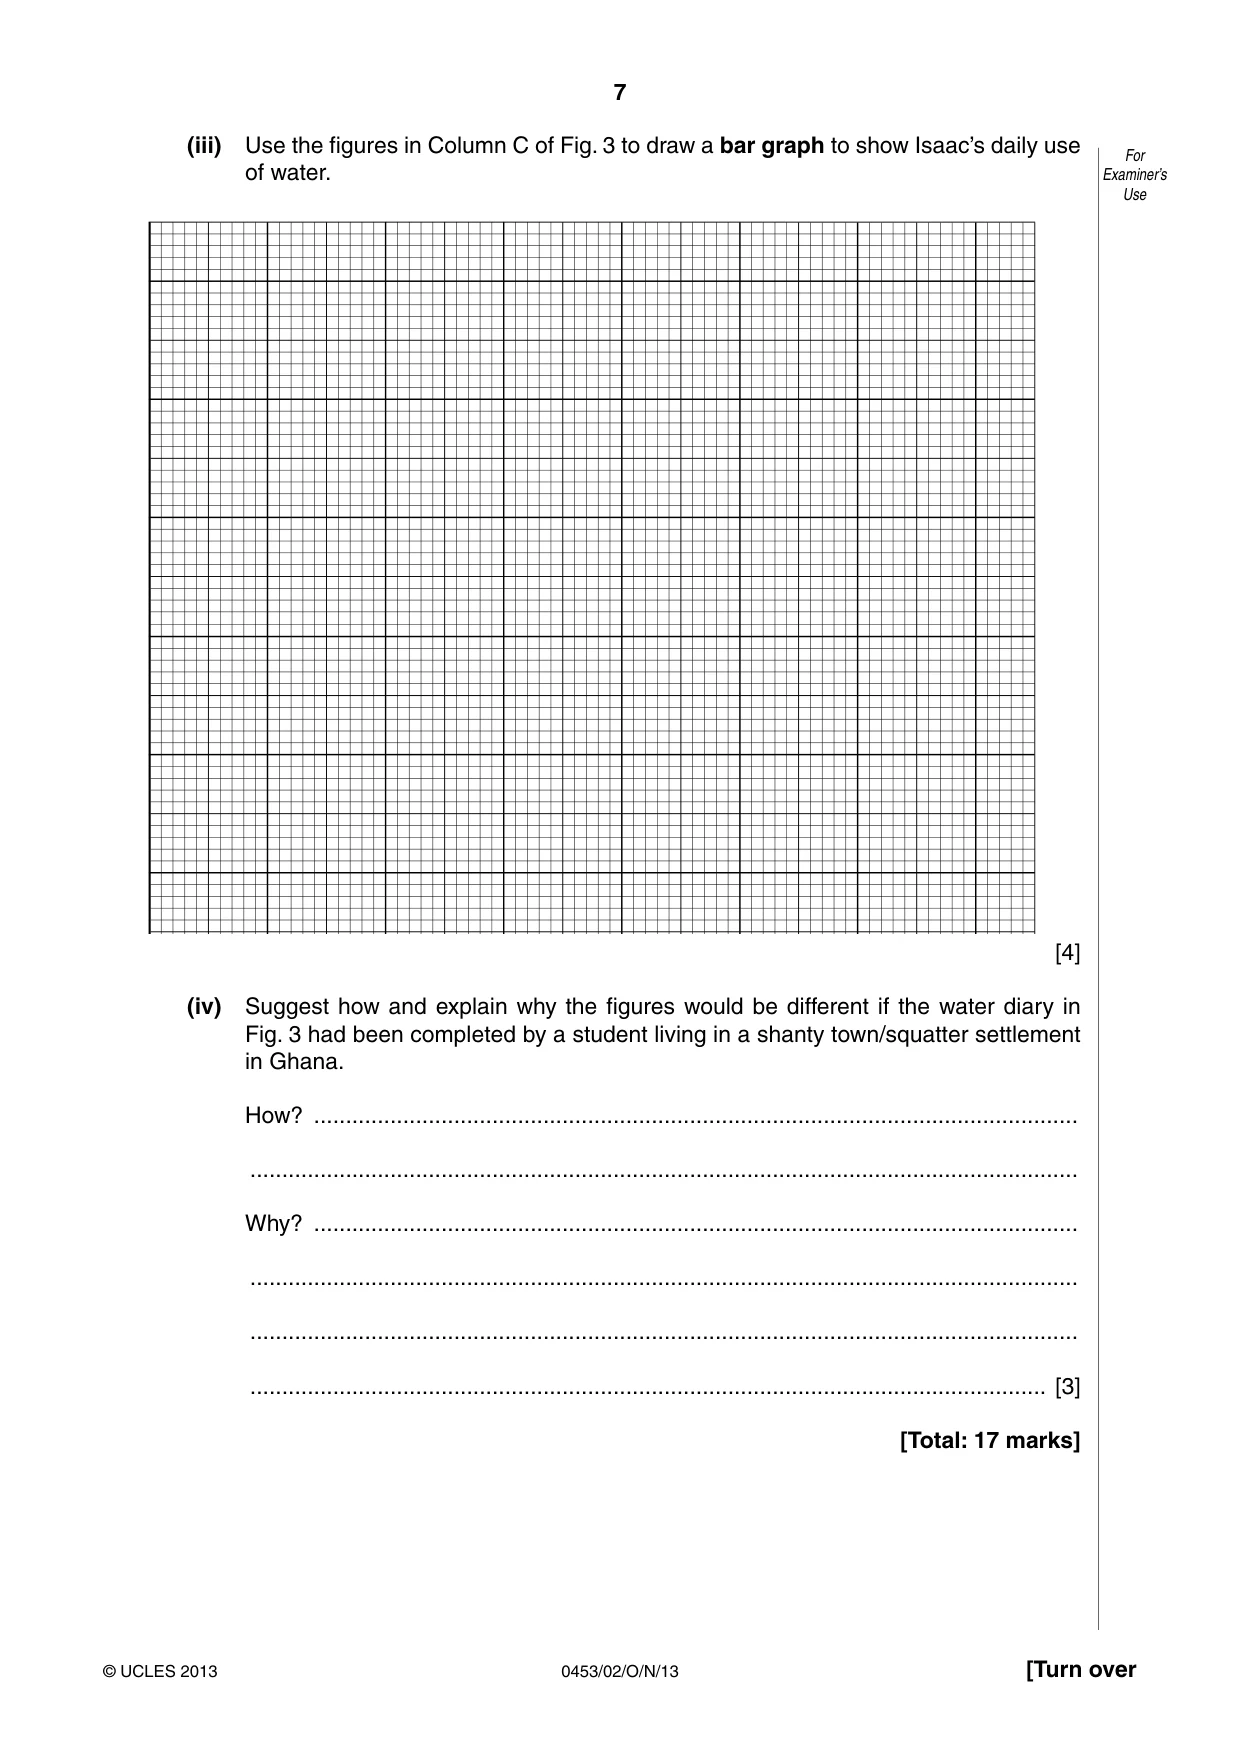
7 0453/02/O/N/13 © UCLES 2013 [Turn over For Examiner’s Use (iii) Use the figures in Column C of Fig. 3 to draw a bar graph to show Isaac’s daily use of water. [4] (iv) Suggest how and explain why the figures would be different if the water diary in Fig. 3 had been completed by a student living in a shanty town/squatter settlement in Ghana. How? … … Why? … … … … [3] [Total: 17 marks]
Question paper, page 8
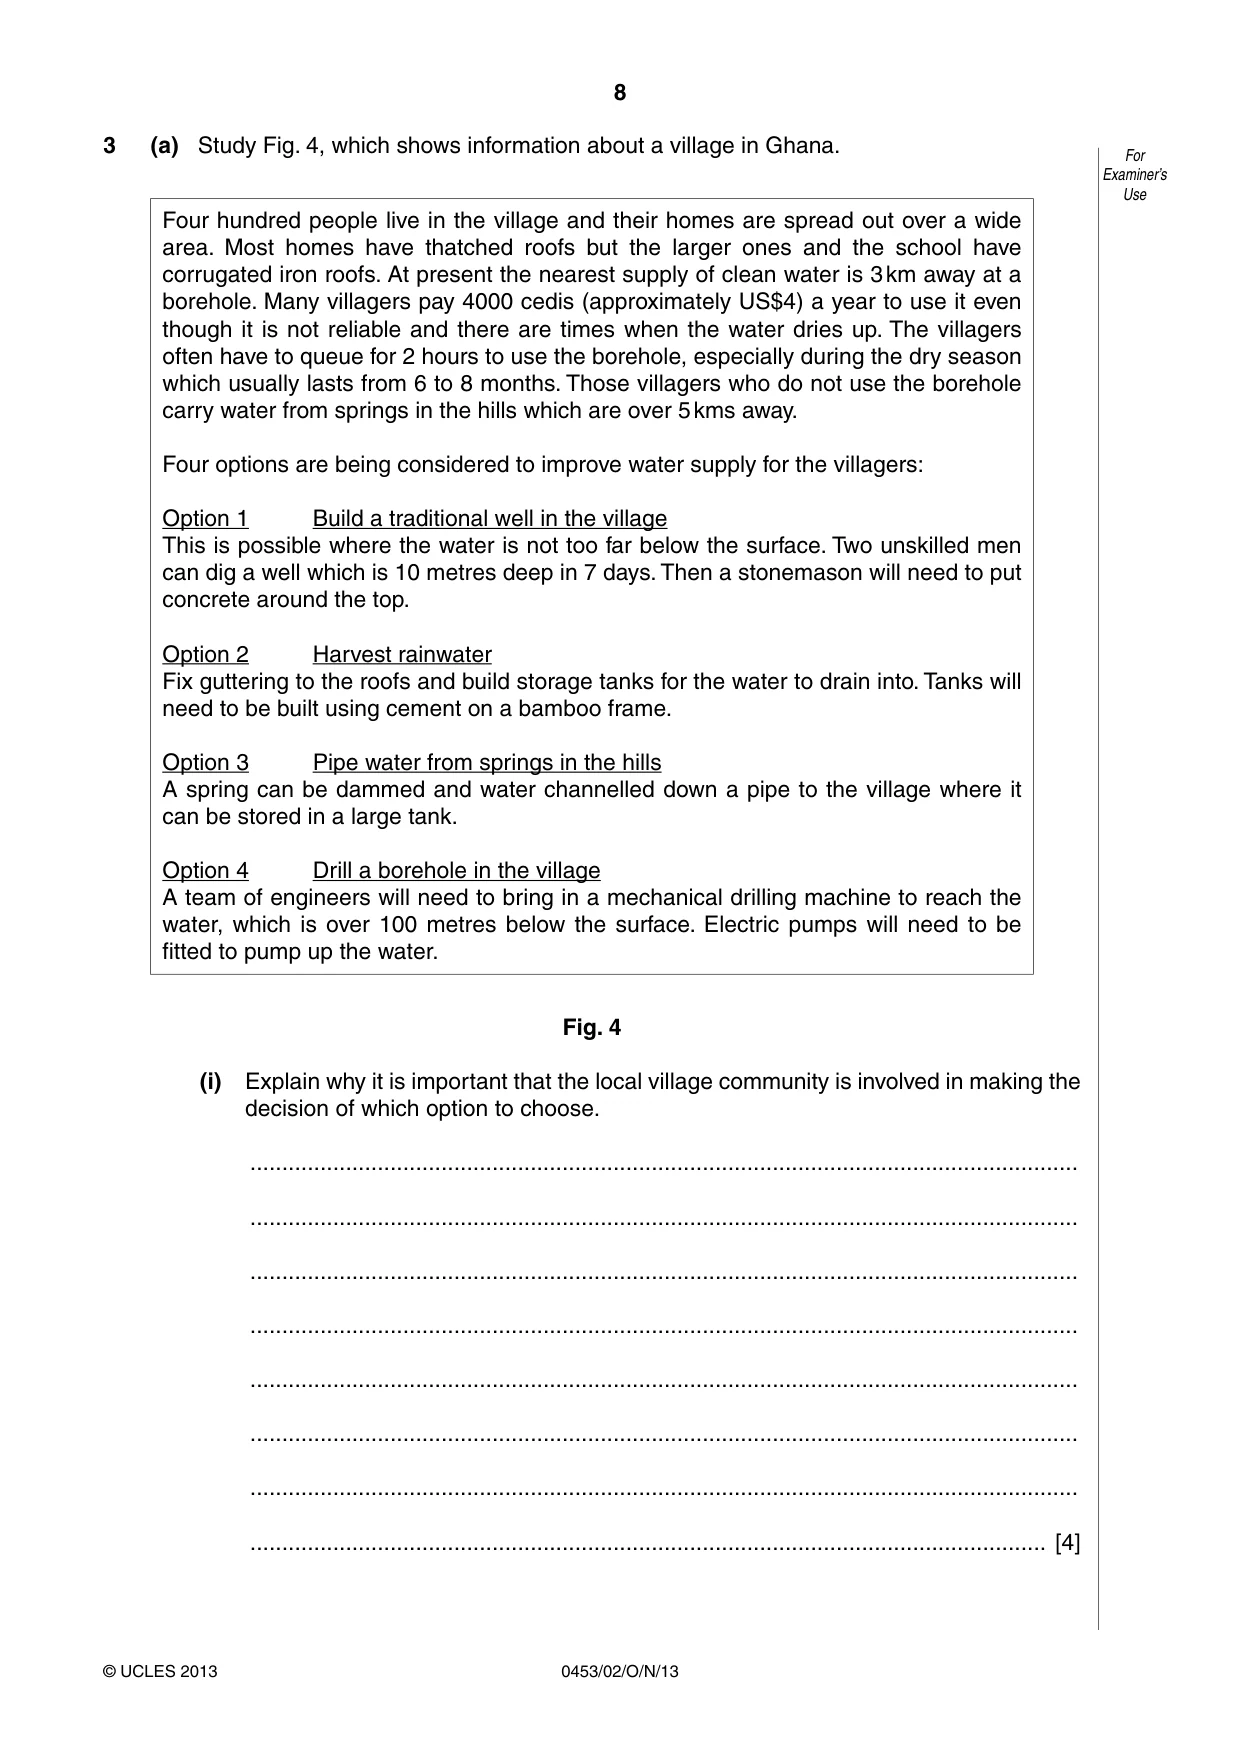
8 0453/02/O/N/13 © UCLES 2013 For Examiner’s Use 3 (a) Study Fig. 4, which shows information about a village in Ghana. Four hundred people live in the village and their homes are spread out over a wide area. Most homes have thatched roofs but the larger ones and the school have corrugated iron roofs. At present the nearest supply of clean water is 3 km away at a borehole. Many villagers pay 4000 cedis (approximately US$4) a year to use it even though it is not reliable and there are times when the water dries up. The villagers often have to queue for 2 hours to use the borehole, especially during the dry season which usually lasts from 6 to 8 months. Those villagers who do not use the borehole carry water from springs in the hills which are over 5 kms away. Four options are being considered to improve water supply for the villagers: Option 1 Build a traditional well in the village This is possible where the water is not too far below the surface. Two unskilled men can dig a well which is 10 metres deep in 7 days. Then a stonemason will need to put concrete around the top. Option 2 Harvest rainwater Fix guttering to the roofs and build storage tanks for the water to drain into. Tanks will need to be built using cement on a bamboo frame. Option 3 Pipe water from springs in the hills A spring can be dammed and water channelled down a pipe to the village where it can be stored in a large tank. Option 4 Drill a borehole in the village A team of engineers will need to bring in a mechanical drilling machine to reach the water, which is over 100 metres below the surface. Electric pumps will need to be fitted to pump up the water. Fig. 4 (i) Explain why it is important that the local village community is involved in making the decision of which option to choose. … … … … … … … … [4]
Question paper, page 9
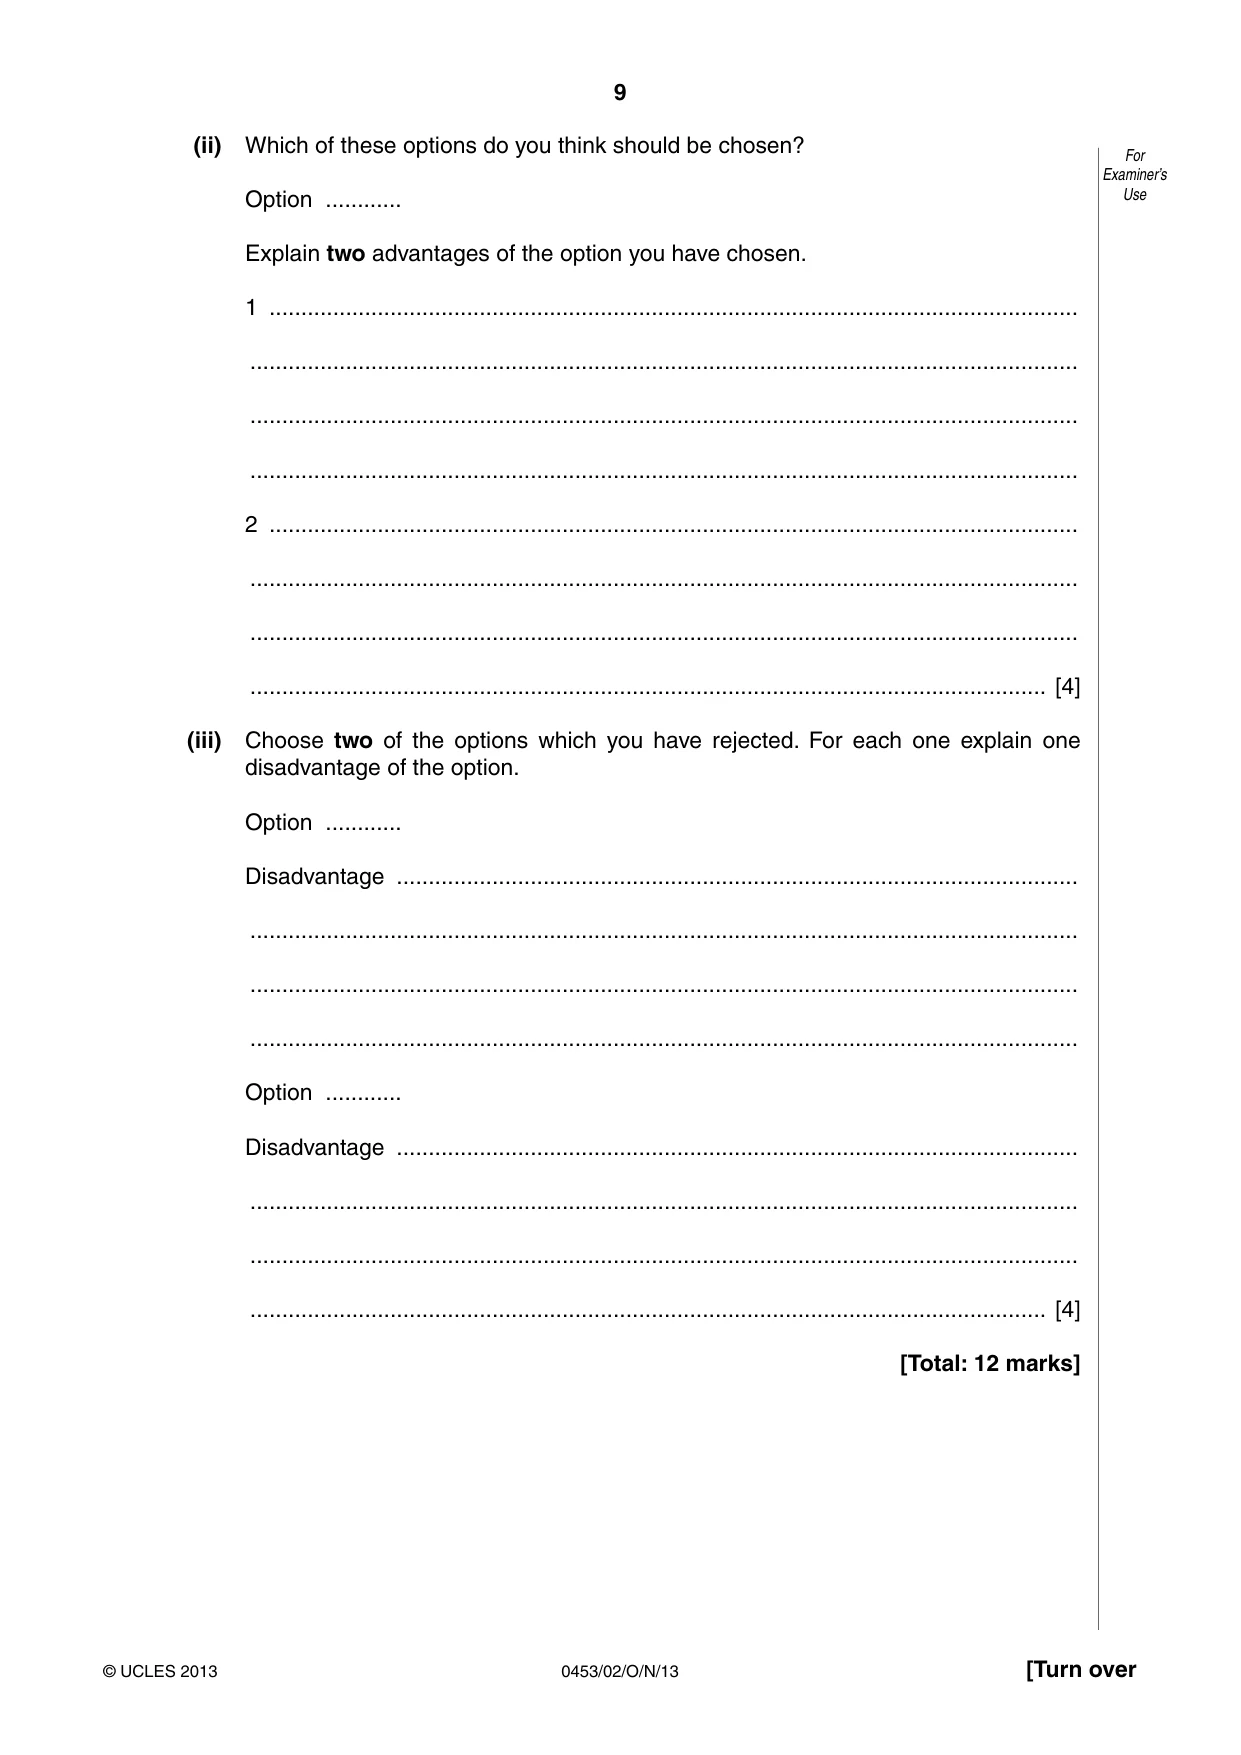
9 0453/02/O/N/13 © UCLES 2013 [Turn over For Examiner’s Use (ii) Which of these options do you think should be chosen? Option … Explain two advantages of the option you have chosen. 1 … … … … 2 … … … … [4] (iii) Choose two of the options which you have rejected. For each one explain one disadvantage of the option. Option … Disadvantage … … … … Option … Disadvantage … … … … [4] [Total: 12 marks]
Question paper, page 10
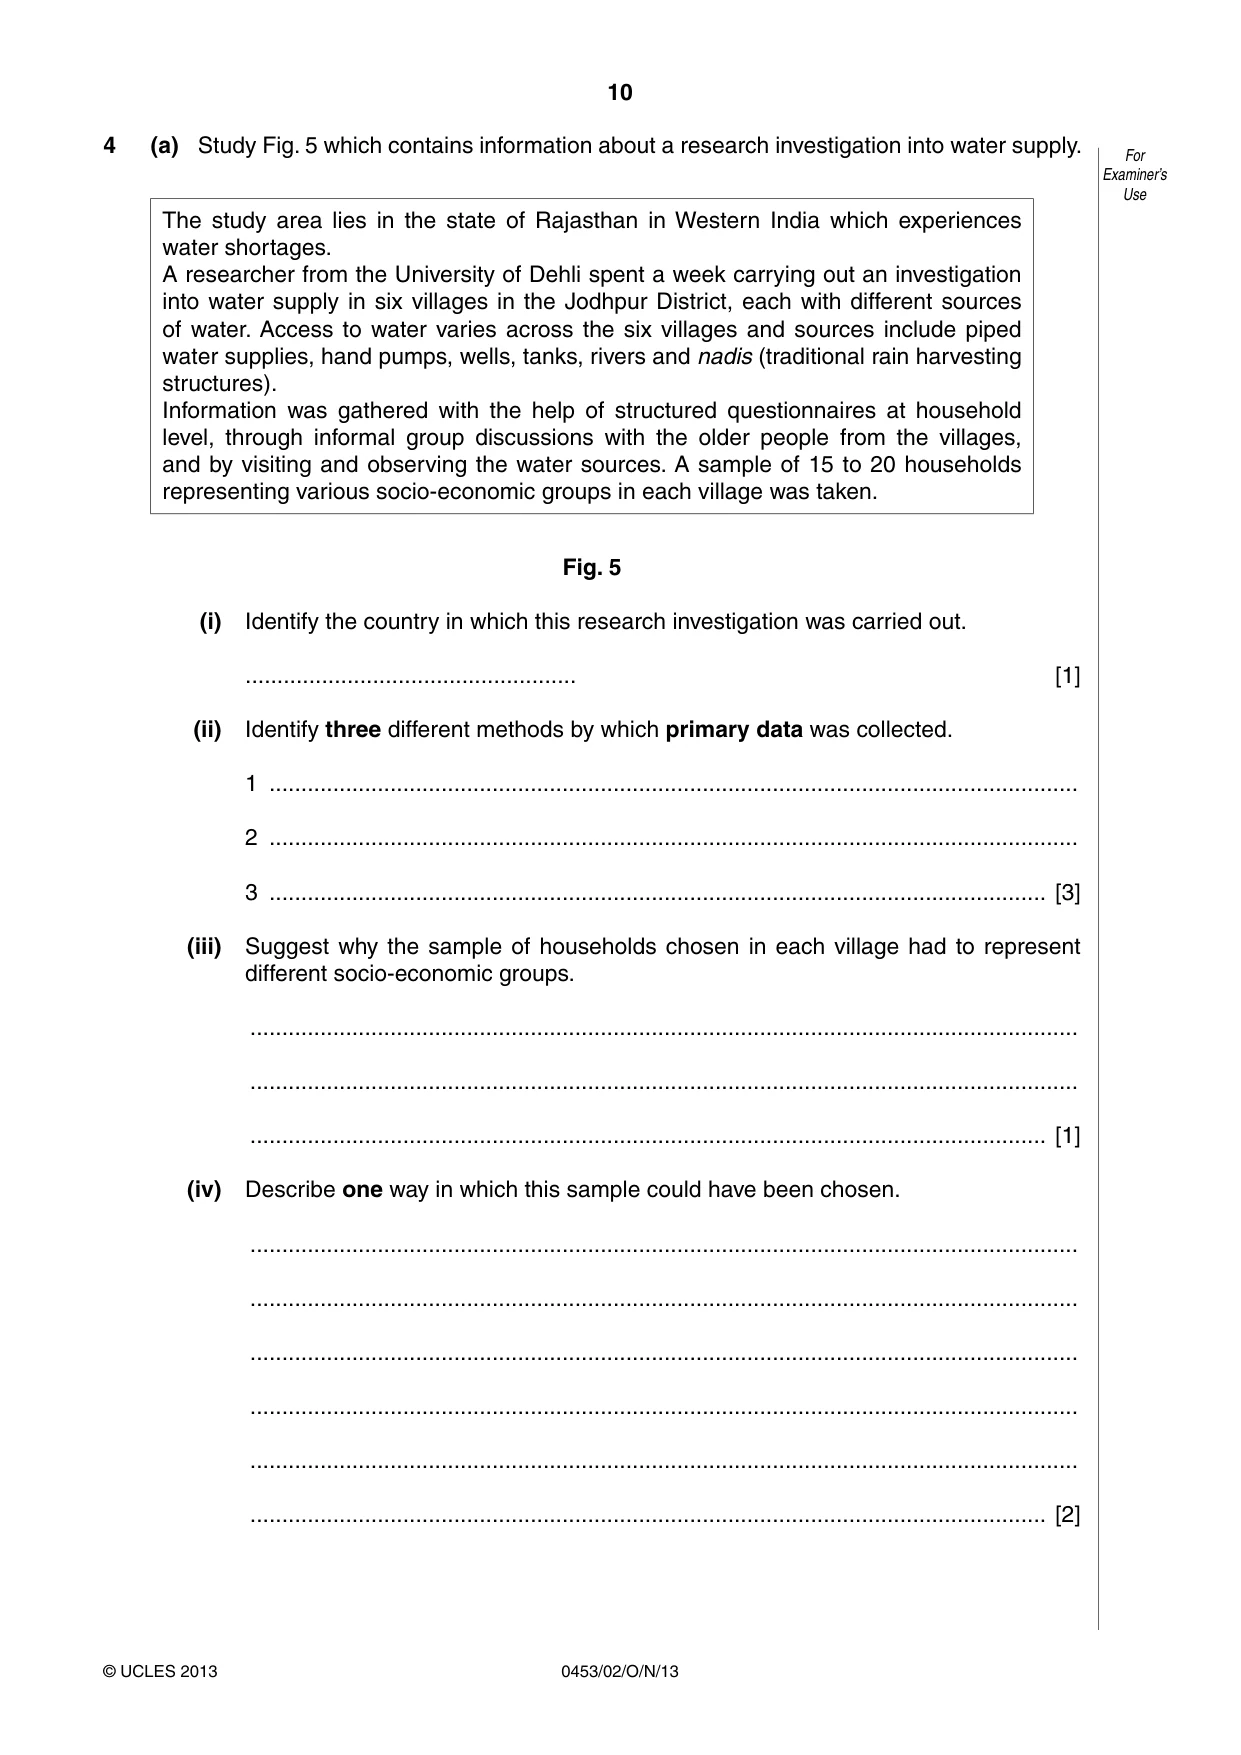
10 0453/02/O/N/13 © UCLES 2013 For Examiner’s Use 4 (a) Study Fig. 5 which contains information about a research investigation into water supply. The study area lies in the state of Rajasthan in Western India which experiences water shortages. A researcher from the University of Dehli spent a week carrying out an investigation into water supply in six villages in the Jodhpur District, each with different sources of water. Access to water varies across the six villages and sources include piped water supplies, hand pumps, wells, tanks, rivers and nadis (traditional rain harvesting structures). Information was gathered with the help of structured questionnaires at household level, through informal group discussions with the older people from the villages, and by visiting and observing the water sources. A sample of 15 to 20 households representing various socio-economic groups in each village was taken. Fig. 5 (i) Identify the country in which this research investigation was carried out. … [1] (ii) Identify three different methods by which primary data was collected. 1 … 2 … 3 … [3] (iii) Suggest why the sample of households chosen in each village had to represent different socio-economic groups. … … … [1] (iv) Describe one way in which this sample could have been chosen. … … … … … … [2]
Question paper, page 11
11 0453/02/O/N/13 © UCLES 2013 [Turn over For Examiner’s Use (v) Describe the practical difficulties which the researcher may have experienced when collecting the primary data. … … … … … … … … … … … … … … … … … … … … … … … … [6]
Question paper, page 12
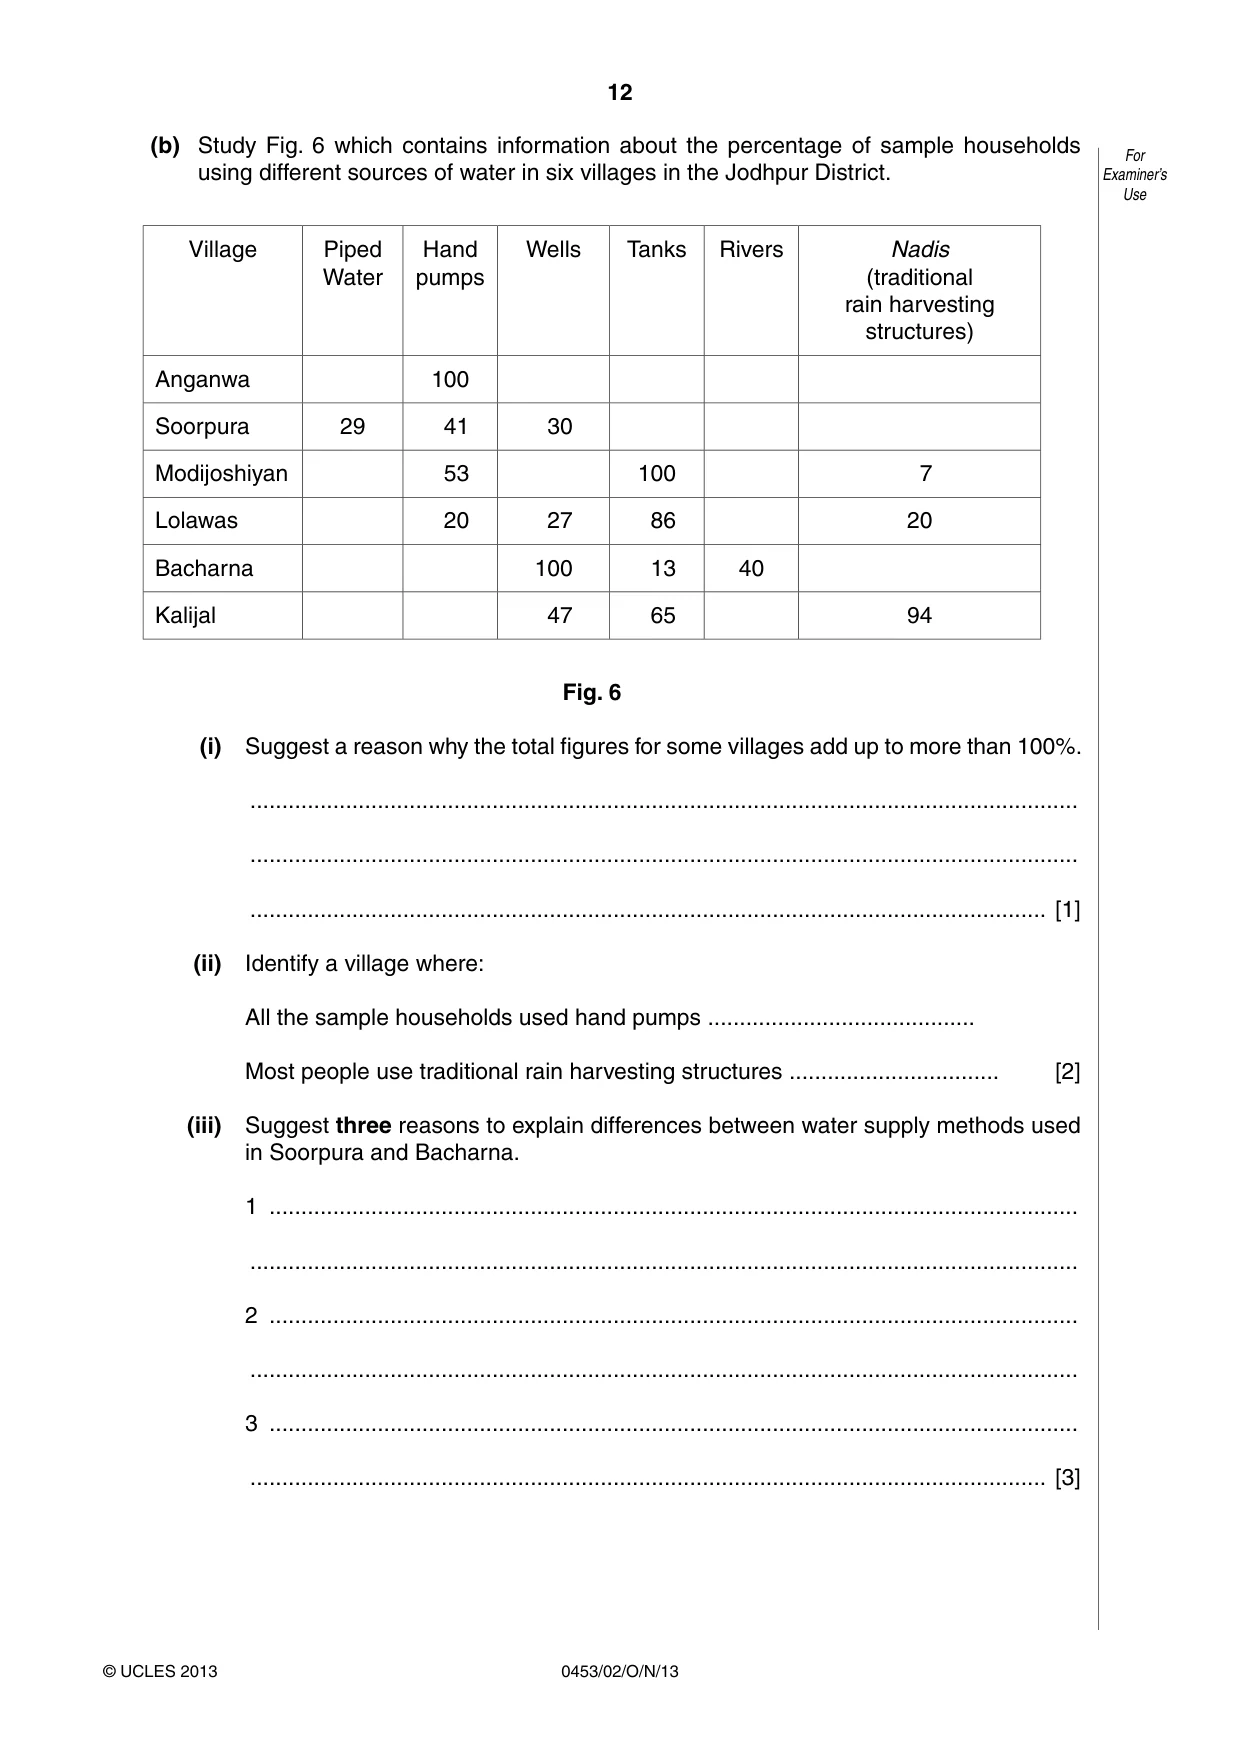
12 0453/02/O/N/13 © UCLES 2013 For Examiner’s Use (b) Study Fig. 6 which contains information about the percentage of sample households using different sources of water in six villages in the Jodhpur District. Village Piped Water Hand pumps Wells Tanks Rivers Nadis (traditional rain harvesting structures) Anganwa 100 Soorpura 29 41 30 Modijoshiyan 53 100 7 Lolawas 20 27 86 20 Bacharna 100 13 40 Kalijal 47 65 94 Fig. 6 (i) Suggest a reason why the total figures for some villages add up to more than 100%. … … … [1] (ii) Identify a village where: All the sample households used hand pumps … Most people use traditional rain harvesting structures … [2] (iii) Suggest three reasons to explain differences between water supply methods used in Soorpura and Bacharna. 1 … … 2 … … 3 … … [3]
Question paper, page 13
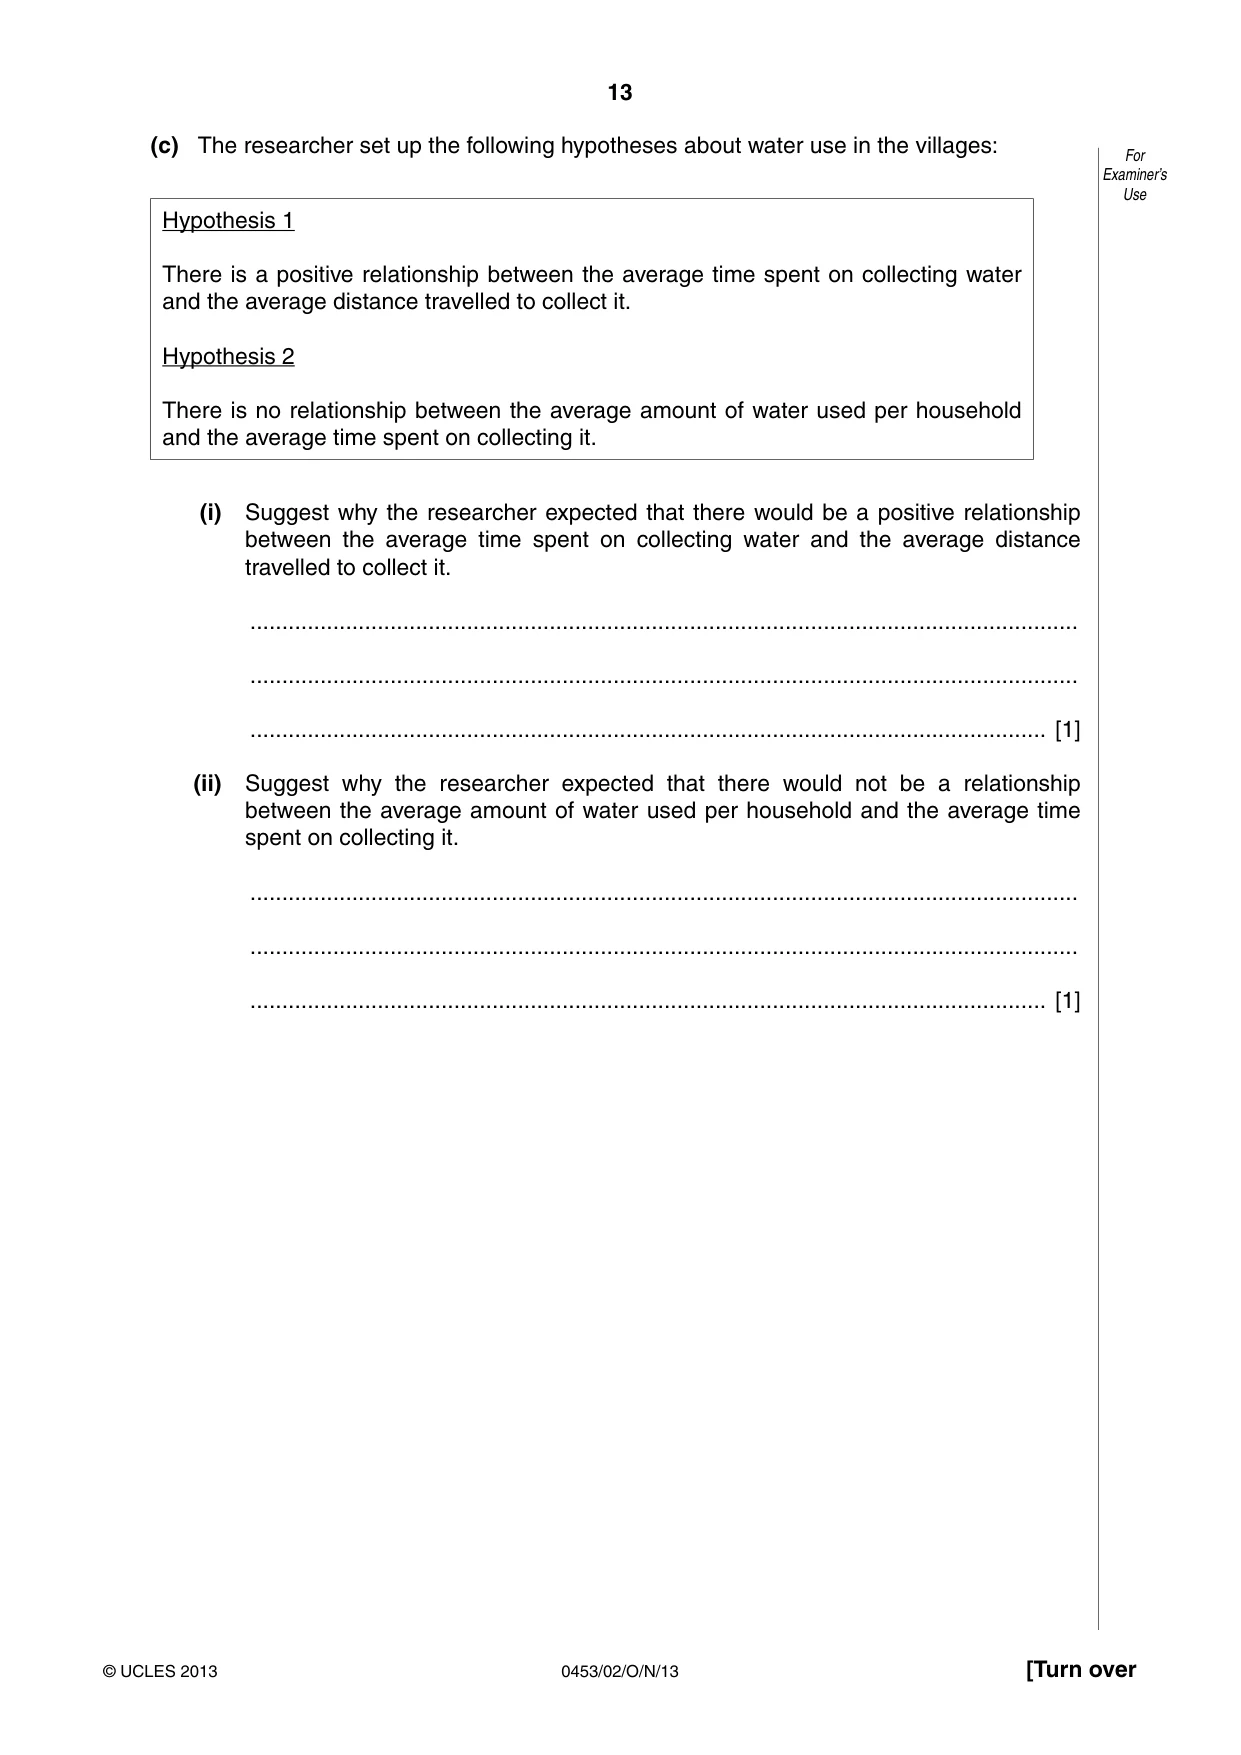
13 0453/02/O/N/13 © UCLES 2013 [Turn over For Examiner’s Use (c) The researcher set up the following hypotheses about water use in the villages: Hypothesis 1 There is a positive relationship between the average time spent on collecting water and the average distance travelled to collect it. Hypothesis 2 There is no relationship between the average amount of water used per household and the average time spent on collecting it. (i) Suggest why the researcher expected that there would be a positive relationship between the average time spent on collecting water and the average distance travelled to collect it. … … … [1] (ii) Suggest why the researcher expected that there would not be a relationship between the average amount of water used per household and the average time spent on collecting it. … … … [1]
Question paper, page 14
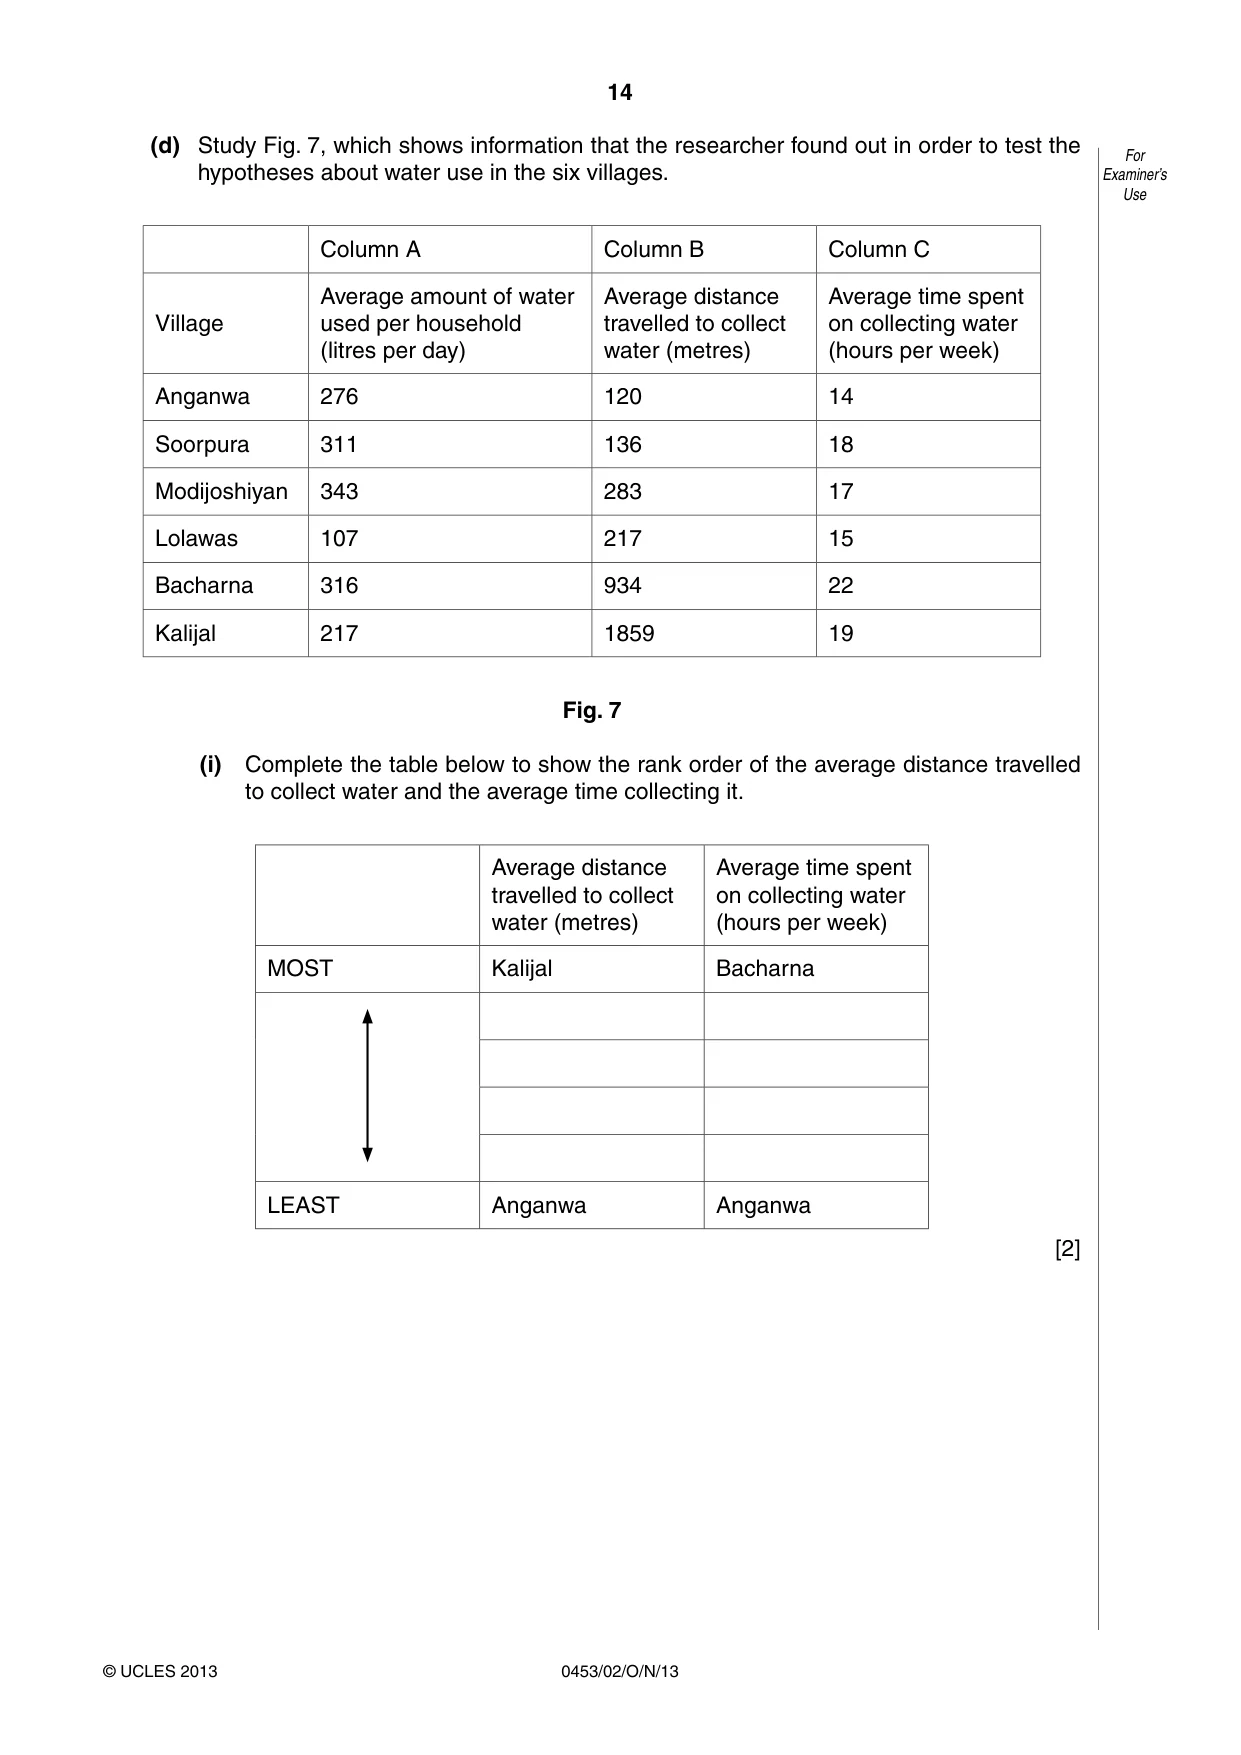
14 0453/02/O/N/13 © UCLES 2013 For Examiner’s Use (d) Study Fig. 7, which shows information that the researcher found out in order to test the hypotheses about water use in the six villages. Column A Column B Column C Village Average amount of water used per household (litres per day) Average distance travelled to collect water (metres) Average time spent on collecting water (hours per week) Anganwa 276 120 14 Soorpura 311 136 18 Modijoshiyan 343 283 17 Lolawas 107 217 15 Bacharna 316 934 22 Kalijal 217 1859 19 Fig. 7 (i) Complete the table below to show the rank order of the average distance travelled to collect water and the average time collecting it. Average distance travelled to collect water (metres) Average time spent on collecting water (hours per week) MOST Kalijal Bacharna LEAST Anganwa Anganwa [2]
Question paper, page 15
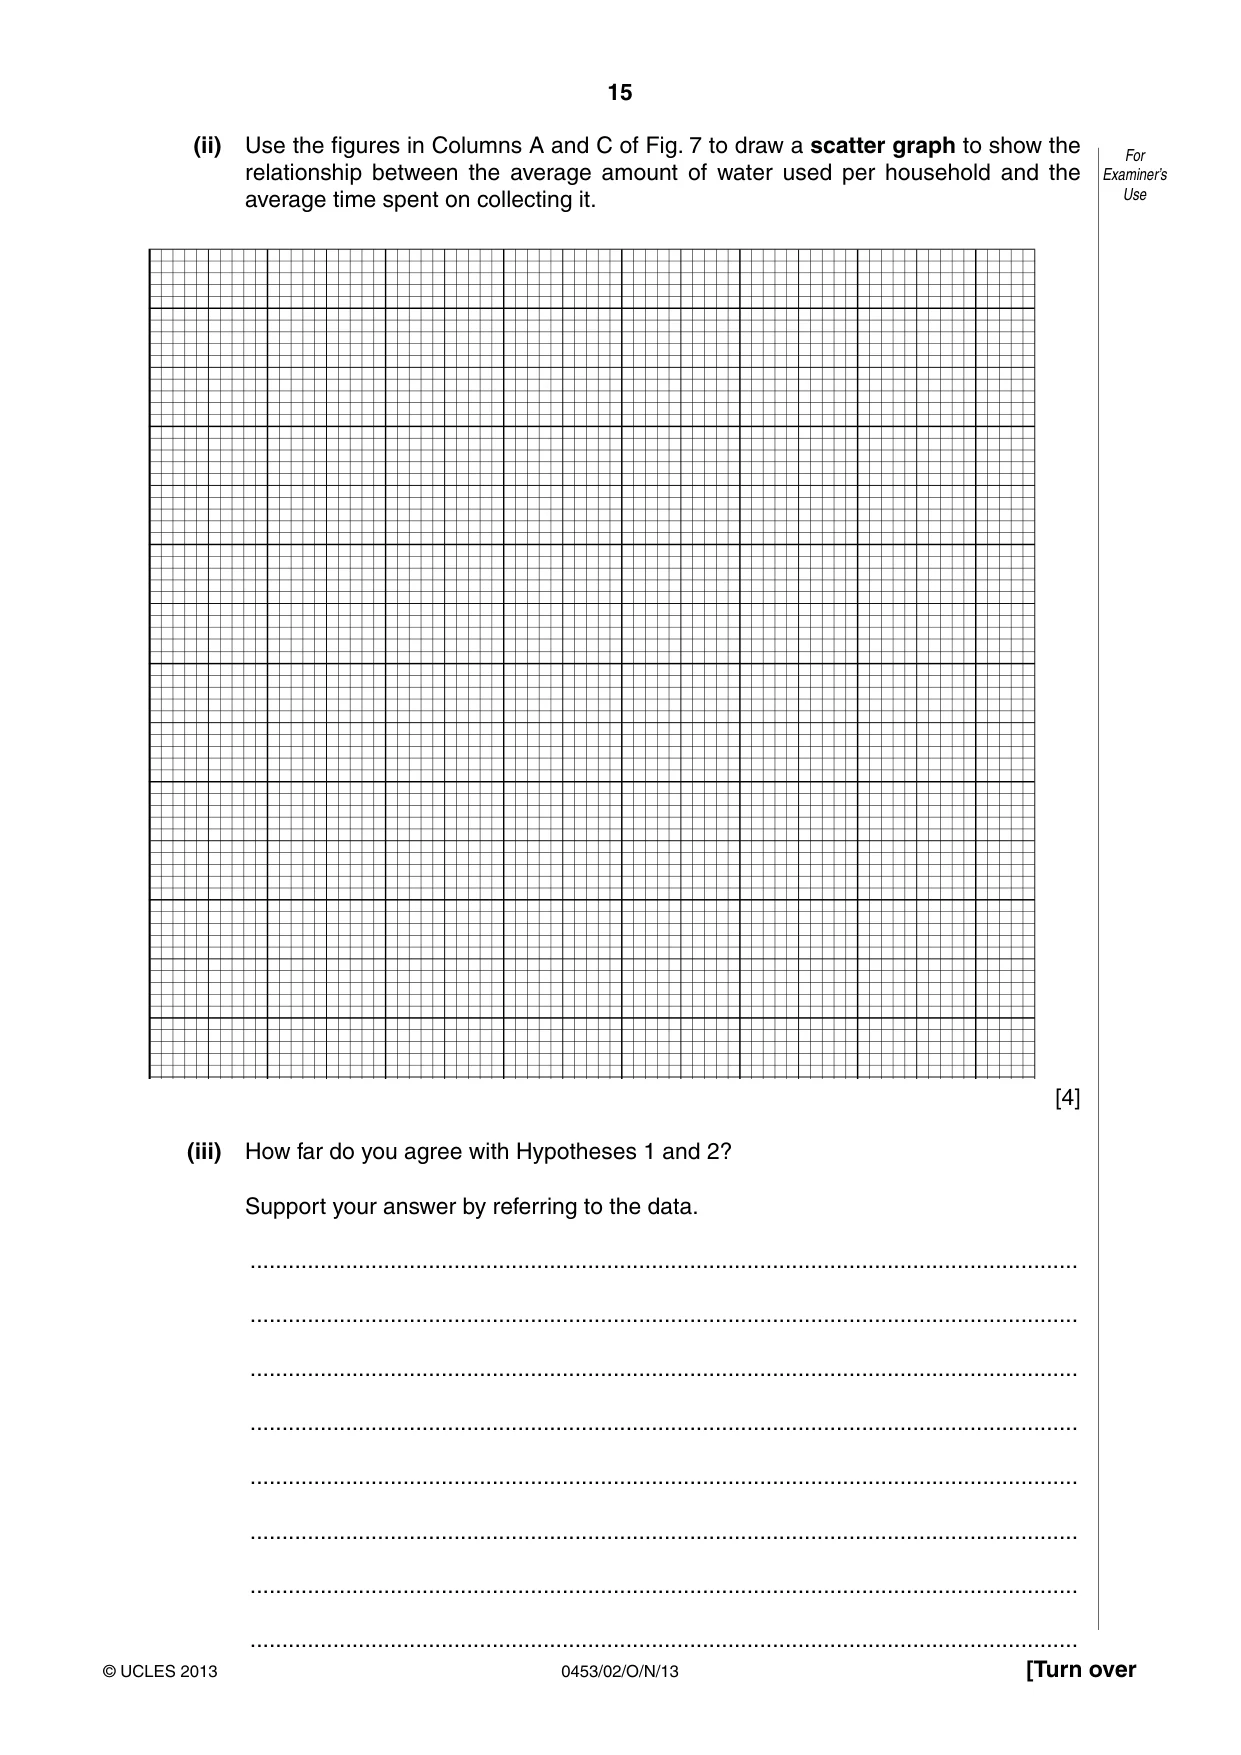
15 0453/02/O/N/13 © UCLES 2013 [Turn over For Examiner’s Use (ii) Use the figures in Columns A and C of Fig. 7 to draw a scatter graph to show the relationship between the average amount of water used per household and the average time spent on collecting it. [4] (iii) How far do you agree with Hypotheses 1 and 2? Support your answer by referring to the data. … … … … … … … …
Question paper, page 16
16 0453/02/O/N/13 © UCLES 2013 For Examiner’s Use Permission to reproduce items where third-party owned material protected by copyright is included has been sought and cleared where possible. Every reasonable effort has been made by the publisher (UCLES) to trace copyright holders, but if any items requiring clearance have unwittingly been included, the publisher will be pleased to make amends at the earliest possible opportunity. University of Cambridge International Examinations is part of the Cambridge Assessment Group. Cambridge Assessment is the brand name of University of Cambridge Local Examinations Syndicate (UCLES), which is itself a department of the University of Cambridge. … … … … … … … … … … … … … … … … … … … … … … … … [6] [Total: 33 marks]
Mark scheme, page 1
CAMBRIDGE INTERNATIONAL EXAMINATIONS International General Certificate of Secondary Education MARK SCHEME for the October/November 2013 series 0453 DEVELOPMENT STUDIES 0453/02 Paper 2, maximum raw mark 80 This mark scheme is published as an aid to teachers and candidates, to indicate the requirements of the examination. It shows the basis on which Examiners were instructed to award marks. It does not indicate the details of the discussions that took place at an Examiners’ meeting before marking began, which would have considered the acceptability of alternative answers. Mark schemes should be read in conjunction with the question paper and the Principal Examiner Report for Teachers. Cambridge will not enter into discussions about these mark schemes. Cambridge is publishing the mark schemes for the October/November 2013 series for most IGCSE, GCE Advanced Level and Advanced Subsidiary Level components and some Ordinary Level components.
Mark scheme, page 2
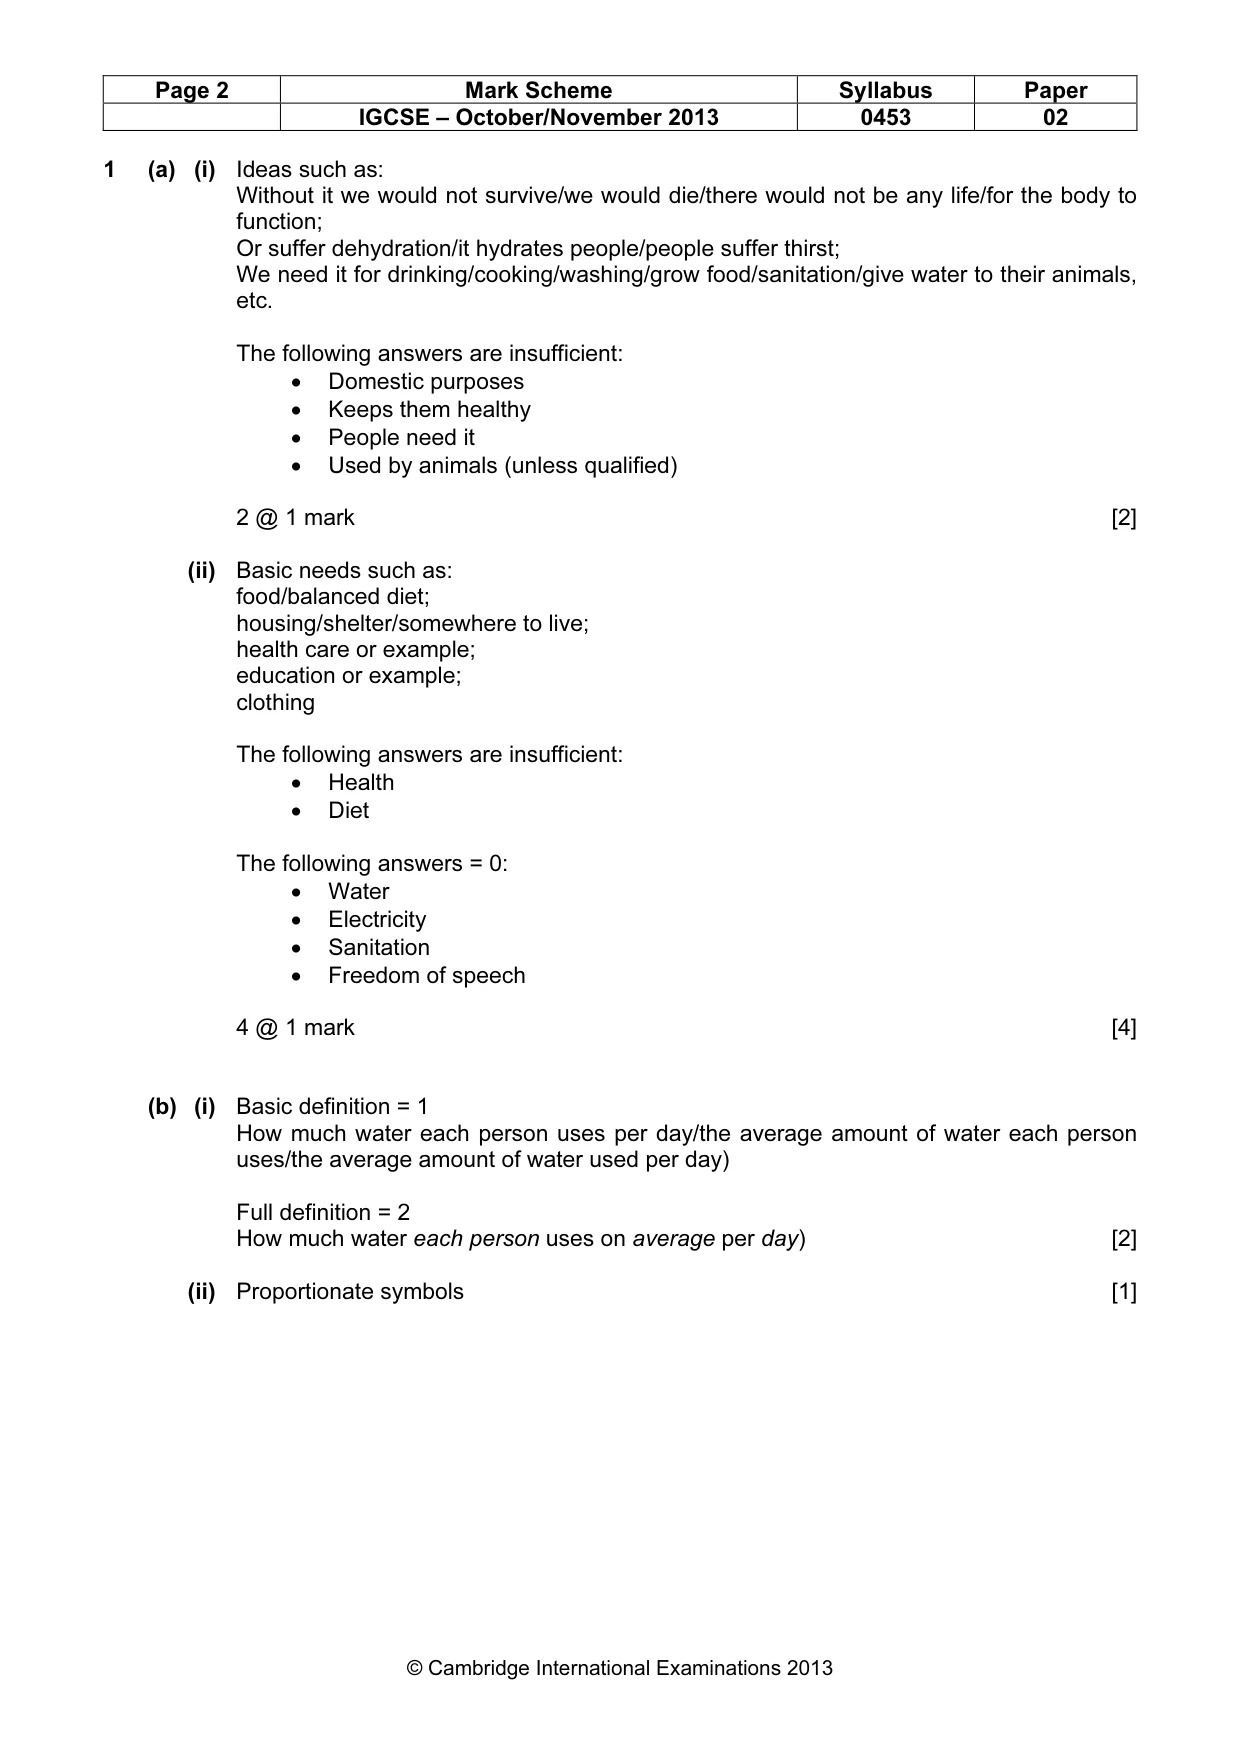
Page 2 Mark Scheme Syllabus Paper IGCSE – October/November 2013 0453 02 © Cambridge International Examinations 2013 1 (a) (i) Ideas such as: Without it we would not survive/we would die/there would not be any life/for the body to function; Or suffer dehydration/it hydrates people/people suffer thirst; We need it for drinking/cooking/washing/grow food/sanitation/give water to their animals, etc. The following answers are insufficient: • Domestic purposes • Keeps them healthy • People need it • Used by animals (unless qualified) 2 @ 1 mark [2] (ii) Basic needs such as: food/balanced diet; housing/shelter/somewhere to live; health care or example; education or example; clothing The following answers are insufficient: • Health • Diet The following answers = 0: • Water • Electricity • Sanitation • Freedom of speech 4 @ 1 mark [4] (b) (i) Basic definition = 1 How much water each person uses per day/the average amount of water each person uses/the average amount of water used per day) Full definition = 2 How much water each person uses on average per day) [2] (ii) Proportionate symbols [1]
Mark scheme, page 3
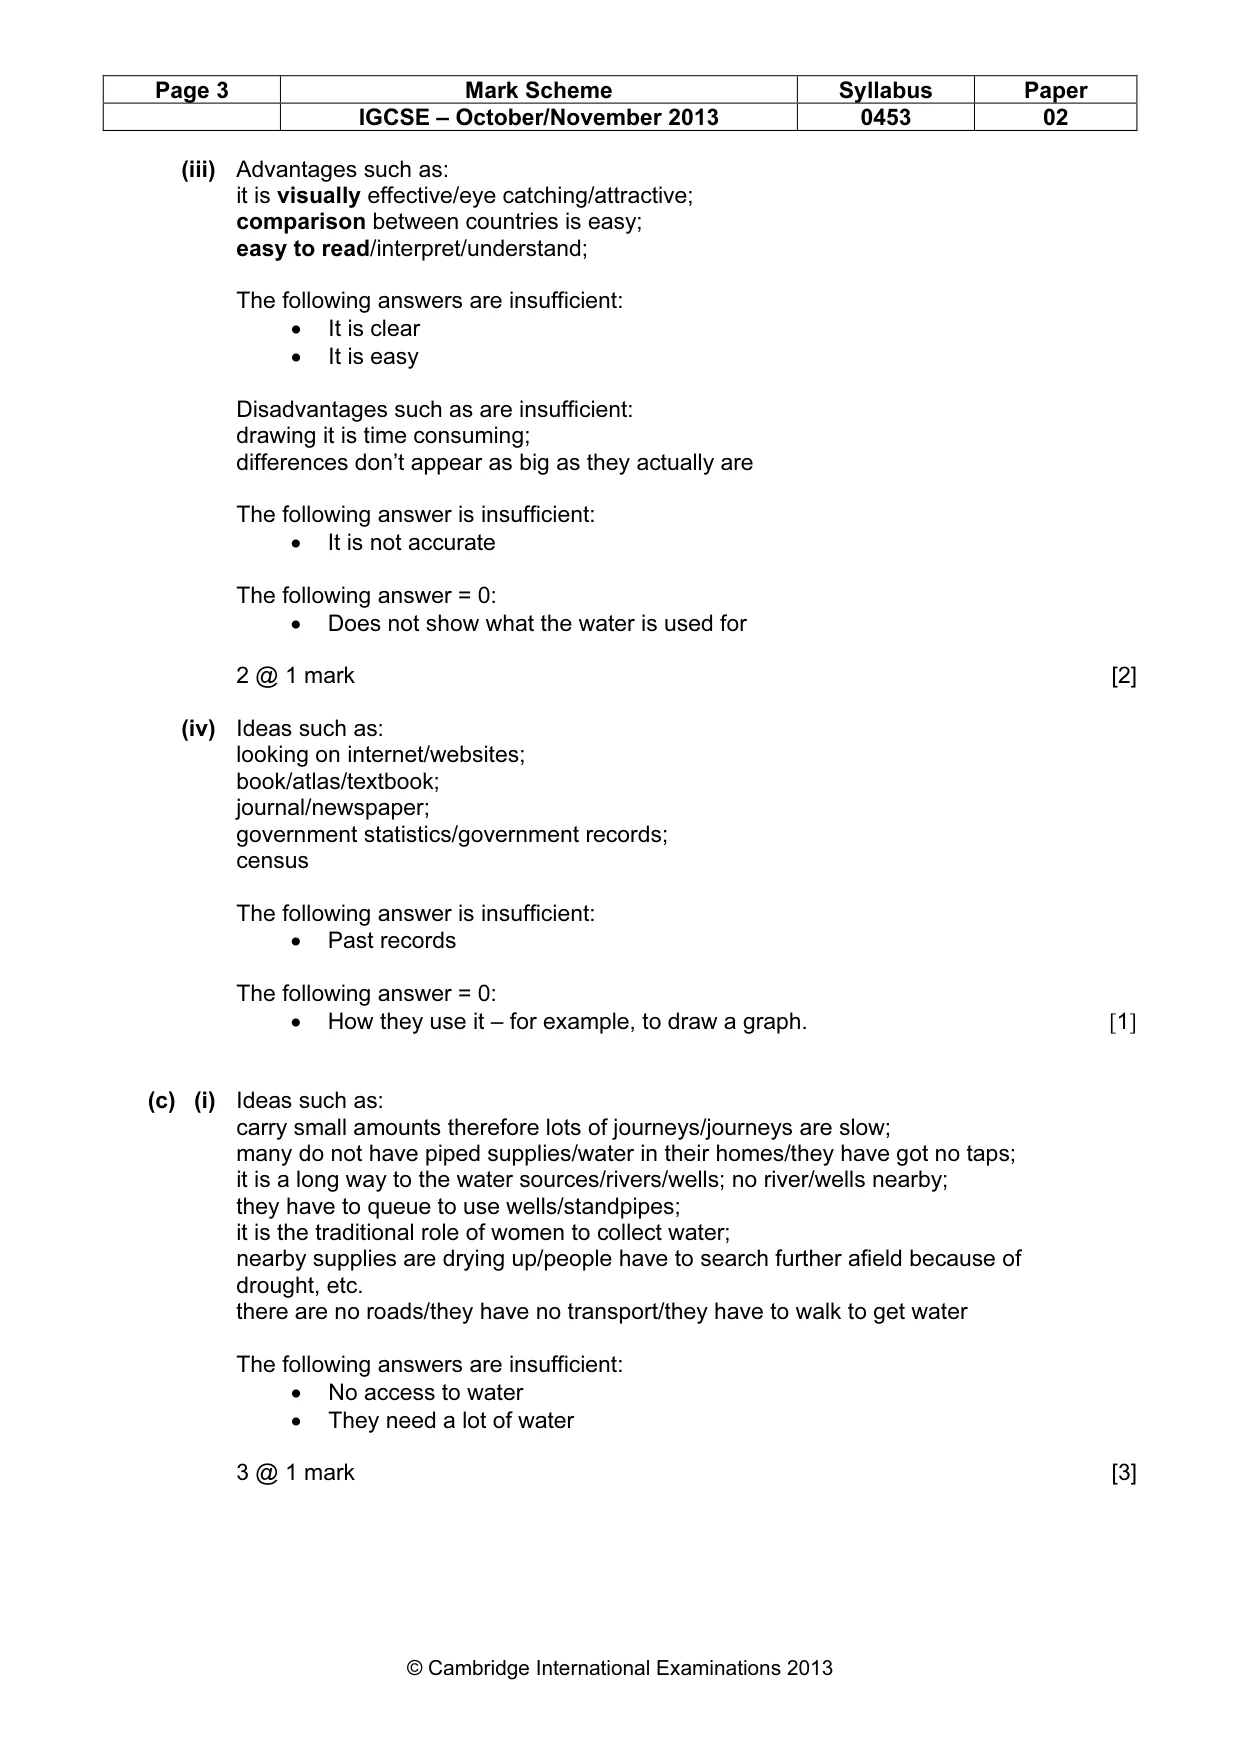
Page 3 Mark Scheme Syllabus Paper IGCSE – October/November 2013 0453 02 © Cambridge International Examinations 2013 (iii) Advantages such as: it is visually effective/eye catching/attractive; comparison between countries is easy; easy to read/interpret/understand; The following answers are insufficient: • It is clear • It is easy Disadvantages such as are insufficient: drawing it is time consuming; differences don’t appear as big as they actually are The following answer is insufficient: • It is not accurate The following answer = 0: • Does not show what the water is used for 2 @ 1 mark [2] (iv) Ideas such as: looking on internet/websites; book/atlas/textbook; journal/newspaper; government statistics/government records; census The following answer is insufficient: • Past records The following answer = 0: • How they use it – for example, to draw a graph. [1] (c) (i) Ideas such as: carry small amounts therefore lots of journeys/journeys are slow; many do not have piped supplies/water in their homes/they have got no taps; it is a long way to the water sources/rivers/wells; no river/wells nearby; they have to queue to use wells/standpipes; it is the traditional role of women to collect water; nearby supplies are drying up/people have to search further afield because of drought, etc. there are no roads/they have no transport/they have to walk to get water The following answers are insufficient: • No access to water • They need a lot of water 3 @ 1 mark [3]
Mark scheme, page 4
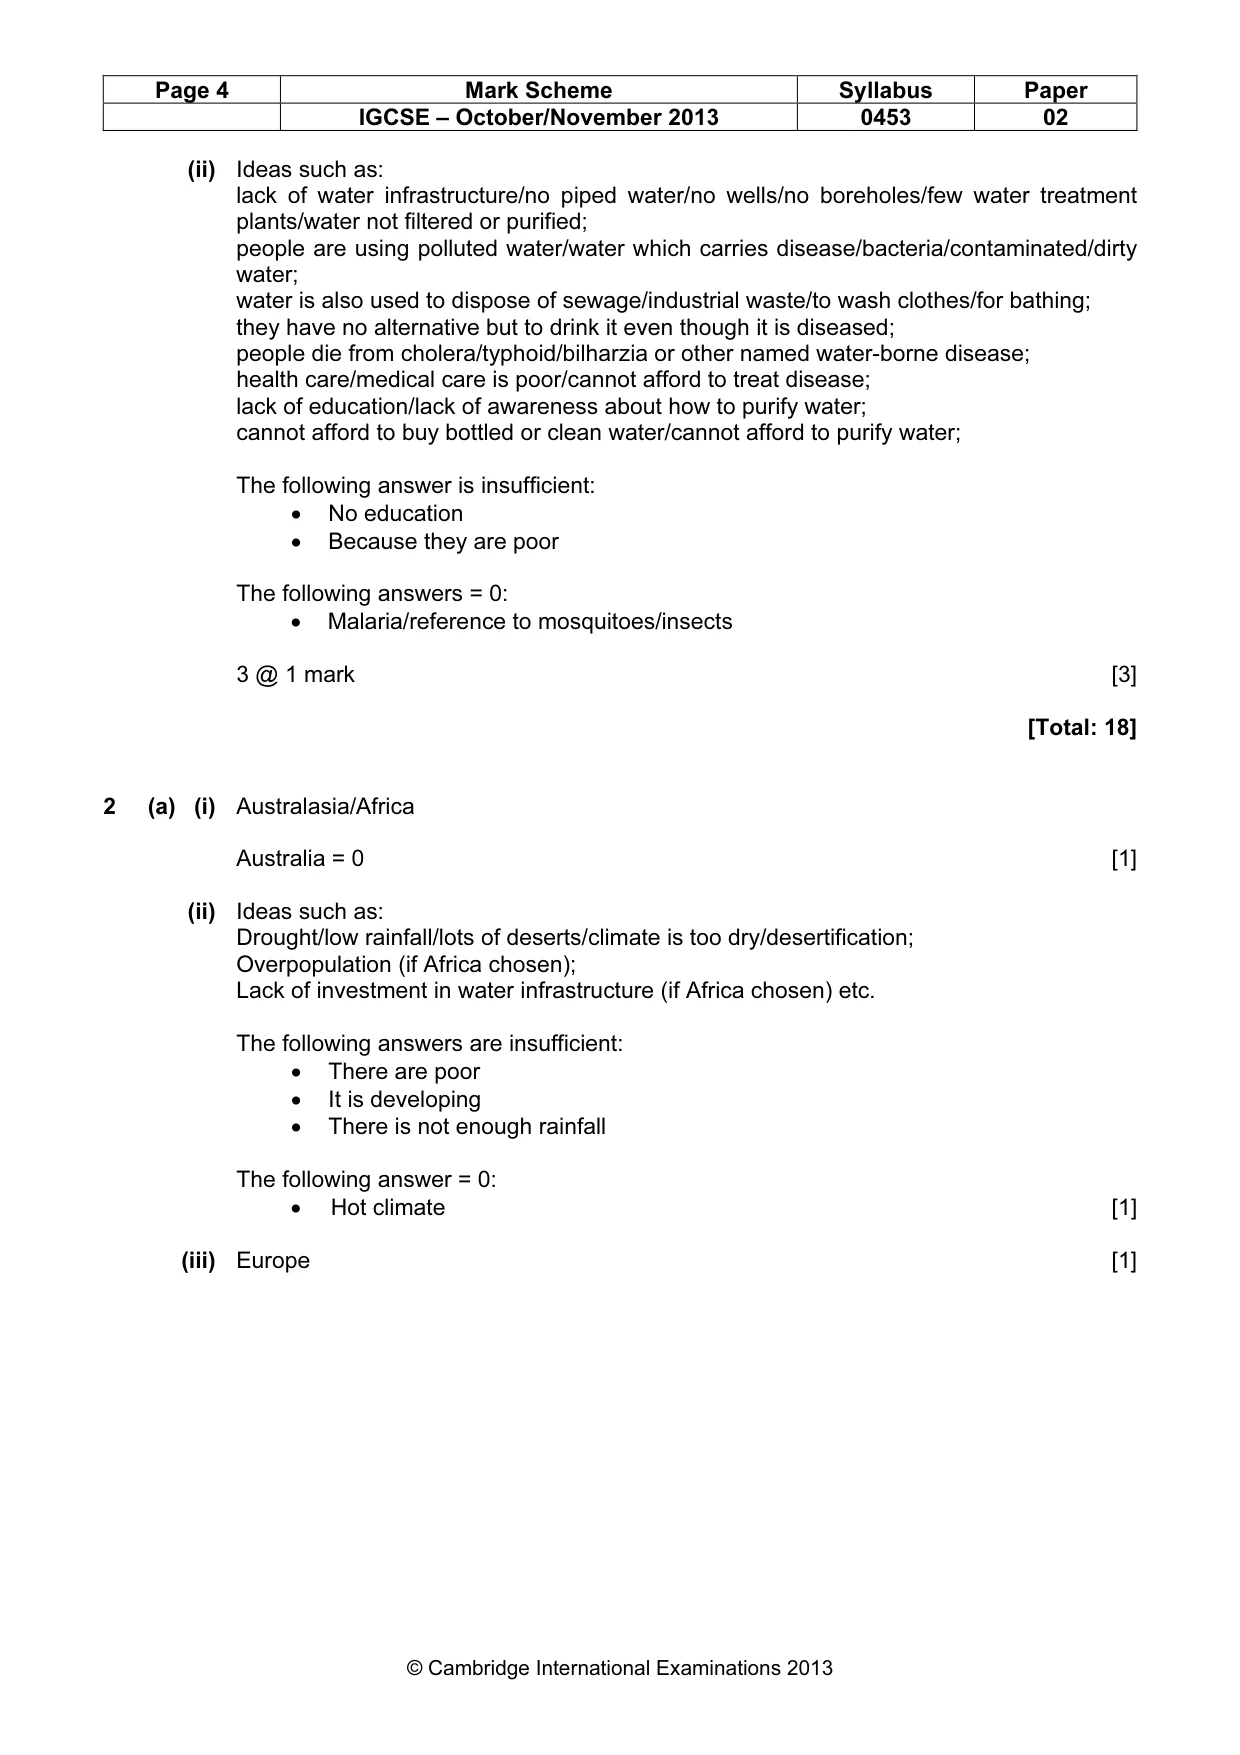
Page 4 Mark Scheme Syllabus Paper IGCSE – October/November 2013 0453 02 © Cambridge International Examinations 2013 (ii) Ideas such as: lack of water infrastructure/no piped water/no wells/no boreholes/few water treatment plants/water not filtered or purified; people are using polluted water/water which carries disease/bacteria/contaminated/dirty water; water is also used to dispose of sewage/industrial waste/to wash clothes/for bathing; they have no alternative but to drink it even though it is diseased; people die from cholera/typhoid/bilharzia or other named water-borne disease; health care/medical care is poor/cannot afford to treat disease; lack of education/lack of awareness about how to purify water; cannot afford to buy bottled or clean water/cannot afford to purify water; The following answer is insufficient: • No education • Because they are poor The following answers = 0: • Malaria/reference to mosquitoes/insects 3 @ 1 mark [3] [Total: 18] 2 (a) (i) Australasia/Africa Australia = 0 [1] (ii) Ideas such as: Drought/low rainfall/lots of deserts/climate is too dry/desertification; Overpopulation (if Africa chosen); Lack of investment in water infrastructure (if Africa chosen) etc. The following answers are insufficient: • There are poor • It is developing • There is not enough rainfall The following answer = 0: • Hot climate [1] (iii) Europe [1]
Mark scheme, page 5
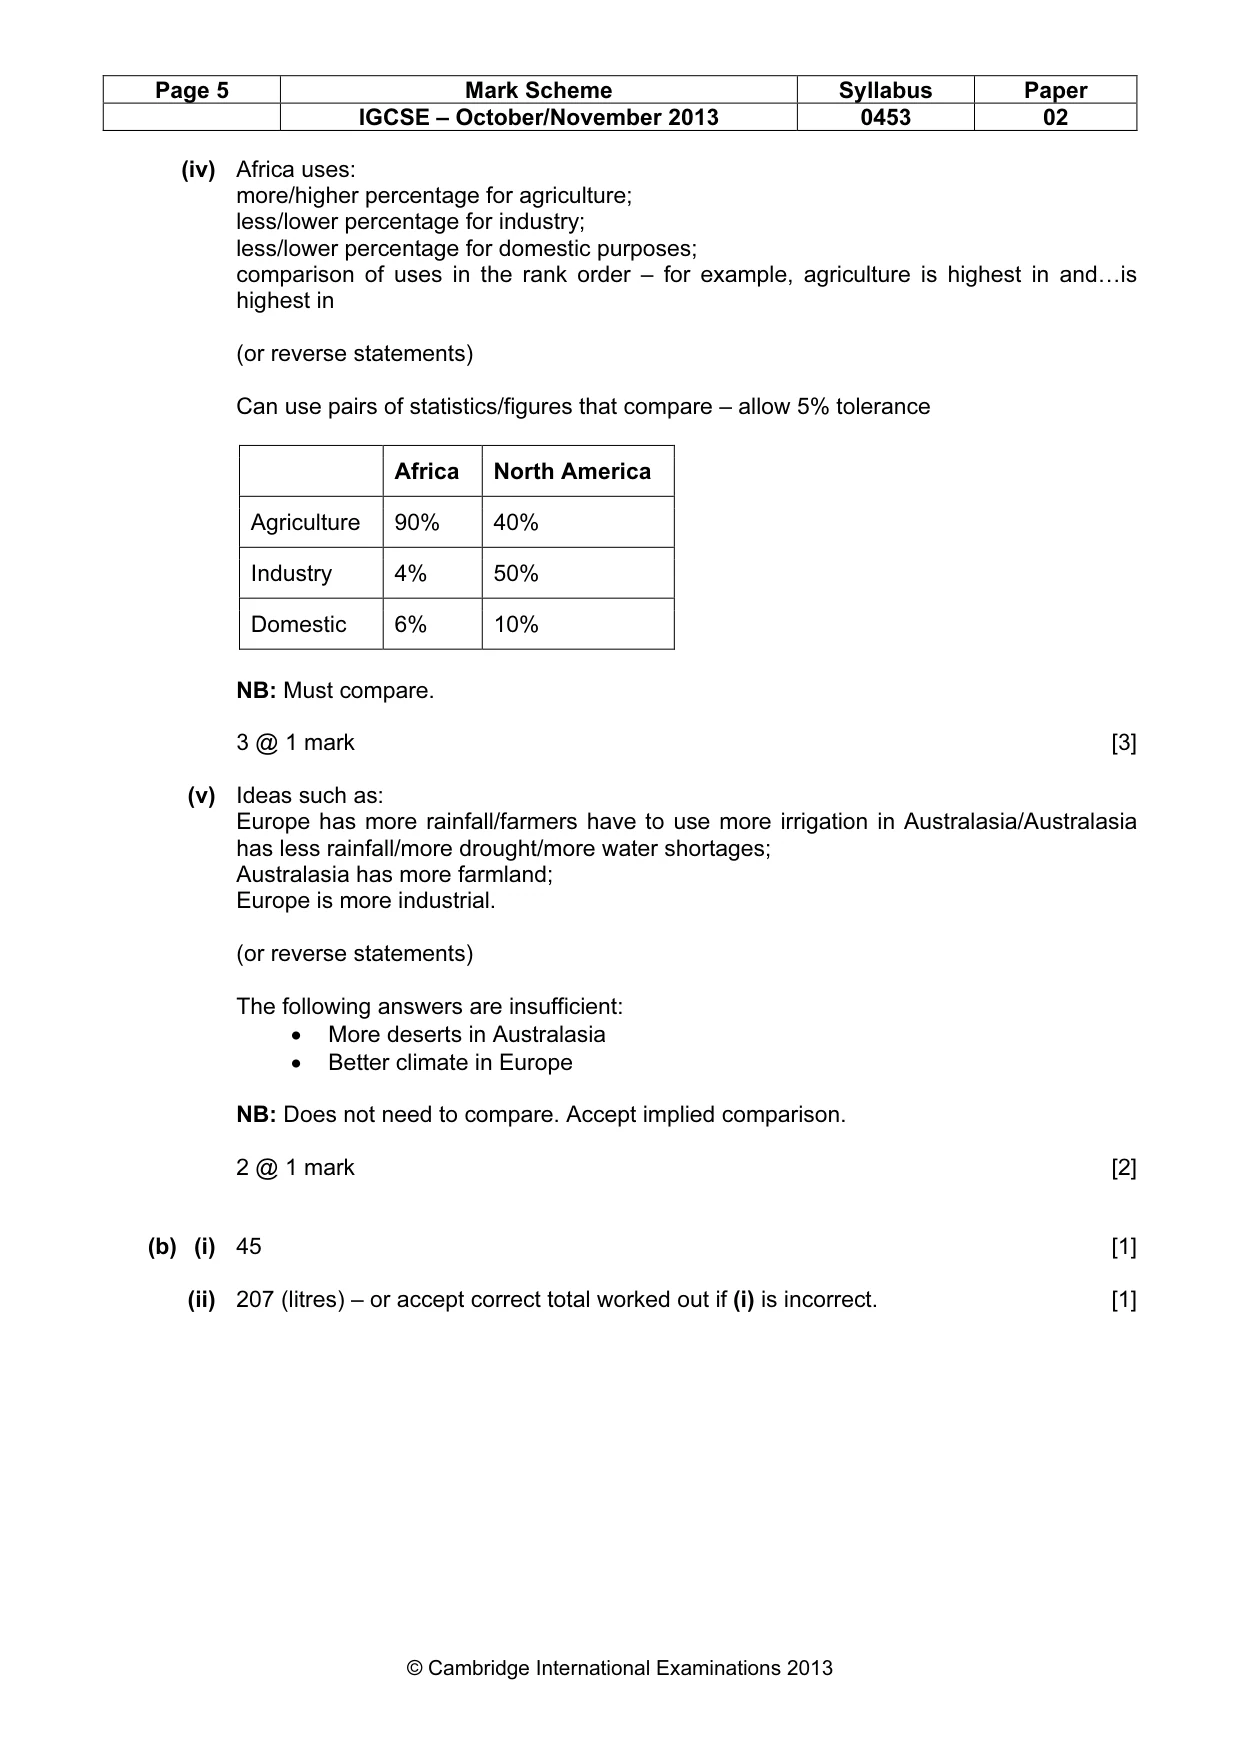
Page 5 Mark Scheme Syllabus Paper IGCSE – October/November 2013 0453 02 © Cambridge International Examinations 2013 (iv) Africa uses: more/higher percentage for agriculture; less/lower percentage for industry; less/lower percentage for domestic purposes; comparison of uses in the rank order – for example, agriculture is highest in and…is highest in (or reverse statements) Can use pairs of statistics/figures that compare – allow 5% tolerance Africa North America Agriculture 90% 40% Industry 4% 50% Domestic 6% 10% NB: Must compare. 3 @ 1 mark [3] (v) Ideas such as: Europe has more rainfall/farmers have to use more irrigation in Australasia/Australasia has less rainfall/more drought/more water shortages; Australasia has more farmland; Europe is more industrial. (or reverse statements) The following answers are insufficient: • More deserts in Australasia • Better climate in Europe NB: Does not need to compare. Accept implied comparison. 2 @ 1 mark [2] (b) (i) 45 [1] (ii) 207 (litres) – or accept correct total worked out if (i) is incorrect. [1]
Mark scheme, page 6
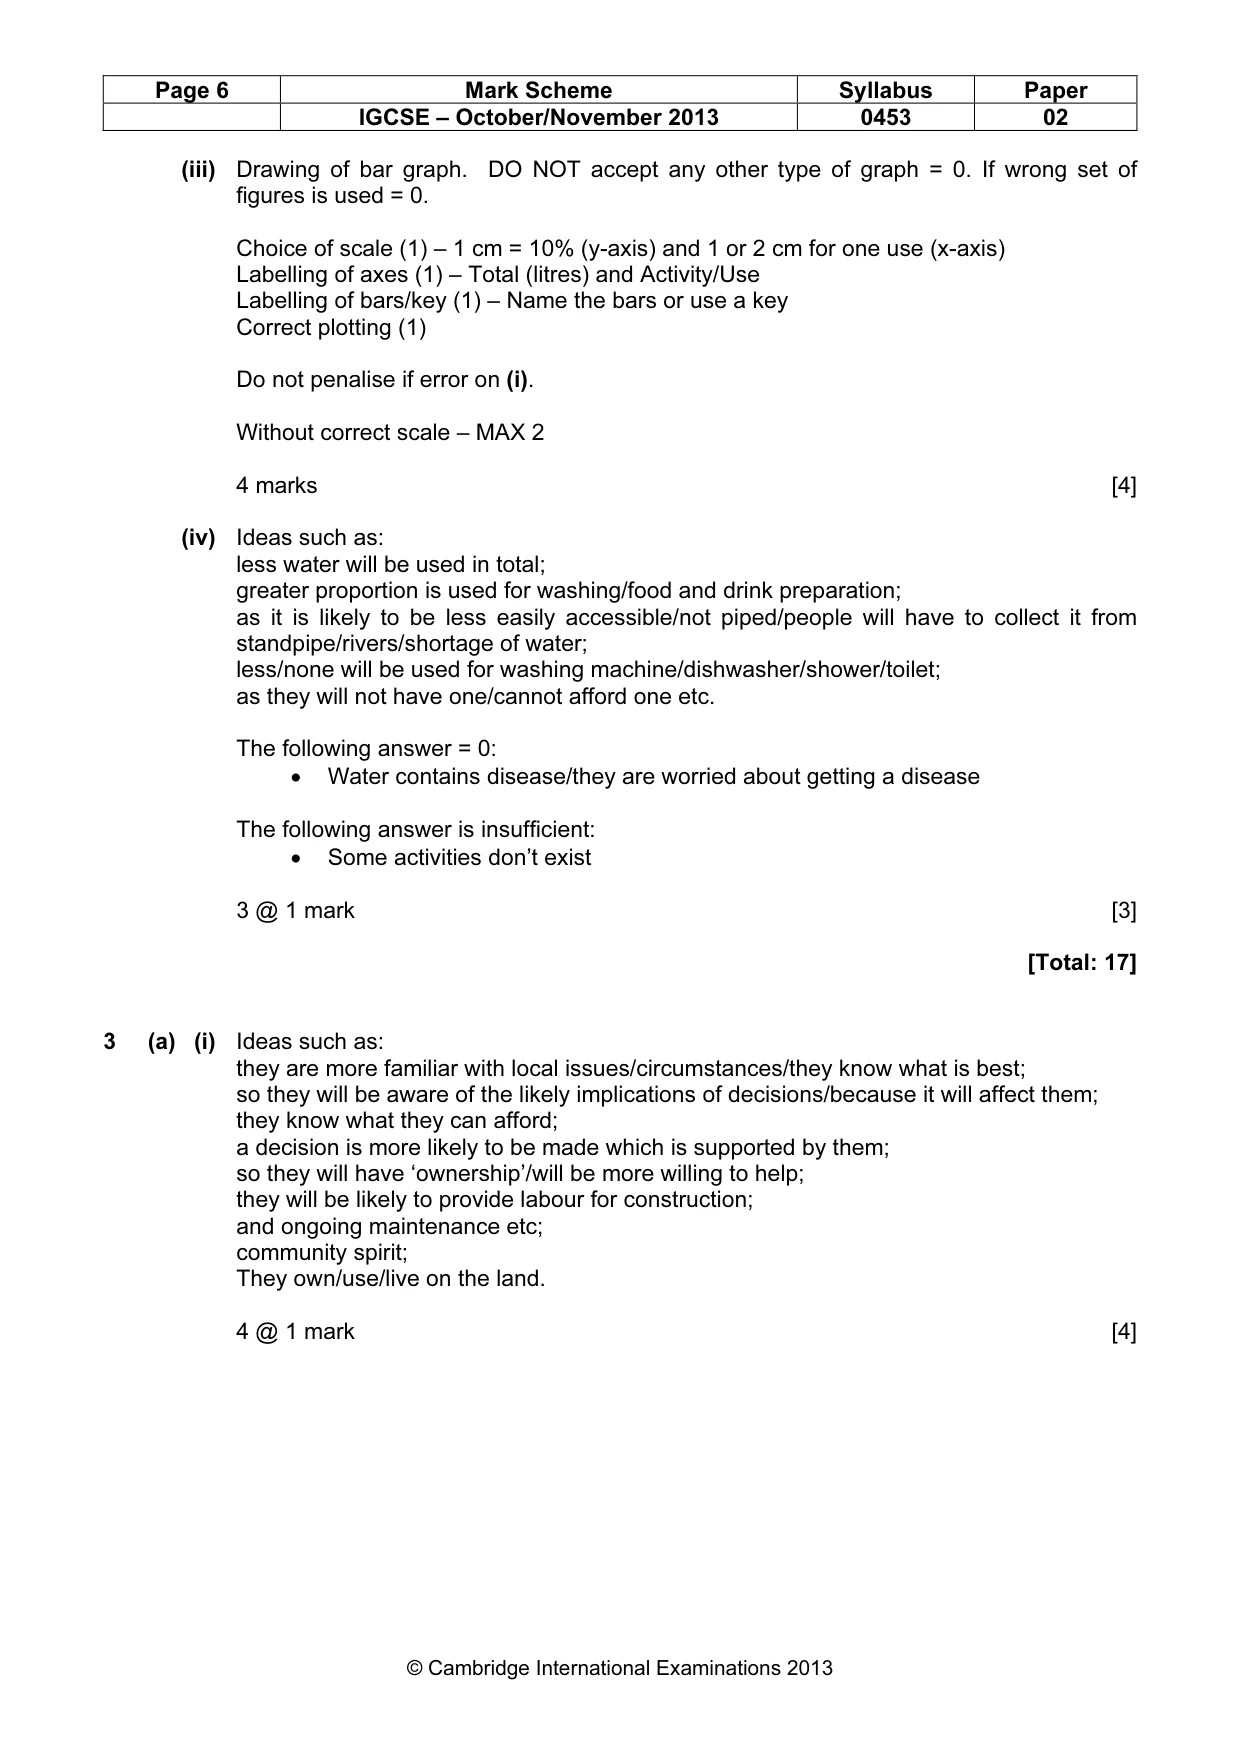
Page 6 Mark Scheme Syllabus Paper IGCSE – October/November 2013 0453 02 © Cambridge International Examinations 2013 (iii) Drawing of bar graph. DO NOT accept any other type of graph = 0. If wrong set of figures is used = 0. Choice of scale (1) – 1 cm = 10% (y-axis) and 1 or 2 cm for one use (x-axis) Labelling of axes (1) – Total (litres) and Activity/Use Labelling of bars/key (1) – Name the bars or use a key Correct plotting (1) Do not penalise if error on (i). Without correct scale – MAX 2 4 marks [4] (iv) Ideas such as: less water will be used in total; greater proportion is used for washing/food and drink preparation; as it is likely to be less easily accessible/not piped/people will have to collect it from standpipe/rivers/shortage of water; less/none will be used for washing machine/dishwasher/shower/toilet; as they will not have one/cannot afford one etc. The following answer = 0: • Water contains disease/they are worried about getting a disease The following answer is insufficient: • Some activities don’t exist 3 @ 1 mark [3] [Total: 17] 3 (a) (i) Ideas such as: they are more familiar with local issues/circumstances/they know what is best; so they will be aware of the likely implications of decisions/because it will affect them; they know what they can afford; a decision is more likely to be made which is supported by them; so they will have ‘ownership’/will be more willing to help; they will be likely to provide labour for construction; and ongoing maintenance etc; community spirit; They own/use/live on the land. 4 @ 1 mark [4]
Mark scheme, page 7
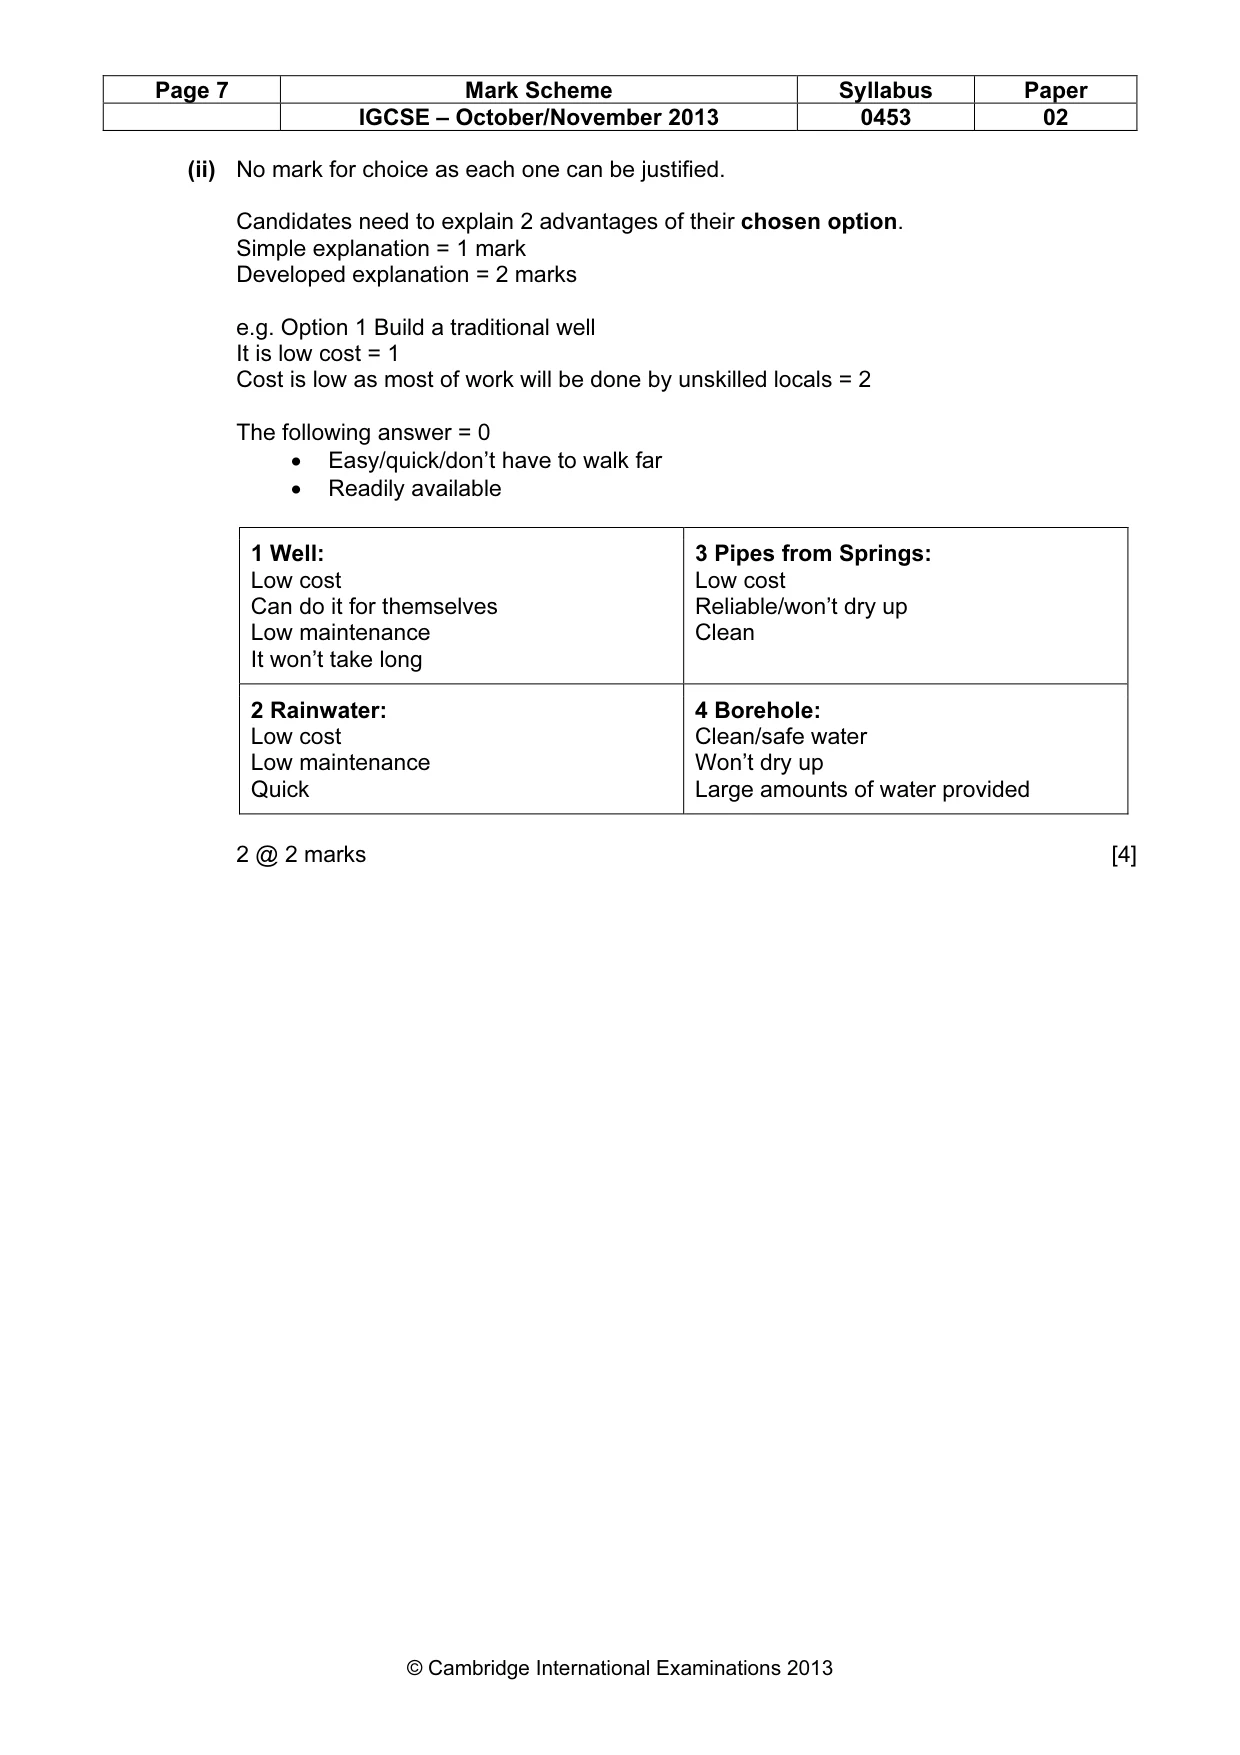
Page 7 Mark Scheme Syllabus Paper IGCSE – October/November 2013 0453 02 © Cambridge International Examinations 2013 (ii) No mark for choice as each one can be justified. Candidates need to explain 2 advantages of their chosen option. Simple explanation = 1 mark Developed explanation = 2 marks e.g. Option 1 Build a traditional well It is low cost = 1 Cost is low as most of work will be done by unskilled locals = 2 The following answer = 0 • Easy/quick/don’t have to walk far • Readily available 1 Well: Low cost Can do it for themselves Low maintenance It won’t take long 3 Pipes from Springs: Low cost Reliable/won’t dry up Clean 2 Rainwater: Low cost Low maintenance Quick 4 Borehole: Clean/safe water Won’t dry up Large amounts of water provided 2 @ 2 marks [4]
Mark scheme, page 8
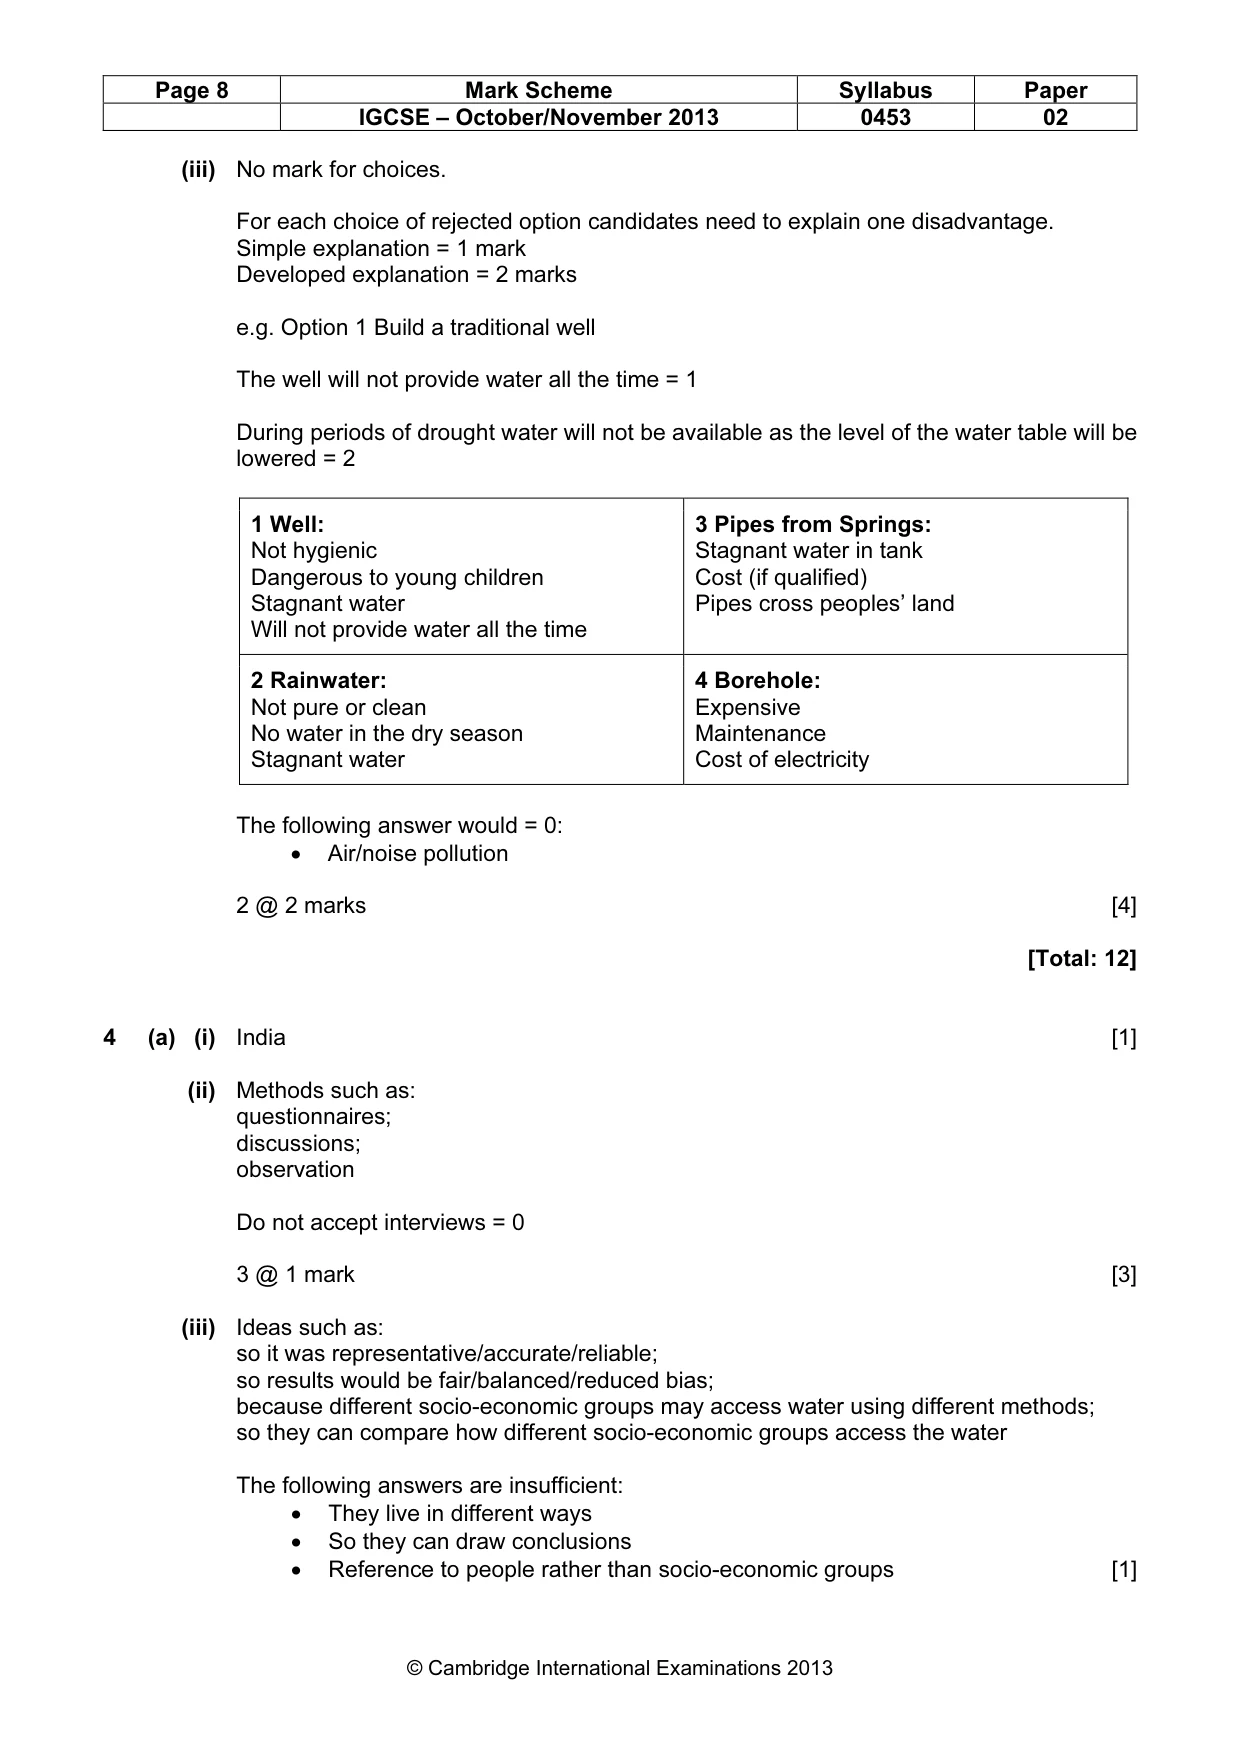
Page 8 Mark Scheme Syllabus Paper IGCSE – October/November 2013 0453 02 © Cambridge International Examinations 2013 (iii) No mark for choices. For each choice of rejected option candidates need to explain one disadvantage. Simple explanation = 1 mark Developed explanation = 2 marks e.g. Option 1 Build a traditional well The well will not provide water all the time = 1 During periods of drought water will not be available as the level of the water table will be lowered = 2 1 Well: Not hygienic Dangerous to young children Stagnant water Will not provide water all the time 3 Pipes from Springs: Stagnant water in tank Cost (if qualified) Pipes cross peoples’ land 2 Rainwater: Not pure or clean No water in the dry season Stagnant water 4 Borehole: Expensive Maintenance Cost of electricity The following answer would = 0: • Air/noise pollution 2 @ 2 marks [4] [Total: 12] 4 (a) (i) India [1] (ii) Methods such as: questionnaires; discussions; observation Do not accept interviews = 0 3 @ 1 mark [3] (iii) Ideas such as: so it was representative/accurate/reliable; so results would be fair/balanced/reduced bias; because different socio-economic groups may access water using different methods; so they can compare how different socio-economic groups access the water The following answers are insufficient: • They live in different ways • So they can draw conclusions • Reference to people rather than socio-economic groups [1]
Mark scheme, page 9
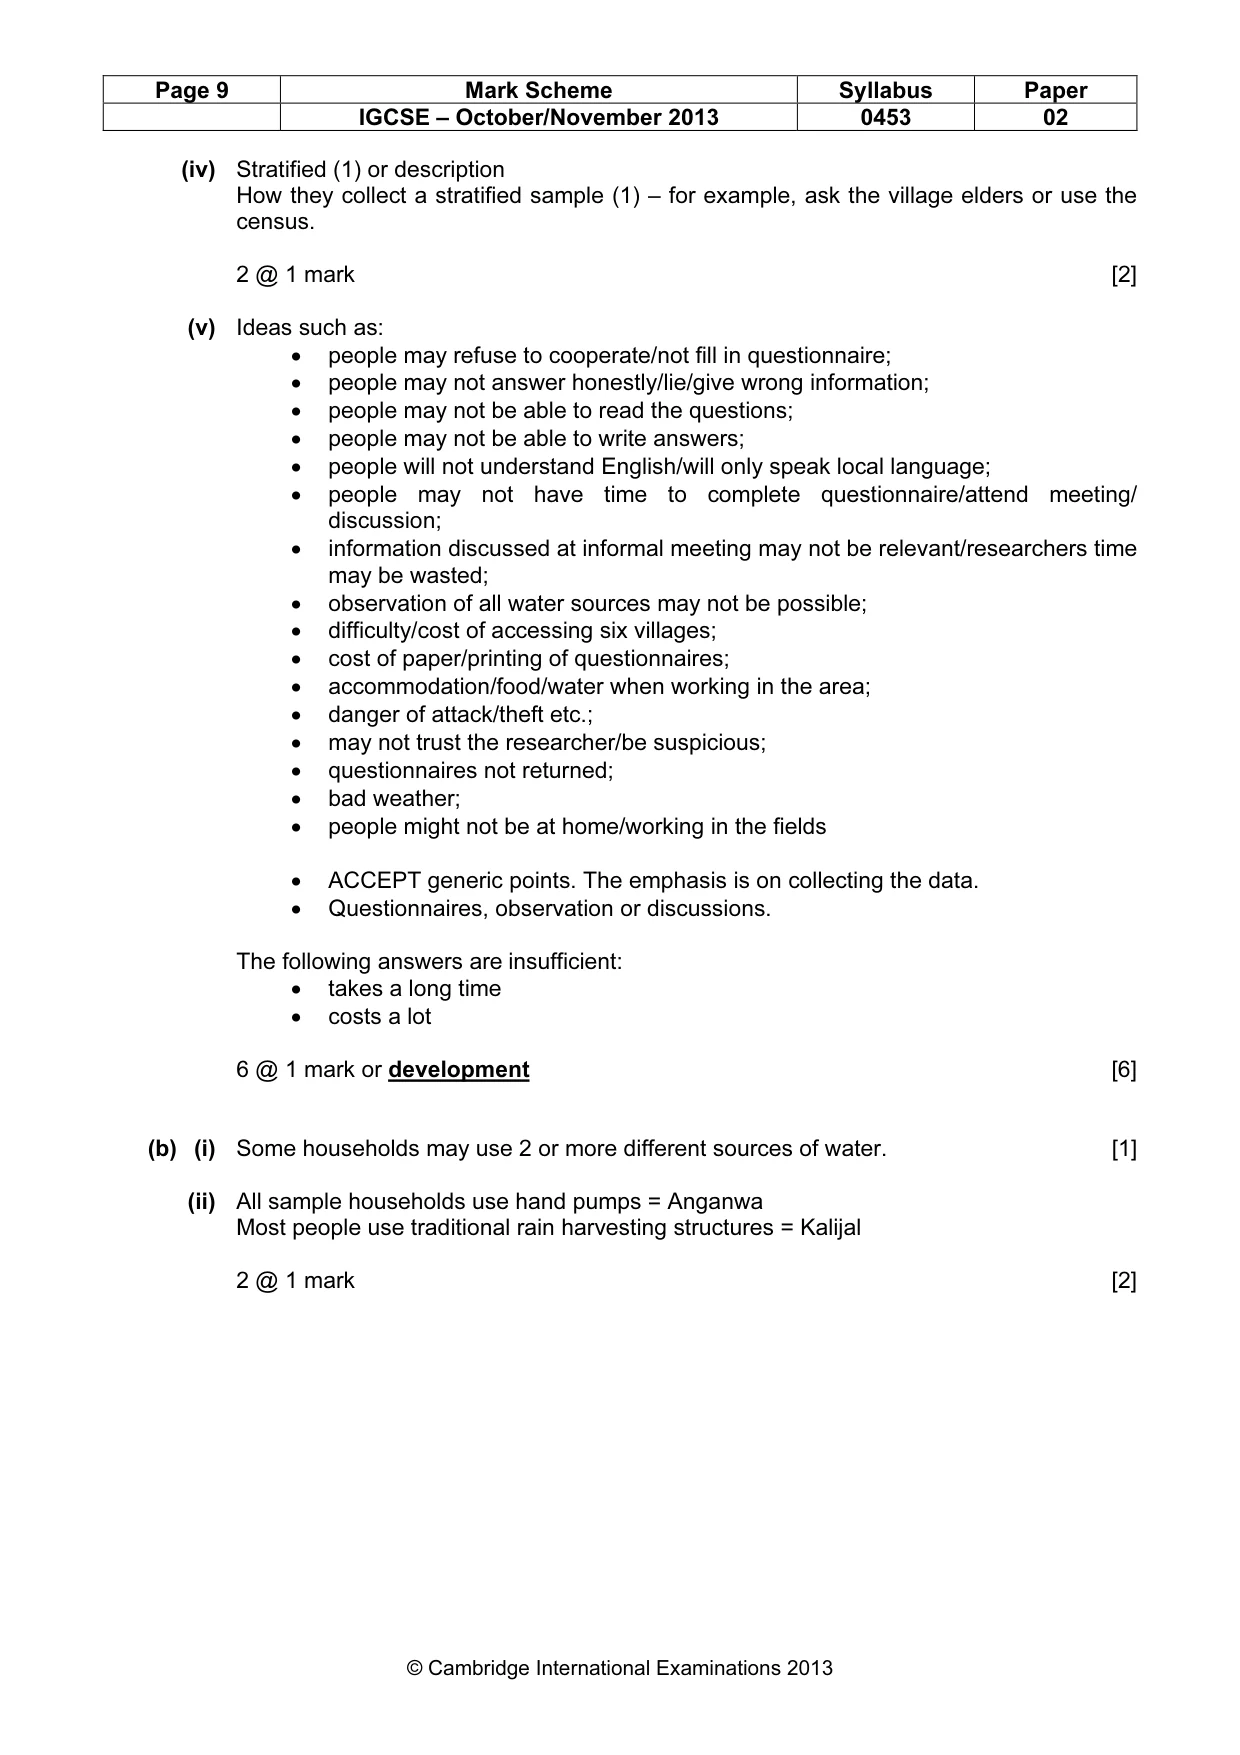
Page 9 Mark Scheme Syllabus Paper IGCSE – October/November 2013 0453 02 © Cambridge International Examinations 2013 (iv) Stratified (1) or description How they collect a stratified sample (1) – for example, ask the village elders or use the census. 2 @ 1 mark [2] (v) Ideas such as: • people may refuse to cooperate/not fill in questionnaire; • people may not answer honestly/lie/give wrong information; • people may not be able to read the questions; • people may not be able to write answers; • people will not understand English/will only speak local language; • people may not have time to complete questionnaire/attend meeting/ discussion; • information discussed at informal meeting may not be relevant/researchers time may be wasted; • observation of all water sources may not be possible; • difficulty/cost of accessing six villages; • cost of paper/printing of questionnaires; • accommodation/food/water when working in the area; • danger of attack/theft etc.; • may not trust the researcher/be suspicious; • questionnaires not returned; • bad weather; • people might not be at home/working in the fields • ACCEPT generic points. The emphasis is on collecting the data. • Questionnaires, observation or discussions. The following answers are insufficient: • takes a long time • costs a lot 6 @ 1 mark or development [6] (b) (i) Some households may use 2 or more different sources of water. [1] (ii) All sample households use hand pumps = Anganwa Most people use traditional rain harvesting structures = Kalijal 2 @ 1 mark [2]
Mark scheme, page 10
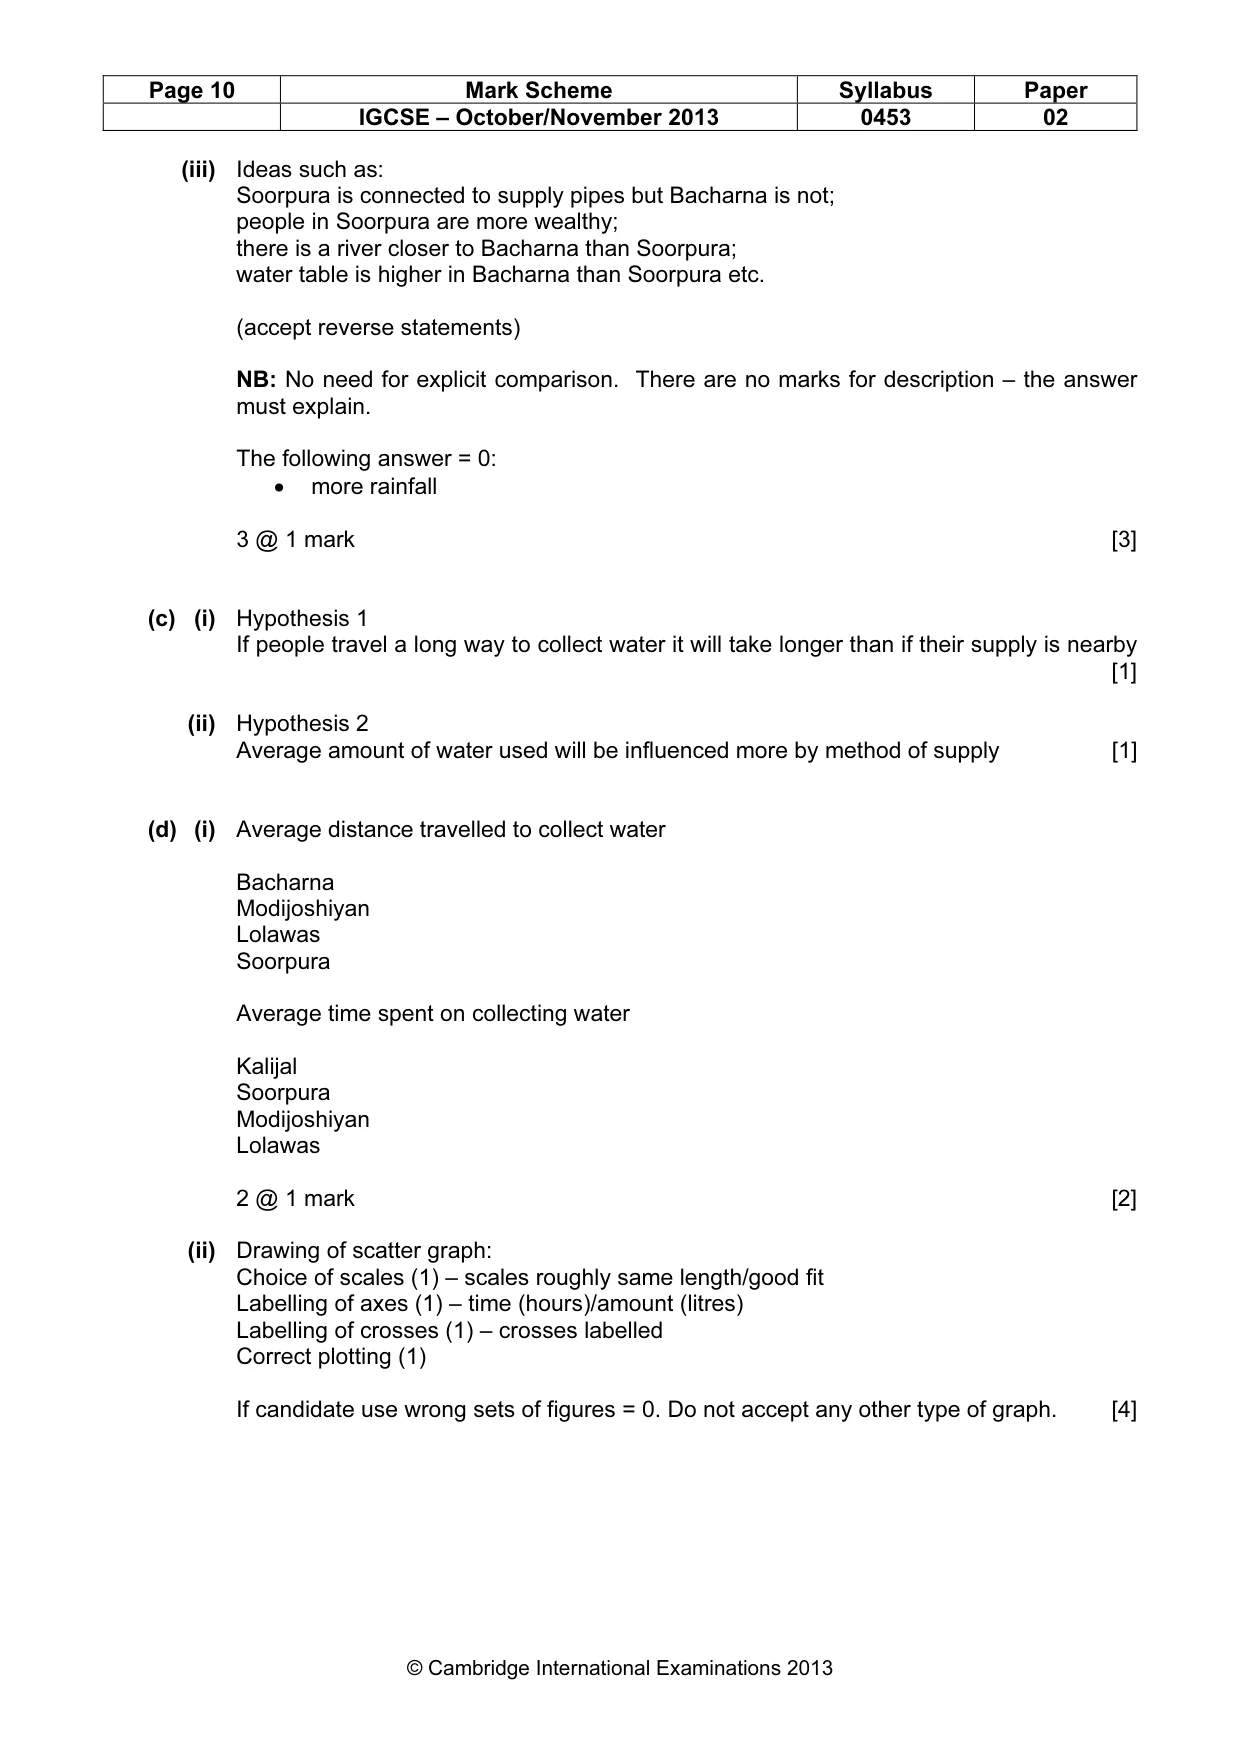
Page 10 Mark Scheme Syllabus Paper IGCSE – October/November 2013 0453 02 © Cambridge International Examinations 2013 (iii) Ideas such as: Soorpura is connected to supply pipes but Bacharna is not; people in Soorpura are more wealthy; there is a river closer to Bacharna than Soorpura; water table is higher in Bacharna than Soorpura etc. (accept reverse statements) NB: No need for explicit comparison. There are no marks for description – the answer must explain. The following answer = 0: • more rainfall 3 @ 1 mark [3] (c) (i) Hypothesis 1 If people travel a long way to collect water it will take longer than if their supply is nearby [1] (ii) Hypothesis 2 Average amount of water used will be influenced more by method of supply [1] (d) (i) Average distance travelled to collect water Bacharna Modijoshiyan Lolawas Soorpura Average time spent on collecting water Kalijal Soorpura Modijoshiyan Lolawas 2 @ 1 mark [2] (ii) Drawing of scatter graph: Choice of scales (1) – scales roughly same length/good fit Labelling of axes (1) – time (hours)/amount (litres) Labelling of crosses (1) – crosses labelled Correct plotting (1) If candidate use wrong sets of figures = 0. Do not accept any other type of graph. [4]
Mark scheme, page 11
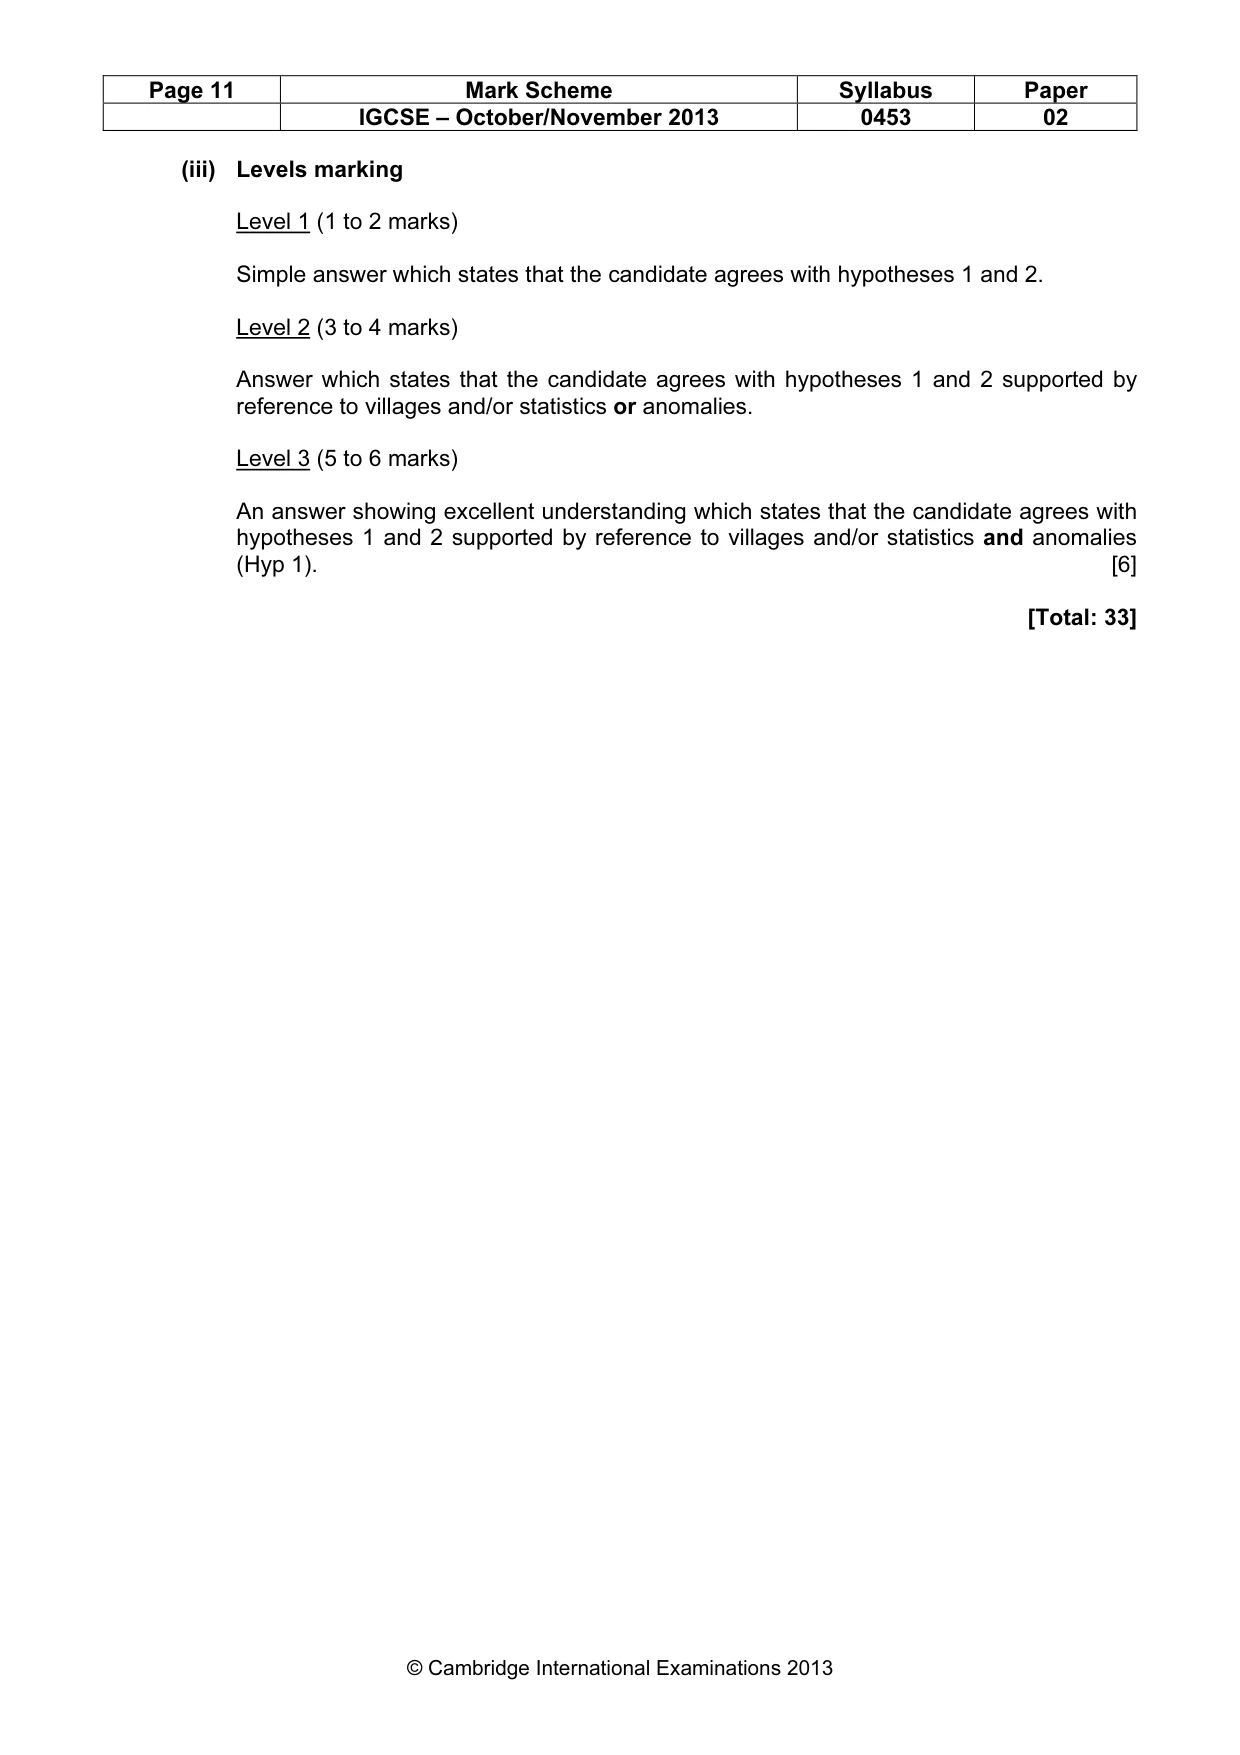
Page 11 Mark Scheme Syllabus Paper IGCSE – October/November 2013 0453 02 © Cambridge International Examinations 2013 (iii) Levels marking Level 1 (1 to 2 marks) Simple answer which states that the candidate agrees with hypotheses 1 and 2. Level 2 (3 to 4 marks) Answer which states that the candidate agrees with hypotheses 1 and 2 supported by reference to villages and/or statistics or anomalies. Level 3 (5 to 6 marks) An answer showing excellent understanding which states that the candidate agrees with hypotheses 1 and 2 supported by reference to villages and/or statistics and anomalies (Hyp 1). [6] [Total: 33]
What you needed in this session
Cambridge’s own grade thresholds for 2013 Oct/Nov, Paper 2 · Variant 1. A higher threshold means an easier paper — the bar moves with how the cohort did.