Cambridge IGCSE Development Studies 0453 — 2015 Oct/Nov Paper 2 · Variant 1
0453/21/O/N/15 · 80 marks · ≈90 min
The question paper and its mark scheme, free to read here and free to download. This is Cambridge’s own paper, exactly as it was sat.
Question paper20 pages





Mark scheme9 pages
Answers below. Sit the paper first if you are practising.
Paper as text
Question paper, page 1
This document consists of 19 printed pages, 1 blank page and 1 Insert. DC (NF/JG) 99186/3 © UCLES 2015 [Turn over Cambridge International Examinations Cambridge International General Certificate of Secondary Education * 7 8 1 6 6 8 8 7 8 0 * DEVELOPMENT STUDIES 0453/02 Paper 2 October/November 2015 2 hours Candidates answer on the Question Paper. Additional Materials: Ruler READ THESE INSTRUCTIONS FIRST Write your Centre number, candidate number and name on all the work you hand in. Write in dark blue or black pen. You may use an HB pencil for any diagrams, graphs or rough working. Do not use staples, paper clips, glue or correction fluid. DO NOT WRITE IN ANY BARCODES. Answer all the questions. You may not need all the answer lines for your answer. You should read and study the sources before answering the questions. The Insert contains Photographs A and B for Question 3(a). The Insert is not required by the Examiner. It can be kept by the Centre and used as a teaching resource. At the end of the examination, fasten all your work securely together. The number of marks is given in brackets [ ] at the end of each question or part question.
Question paper, page 2
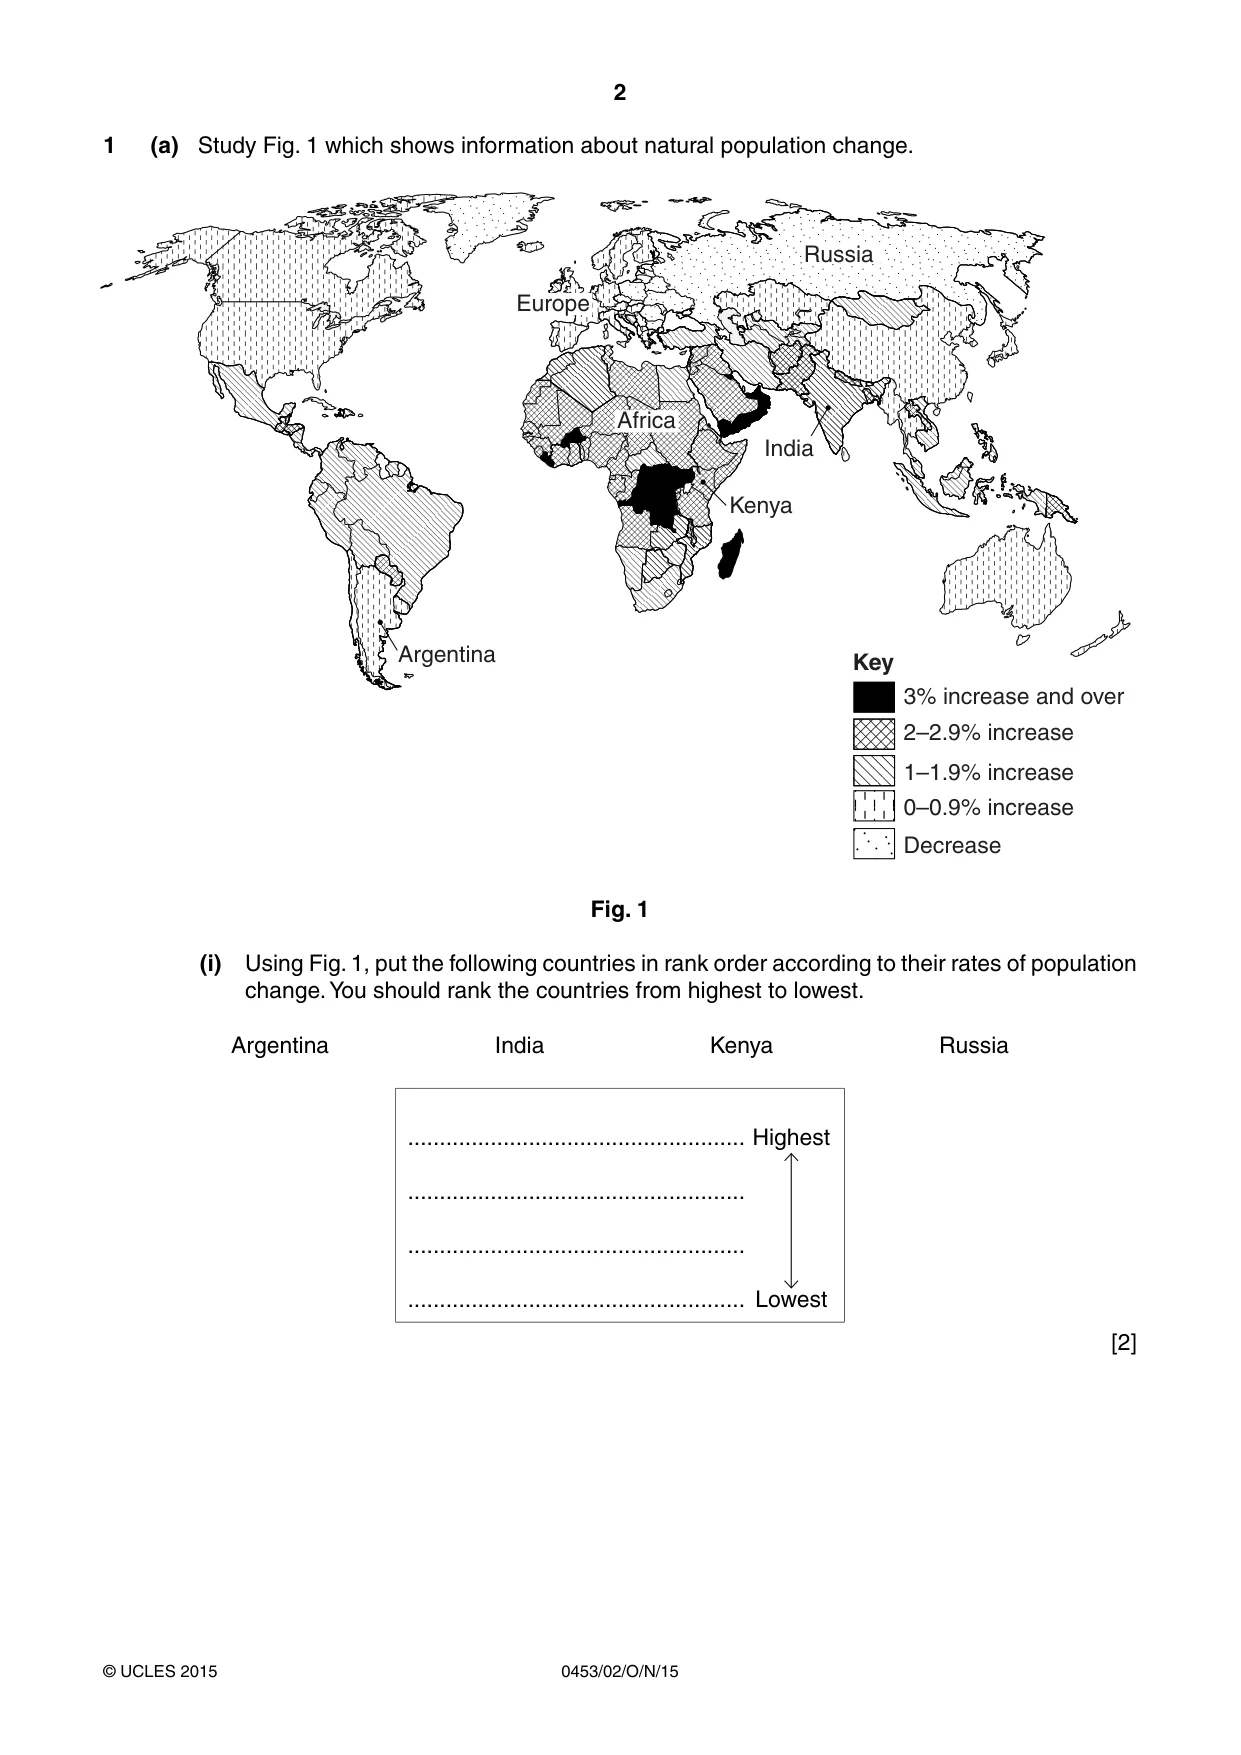
2 0453/02/O/N/15 © UCLES 2015 1 (a) Study Fig. 1 which shows information about natural population change. Key 3% increase and over 2–2.9% increase 1–1.9% increase 0–0.9% increase Decrease India Kenya Argentina Russia Africa Europe Fig. 1 (i) Using Fig. 1, put the following countries in rank order according to their rates of population change. You should rank the countries from highest to lowest. Argentina India Kenya Russia … … … … Highest Lowest [2]
Question paper, page 3
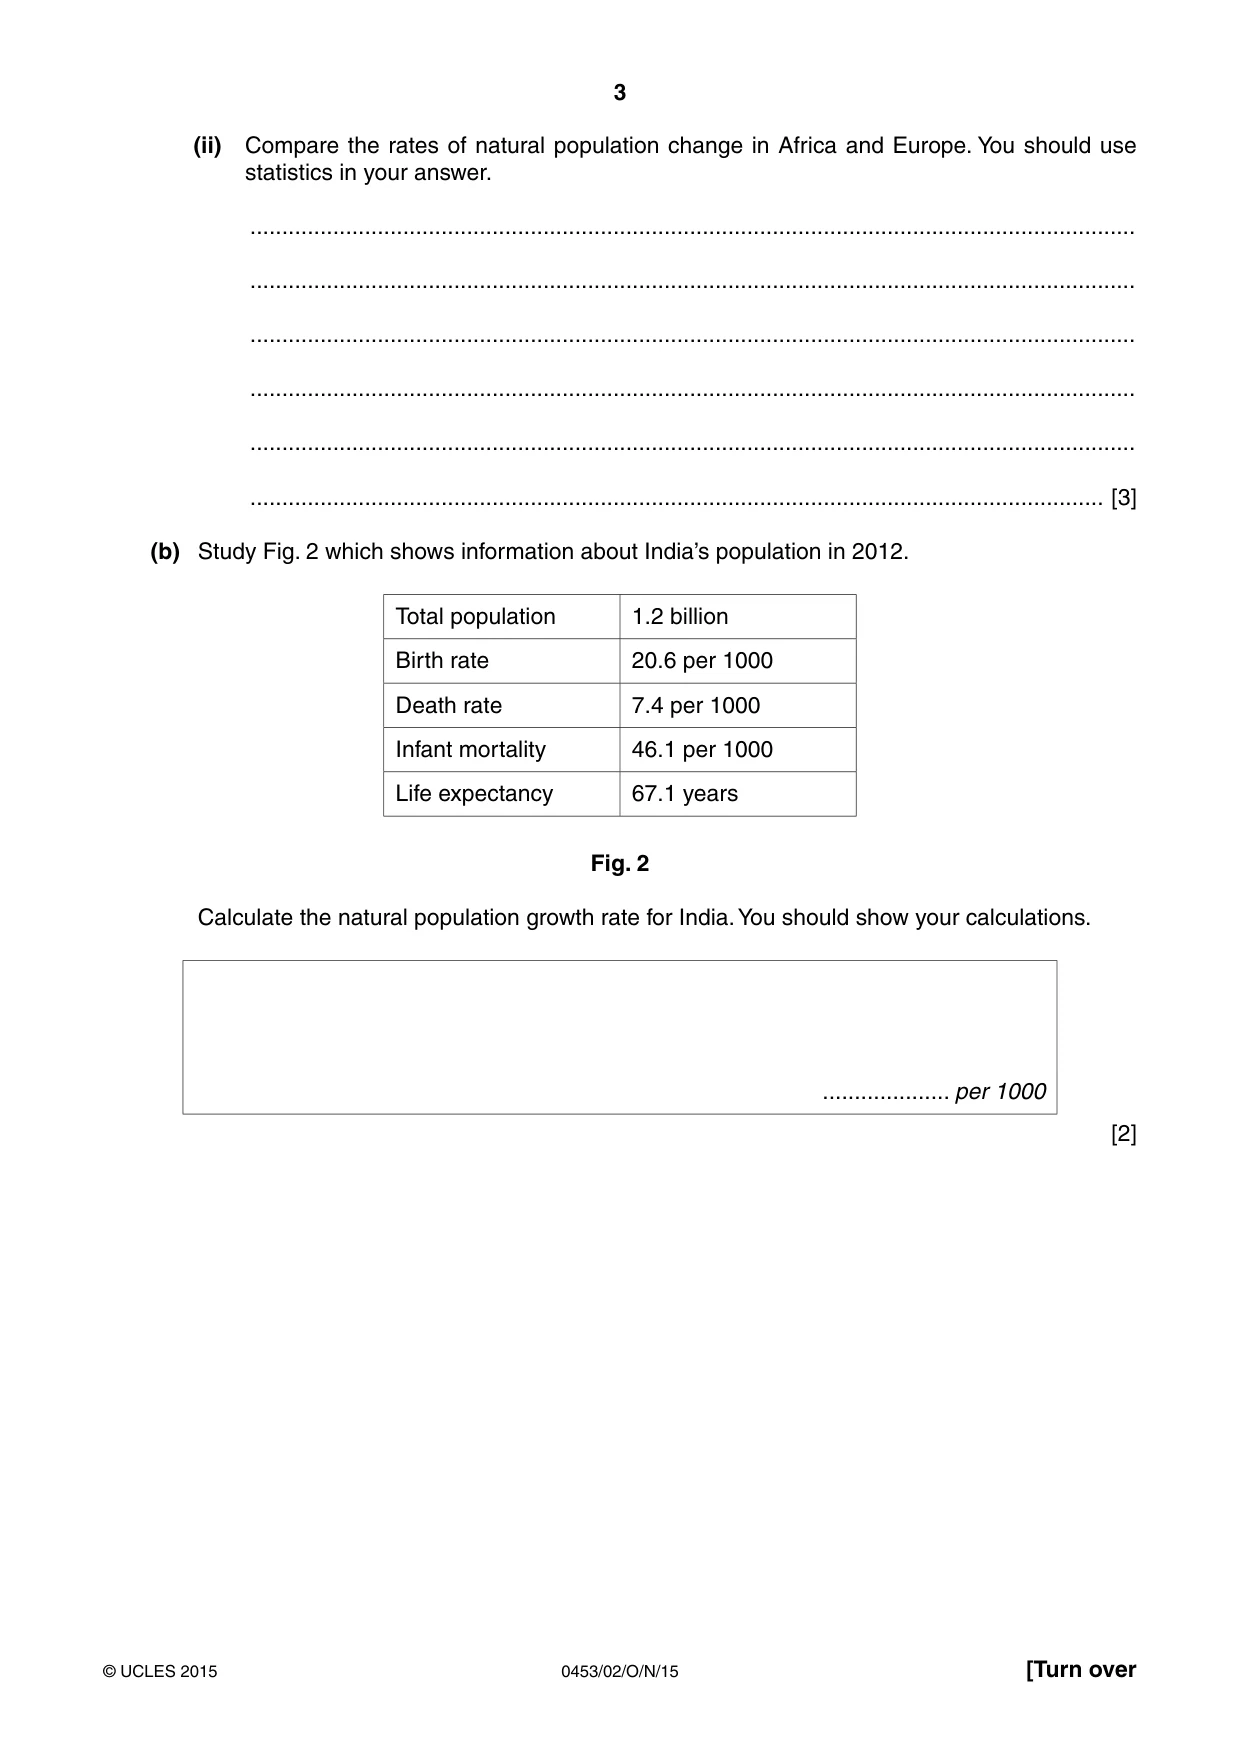
3 0453/02/O/N/15 © UCLES 2015 [Turn over (ii) Compare the rates of natural population change in Africa and Europe. You should use statistics in your answer. … … … … … … [3] (b) Study Fig. 2 which shows information about India’s population in 2012. Total population 1.2 billion Birth rate 20.6 per 1000 Death rate 7.4 per 1000 Infant mortality 46.1 per 1000 Life expectancy 67.1 years Fig. 2 Calculate the natural population growth rate for India. You should show your calculations. … per 1000 [2]
Question paper, page 4
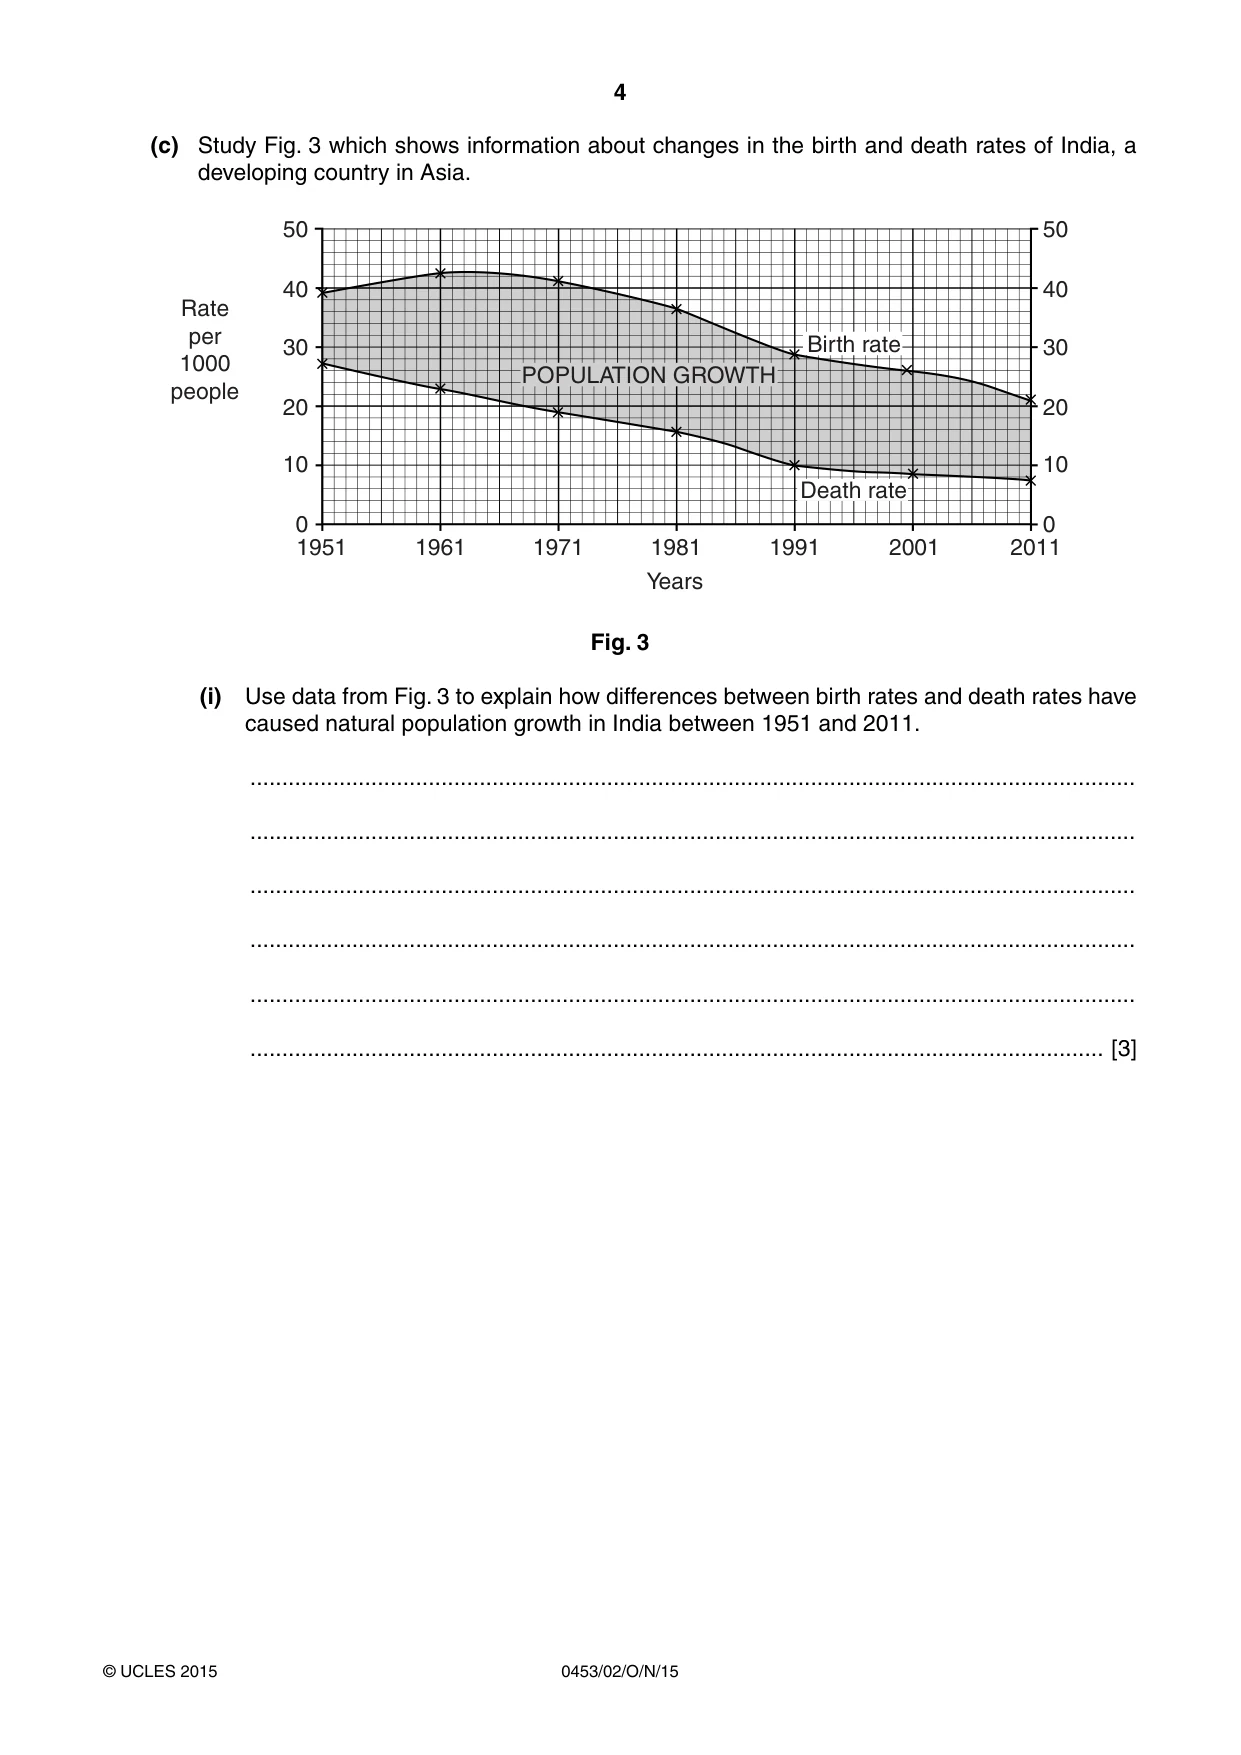
4 0453/02/O/N/15 © UCLES 2015 (c) Study Fig. 3 which shows information about changes in the birth and death rates of India, a developing country in Asia. 1951 1961 1971 1981 1991 2001 2011 0 10 20 30 40 50 0 10 20 30 40 50 Years Rate per 1000 people POPULATION GROWTH Birth rate Death rate Fig. 3 (i) Use data from Fig. 3 to explain how differences between birth rates and death rates have caused natural population growth in India between 1951 and 2011. … … … … … … [3]
Question paper, page 5
5 0453/02/O/N/15 © UCLES 2015 [Turn over (ii) Suggest reasons for the changes in birth rates and death rates which are shown on Fig. 3. … … … … … … … … … … … … [6] [Total: 16 marks]
Question paper, page 6
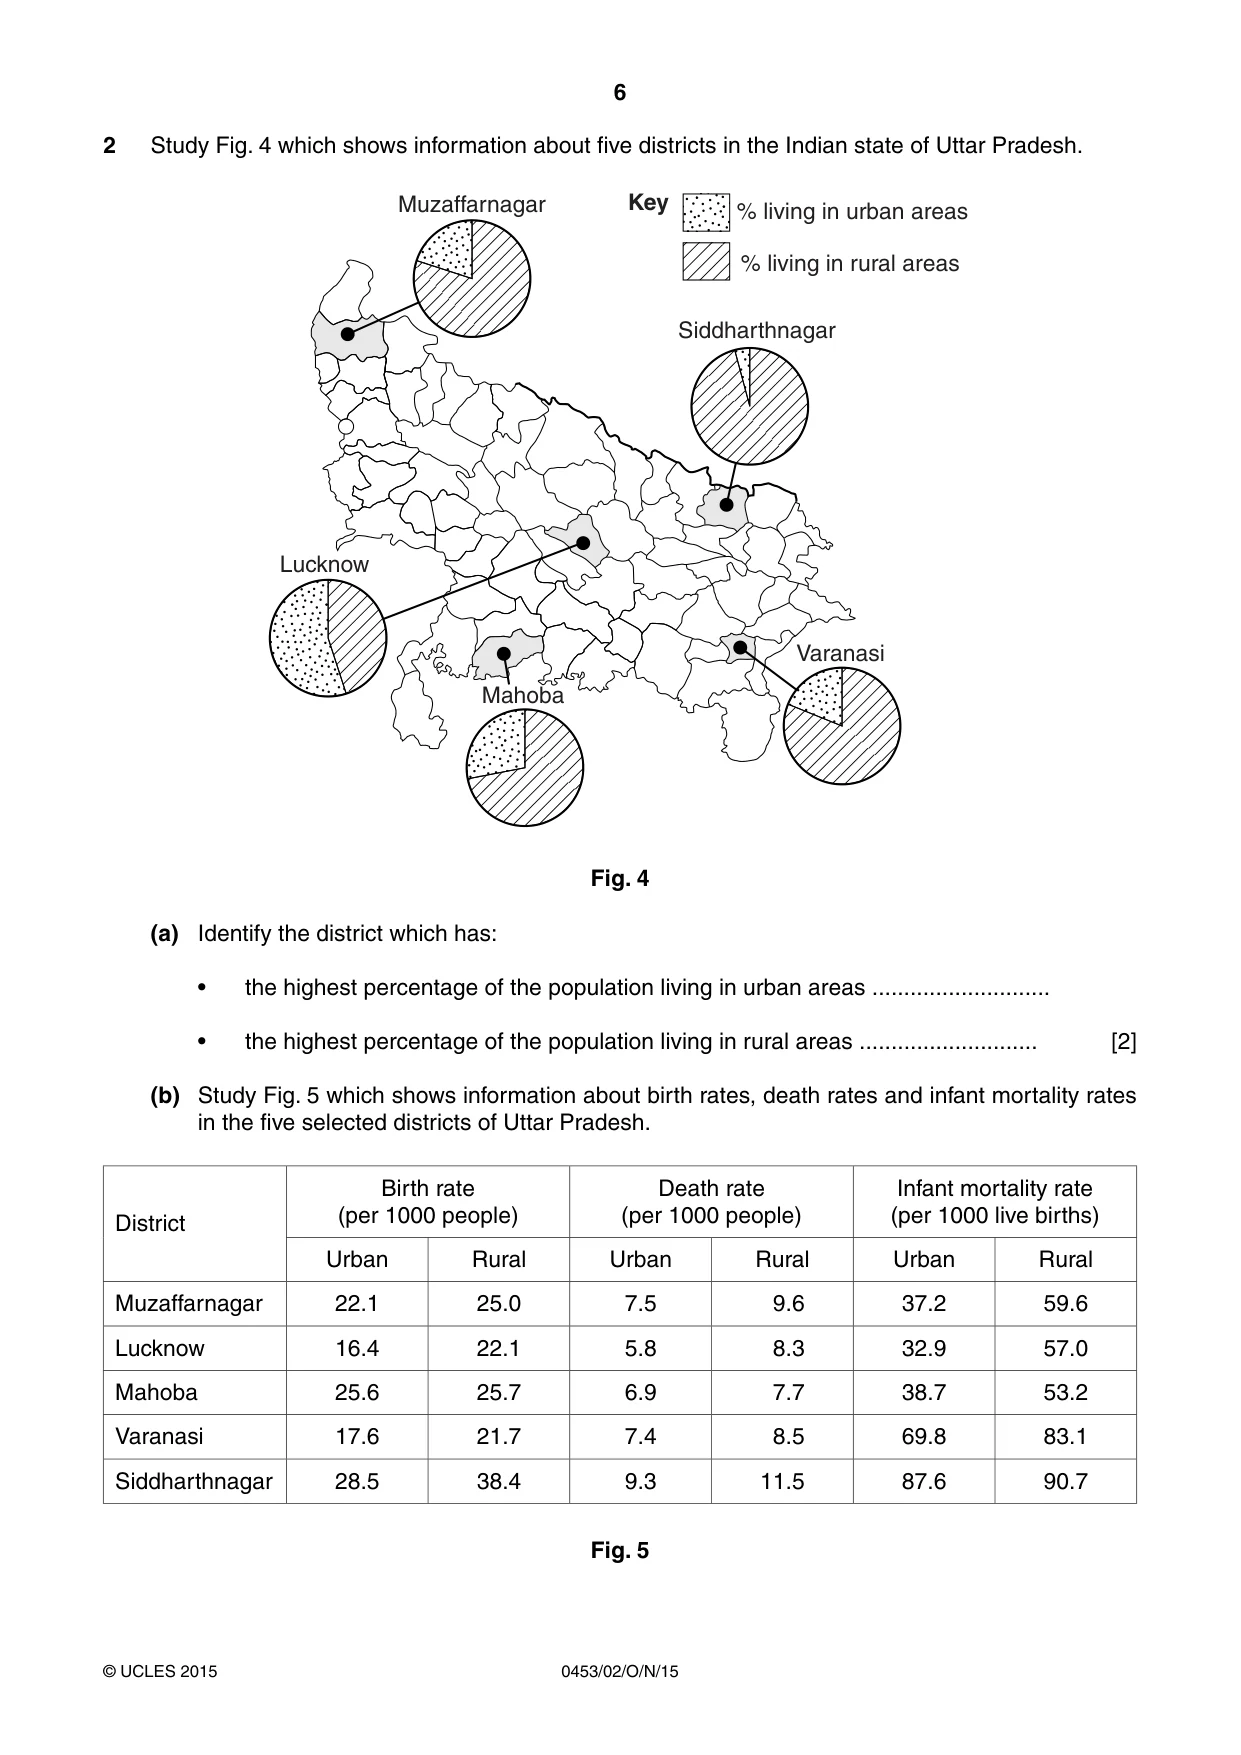
6 0453/02/O/N/15 © UCLES 2015 2 Study Fig. 4 which shows information about five districts in the Indian state of Uttar Pradesh. Muzaffarnagar Siddharthnagar % living in urban areas % living in rural areas Varanasi Mahoba Lucknow Key Fig. 4 (a) Identify the district which has: • the highest percentage of the population living in urban areas … • the highest percentage of the population living in rural areas … [2] (b) Study Fig. 5 which shows information about birth rates, death rates and infant mortality rates in the five selected districts of Uttar Pradesh. District Birth rate (per 1000 people) Death rate (per 1000 people) Infant mortality rate (per 1000 live births) Urban Rural Urban Rural Urban Rural Muzaffarnagar 22.1 25.0 7.5 9.6 37.2 59.6 Lucknow 16.4 22.1 5.8 8.3 32.9 57.0 Mahoba 25.6 25.7 6.9 7.7 38.7 53.2 Varanasi 17.6 21.7 7.4 8.5 69.8 83.1 Siddharthnagar 28.5 38.4 9.3 11.5 87.6 90.7 Fig. 5
Question paper, page 7
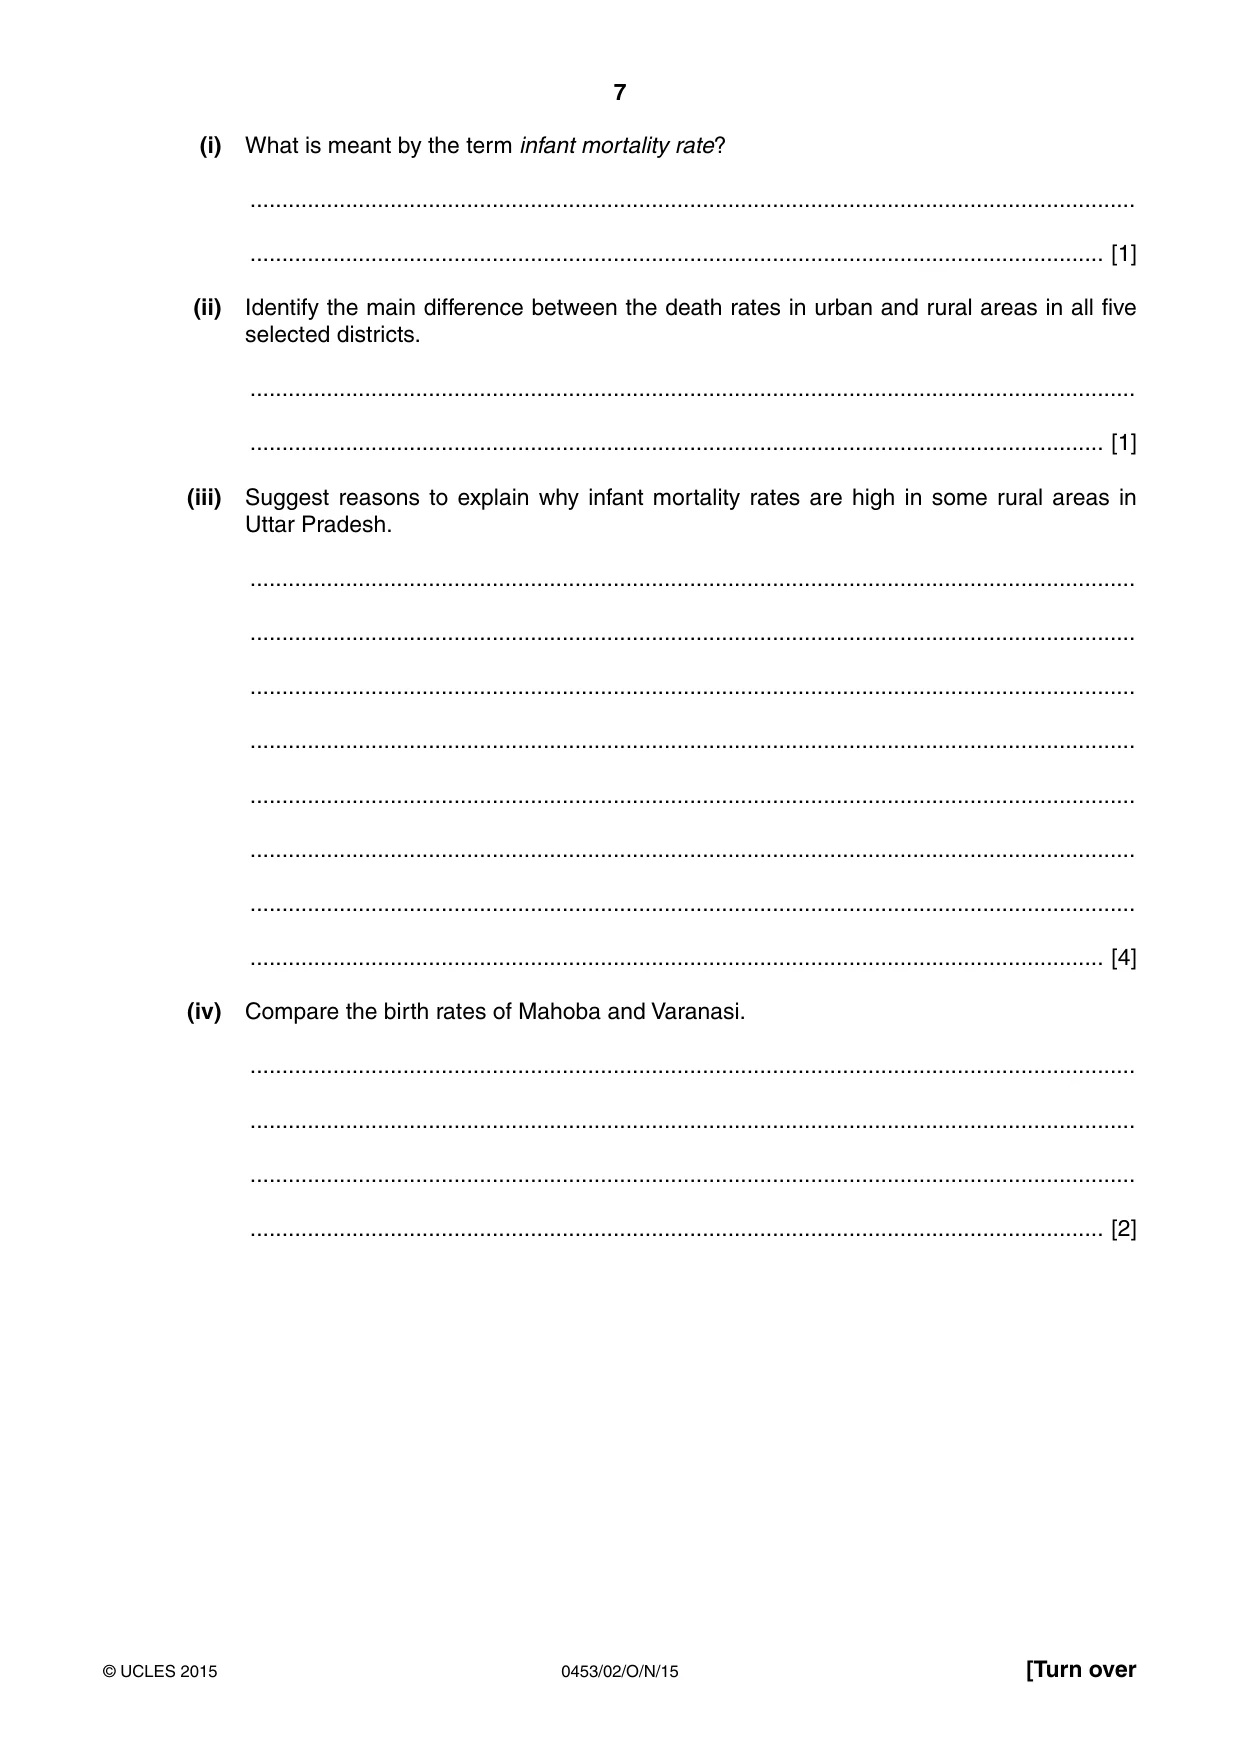
7 0453/02/O/N/15 © UCLES 2015 [Turn over (i) What is meant by the term infant mortality rate? … … [1] (ii) Identify the main difference between the death rates in urban and rural areas in all five selected districts. … … [1] (iii) Suggest reasons to explain why infant mortality rates are high in some rural areas in Uttar Pradesh. … … … … … … … … [4] (iv) Compare the birth rates of Mahoba and Varanasi. … … … … [2]
Question paper, page 8
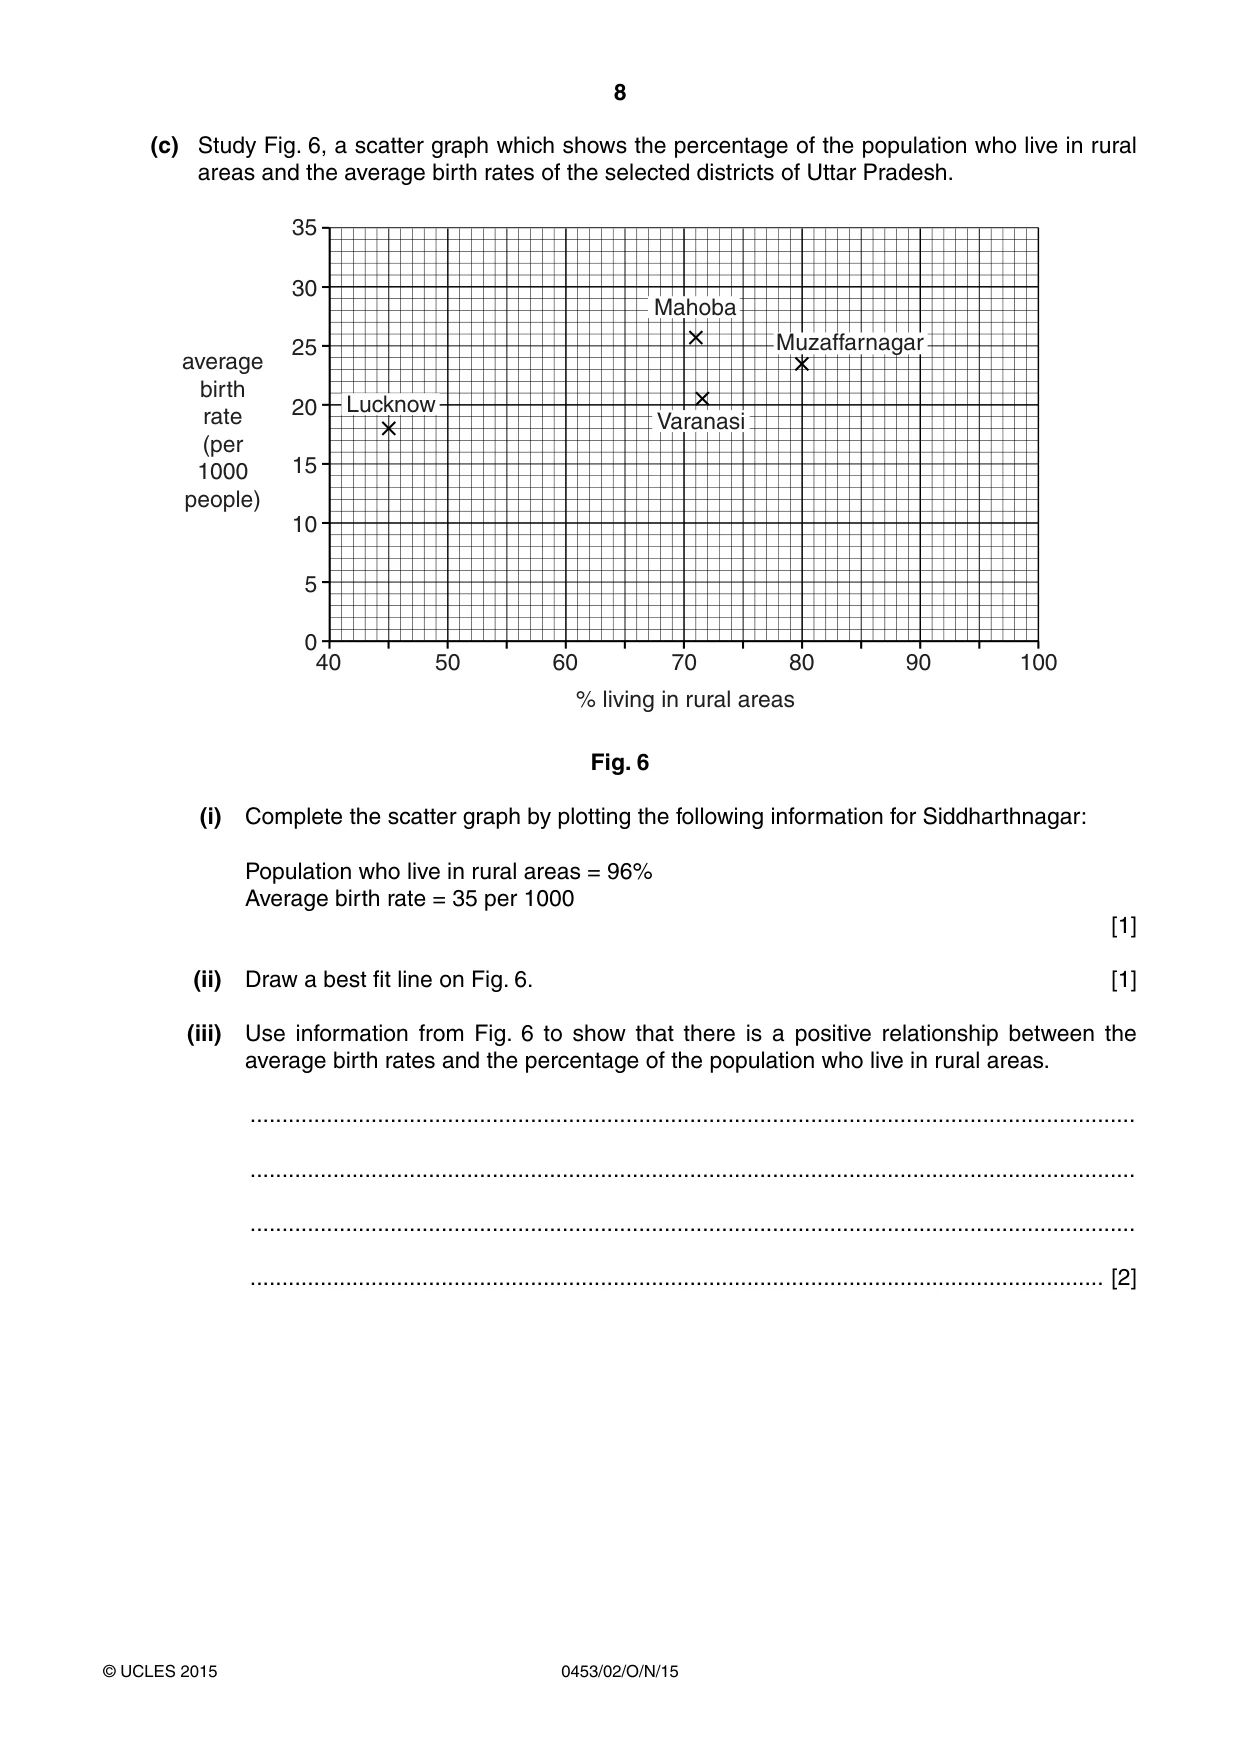
8 0453/02/O/N/15 © UCLES 2015 (c) Study Fig. 6, a scatter graph which shows the percentage of the population who live in rural areas and the average birth rates of the selected districts of Uttar Pradesh. 35 30 25 20 15 10 5 0 40 50 60 70 80 90 100 average birth rate (per 1000 people) % living in rural areas Lucknow Mahoba Varanasi Muzaffarnagar Fig. 6 (i) Complete the scatter graph by plotting the following information for Siddharthnagar: Population who live in rural areas = 96% Average birth rate = 35 per 1000 [1] (ii) Draw a best fit line on Fig. 6. [1] (iii) Use information from Fig. 6 to show that there is a positive relationship between the average birth rates and the percentage of the population who live in rural areas. … … … … [2]
Question paper, page 9
9 0453/02/O/N/15 © UCLES 2015 [Turn over (iv) Explain why birth rates are high in many rural areas of developing countries. … … … … … … … … [4]
Question paper, page 10
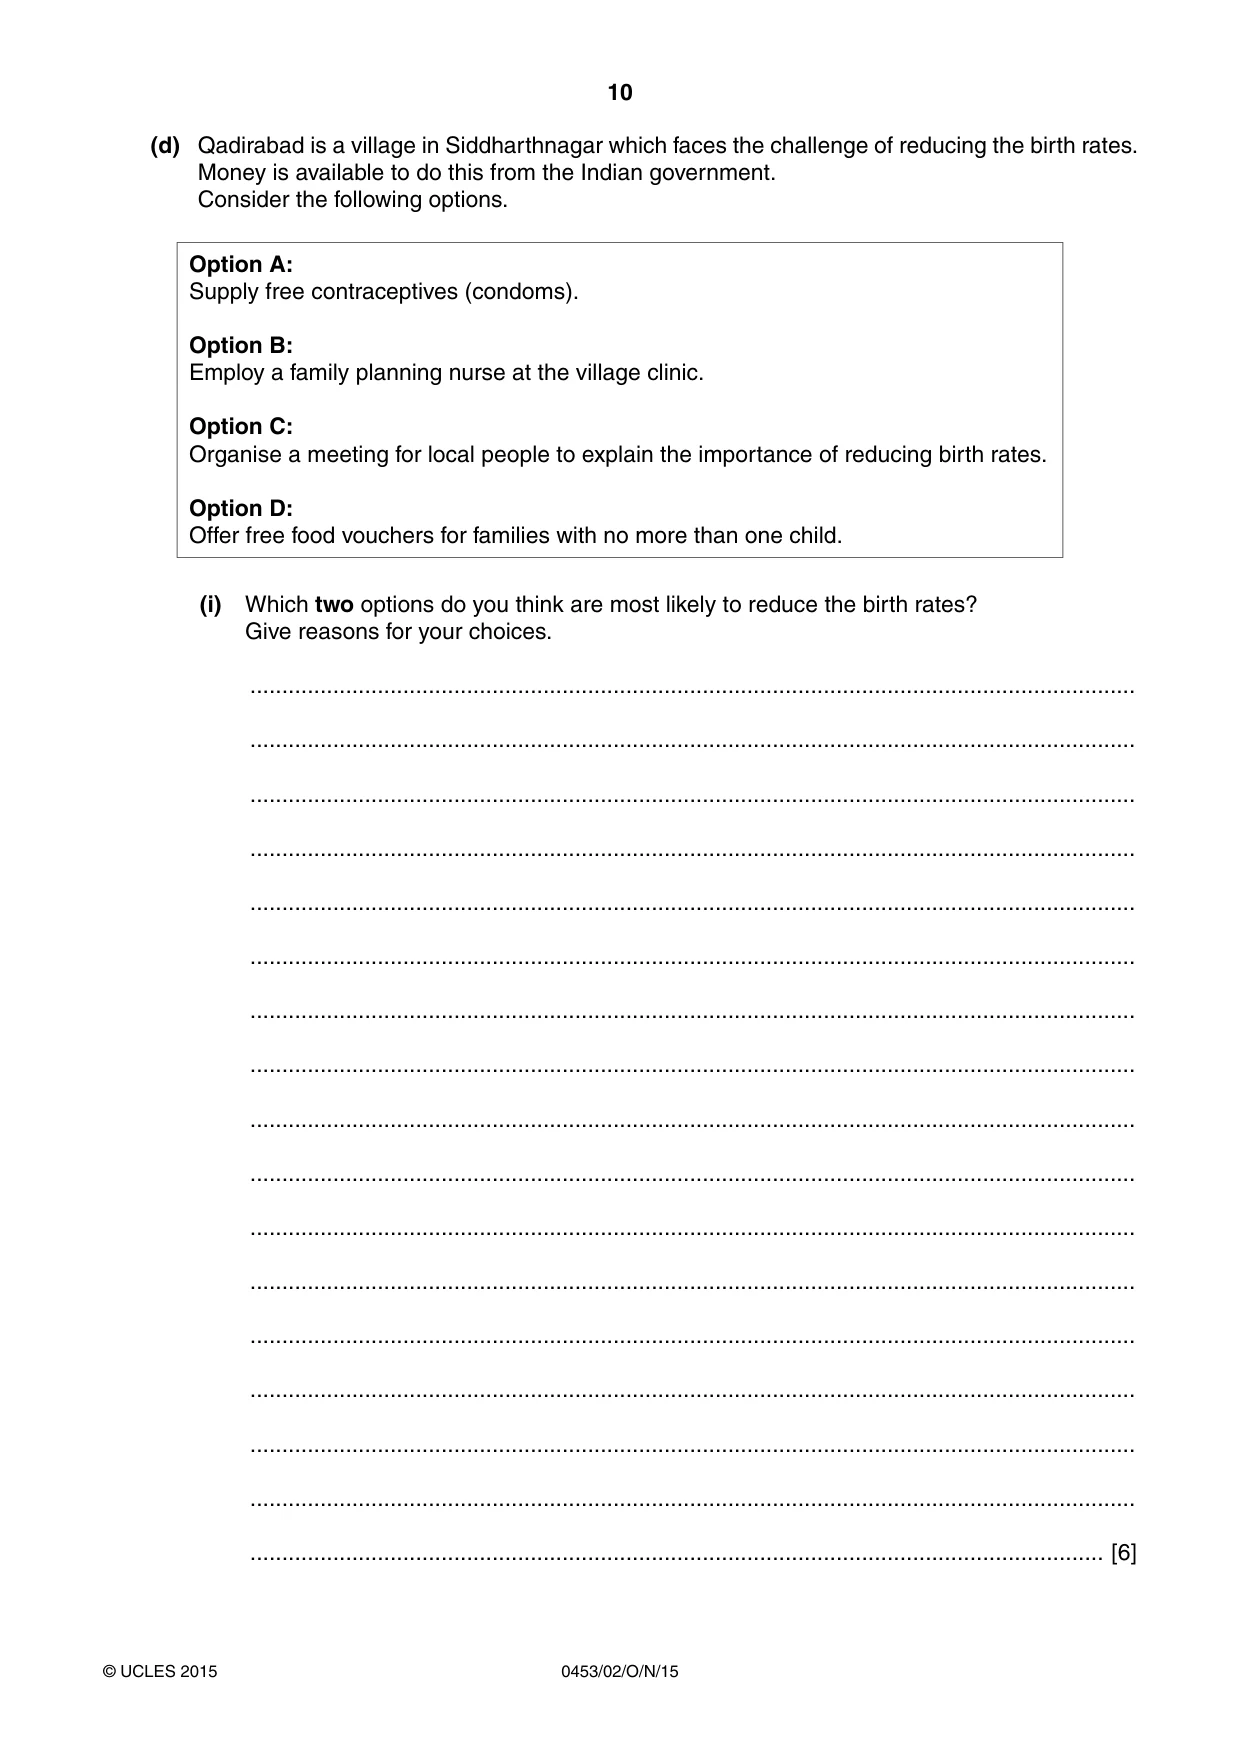
10 0453/02/O/N/15 © UCLES 2015 (d) Qadirabad is a village in Siddharthnagar which faces the challenge of reducing the birth rates. Money is available to do this from the Indian government. Consider the following options. Option A: Supply free contraceptives (condoms). Option B: Employ a family planning nurse at the village clinic. Option C: Organise a meeting for local people to explain the importance of reducing birth rates. Option D: Offer free food vouchers for families with no more than one child. (i) Which two options do you think are most likely to reduce the birth rates? Give reasons for your choices. … … … … … … … … … … … … … … … … … [6]
Question paper, page 11
11 0453/02/O/N/15 © UCLES 2015 [Turn over (ii) Explain why it is important to use several methods together to reduce birth rates, rather than using only one method. … … … … [2] [Total: 26 marks]
Question paper, page 12
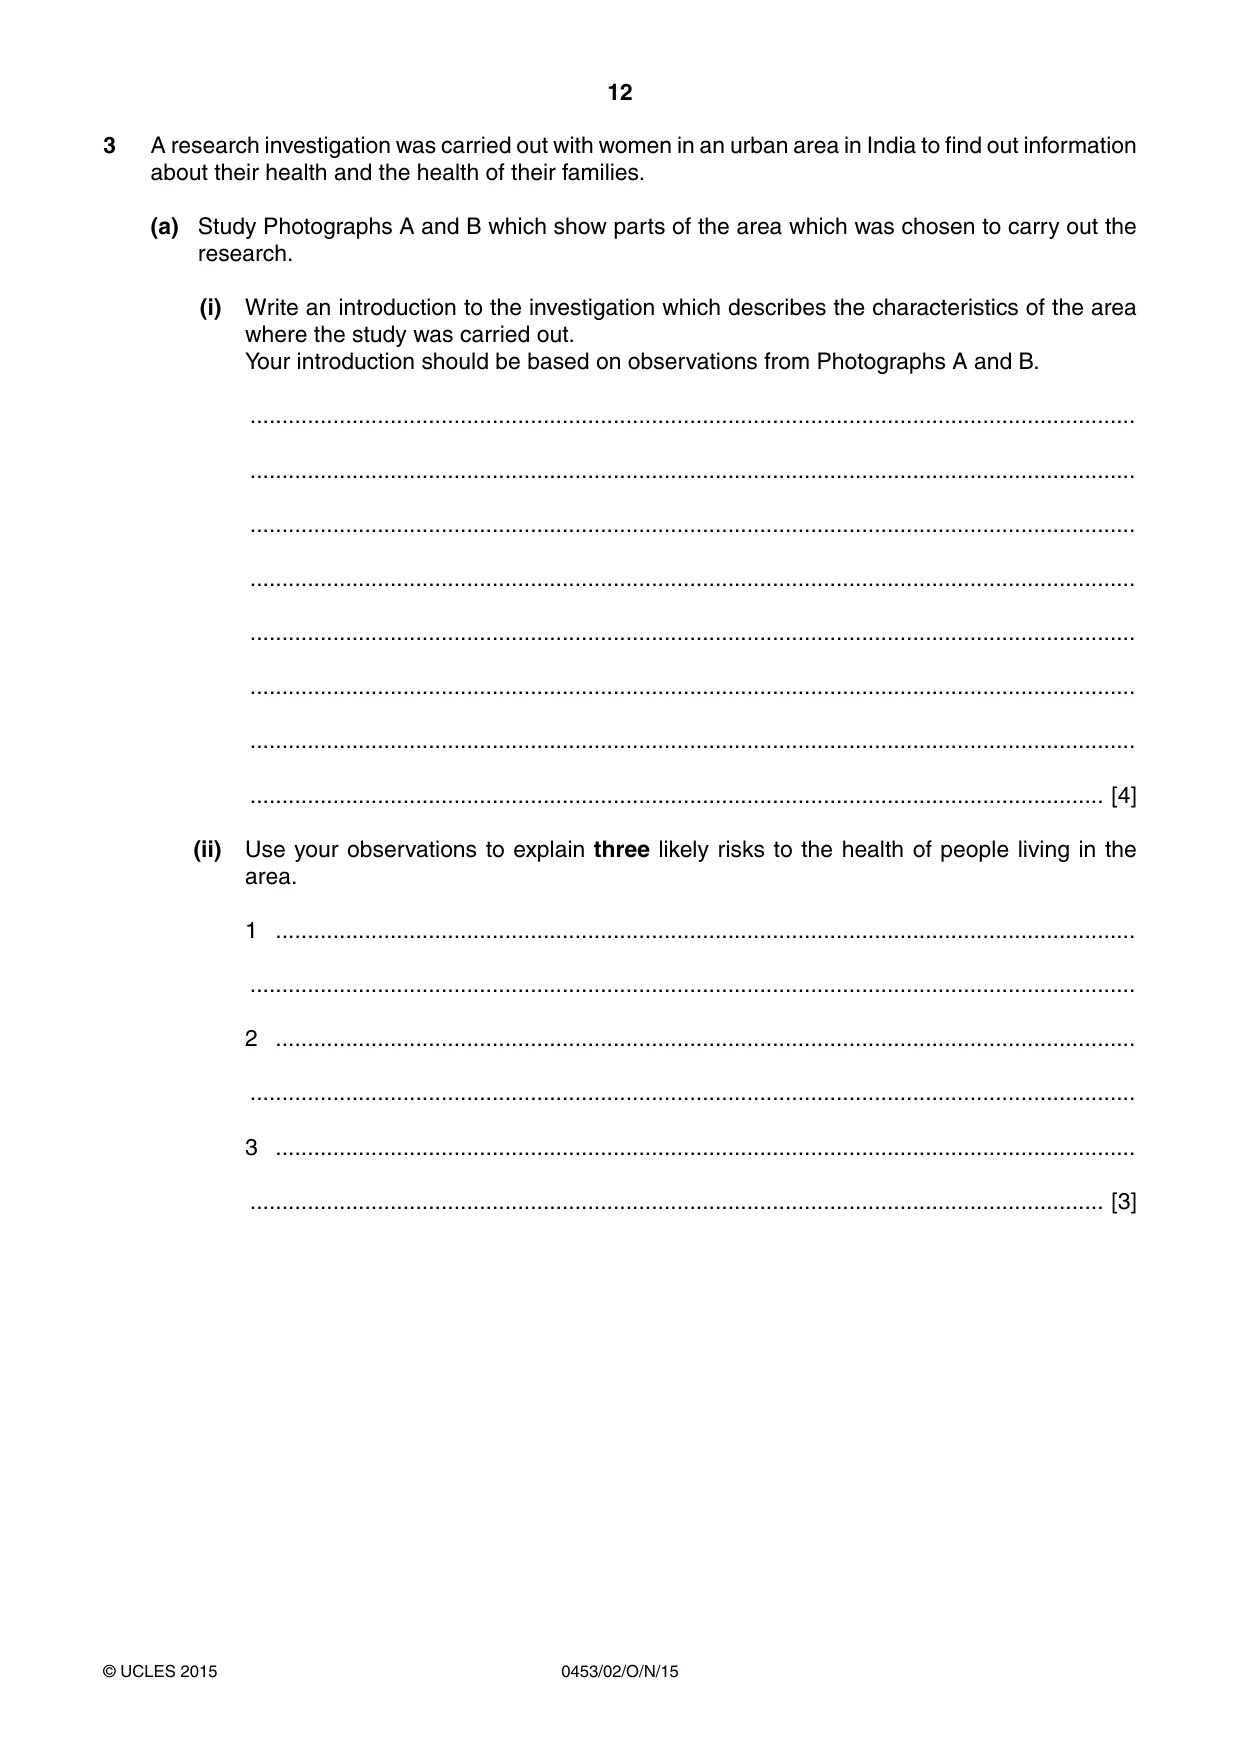
12 0453/02/O/N/15 © UCLES 2015 3 A research investigation was carried out with women in an urban area in India to find out information about their health and the health of their families. (a) Study Photographs A and B which show parts of the area which was chosen to carry out the research. (i) Write an introduction to the investigation which describes the characteristics of the area where the study was carried out. Your introduction should be based on observations from Photographs A and B. … … … … … … … … [4] (ii) Use your observations to explain three likely risks to the health of people living in the area. 1 … … 2 … … 3 … … [3]
Question paper, page 13
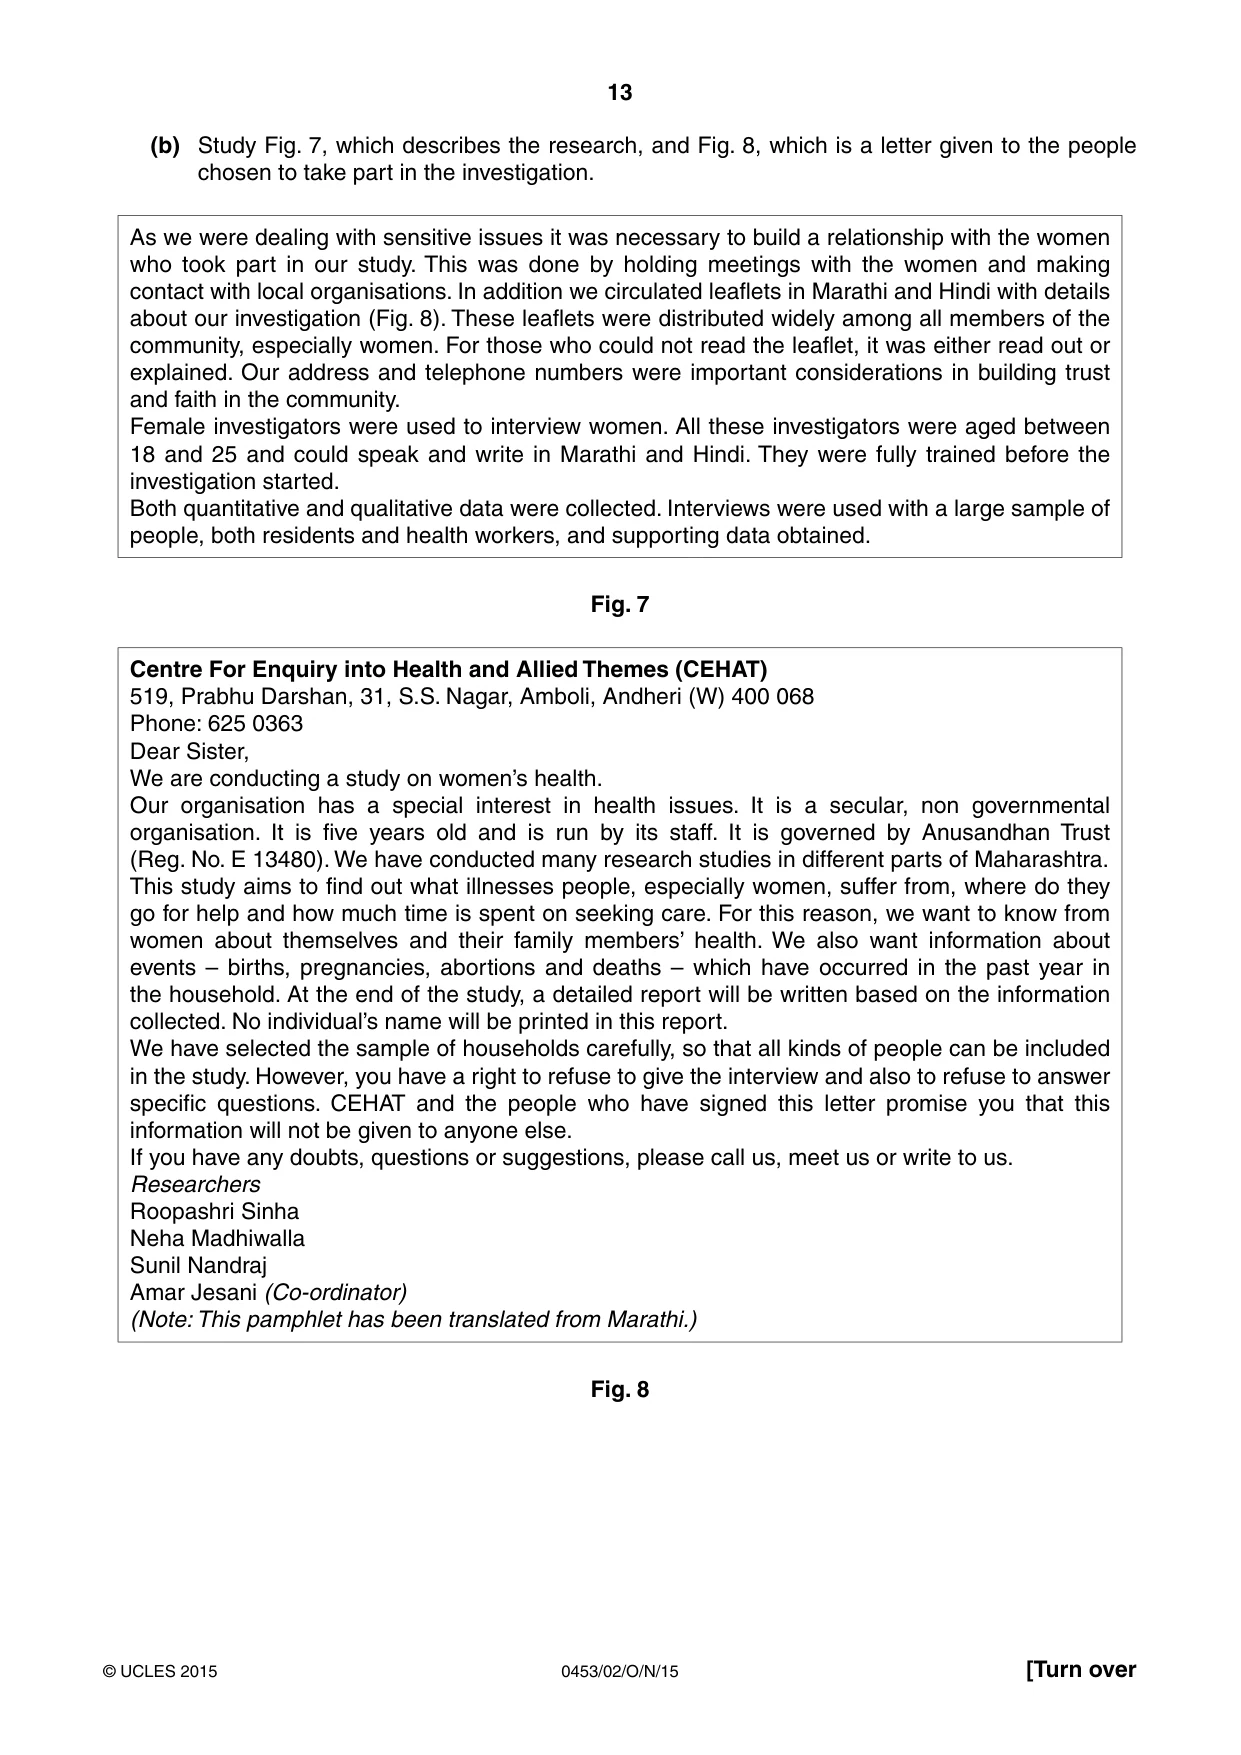
13 0453/02/O/N/15 © UCLES 2015 [Turn over (b) Study Fig. 7, which describes the research, and Fig. 8, which is a letter given to the people chosen to take part in the investigation. As we were dealing with sensitive issues it was necessary to build a relationship with the women who took part in our study. This was done by holding meetings with the women and making contact with local organisations. In addition we circulated leaflets in Marathi and Hindi with details about our investigation (Fig. 8). These leaflets were distributed widely among all members of the community, especially women. For those who could not read the leaflet, it was either read out or explained. Our address and telephone numbers were important considerations in building trust and faith in the community. Female investigators were used to interview women. All these investigators were aged between 18 and 25 and could speak and write in Marathi and Hindi. They were fully trained before the investigation started. Both quantitative and qualitative data were collected. Interviews were used with a large sample of people, both residents and health workers, and supporting data obtained. Fig. 7 Centre For Enquiry into Health and Allied Themes (CEHAT) 519, Prabhu Darshan, 31, S.S. Nagar, Amboli, Andheri (W) 400 068 Phone: 625 0363 Dear Sister, We are conducting a study on women’s health. Our organisation has a special interest in health issues. It is a secular, non governmental organisation. It is five years old and is run by its staff. It is governed by Anusandhan Trust (Reg. No. E 13480). We have conducted many research studies in different parts of Maharashtra. This study aims to find out what illnesses people, especially women, suffer from, where do they go for help and how much time is spent on seeking care. For this reason, we want to know from women about themselves and their family members’ health. We also want information about events – births, pregnancies, abortions and deaths – which have occurred in the past year in the household. At the end of the study, a detailed report will be written based on the information collected. No individual’s name will be printed in this report. We have selected the sample of households carefully, so that all kinds of people can be included in the study. However, you have a right to refuse to give the interview and also to refuse to answer specific questions. CEHAT and the people who have signed this letter promise you that this information will not be given to anyone else. If you have any doubts, questions or suggestions, please call us, meet us or write to us. Researchers Roopashri Sinha Neha Madhiwalla Sunil Nandraj Amar Jesani (Co-ordinator) (Note: This pamphlet has been translated from Marathi.) Fig. 8
Question paper, page 14
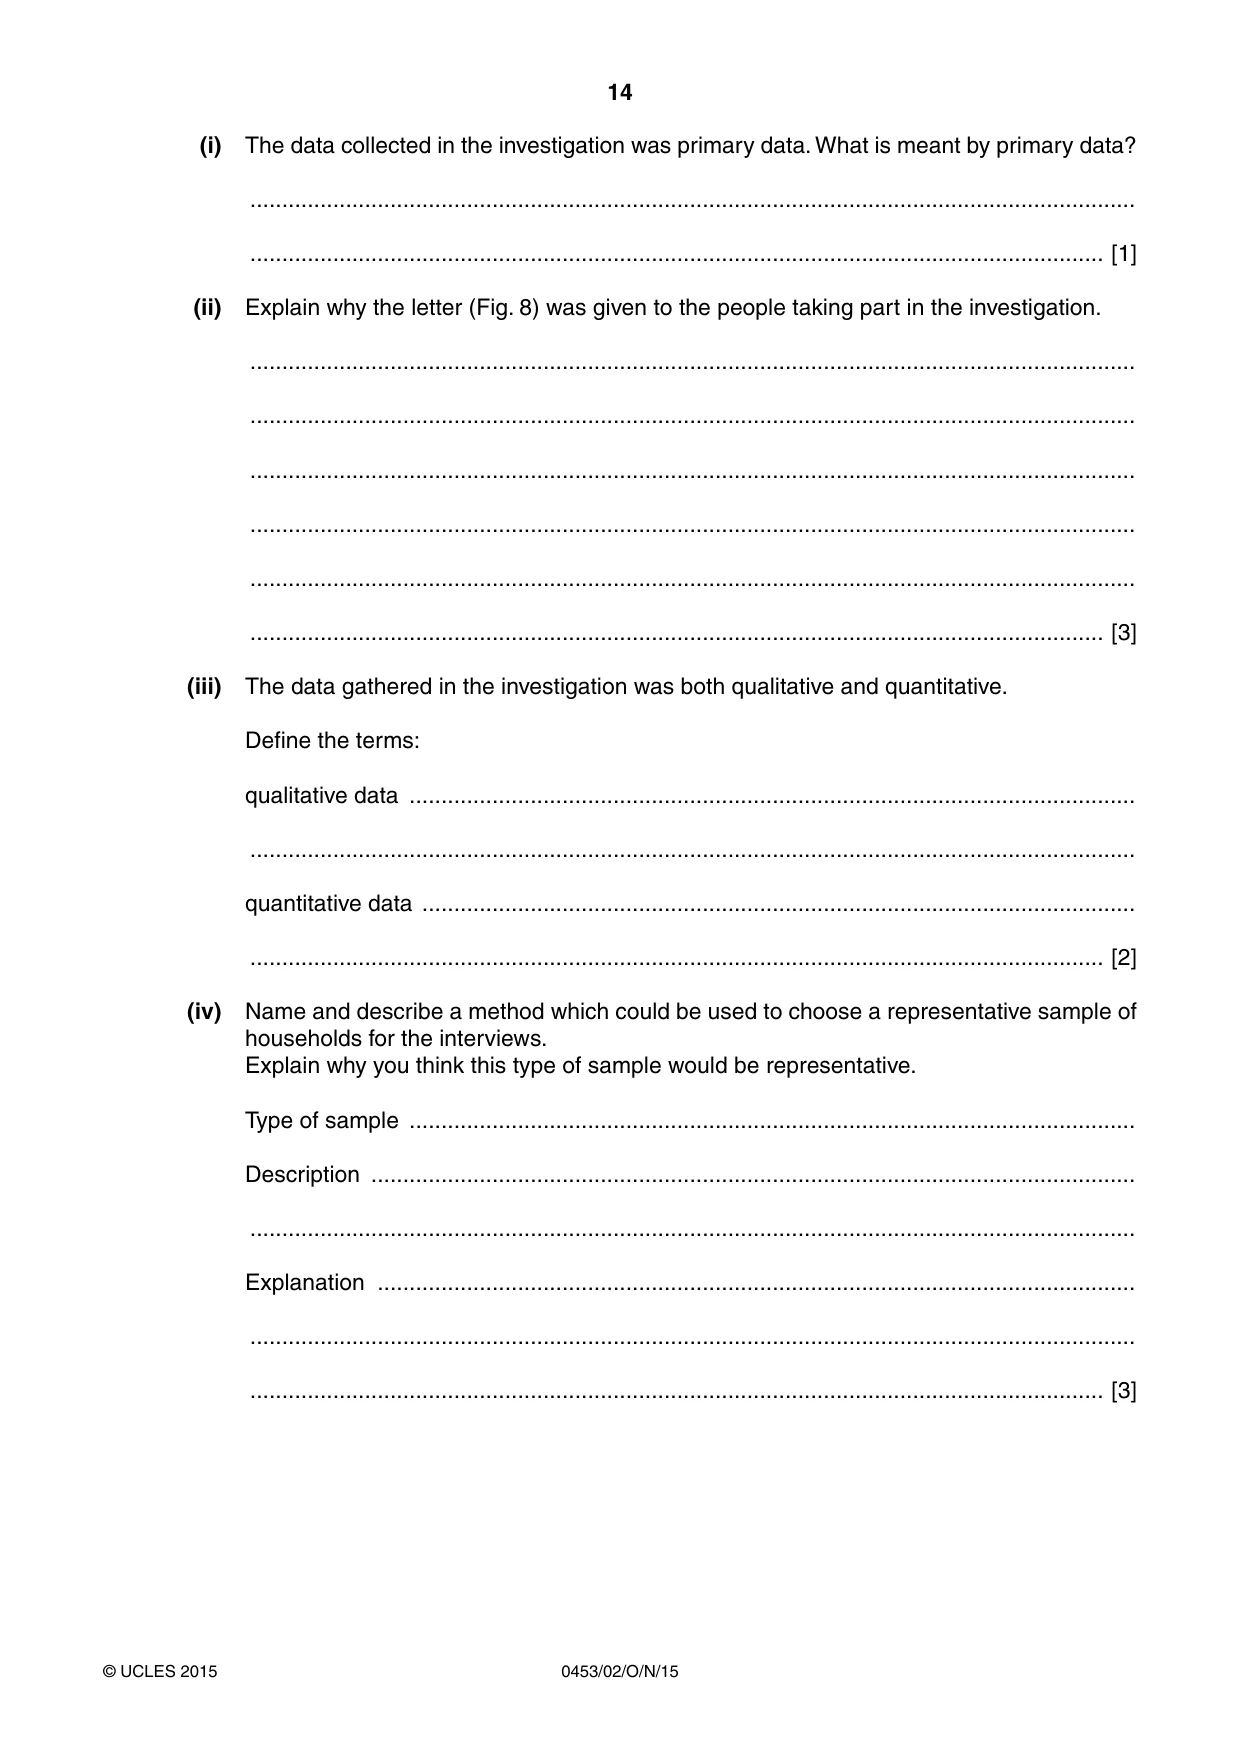
14 0453/02/O/N/15 © UCLES 2015 (i) The data collected in the investigation was primary data. What is meant by primary data? … … [1] (ii) Explain why the letter (Fig. 8) was given to the people taking part in the investigation. … … … … … … [3] (iii) The data gathered in the investigation was both qualitative and quantitative. Define the terms: qualitative data … … quantitative data … … [2] (iv) Name and describe a method which could be used to choose a representative sample of households for the interviews. Explain why you think this type of sample would be representative. Type of sample … Description … … Explanation … … … [3]
Question paper, page 15
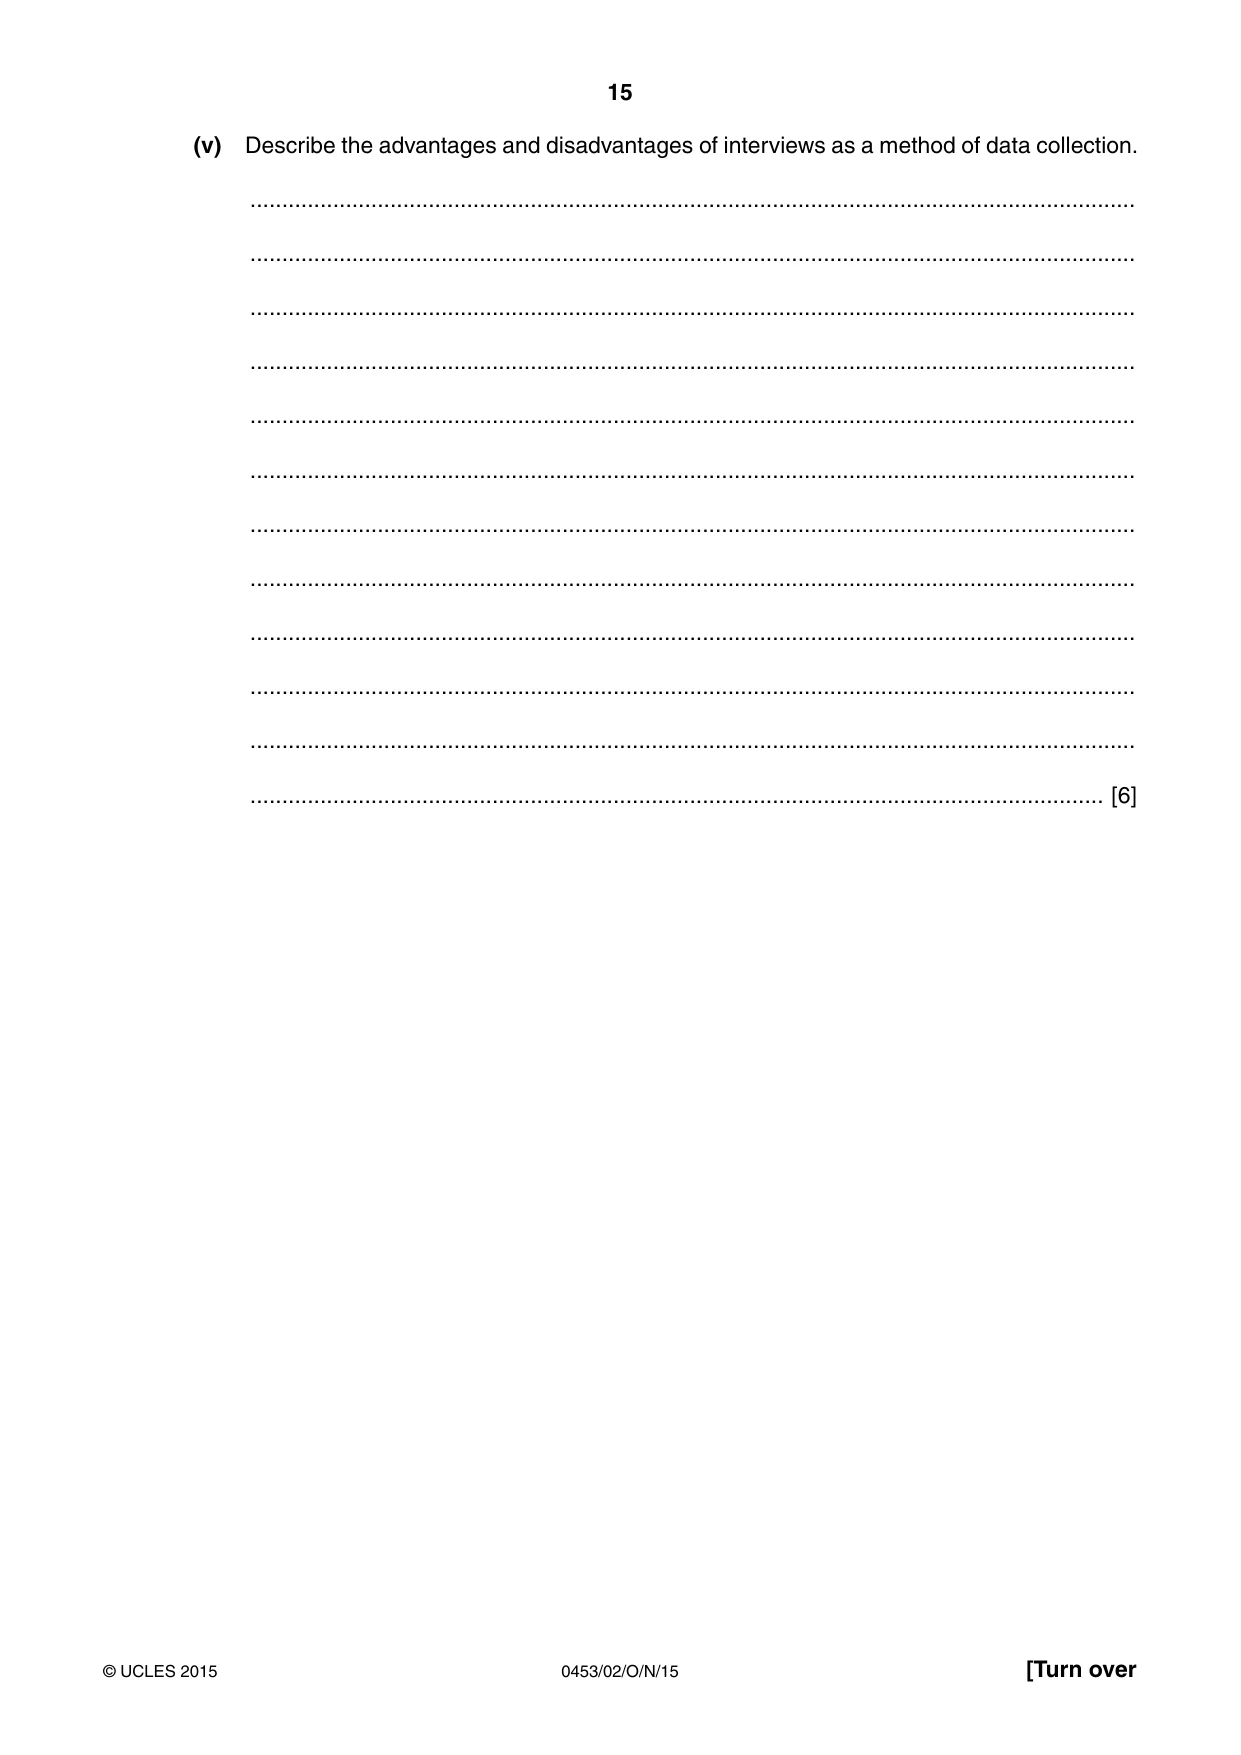
15 0453/02/O/N/15 © UCLES 2015 [Turn over (v) Describe the advantages and disadvantages of interviews as a method of data collection. … … … … … … … … … … … … [6]
Question paper, page 16
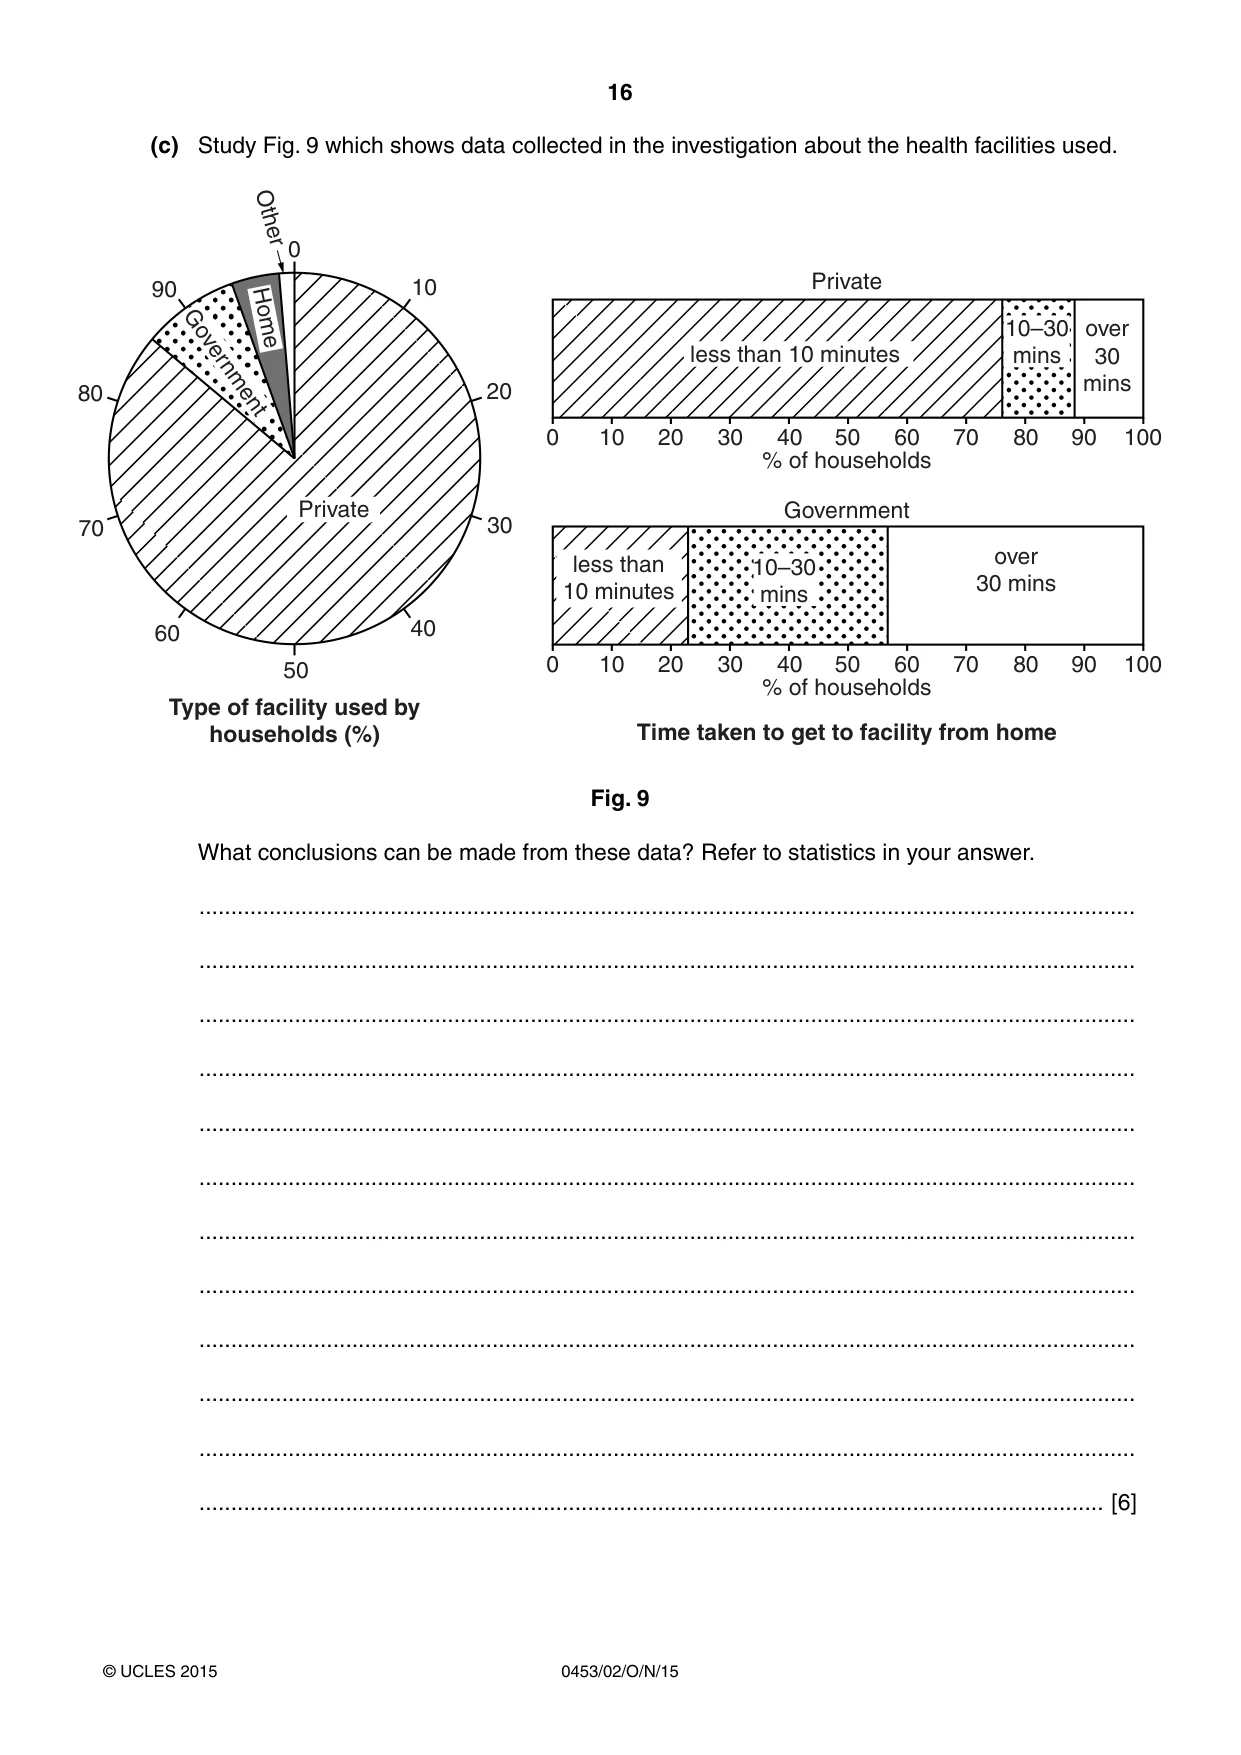
16 0453/02/O/N/15 © UCLES 2015 (c) Study Fig. 9 which shows data collected in the investigation about the health facilities used. 0 10 20 30 40 50 60 70 80 90 0 10 20 30 40 50 60 70 80 90 100 0 10 20 30 40 50 60 70 80 90 100 Private % of households % of households Government less than 10 minutes less than 10 minutes 10–30 mins 10 - 30 mins 10–30 mins over 30 mins over 30 mins Time taken to get to facility from home Type of facility used by households (%) Private Government Home Other Fig. 9 What conclusions can be made from these data? Refer to statistics in your answer. … … … … … … … … … … … … [6]
Question paper, page 17
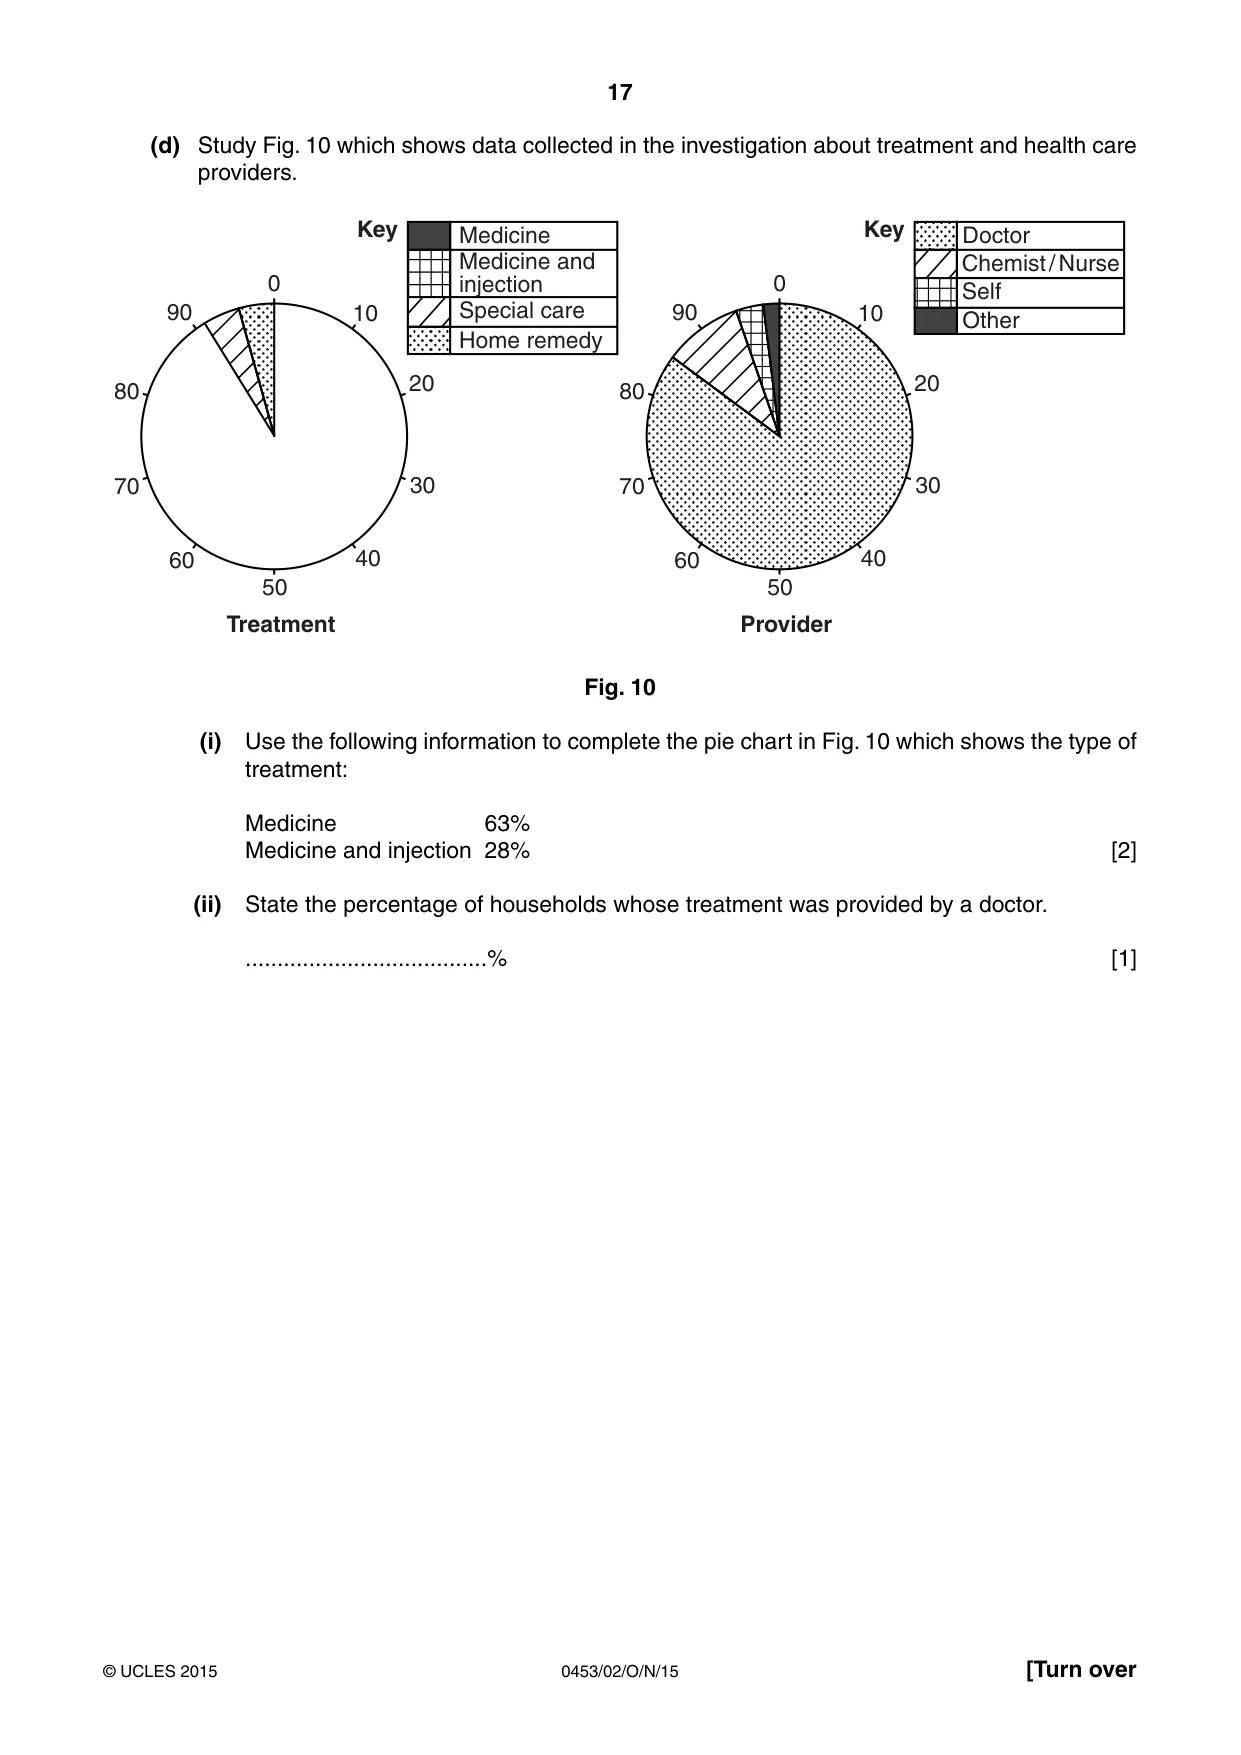
17 0453/02/O/N/15 © UCLES 2015 [Turn over (d) Study Fig. 10 which shows data collected in the investigation about treatment and health care providers. 0 10 20 30 40 50 60 70 80 90 Treatment 0 10 20 30 40 50 60 70 80 90 Provider Key Medicine Special care Home remedy Medicine and injection Key Doctor Chemist / Nurse Self Other Fig. 10 (i) Use the following information to complete the pie chart in Fig. 10 which shows the type of treatment: Medicine 63% Medicine and injection 28% [2] (ii) State the percentage of households whose treatment was provided by a doctor. …% [1]
Question paper, page 18
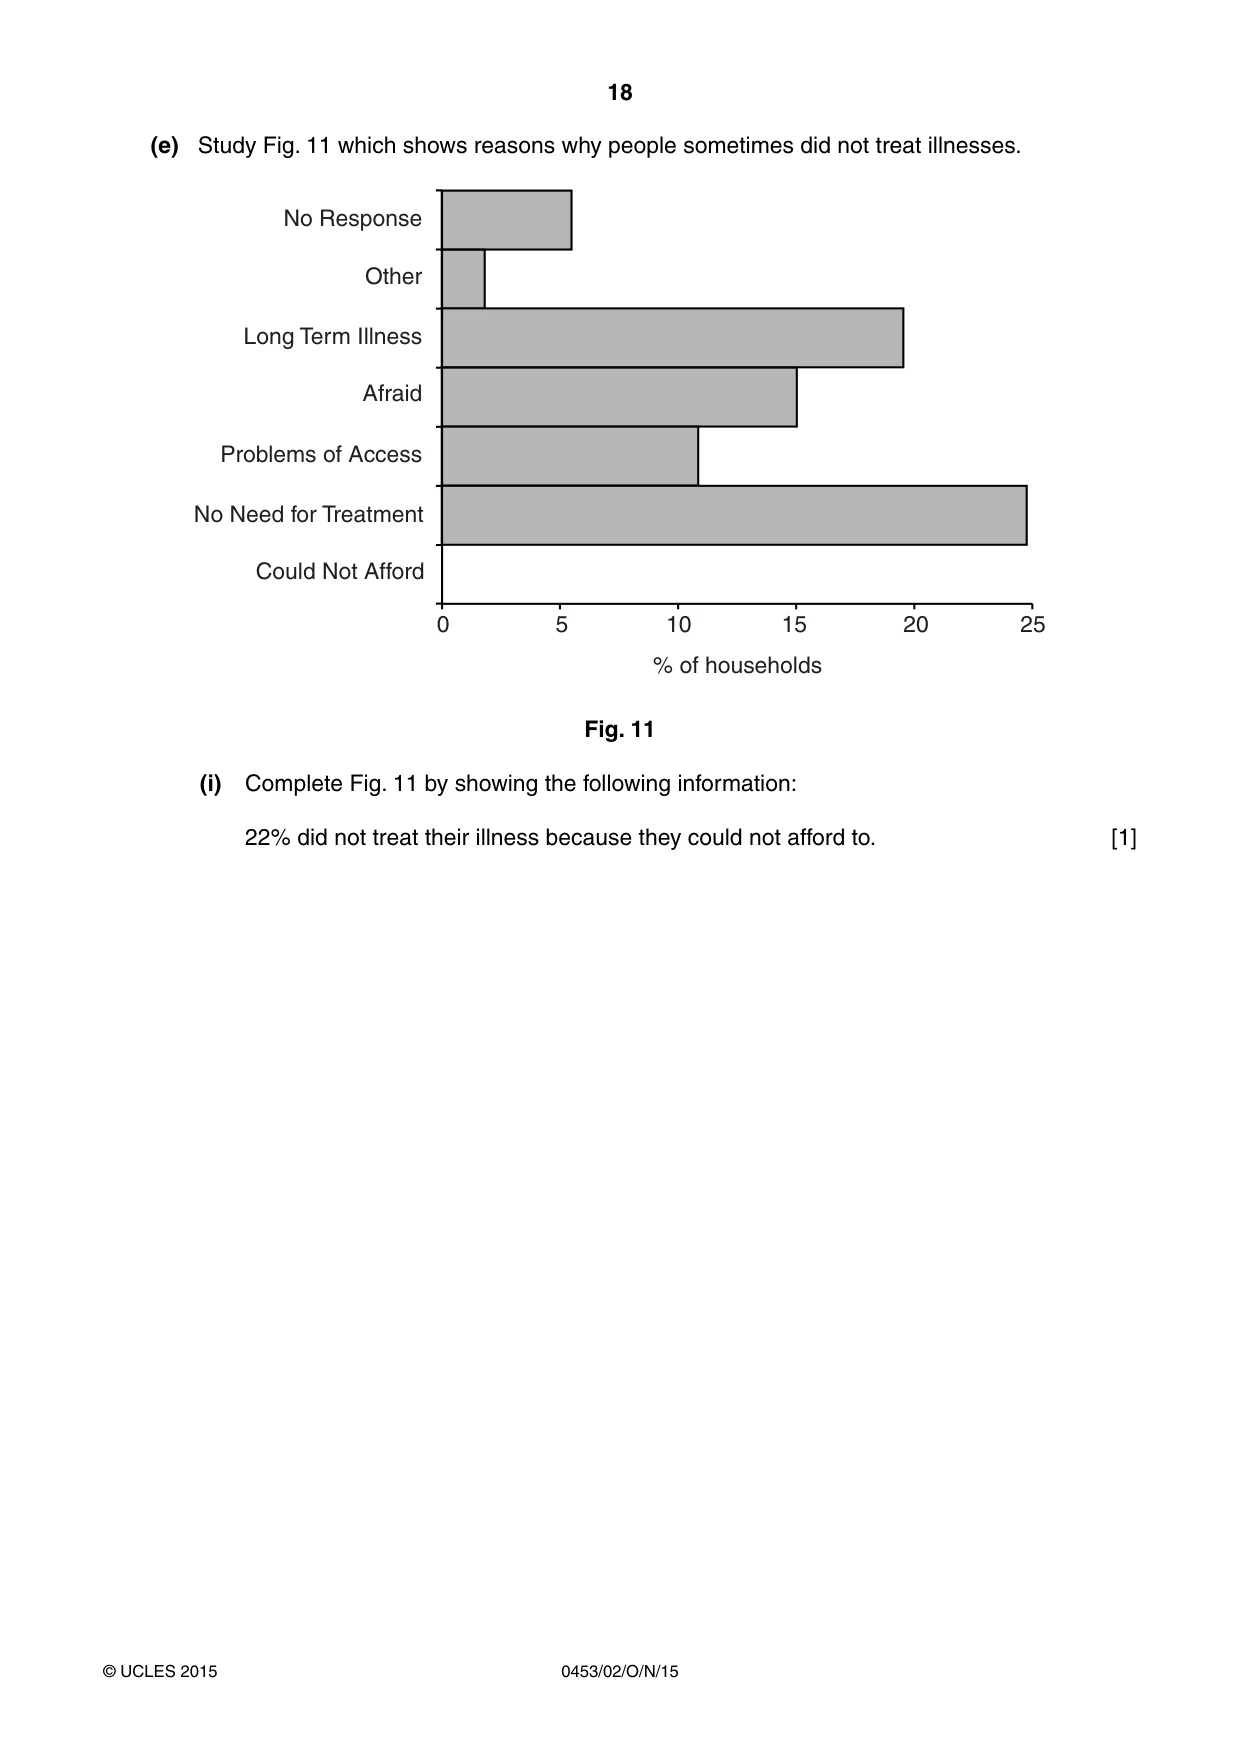
18 0453/02/O/N/15 © UCLES 2015 (e) Study Fig. 11 which shows reasons why people sometimes did not treat illnesses. No Response Other Long Term Illness Afraid Problems of Access No Need for Treatment Could Not Afford 0 5 10 15 20 25 % of households Fig. 11 (i) Complete Fig. 11 by showing the following information: 22% did not treat their illness because they could not afford to. [1]
Question paper, page 19
19 0453/02/O/N/15 © UCLES 2015 (ii) Suggest possible solutions to the problem of non-treatment of illness in the area. Justify your suggestions. … … … … … … … … … … … … [6] [Total: 38 marks]
Question paper, page 20
20 0453/02/O/N/15 © UCLES 2015 Permission to reproduce items where third-party owned material protected by copyright is included has been sought and cleared where possible. Every reasonable effort has been made by the publisher (UCLES) to trace copyright holders, but if any items requiring clearance have unwittingly been included, the publisher will be pleased to make amends at the earliest possible opportunity. To avoid the issue of disclosure of answer-related information to candidates, all copyright acknowledgements are reproduced online in the Cambridge International Examinations Copyright Acknowledgements Booklet. This is produced for each series of examinations and is freely available to download at www.cie.org.uk after the live examination series. Cambridge International Examinations is part of the Cambridge Assessment Group. Cambridge Assessment is the brand name of University of Cambridge Local Examinations Syndicate (UCLES), which is itself a department of the University of Cambridge. BLANK PAGE
Mark scheme, page 1
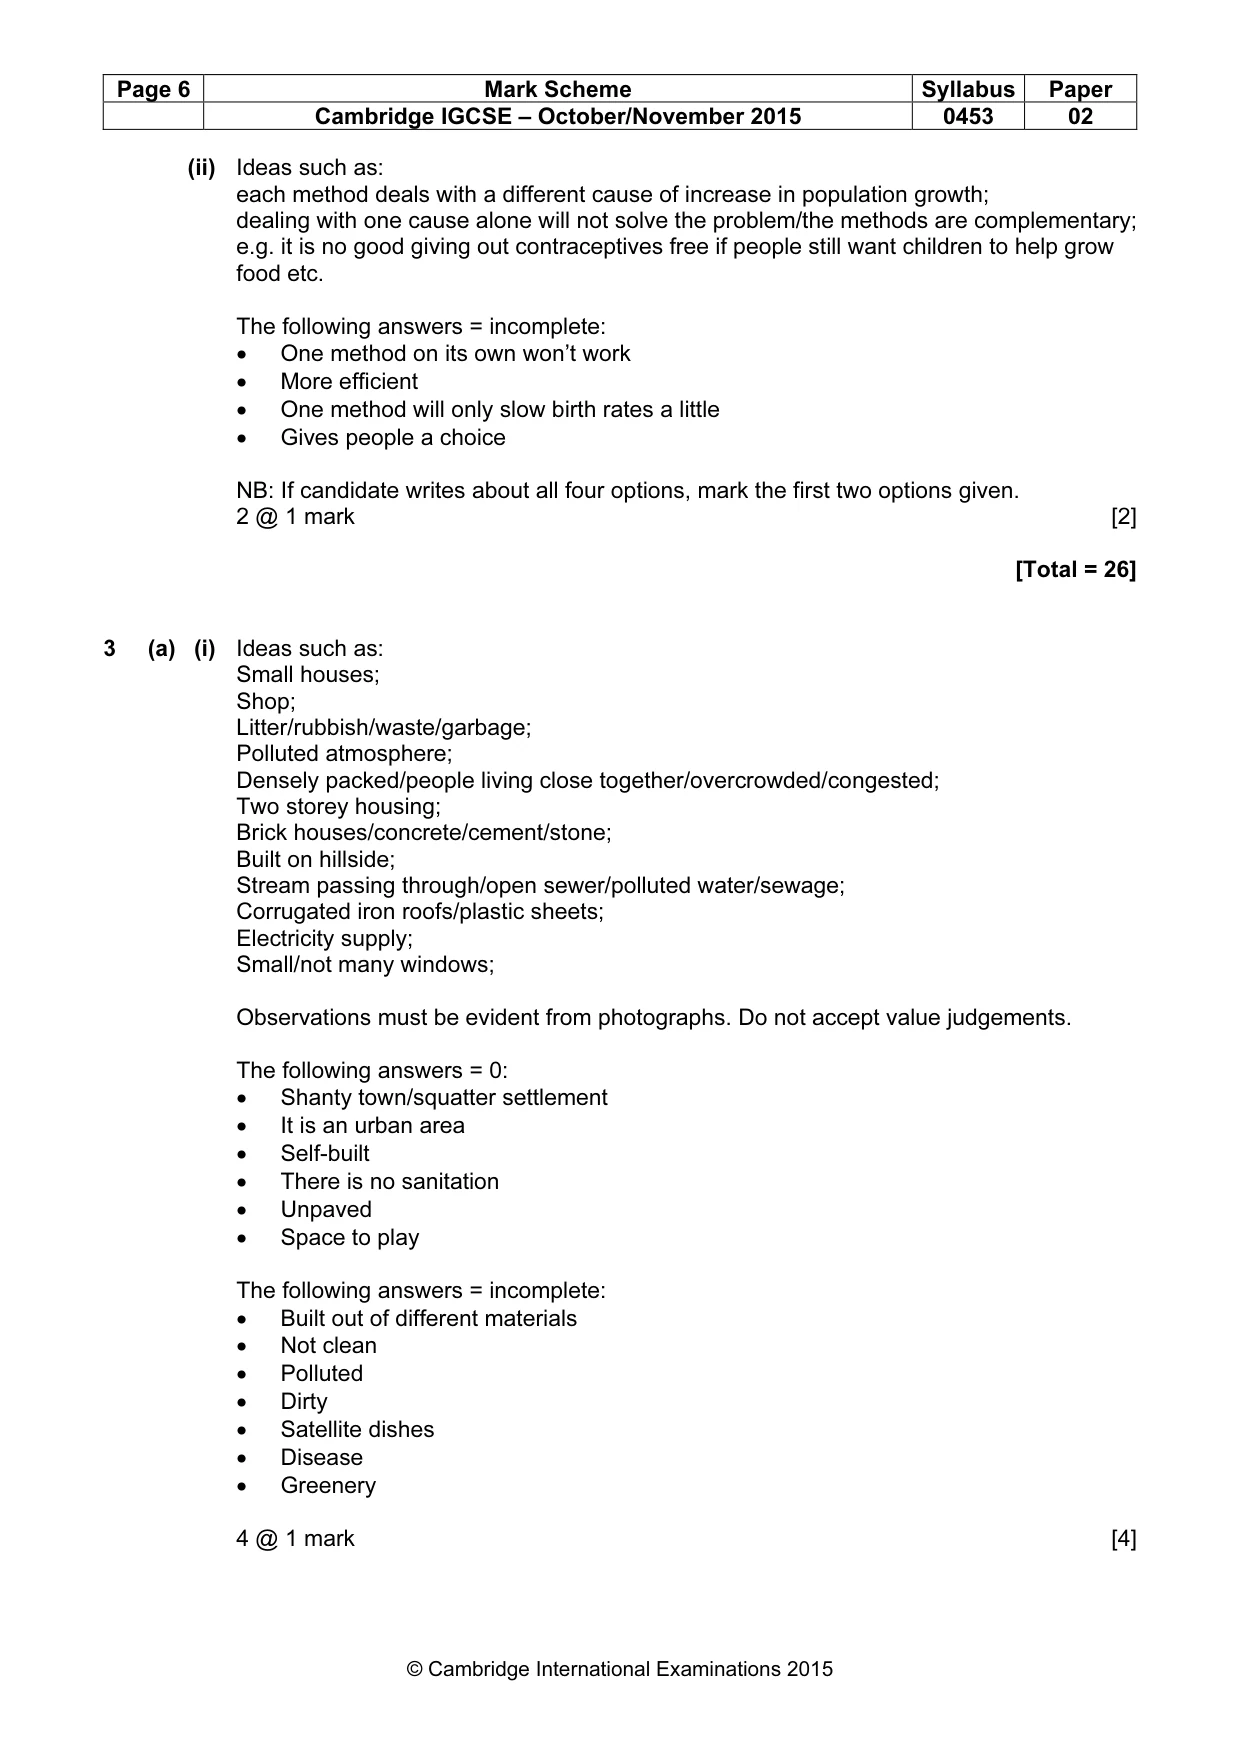
® IGCSE is the registered trademark of Cambridge International Examinations. CAMBRIDGE INTERNATIONAL EXAMINATIONS Cambridge International General Certificate of Secondary Education MARK SCHEME for the October/November 2015 series 0453 DEVELOPMENT STUDIES 0453/02 Paper 2, maximum raw mark 80 This mark scheme is published as an aid to teachers and candidates, to indicate the requirements of the examination. It shows the basis on which Examiners were instructed to award marks. It does not indicate the details of the discussions that took place at an Examiners’ meeting before marking began, which would have considered the acceptability of alternative answers. Mark schemes should be read in conjunction with the question paper and the Principal Examiner Report for Teachers. Cambridge will not enter into discussions about these mark schemes. Cambridge is publishing the mark schemes for the October/November 2015 series for most Cambridge IGCSE®, Cambridge International A and AS Level components and some Cambridge O Level components.
Mark scheme, page 2
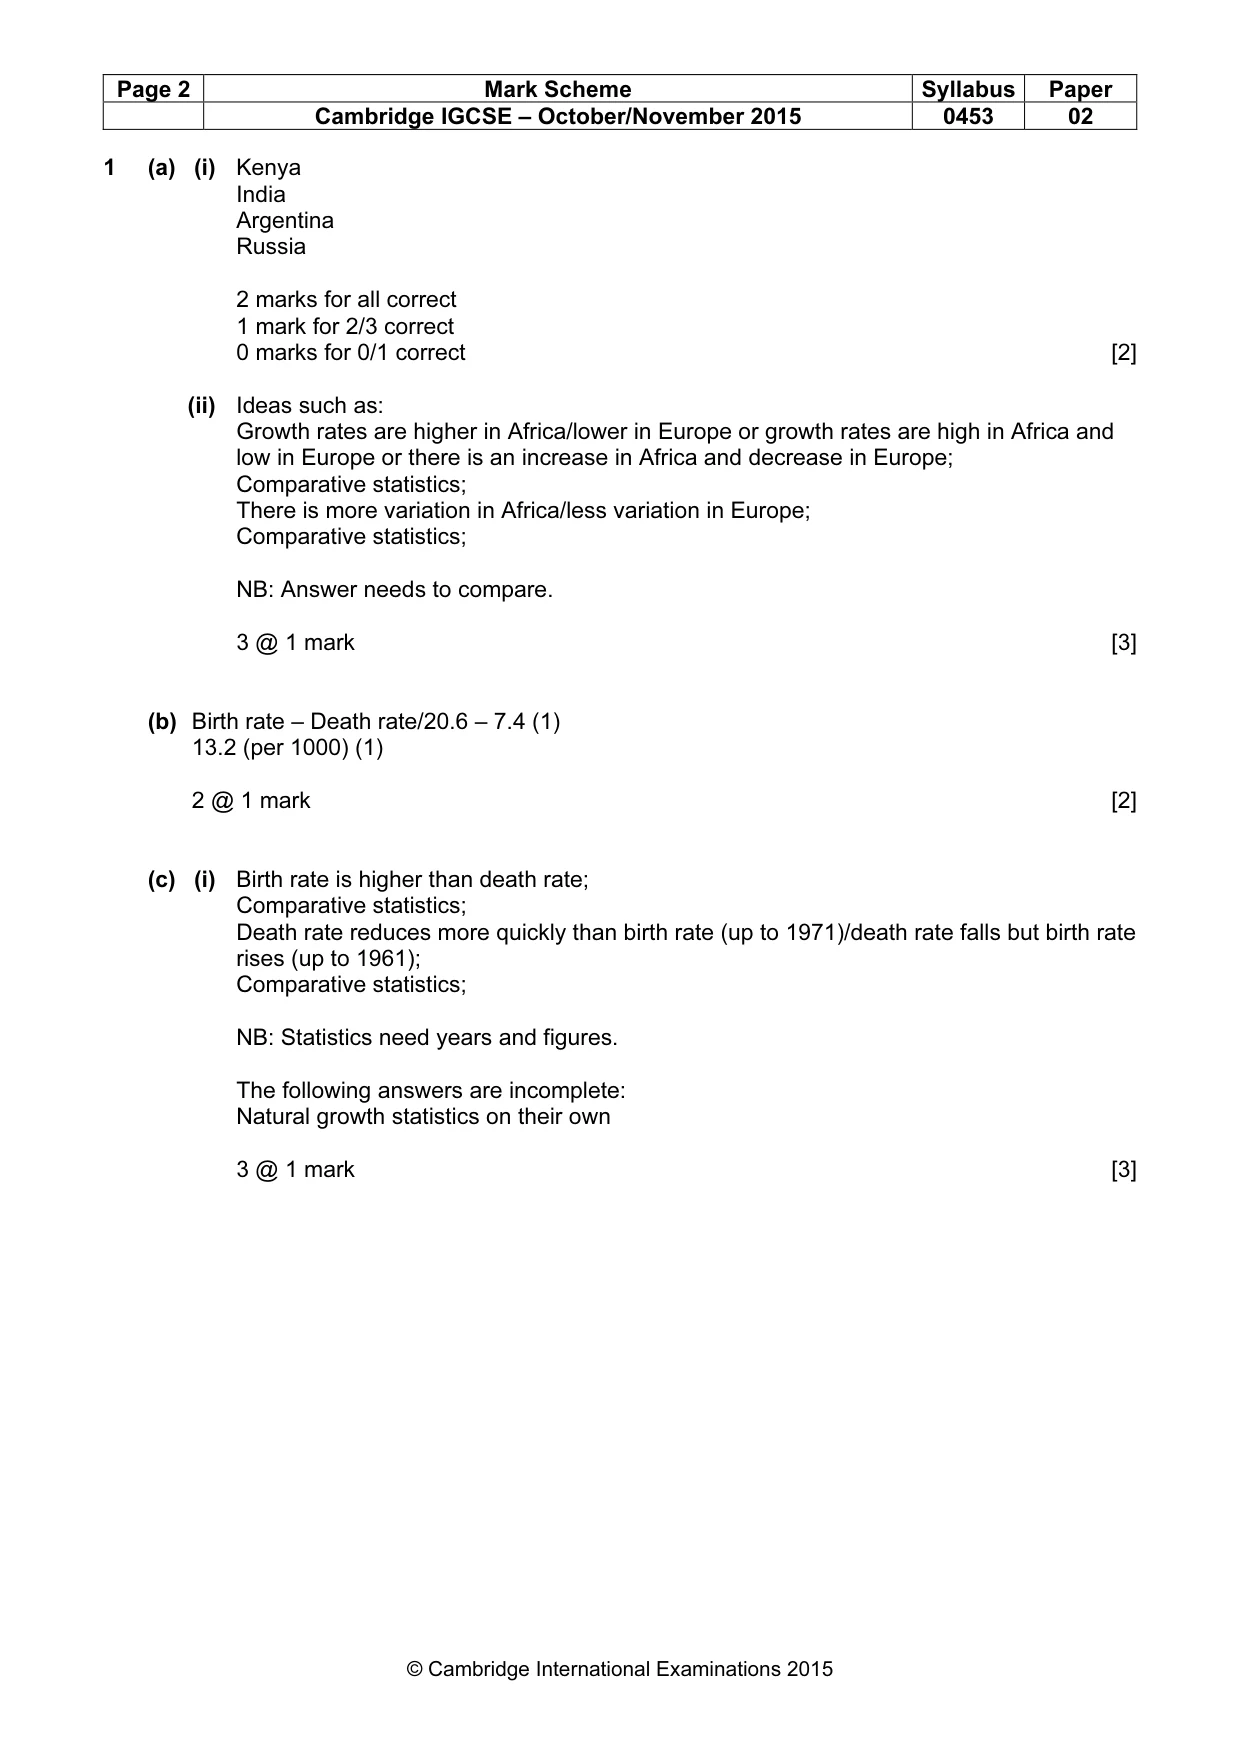
Page 2 Mark Scheme Syllabus Paper Cambridge IGCSE – October/November 2015 0453 02 © Cambridge International Examinations 2015 1 (a) (i) Kenya India Argentina Russia 2 marks for all correct 1 mark for 2/3 correct 0 marks for 0/1 correct [2] (ii) Ideas such as: Growth rates are higher in Africa/lower in Europe or growth rates are high in Africa and low in Europe or there is an increase in Africa and decrease in Europe; Comparative statistics; There is more variation in Africa/less variation in Europe; Comparative statistics; NB: Answer needs to compare. 3 @ 1 mark [3] (b) Birth rate – Death rate/20.6 – 7.4 (1) 13.2 (per 1000) (1) 2 @ 1 mark [2] (c) (i) Birth rate is higher than death rate; Comparative statistics; Death rate reduces more quickly than birth rate (up to 1971)/death rate falls but birth rate rises (up to 1961); Comparative statistics; NB: Statistics need years and figures. The following answers are incomplete: Natural growth statistics on their own 3 @ 1 mark [3]
Mark scheme, page 3
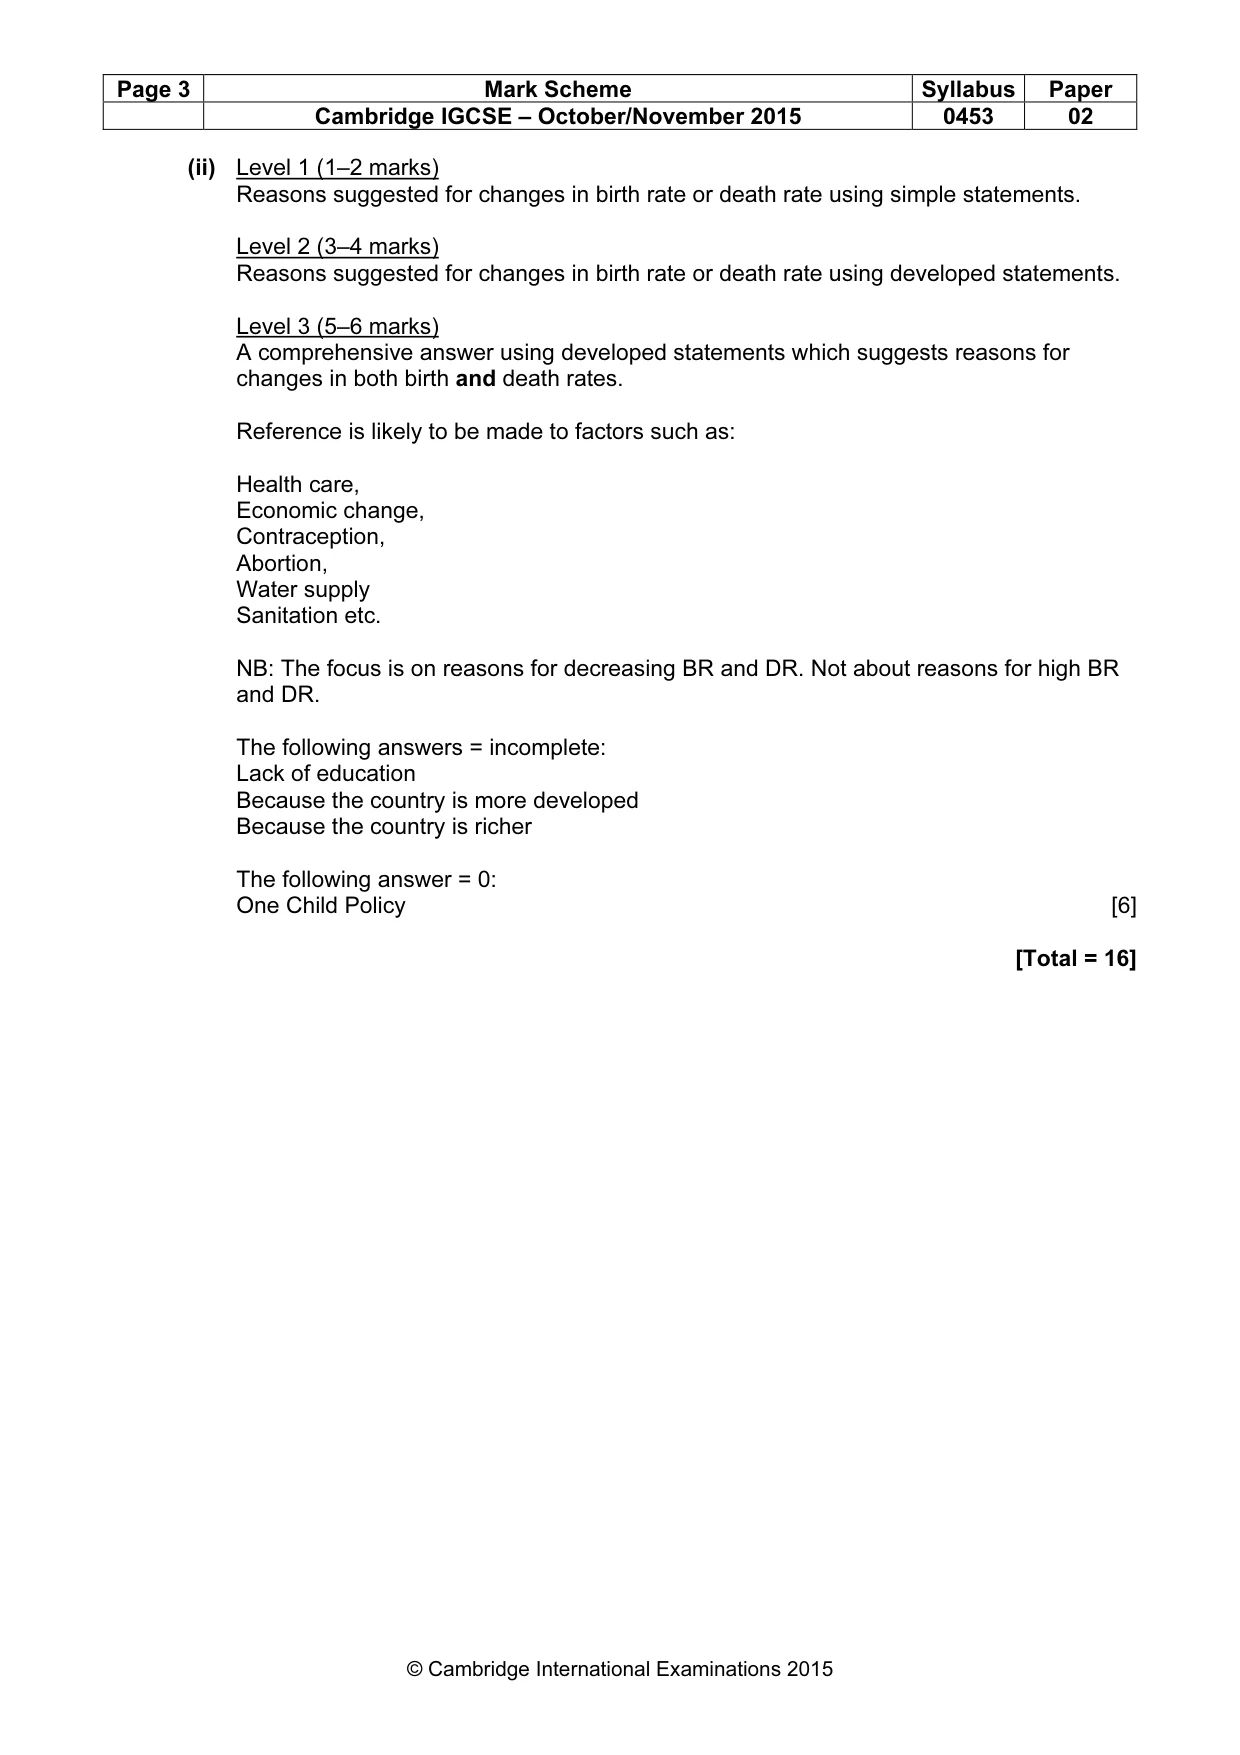
Page 3 Mark Scheme Syllabus Paper Cambridge IGCSE – October/November 2015 0453 02 © Cambridge International Examinations 2015 (ii) Level 1 (1–2 marks) Reasons suggested for changes in birth rate or death rate using simple statements. Level 2 (3–4 marks) Reasons suggested for changes in birth rate or death rate using developed statements. Level 3 (5–6 marks) A comprehensive answer using developed statements which suggests reasons for changes in both birth and death rates. Reference is likely to be made to factors such as: Health care, Economic change, Contraception, Abortion, Water supply Sanitation etc. NB: The focus is on reasons for decreasing BR and DR. Not about reasons for high BR and DR. The following answers = incomplete: Lack of education Because the country is more developed Because the country is richer The following answer = 0: One Child Policy [6] [Total = 16]
Mark scheme, page 4
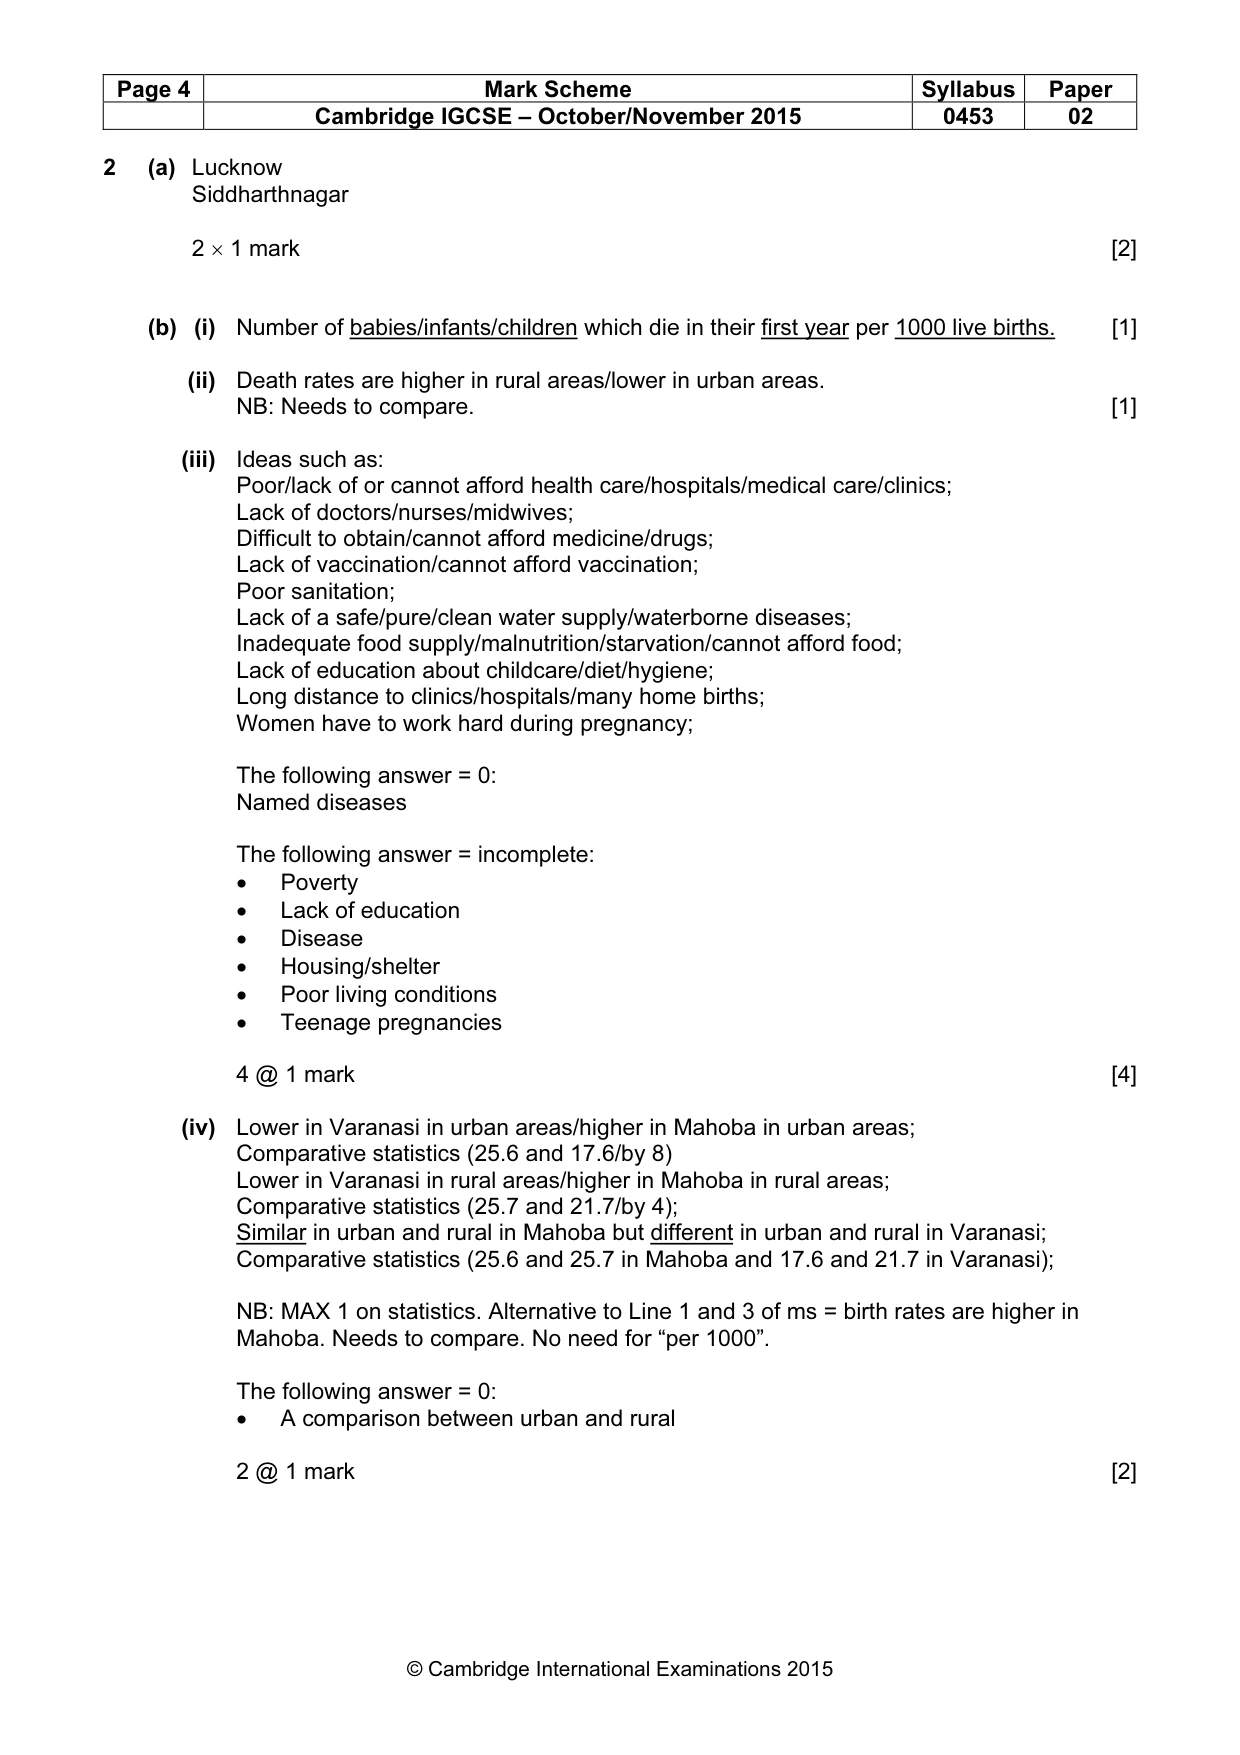
Page 4 Mark Scheme Syllabus Paper Cambridge IGCSE – October/November 2015 0453 02 © Cambridge International Examinations 2015 2 (a) Lucknow Siddharthnagar 2 × 1 mark [2] (b) (i) Number of babies/infants/children which die in their first year per 1000 live births. [1] (ii) Death rates are higher in rural areas/lower in urban areas. NB: Needs to compare. [1] (iii) Ideas such as: Poor/lack of or cannot afford health care/hospitals/medical care/clinics; Lack of doctors/nurses/midwives; Difficult to obtain/cannot afford medicine/drugs; Lack of vaccination/cannot afford vaccination; Poor sanitation; Lack of a safe/pure/clean water supply/waterborne diseases; Inadequate food supply/malnutrition/starvation/cannot afford food; Lack of education about childcare/diet/hygiene; Long distance to clinics/hospitals/many home births; Women have to work hard during pregnancy; The following answer = 0: Named diseases The following answer = incomplete: • Poverty • Lack of education • Disease • Housing/shelter • Poor living conditions • Teenage pregnancies 4 @ 1 mark [4] (iv) Lower in Varanasi in urban areas/higher in Mahoba in urban areas; Comparative statistics (25.6 and 17.6/by 8) Lower in Varanasi in rural areas/higher in Mahoba in rural areas; Comparative statistics (25.7 and 21.7/by 4); Similar in urban and rural in Mahoba but different in urban and rural in Varanasi; Comparative statistics (25.6 and 25.7 in Mahoba and 17.6 and 21.7 in Varanasi); NB: MAX 1 on statistics. Alternative to Line 1 and 3 of ms = birth rates are higher in Mahoba. Needs to compare. No need for “per 1000”. The following answer = 0: • A comparison between urban and rural 2 @ 1 mark [2]
Mark scheme, page 5
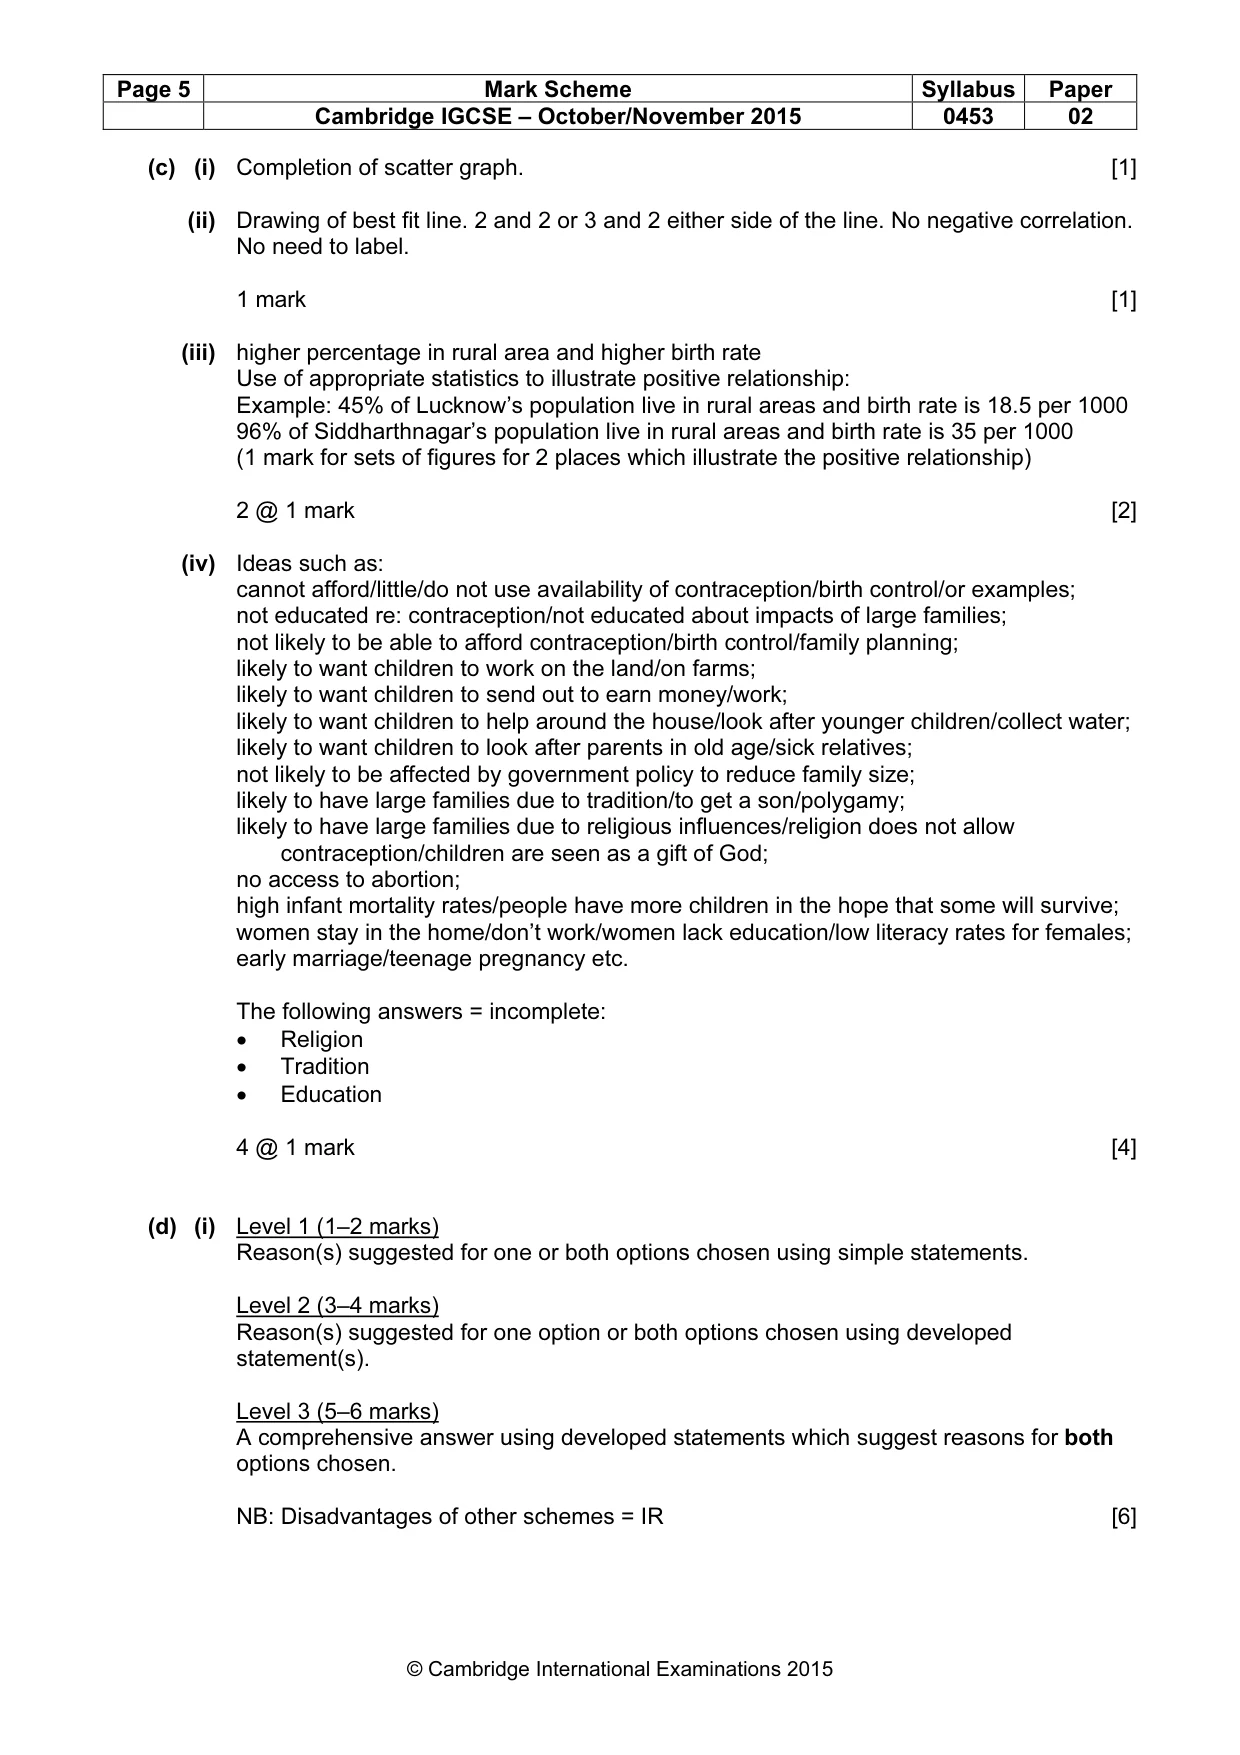
Page 5 Mark Scheme Syllabus Paper Cambridge IGCSE – October/November 2015 0453 02 © Cambridge International Examinations 2015 (c) (i) Completion of scatter graph. [1] (ii) Drawing of best fit line. 2 and 2 or 3 and 2 either side of the line. No negative correlation. No need to label. 1 mark [1] (iii) higher percentage in rural area and higher birth rate Use of appropriate statistics to illustrate positive relationship: Example: 45% of Lucknow’s population live in rural areas and birth rate is 18.5 per 1000 96% of Siddharthnagar’s population live in rural areas and birth rate is 35 per 1000 (1 mark for sets of figures for 2 places which illustrate the positive relationship) 2 @ 1 mark [2] (iv) Ideas such as: cannot afford/little/do not use availability of contraception/birth control/or examples; not educated re: contraception/not educated about impacts of large families; not likely to be able to afford contraception/birth control/family planning; likely to want children to work on the land/on farms; likely to want children to send out to earn money/work; likely to want children to help around the house/look after younger children/collect water; likely to want children to look after parents in old age/sick relatives; not likely to be affected by government policy to reduce family size; likely to have large families due to tradition/to get a son/polygamy; likely to have large families due to religious influences/religion does not allow contraception/children are seen as a gift of God; no access to abortion; high infant mortality rates/people have more children in the hope that some will survive; women stay in the home/don’t work/women lack education/low literacy rates for females; early marriage/teenage pregnancy etc. The following answers = incomplete: • Religion • Tradition • Education 4 @ 1 mark [4] (d) (i) Level 1 (1–2 marks) Reason(s) suggested for one or both options chosen using simple statements. Level 2 (3–4 marks) Reason(s) suggested for one option or both options chosen using developed statement(s). Level 3 (5–6 marks) A comprehensive answer using developed statements which suggest reasons for both options chosen. NB: Disadvantages of other schemes = IR [6]
Mark scheme, page 6
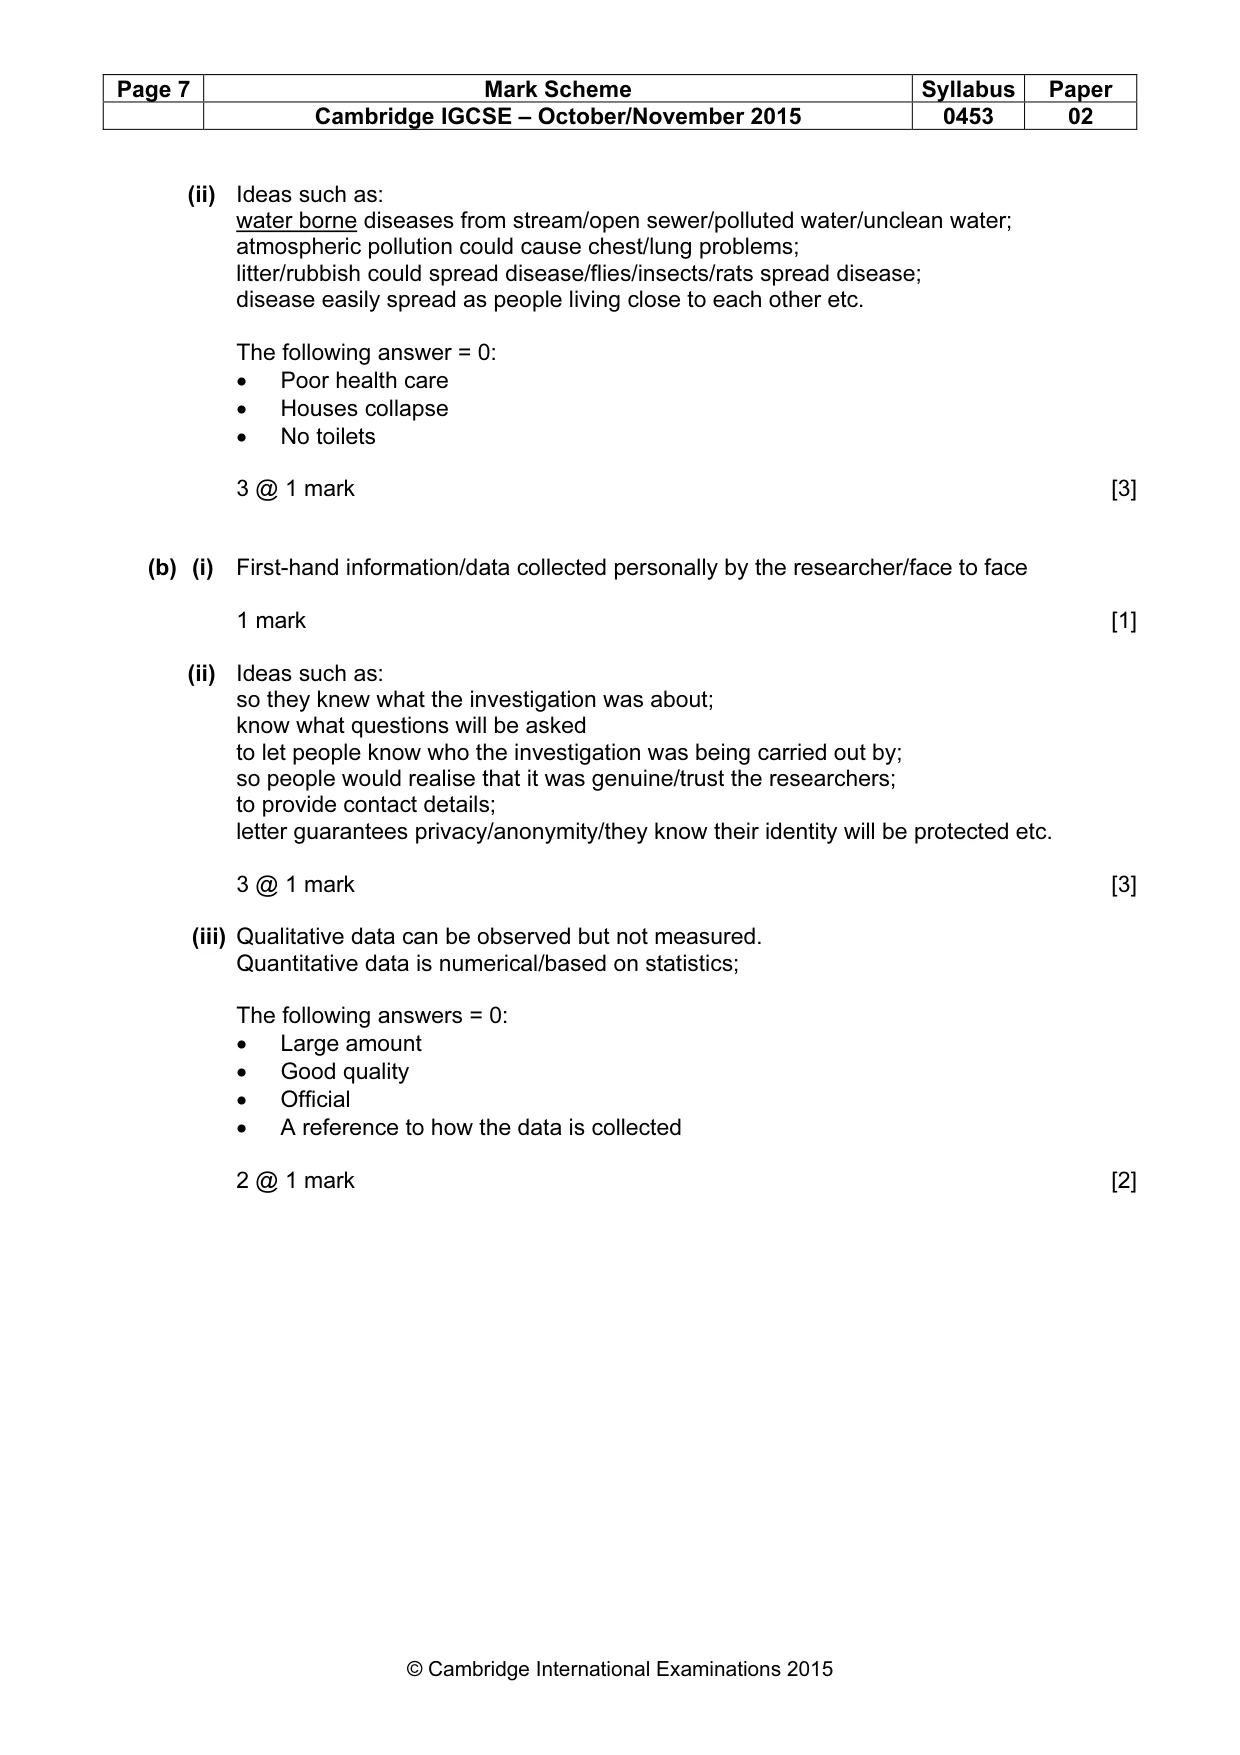
Page 6 Mark Scheme Syllabus Paper Cambridge IGCSE – October/November 2015 0453 02 © Cambridge International Examinations 2015 (ii) Ideas such as: each method deals with a different cause of increase in population growth; dealing with one cause alone will not solve the problem/the methods are complementary; e.g. it is no good giving out contraceptives free if people still want children to help grow food etc. The following answers = incomplete: • One method on its own won’t work • More efficient • One method will only slow birth rates a little • Gives people a choice NB: If candidate writes about all four options, mark the first two options given. 2 @ 1 mark [2] [Total = 26] 3 (a) (i) Ideas such as: Small houses; Shop; Litter/rubbish/waste/garbage; Polluted atmosphere; Densely packed/people living close together/overcrowded/congested; Two storey housing; Brick houses/concrete/cement/stone; Built on hillside; Stream passing through/open sewer/polluted water/sewage; Corrugated iron roofs/plastic sheets; Electricity supply; Small/not many windows; Observations must be evident from photographs. Do not accept value judgements. The following answers = 0: • Shanty town/squatter settlement • It is an urban area • Self-built • There is no sanitation • Unpaved • Space to play The following answers = incomplete: • Built out of different materials • Not clean • Polluted • Dirty • Satellite dishes • Disease • Greenery 4 @ 1 mark [4]
Mark scheme, page 7
Page 7 Mark Scheme Syllabus Paper Cambridge IGCSE – October/November 2015 0453 02 © Cambridge International Examinations 2015 (ii) Ideas such as: water borne diseases from stream/open sewer/polluted water/unclean water; atmospheric pollution could cause chest/lung problems; litter/rubbish could spread disease/flies/insects/rats spread disease; disease easily spread as people living close to each other etc. The following answer = 0: • Poor health care • Houses collapse • No toilets 3 @ 1 mark [3] (b) (i) First-hand information/data collected personally by the researcher/face to face 1 mark [1] (ii) Ideas such as: so they knew what the investigation was about; know what questions will be asked to let people know who the investigation was being carried out by; so people would realise that it was genuine/trust the researchers; to provide contact details; letter guarantees privacy/anonymity/they know their identity will be protected etc. 3 @ 1 mark [3] (iii) Qualitative data can be observed but not measured. Quantitative data is numerical/based on statistics; The following answers = 0: • Large amount • Good quality • Official • A reference to how the data is collected 2 @ 1 mark [2]
Mark scheme, page 8
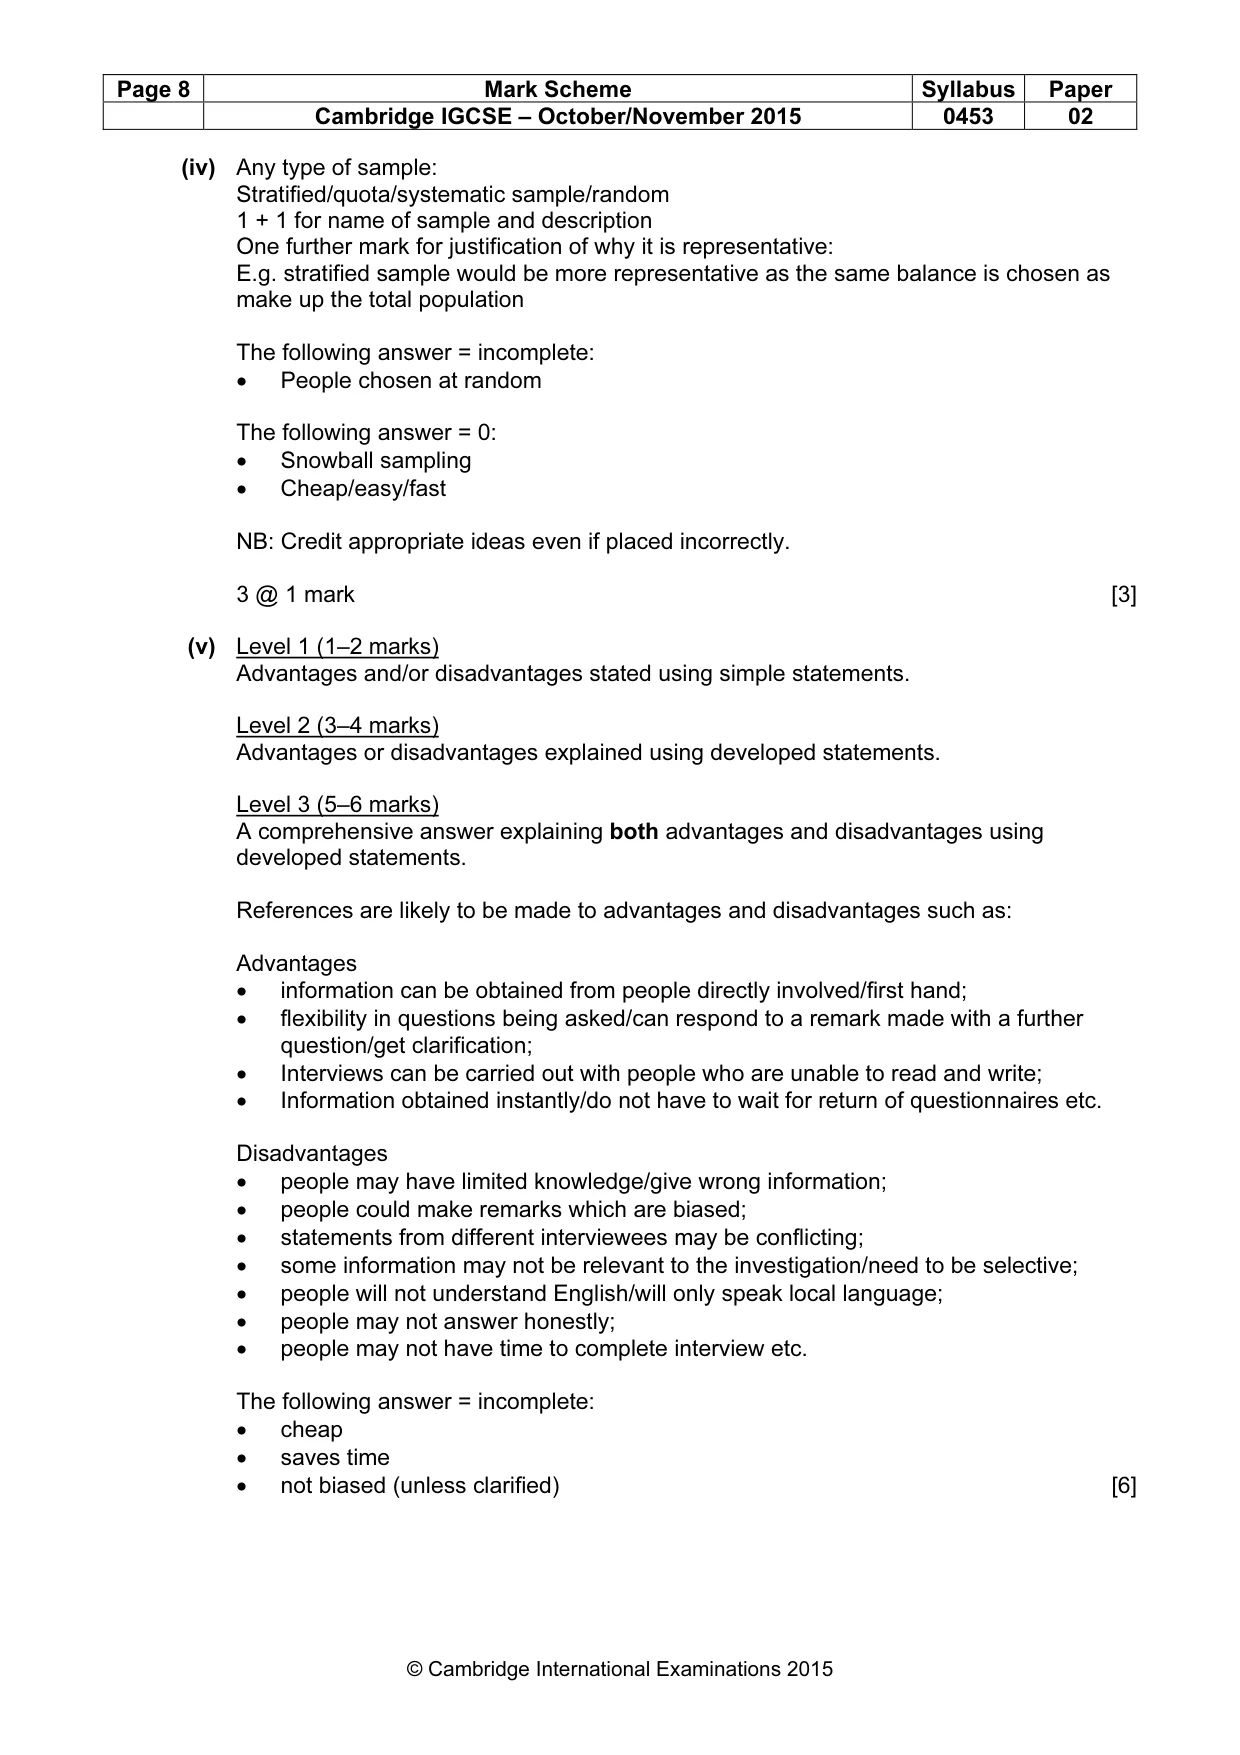
Page 8 Mark Scheme Syllabus Paper Cambridge IGCSE – October/November 2015 0453 02 © Cambridge International Examinations 2015 (iv) Any type of sample: Stratified/quota/systematic sample/random 1 + 1 for name of sample and description One further mark for justification of why it is representative: E.g. stratified sample would be more representative as the same balance is chosen as make up the total population The following answer = incomplete: • People chosen at random The following answer = 0: • Snowball sampling • Cheap/easy/fast NB: Credit appropriate ideas even if placed incorrectly. 3 @ 1 mark [3] (v) Level 1 (1–2 marks) Advantages and/or disadvantages stated using simple statements. Level 2 (3–4 marks) Advantages or disadvantages explained using developed statements. Level 3 (5–6 marks) A comprehensive answer explaining both advantages and disadvantages using developed statements. References are likely to be made to advantages and disadvantages such as: Advantages • information can be obtained from people directly involved/first hand; • flexibility in questions being asked/can respond to a remark made with a further question/get clarification; • Interviews can be carried out with people who are unable to read and write; • Information obtained instantly/do not have to wait for return of questionnaires etc. Disadvantages • people may have limited knowledge/give wrong information; • people could make remarks which are biased; • statements from different interviewees may be conflicting; • some information may not be relevant to the investigation/need to be selective; • people will not understand English/will only speak local language; • people may not answer honestly; • people may not have time to complete interview etc. The following answer = incomplete: • cheap • saves time • not biased (unless clarified) [6]
Mark scheme, page 9
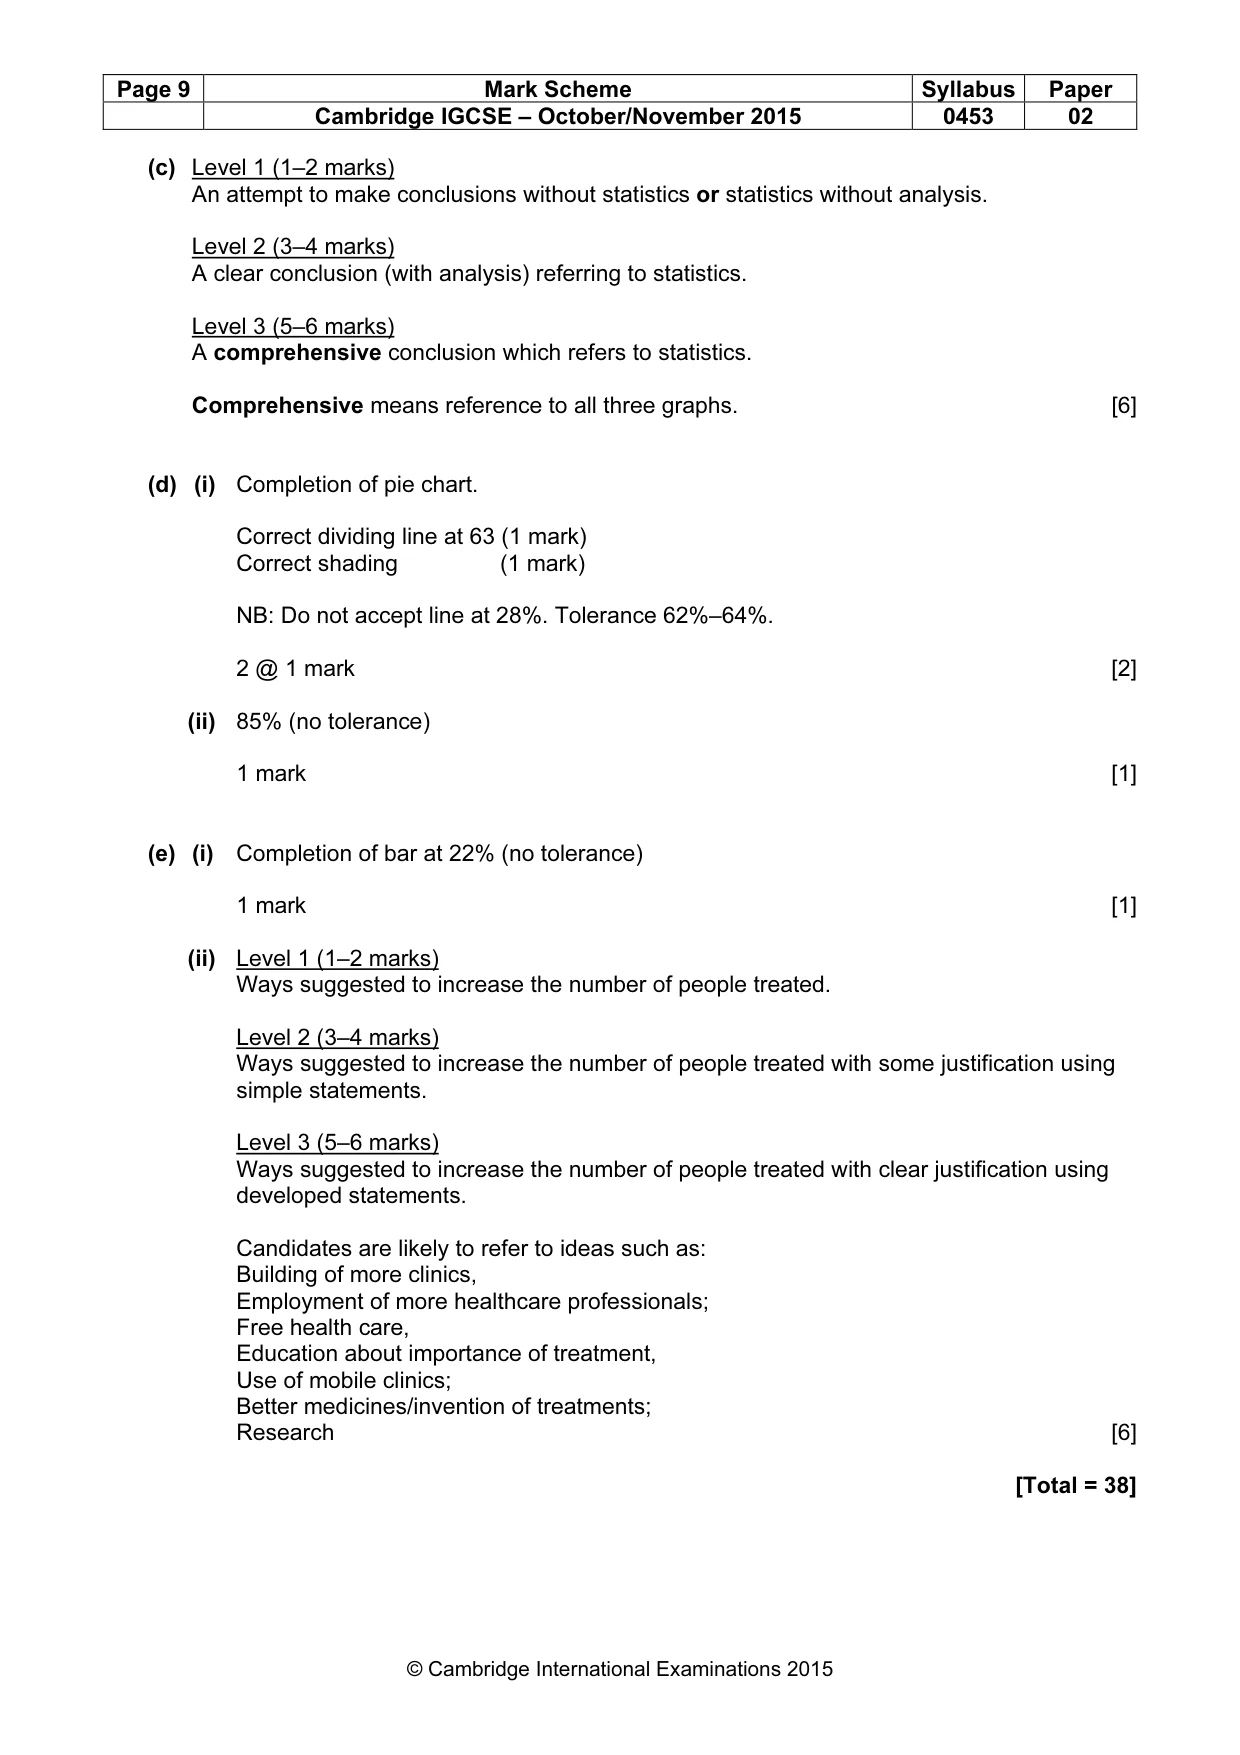
Page 9 Mark Scheme Syllabus Paper Cambridge IGCSE – October/November 2015 0453 02 © Cambridge International Examinations 2015 (c) Level 1 (1–2 marks) An attempt to make conclusions without statistics or statistics without analysis. Level 2 (3–4 marks) A clear conclusion (with analysis) referring to statistics. Level 3 (5–6 marks) A comprehensive conclusion which refers to statistics. Comprehensive means reference to all three graphs. [6] (d) (i) Completion of pie chart. Correct dividing line at 63 (1 mark) Correct shading (1 mark) NB: Do not accept line at 28%. Tolerance 62%–64%. 2 @ 1 mark [2] (ii) 85% (no tolerance) 1 mark [1] (e) (i) Completion of bar at 22% (no tolerance) 1 mark [1] (ii) Level 1 (1–2 marks) Ways suggested to increase the number of people treated. Level 2 (3–4 marks) Ways suggested to increase the number of people treated with some justification using simple statements. Level 3 (5–6 marks) Ways suggested to increase the number of people treated with clear justification using developed statements. Candidates are likely to refer to ideas such as: Building of more clinics, Employment of more healthcare professionals; Free health care, Education about importance of treatment, Use of mobile clinics; Better medicines/invention of treatments; Research [6] [Total = 38]
What you needed in this session
Cambridge’s own grade thresholds for 2015 Oct/Nov, Paper 2 · Variant 1. A higher threshold means an easier paper — the bar moves with how the cohort did.