Cambridge IGCSE Development Studies 0453 — 2011 Oct/Nov Paper 2 · Variant 1
0453/21/O/N/11 · 80 marks · ≈90 min
The question paper and its mark scheme, free to read here and free to download. This is Cambridge’s own paper, exactly as it was sat.
Question paper16 pages




Mark scheme7 pages
Answers below. Sit the paper first if you are practising.
Paper as text
Question paper, page 1
This document consists of 14 printed pages, 2 blank pages and 1 Insert. DC (RCL (SW/SW)) 31966/6 © UCLES 2011 [Turn over UNIVERSITY OF CAMBRIDGE INTERNATIONAL EXAMINATIONS International General Certificate of Secondary Education * 5 4 7 3 3 7 6 5 5 6 * DEVELOPMENT STUDIES 0453/02 Paper 2 October/November 2011 2 hours Candidates answer on the Question Paper. Additional Materials: Ruler READ THESE INSTRUCTIONS FIRST Write your Centre number, candidate number and name on all the work you hand in. Write in dark blue or black pen. You may use a soft pencil for any diagrams, graphs or rough working. Do not use staples, paper clips, highlighters, glue or correction fluid. DO NOT WRITE IN ANY BARCODES. Answer all the questions. You may not need all the answer lines for your answer. You should read and study the sources before answering the questions. The Insert contains Figs 1, 2 and 3 for Question 1 and Figs 4A and 4B for Question 2. At the end of the examination, fasten all your work securely together. The number of marks is given in brackets [ ] at the end of each question or part question. For Examiner’s Use 1 2 Total
Question paper, page 2
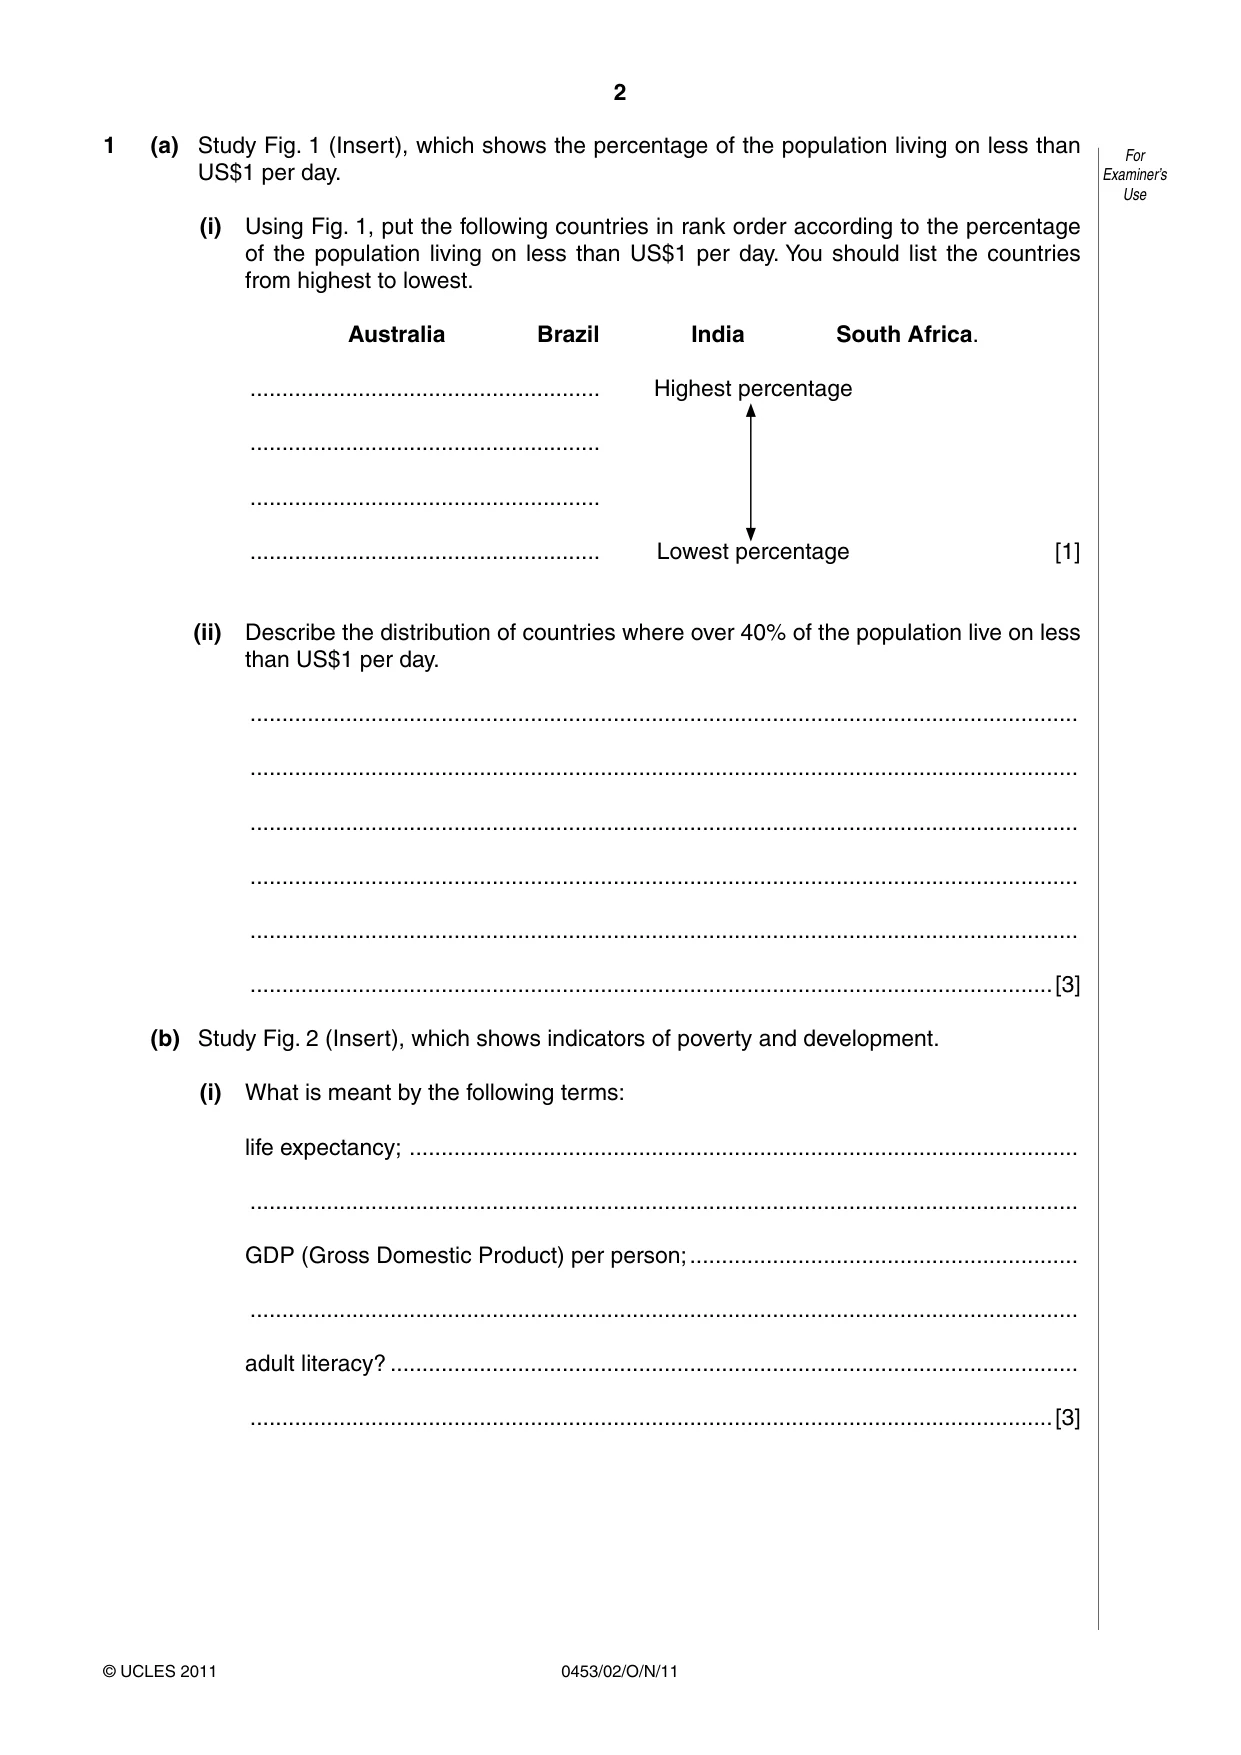
2 0453/02/O/N/11 © UCLES 2011 For Examiner’s Use 1 (a) Study Fig. 1 (Insert), which shows the percentage of the population living on less than US$1 per day. (i) Using Fig. 1, put the following countries in rank order according to the percentage of the population living on less than US$1 per day. You should list the countries from highest to lowest. Australia Brazil India South Africa. … Highest percentage … … … Lowest percentage [1] (ii) Describe the distribution of countries where over 40% of the population live on less than US$1 per day. … … … … … …[3] (b) Study Fig. 2 (Insert), which shows indicators of poverty and development. (i) What is meant by the following terms: life expectancy; … … GDP (Gross Domestic Product) per person; … … adult literacy? … …[3]
Question paper, page 3
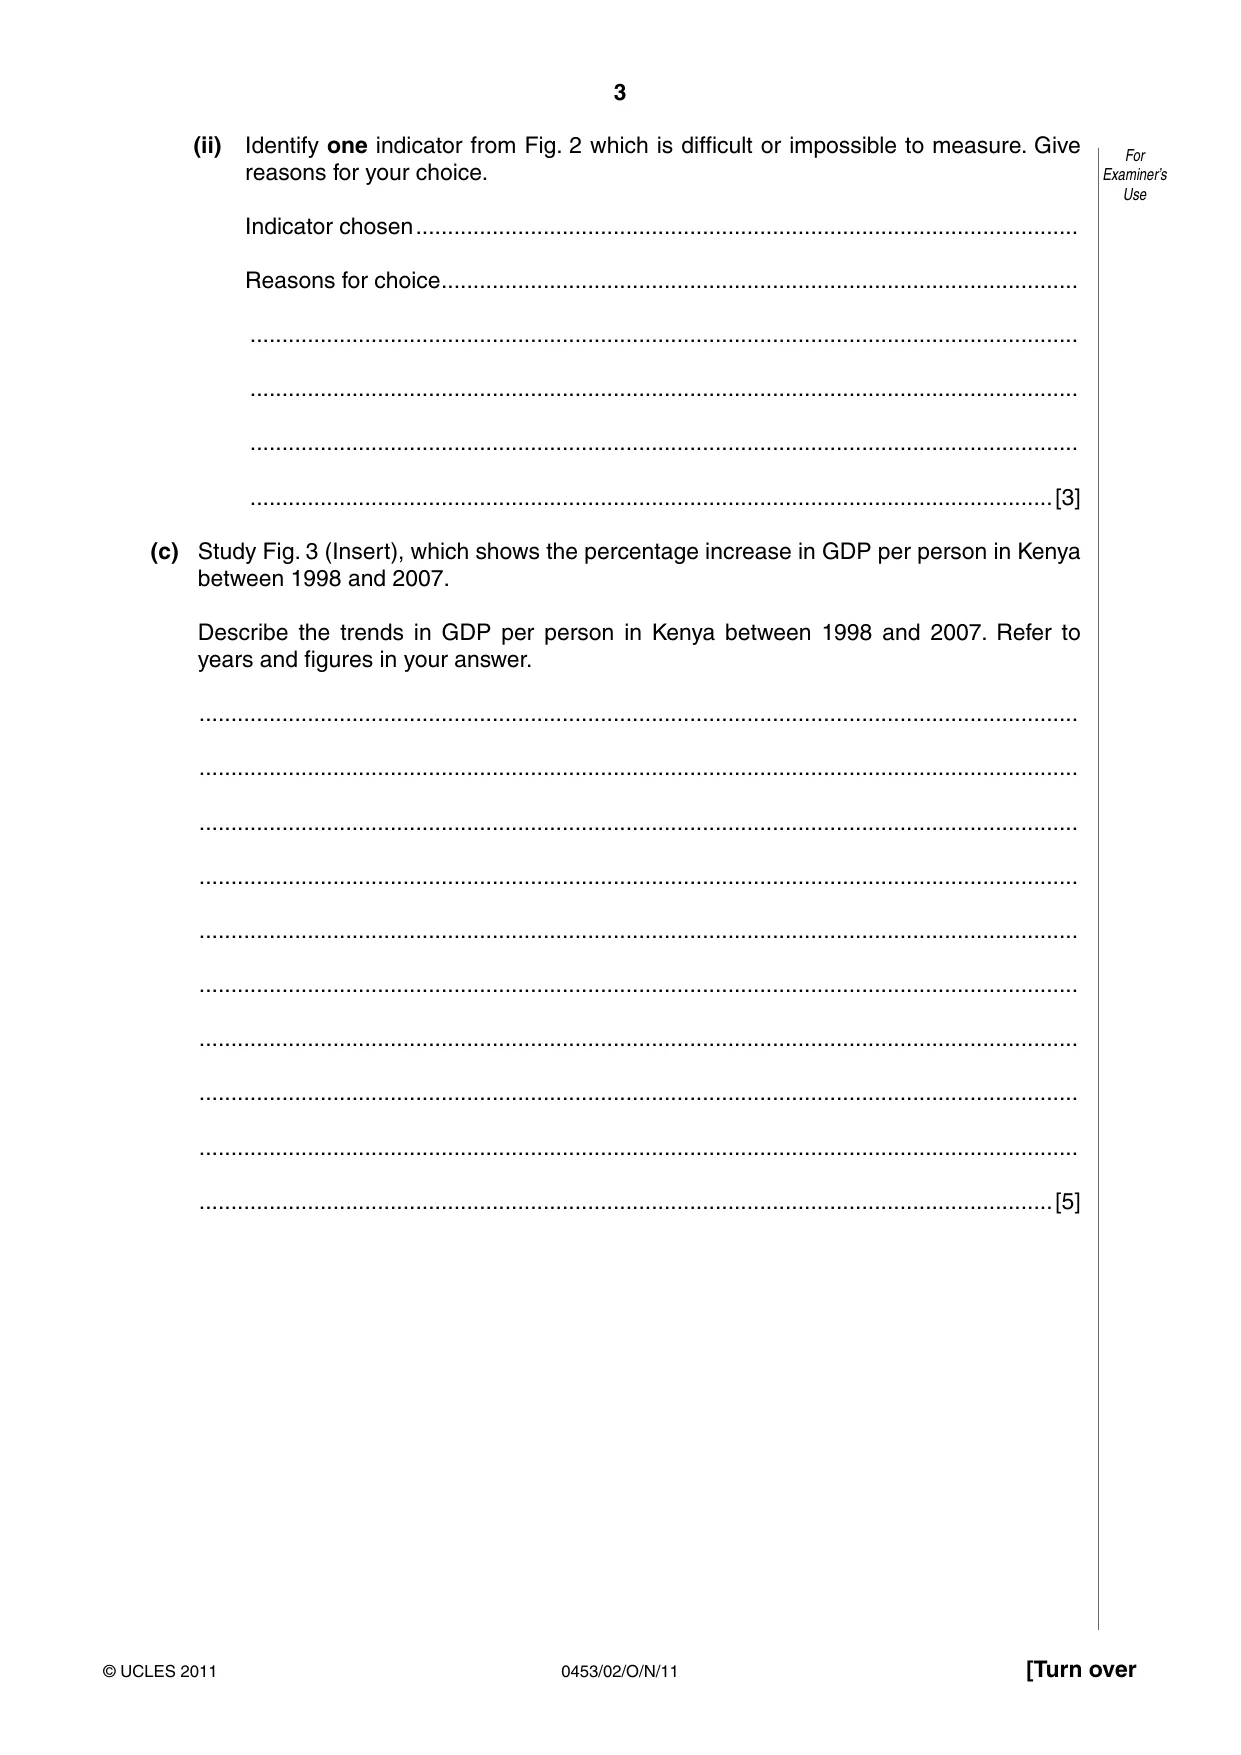
3 0453/02/O/N/11 © UCLES 2011 [Turn over For Examiner’s Use (ii) Identify one indicator from Fig. 2 which is difficult or impossible to measure. Give reasons for your choice. Indicator chosen … Reasons for choice … … … … …[3] (c) Study Fig. 3 (Insert), which shows the percentage increase in GDP per person in Kenya between 1998 and 2007. Describe the trends in GDP per person in Kenya between 1998 and 2007. Refer to years and figures in your answer. … … … … … … … … … …[5]
Question paper, page 4
4 0453/02/O/N/11 © UCLES 2011 For Examiner’s Use (d) A student wants to research the answer to the following question: Is Kenya a low, middle or high income country? Explain how the student could use a variety of indicators, such as those in Figs 1 and 2, to carry out this task. … … … … … … … … … … … …[6] [Total: 21 marks]
Question paper, page 5
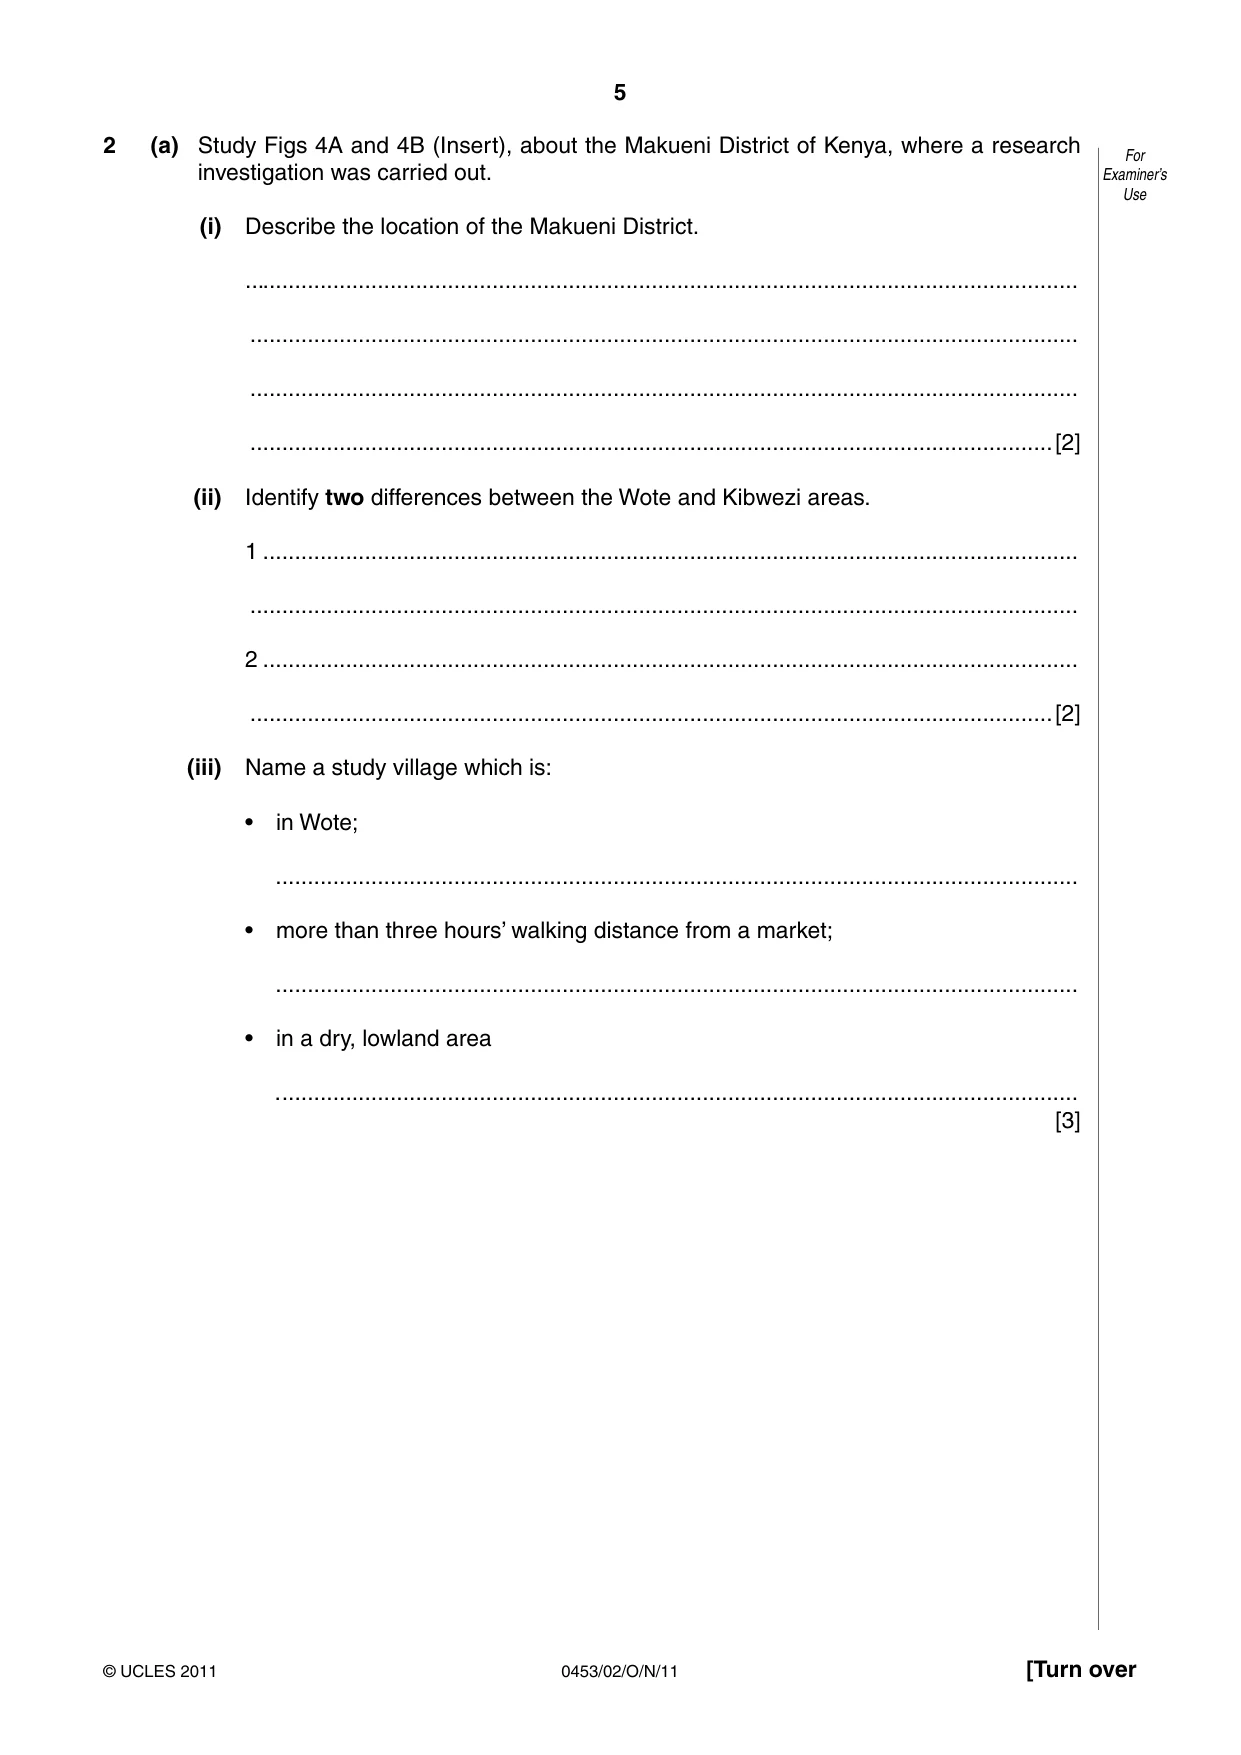
5 0453/02/O/N/11 © UCLES 2011 [Turn over For Examiner’s Use 2 (a) Study Figs 4A and 4B (Insert), about the Makueni District of Kenya, where a research investigation was carried out. (i) Describe the location of the Makueni District. … … … …[2] (ii) Identify two differences between the Wote and Kibwezi areas. 1 … … 2 … …[2] (iii) Name a study village which is: • in Wote; … • more than three hours’ walking distance from a market; … • in a dry, lowland area . … [3]
Question paper, page 6
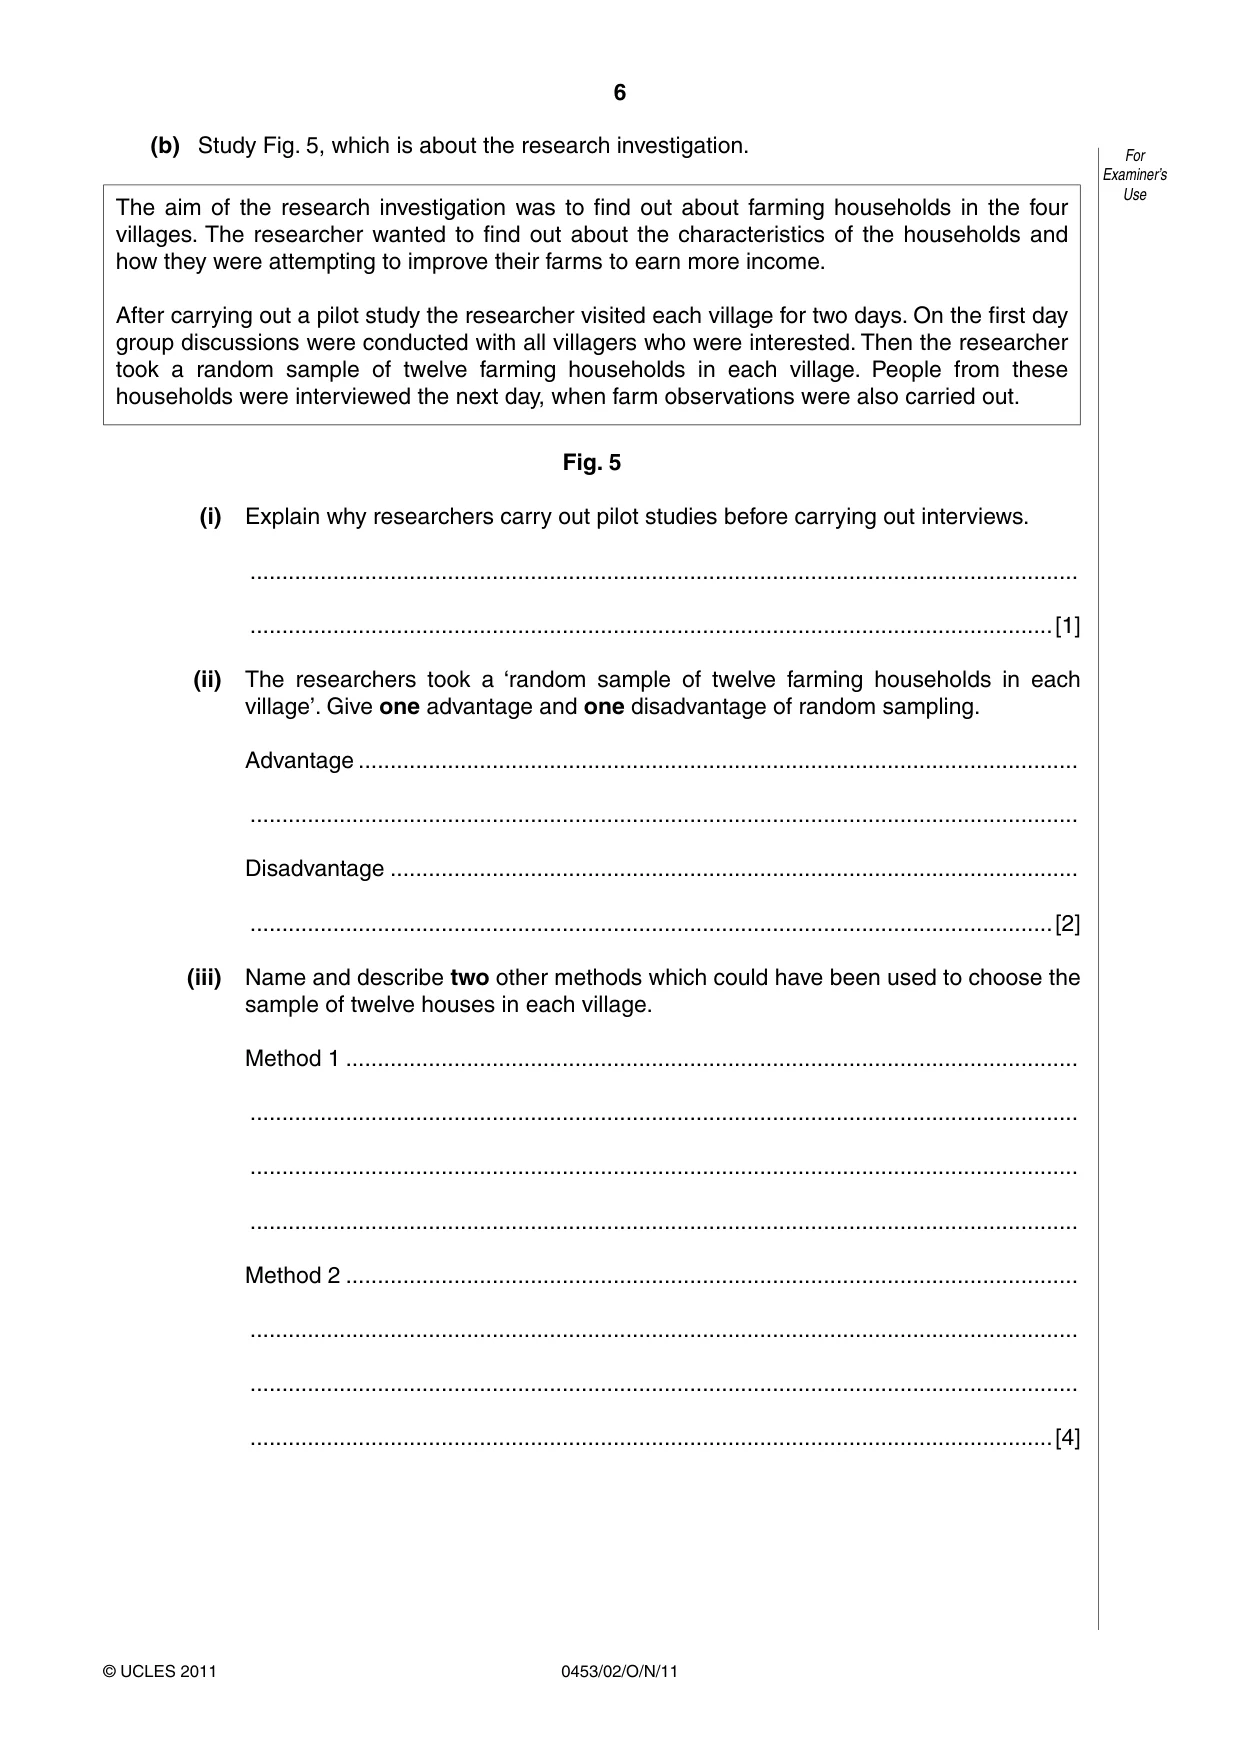
6 0453/02/O/N/11 © UCLES 2011 For Examiner’s Use (b) Study Fig. 5, which is about the research investigation. The aim of the research investigation was to find out about farming households in the four villages. The researcher wanted to find out about the characteristics of the households and how they were attempting to improve their farms to earn more income. After carrying out a pilot study the researcher visited each village for two days. On the first day group discussions were conducted with all villagers who were interested. Then the researcher took a random sample of twelve farming households in each village. People from these households were interviewed the next day, when farm observations were also carried out. Fig. 5 (i) Explain why researchers carry out pilot studies before carrying out interviews. … …[1] (ii) The researchers took a ‘random sample of twelve farming households in each village’. Give one advantage and one disadvantage of random sampling. Advantage … … Disadvantage … …[2] (iii) Name and describe two other methods which could have been used to choose the sample of twelve houses in each village. Method 1 … … … … Method 2 … … … …[4]
Question paper, page 7
7 0453/02/O/N/11 © UCLES 2011 [Turn over For Examiner’s Use (iv) Identify two methods of data collection used in this research investigation. For each method suggest why it was used. Method 1 … Why it was used … … … … … Method 2 … Why it was used … … … … …[6] (v) Explain the practical difficulties which the researcher may have experienced when collecting the data for this research investigation. … … … … … … … … … …[5]
Question paper, page 8
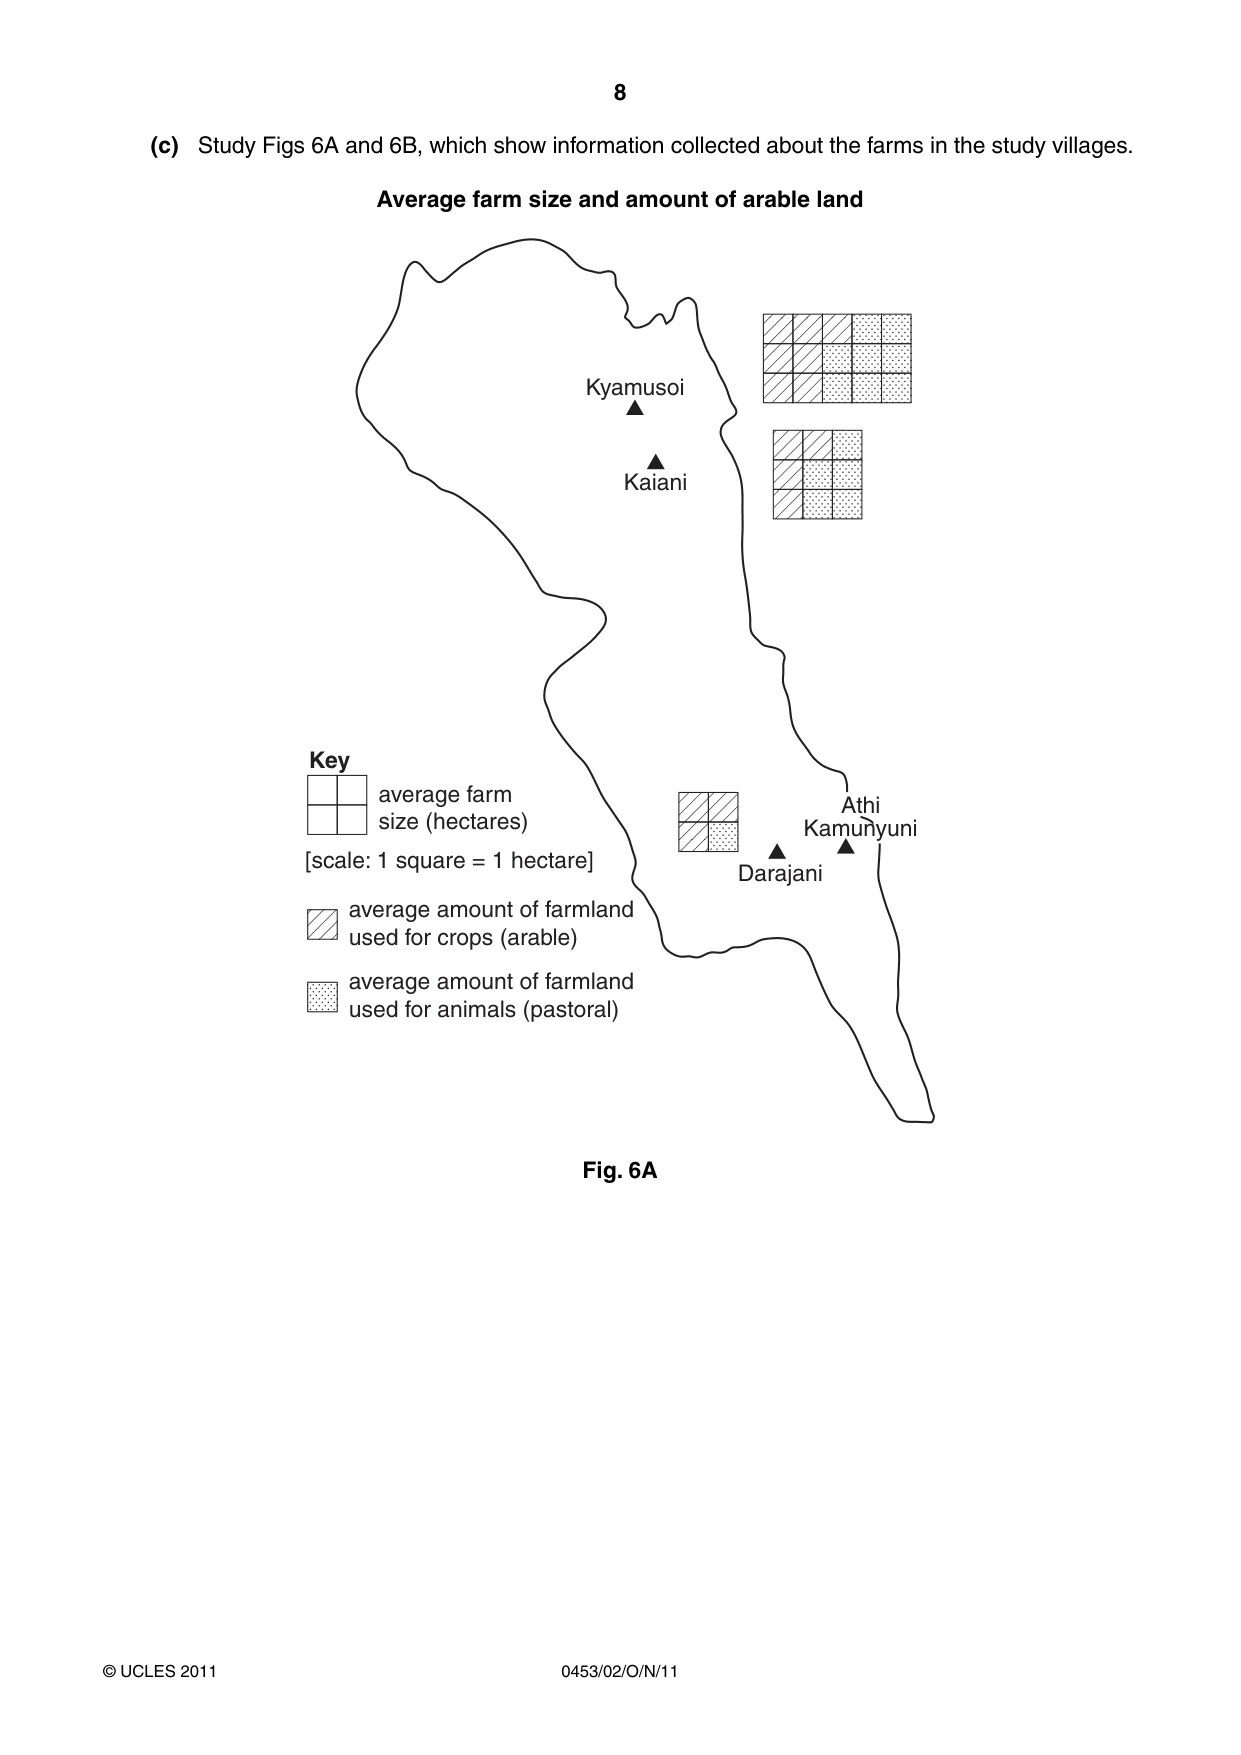
8 0453/02/O/N/11 © UCLES 2011 (c) Study Figs 6A and 6B, which show information collected about the farms in the study villages. Average farm size and amount of arable land Darajani Athi Kamunyuni Kyamusoi Kaiani average farm size (hectares) average amount of farmland used for crops (arable) Key average amount of farmland used for animals (pastoral) [scale: 1 square = 1 hectare] Fig. 6A
Question paper, page 9
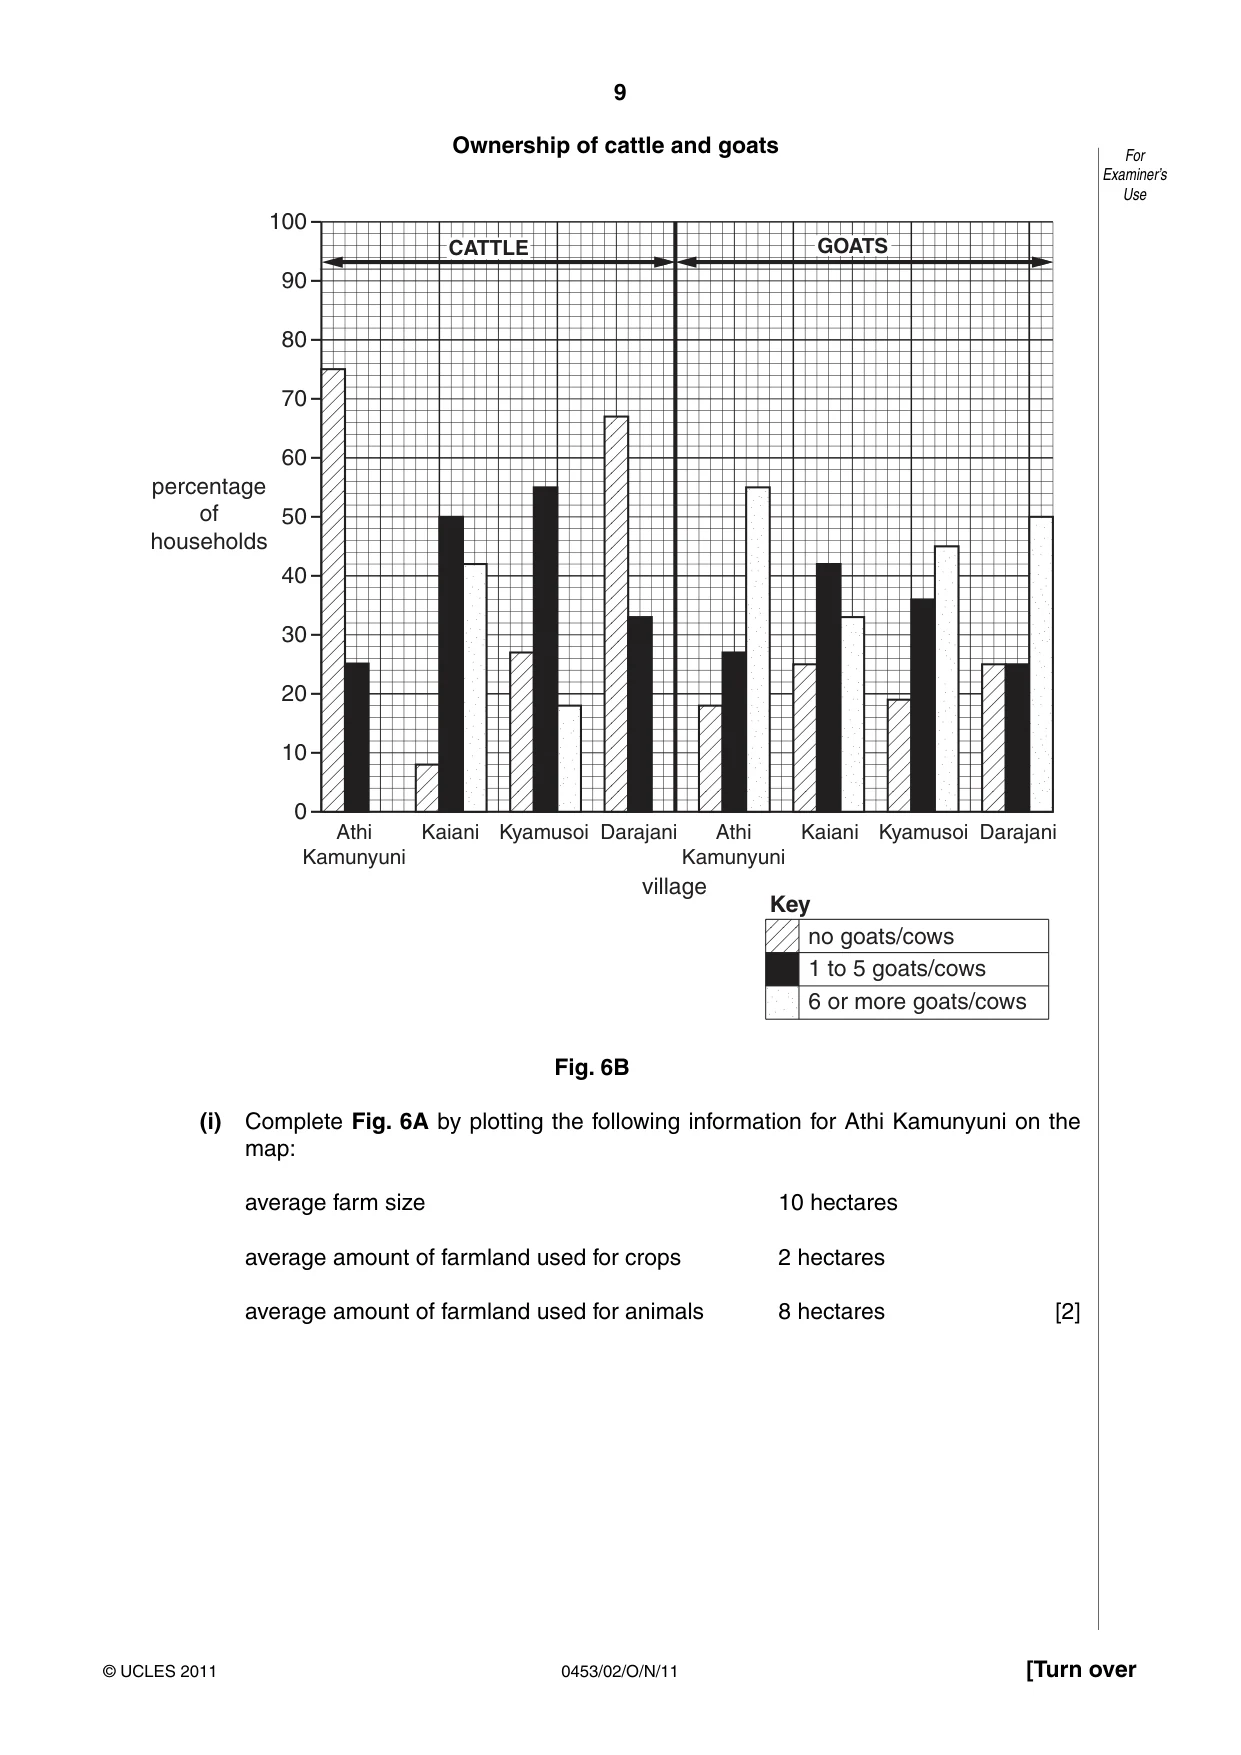
9 0453/02/O/N/11 © UCLES 2011 [Turn over For Examiner’s Use Ownership of cattle and goats 0 10 20 30 40 50 percentage of households village no goats/cows Key 1 to 5 goats/cows 6 or more goats/cows 60 70 80 90 100 Athi Kamunyuni Kaiani Kyamusoi Darajani Athi Kamunyuni Kaiani Kyamusoi Darajani CATTLE GOATS Fig. 6B (i) Complete Fig. 6A by plotting the following information for Athi Kamunyuni on the map: average farm size 10 hectares average amount of farmland used for crops 2 hectares average amount of farmland used for animals 8 hectares [2]
Question paper, page 10
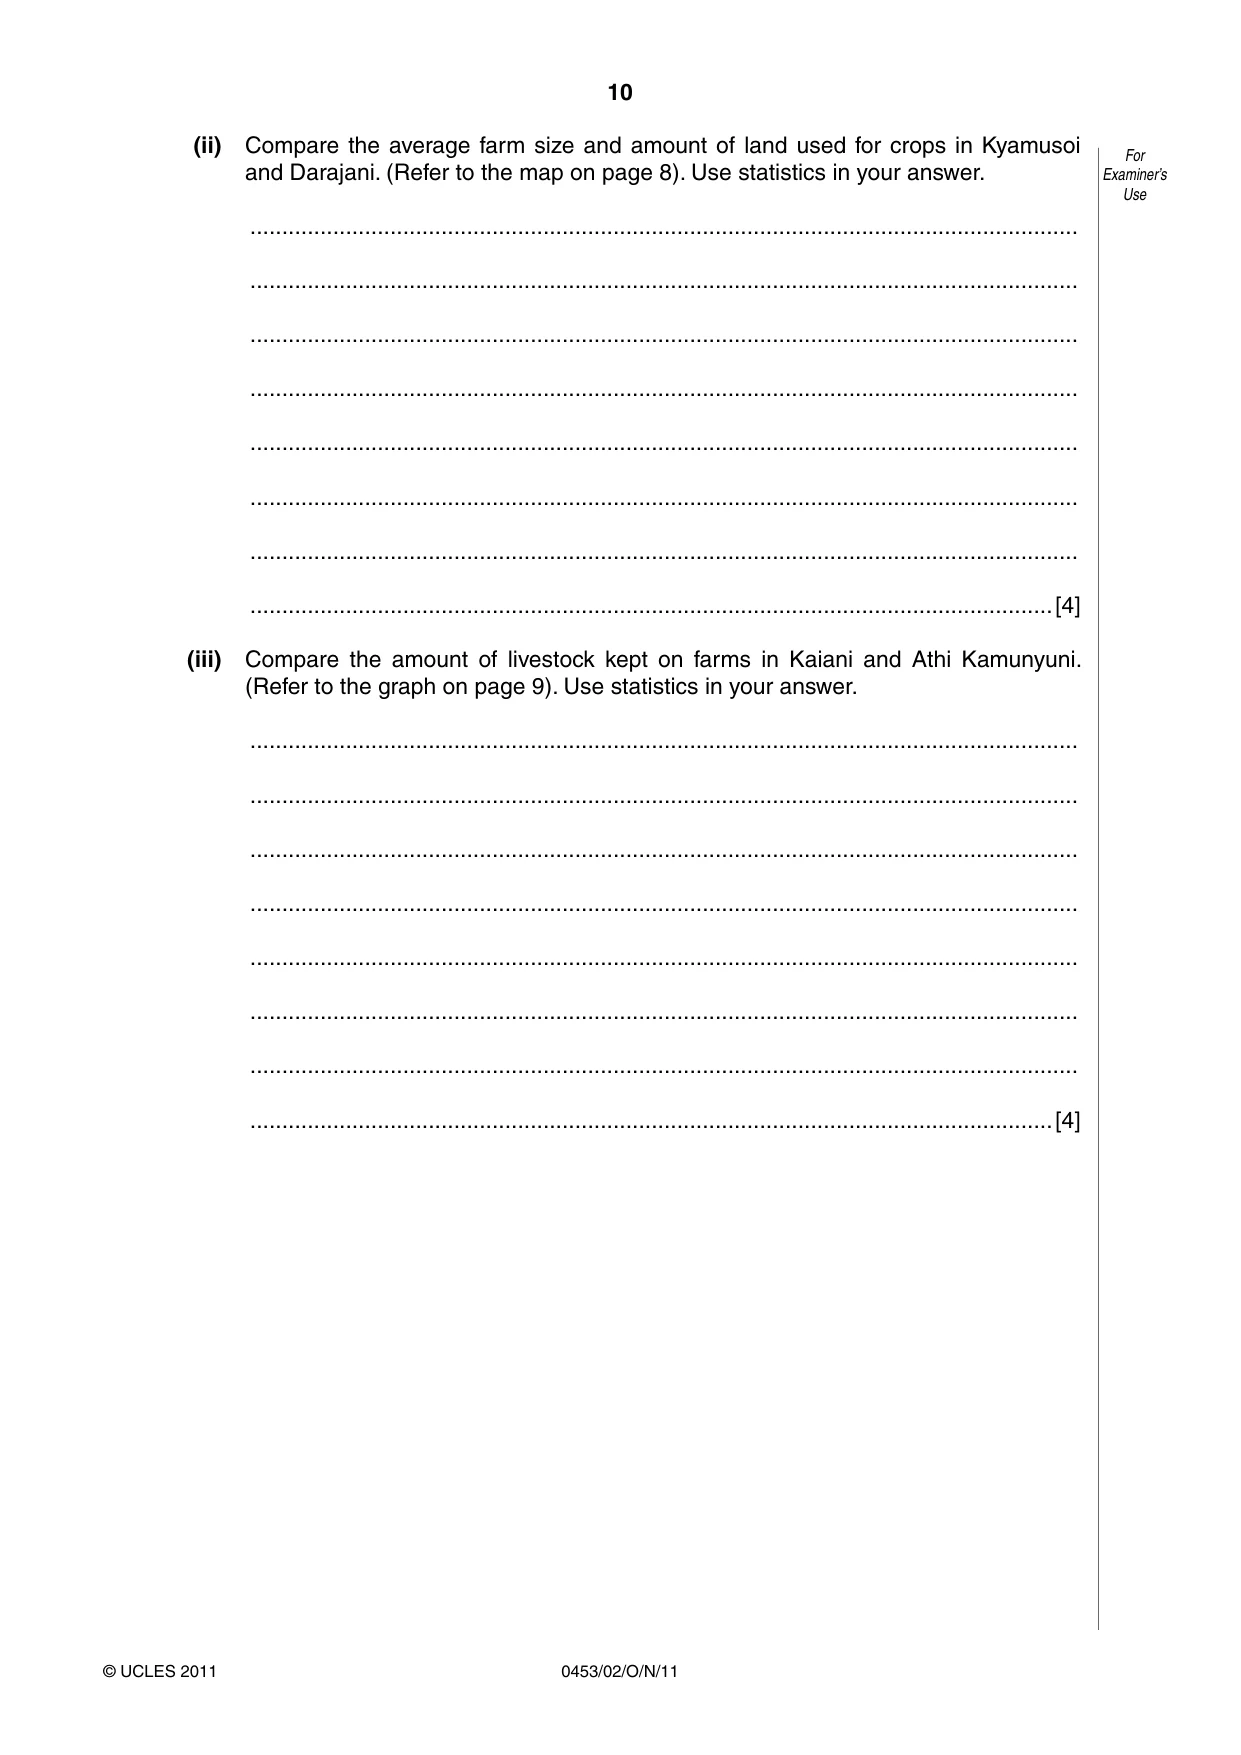
10 0453/02/O/N/11 © UCLES 2011 For Examiner’s Use (ii) Compare the average farm size and amount of land used for crops in Kyamusoi and Darajani. (Refer to the map on page 8). Use statistics in your answer. … … … … … … … …[4] (iii) Compare the amount of livestock kept on farms in Kaiani and Athi Kamunyuni. (Refer to the graph on page 9). Use statistics in your answer. … … … … … … … …[4]
Question paper, page 11
11 0453/02/O/N/11 © UCLES 2011 [Turn over BLANK PAGE QUESTION 2 CONTINUES ON PAGE 12
Question paper, page 12
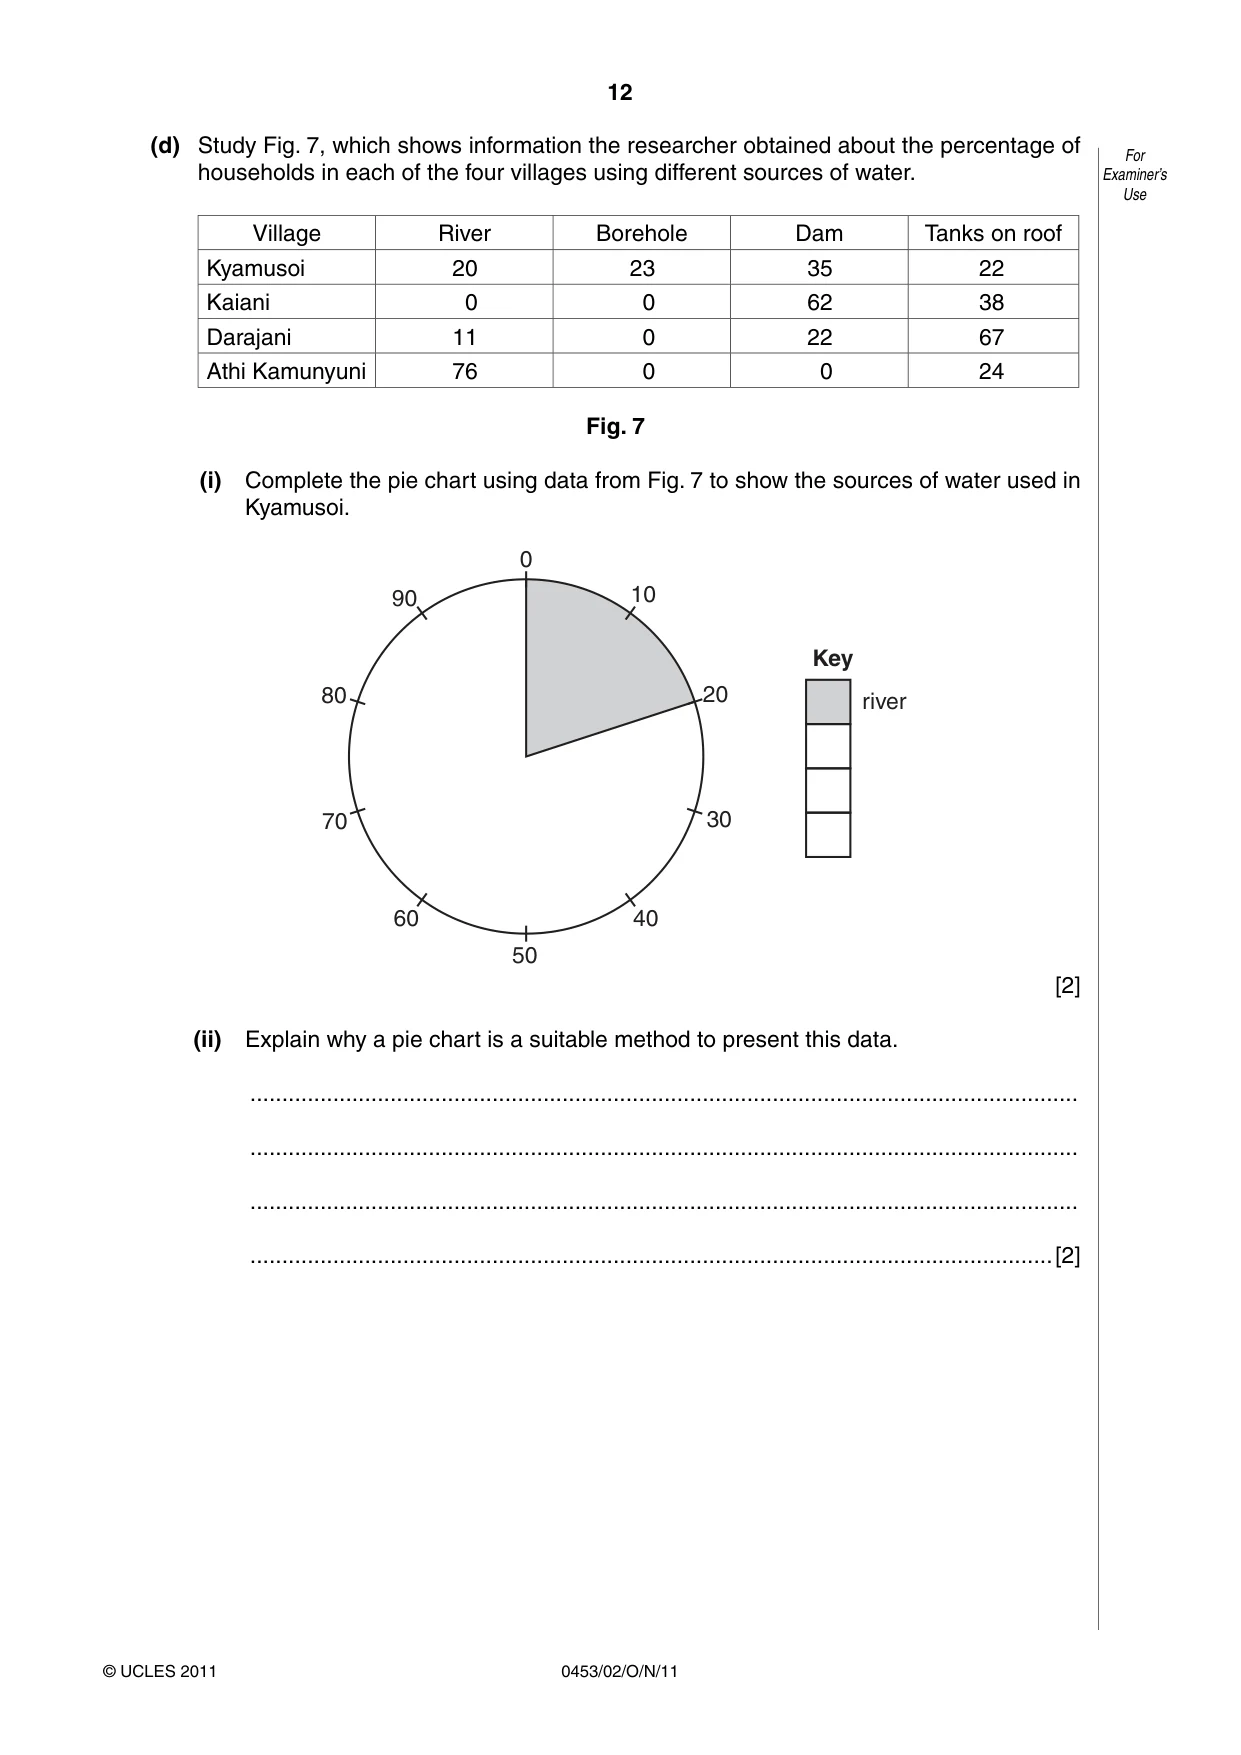
12 0453/02/O/N/11 © UCLES 2011 For Examiner’s Use (d) Study Fig. 7, which shows information the researcher obtained about the percentage of households in each of the four villages using different sources of water. Village River Borehole Dam Tanks on roof Kyamusoi 20 23 35 22 Kaiani 0 0 62 38 Darajani 11 0 22 67 Athi Kamunyuni 76 0 0 24 Fig. 7 (i) Complete the pie chart using data from Fig. 7 to show the sources of water used in Kyamusoi. 0 10 20 river Key 30 40 50 60 70 80 90 [2] (ii) Explain why a pie chart is a suitable method to present this data. … … … …[2]
Question paper, page 13
13 0453/02/O/N/11 © UCLES 2011 [Turn over For Examiner’s Use (iii) Identify and suggest reasons for the differences in the percentage of households using different sources of water in these villages. … … … … … … … … … … … …[6]
Question paper, page 14
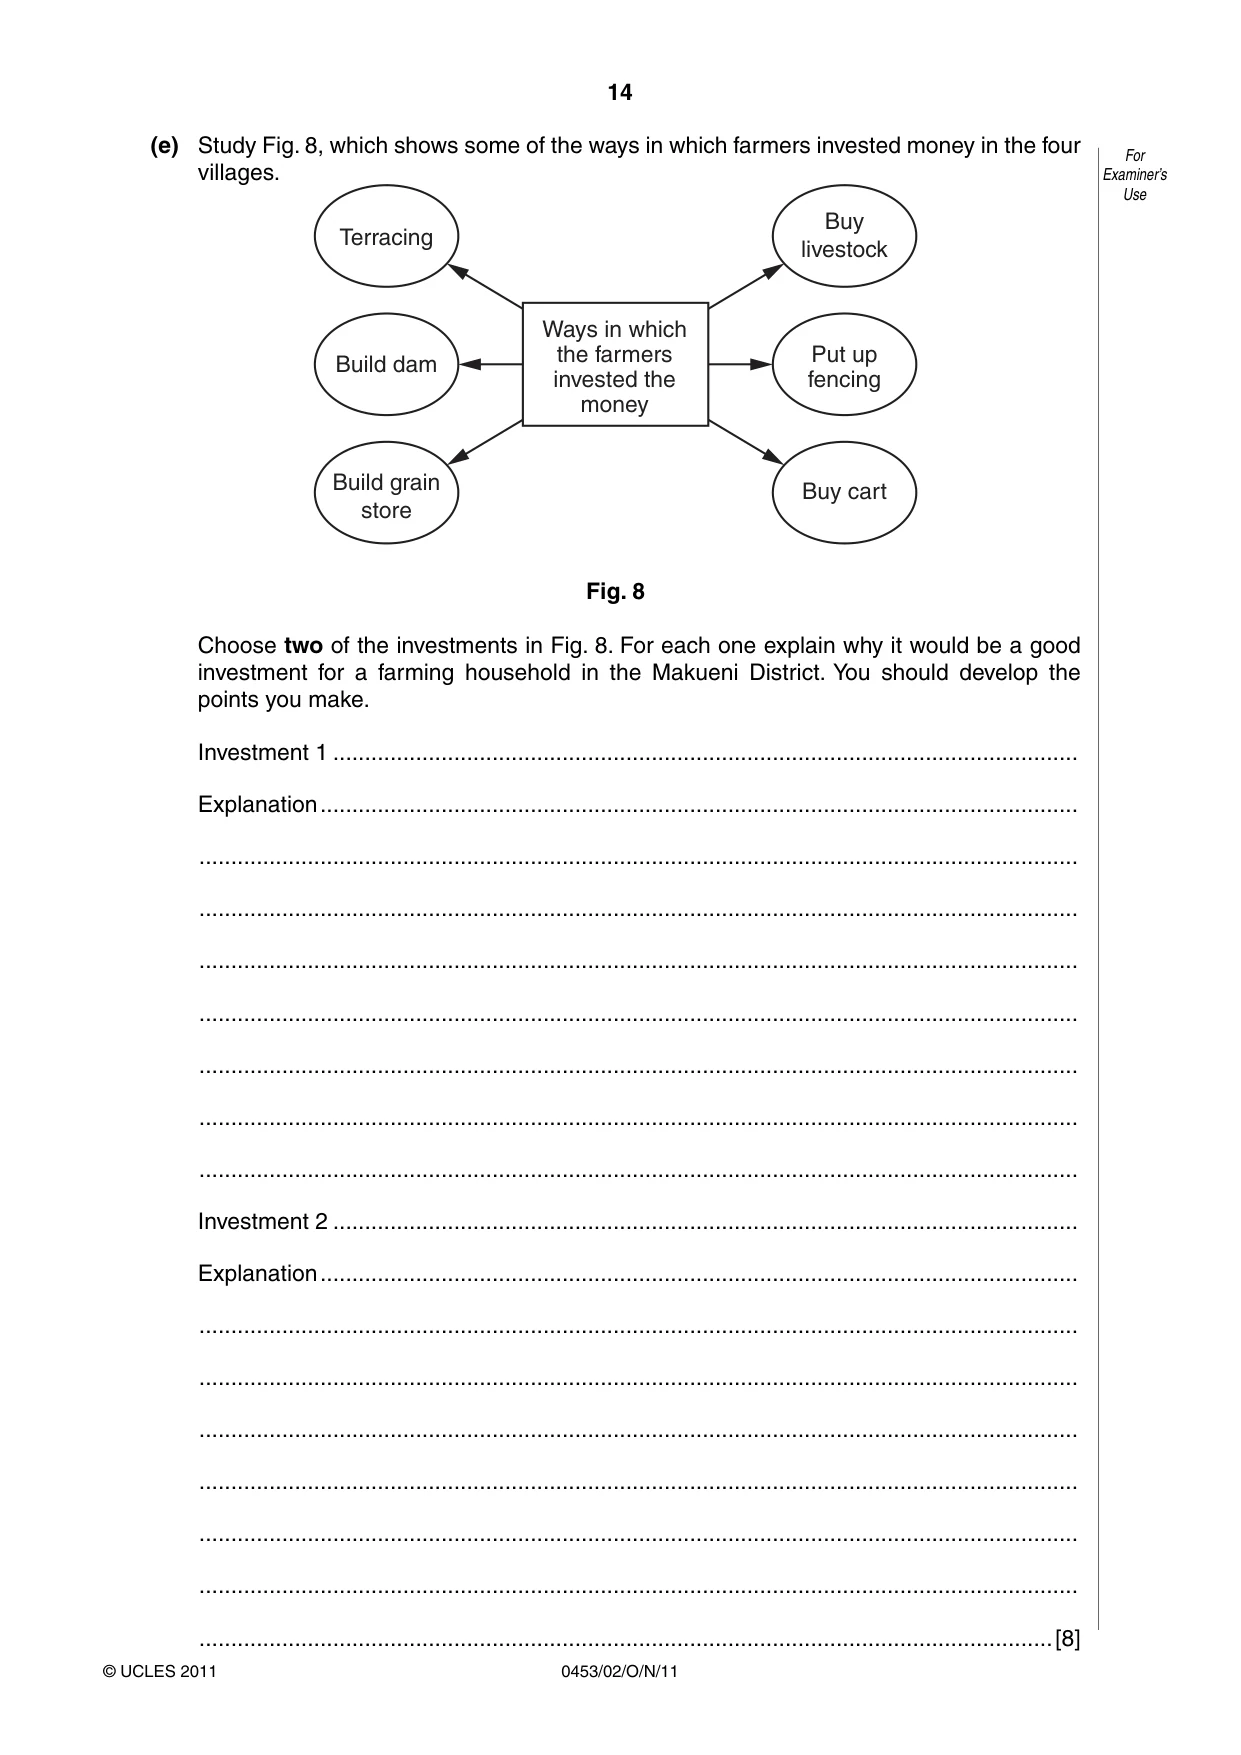
14 0453/02/O/N/11 © UCLES 2011 For Examiner’s Use (e) Study Fig. 8, which shows some of the ways in which farmers invested money in the four villages. Terracing Build dam Build grain store Buy livestock Put up fencing Buy cart Ways in which the farmers invested the money Fig. 8 Choose two of the investments in Fig. 8. For each one explain why it would be a good investment for a farming household in the Makueni District. You should develop the points you make. Investment 1 … Explanation … … … … … … … … Investment 2 … Explanation … … … … … … … …[8]
Question paper, page 15
15 0453/02/O/N/11 © UCLES 2011 For Examiner’s Use (f) Explain and justify methods which could be used by a researcher to find out how successful these investments have been. You should develop the points you make. … … … … … … … … … … … …[6] [Total: 59 marks]
Question paper, page 16
16 0453/02/O/N/11 © UCLES 2011 BLANK PAGE Copyright Acknowledgements: Question 2 © Drylands Research Working Papers; www.drylandsresearch.org.uk. Permission to reproduce items where third-party owned material protected by copyright is included has been sought and cleared where possible. Every reasonable effort has been made by the publisher (UCLES) to trace copyright holders, but if any items requiring clearance have unwittingly been included, the publisher will be pleased to make amends at the earliest possible opportunity. University of Cambridge International Examinations is part of the Cambridge Assessment Group. Cambridge Assessment is the brand name of University of Cambridge Local Examinations Syndicate (UCLES), which is itself a department of the University of Cambridge.
Mark scheme, page 1
UNIVERSITY OF CAMBRIDGE INTERNATIONAL EXAMINATIONS International General Certificate of Secondary Education MARK SCHEME for the October/November 2011 question paper for the guidance of teachers 0453 DEVELOPMENT STUDIES 0453/02 Paper 2, maximum raw mark 80 This mark scheme is published as an aid to teachers and candidates, to indicate the requirements of the examination. It shows the basis on which Examiners were instructed to award marks. It does not indicate the details of the discussions that took place at an Examiners’ meeting before marking began, which would have considered the acceptability of alternative answers. Mark schemes must be read in conjunction with the question papers and the report on the examination. • Cambridge will not enter into discussions or correspondence in connection with these mark schemes. Cambridge is publishing the mark schemes for the October/November 2011 question papers for most IGCSE, GCE Advanced Level and Advanced Subsidiary Level syllabuses and some Ordinary Level syllabuses.
Mark scheme, page 2
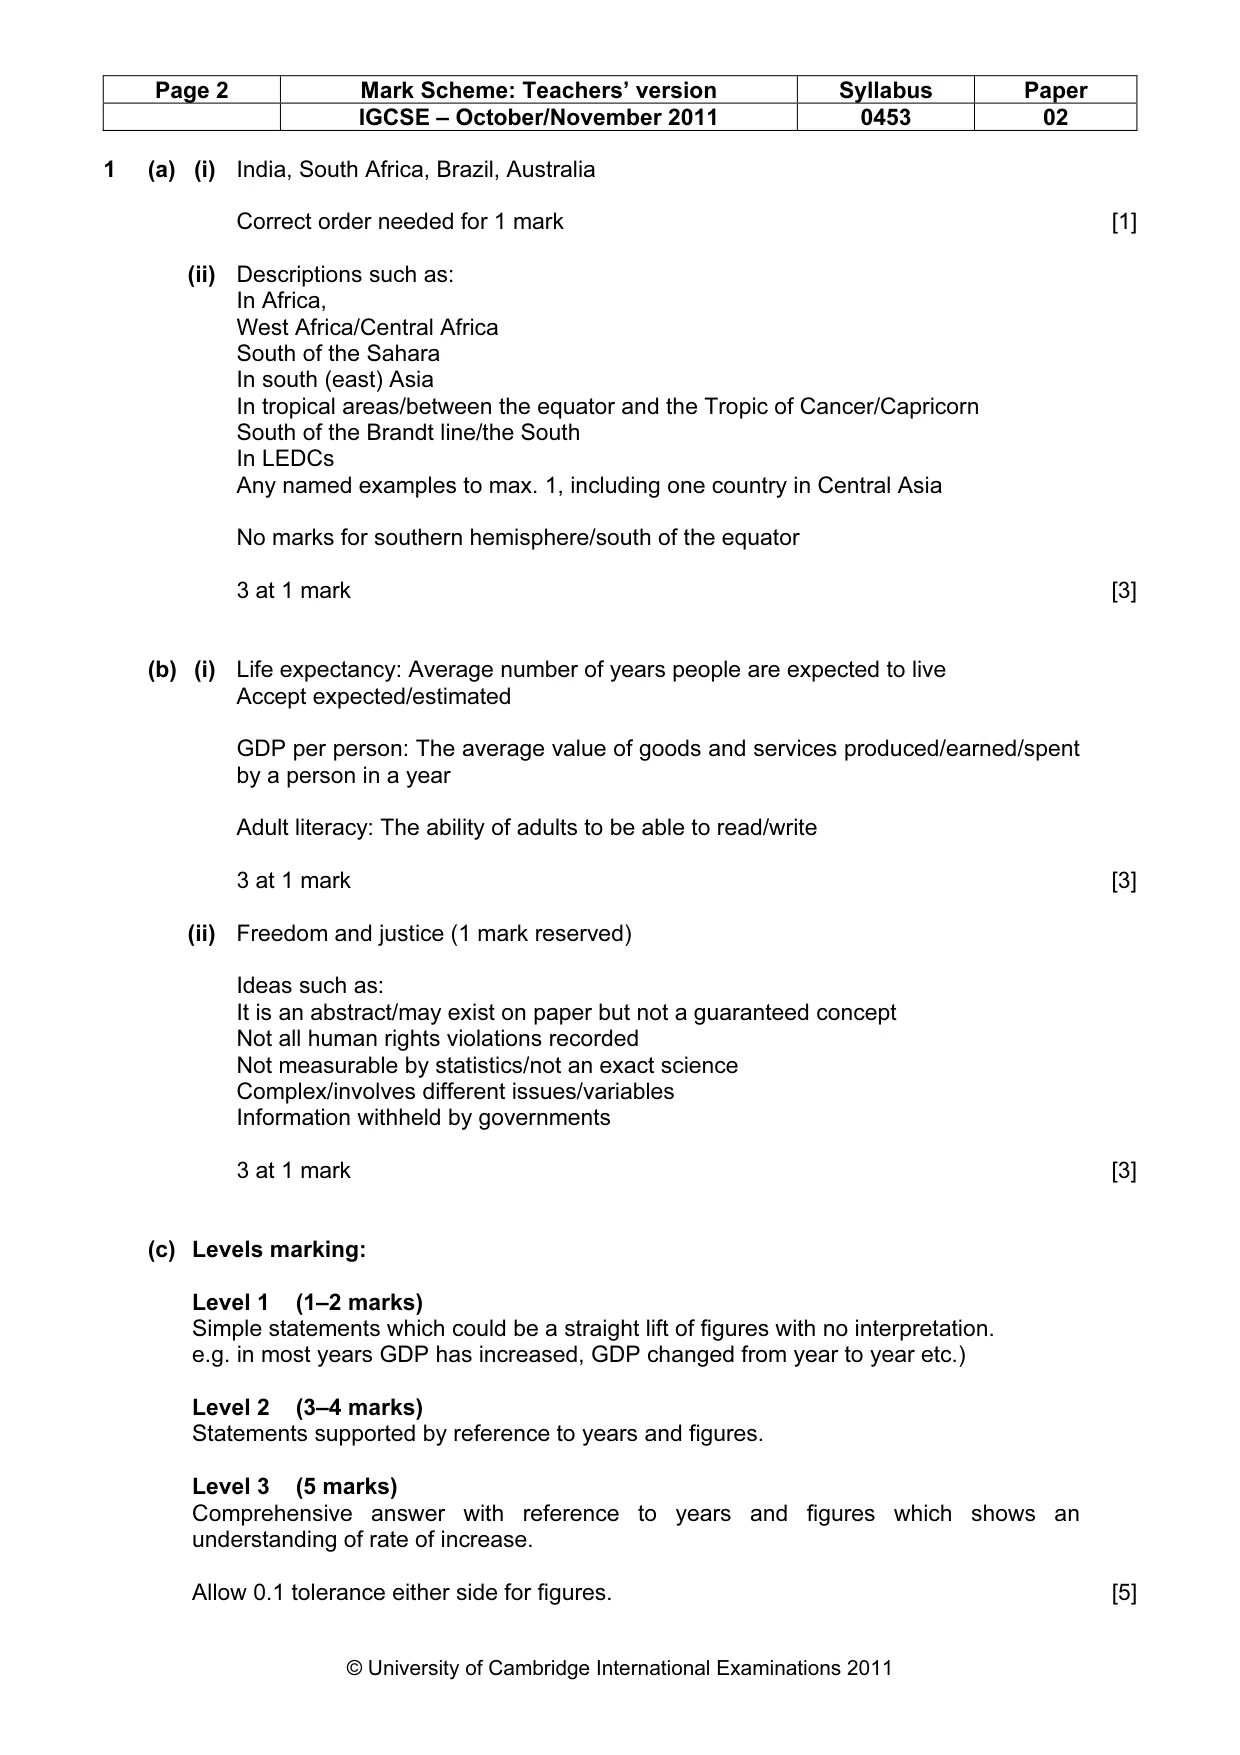
Page 2 Mark Scheme: Teachers’ version Syllabus Paper IGCSE – October/November 2011 0453 02 © University of Cambridge International Examinations 2011 1 (a) (i) India, South Africa, Brazil, Australia Correct order needed for 1 mark [1] (ii) Descriptions such as: In Africa, West Africa/Central Africa South of the Sahara In south (east) Asia In tropical areas/between the equator and the Tropic of Cancer/Capricorn South of the Brandt line/the South In LEDCs Any named examples to max. 1, including one country in Central Asia No marks for southern hemisphere/south of the equator 3 at 1 mark [3] (b) (i) Life expectancy: Average number of years people are expected to live Accept expected/estimated GDP per person: The average value of goods and services produced/earned/spent by a person in a year Adult literacy: The ability of adults to be able to read/write 3 at 1 mark [3] (ii) Freedom and justice (1 mark reserved) Ideas such as: It is an abstract/may exist on paper but not a guaranteed concept Not all human rights violations recorded Not measurable by statistics/not an exact science Complex/involves different issues/variables Information withheld by governments 3 at 1 mark [3] (c) Levels marking: Level 1 (1–2 marks) Simple statements which could be a straight lift of figures with no interpretation. e.g. in most years GDP has increased, GDP changed from year to year etc.) Level 2 (3–4 marks) Statements supported by reference to years and figures. Level 3 (5 marks) Comprehensive answer with reference to years and figures which shows an understanding of rate of increase. Allow 0.1 tolerance either side for figures. [5]
Mark scheme, page 3
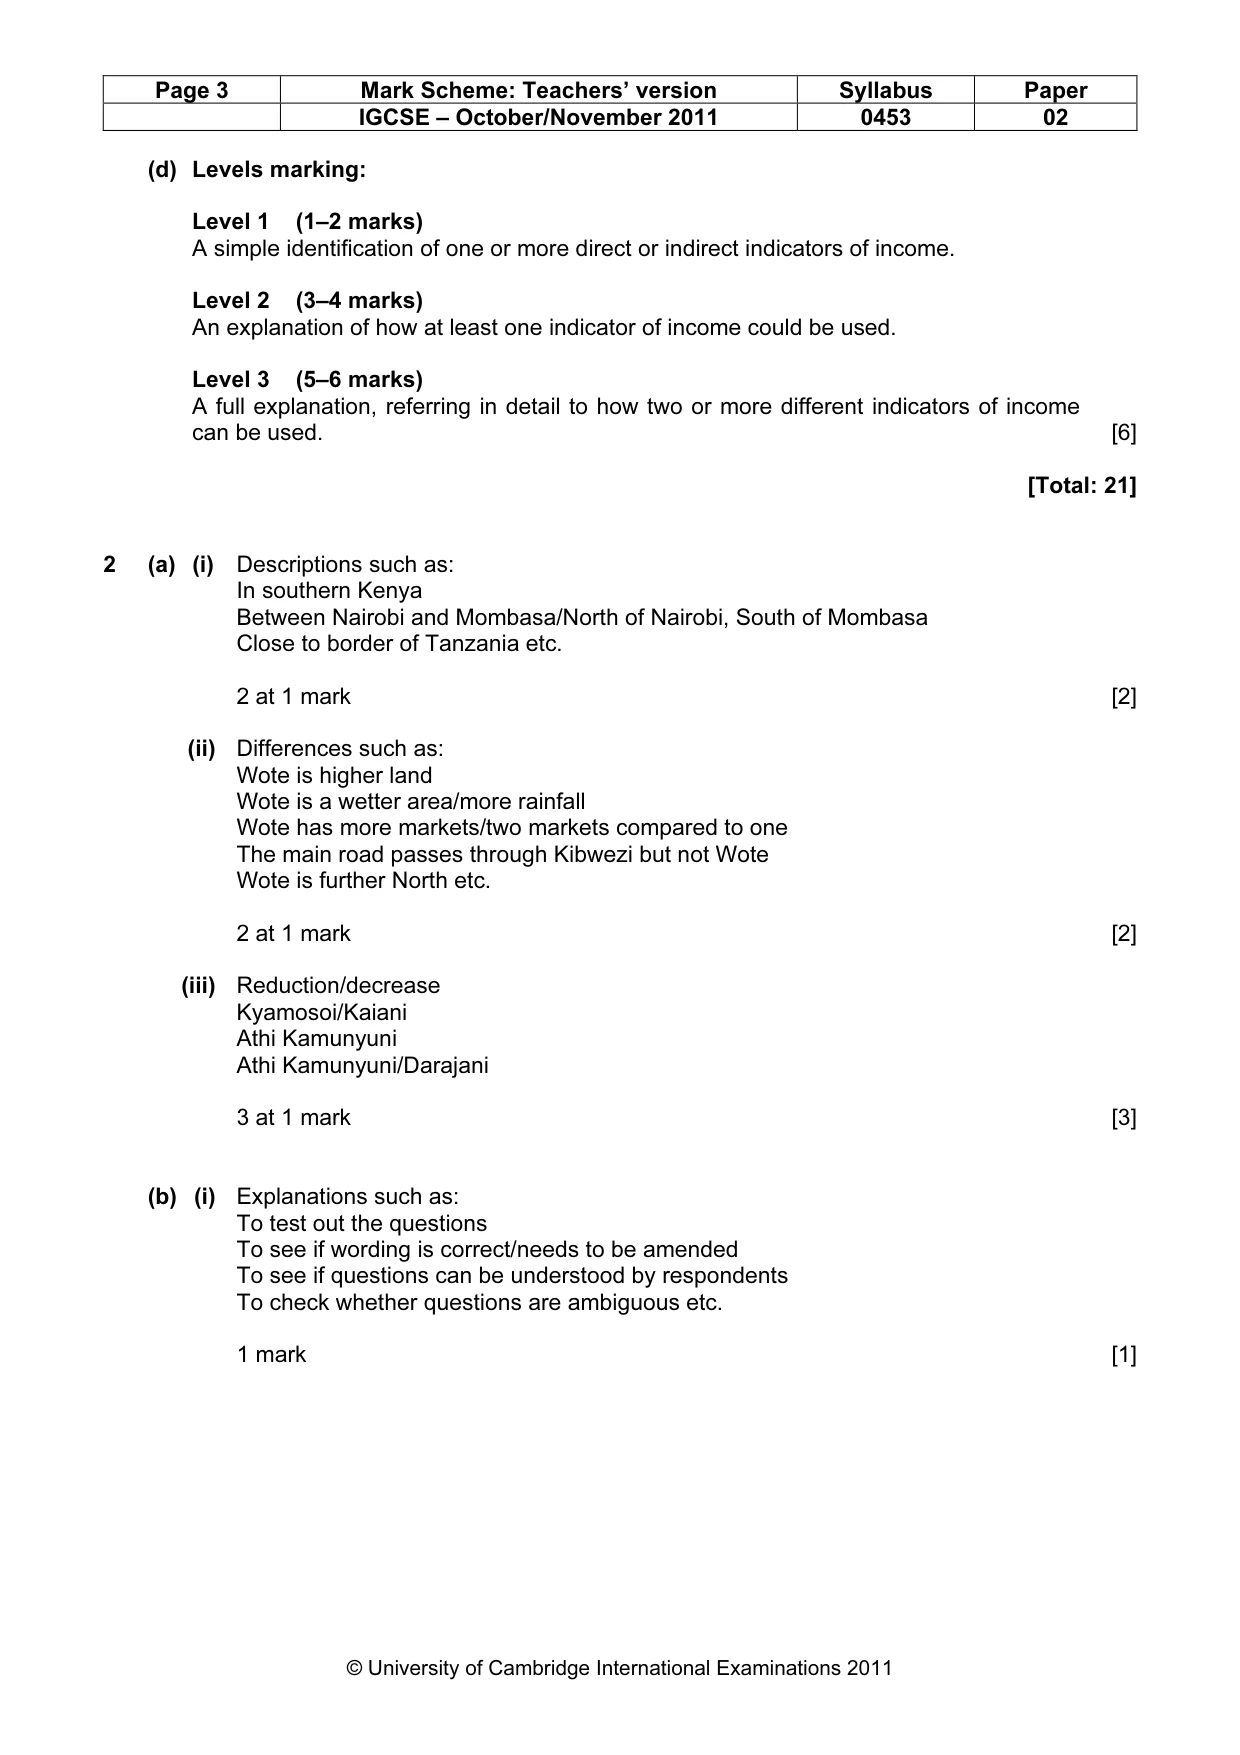
Page 3 Mark Scheme: Teachers’ version Syllabus Paper IGCSE – October/November 2011 0453 02 © University of Cambridge International Examinations 2011 (d) Levels marking: Level 1 (1–2 marks) A simple identification of one or more direct or indirect indicators of income. Level 2 (3–4 marks) An explanation of how at least one indicator of income could be used. Level 3 (5–6 marks) A full explanation, referring in detail to how two or more different indicators of income can be used. [6] [Total: 21] 2 (a) (i) Descriptions such as: In southern Kenya Between Nairobi and Mombasa/North of Nairobi, South of Mombasa Close to border of Tanzania etc. 2 at 1 mark [2] (ii) Differences such as: Wote is higher land Wote is a wetter area/more rainfall Wote has more markets/two markets compared to one The main road passes through Kibwezi but not Wote Wote is further North etc. 2 at 1 mark [2] (iii) Reduction/decrease Kyamosoi/Kaiani Athi Kamunyuni Athi Kamunyuni/Darajani 3 at 1 mark [3] (b) (i) Explanations such as: To test out the questions To see if wording is correct/needs to be amended To see if questions can be understood by respondents To check whether questions are ambiguous etc. 1 mark [1]
Mark scheme, page 4
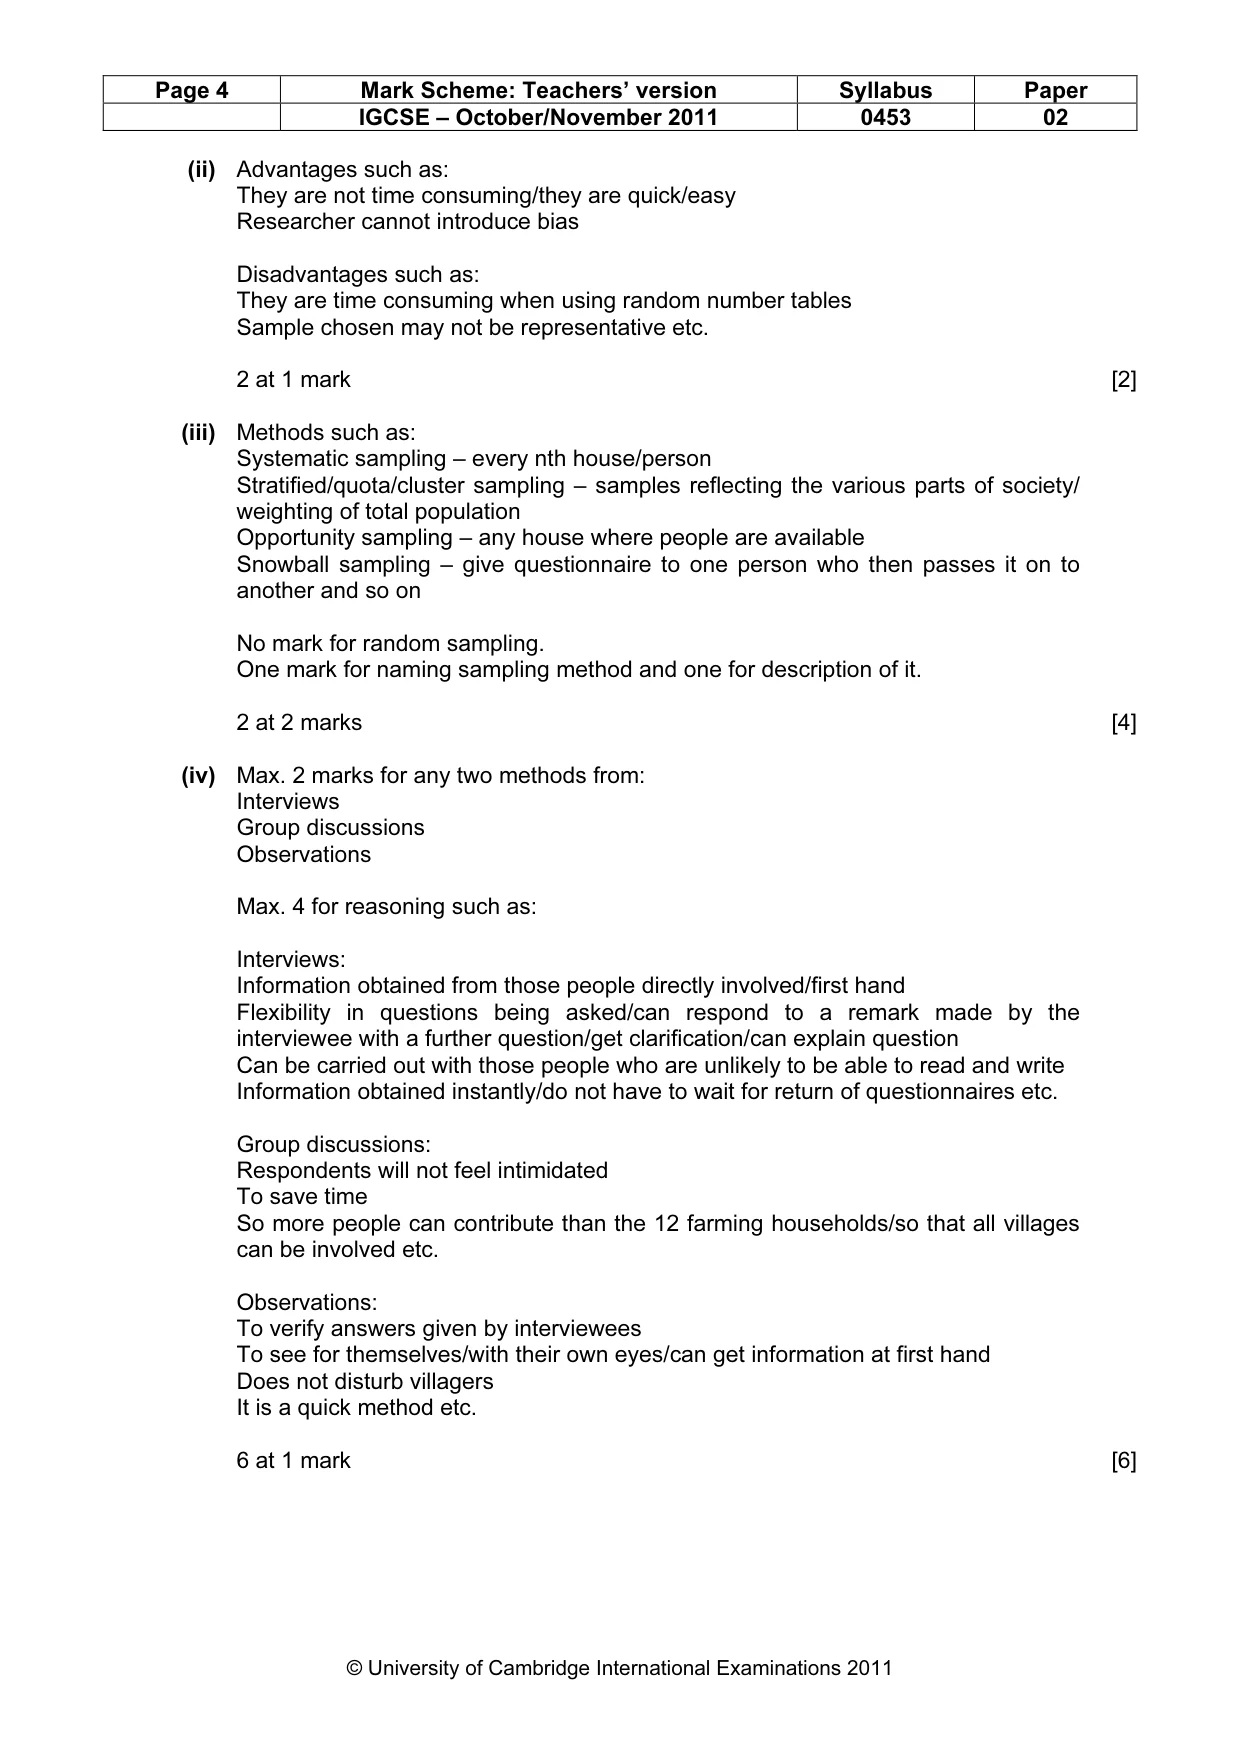
Page 4 Mark Scheme: Teachers’ version Syllabus Paper IGCSE – October/November 2011 0453 02 © University of Cambridge International Examinations 2011 (ii) Advantages such as: They are not time consuming/they are quick/easy Researcher cannot introduce bias Disadvantages such as: They are time consuming when using random number tables Sample chosen may not be representative etc. 2 at 1 mark [2] (iii) Methods such as: Systematic sampling – every nth house/person Stratified/quota/cluster sampling – samples reflecting the various parts of society/ weighting of total population Opportunity sampling – any house where people are available Snowball sampling – give questionnaire to one person who then passes it on to another and so on No mark for random sampling. One mark for naming sampling method and one for description of it. 2 at 2 marks [4] (iv) Max. 2 marks for any two methods from: Interviews Group discussions Observations Max. 4 for reasoning such as: Interviews: Information obtained from those people directly involved/first hand Flexibility in questions being asked/can respond to a remark made by the interviewee with a further question/get clarification/can explain question Can be carried out with those people who are unlikely to be able to read and write Information obtained instantly/do not have to wait for return of questionnaires etc. Group discussions: Respondents will not feel intimidated To save time So more people can contribute than the 12 farming households/so that all villages can be involved etc. Observations: To verify answers given by interviewees To see for themselves/with their own eyes/can get information at first hand Does not disturb villagers It is a quick method etc. 6 at 1 mark [6]
Mark scheme, page 5
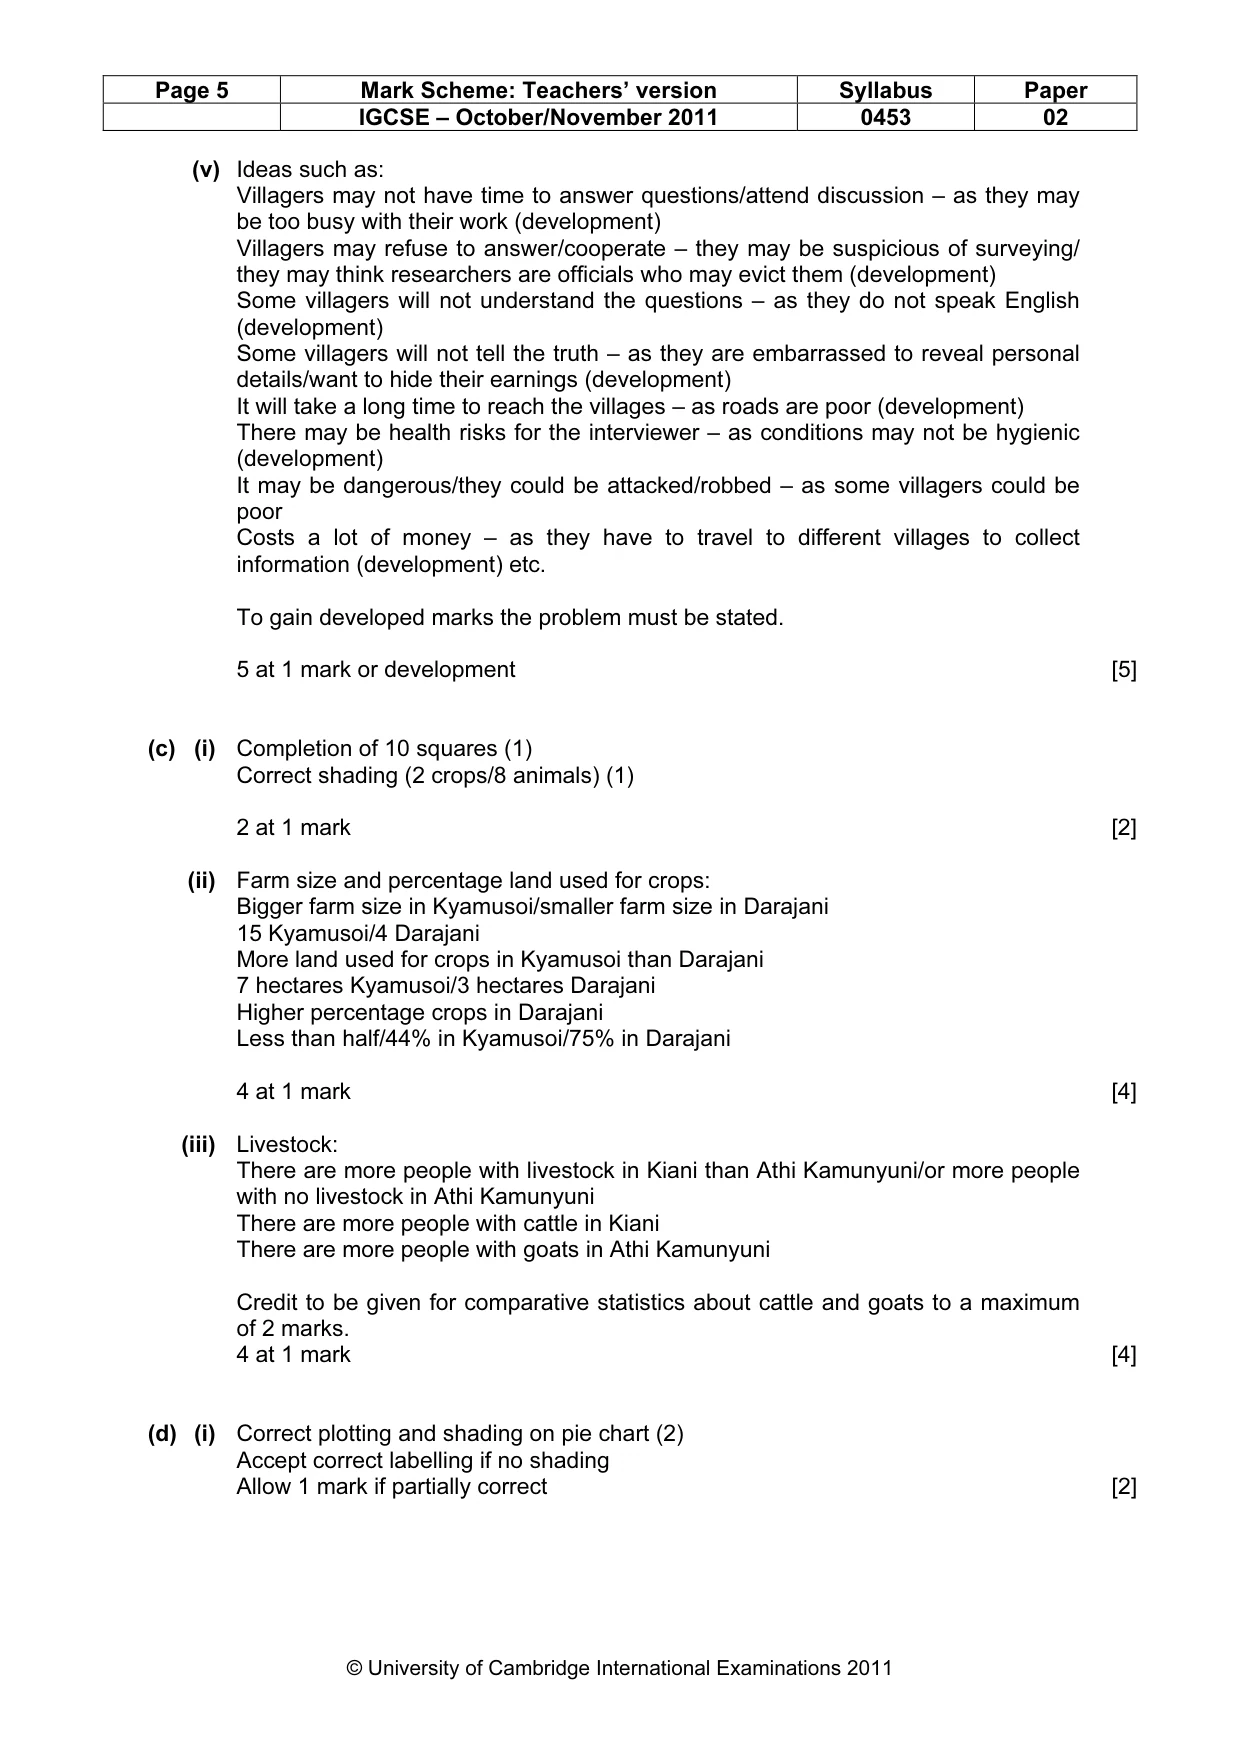
Page 5 Mark Scheme: Teachers’ version Syllabus Paper IGCSE – October/November 2011 0453 02 © University of Cambridge International Examinations 2011 (v) Ideas such as: Villagers may not have time to answer questions/attend discussion – as they may be too busy with their work (development) Villagers may refuse to answer/cooperate – they may be suspicious of surveying/ they may think researchers are officials who may evict them (development) Some villagers will not understand the questions – as they do not speak English (development) Some villagers will not tell the truth – as they are embarrassed to reveal personal details/want to hide their earnings (development) It will take a long time to reach the villages – as roads are poor (development) There may be health risks for the interviewer – as conditions may not be hygienic (development) It may be dangerous/they could be attacked/robbed – as some villagers could be poor Costs a lot of money – as they have to travel to different villages to collect information (development) etc. To gain developed marks the problem must be stated. 5 at 1 mark or development [5] (c) (i) Completion of 10 squares (1) Correct shading (2 crops/8 animals) (1) 2 at 1 mark [2] (ii) Farm size and percentage land used for crops: Bigger farm size in Kyamusoi/smaller farm size in Darajani 15 Kyamusoi/4 Darajani More land used for crops in Kyamusoi than Darajani 7 hectares Kyamusoi/3 hectares Darajani Higher percentage crops in Darajani Less than half/44% in Kyamusoi/75% in Darajani 4 at 1 mark [4] (iii) Livestock: There are more people with livestock in Kiani than Athi Kamunyuni/or more people with no livestock in Athi Kamunyuni There are more people with cattle in Kiani There are more people with goats in Athi Kamunyuni Credit to be given for comparative statistics about cattle and goats to a maximum of 2 marks. 4 at 1 mark [4] (d) (i) Correct plotting and shading on pie chart (2) Accept correct labelling if no shading Allow 1 mark if partially correct [2]
Mark scheme, page 6
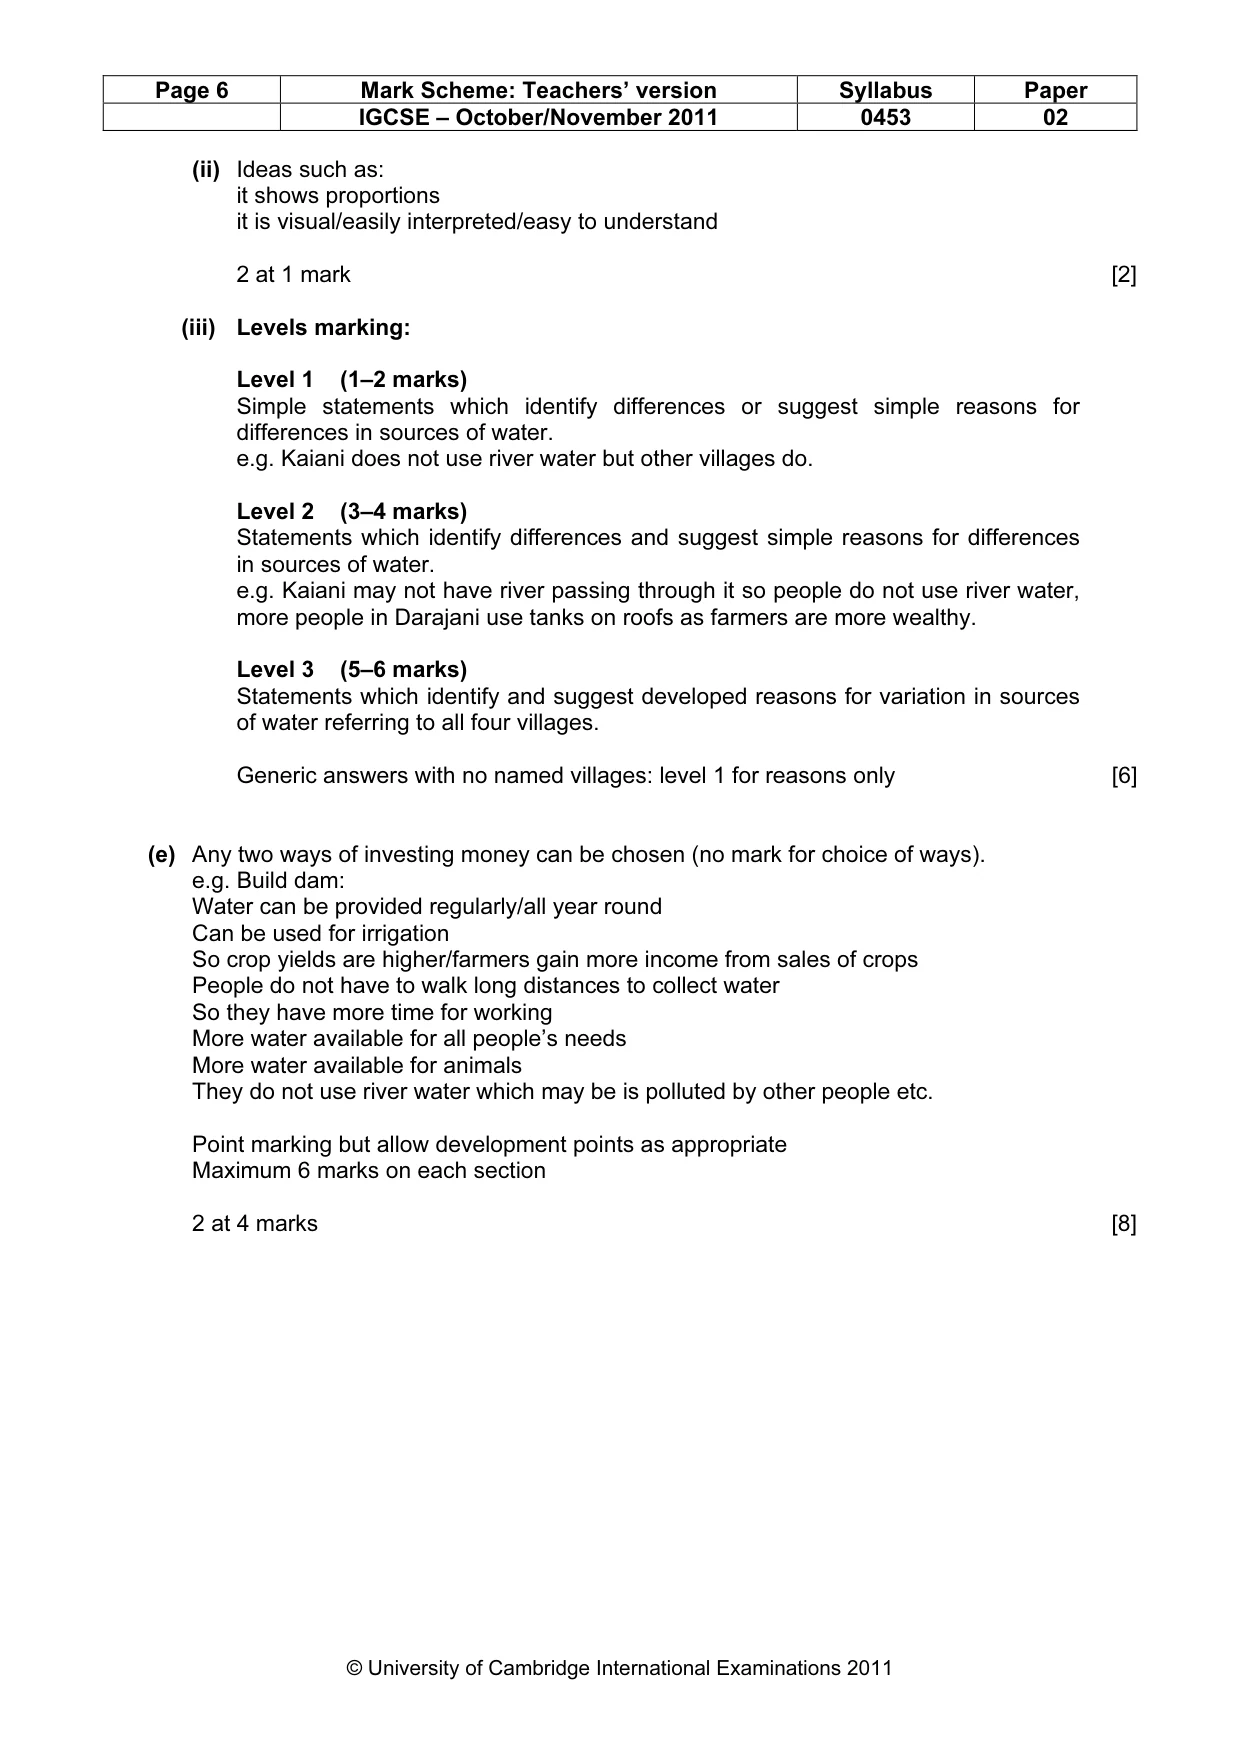
Page 6 Mark Scheme: Teachers’ version Syllabus Paper IGCSE – October/November 2011 0453 02 © University of Cambridge International Examinations 2011 (ii) Ideas such as: it shows proportions it is visual/easily interpreted/easy to understand 2 at 1 mark [2] (iii) Levels marking: Level 1 (1–2 marks) Simple statements which identify differences or suggest simple reasons for differences in sources of water. e.g. Kaiani does not use river water but other villages do. Level 2 (3–4 marks) Statements which identify differences and suggest simple reasons for differences in sources of water. e.g. Kaiani may not have river passing through it so people do not use river water, more people in Darajani use tanks on roofs as farmers are more wealthy. Level 3 (5–6 marks) Statements which identify and suggest developed reasons for variation in sources of water referring to all four villages. Generic answers with no named villages: level 1 for reasons only [6] (e) Any two ways of investing money can be chosen (no mark for choice of ways). e.g. Build dam: Water can be provided regularly/all year round Can be used for irrigation So crop yields are higher/farmers gain more income from sales of crops People do not have to walk long distances to collect water So they have more time for working More water available for all people’s needs More water available for animals They do not use river water which may be is polluted by other people etc. Point marking but allow development points as appropriate Maximum 6 marks on each section 2 at 4 marks [8]
Mark scheme, page 7
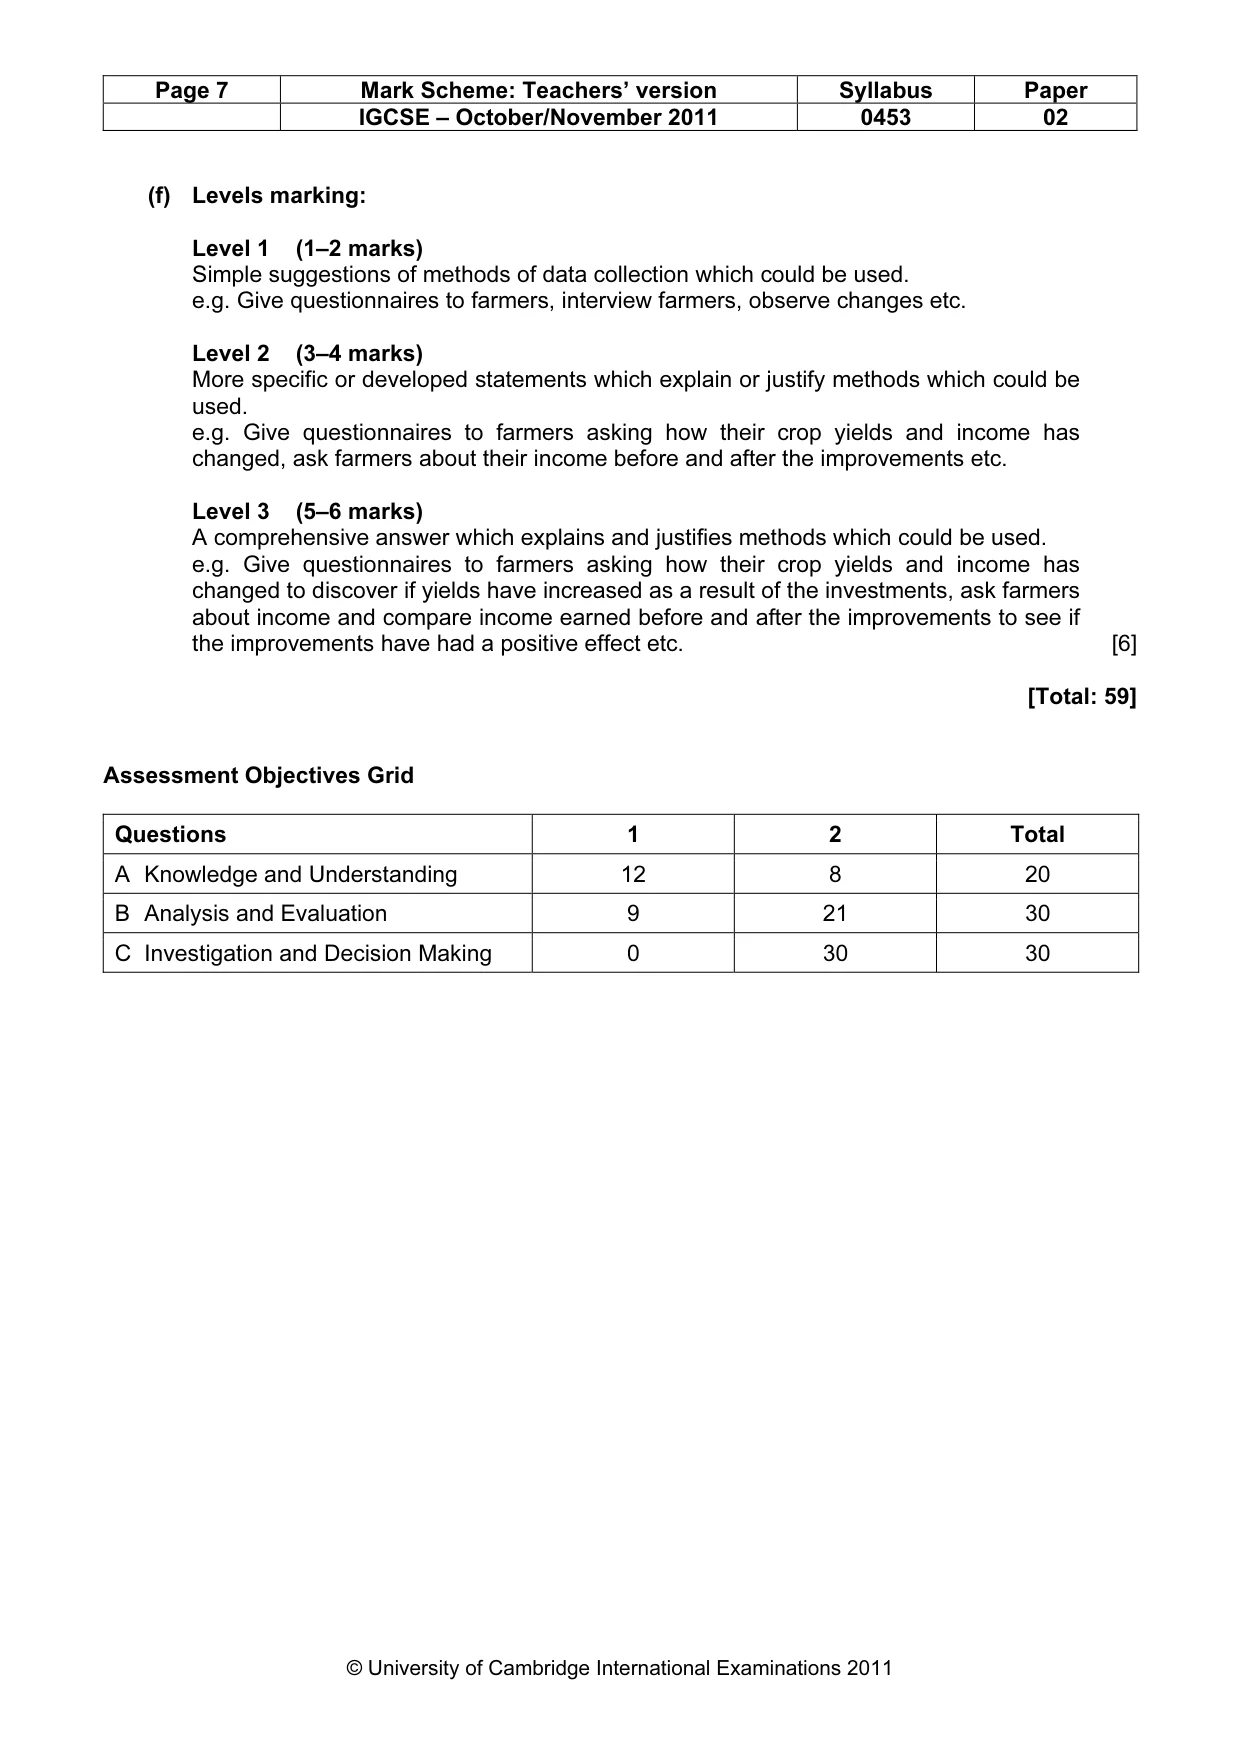
Page 7 Mark Scheme: Teachers’ version Syllabus Paper IGCSE – October/November 2011 0453 02 © University of Cambridge International Examinations 2011 (f) Levels marking: Level 1 (1–2 marks) Simple suggestions of methods of data collection which could be used. e.g. Give questionnaires to farmers, interview farmers, observe changes etc. Level 2 (3–4 marks) More specific or developed statements which explain or justify methods which could be used. e.g. Give questionnaires to farmers asking how their crop yields and income has changed, ask farmers about their income before and after the improvements etc. Level 3 (5–6 marks) A comprehensive answer which explains and justifies methods which could be used. e.g. Give questionnaires to farmers asking how their crop yields and income has changed to discover if yields have increased as a result of the investments, ask farmers about income and compare income earned before and after the improvements to see if the improvements have had a positive effect etc. [6] [Total: 59] Assessment Objectives Grid Questions 1 2 Total A Knowledge and Understanding 12 8 20 B Analysis and Evaluation 9 21 30 C Investigation and Decision Making 0 30 30
What you needed in this session
Cambridge’s own grade thresholds for 2011 Oct/Nov, Paper 2 · Variant 1. A higher threshold means an easier paper — the bar moves with how the cohort did.