Cambridge IGCSE Development Studies 0453 — 2009 Oct/Nov Paper 2 · Variant 1
0453/21/O/N/09 · 80 marks · ≈90 min
The question paper and its mark scheme, free to read here and free to download. This is Cambridge’s own paper, exactly as it was sat.
Question paper12 pages

Mark scheme7 pages
Answers below. Sit the paper first if you are practising.
Paper as text
Question paper, page 1
This document consists of 11 printed pages, 1 blank page and 1 Insert. SP (SM/CGW) T64771/3 © UCLES 2009 [Turn over UNIVERSITY OF CAMBRIDGE INTERNATIONAL EXAMINATIONS International General Certificate of Secondary Education READ THESE INSTRUCTIONS FIRST If you have been given an Answer Booklet, follow the instructions on the front cover of the Booklet. Write your Centre number, candidate number and name on all the work you hand in. Write in dark blue or black pen. You may use a soft pencil for any diagrams, graphs or rough working. Do not use staples, paper clips, highlighters, glue or correction fluid. Answer all the questions. You should read and study the sources before answering the questions. The Insert contains Photographs A and B for Question 1. At the end of the examination, fasten all your work securely together. The number of marks is given in brackets [ ] at the end of each question or part question. * 9 2 3 5 9 0 1 8 0 6 * DEVELOPMENT STUDIES 0453/02 Paper 2 October/November 2009 2 hours Additional Materials: Answer Booklet/Paper Graph paper Ruler www.XtremePapers.com
Question paper, page 2
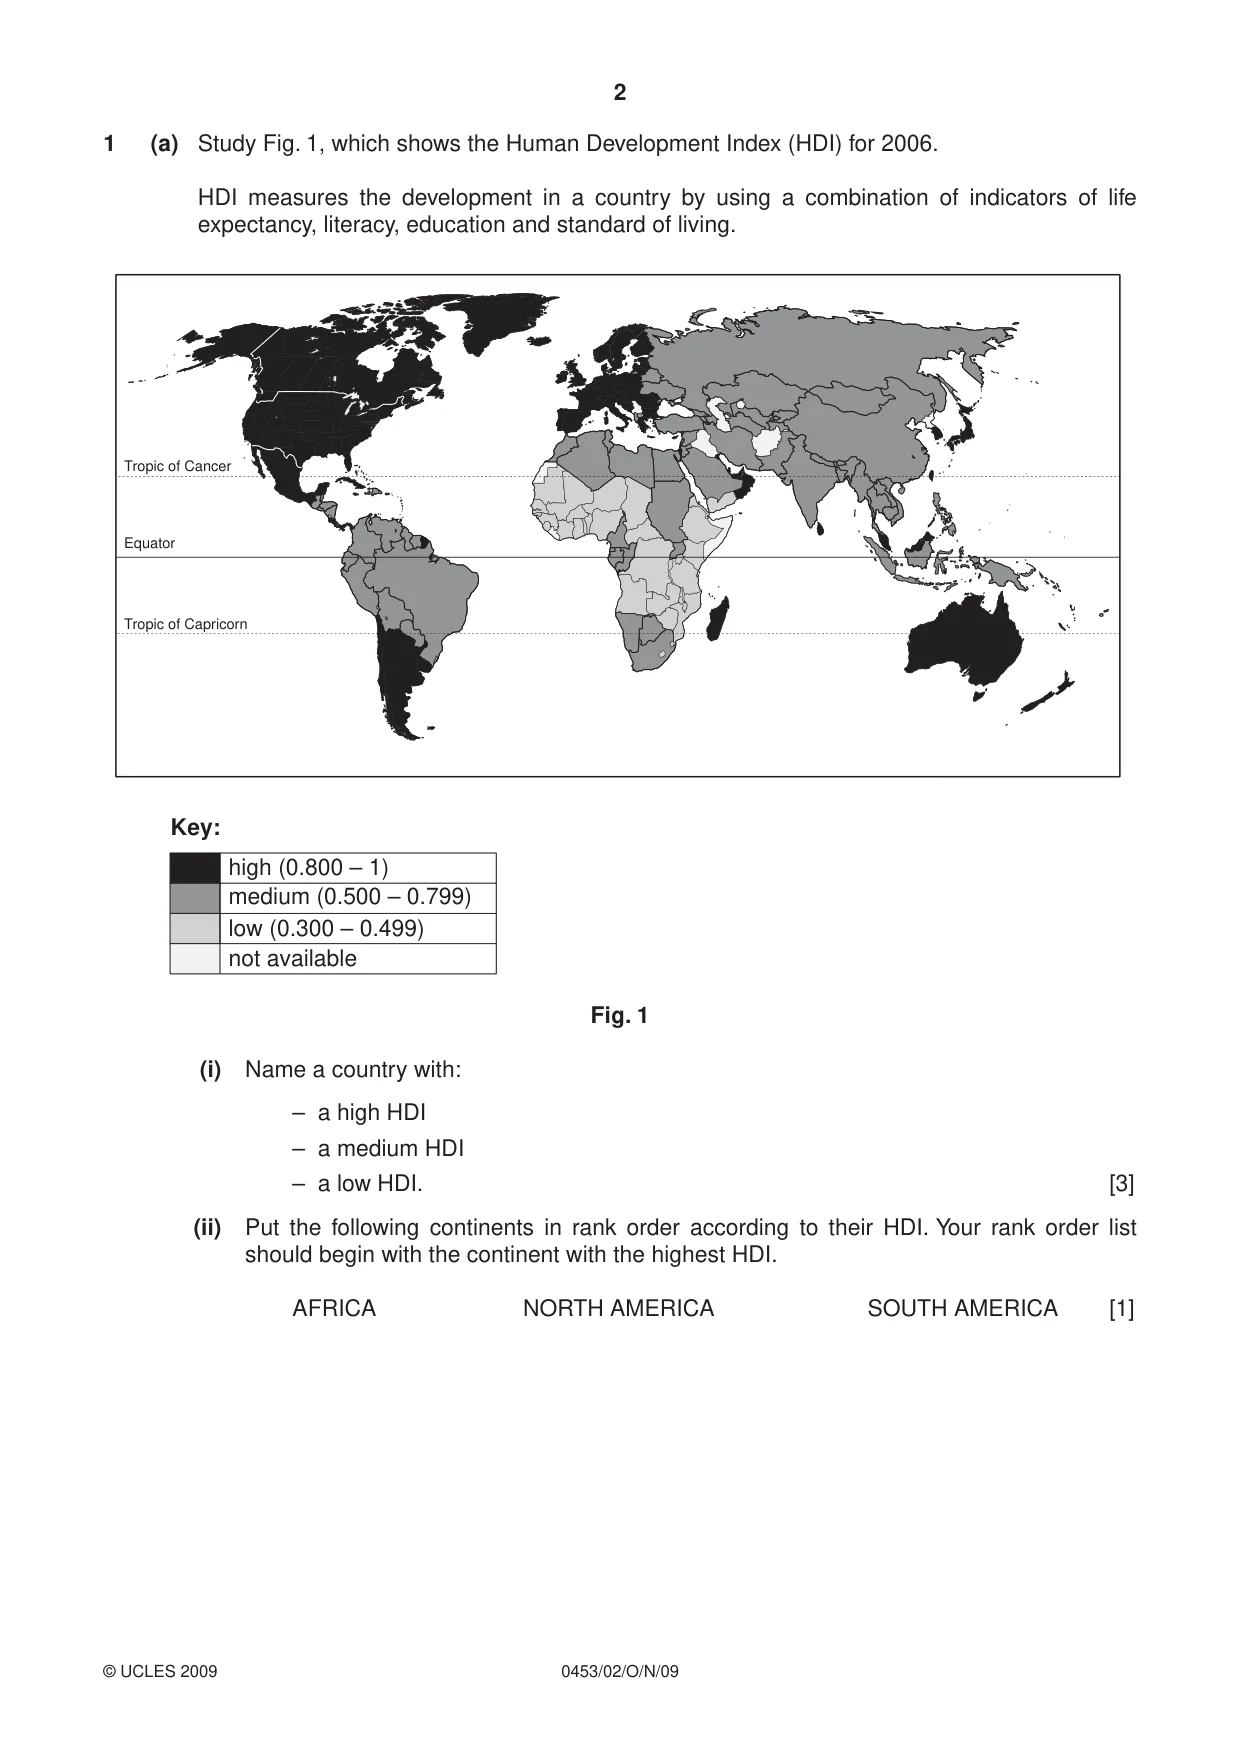
2 0453/02/O/N/09 © UCLES 2009 1 (a) Study Fig. 1, which shows the Human Development Index (HDI) for 2006. HDI measures the development in a country by using a combination of indicators of life expectancy, literacy, education and standard of living. Equator Tropic of Cancer Tropic of Capricorn high (0.800 – 1) medium (0.500 – 0.799) low (0.300 – 0.499) not available Key: Fig. 1 (i) Name a country with: – a high HDI – a medium HDI – a low HDI. [3] (ii) Put the following continents in rank order according to their HDI. Your rank order list should begin with the continent with the highest HDI. AFRICA NORTH AMERICA SOUTH AMERICA [1]
Question paper, page 3
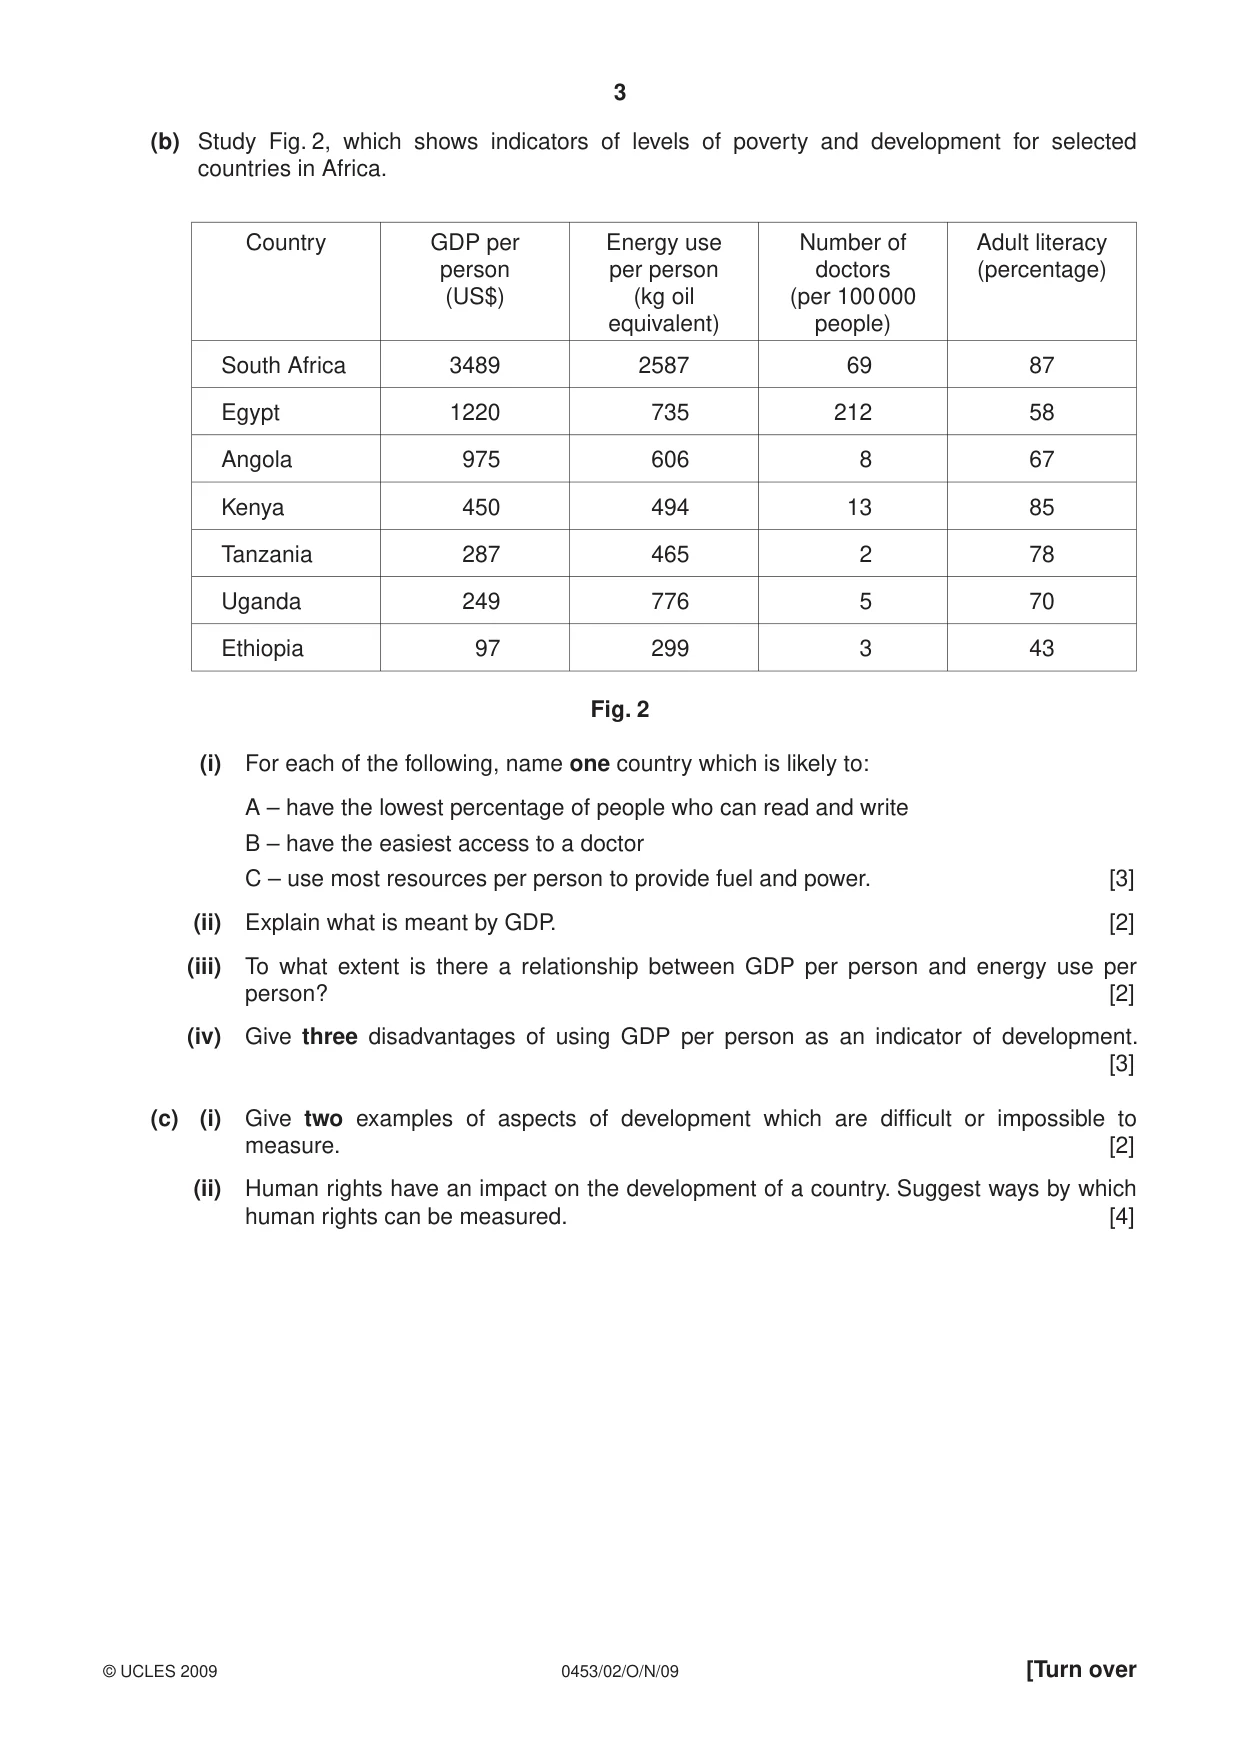
3 0453/02/O/N/09 © UCLES 2009 [Turn over (b) Study Fig. 2, which shows indicators of levels of poverty and development for selected countries in Africa. Country GDP per person (US$) Energy use per person (kg oil equivalent) Number of doctors (per 100 000 people) Adult literacy (percentage) South Africa 3489 2587 69 87 Egypt 1220 735 212 58 Angola 975 606 8 67 Kenya 450 494 13 85 Tanzania 287 465 2 78 Uganda 249 776 5 70 Ethiopia 97 299 3 43 Fig. 2 (i) For each of the following, name one country which is likely to: A – have the lowest percentage of people who can read and write B – have the easiest access to a doctor C – use most resources per person to provide fuel and power. [3] (ii) Explain what is meant by GDP. [2] (iii) To what extent is there a relationship between GDP per person and energy use per person? [2] (iv) Give three disadvantages of using GDP per person as an indicator of development. [3] (c) (i) Give two examples of aspects of development which are difficult or impossible to measure. [2] (ii) Human rights have an impact on the development of a country. Suggest ways by which human rights can be measured. [4]
Question paper, page 4
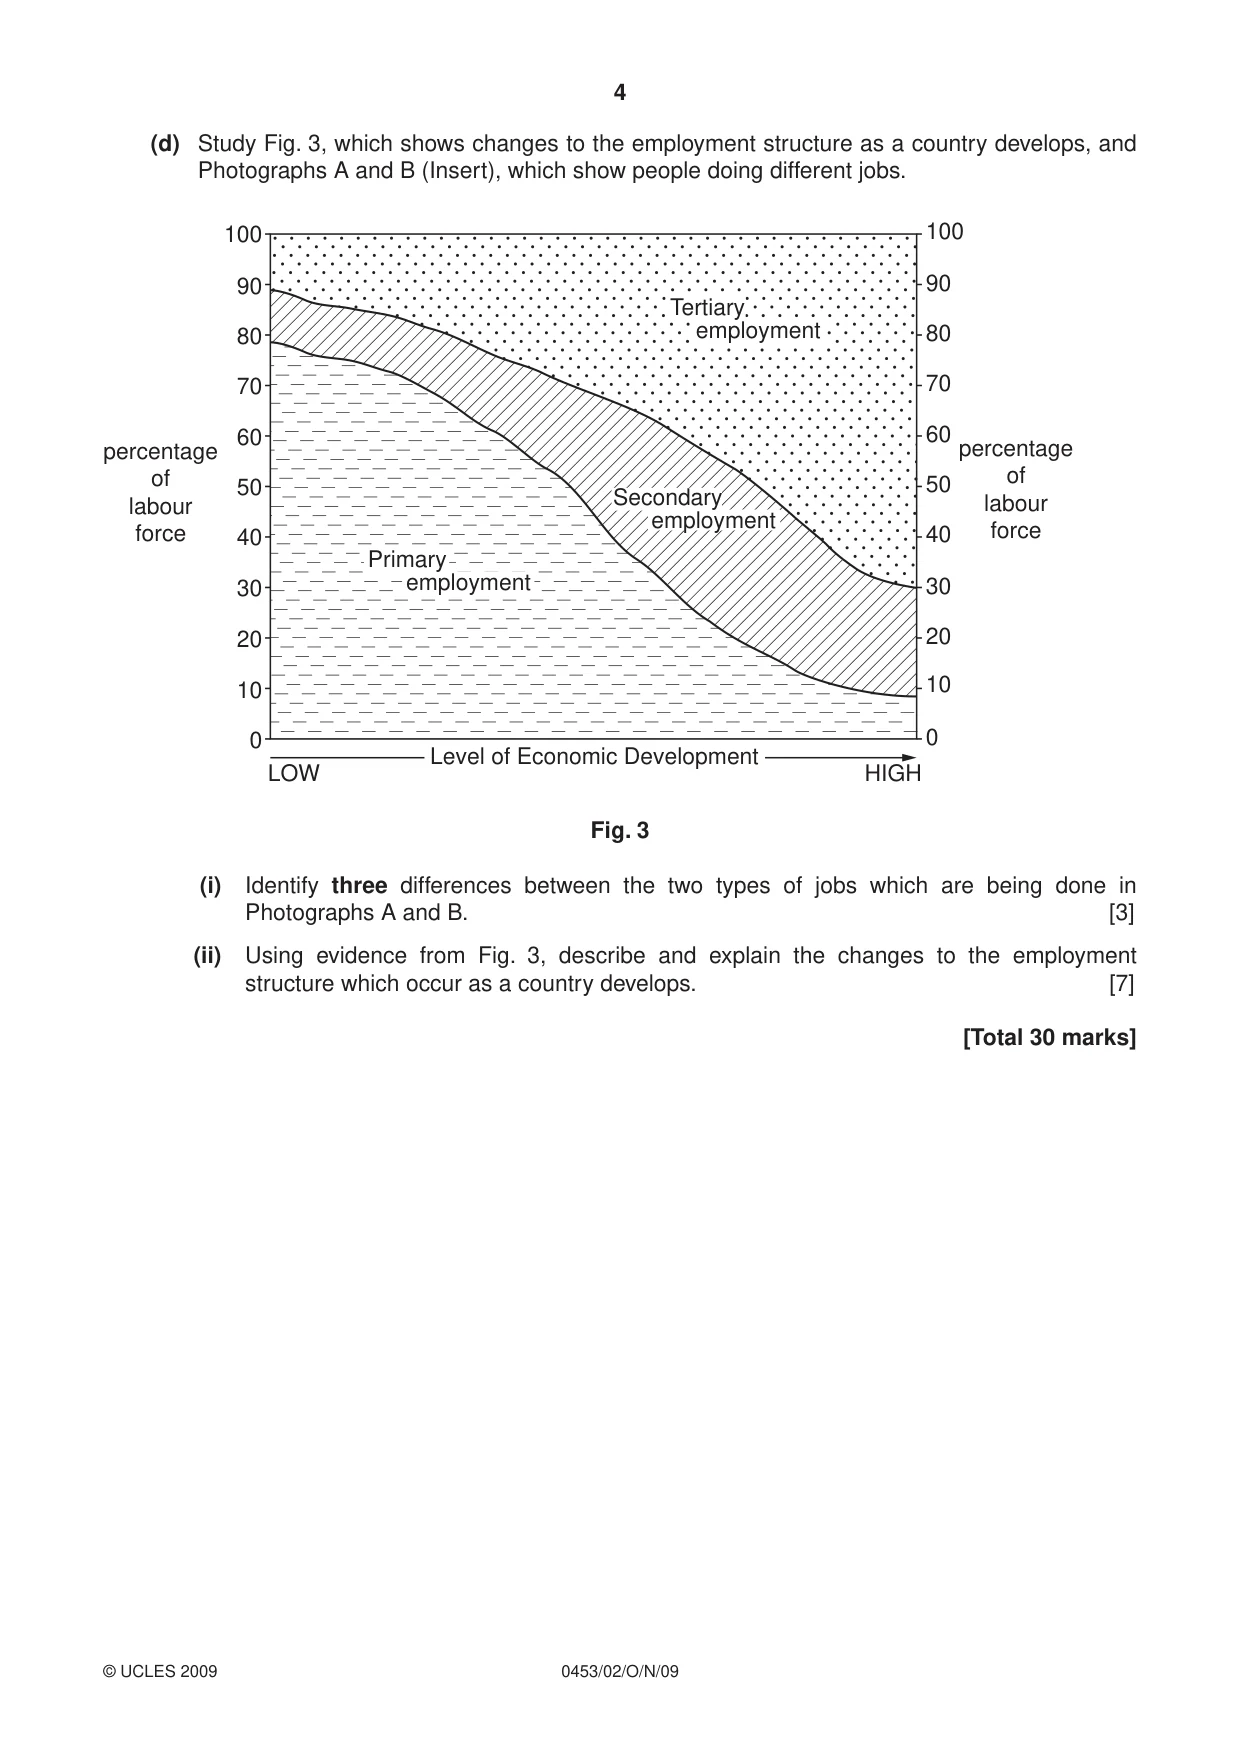
4 0453/02/O/N/09 © UCLES 2009 (d) Study Fig. 3, which shows changes to the employment structure as a country develops, and Photographs A and B (Insert), which show people doing different jobs. Level of Economic Development LOW HIGH 0 10 20 30 40 50 60 percentage of labour force percentage of labour force 70 80 90 100 0 10 20 30 40 50 60 70 80 90 100 Primary employment Secondary employment Tertiary employment Fig. 3 (i) Identify three differences between the two types of jobs which are being done in Photographs A and B. [3] (ii) Using evidence from Fig. 3, describe and explain the changes to the employment structure which occur as a country develops. [7] [Total 30 marks]
Question paper, page 5
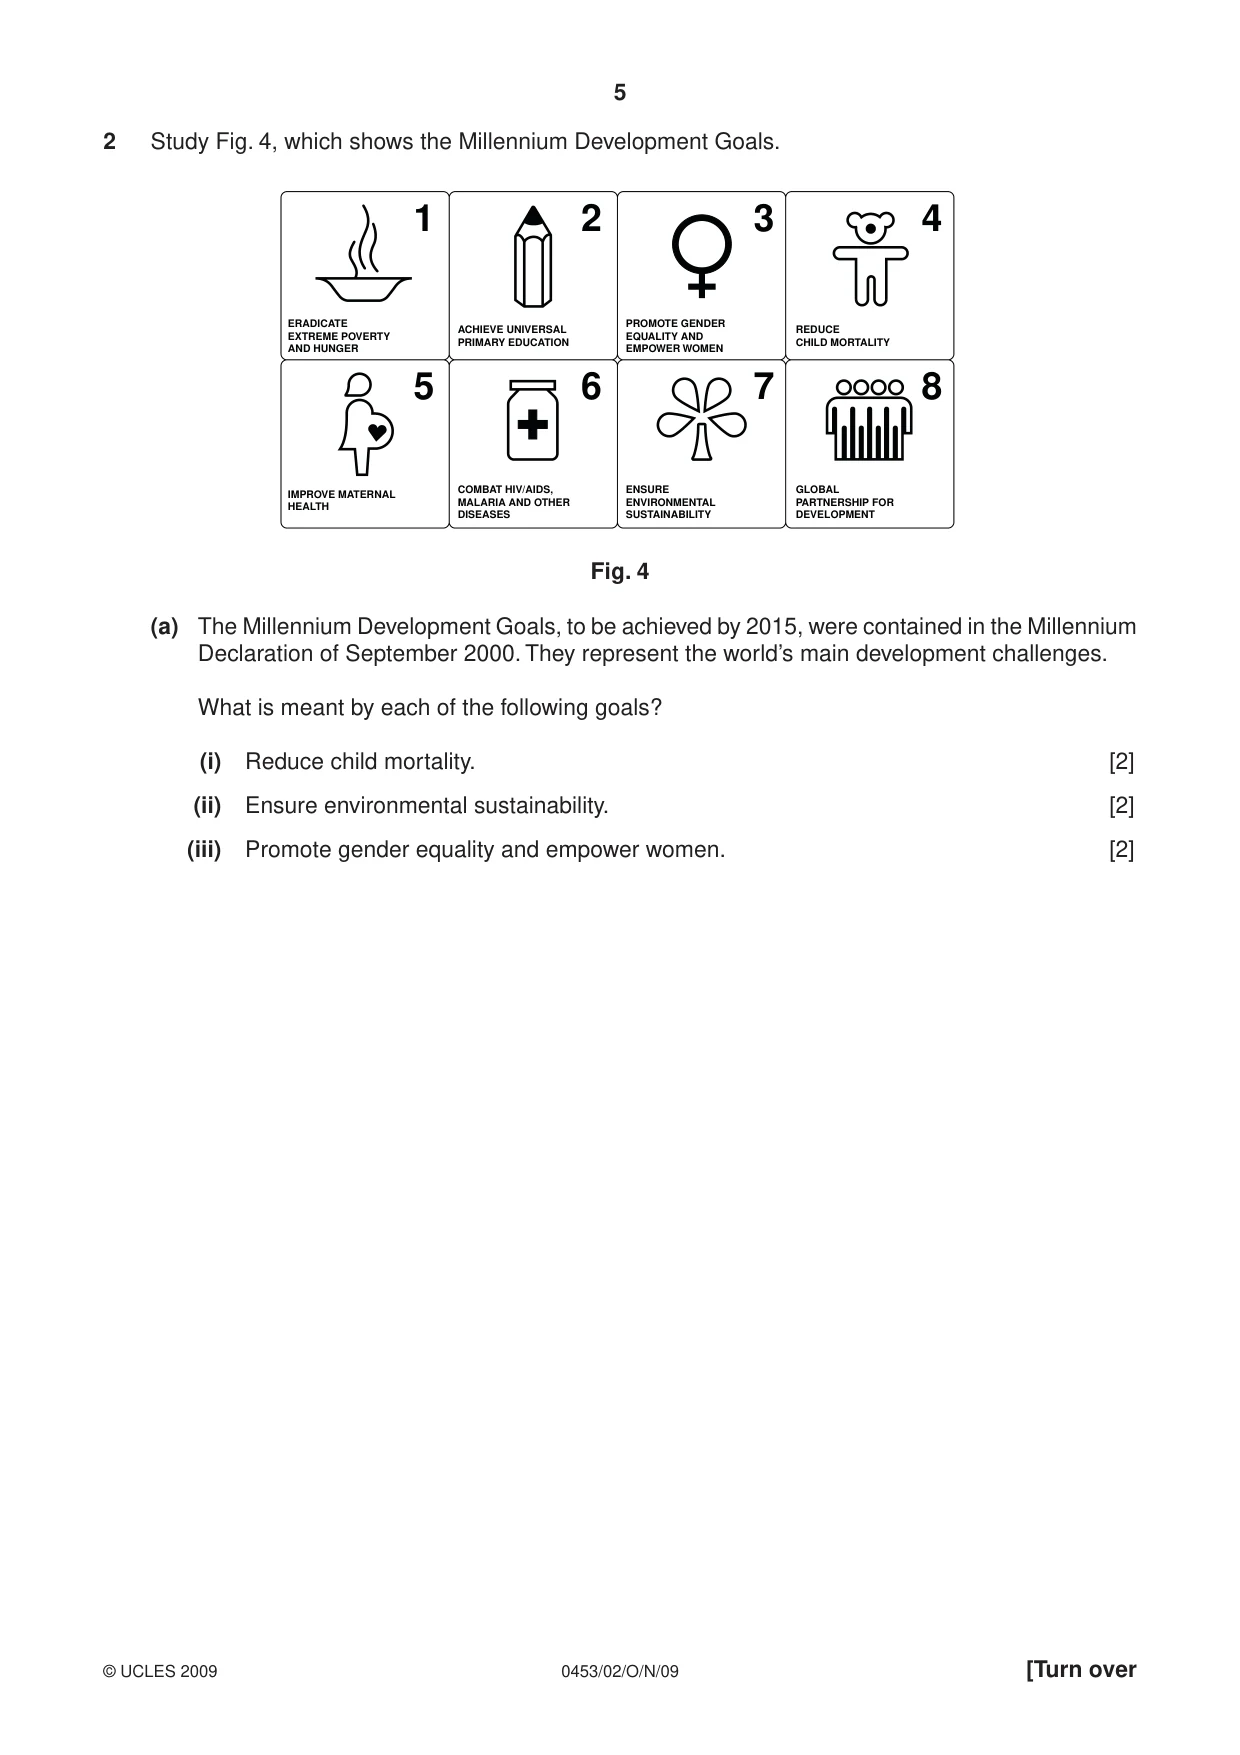
5 0453/02/O/N/09 © UCLES 2009 [Turn over 2 Study Fig. 4, which shows the Millennium Development Goals. 1 ERADICATE EXTREME POVERTY AND HUNGER ACHIEVE UNIVERSAL PRIMARY EDUCATION PROMOTE GENDER EQUALITY AND EMPOWER WOMEN REDUCE CHILD MORTALITY IMPROVE MATERNAL HEALTH COMBAT HIV/AIDS, MALARIA AND OTHER DISEASES ENSURE ENVIRONMENTAL SUSTAINABILITY GLOBAL PARTNERSHIP FOR DEVELOPMENT 2 3 4 5 6 7 8 Fig. 4 (a) The Millennium Development Goals, to be achieved by 2015, were contained in the Millennium Declaration of September 2000. They represent the world’s main development challenges. What is meant by each of the following goals? (i) Reduce child mortality. [2] (ii) Ensure environmental sustainability. [2] (iii) Promote gender equality and empower women. [2]
Question paper, page 6
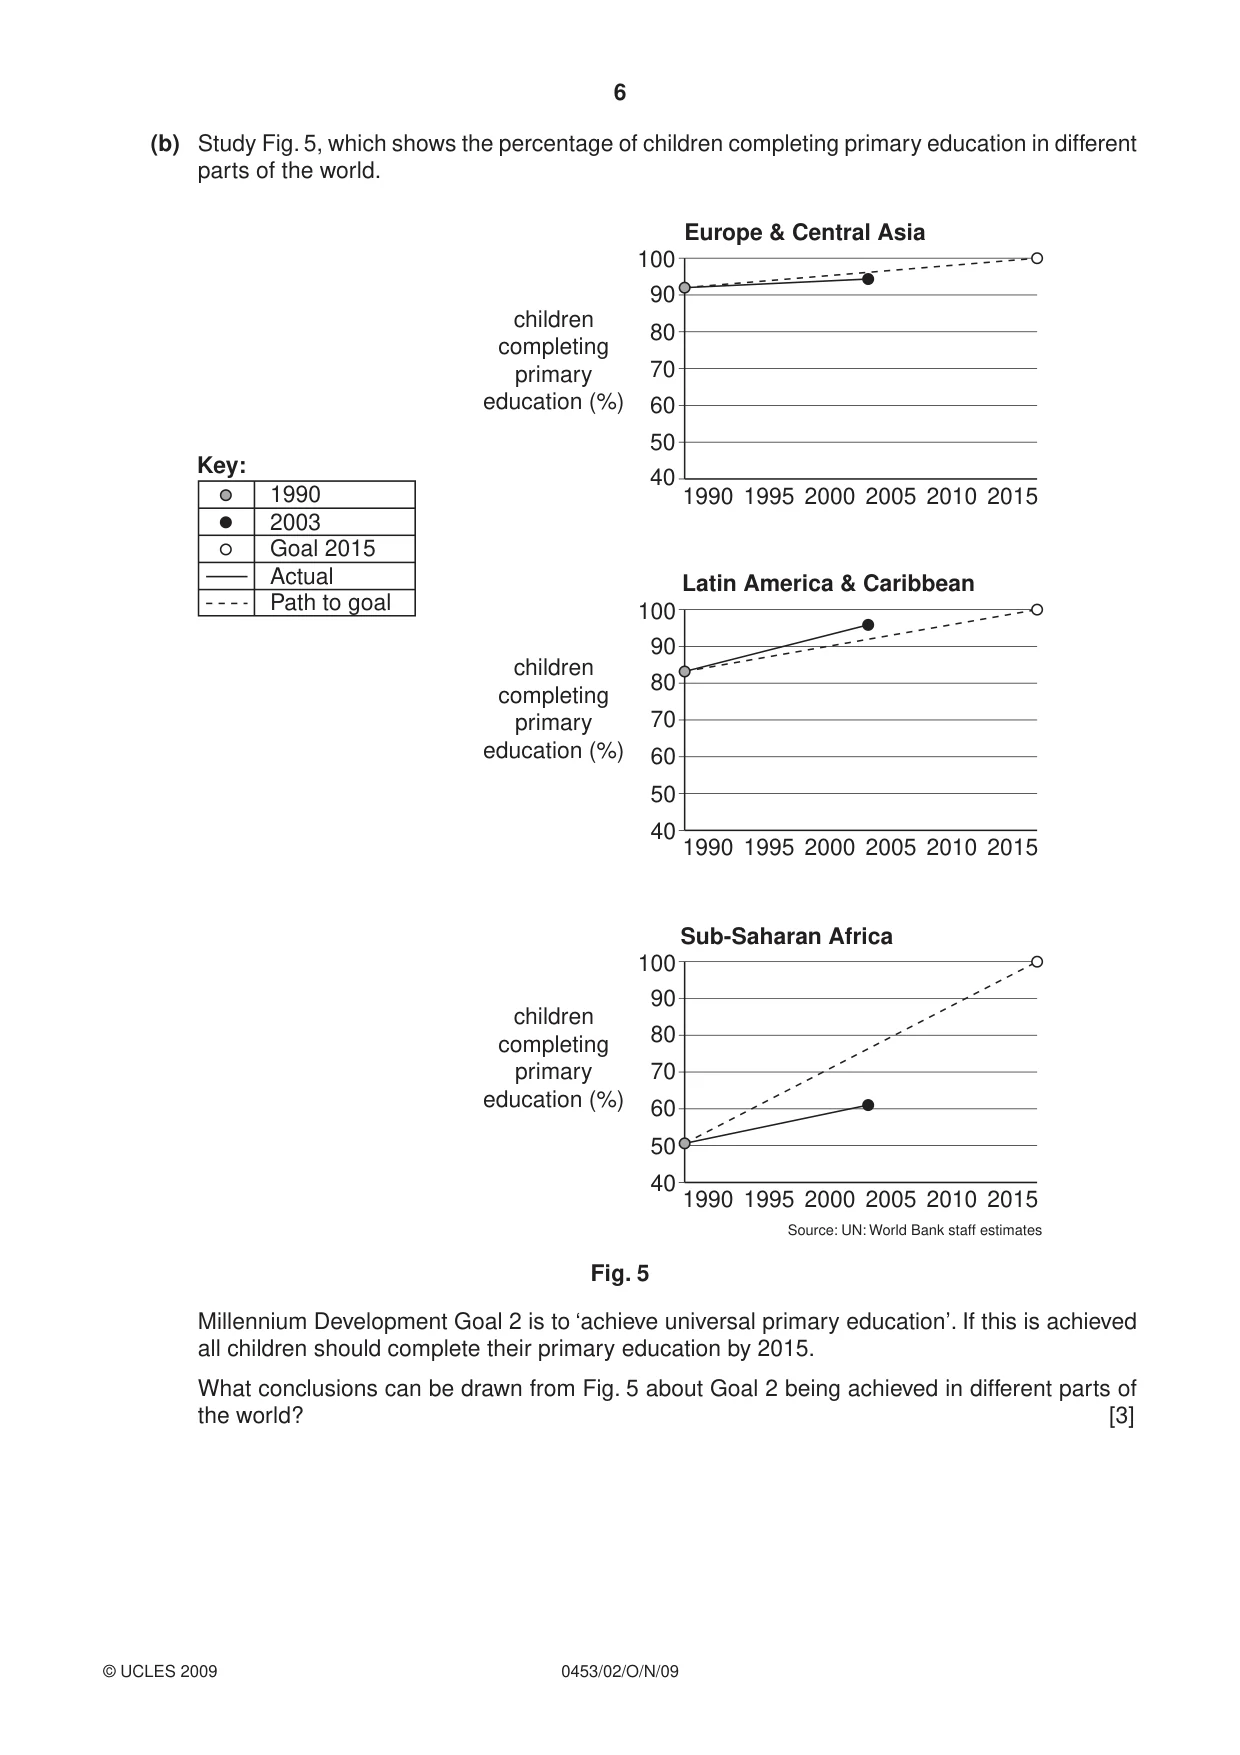
6 0453/02/O/N/09 © UCLES 2009 (b) Study Fig. 5, which shows the percentage of children completing primary education in different parts of the world. 1990 40 50 60 70 80 90 100 40 50 60 70 80 90 100 1995 2000 Europe & Central Asia Latin America & Caribbean 2005 2010 2015 1990 1995 2000 2005 2010 2015 40 50 60 70 80 90 100 Sub-Saharan Africa 1990 Key: 1995 2000 2005 2010 2015 children completing primary education (%) children completing primary education (%) children completing primary education (%) Goal 2015 Actual Path to goal 2003 1990 Source: UN: World Bank staff estimates Fig. 5 Millennium Development Goal 2 is to ‘achieve universal primary education’. If this is achieved all children should complete their primary education by 2015. What conclusions can be drawn from Fig. 5 about Goal 2 being achieved in different parts of the world? [3]
Question paper, page 7
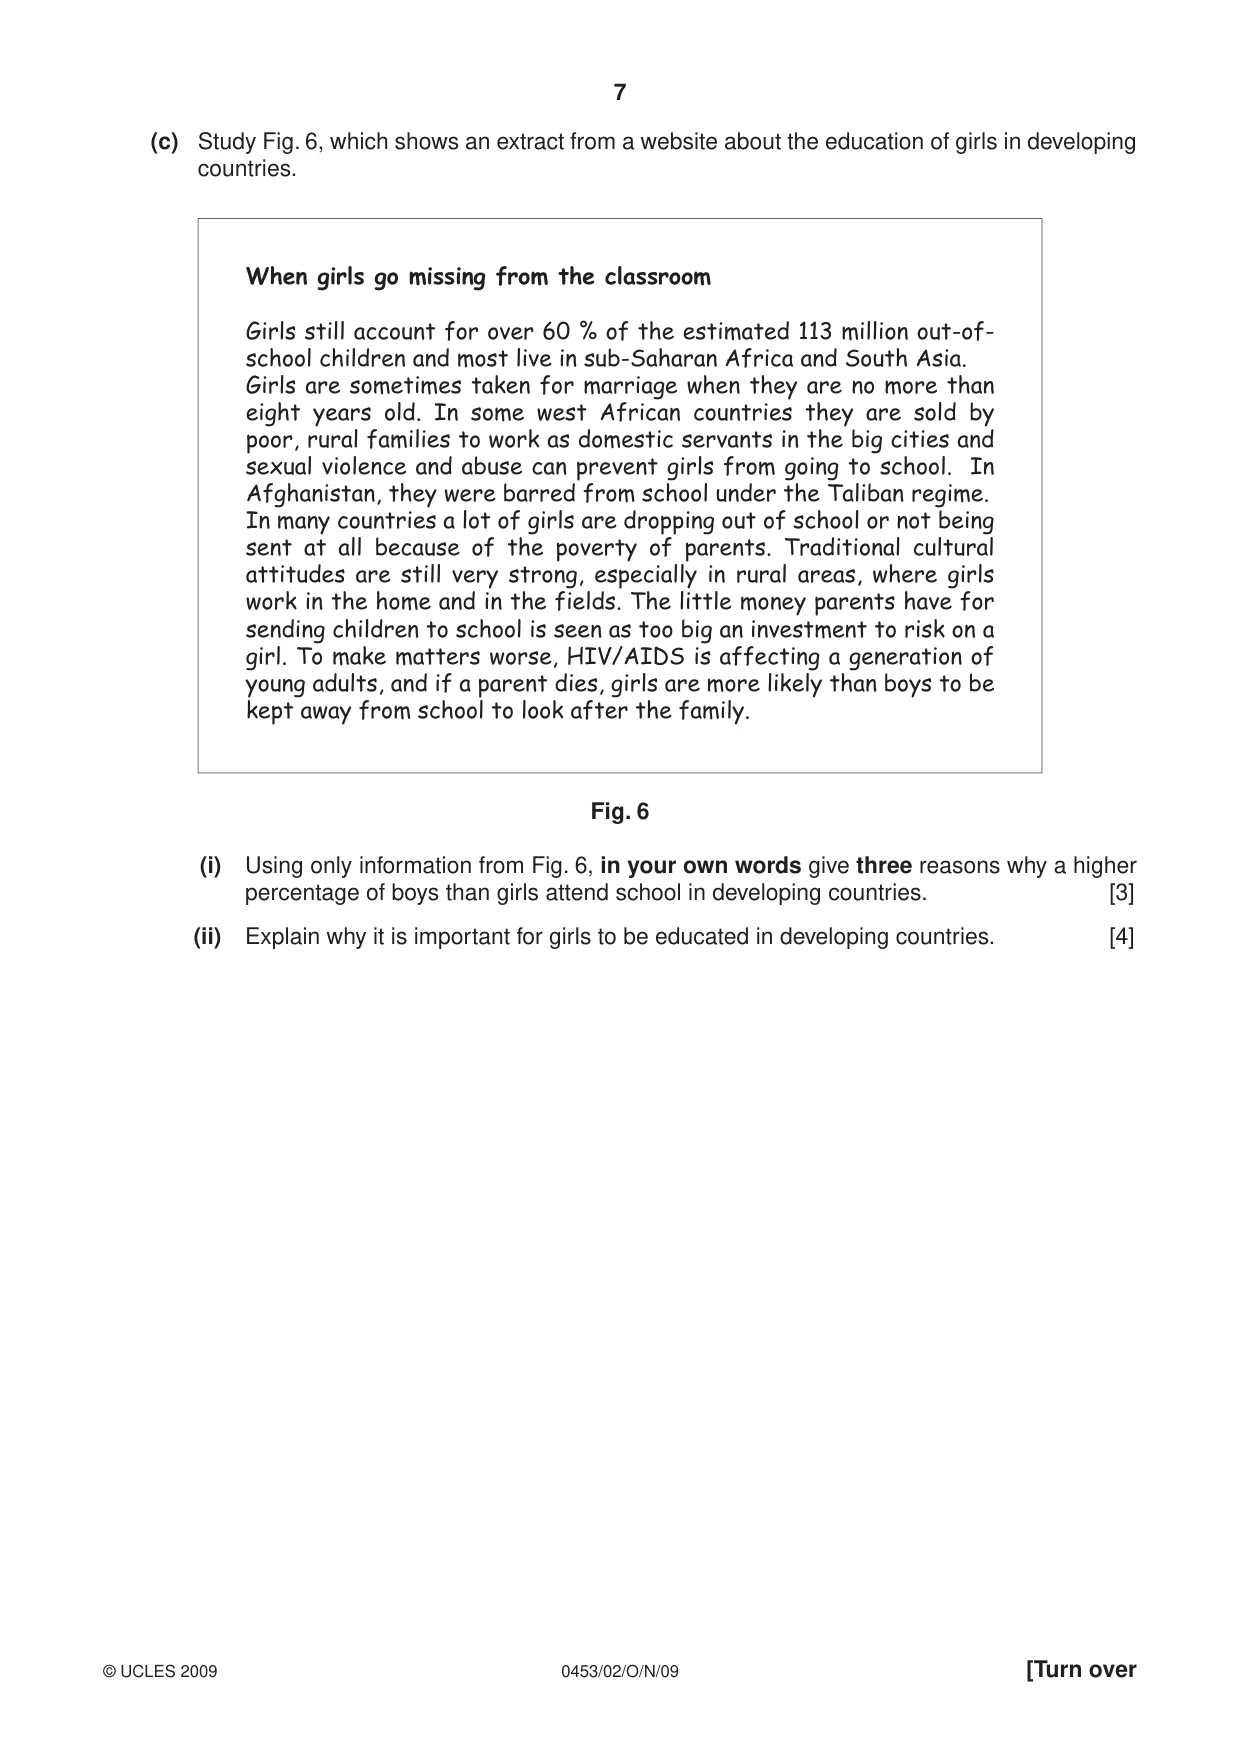
7 0453/02/O/N/09 © UCLES 2009 [Turn over (c) Study Fig. 6, which shows an extract from a website about the education of girls in developing countries. When girls go missing from the classroom Girls still account for over 60 % of the estimated 113 million out-of- school children and most live in sub-Saharan Africa and South Asia. Girls are sometimes taken for marriage when they are no more than eight years old. In some west African countries they are sold by poor, rural families to work as domestic servants in the big cities and sexual violence and abuse can prevent girls from going to school. In Afghanistan, they were barred from school under the Taliban regime. In many countries a lot of girls are dropping out of school or not being sent at all because of the poverty of parents. Traditional cultural attitudes are still very strong, especially in rural areas, where girls work in the home and in the fields. The little money parents have for sending children to school is seen as too big an investment to risk on a girl. To make matters worse, HIV/AIDS is affecting a generation of young adults, and if a parent dies, girls are more likely than boys to be kept away from school to look after the family. Fig. 6 (i) Using only information from Fig. 6, in your own words give three reasons why a higher percentage of boys than girls attend school in developing countries. [3] (ii) Explain why it is important for girls to be educated in developing countries. [4]
Question paper, page 8
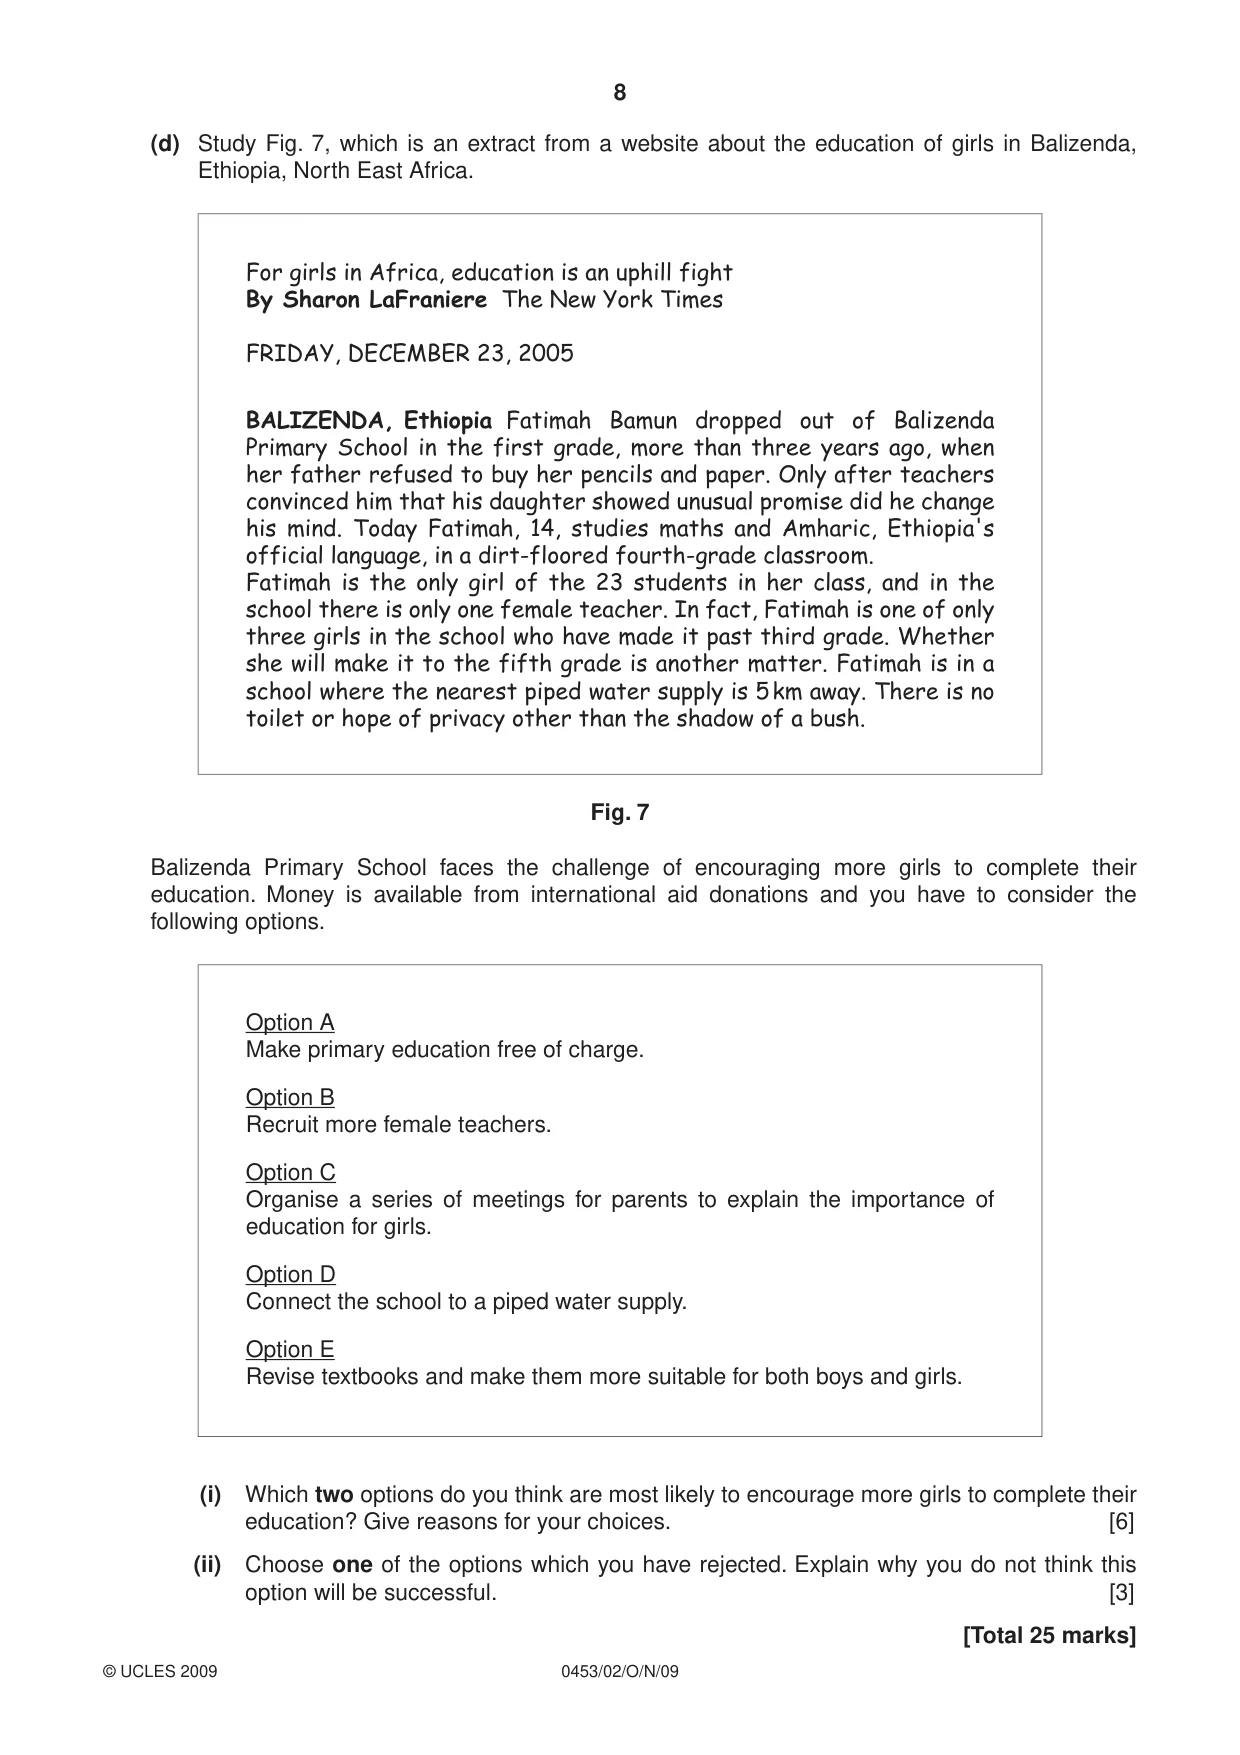
8 0453/02/O/N/09 © UCLES 2009 (d) Study Fig. 7, which is an extract from a website about the education of girls in Balizenda, Ethiopia, North East Africa. For girls in Africa, education is an uphill fight By Sharon LaFraniere The New York Times FRIDAY, DECEMBER 23, 2005 BALIZENDA, Ethiopia Fatimah Bamun dropped out of Balizenda Primary School in the first grade, more than three years ago, when her father refused to buy her pencils and paper. Only after teachers convinced him that his daughter showed unusual promise did he change his mind. Today Fatimah, 14, studies maths and Amharic, Ethiopia's official language, in a dirt-floored fourth-grade classroom. Fatimah is the only girl of the 23 students in her class, and in the school there is only one female teacher. In fact, Fatimah is one of only three girls in the school who have made it past third grade. Whether she will make it to the fifth grade is another matter. Fatimah is in a school where the nearest piped water supply is 5 km away. There is no toilet or hope of privacy other than the shadow of a bush. Fig. 7 Balizenda Primary School faces the challenge of encouraging more girls to complete their education. Money is available from international aid donations and you have to consider the following options. Option A Make primary education free of charge. Option B Recruit more female teachers. Option C Organise a series of meetings for parents to explain the importance of education for girls. Option D Connect the school to a piped water supply. Option E Revise textbooks and make them more suitable for both boys and girls. (i) Which two options do you think are most likely to encourage more girls to complete their education? Give reasons for your choices. [6] (ii) Choose one of the options which you have rejected. Explain why you do not think this option will be successful. [3] [Total 25 marks]
Question paper, page 9
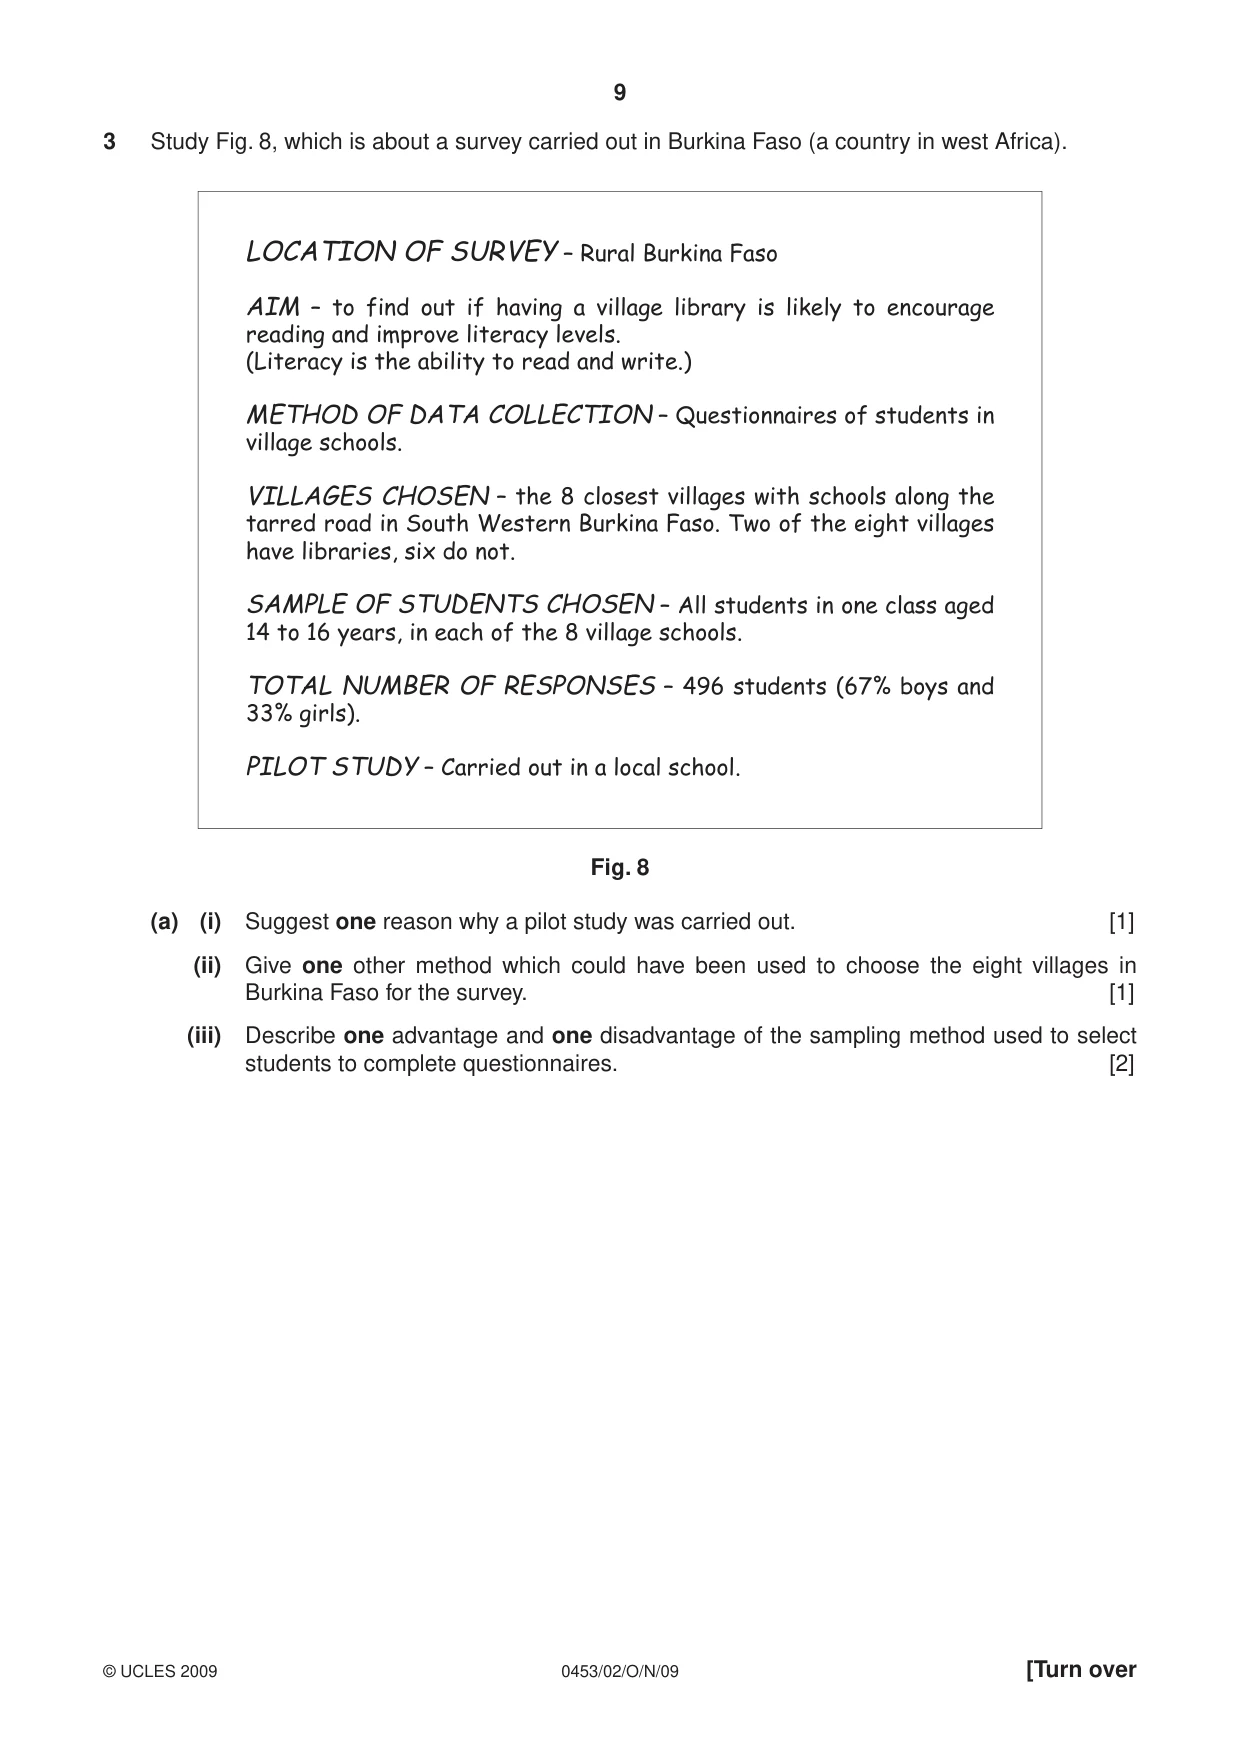
9 0453/02/O/N/09 © UCLES 2009 [Turn over 3 Study Fig. 8, which is about a survey carried out in Burkina Faso (a country in west Africa). LOCATION OF SURVEY – Rural Burkina Faso AIM – to find out if having a village library is likely to encourage reading and improve literacy levels. (Literacy is the ability to read and write.) METHOD OF DATA COLLECTION – Questionnaires of students in village schools. VILLAGES CHOSEN – the 8 closest villages with schools along the tarred road in South Western Burkina Faso. Two of the eight villages have libraries, six do not. SAMPLE OF STUDENTS CHOSEN – All students in one class aged 14 to 16 years, in each of the 8 village schools. TOTAL NUMBER OF RESPONSES – 496 students (67% boys and 33% girls). PILOT STUDY – Carried out in a local school. Fig. 8 (a) (i) Suggest one reason why a pilot study was carried out. [1] (ii) Give one other method which could have been used to choose the eight villages in Burkina Faso for the survey. [1] (iii) Describe one advantage and one disadvantage of the sampling method used to select students to complete questionnaires. [2]
Question paper, page 10
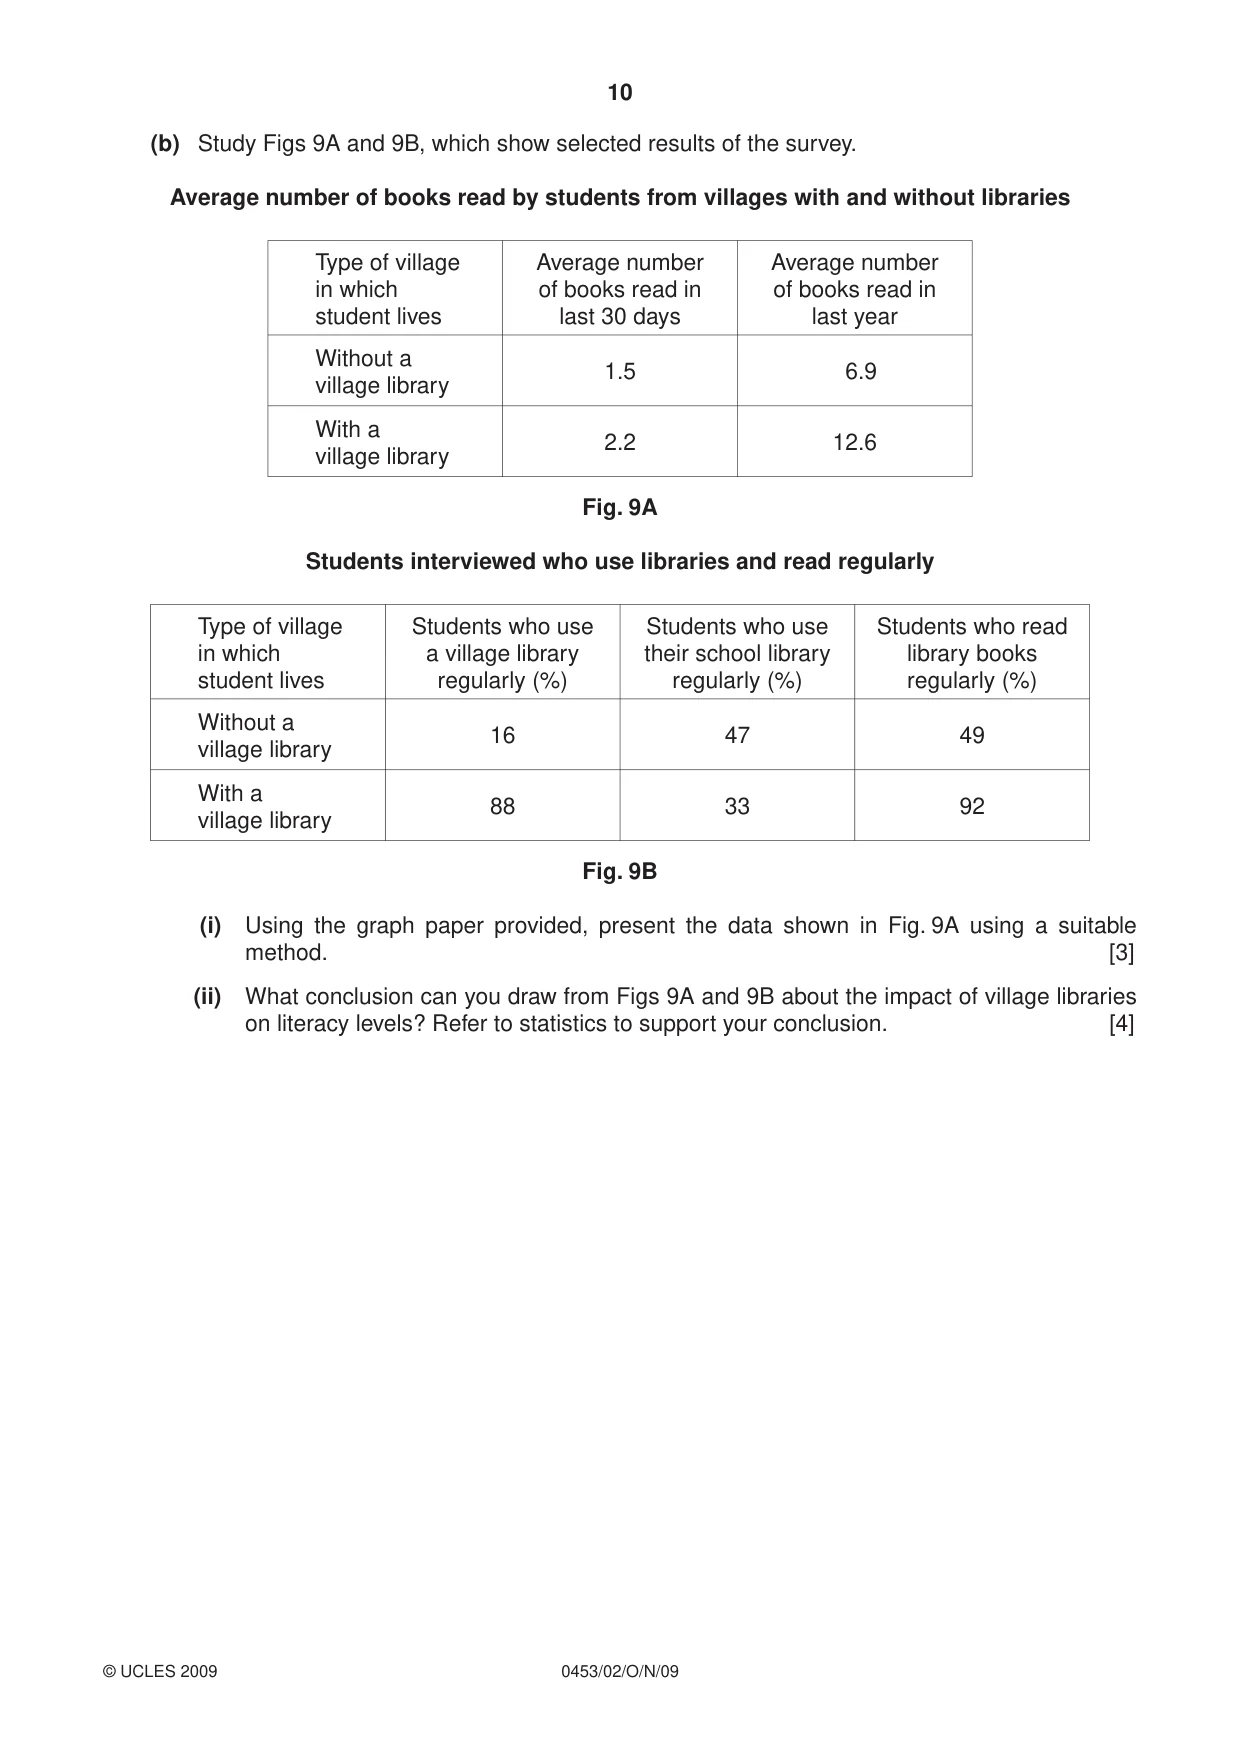
10 0453/02/O/N/09 © UCLES 2009 (b) Study Figs 9A and 9B, which show selected results of the survey. Average number of books read by students from villages with and without libraries Type of village in which student lives Average number of books read in last 30 days Average number of books read in last year Without a village library 1.5 6.9 With a village library 2.2 12.6 Fig. 9A Students interviewed who use libraries and read regularly Type of village in which student lives Students who use a village library regularly (%) Students who use their school library regularly (%) Students who read library books regularly (%) Without a village library 16 47 49 With a village library 88 33 92 Fig. 9B (i) Using the graph paper provided, present the data shown in Fig. 9A using a suitable method. [3] (ii) What conclusion can you draw from Figs 9A and 9B about the impact of village libraries on literacy levels? Refer to statistics to support your conclusion. [4]
Question paper, page 11
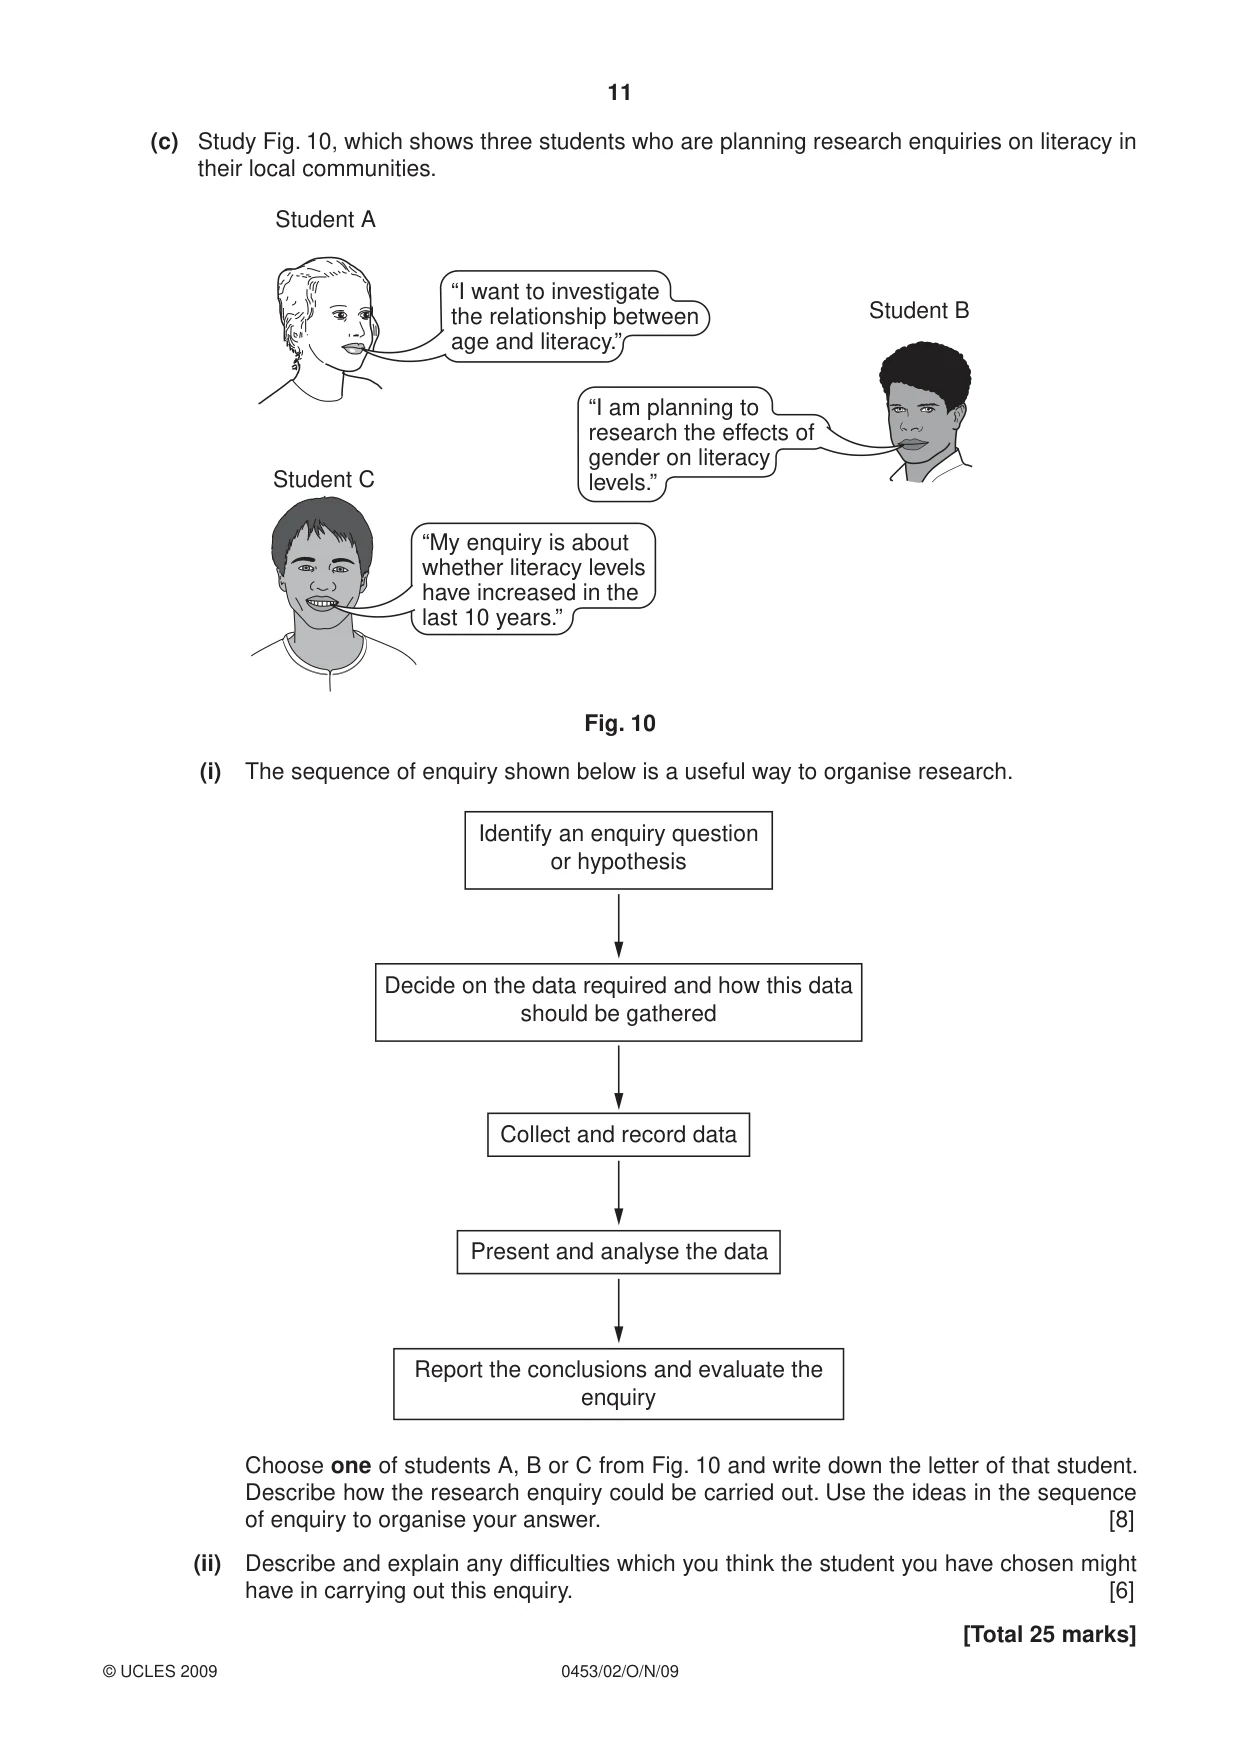
11 0453/02/O/N/09 (c) Study Fig. 10, which shows three students who are planning research enquiries on literacy in their local communities. “I want to investigate the relationship between age and literacy.” “I am planning to research the effects of gender on literacy levels.” “My enquiry is about whether literacy levels have increased in the last 10 years.” Student A Student B Student C Fig. 10 (i) The sequence of enquiry shown below is a useful way to organise research. Identify an enquiry question or hypothesis Decide on the data required and how this data should be gathered Collect and record data Present and analyse the data Report the conclusions and evaluate the enquiry Choose one of students A, B or C from Fig. 10 and write down the letter of that student. Describe how the research enquiry could be carried out. Use the ideas in the sequence of enquiry to organise your answer. [8] (ii) Describe and explain any difficulties which you think the student you have chosen might have in carrying out this enquiry. [6] [Total 25 marks] © UCLES 2009
Question paper, page 12
12 0453/02/O/N/09 BLANK PAGE Copyright Acknowledgements: Question 1 Fig. 1 www.en.wikipedia.org Question 2 Fig. 2 United Nations Development Programme Question 2 Fig. 5 Worldbank Question 2 Fig. 6 UNESCO Question 2 Fig. 7 International Herald Tribune Question 3 Fig. 8 Leavey School of Business Question 3 Figs 9a & 9b Leavey School of Business Permission to reproduce items where third-party owned material protected by copyright is included has been sought and cleared where possible. Every reasonable effort has been made by the publisher (UCLES) to trace copyright holders, but if any items requiring clearance have unwittingly been included, the publisher will be pleased to make amends at the earliest possible opportunity. University of Cambridge International Examinations is part of the Cambridge Assessment Group. Cambridge Assessment is the brand name of University of Cambridge Local Examinations Syndicate (UCLES), which is itself a department of the University of Cambridge.
Mark scheme, page 1
UNIVERSITY OF CAMBRIDGE INTERNATIONAL EXAMINATIONS International General Certificate of Secondary Education MARK SCHEME for the October/November 2009 question paper for the guidance of teachers 0453 DEVELOPMENT STUDIES 0453/02 Paper 2, maximum raw mark 80 This mark scheme is published as an aid to teachers and candidates, to indicate the requirements of the examination. It shows the basis on which Examiners were instructed to award marks. It does not indicate the details of the discussions that took place at an Examiners’ meeting before marking began, which would have considered the acceptability of alternative answers. Mark schemes must be read in conjunction with the question papers and the report on the examination. • CIE will not enter into discussions or correspondence in connection with these mark schemes. CIE is publishing the mark schemes for the October/November 2009 question papers for most IGCSE, GCE Advanced Level and Advanced Subsidiary Level syllabuses and some Ordinary Level syllabuses. www.XtremePapers.com
Mark scheme, page 2
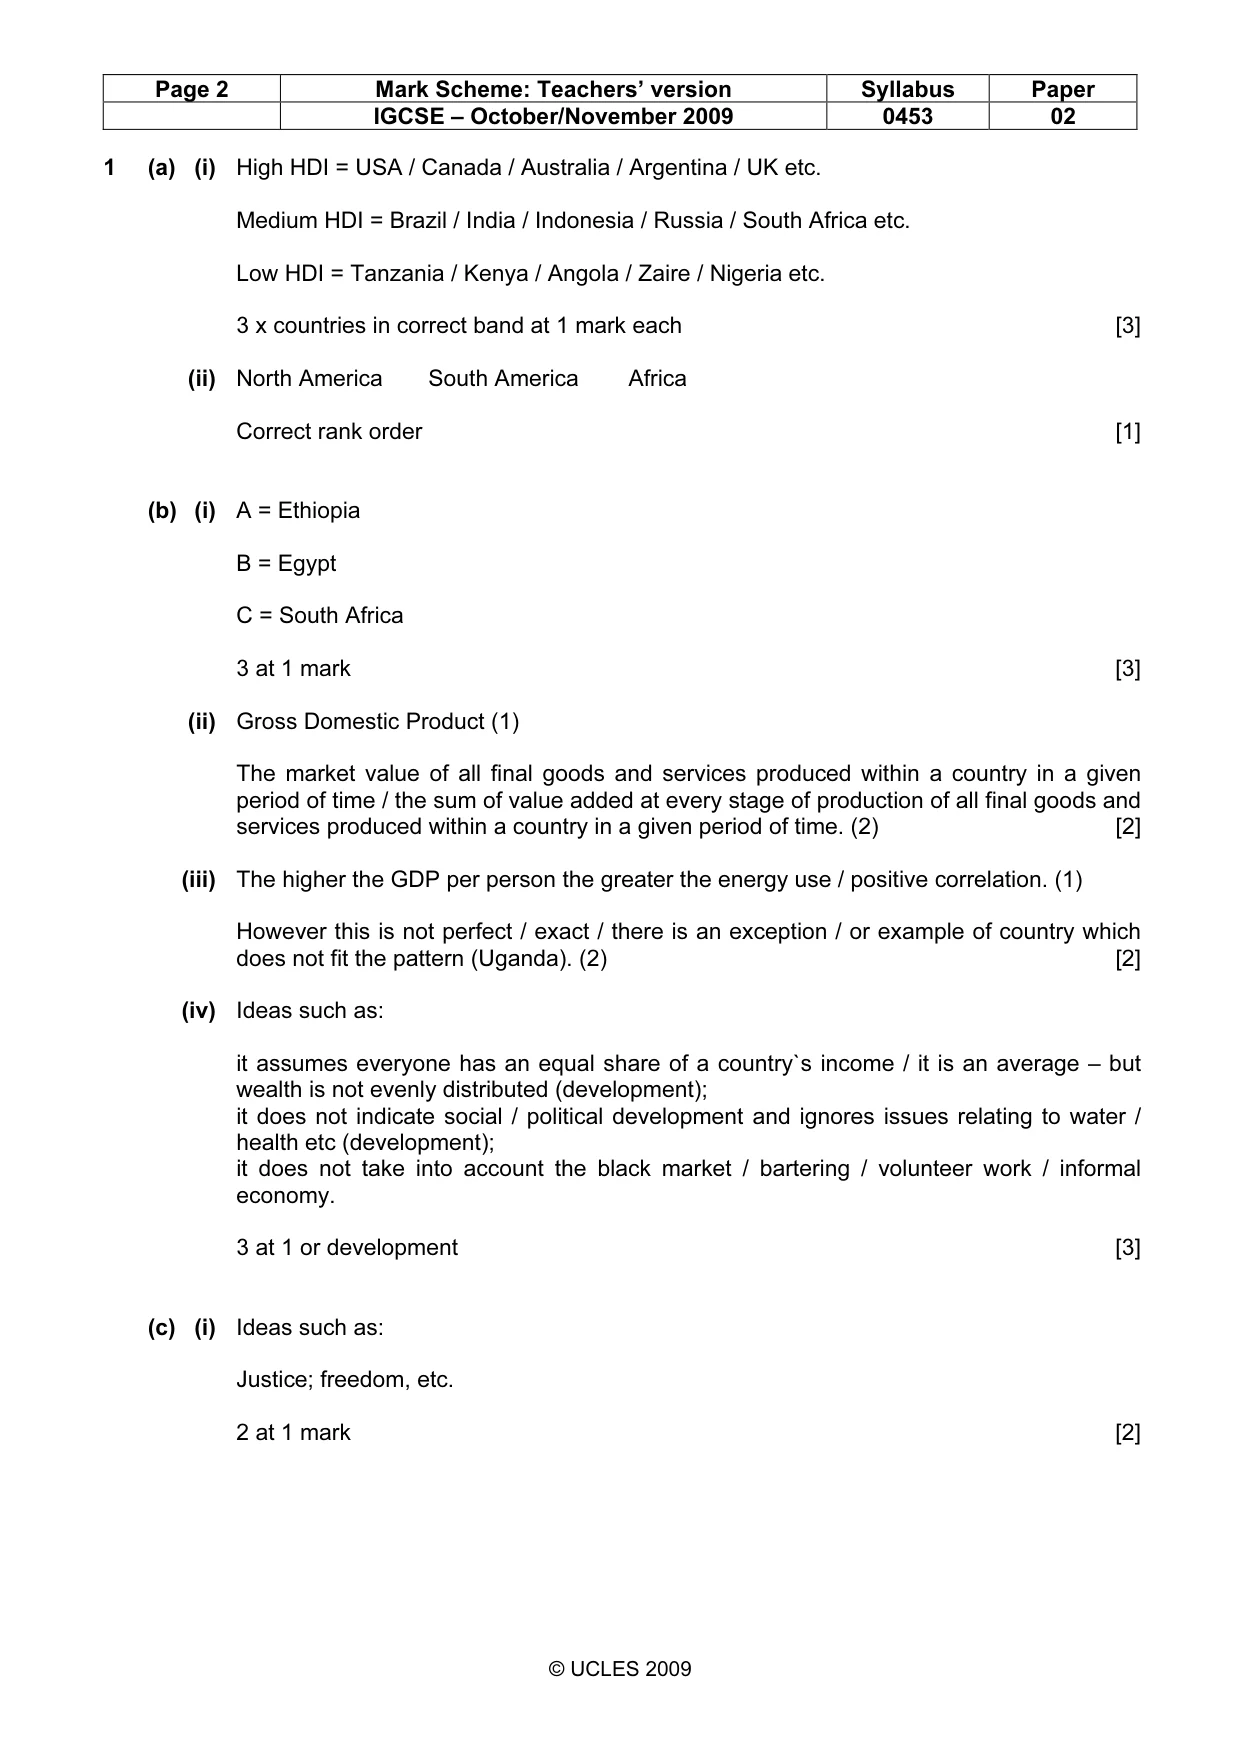
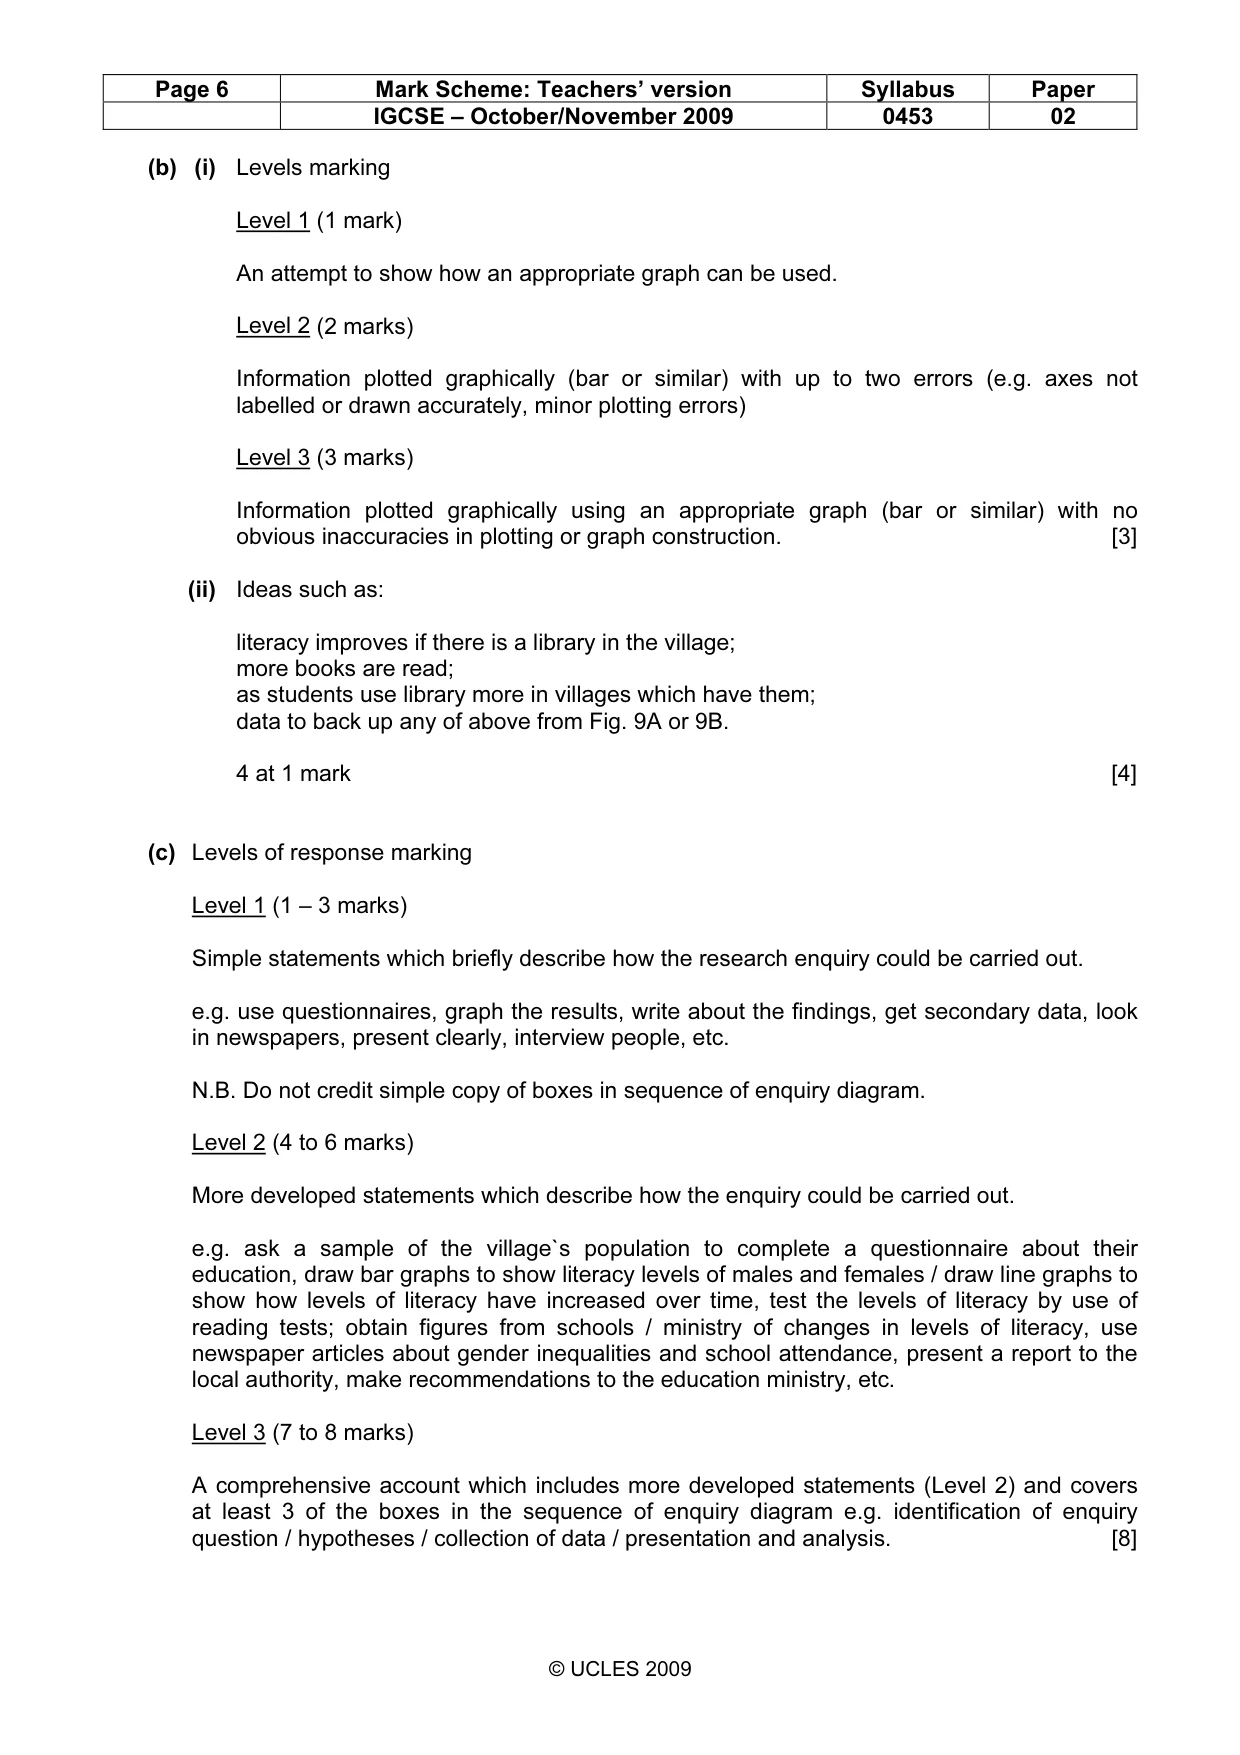
Page 2 Mark Scheme: Teachers’ version Syllabus Paper IGCSE – October/November 2009 0453 02 © UCLES 2009 1 (a) (i) High HDI = USA / Canada / Australia / Argentina / UK etc. Medium HDI = Brazil / India / Indonesia / Russia / South Africa etc. Low HDI = Tanzania / Kenya / Angola / Zaire / Nigeria etc. 3 x countries in correct band at 1 mark each [3] (ii) North America South America Africa Correct rank order [1] (b) (i) A = Ethiopia B = Egypt C = South Africa 3 at 1 mark [3] (ii) Gross Domestic Product (1) The market value of all final goods and services produced within a country in a given period of time / the sum of value added at every stage of production of all final goods and services produced within a country in a given period of time. (2) [2] (iii) The higher the GDP per person the greater the energy use / positive correlation. (1) However this is not perfect / exact / there is an exception / or example of country which does not fit the pattern (Uganda). (2) [2] (iv) Ideas such as: it assumes everyone has an equal share of a country`s income / it is an average – but wealth is not evenly distributed (development); it does not indicate social / political development and ignores issues relating to water / health etc (development); it does not take into account the black market / bartering / volunteer work / informal economy. 3 at 1 or development [3] (c) (i) Ideas such as: Justice; freedom, etc. 2 at 1 mark [2]
Mark scheme, page 3
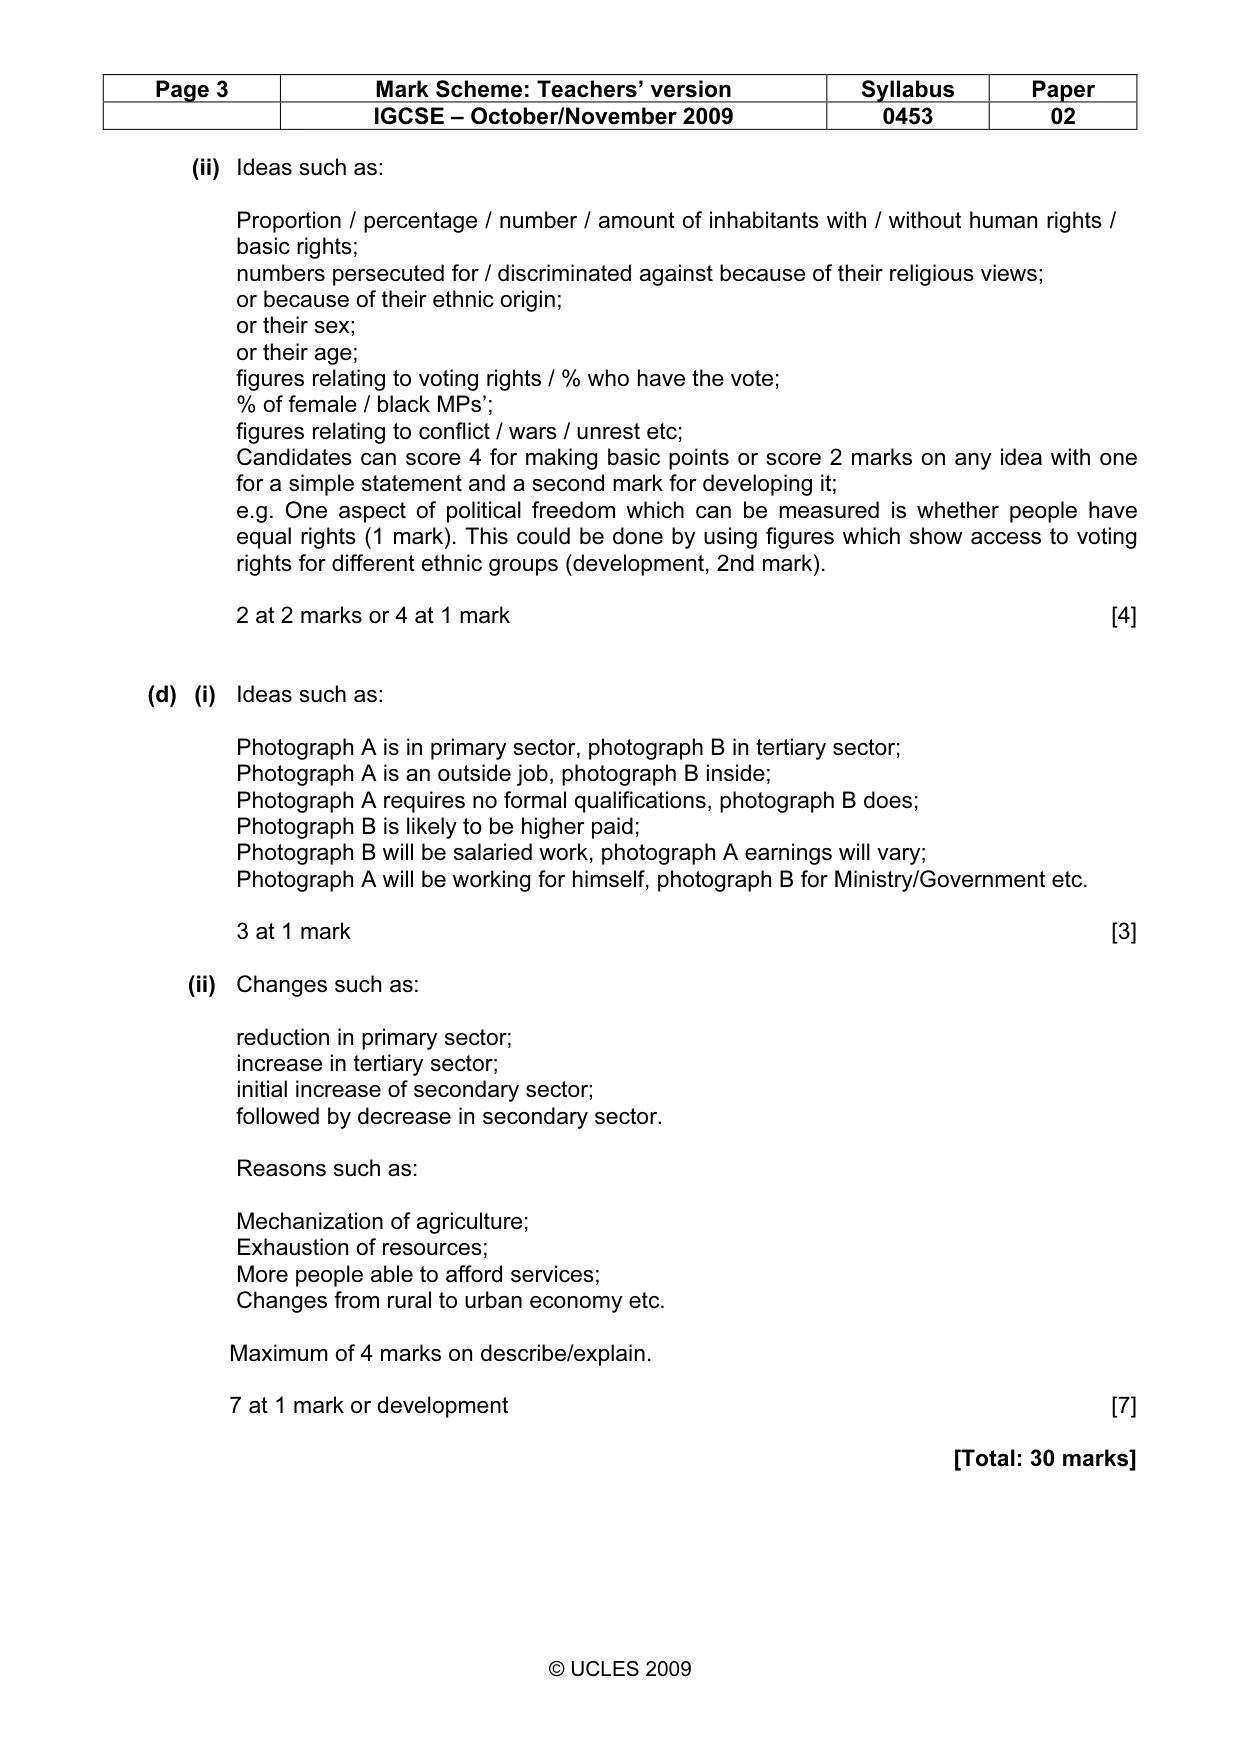
Page 3 Mark Scheme: Teachers’ version Syllabus Paper IGCSE – October/November 2009 0453 02 © UCLES 2009 (ii) Ideas such as: Proportion / percentage / number / amount of inhabitants with / without human rights / basic rights; numbers persecuted for / discriminated against because of their religious views; or because of their ethnic origin; or their sex; or their age; figures relating to voting rights / % who have the vote; % of female / black MPs’; figures relating to conflict / wars / unrest etc; Candidates can score 4 for making basic points or score 2 marks on any idea with one for a simple statement and a second mark for developing it; e.g. One aspect of political freedom which can be measured is whether people have equal rights (1 mark). This could be done by using figures which show access to voting rights for different ethnic groups (development, 2nd mark). 2 at 2 marks or 4 at 1 mark [4] (d) (i) Ideas such as: Photograph A is in primary sector, photograph B in tertiary sector; Photograph A is an outside job, photograph B inside; Photograph A requires no formal qualifications, photograph B does; Photograph B is likely to be higher paid; Photograph B will be salaried work, photograph A earnings will vary; Photograph A will be working for himself, photograph B for Ministry/Government etc. 3 at 1 mark [3] (ii) Changes such as: reduction in primary sector; increase in tertiary sector; initial increase of secondary sector; followed by decrease in secondary sector. Reasons such as: Mechanization of agriculture; Exhaustion of resources; More people able to afford services; Changes from rural to urban economy etc. Maximum of 4 marks on describe/explain. 7 at 1 mark or development [7] [Total: 30 marks]
Mark scheme, page 4
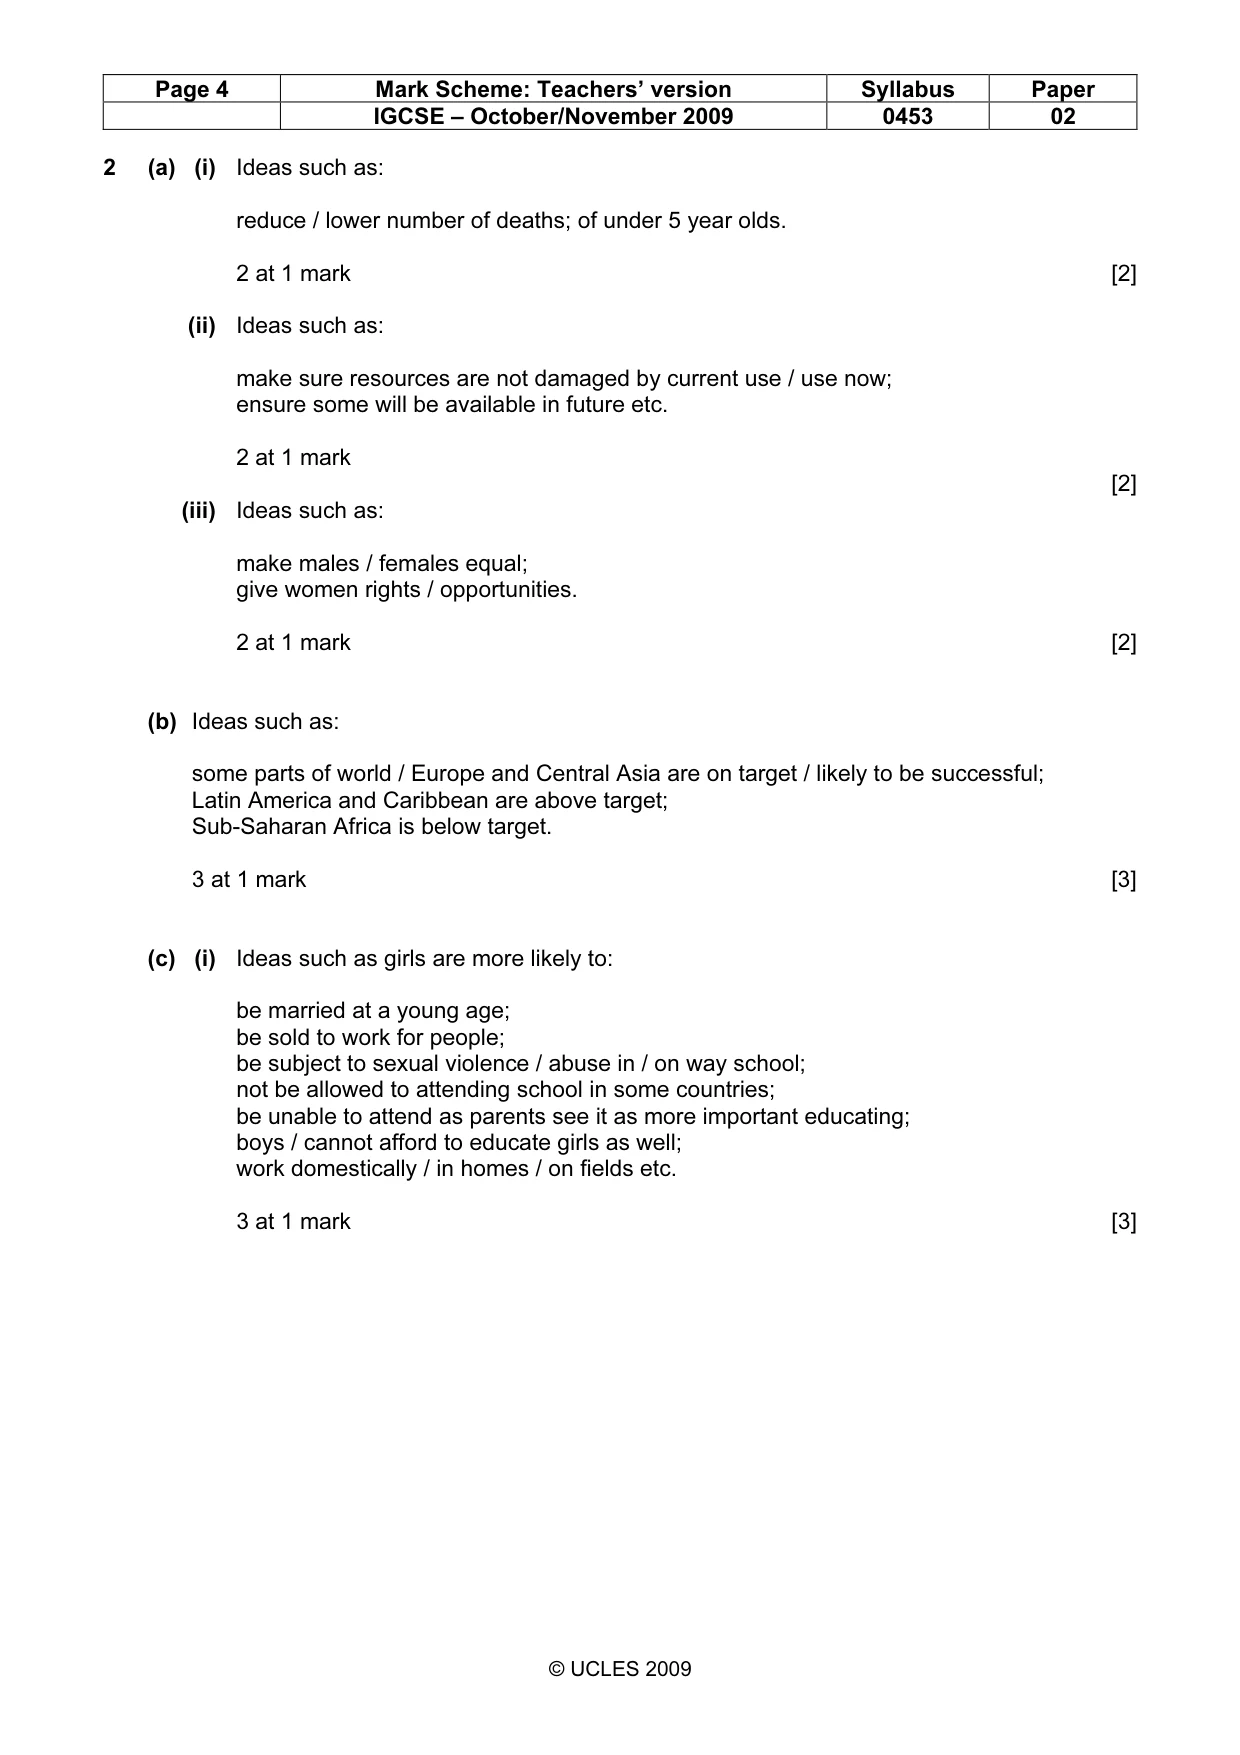
Page 4 Mark Scheme: Teachers’ version Syllabus Paper IGCSE – October/November 2009 0453 02 © UCLES 2009 2 (a) (i) Ideas such as: reduce / lower number of deaths; of under 5 year olds. 2 at 1 mark [2] (ii) Ideas such as: make sure resources are not damaged by current use / use now; ensure some will be available in future etc. 2 at 1 mark [2] (iii) Ideas such as: make males / females equal; give women rights / opportunities. 2 at 1 mark [2] (b) Ideas such as: some parts of world / Europe and Central Asia are on target / likely to be successful; Latin America and Caribbean are above target; Sub-Saharan Africa is below target. 3 at 1 mark [3] (c) (i) Ideas such as girls are more likely to: be married at a young age; be sold to work for people; be subject to sexual violence / abuse in / on way school; not be allowed to attending school in some countries; be unable to attend as parents see it as more important educating; boys / cannot afford to educate girls as well; work domestically / in homes / on fields etc. 3 at 1 mark [3]
Mark scheme, page 5
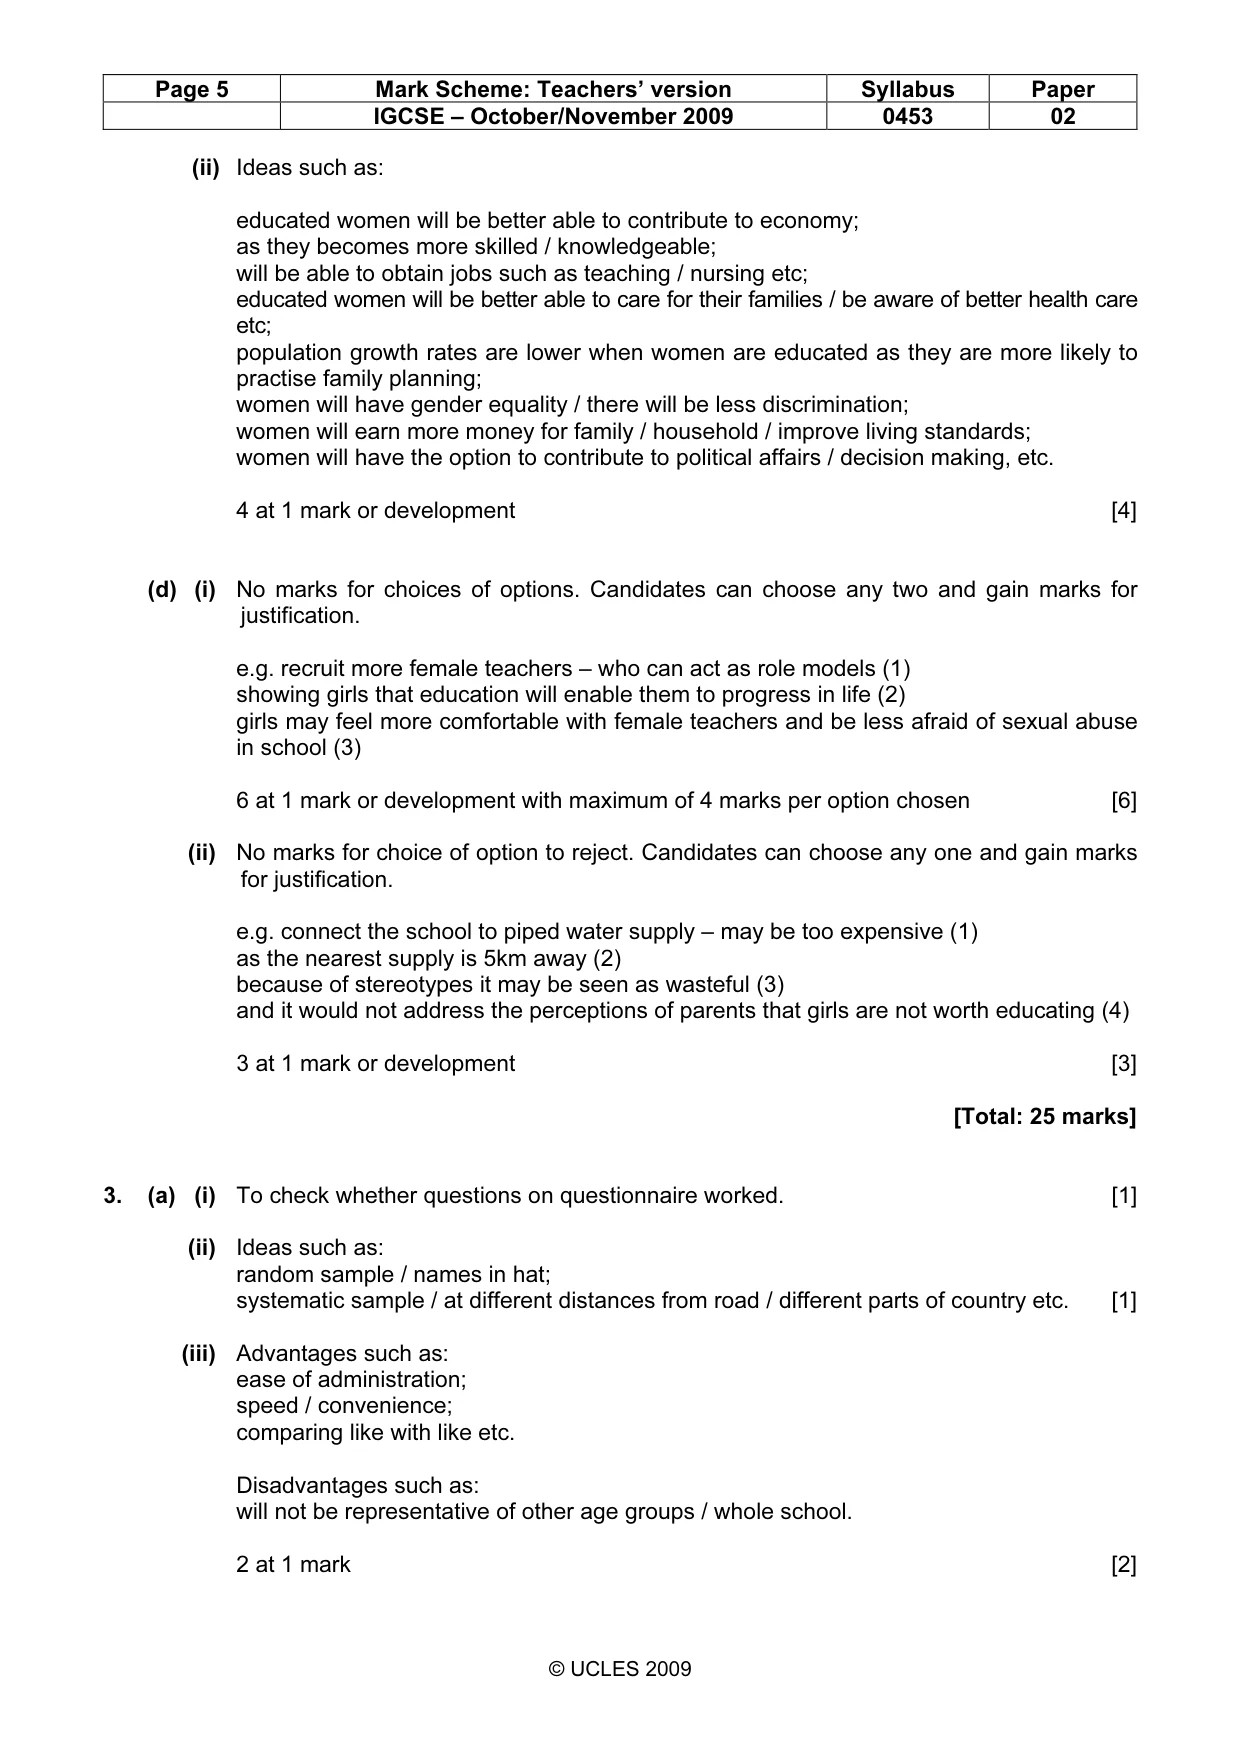
Page 5 Mark Scheme: Teachers’ version Syllabus Paper IGCSE – October/November 2009 0453 02 © UCLES 2009 (ii) Ideas such as: educated women will be better able to contribute to economy; as they becomes more skilled / knowledgeable; will be able to obtain jobs such as teaching / nursing etc; educated women will be better able to care for their families / be aware of better health care etc; population growth rates are lower when women are educated as they are more likely to practise family planning; women will have gender equality / there will be less discrimination; women will earn more money for family / household / improve living standards; women will have the option to contribute to political affairs / decision making, etc. 4 at 1 mark or development [4] (d) (i) No marks for choices of options. Candidates can choose any two and gain marks for justification. e.g. recruit more female teachers – who can act as role models (1) showing girls that education will enable them to progress in life (2) girls may feel more comfortable with female teachers and be less afraid of sexual abuse in school (3) 6 at 1 mark or development with maximum of 4 marks per option chosen [6] (ii) No marks for choice of option to reject. Candidates can choose any one and gain marks for justification. e.g. connect the school to piped water supply – may be too expensive (1) as the nearest supply is 5km away (2) because of stereotypes it may be seen as wasteful (3) and it would not address the perceptions of parents that girls are not worth educating (4) 3 at 1 mark or development [3] [Total: 25 marks] 3. (a) (i) To check whether questions on questionnaire worked. [1] (ii) Ideas such as: random sample / names in hat; systematic sample / at different distances from road / different parts of country etc. [1] (iii) Advantages such as: ease of administration; speed / convenience; comparing like with like etc. Disadvantages such as: will not be representative of other age groups / whole school. 2 at 1 mark [2]
Mark scheme, page 6
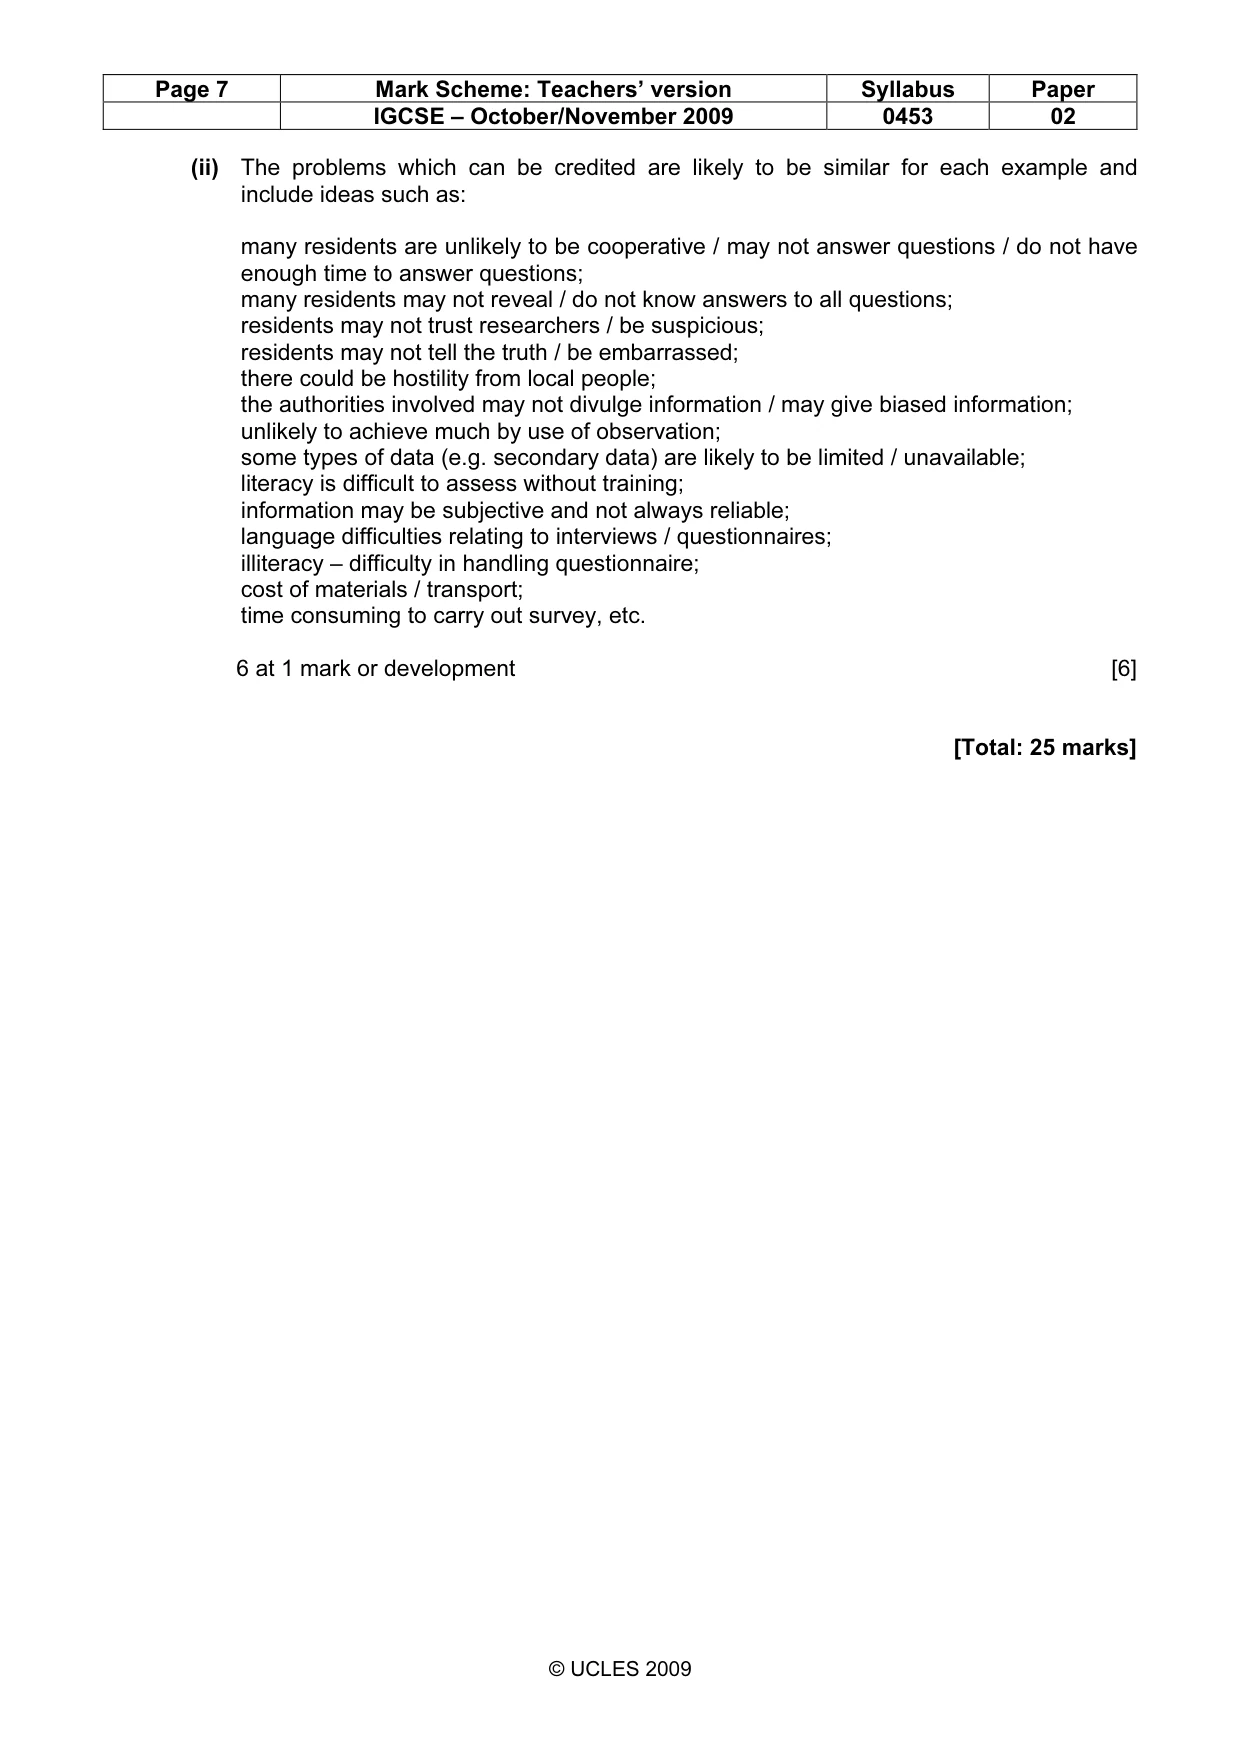
Page 6 Mark Scheme: Teachers’ version Syllabus Paper IGCSE – October/November 2009 0453 02 © UCLES 2009 (b) (i) Levels marking Level 1 (1 mark) An attempt to show how an appropriate graph can be used. Level 2 (2 marks) Information plotted graphically (bar or similar) with up to two errors (e.g. axes not labelled or drawn accurately, minor plotting errors) Level 3 (3 marks) Information plotted graphically using an appropriate graph (bar or similar) with no obvious inaccuracies in plotting or graph construction. [3] (ii) Ideas such as: literacy improves if there is a library in the village; more books are read; as students use library more in villages which have them; data to back up any of above from Fig. 9A or 9B. 4 at 1 mark [4] (c) Levels of response marking Level 1 (1 – 3 marks) Simple statements which briefly describe how the research enquiry could be carried out. e.g. use questionnaires, graph the results, write about the findings, get secondary data, look in newspapers, present clearly, interview people, etc. N.B. Do not credit simple copy of boxes in sequence of enquiry diagram. Level 2 (4 to 6 marks) More developed statements which describe how the enquiry could be carried out. e.g. ask a sample of the village`s population to complete a questionnaire about their education, draw bar graphs to show literacy levels of males and females / draw line graphs to show how levels of literacy have increased over time, test the levels of literacy by use of reading tests; obtain figures from schools / ministry of changes in levels of literacy, use newspaper articles about gender inequalities and school attendance, present a report to the local authority, make recommendations to the education ministry, etc. Level 3 (7 to 8 marks) A comprehensive account which includes more developed statements (Level 2) and covers at least 3 of the boxes in the sequence of enquiry diagram e.g. identification of enquiry question / hypotheses / collection of data / presentation and analysis. [8]
Mark scheme, page 7
Page 7 Mark Scheme: Teachers’ version Syllabus Paper IGCSE – October/November 2009 0453 02 © UCLES 2009 (ii) The problems which can be credited are likely to be similar for each example and include ideas such as: many residents are unlikely to be cooperative / may not answer questions / do not have enough time to answer questions; many residents may not reveal / do not know answers to all questions; residents may not trust researchers / be suspicious; residents may not tell the truth / be embarrassed; there could be hostility from local people; the authorities involved may not divulge information / may give biased information; unlikely to achieve much by use of observation; some types of data (e.g. secondary data) are likely to be limited / unavailable; literacy is difficult to assess without training; information may be subjective and not always reliable; language difficulties relating to interviews / questionnaires; illiteracy – difficulty in handling questionnaire; cost of materials / transport; time consuming to carry out survey, etc. 6 at 1 mark or development [6] [Total: 25 marks]
What you needed in this session
Cambridge’s own grade thresholds for 2009 Oct/Nov, Paper 2 · Variant 1. A higher threshold means an easier paper — the bar moves with how the cohort did.