Cambridge IGCSE Development Studies 0453 — 2008 Oct/Nov Paper 2 · Variant 1
0453/21/O/N/08 · 80 marks · ≈90 min
The question paper and its mark scheme, free to read here and free to download. This is Cambridge’s own paper, exactly as it was sat.
Question paper12 pages

Mark scheme6 pages
Answers below. Sit the paper first if you are practising.
Paper as text
Question paper, page 1
This document consists of 12 printed pages and 2 Inserts. SP (SM/CGW) T39734/7 © UCLES 2008 [Turn over UNIVERSITY OF CAMBRIDGE INTERNATIONAL EXAMINATIONS International General Certificate of Secondary Education READ THESE INSTRUCTIONS FIRST If you have been given an Answer Booklet, follow the instructions on the front cover of the Booklet. Write your Centre number, candidate number and name on all the work you hand in. Write in dark blue or black pen. You may use a soft pencil for any diagrams, graphs or rough working. Do not use staples, paper clips, highlighters, glue or correction fluid. Answer all the questions. You should read and study the sources before answering the questions. Insert 1 contains Photograph A for Question 2 and Insert 2 contains Fig. 8 for Question 3. At the end of the examination, fasten all your work securely together. The number of marks is given in brackets [ ] at the end of each question or part question. * 4 7 9 0 9 0 5 1 3 5 * DEVELOPMENT STUDIES 0453/02 Paper 2 October/November 2008 2 hours Additional Materials: Answer Booklet/Paper Ruler www.XtremePapers.com
Question paper, page 2
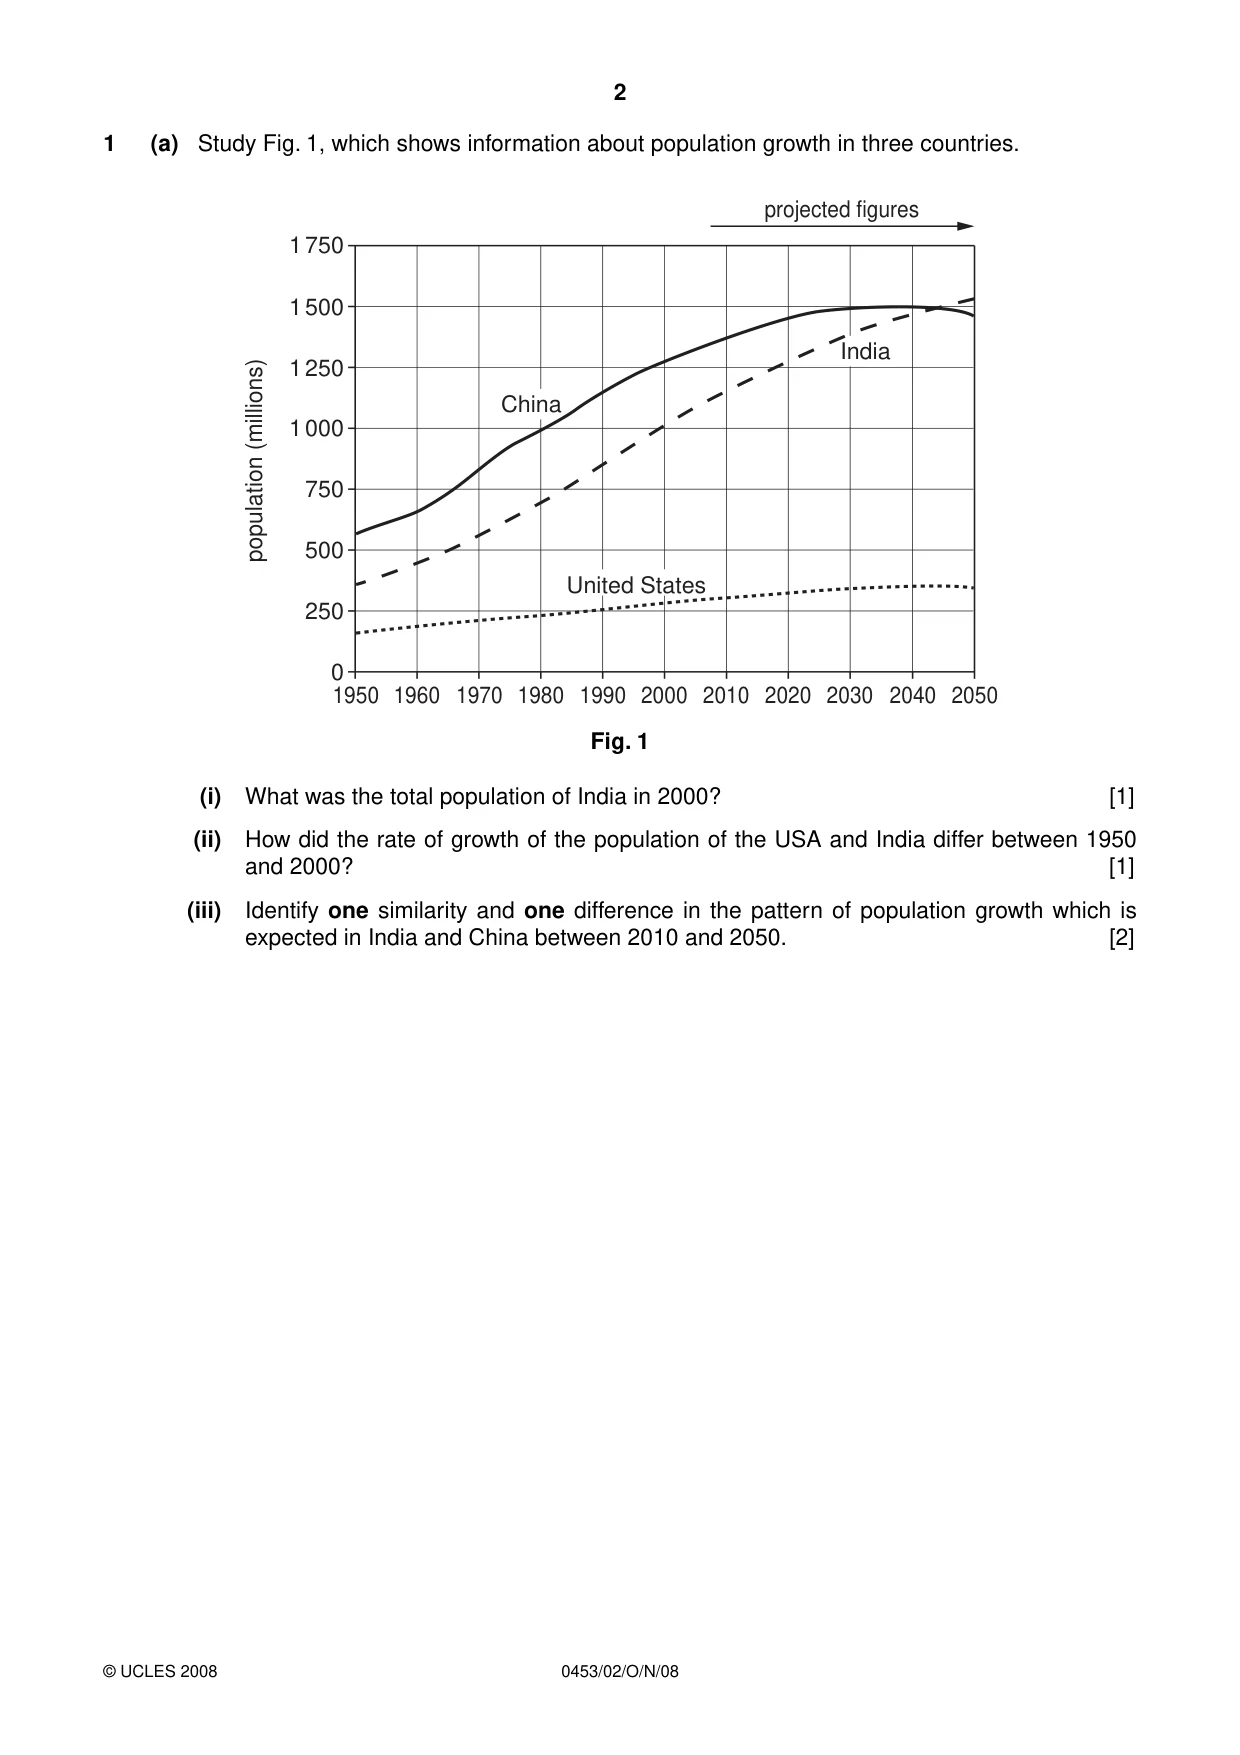
2 0453/02/O/N/08 © UCLES 2008 1 (a) Study Fig. 1, which shows information about population growth in three countries. 1 750 1 500 1 250 1 000 population (millions) 750 500 250 1950 1970 1990 2010 2030 projected figures 2050 2020 2000 1980 1960 2040 0 China India United States Fig. 1 (i) What was the total population of India in 2000? [1] (ii) How did the rate of growth of the population of the USA and India differ between 1950 and 2000? [1] (iii) Identify one similarity and one difference in the pattern of population growth which is expected in India and China between 2010 and 2050. [2]
Question paper, page 3
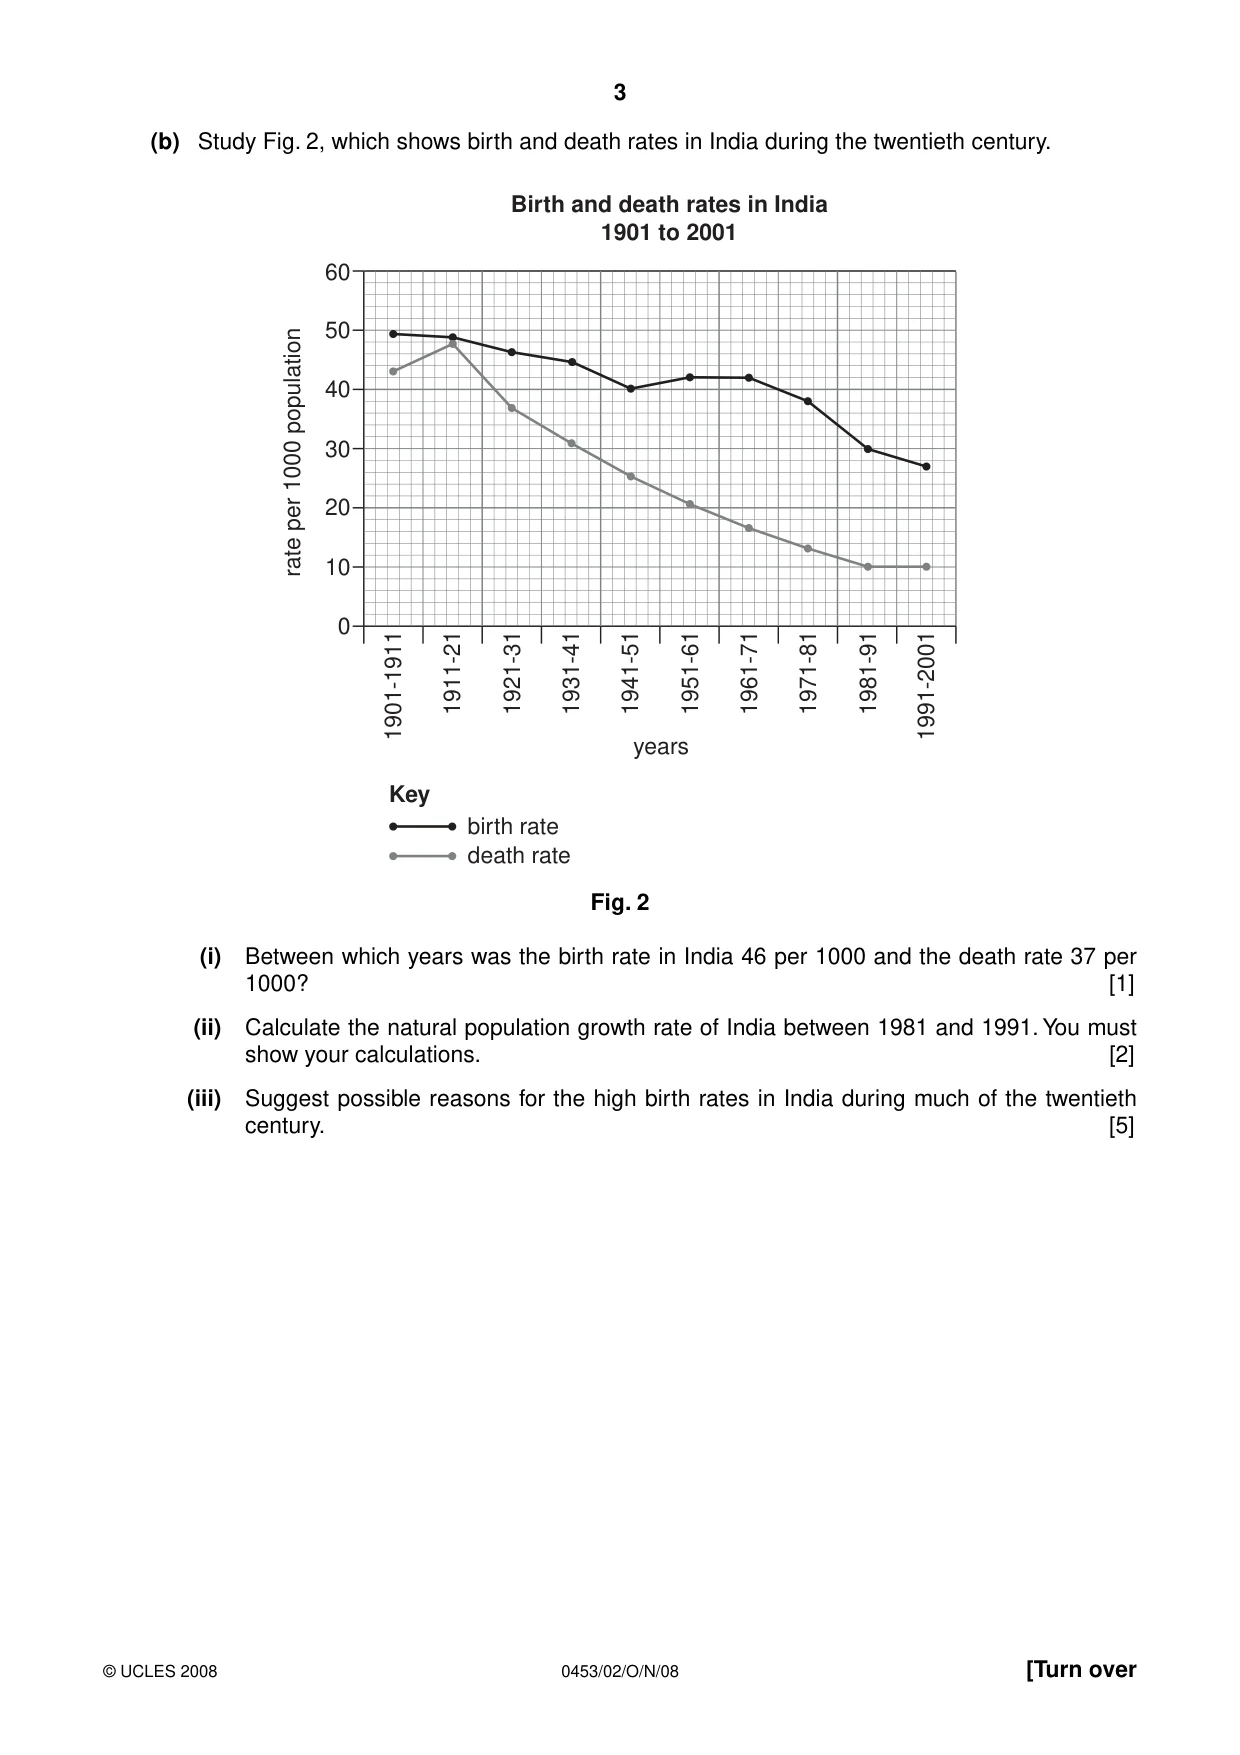
3 0453/02/O/N/08 © UCLES 2008 [Turn over (b) Study Fig. 2, which shows birth and death rates in India during the twentieth century. 1901-1911 1911-21 1921-31 1931-41 1941-51 1951-61 1961-71 1971-81 1981-91 1991-2001 0 10 death rate birth rate Key rate per 1000 population 20 years 30 40 50 60 Birth and death rates in India 1901 to 2001 Fig. 2 (i) Between which years was the birth rate in India 46 per 1000 and the death rate 37 per 1000? [1] (ii) Calculate the natural population growth rate of India between 1981 and 1991. You must show your calculations. [2] (iii) Suggest possible reasons for the high birth rates in India during much of the twentieth century. [5]
Question paper, page 4
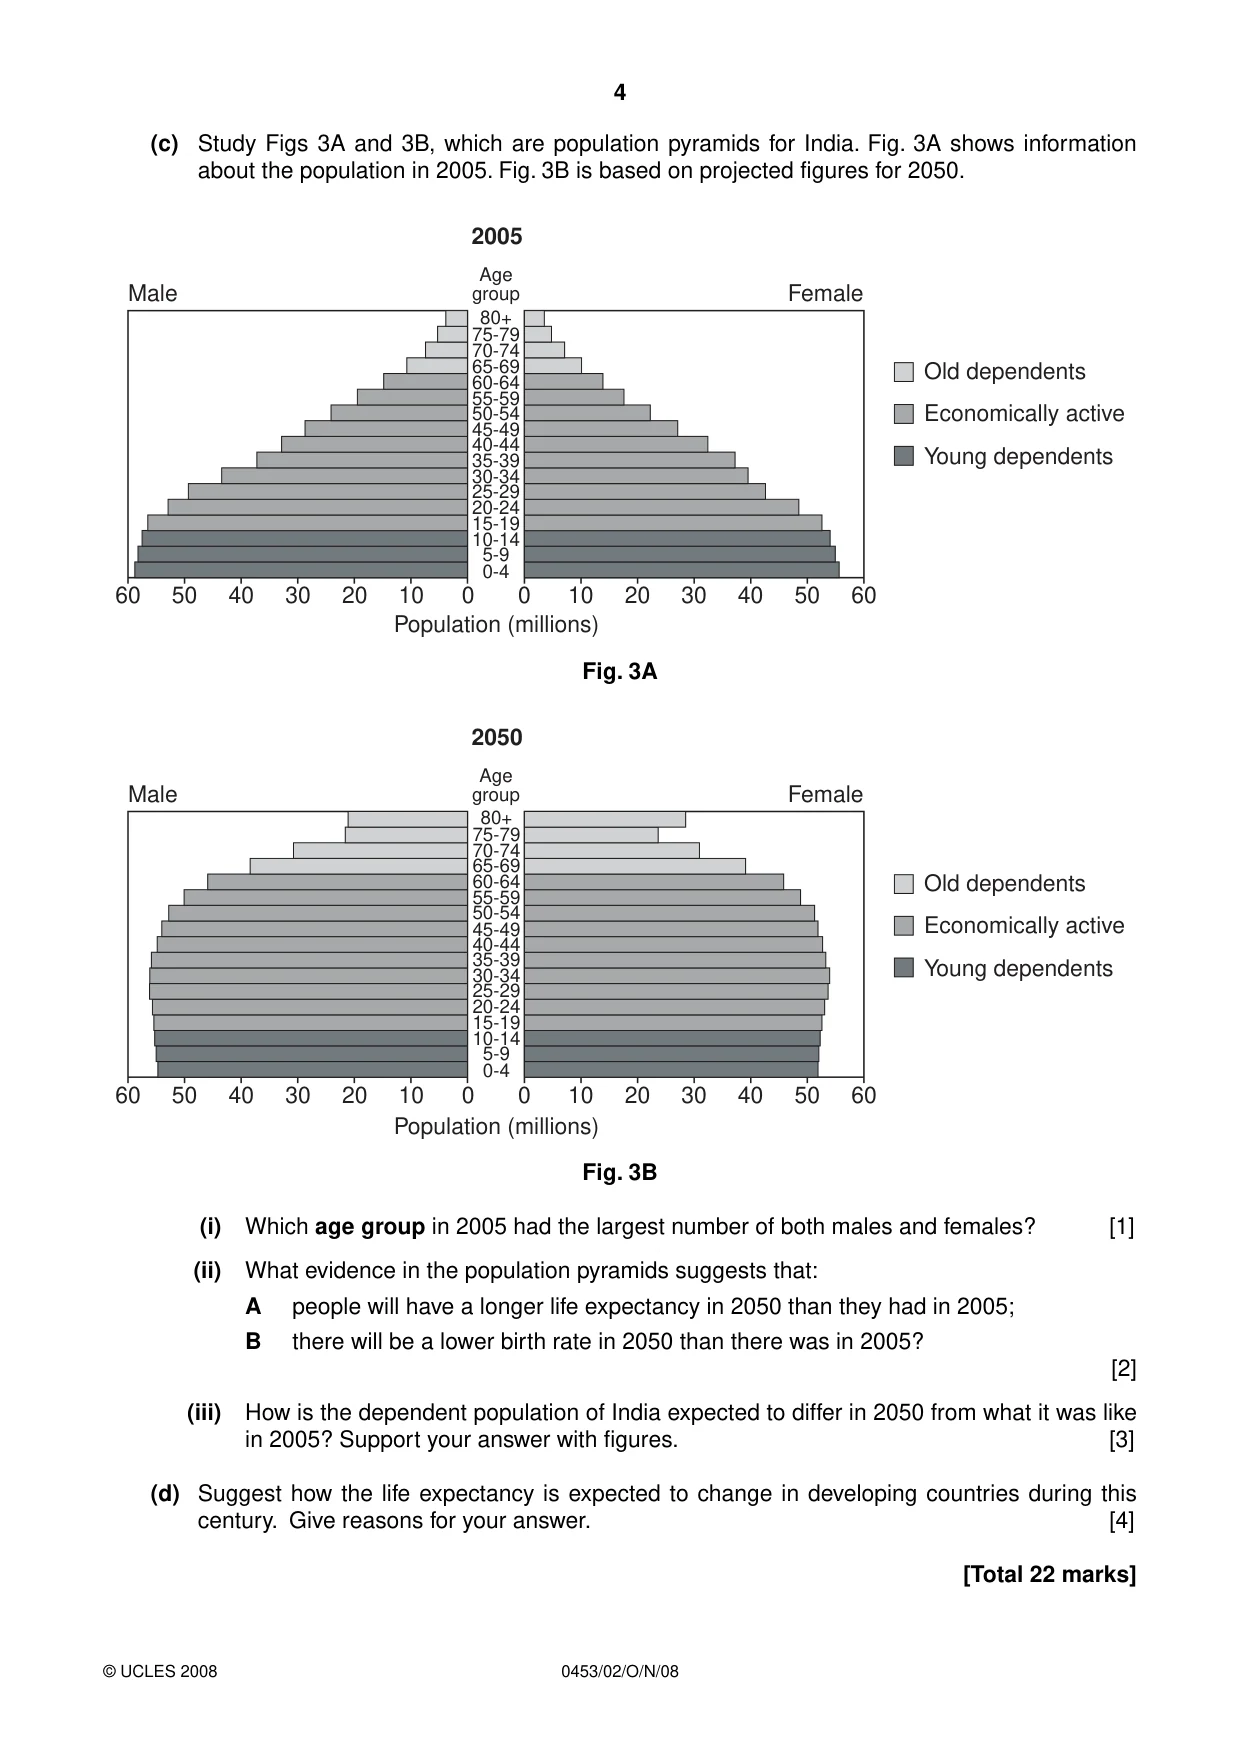
4 0453/02/O/N/08 © UCLES 2008 (c) Study Figs 3A and 3B, which are population pyramids for India. Fig. 3A shows information about the population in 2005. Fig. 3B is based on projected figures for 2050. 60 60 50 50 40 40 30 30 20 20 10 10 75-79 80+ 0-4 5-9 10-14 15-19 20-24 25-29 30-34 35-39 40-44 Age group 45-49 50-54 55-59 60-64 65-69 70-74 Population (millions) Male Young dependents Economically active Old dependents Female 0 0 2005 Fig. 3A 75-79 80+ Population (millions) Male Female 0-4 5-9 10-14 15-19 20-24 25-29 30-34 35-39 40-44 45-49 50-54 55-59 60-64 65-69 70-74 60 60 50 50 40 40 30 30 20 20 10 10 0 0 Young dependents Economically active Old dependents Age group 2050 Fig. 3B (i) Which age group in 2005 had the largest number of both males and females? [1] (ii) What evidence in the population pyramids suggests that: A people will have a longer life expectancy in 2050 than they had in 2005; B there will be a lower birth rate in 2050 than there was in 2005? [2] (iii) How is the dependent population of India expected to differ in 2050 from what it was like in 2005? Support your answer with figures. [3] (d) Suggest how the life expectancy is expected to change in developing countries during this century. Give reasons for your answer. [4] [Total 22 marks]
Question paper, page 5
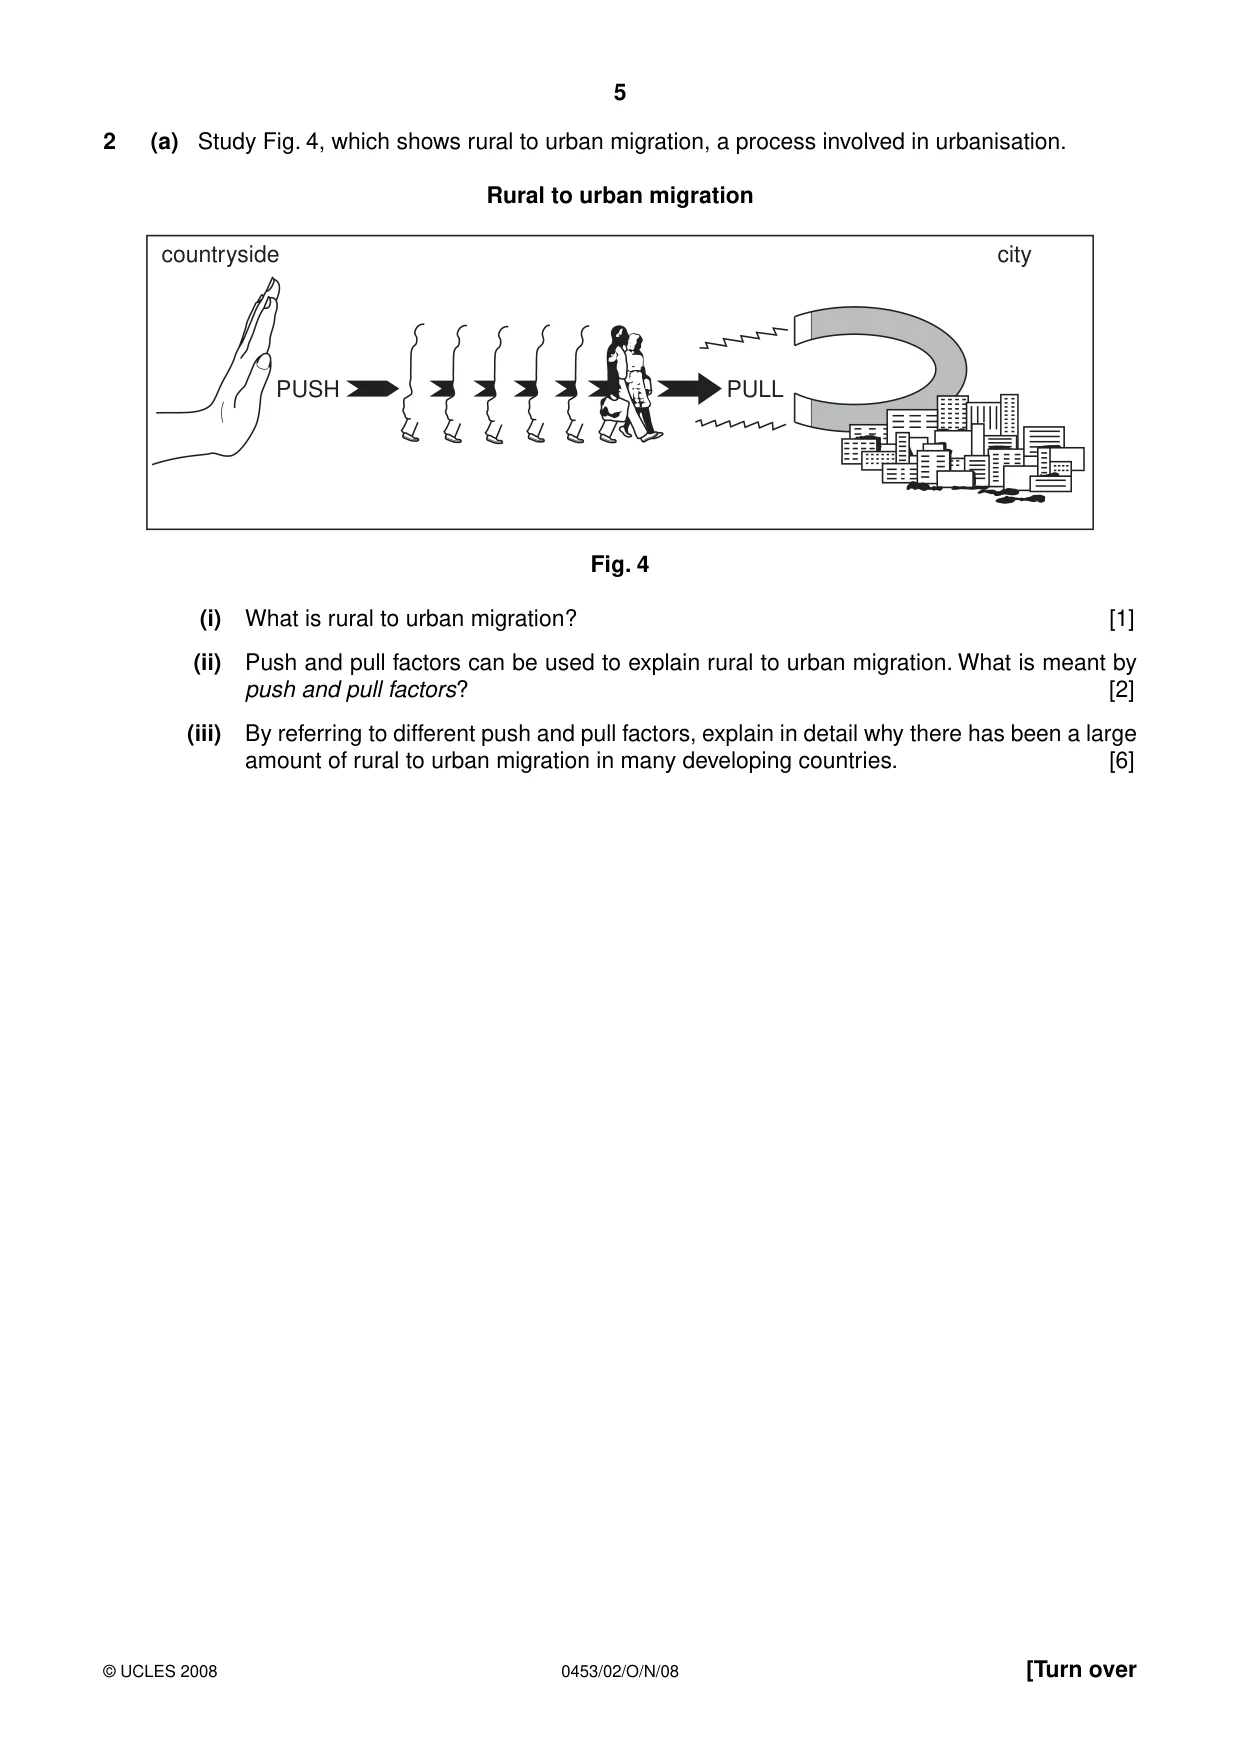
5 0453/02/O/N/08 © UCLES 2008 [Turn over 2 (a) Study Fig. 4, which shows rural to urban migration, a process involved in urbanisation. Rural to urban migration PUSH PULL countryside city Fig. 4 (i) What is rural to urban migration? [1] (ii) Push and pull factors can be used to explain rural to urban migration. What is meant by push and pull factors? [2] (iii) By referring to different push and pull factors, explain in detail why there has been a large amount of rural to urban migration in many developing countries. [6]
Question paper, page 6
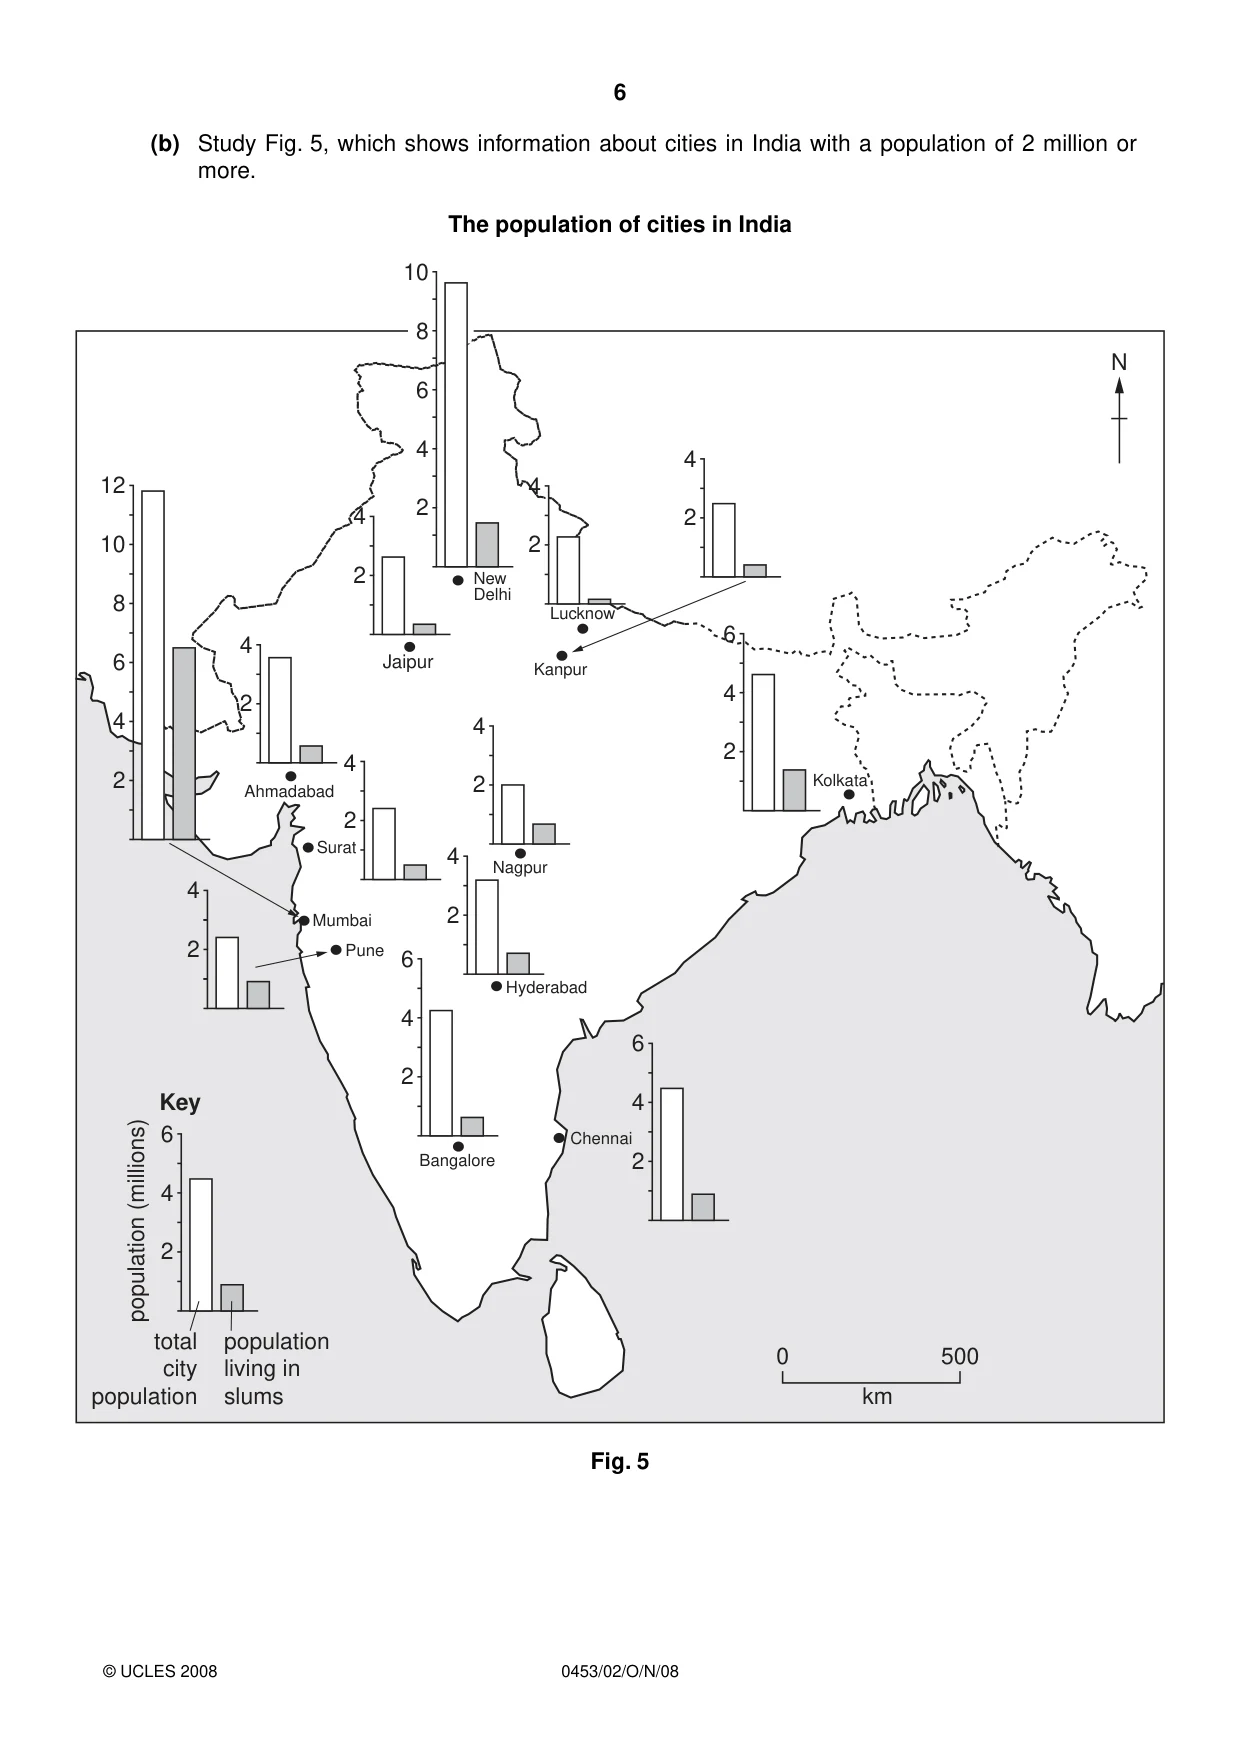
6 0453/02/O/N/08 © UCLES 2008 (b) Study Fig. 5, which shows information about cities in India with a population of 2 million or more. The population of cities in India Jaipur Lucknow Kanpur Ahmadabad Kolkata Nagpur Hyderabad Bangalore New Delhi Pune Chennai 0 500 km Mumbai Surat 2 4 4 2 4 2 4 N 2 4 2 2 4 2 4 2 4 6 2 4 6 8 10 2 4 6 8 10 12 2 4 6 2 population (millions) 4 6 Key total city population population living in slums 2 4 6 2 4 Fig. 5
Question paper, page 7
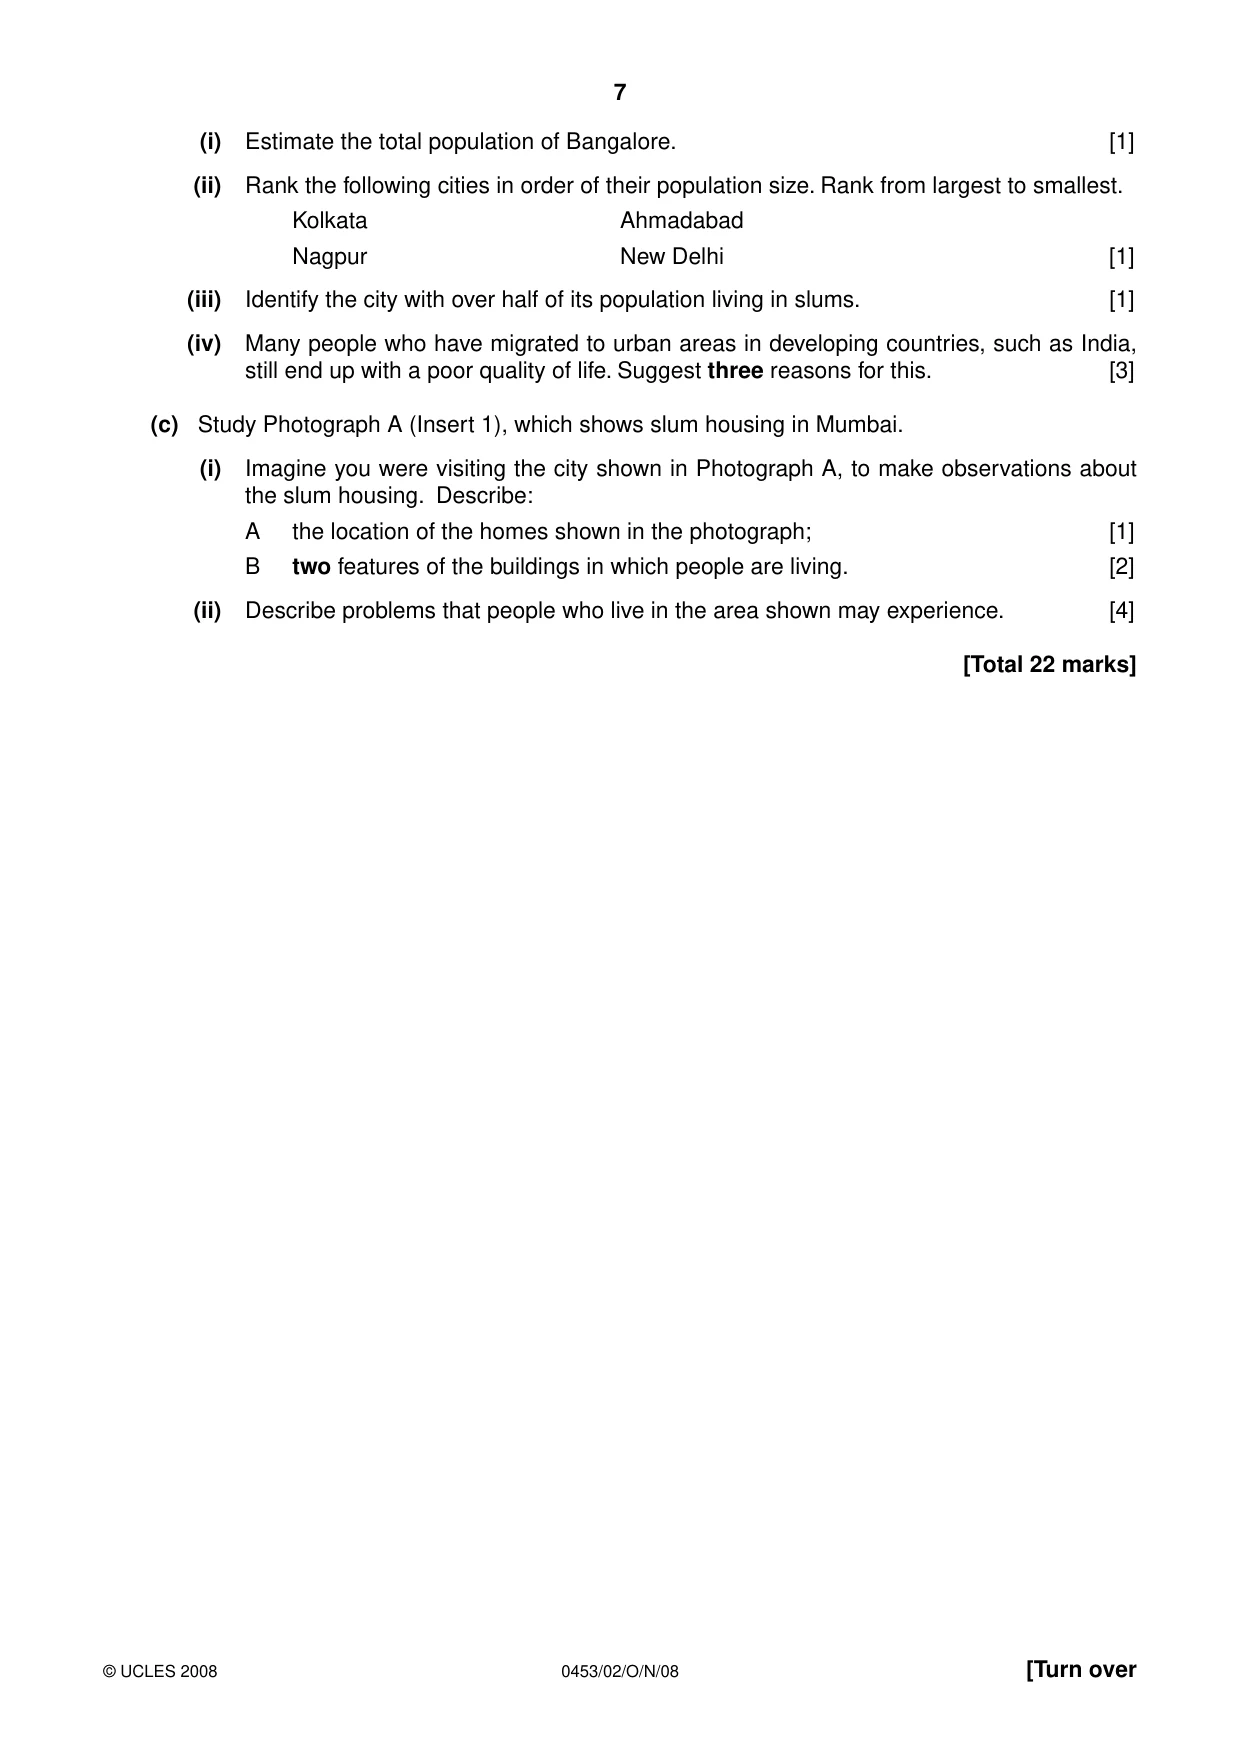
7 0453/02/O/N/08 © UCLES 2008 [Turn over (i) Estimate the total population of Bangalore. [1] (ii) Rank the following cities in order of their population size. Rank from largest to smallest. Kolkata Ahmadabad Nagpur New Delhi [1] (iii) Identify the city with over half of its population living in slums. [1] (iv) Many people who have migrated to urban areas in developing countries, such as India, still end up with a poor quality of life. Suggest three reasons for this. [3] (c) Study Photograph A (Insert 1), which shows slum housing in Mumbai. (i) Imagine you were visiting the city shown in Photograph A, to make observations about the slum housing. Describe: A the location of the homes shown in the photograph; [1] B two features of the buildings in which people are living. [2] (ii) Describe problems that people who live in the area shown may experience. [4] [Total 22 marks]
Question paper, page 8
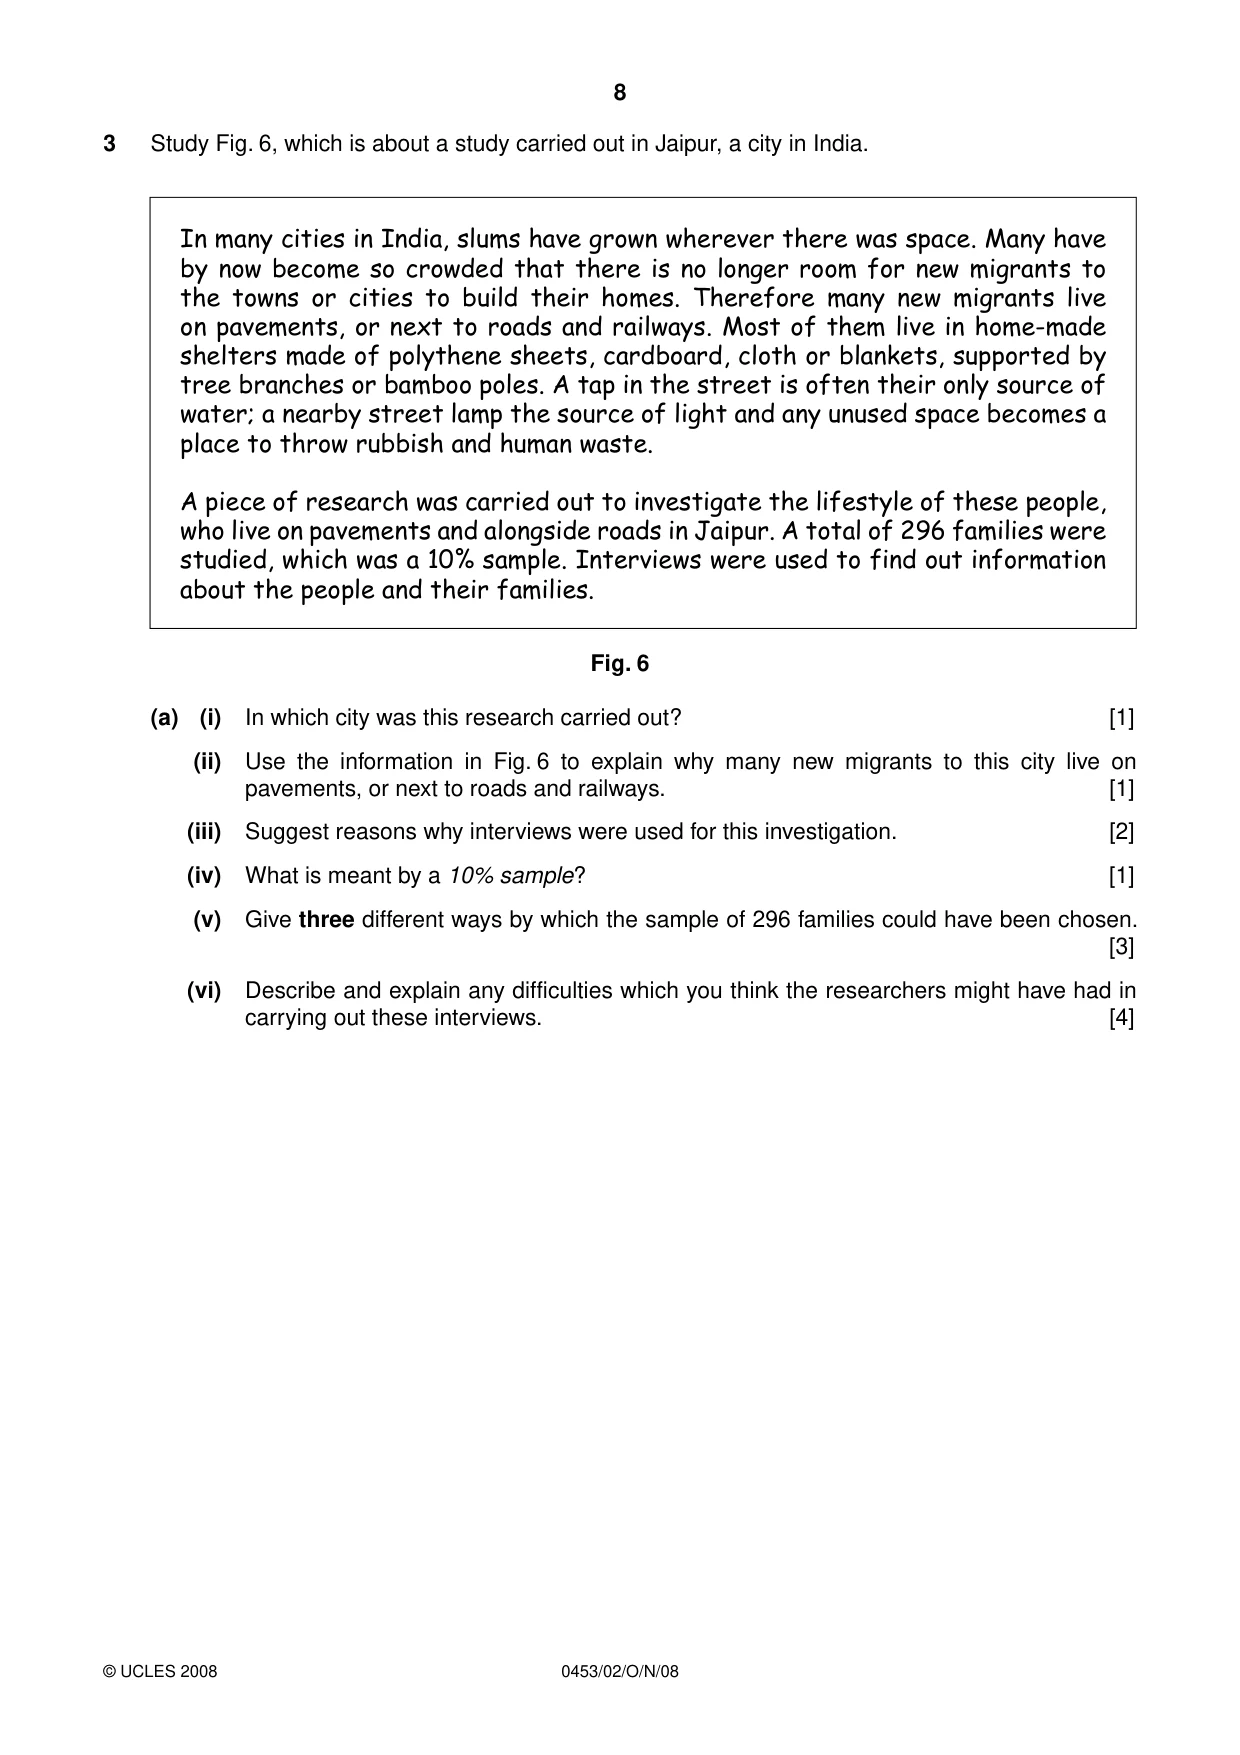
8 0453/02/O/N/08 © UCLES 2008 3 Study Fig. 6, which is about a study carried out in Jaipur, a city in India. In many cities in India, slums have grown wherever there was space. Many have by now become so crowded that there is no longer room for new migrants to the towns or cities to build their homes. Therefore many new migrants live on pavements, or next to roads and railways. Most of them live in home-made shelters made of polythene sheets, cardboard, cloth or blankets, supported by tree branches or bamboo poles. A tap in the street is often their only source of water; a nearby street lamp the source of light and any unused space becomes a place to throw rubbish and human waste. A piece of research was carried out to investigate the lifestyle of these people, who live on pavements and alongside roads in Jaipur. A total of 296 families were studied, which was a 10% sample. Interviews were used to find out information about the people and their families. Fig. 6 (a) (i) In which city was this research carried out? [1] (ii) Use the information in Fig. 6 to explain why many new migrants to this city live on pavements, or next to roads and railways. [1] (iii) Suggest reasons why interviews were used for this investigation. [2] (iv) What is meant by a 10% sample? [1] (v) Give three different ways by which the sample of 296 families could have been chosen. [3] (vi) Describe and explain any difficulties which you think the researchers might have had in carrying out these interviews. [4]
Question paper, page 9
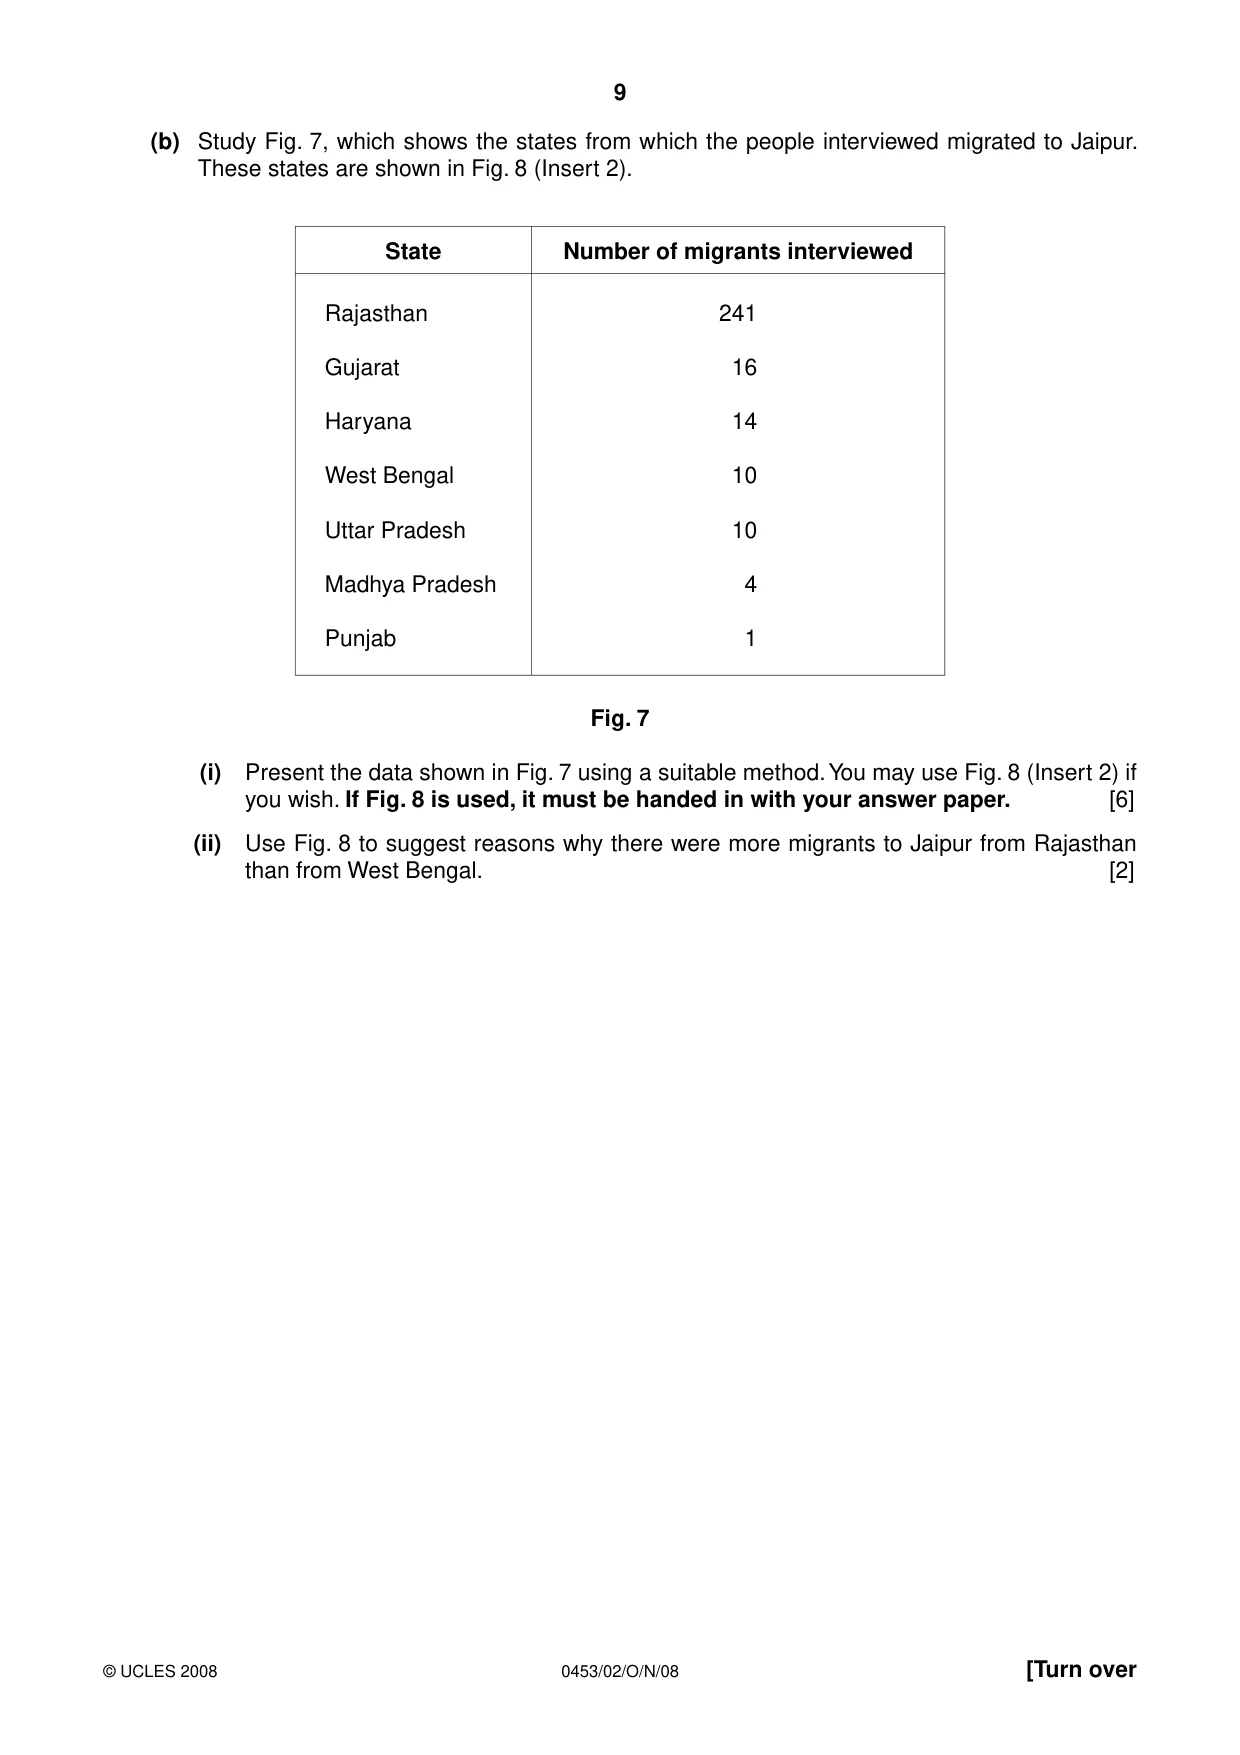
9 0453/02/O/N/08 © UCLES 2008 [Turn over (b) Study Fig. 7, which shows the states from which the people interviewed migrated to Jaipur. These states are shown in Fig. 8 (Insert 2). State Number of migrants interviewed Rajasthan Gujarat Haryana West Bengal Uttar Pradesh Madhya Pradesh Punjab 241 16 14 10 10 4 1 Fig. 7 (i) Present the data shown in Fig. 7 using a suitable method. You may use Fig. 8 (Insert 2) if you wish. If Fig. 8 is used, it must be handed in with your answer paper. [6] (ii) Use Fig. 8 to suggest reasons why there were more migrants to Jaipur from Rajasthan than from West Bengal. [2]
Question paper, page 10
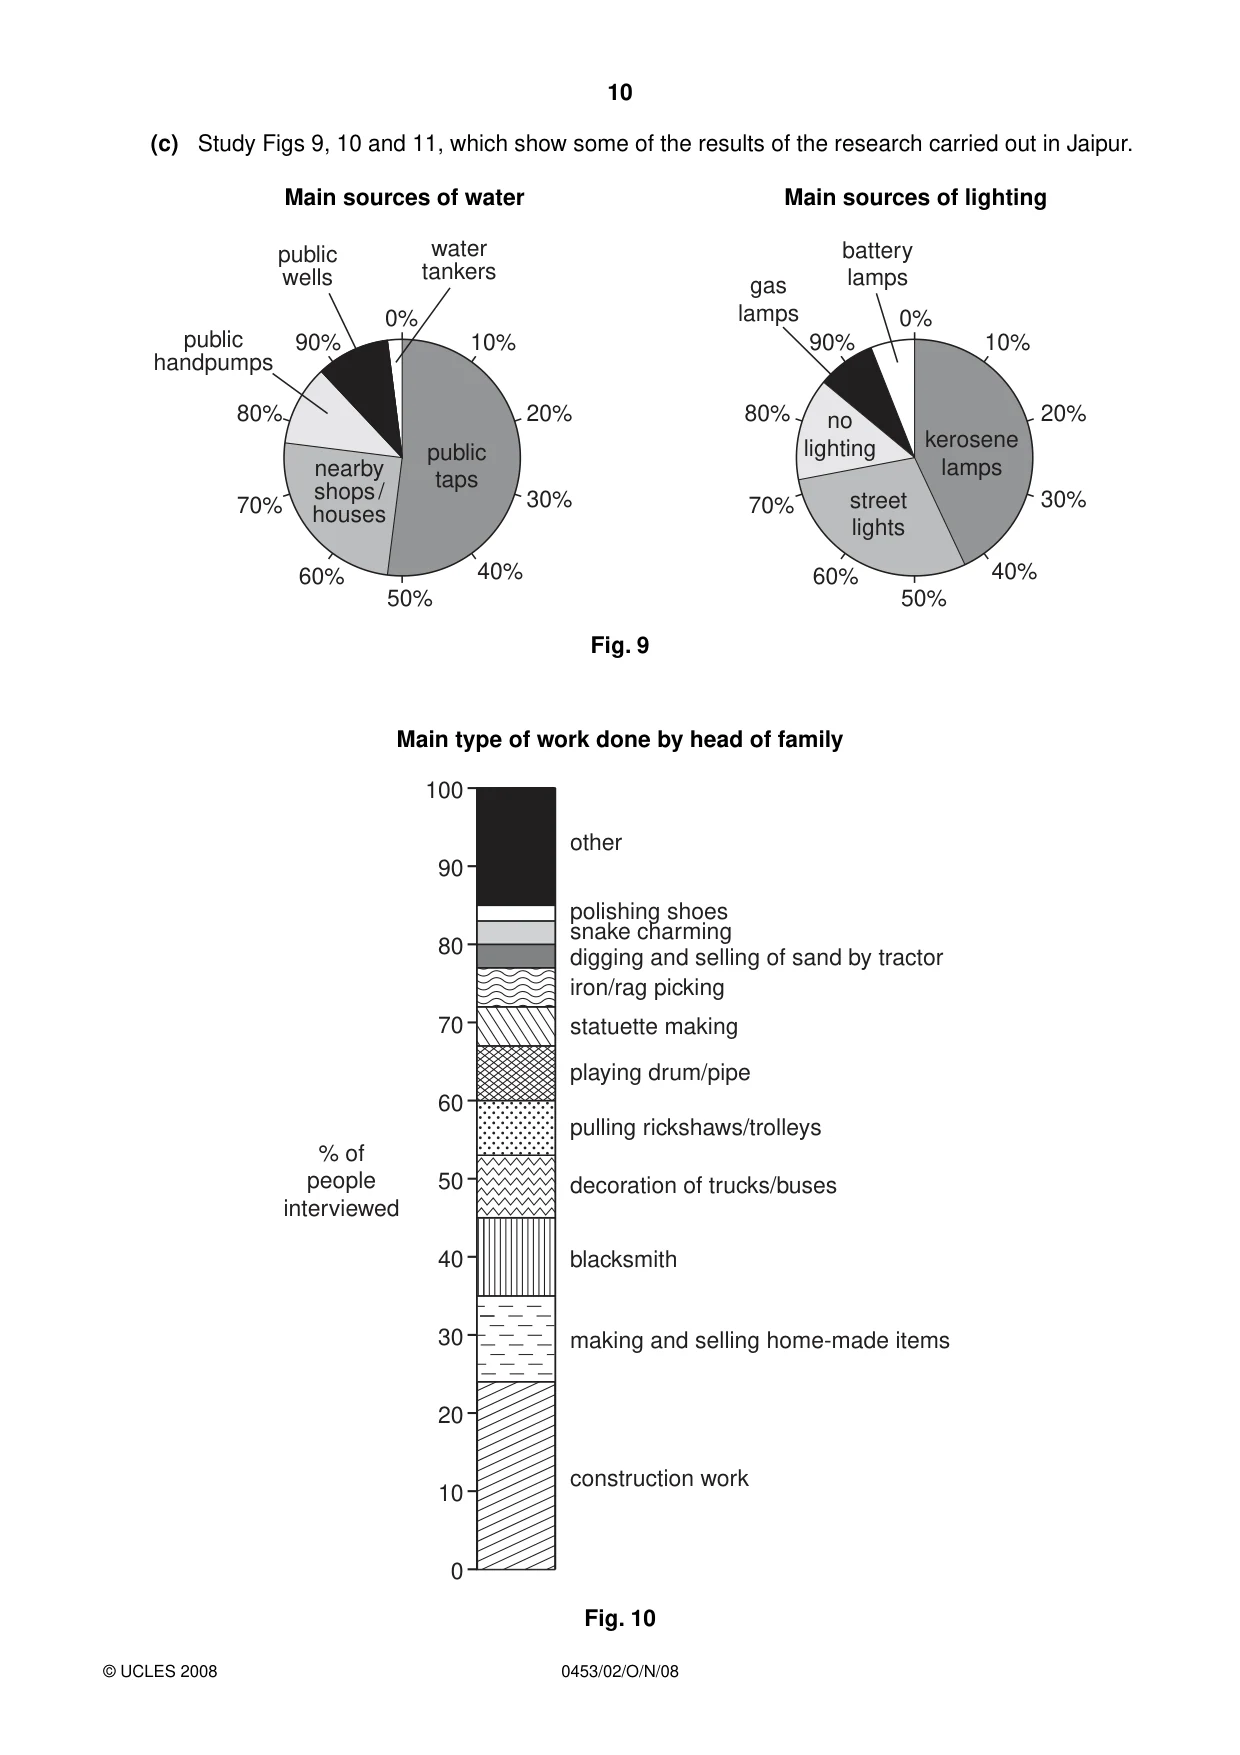
10 0453/02/O/N/08 © UCLES 2008 (c) Study Figs 9, 10 and 11, which show some of the results of the research carried out in Jaipur. Main sources of water Main sources of lighting 0% 10% 20% 30% public taps kerosene lamps street lights no lighting gas lamps battery lamps nearby shops / houses public handpumps public wells water tankers 40% 50% 60% 70% 80% 90% 0% 10% 20% 30% 40% 50% 60% 70% 80% 90% Fig. 9 Main type of work done by head of family 10 0 20 30 40 50 60 70 80 90 100 construction work making and selling home-made items blacksmith % of people interviewed decoration of trucks/buses pulling rickshaws/trolleys playing drum/pipe statuette making iron/rag picking digging and selling of sand by tractor snake charming polishing shoes other Fig. 10
Question paper, page 11
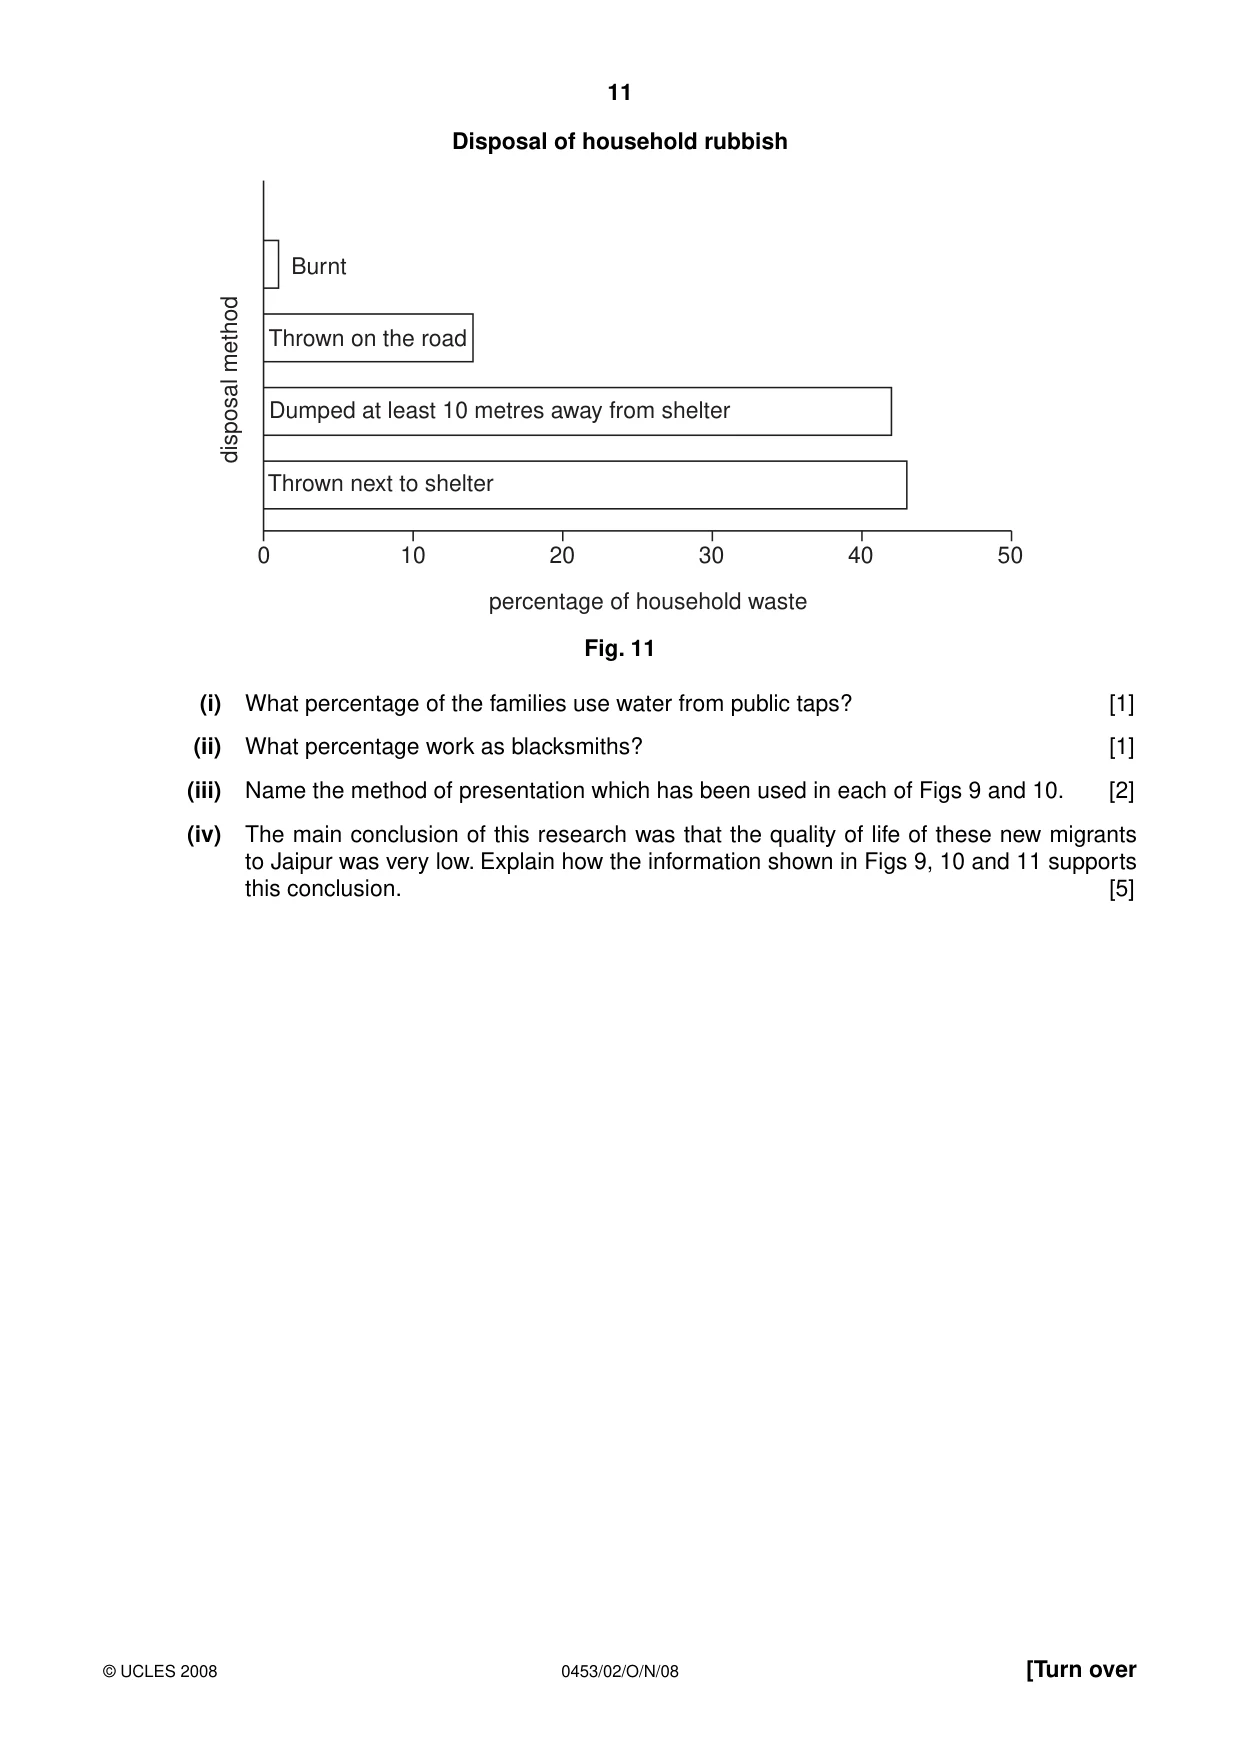
11 0453/02/O/N/08 Disposal of household rubbish Thrown next to shelter Thrown on the road Burnt Dumped at least 10 metres away from shelter 0 10 20 30 percentage of household waste disposal method 40 50 Fig. 11 (i) What percentage of the families use water from public taps? [1] (ii) What percentage work as blacksmiths? [1] (iii) Name the method of presentation which has been used in each of Figs 9 and 10. [2] (iv) The main conclusion of this research was that the quality of life of these new migrants to Jaipur was very low. Explain how the information shown in Figs 9, 10 and 11 supports this conclusion. [5] [Turn over © UCLES 2008
Question paper, page 12
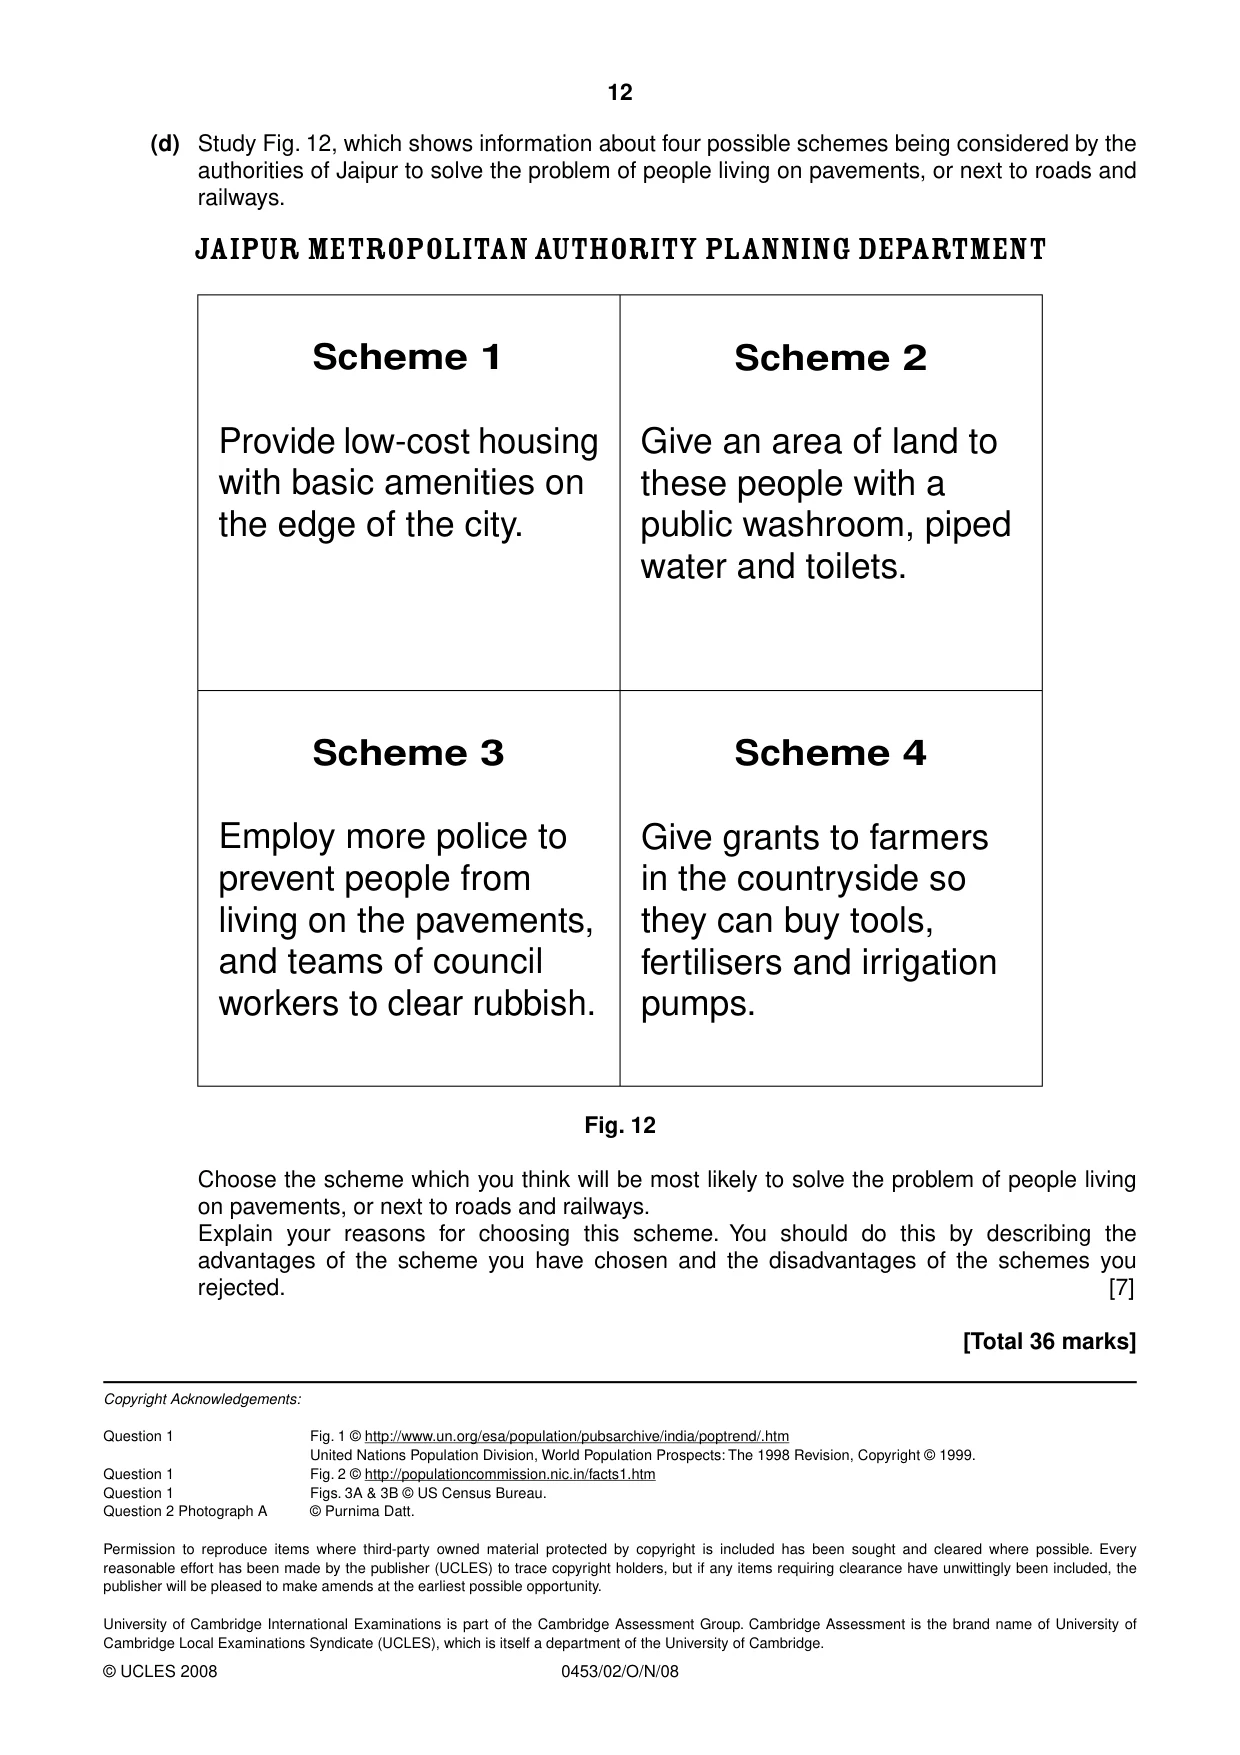
12 0453/02/O/N/08 (d) Study Fig. 12, which shows information about four possible schemes being considered by the authorities of Jaipur to solve the problem of people living on pavements, or next to roads and railways. JAIPUR METROPOLITAN AUTHORITY PLANNING DEPARTMENT Scheme 1 Provide low-cost housing with basic amenities on the edge of the city. Scheme 2 Give an area of land to these people with a public washroom, piped water and toilets. Scheme 3 Employ more police to prevent people from living on the pavements, and teams of council workers to clear rubbish. Scheme 4 Give grants to farmers in the countryside so they can buy tools, fertilisers and irrigation pumps. Fig. 12 Choose the scheme which you think will be most likely to solve the problem of people living on pavements, or next to roads and railways. Explain your reasons for choosing this scheme. You should do this by describing the advantages of the scheme you have chosen and the disadvantages of the schemes you rejected. [7] [Total 36 marks] Copyright Acknowledgements: Question 1 Fig. 1 © http://www.un.org/esa/population/pubsarchive/india/poptrend/.htm United Nations Population Division, World Population Prospects: The 1998 Revision, Copyright © 1999. Question 1 Fig. 2 © http://populationcommission.nic.in/facts1.htm Question 1 Figs. 3A & 3B © US Census Bureau. Question 2 Photograph A © Purnima Datt. Permission to reproduce items where third-party owned material protected by copyright is included has been sought and cleared where possible. Every reasonable effort has been made by the publisher (UCLES) to trace copyright holders, but if any items requiring clearance have unwittingly been included, the publisher will be pleased to make amends at the earliest possible opportunity. University of Cambridge International Examinations is part of the Cambridge Assessment Group. Cambridge Assessment is the brand name of University of Cambridge Local Examinations Syndicate (UCLES), which is itself a department of the University of Cambridge. © UCLES 2008
Mark scheme, page 1
UNIVERSITY OF CAMBRIDGE INTERNATIONAL EXAMINATIONS International General Certificate of Secondary Education MARK SCHEME for the October/November 2008 question paper 0453 DEVELOPMENT STUDIES 0453/02 Paper 2, maximum raw mark 80 This mark scheme is published as an aid to teachers and candidates, to indicate the requirements of the examination. It shows the basis on which Examiners were instructed to award marks. It does not indicate the details of the discussions that took place at an Examiners’ meeting before marking began. All Examiners are instructed that alternative correct answers and unexpected approaches in candidates’ scripts must be given marks that fairly reflect the relevant knowledge and skills demonstrated. Mark schemes must be read in conjunction with the question papers and the report on the examination. • CIE will not enter into discussions or correspondence in connection with these mark schemes. CIE is publishing the mark schemes for the October/November 2008 question papers for most IGCSE, GCE Advanced Level and Advanced Subsidiary Level syllabuses and some Ordinary Level syllabuses. www.XtremePapers.com
Mark scheme, page 2
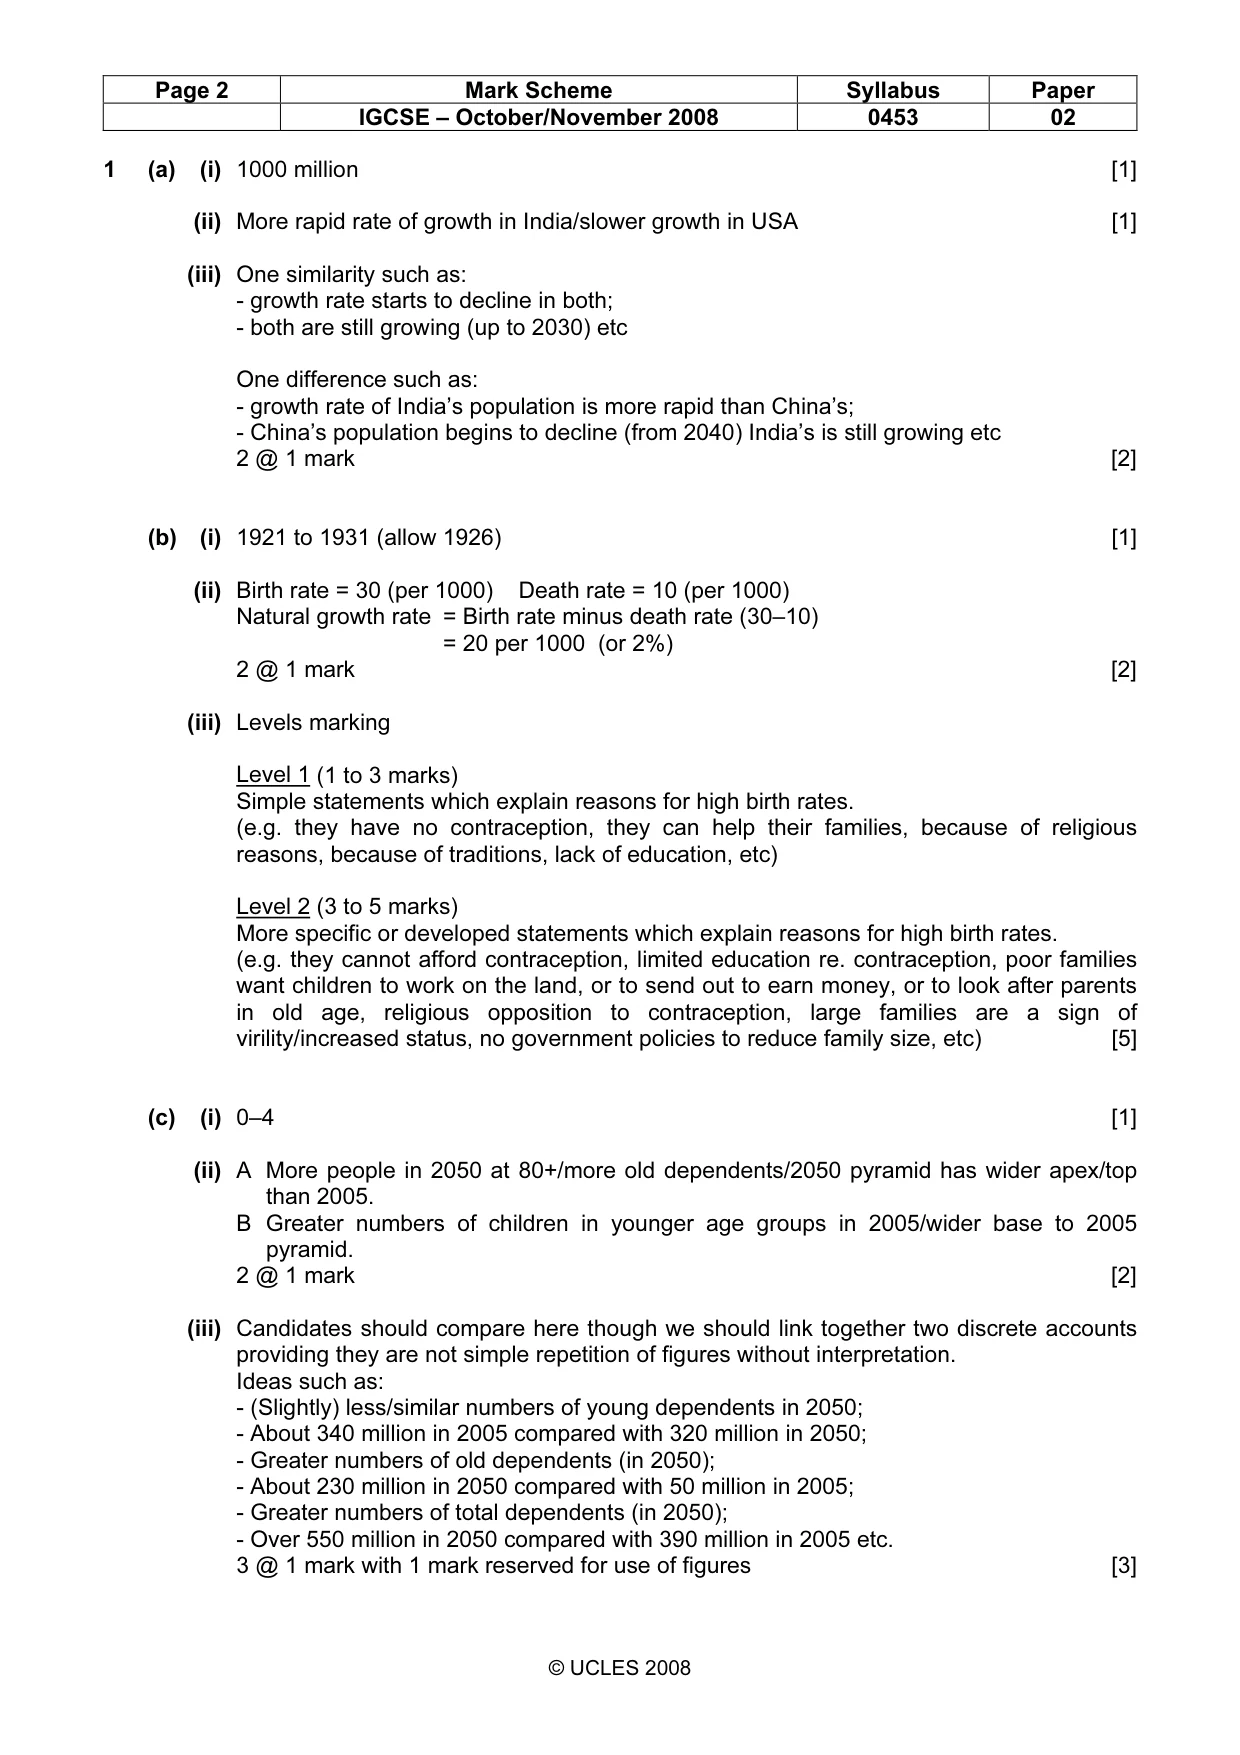
Page 2 Mark Scheme Syllabus Paper IGCSE – October/November 2008 0453 02 © UCLES 2008 1 (a) (i) 1000 million [1] (ii) More rapid rate of growth in India/slower growth in USA [1] (iii) One similarity such as: - growth rate starts to decline in both; - both are still growing (up to 2030) etc One difference such as: - growth rate of India’s population is more rapid than China’s; - China’s population begins to decline (from 2040) India’s is still growing etc 2 @ 1 mark [2] (b) (i) 1921 to 1931 (allow 1926) [1] (ii) Birth rate = 30 (per 1000) Death rate = 10 (per 1000) Natural growth rate = Birth rate minus death rate (30–10) = 20 per 1000 (or 2%) 2 @ 1 mark [2] (iii) Levels marking Level 1 (1 to 3 marks) Simple statements which explain reasons for high birth rates. (e.g. they have no contraception, they can help their families, because of religious reasons, because of traditions, lack of education, etc) Level 2 (3 to 5 marks) More specific or developed statements which explain reasons for high birth rates. (e.g. they cannot afford contraception, limited education re. contraception, poor families want children to work on the land, or to send out to earn money, or to look after parents in old age, religious opposition to contraception, large families are a sign of virility/increased status, no government policies to reduce family size, etc) [5] (c) (i) 0–4 [1] (ii) A More people in 2050 at 80+/more old dependents/2050 pyramid has wider apex/top than 2005. B Greater numbers of children in younger age groups in 2005/wider base to 2005 pyramid. 2 @ 1 mark [2] (iii) Candidates should compare here though we should link together two discrete accounts providing they are not simple repetition of figures without interpretation. Ideas such as: - (Slightly) less/similar numbers of young dependents in 2050; - About 340 million in 2005 compared with 320 million in 2050; - Greater numbers of old dependents (in 2050); - About 230 million in 2050 compared with 50 million in 2005; - Greater numbers of total dependents (in 2050); - Over 550 million in 2050 compared with 390 million in 2005 etc. 3 @ 1 mark with 1 mark reserved for use of figures [3]
Mark scheme, page 3
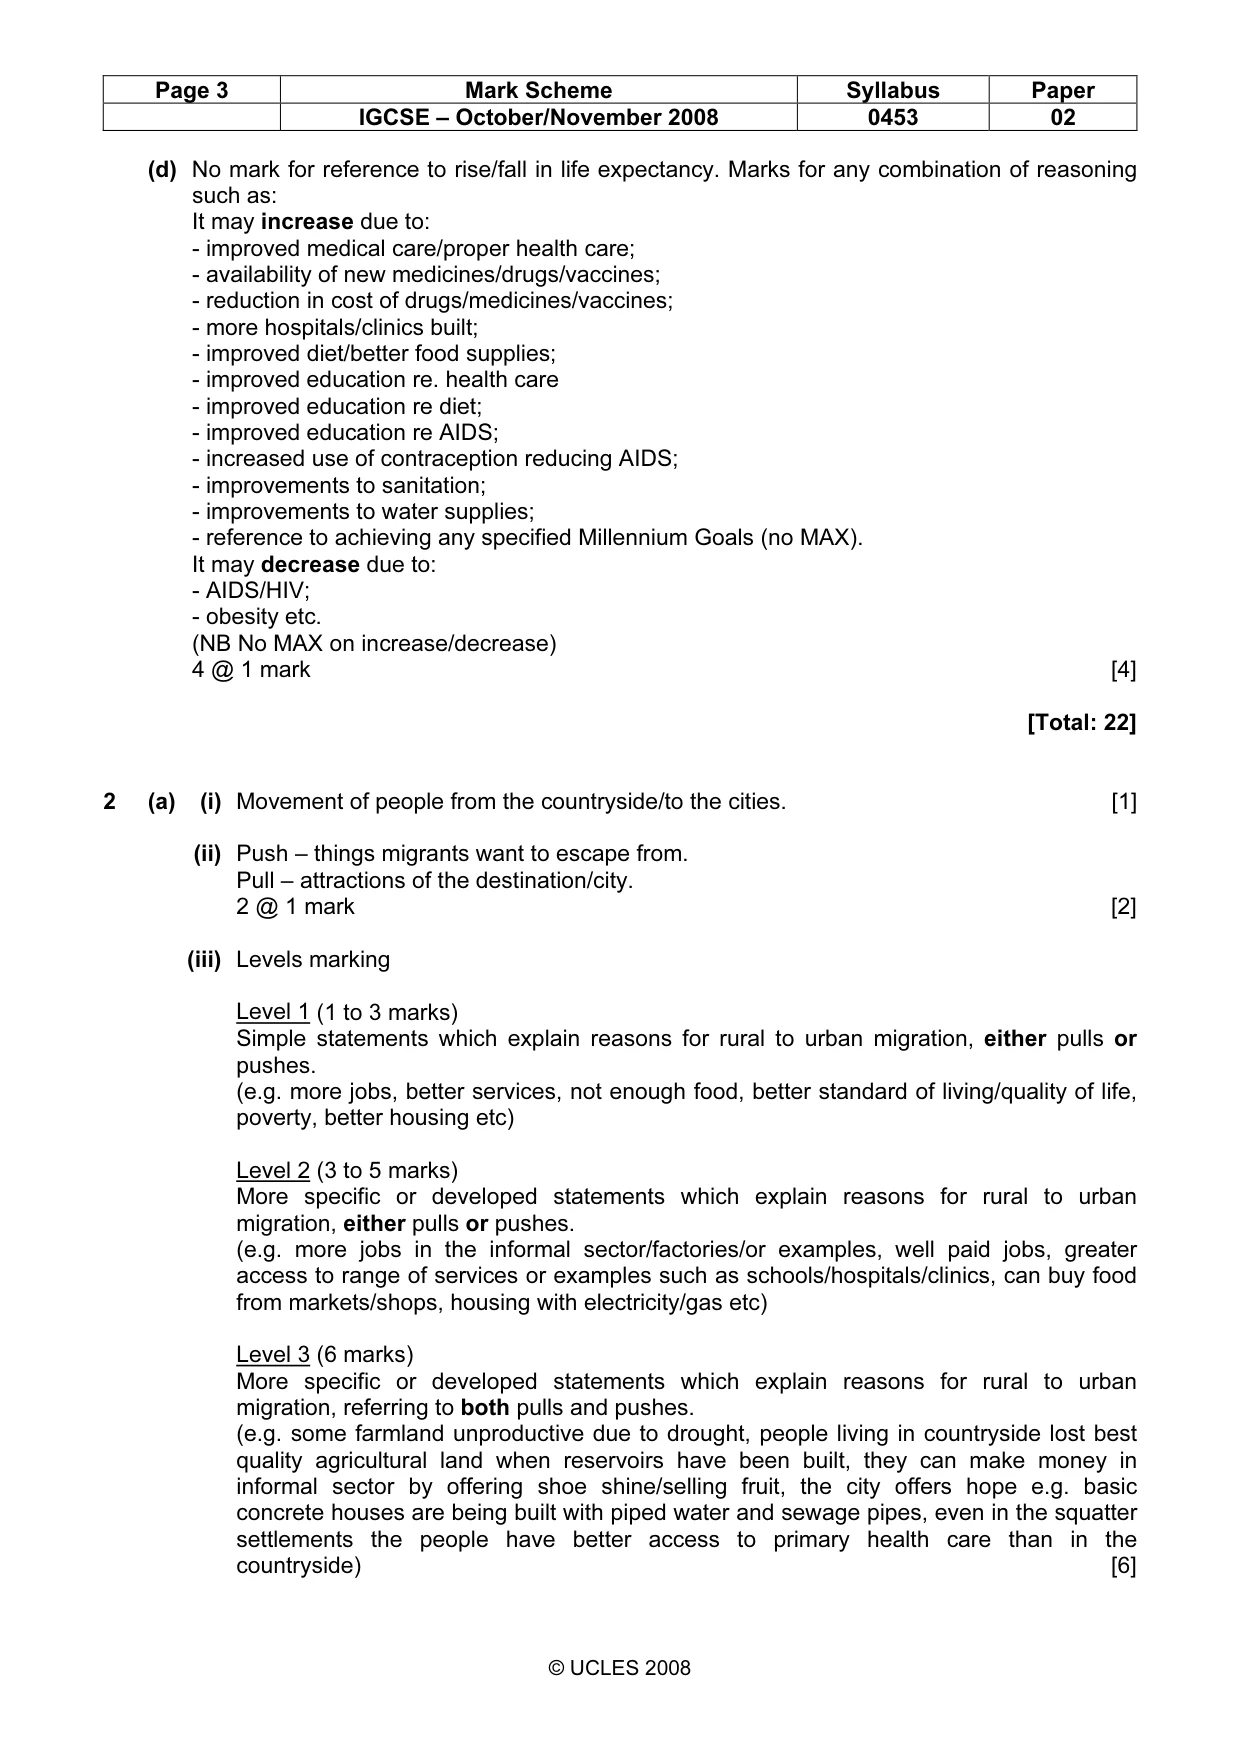
Page 3 Mark Scheme Syllabus Paper IGCSE – October/November 2008 0453 02 © UCLES 2008 (d) No mark for reference to rise/fall in life expectancy. Marks for any combination of reasoning such as: It may increase due to: - improved medical care/proper health care; - availability of new medicines/drugs/vaccines; - reduction in cost of drugs/medicines/vaccines; - more hospitals/clinics built; - improved diet/better food supplies; - improved education re. health care - improved education re diet; - improved education re AIDS; - increased use of contraception reducing AIDS; - improvements to sanitation; - improvements to water supplies; - reference to achieving any specified Millennium Goals (no MAX). It may decrease due to: - AIDS/HIV; - obesity etc. (NB No MAX on increase/decrease) 4 @ 1 mark [4] [Total: 22] 2 (a) (i) Movement of people from the countryside/to the cities. [1] (ii) Push – things migrants want to escape from. Pull – attractions of the destination/city. 2 @ 1 mark [2] (iii) Levels marking Level 1 (1 to 3 marks) Simple statements which explain reasons for rural to urban migration, either pulls or pushes. (e.g. more jobs, better services, not enough food, better standard of living/quality of life, poverty, better housing etc) Level 2 (3 to 5 marks) More specific or developed statements which explain reasons for rural to urban migration, either pulls or pushes. (e.g. more jobs in the informal sector/factories/or examples, well paid jobs, greater access to range of services or examples such as schools/hospitals/clinics, can buy food from markets/shops, housing with electricity/gas etc) Level 3 (6 marks) More specific or developed statements which explain reasons for rural to urban migration, referring to both pulls and pushes. (e.g. some farmland unproductive due to drought, people living in countryside lost best quality agricultural land when reservoirs have been built, they can make money in informal sector by offering shoe shine/selling fruit, the city offers hope e.g. basic concrete houses are being built with piped water and sewage pipes, even in the squatter settlements the people have better access to primary health care than in the countryside) [6]
Mark scheme, page 4
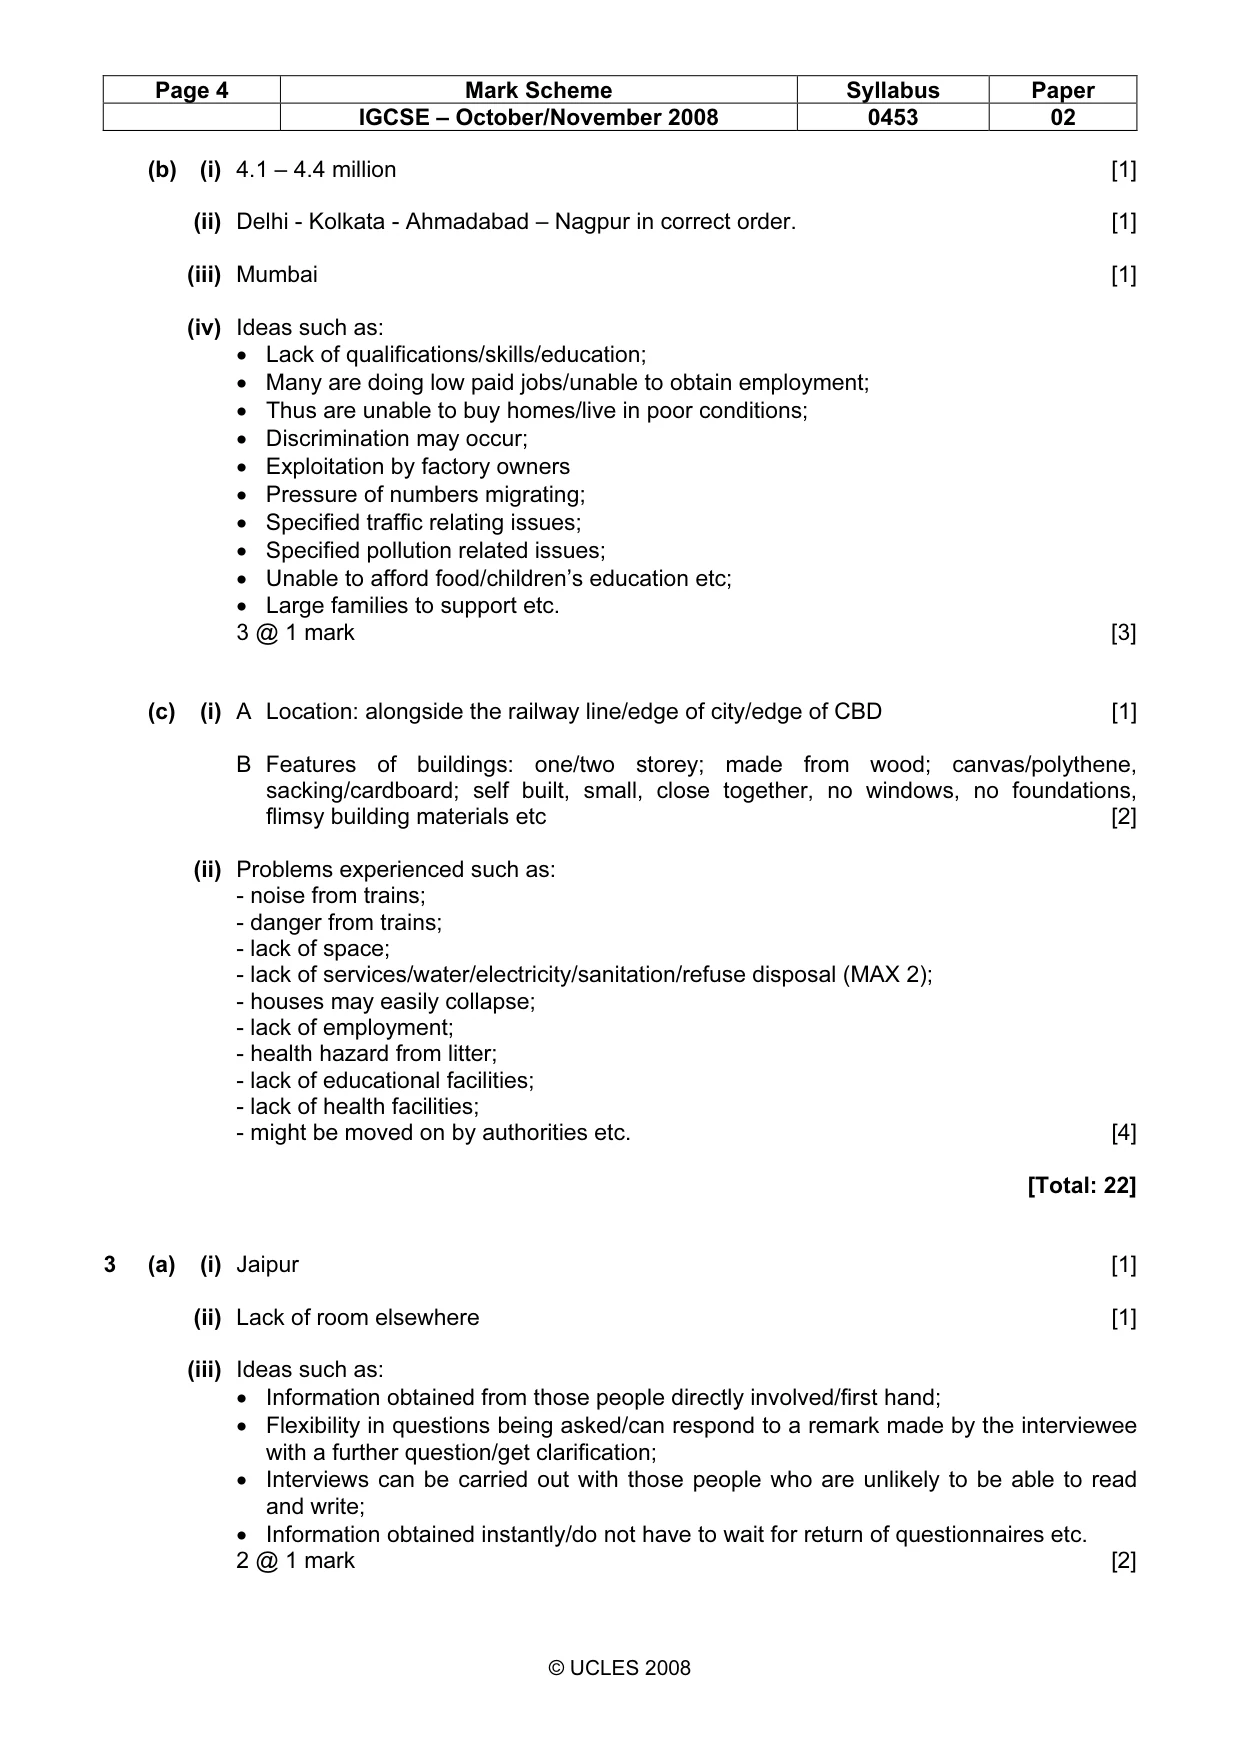
Page 4 Mark Scheme Syllabus Paper IGCSE – October/November 2008 0453 02 © UCLES 2008 (b) (i) 4.1 – 4.4 million [1] (ii) Delhi - Kolkata - Ahmadabad – Nagpur in correct order. [1] (iii) Mumbai [1] (iv) Ideas such as: • Lack of qualifications/skills/education; • Many are doing low paid jobs/unable to obtain employment; • Thus are unable to buy homes/live in poor conditions; • Discrimination may occur; • Exploitation by factory owners • Pressure of numbers migrating; • Specified traffic relating issues; • Specified pollution related issues; • Unable to afford food/children’s education etc; • Large families to support etc. 3 @ 1 mark [3] (c) (i) A Location: alongside the railway line/edge of city/edge of CBD [1] B Features of buildings: one/two storey; made from wood; canvas/polythene, sacking/cardboard; self built, small, close together, no windows, no foundations, flimsy building materials etc [2] (ii) Problems experienced such as: - noise from trains; - danger from trains; - lack of space; - lack of services/water/electricity/sanitation/refuse disposal (MAX 2); - houses may easily collapse; - lack of employment; - health hazard from litter; - lack of educational facilities; - lack of health facilities; - might be moved on by authorities etc. [4] [Total: 22] 3 (a) (i) Jaipur [1] (ii) Lack of room elsewhere [1] (iii) Ideas such as: • Information obtained from those people directly involved/first hand; • Flexibility in questions being asked/can respond to a remark made by the interviewee with a further question/get clarification; • Interviews can be carried out with those people who are unlikely to be able to read and write; • Information obtained instantly/do not have to wait for return of questionnaires etc. 2 @ 1 mark [2]
Mark scheme, page 5
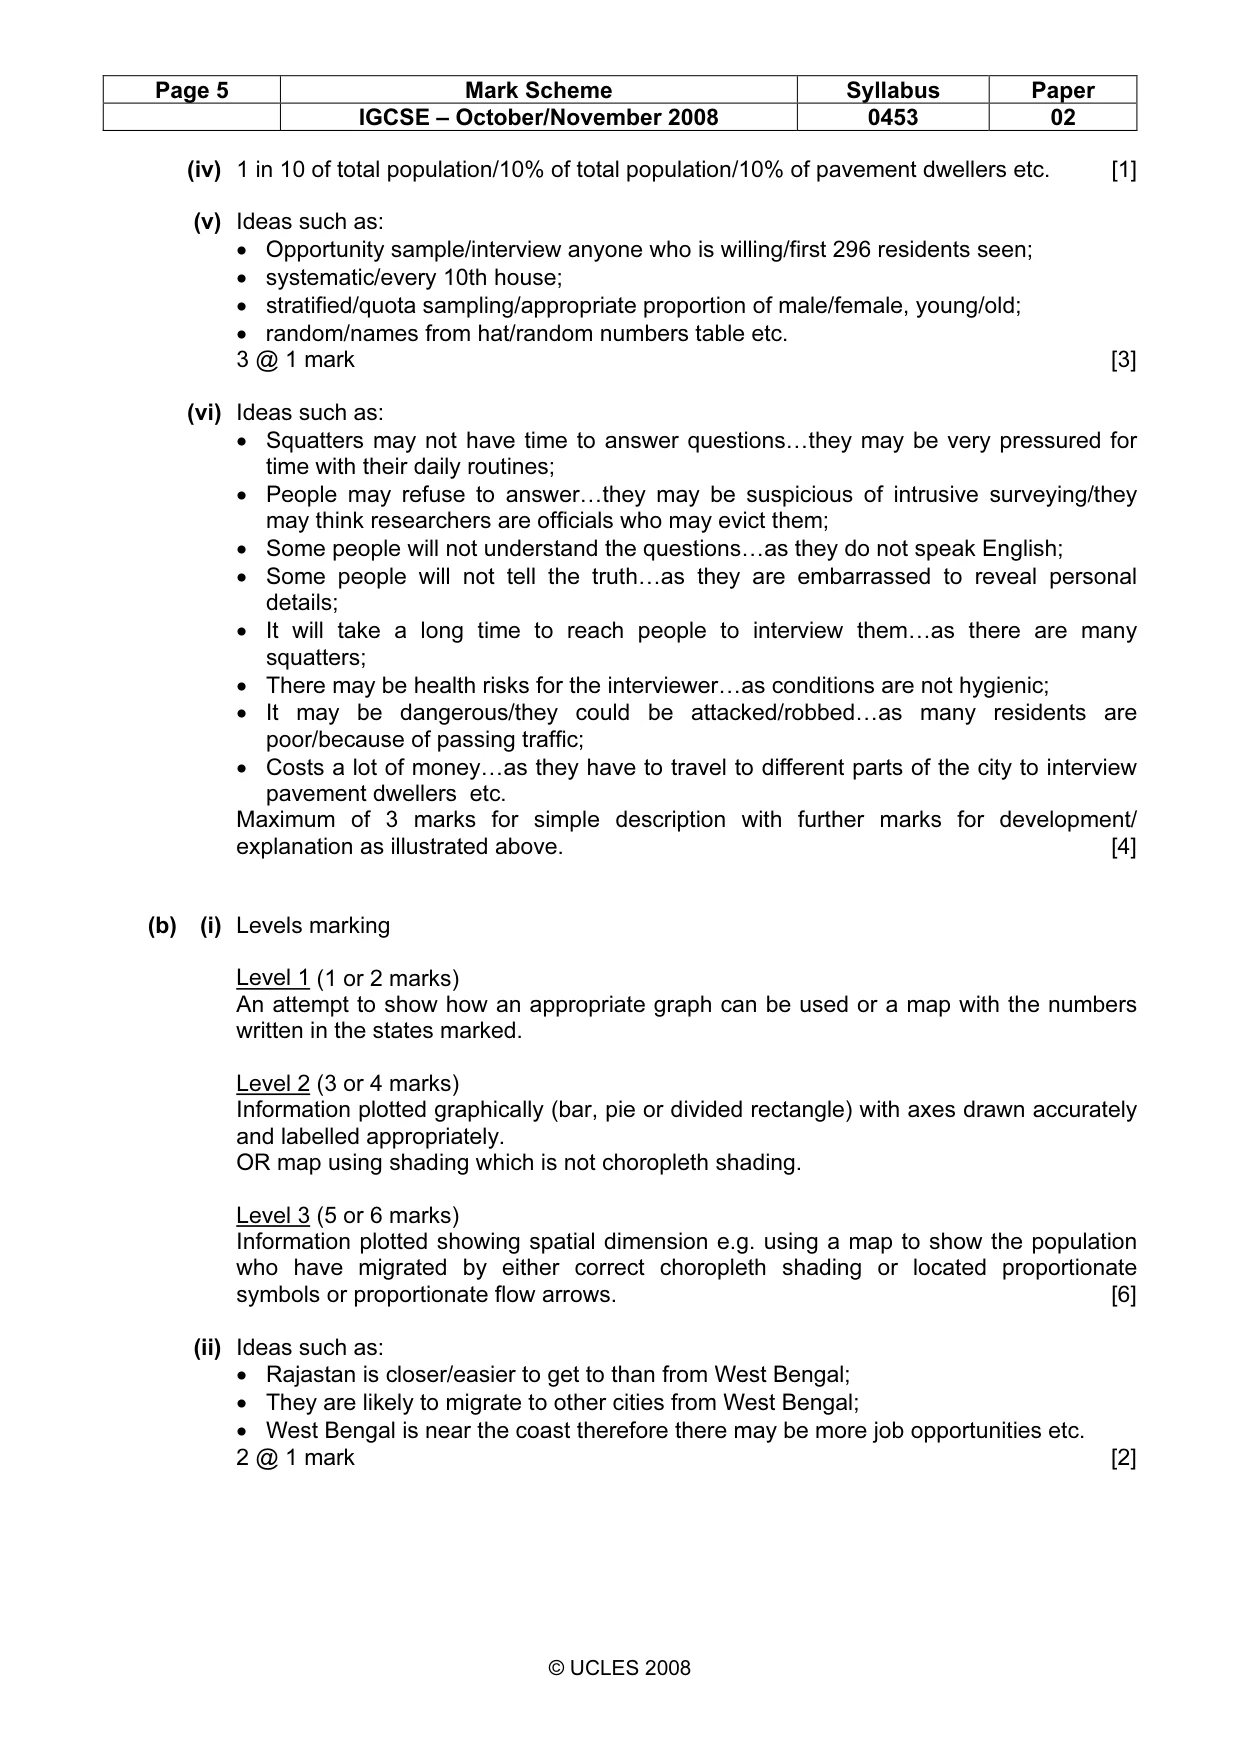
Page 5 Mark Scheme Syllabus Paper IGCSE – October/November 2008 0453 02 © UCLES 2008 (iv) 1 in 10 of total population/10% of total population/10% of pavement dwellers etc. [1] (v) Ideas such as: • Opportunity sample/interview anyone who is willing/first 296 residents seen; • systematic/every 10th house; • stratified/quota sampling/appropriate proportion of male/female, young/old; • random/names from hat/random numbers table etc. 3 @ 1 mark [3] (vi) Ideas such as: • Squatters may not have time to answer questions…they may be very pressured for time with their daily routines; • People may refuse to answer…they may be suspicious of intrusive surveying/they may think researchers are officials who may evict them; • Some people will not understand the questions…as they do not speak English; • Some people will not tell the truth…as they are embarrassed to reveal personal details; • It will take a long time to reach people to interview them…as there are many squatters; • There may be health risks for the interviewer…as conditions are not hygienic; • It may be dangerous/they could be attacked/robbed…as many residents are poor/because of passing traffic; • Costs a lot of money…as they have to travel to different parts of the city to interview pavement dwellers etc. Maximum of 3 marks for simple description with further marks for development/ explanation as illustrated above. [4] (b) (i) Levels marking Level 1 (1 or 2 marks) An attempt to show how an appropriate graph can be used or a map with the numbers written in the states marked. Level 2 (3 or 4 marks) Information plotted graphically (bar, pie or divided rectangle) with axes drawn accurately and labelled appropriately. OR map using shading which is not choropleth shading. Level 3 (5 or 6 marks) Information plotted showing spatial dimension e.g. using a map to show the population who have migrated by either correct choropleth shading or located proportionate symbols or proportionate flow arrows. [6] (ii) Ideas such as: • Rajastan is closer/easier to get to than from West Bengal; • They are likely to migrate to other cities from West Bengal; • West Bengal is near the coast therefore there may be more job opportunities etc. 2 @ 1 mark [2]
Mark scheme, page 6
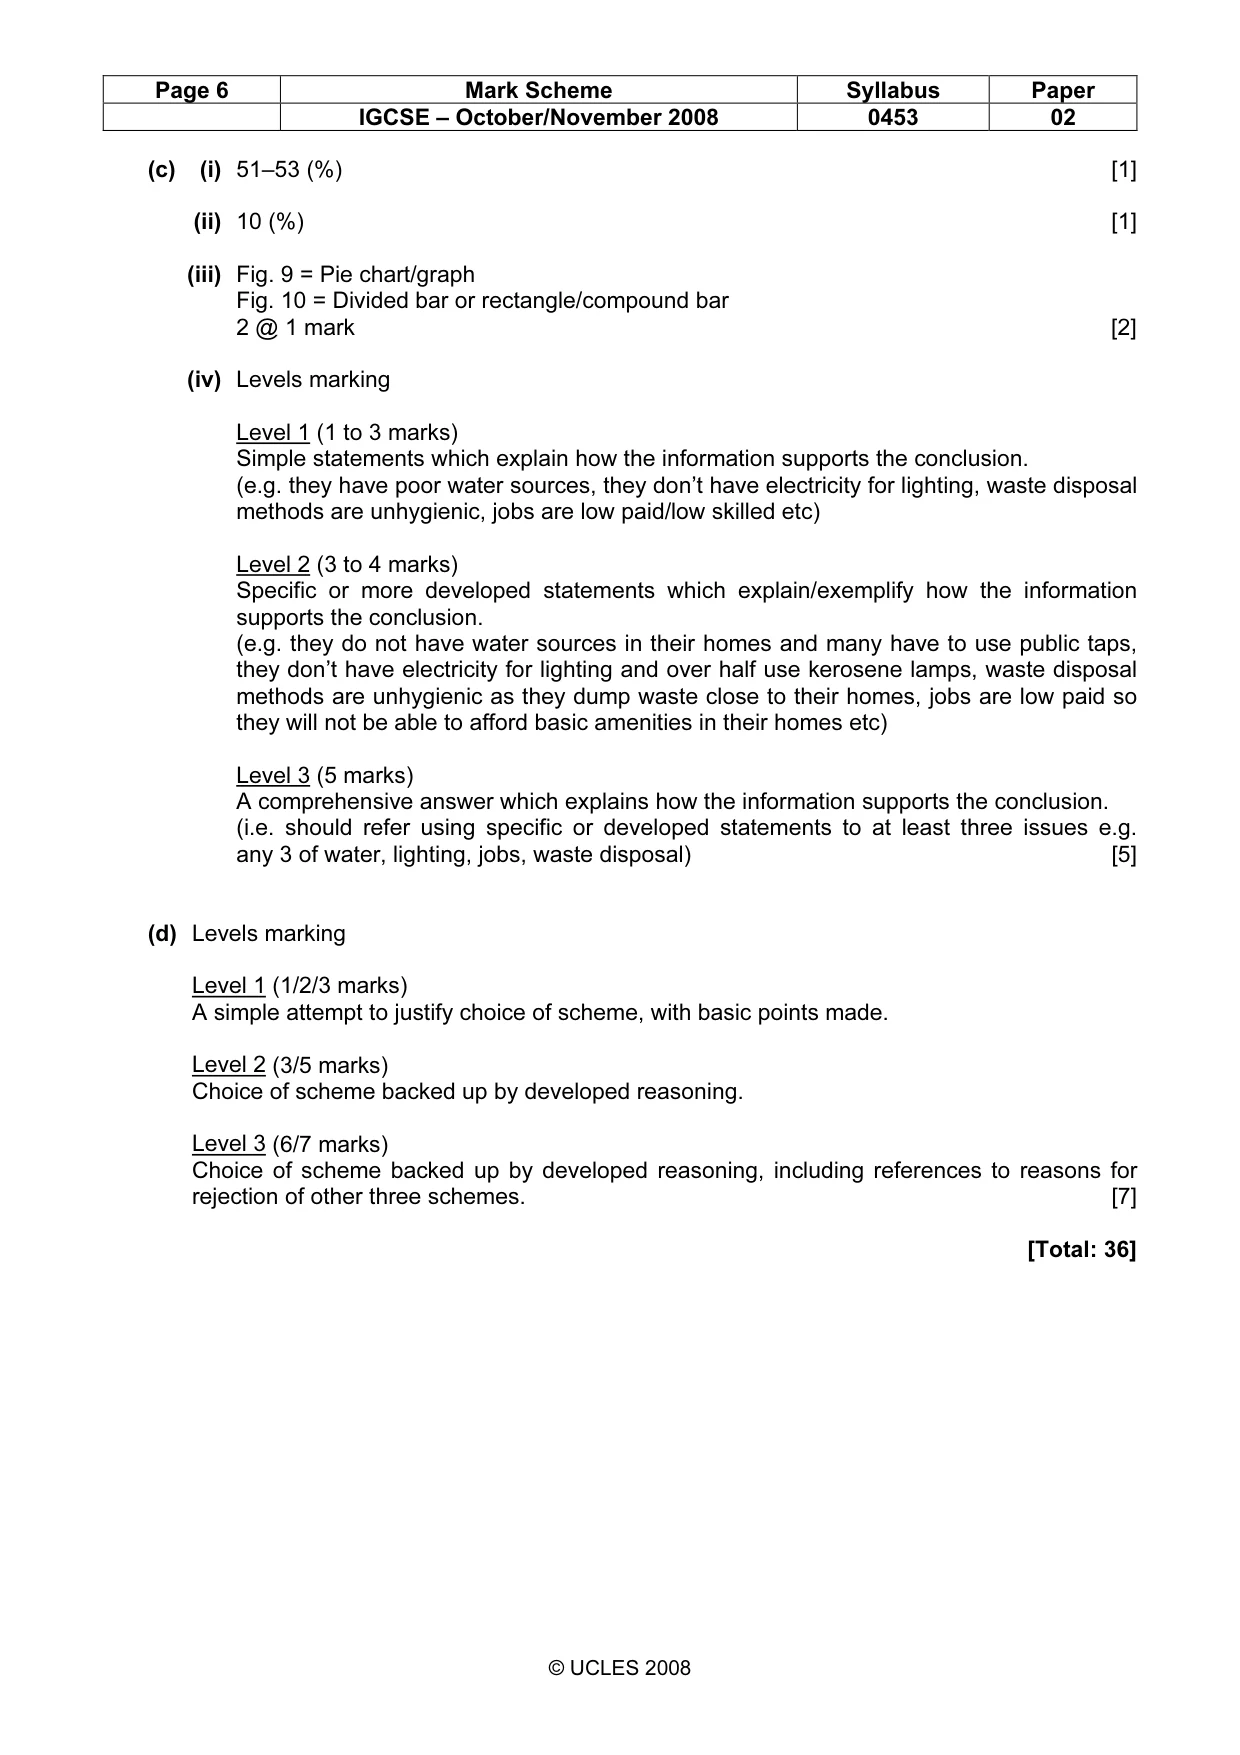
Page 6 Mark Scheme Syllabus Paper IGCSE – October/November 2008 0453 02 © UCLES 2008 (c) (i) 51–53 (%) [1] (ii) 10 (%) [1] (iii) Fig. 9 = Pie chart/graph Fig. 10 = Divided bar or rectangle/compound bar 2 @ 1 mark [2] (iv) Levels marking Level 1 (1 to 3 marks) Simple statements which explain how the information supports the conclusion. (e.g. they have poor water sources, they don’t have electricity for lighting, waste disposal methods are unhygienic, jobs are low paid/low skilled etc) Level 2 (3 to 4 marks) Specific or more developed statements which explain/exemplify how the information supports the conclusion. (e.g. they do not have water sources in their homes and many have to use public taps, they don’t have electricity for lighting and over half use kerosene lamps, waste disposal methods are unhygienic as they dump waste close to their homes, jobs are low paid so they will not be able to afford basic amenities in their homes etc) Level 3 (5 marks) A comprehensive answer which explains how the information supports the conclusion. (i.e. should refer using specific or developed statements to at least three issues e.g. any 3 of water, lighting, jobs, waste disposal) [5] (d) Levels marking Level 1 (1/2/3 marks) A simple attempt to justify choice of scheme, with basic points made. Level 2 (3/5 marks) Choice of scheme backed up by developed reasoning. Level 3 (6/7 marks) Choice of scheme backed up by developed reasoning, including references to reasons for rejection of other three schemes. [7] [Total: 36]
What you needed in this session
Cambridge’s own grade thresholds for 2008 Oct/Nov, Paper 2 · Variant 1. A higher threshold means an easier paper — the bar moves with how the cohort did.