Cambridge IGCSE Development Studies 0453 — 2004 Oct/Nov Paper 2 · Variant 1
0453/21/O/N/04
The question paper and its mark scheme, free to read here and free to download. This is Cambridge’s own paper, exactly as it was sat.
Question paper12 pages




Mark scheme8 pages
Answers below. Sit the paper first if you are practising.
Paper as text
Question paper, page 1
This document consists of 10 printed pages and 2 blank pages. SP (NF/GR) S57640/3 © UCLES 2004 [Turn over UNIVERSITY OF CAMBRIDGE INTERNATIONAL EXAMINATIONS International General Certificate of Secondary Education DEVELOPMENT STUDIES 0453/02 Paper 2 October/November 2004 2 hours 15 minutes Additional Materials: Answer Booklet/Paper READ THESE INSTRUCTIONS FIRST If you have been given an Answer Booklet, follow the instructions on the front cover of the Booklet. Write your Centre number, candidate number and name on all the work you hand in. Write in dark blue or black pen on both sides of the paper. You may use a soft pencil for any diagrams, graphs or rough working. Do not use staples, paper clips, highlighters, glue or correction fluid. At the end of the examination, fasten all your work securely together. Answer both questions. The number of marks is given in brackets [ ] at the end of each question or part question. The Insert contains all the source material for use with the questions. You should read and study the sources before answering the questions. www.XtremePapers.com
Question paper, page 2
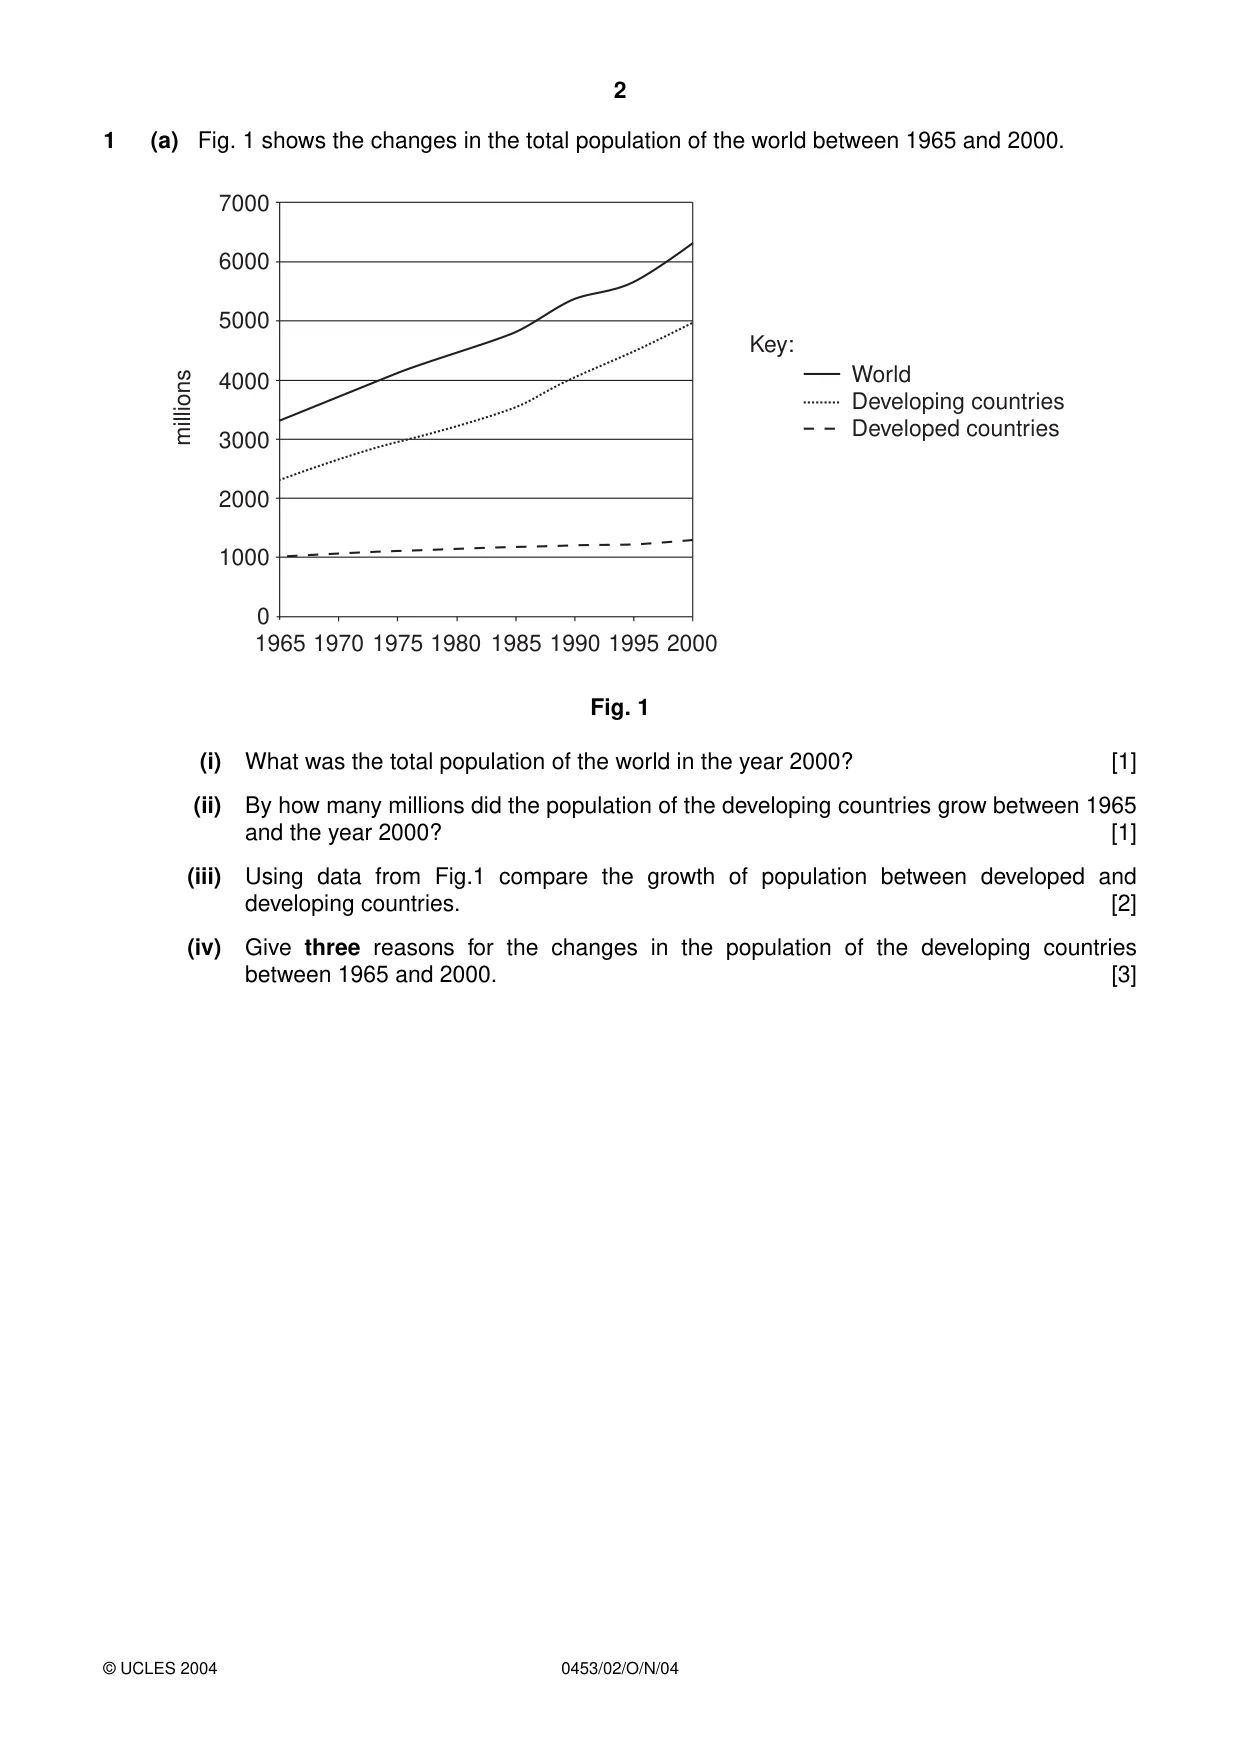
2 0453/02/O/N/04 1 (a) Fig. 1 shows the changes in the total population of the world between 1965 and 2000. Fig. 1 (i) What was the total population of the world in the year 2000? [1] (ii) By how many millions did the population of the developing countries grow between 1965 and the year 2000? [1] (iii) Using data from Fig.1 compare the growth of population between developed and developing countries. [2] (iv) Give three reasons for the changes in the population of the developing countries between 1965 and 2000. [3] 7000 6000 5000 4000 3000 2000 1000 0 1965 1970 1975 1980 1985 1990 1995 2000 Key: World Developing countries Developed countries millions © UCLES 2004
Question paper, page 3
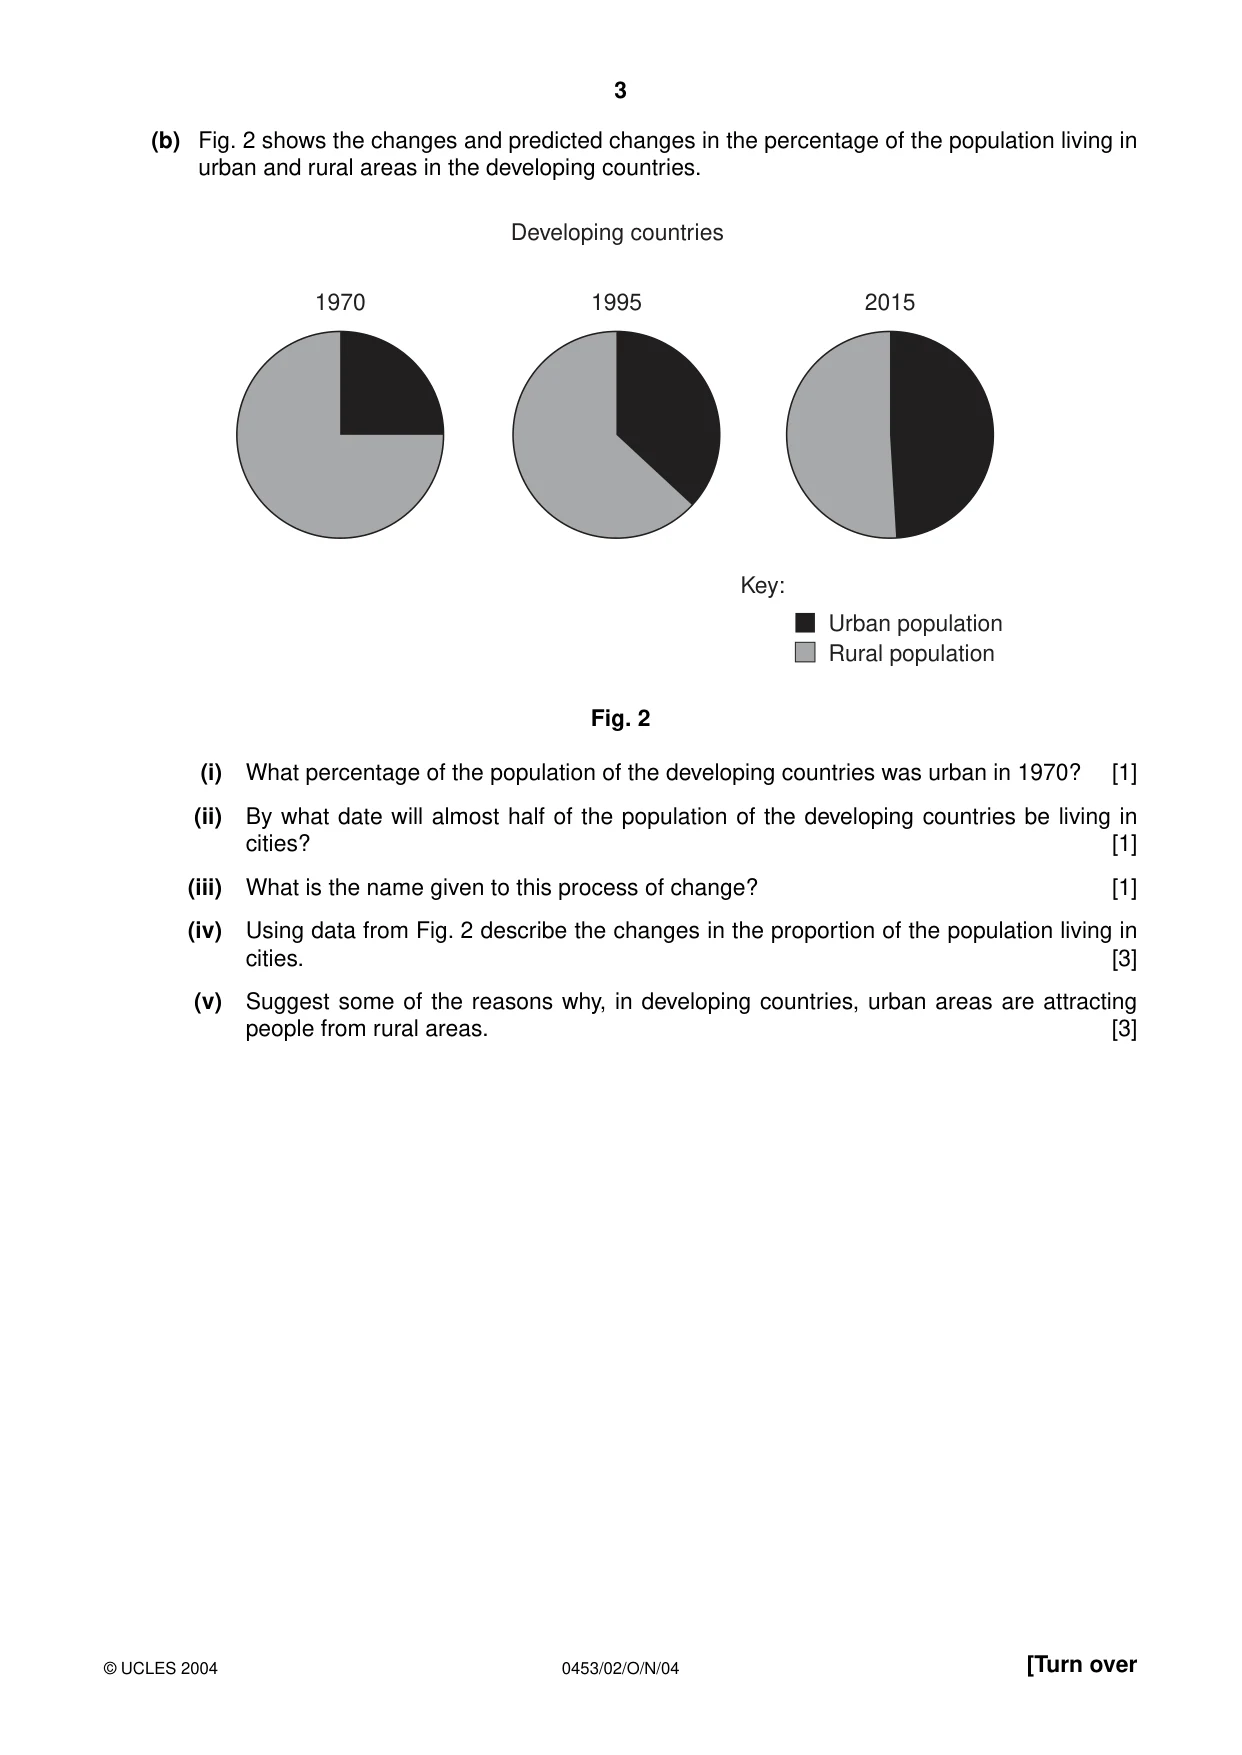
3 0453/02/O/N/04 [Turn over (b) Fig. 2 shows the changes and predicted changes in the percentage of the population living in urban and rural areas in the developing countries. Fig. 2 (i) What percentage of the population of the developing countries was urban in 1970? [1] (ii) By what date will almost half of the population of the developing countries be living in cities? [1] (iii) What is the name given to this process of change? [1] (iv) Using data from Fig. 2 describe the changes in the proportion of the population living in cities. [3] (v) Suggest some of the reasons why, in developing countries, urban areas are attracting people from rural areas. [3] 2015 1970 1995 Key: Urban population Rural population Developing countries © UCLES 2004
Question paper, page 4
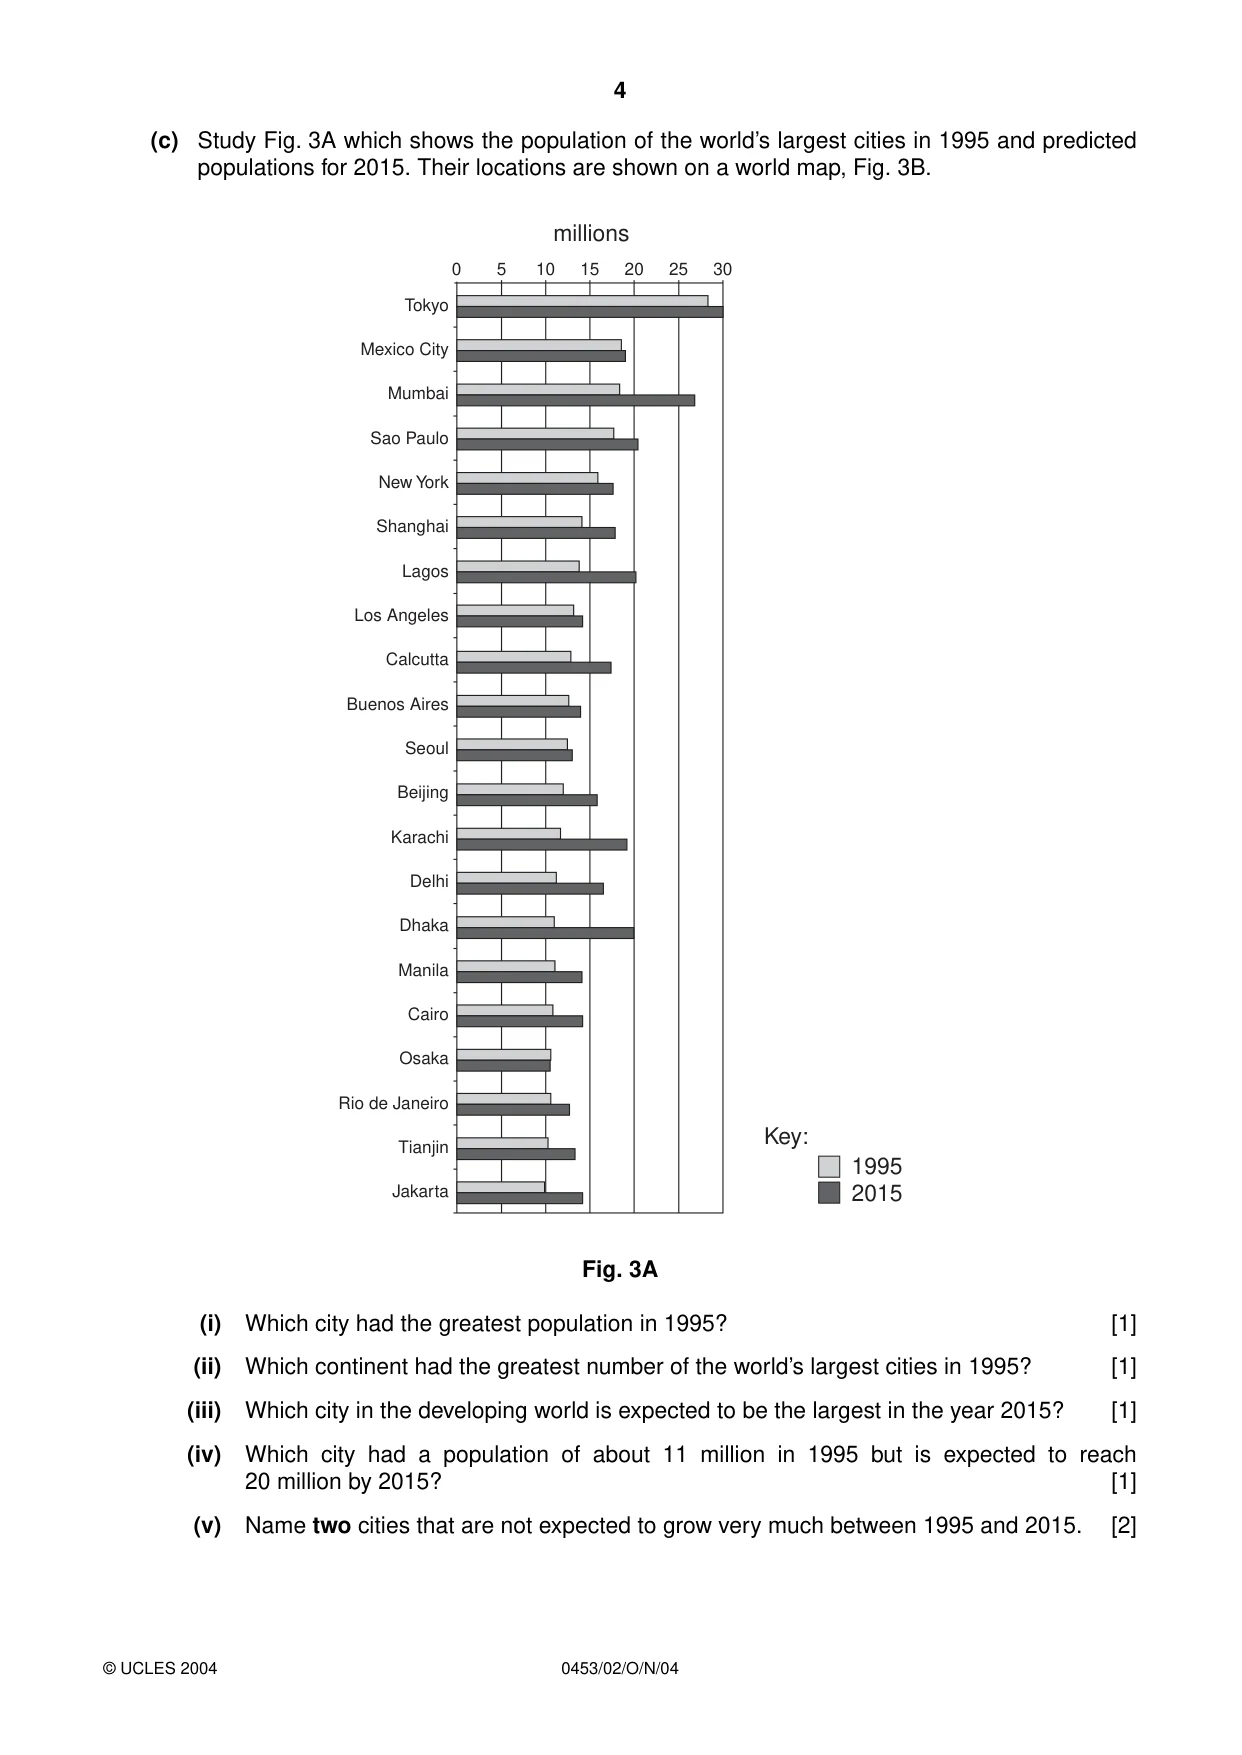
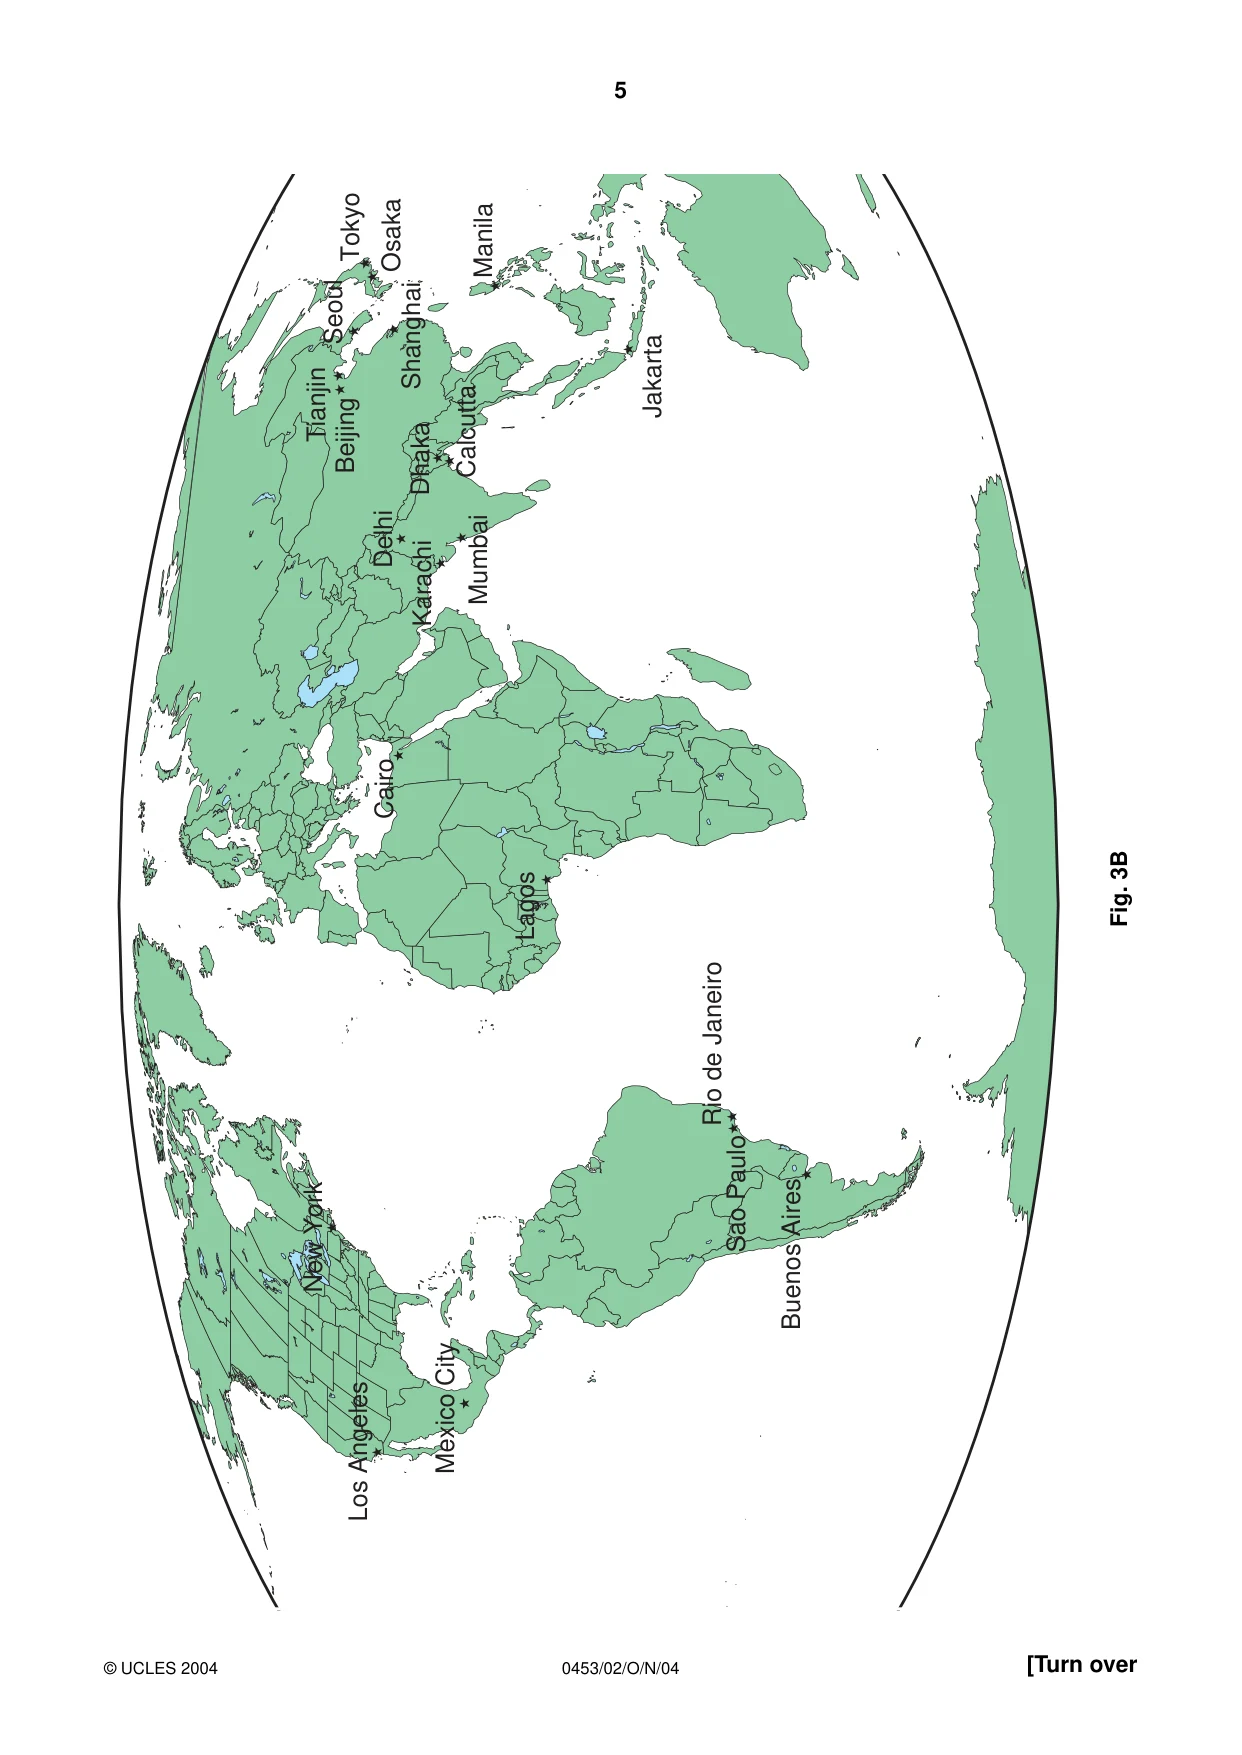
4 0453/02/O/N/04 (c) Study Fig. 3A which shows the population of the world’s largest cities in 1995 and predicted populations for 2015. Their locations are shown on a world map, Fig. 3B. Fig. 3A (i) Which city had the greatest population in 1995? [1] (ii) Which continent had the greatest number of the world’s largest cities in 1995? [1] (iii) Which city in the developing world is expected to be the largest in the year 2015? [1] (iv) Which city had a population of about 11 million in 1995 but is expected to reach 20 million by 2015? [1] (v) Name two cities that are not expected to grow very much between 1995 and 2015. [2] Key: 1995 2015 Tokyo Mexico City Mumbai Sao Paulo New York Shanghai Lagos Los Angeles Calcutta Buenos Aires Seoul Beijing Karachi Delhi Dhaka Manila Cairo Osaka Rio de Janeiro Tianjin Jakarta 0 5 10 15 20 25 30 millions © UCLES 2004
Question paper, page 5
5 0453/02/O/N/04 [Turn over Fig. 3B Dhaka Mumbai Delhi Karachi Calcutta Jakarta Mexico City Los Angeles New York Manila Seoul Buenos Aires Beijing Tianjin Cairo Lagos Sao Paulo Rio de Janeiro Tokyo Osaka Shanghai © UCLES 2004
Question paper, page 6
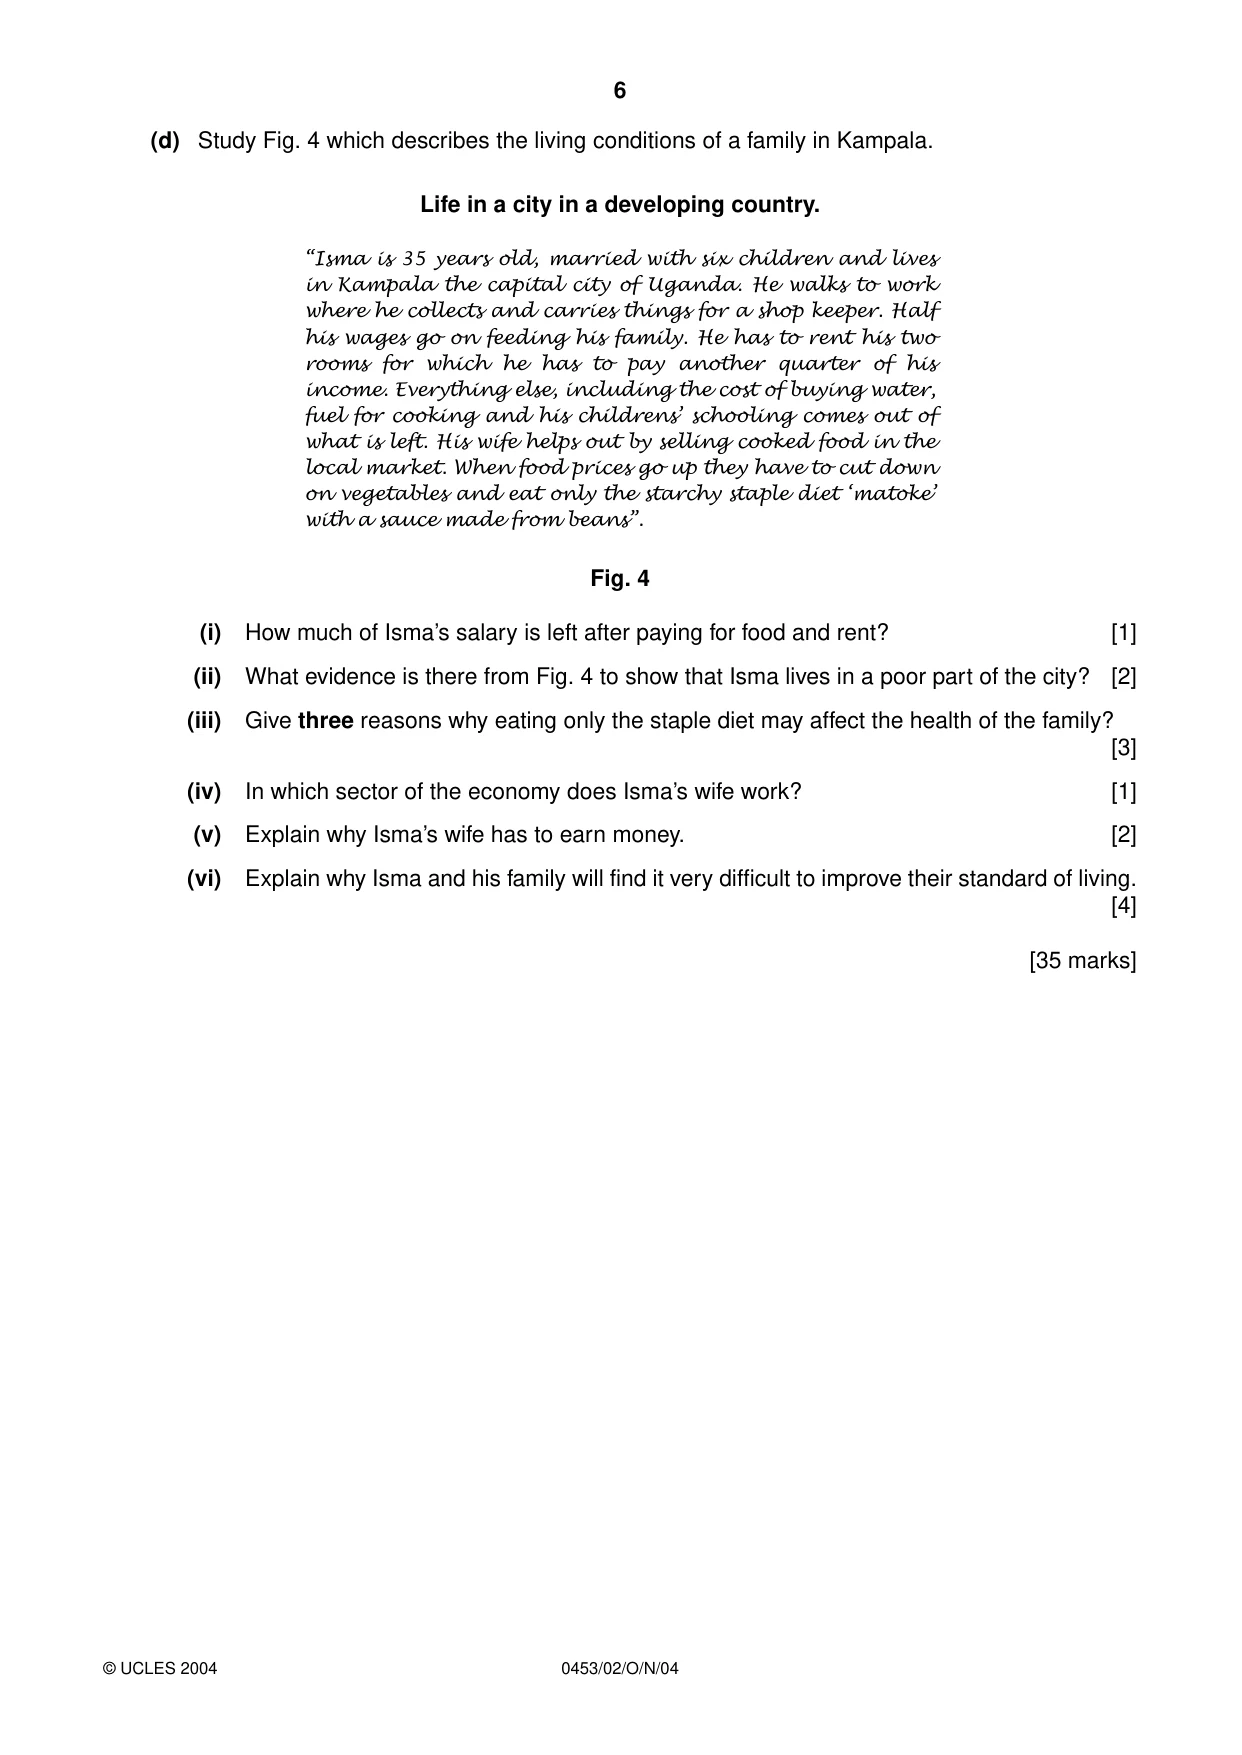
6 0453/02/O/N/04 (d) Study Fig. 4 which describes the living conditions of a family in Kampala. Life in a city in a developing country. “Isma is 35 years old, married with six children and lives in Kampala the capital city of Uganda. He walks to work where he collects and carries things for a shop keeper. Half his wages go on feeding his family. He has to rent his two rooms for which he has to pay another quarter of his income. Everything else, including the cost of buying water, fuel for cooking and his childrens’ schooling comes out of what is left. His wife helps out by selling cooked food in the local market. When food prices go up they have to cut down on vegetables and eat only the starchy staple diet ‘matoke’ with a sauce made from beans”. Fig. 4 (i) How much of Isma’s salary is left after paying for food and rent? [1] (ii) What evidence is there from Fig. 4 to show that Isma lives in a poor part of the city? [2] (iii) Give three reasons why eating only the staple diet may affect the health of the family? [3] (iv) In which sector of the economy does Isma’s wife work? [1] (v) Explain why Isma’s wife has to earn money. [2] (vi) Explain why Isma and his family will find it very difficult to improve their standard of living. [4] [35 marks] © UCLES 2004
Question paper, page 7
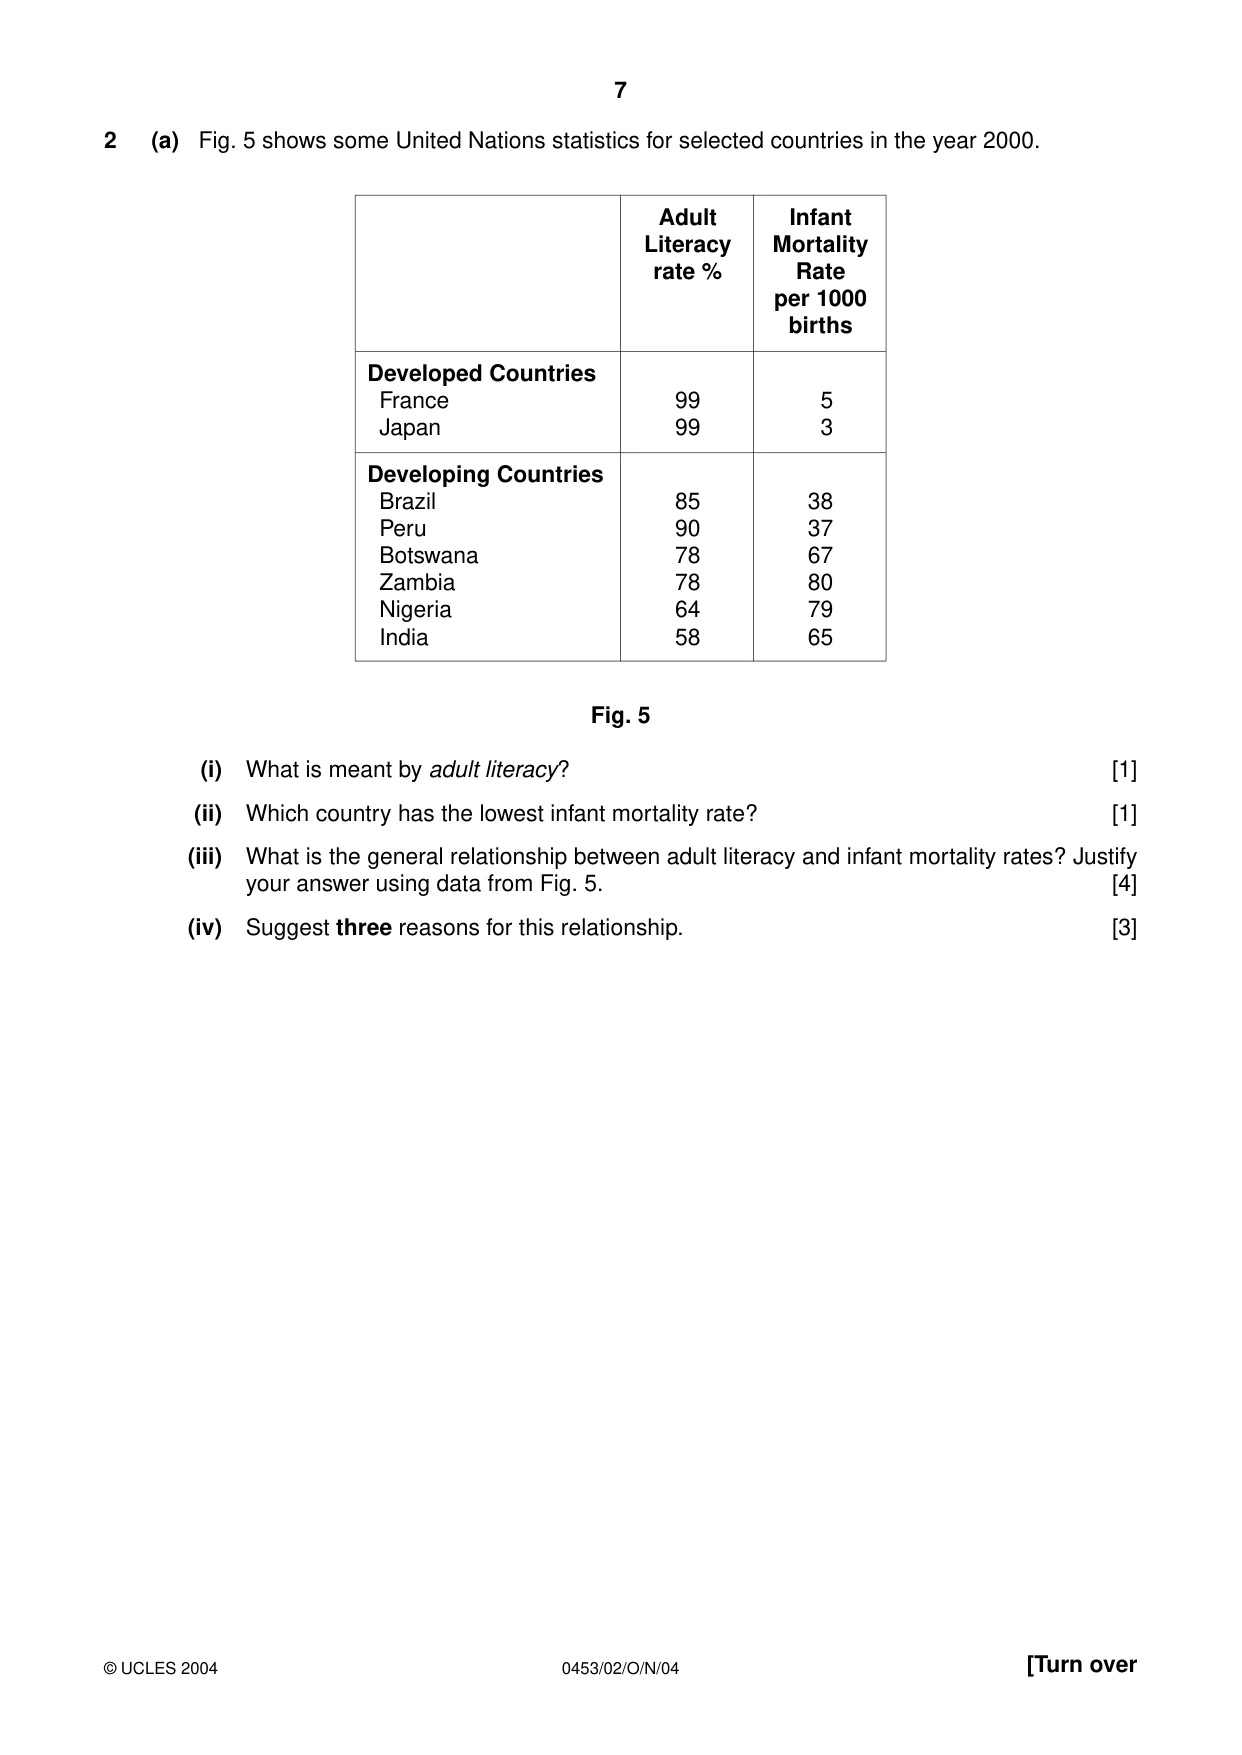
7 0453/02/O/N/04 [Turn over 2 (a) Fig. 5 shows some United Nations statistics for selected countries in the year 2000. Fig. 5 (i) What is meant by adult literacy? [1] (ii) Which country has the lowest infant mortality rate? [1] (iii) What is the general relationship between adult literacy and infant mortality rates? Justify your answer using data from Fig. 5. [4] (iv) Suggest three reasons for this relationship. [3] © UCLES 2004 Adult Infant Literacy Mortality rate % Rate per 1000 births Developed Countries France 99 5 Japan 99 3 Developing Countries Brazil 85 38 Peru 90 37 Botswana 78 67 Zambia 78 80 Nigeria 64 79 India 58 65
Question paper, page 8
8 0453/02/O/N/04 (b) Study Fig. 6 which describes three education projects. Three education projects in developing countries Distance learning Adults who have left school without qualifications can study to gain school certificate and university entrance. Students pay fees and buy the course materials. They send their work by post to tutors who mark and return it. At the end of the course they sit examinations. Television lessons School pupils follow lessons which are broadcast by the Ministry of Education on the national television network. Science, maths and language lessons are particularly important and more school students are able to follow these subjects to gain their school certificate. National Apprenticeship Courses These are run as evening classes and students study practical subjects. Particularly important are courses for the building and engineering industries. The students are paid to work in the day alongside skilled workers who help with their training. After three years the students’ practical work is examined and if it is judged of good standard they gain a nationally accepted qualification. Fig. 6 (i) Suggest two reasons why many adults have no qualifications. [2] (ii) Explain why “distance learning” is a particularly useful way of gaining qualifications in developing countries. [2] (iii) Suggest two reasons why television lessons enable many more school students to gain their school certificate than if they only had classroom lessons. [2] (iv) Give two reasons why television lessons have disadvantages in some countries. [2] (v) Suggest one practical subject which would be suited to a national apprenticeship course. [1] (vi) Give three advantages of national apprenticeship courses. [3] © UCLES 2004
Question paper, page 9
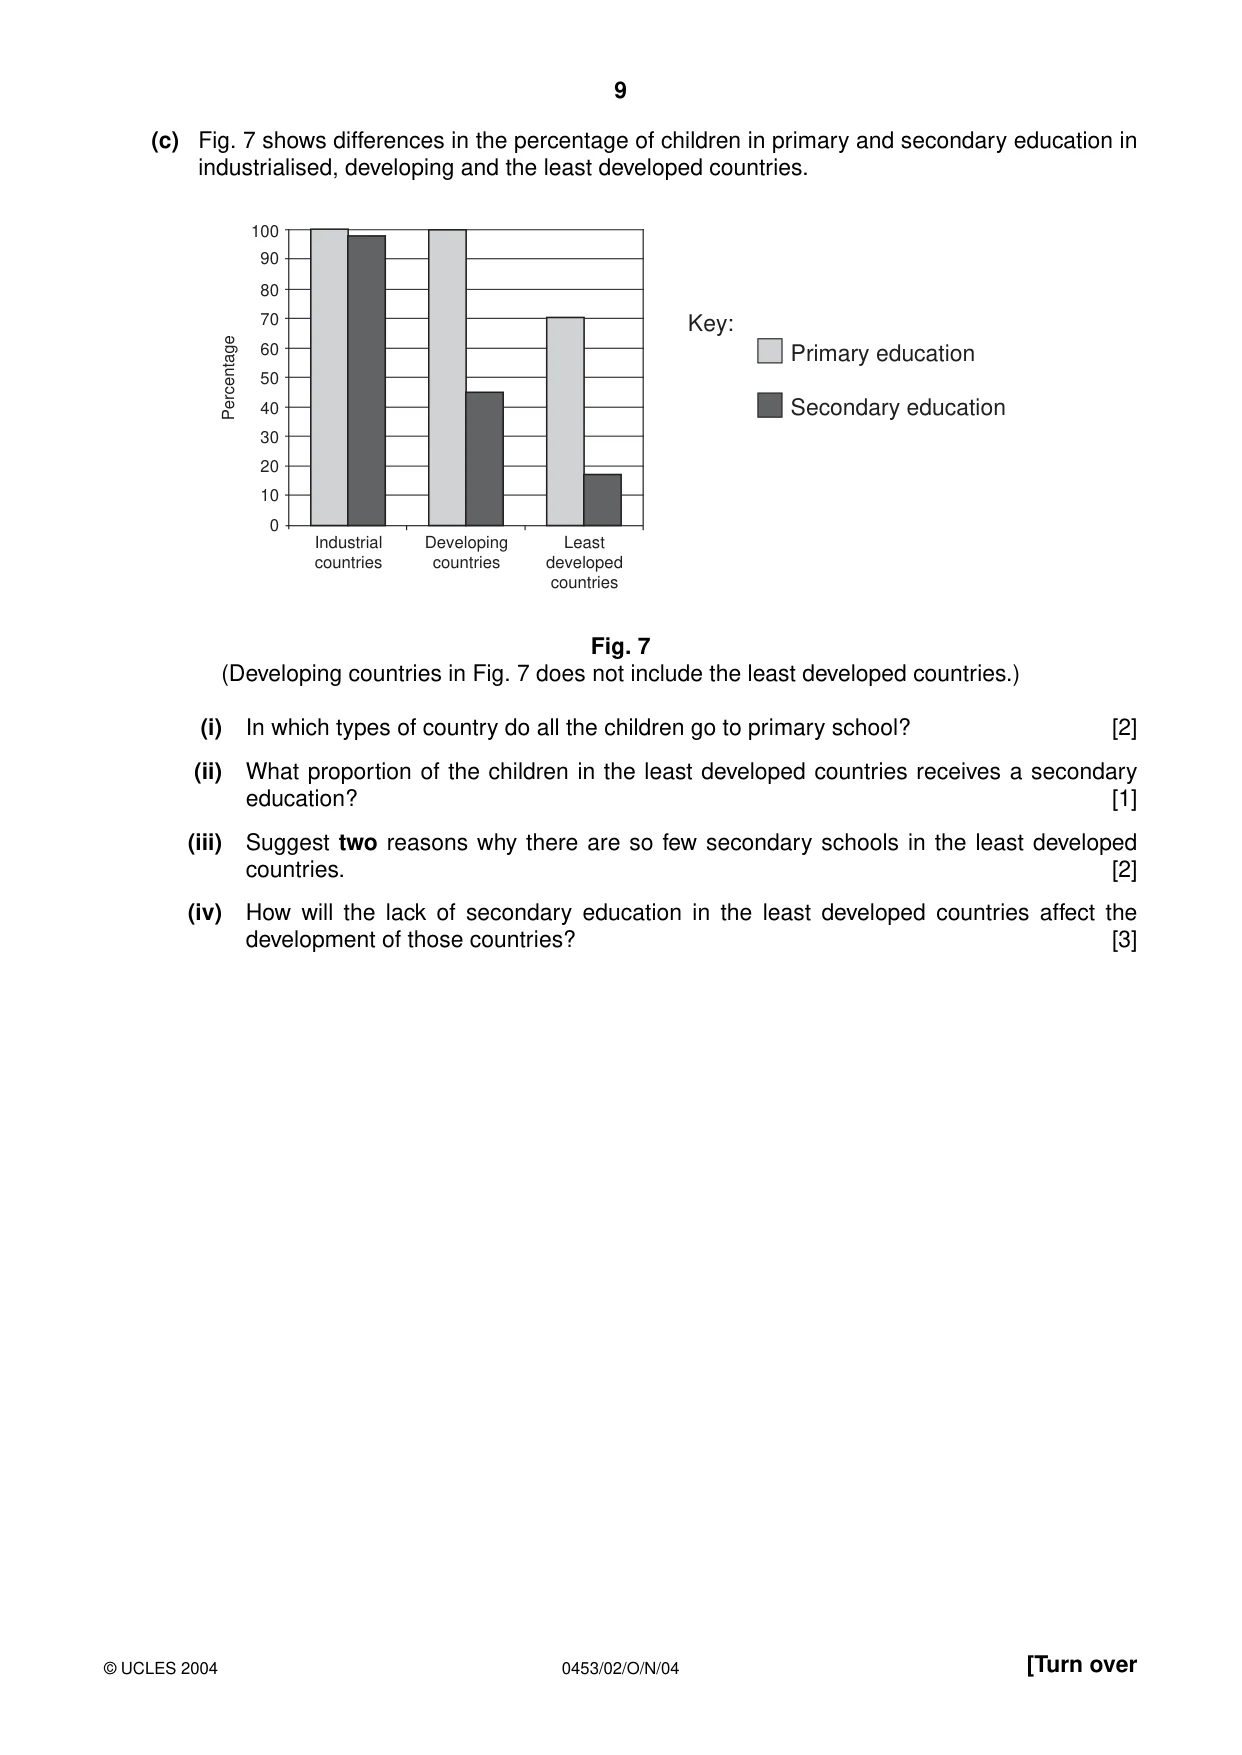
9 0453/02/O/N/04 [Turn over (c) Fig. 7 shows differences in the percentage of children in primary and secondary education in industrialised, developing and the least developed countries. Fig. 7 (Developing countries in Fig. 7 does not include the least developed countries.) (i) In which types of country do all the children go to primary school? [2] (ii) What proportion of the children in the least developed countries receives a secondary education? [1] (iii) Suggest two reasons why there are so few secondary schools in the least developed countries. [2] (iv) How will the lack of secondary education in the least developed countries affect the development of those countries? [3] 100 80 60 40 20 90 70 50 30 10 0 Key: Primary education Secondary education Industrial countries Developing countries Least developed countries Percentage © UCLES 2004
Question paper, page 10
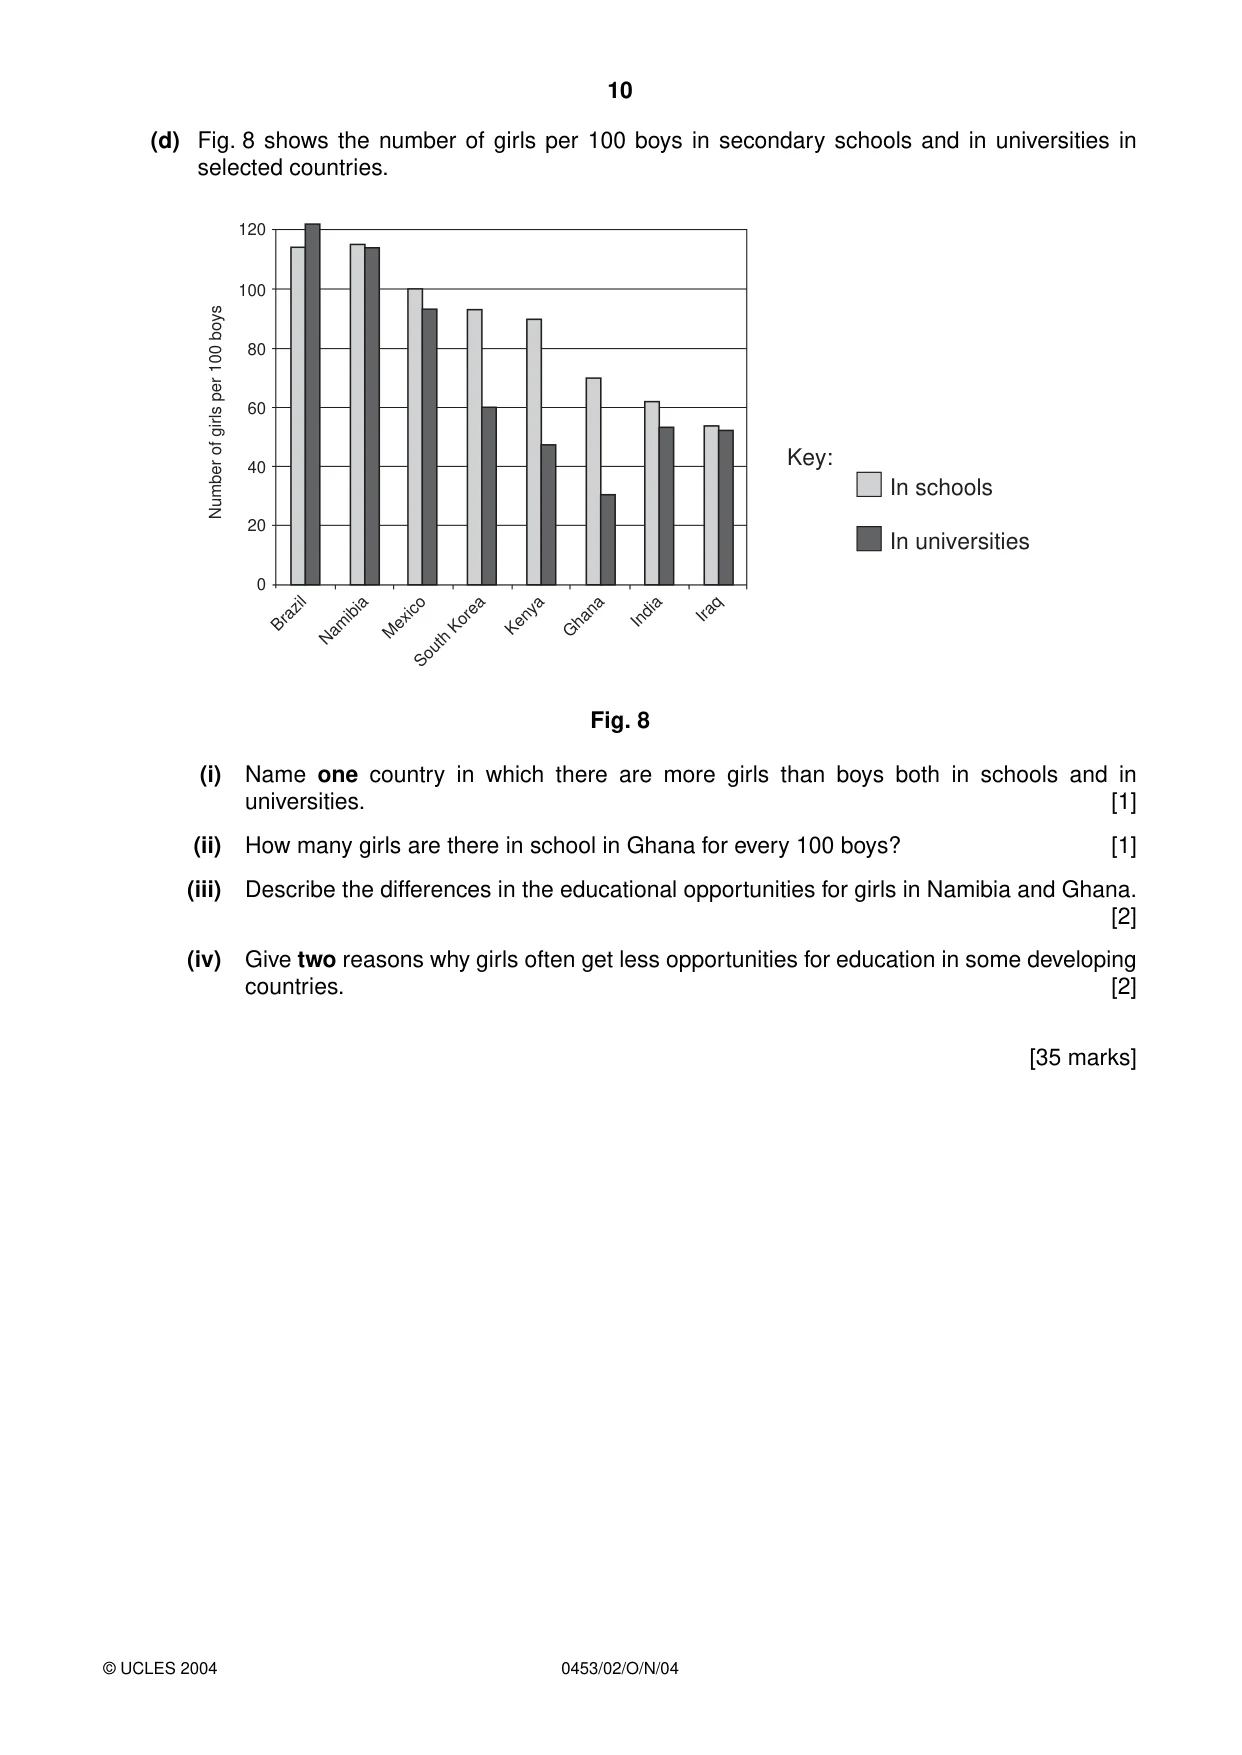
10 0453/02/O/N/04 (d) Fig. 8 shows the number of girls per 100 boys in secondary schools and in universities in selected countries. Fig. 8 (i) Name one country in which there are more girls than boys both in schools and in universities. [1] (ii) How many girls are there in school in Ghana for every 100 boys? [1] (iii) Describe the differences in the educational opportunities for girls in Namibia and Ghana. [2] (iv) Give two reasons why girls often get less opportunities for education in some developing countries. [2] [35 marks] 100 120 80 60 40 20 0 Key: In schools In universities Number of girls per 100 boys Brazil Namibia Mexico South Korea Kenya Ghana India Iraq © UCLES 2004
Question paper, page 12
12 0453/02/O/N/04 BLANK PAGE Copyright Acknowledgements: The University of Cambridge Local Examinations Syndicate has made every effort to trace copyright holders, but if we have inadvertently overlooked any we will be pleased to make the necessary arrangements at the first opportunity. University of Cambridge International Examinations is part of the University of Cambridge Local Examinations Syndicate (UCLES) which is itself a department of the University of Cambridge.
Mark scheme, page 1
UNIVERSITY OF CAMBRIDGE INTERNATIONAL EXAMINATIONS International General Certificate of Secondary Education MARK SCHEME for the November 2004 question paper 0453 Development Studies 0453/02 Paper 2, maximum mark 70 This mark scheme is published as an aid to teachers and students, to indicate the requirements of the examination. It shows the basis on which Examiners were initially instructed to award marks. It does not indicate the details of the discussions that took place at an Examiners’ meeting before marking began. Any substantial changes to the mark scheme that arose from these discussions will be recorded in the published Report on the Examination. All Examiners are instructed that alternative correct answers and unexpected approaches in candidates’ scripts must be given marks that fairly reflect the relevant knowledge and skills demonstrated. Mark schemes must be read in conjunction with the question papers and the Report on the Examination. • CIE will not enter into discussion or correspondence in connection with these mark schemes. CIE is publishing the mark schemes for the November 2004 question papers for most IGCSE and GCE Advanced Level syllabuses. www.XtremePapers.com
Mark scheme, page 2
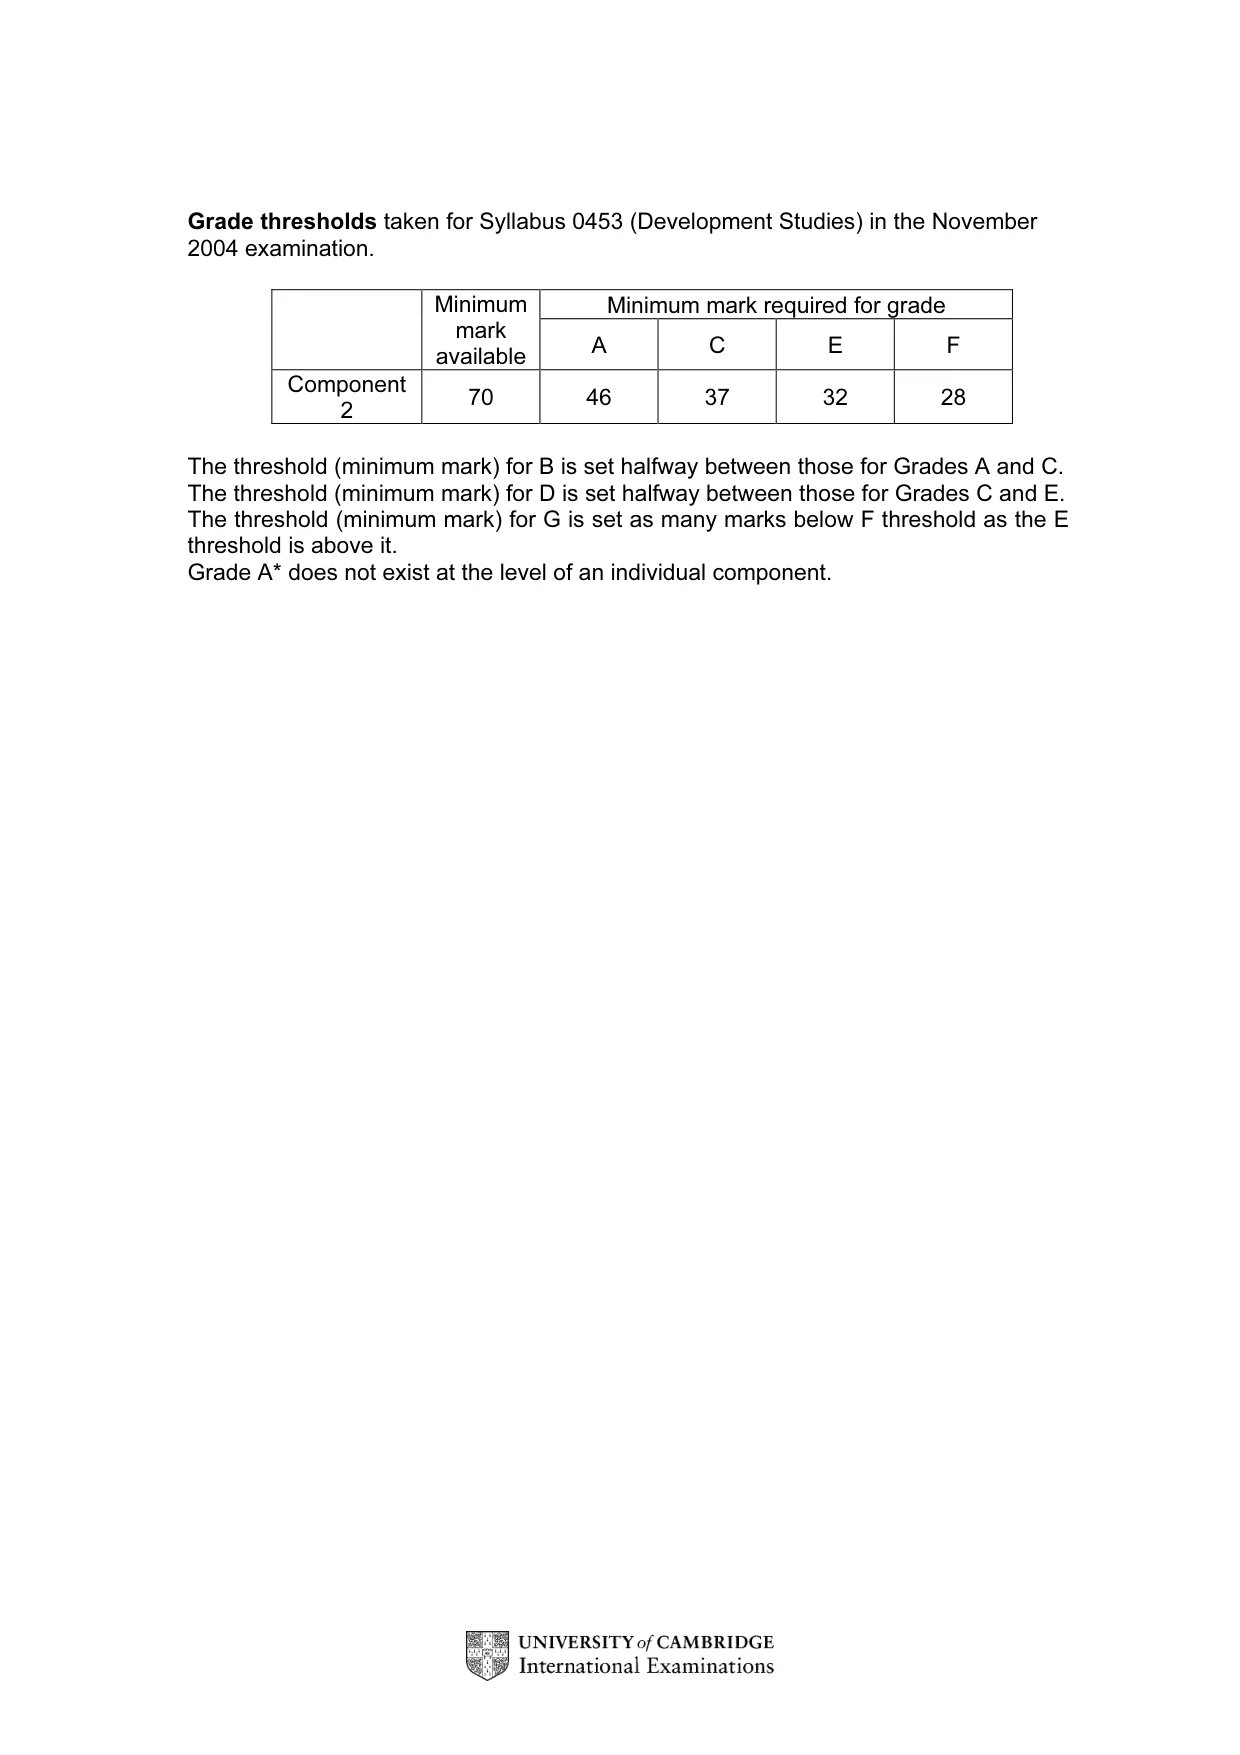
Grade thresholds taken for Syllabus 0453 (Development Studies) in the November 2004 examination. Minimum mark required for grade Minimum mark available A C E F Component 2 70 46 37 32 28 The threshold (minimum mark) for B is set halfway between those for Grades A and C. The threshold (minimum mark) for D is set halfway between those for Grades C and E. The threshold (minimum mark) for G is set as many marks below F threshold as the E threshold is above it. Grade A* does not exist at the level of an individual component.
Mark scheme, page 3
November 2004 INTERNATIONAL GCSE MARK SCHEME MAXIMUM MARK: 70 SYLLABUS/COMPONENT: 0453/02 DEVELOPMENT STUDIES Paper 2
Mark scheme, page 4
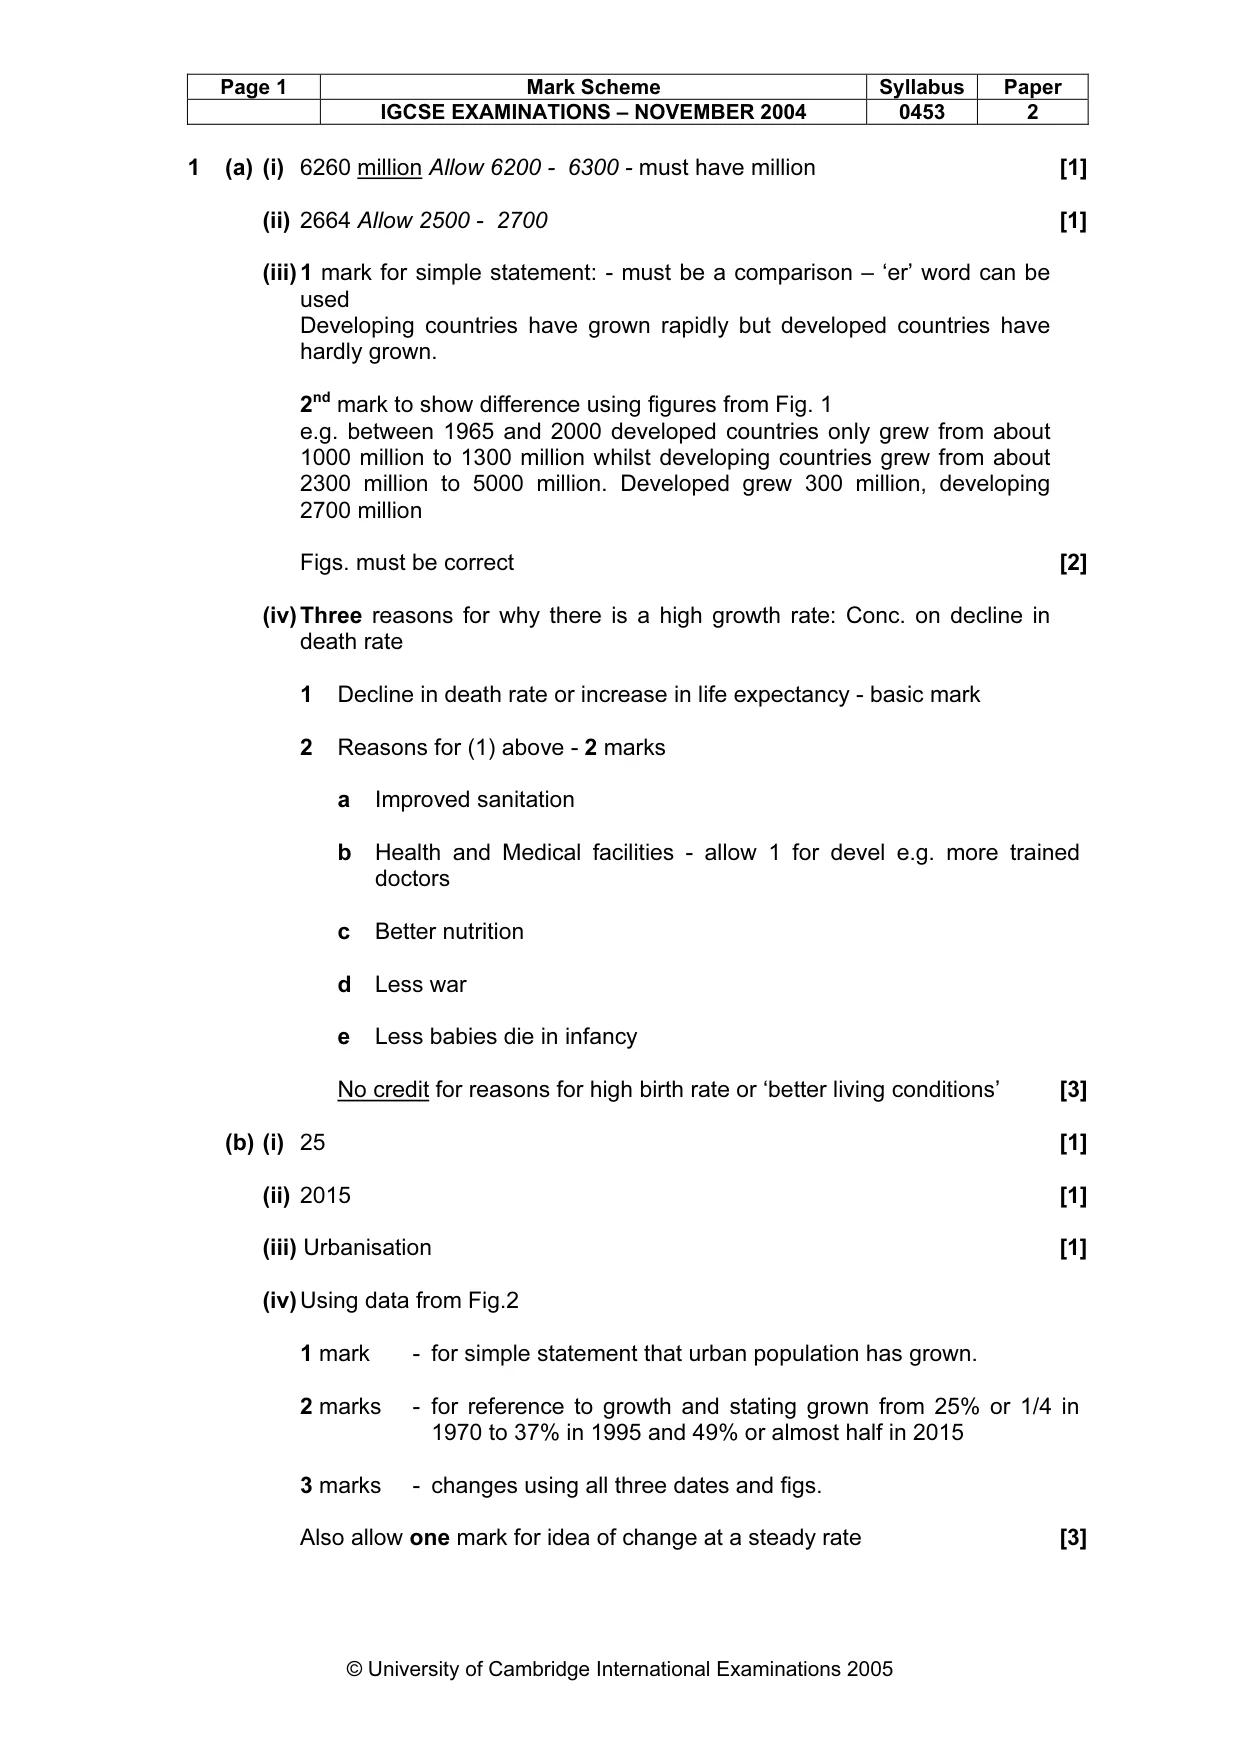
Page 1 Mark Scheme Syllabus Paper IGCSE EXAMINATIONS – NOVEMBER 2004 0453 2 © University of Cambridge International Examinations 2005 1 (a) (i) 6260 million Allow 6200 - 6300 - must have million [1] (ii) 2664 Allow 2500 - 2700 [1] (iii) 1 mark for simple statement: - must be a comparison – ‘er’ word can be used Developing countries have grown rapidly but developed countries have hardly grown. 2nd mark to show difference using figures from Fig. 1 e.g. between 1965 and 2000 developed countries only grew from about 1000 million to 1300 million whilst developing countries grew from about 2300 million to 5000 million. Developed grew 300 million, developing 2700 million Figs. must be correct [2] (iv) Three reasons for why there is a high growth rate: Conc. on decline in death rate 1 Decline in death rate or increase in life expectancy - basic mark 2 Reasons for (1) above - 2 marks a Improved sanitation b Health and Medical facilities - allow 1 for devel e.g. more trained doctors c Better nutrition d Less war e Less babies die in infancy No credit for reasons for high birth rate or ‘better living conditions’ [3] (b) (i) 25 [1] (ii) 2015 [1] (iii) Urbanisation [1] (iv) Using data from Fig.2 1 mark - for simple statement that urban population has grown. 2 marks - for reference to growth and stating grown from 25% or 1/4 in 1970 to 37% in 1995 and 49% or almost half in 2015 3 marks - changes using all three dates and figs. Also allow one mark for idea of change at a steady rate [3]
Mark scheme, page 5
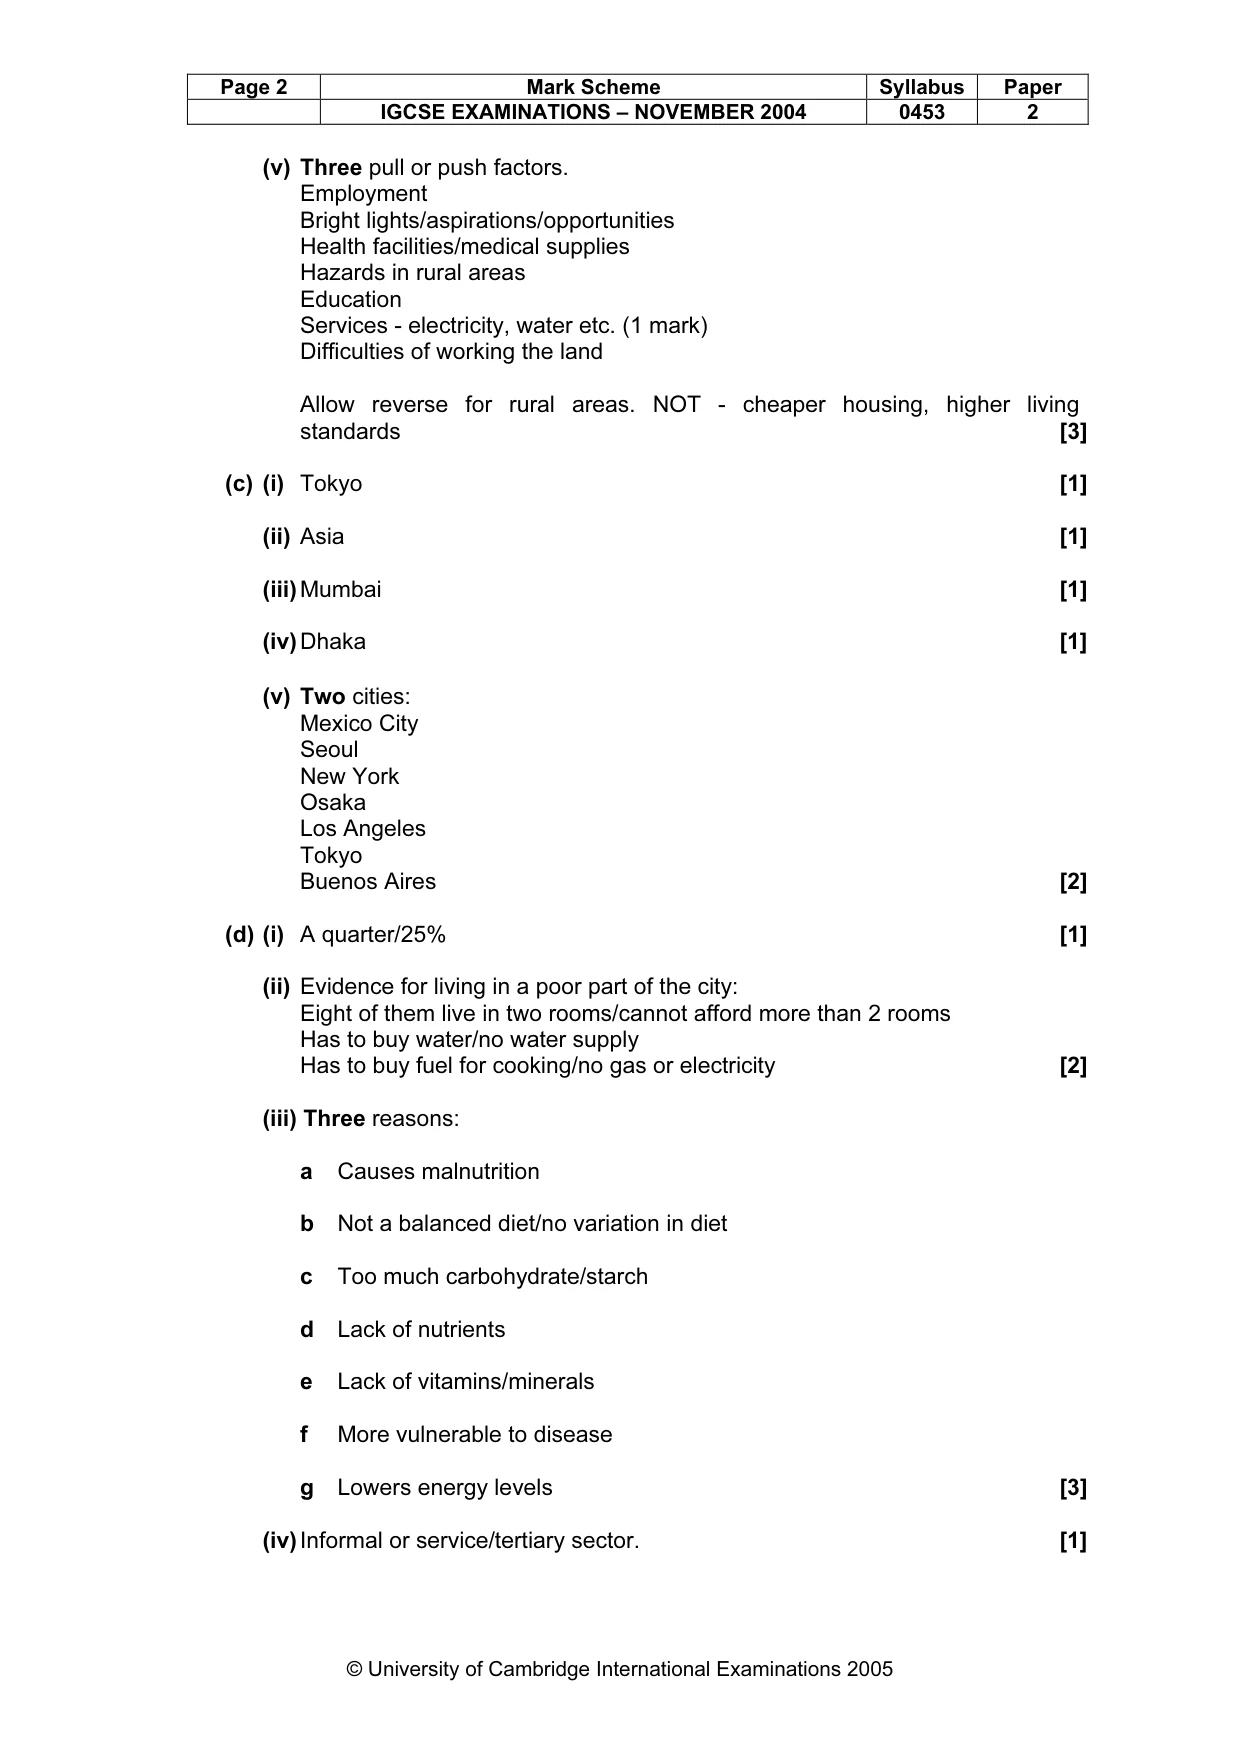
Page 2 Mark Scheme Syllabus Paper IGCSE EXAMINATIONS – NOVEMBER 2004 0453 2 © University of Cambridge International Examinations 2005 (v) Three pull or push factors. Employment Bright lights/aspirations/opportunities Health facilities/medical supplies Hazards in rural areas Education Services - electricity, water etc. (1 mark) Difficulties of working the land Allow reverse for rural areas. NOT - cheaper housing, higher living standards [3] (c) (i) Tokyo [1] (ii) Asia [1] (iii) Mumbai [1] (iv) Dhaka [1] (v) Two cities: Mexico City Seoul New York Osaka Los Angeles Tokyo Buenos Aires [2] (d) (i) A quarter/25% [1] (ii) Evidence for living in a poor part of the city: Eight of them live in two rooms/cannot afford more than 2 rooms Has to buy water/no water supply Has to buy fuel for cooking/no gas or electricity [2] (iii) Three reasons: a Causes malnutrition b Not a balanced diet/no variation in diet c Too much carbohydrate/starch d Lack of nutrients e Lack of vitamins/minerals f More vulnerable to disease g Lowers energy levels [3] (iv) Informal or service/tertiary sector. [1]
Mark scheme, page 6
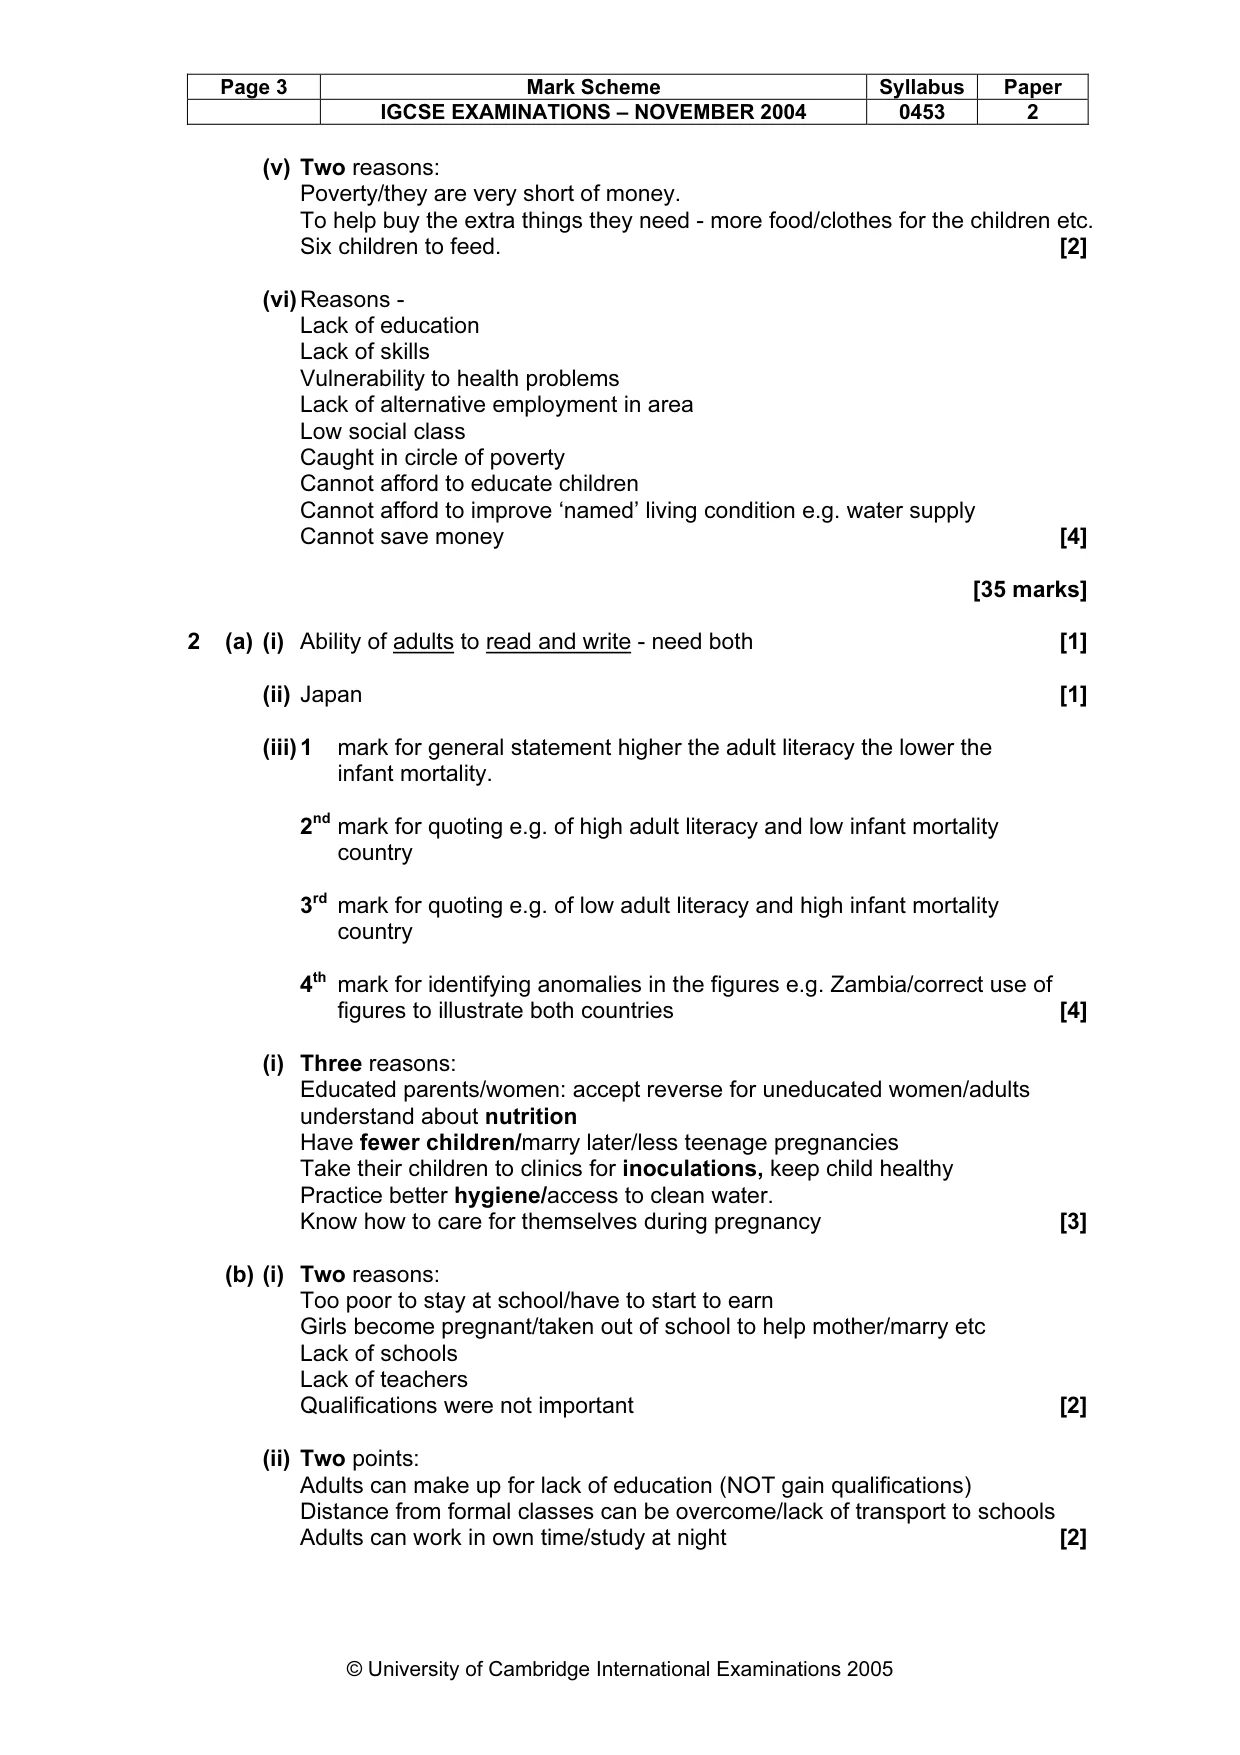
Page 3 Mark Scheme Syllabus Paper IGCSE EXAMINATIONS – NOVEMBER 2004 0453 2 © University of Cambridge International Examinations 2005 (v) Two reasons: Poverty/they are very short of money. To help buy the extra things they need - more food/clothes for the children etc. Six children to feed. [2] (vi) Reasons - Lack of education Lack of skills Vulnerability to health problems Lack of alternative employment in area Low social class Caught in circle of poverty Cannot afford to educate children Cannot afford to improve ‘named’ living condition e.g. water supply Cannot save money [4] [35 marks] 2 (a) (i) Ability of adults to read and write - need both [1] (ii) Japan [1] (iii) 1 mark for general statement higher the adult literacy the lower the infant mortality. 2nd mark for quoting e.g. of high adult literacy and low infant mortality country 3rd mark for quoting e.g. of low adult literacy and high infant mortality country 4th mark for identifying anomalies in the figures e.g. Zambia/correct use of figures to illustrate both countries [4] (i) Three reasons: Educated parents/women: accept reverse for uneducated women/adults understand about nutrition Have fewer children/marry later/less teenage pregnancies Take their children to clinics for inoculations, keep child healthy Practice better hygiene/access to clean water. Know how to care for themselves during pregnancy [3] (b) (i) Two reasons: Too poor to stay at school/have to start to earn Girls become pregnant/taken out of school to help mother/marry etc Lack of schools Lack of teachers Qualifications were not important [2] (ii) Two points: Adults can make up for lack of education (NOT gain qualifications) Distance from formal classes can be overcome/lack of transport to schools Adults can work in own time/study at night [2]
Mark scheme, page 7
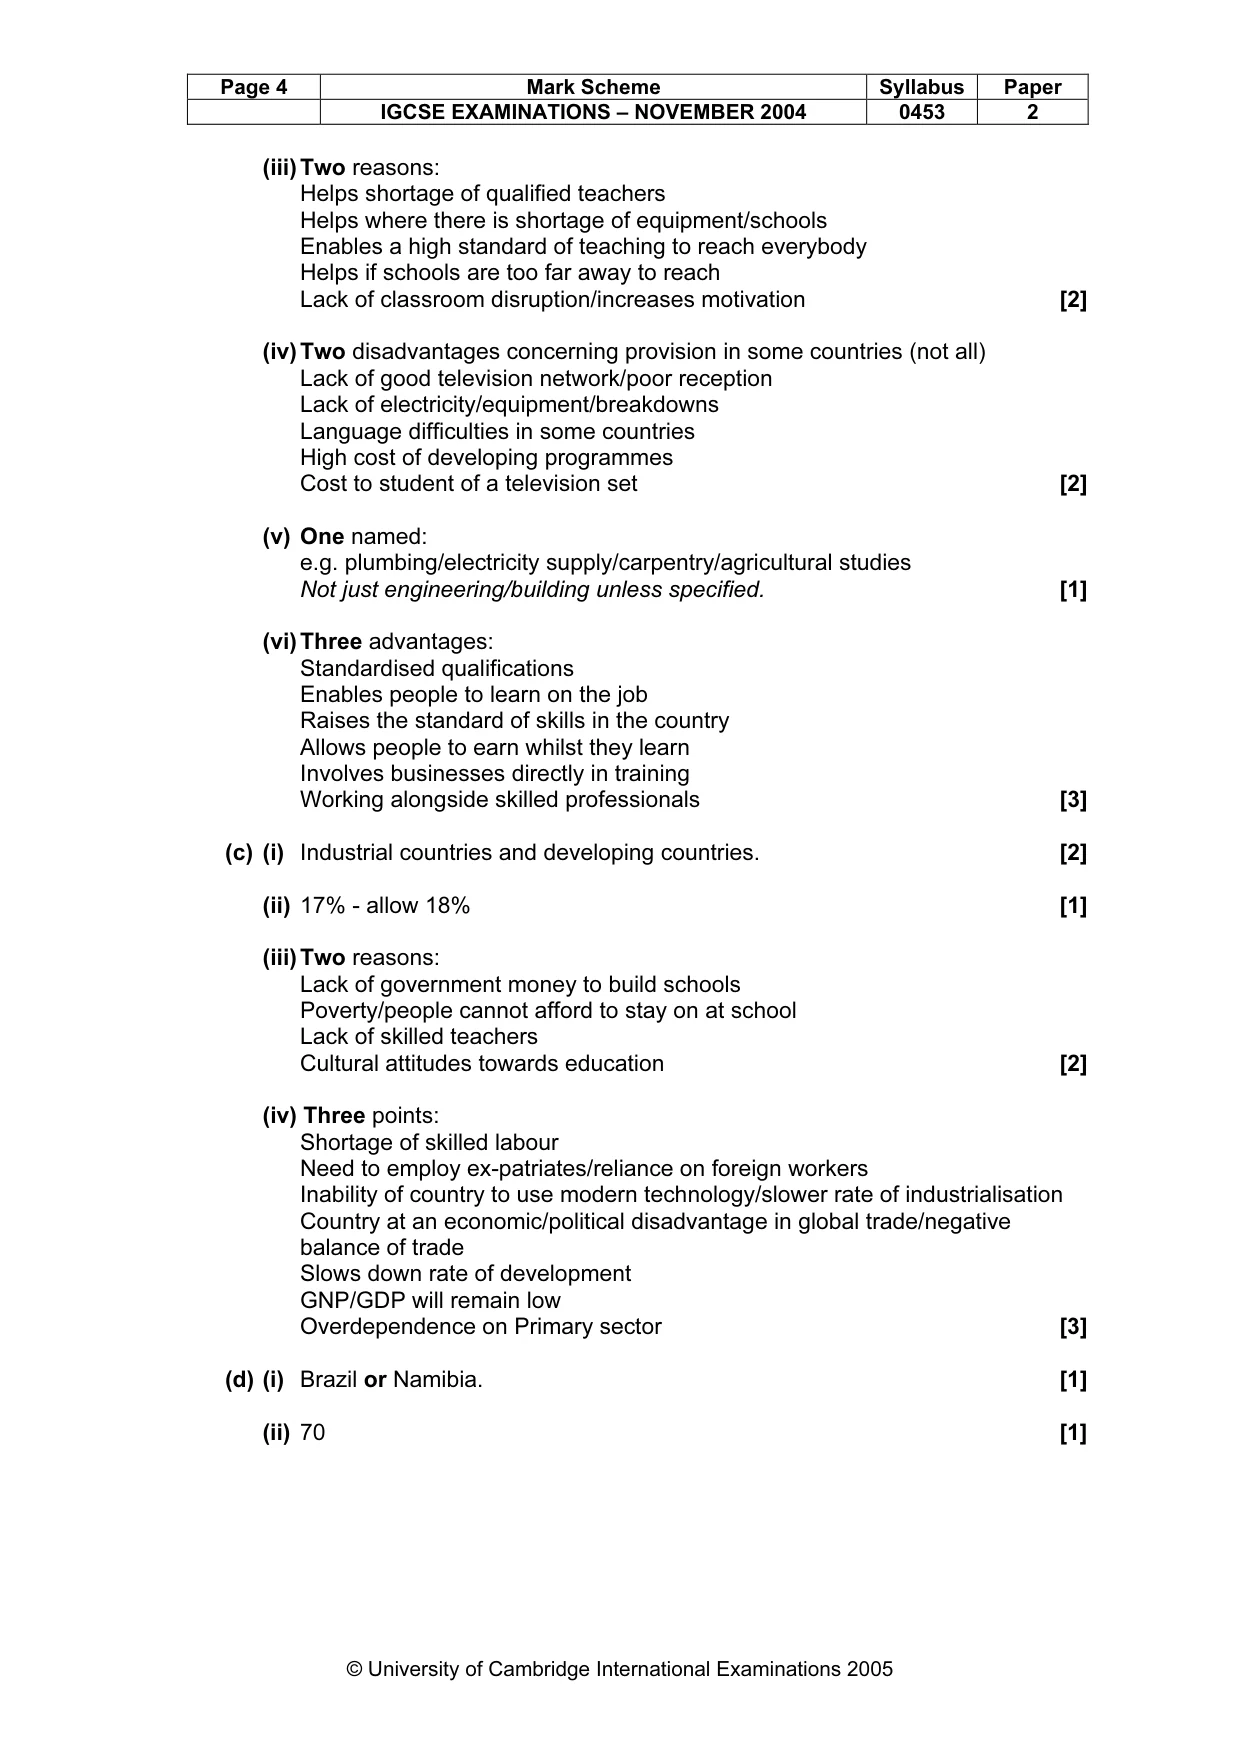
Page 4 Mark Scheme Syllabus Paper IGCSE EXAMINATIONS – NOVEMBER 2004 0453 2 © University of Cambridge International Examinations 2005 (iii) Two reasons: Helps shortage of qualified teachers Helps where there is shortage of equipment/schools Enables a high standard of teaching to reach everybody Helps if schools are too far away to reach Lack of classroom disruption/increases motivation [2] (iv) Two disadvantages concerning provision in some countries (not all) Lack of good television network/poor reception Lack of electricity/equipment/breakdowns Language difficulties in some countries High cost of developing programmes Cost to student of a television set [2] (v) One named: e.g. plumbing/electricity supply/carpentry/agricultural studies Not just engineering/building unless specified. [1] (vi) Three advantages: Standardised qualifications Enables people to learn on the job Raises the standard of skills in the country Allows people to earn whilst they learn Involves businesses directly in training Working alongside skilled professionals [3] (c) (i) Industrial countries and developing countries. [2] (ii) 17% - allow 18% [1] (iii) Two reasons: Lack of government money to build schools Poverty/people cannot afford to stay on at school Lack of skilled teachers Cultural attitudes towards education [2] (iv) Three points: Shortage of skilled labour Need to employ ex-patriates/reliance on foreign workers Inability of country to use modern technology/slower rate of industrialisation Country at an economic/political disadvantage in global trade/negative balance of trade Slows down rate of development GNP/GDP will remain low Overdependence on Primary sector [3] (d) (i) Brazil or Namibia. [1] (ii) 70 [1]
Mark scheme, page 8
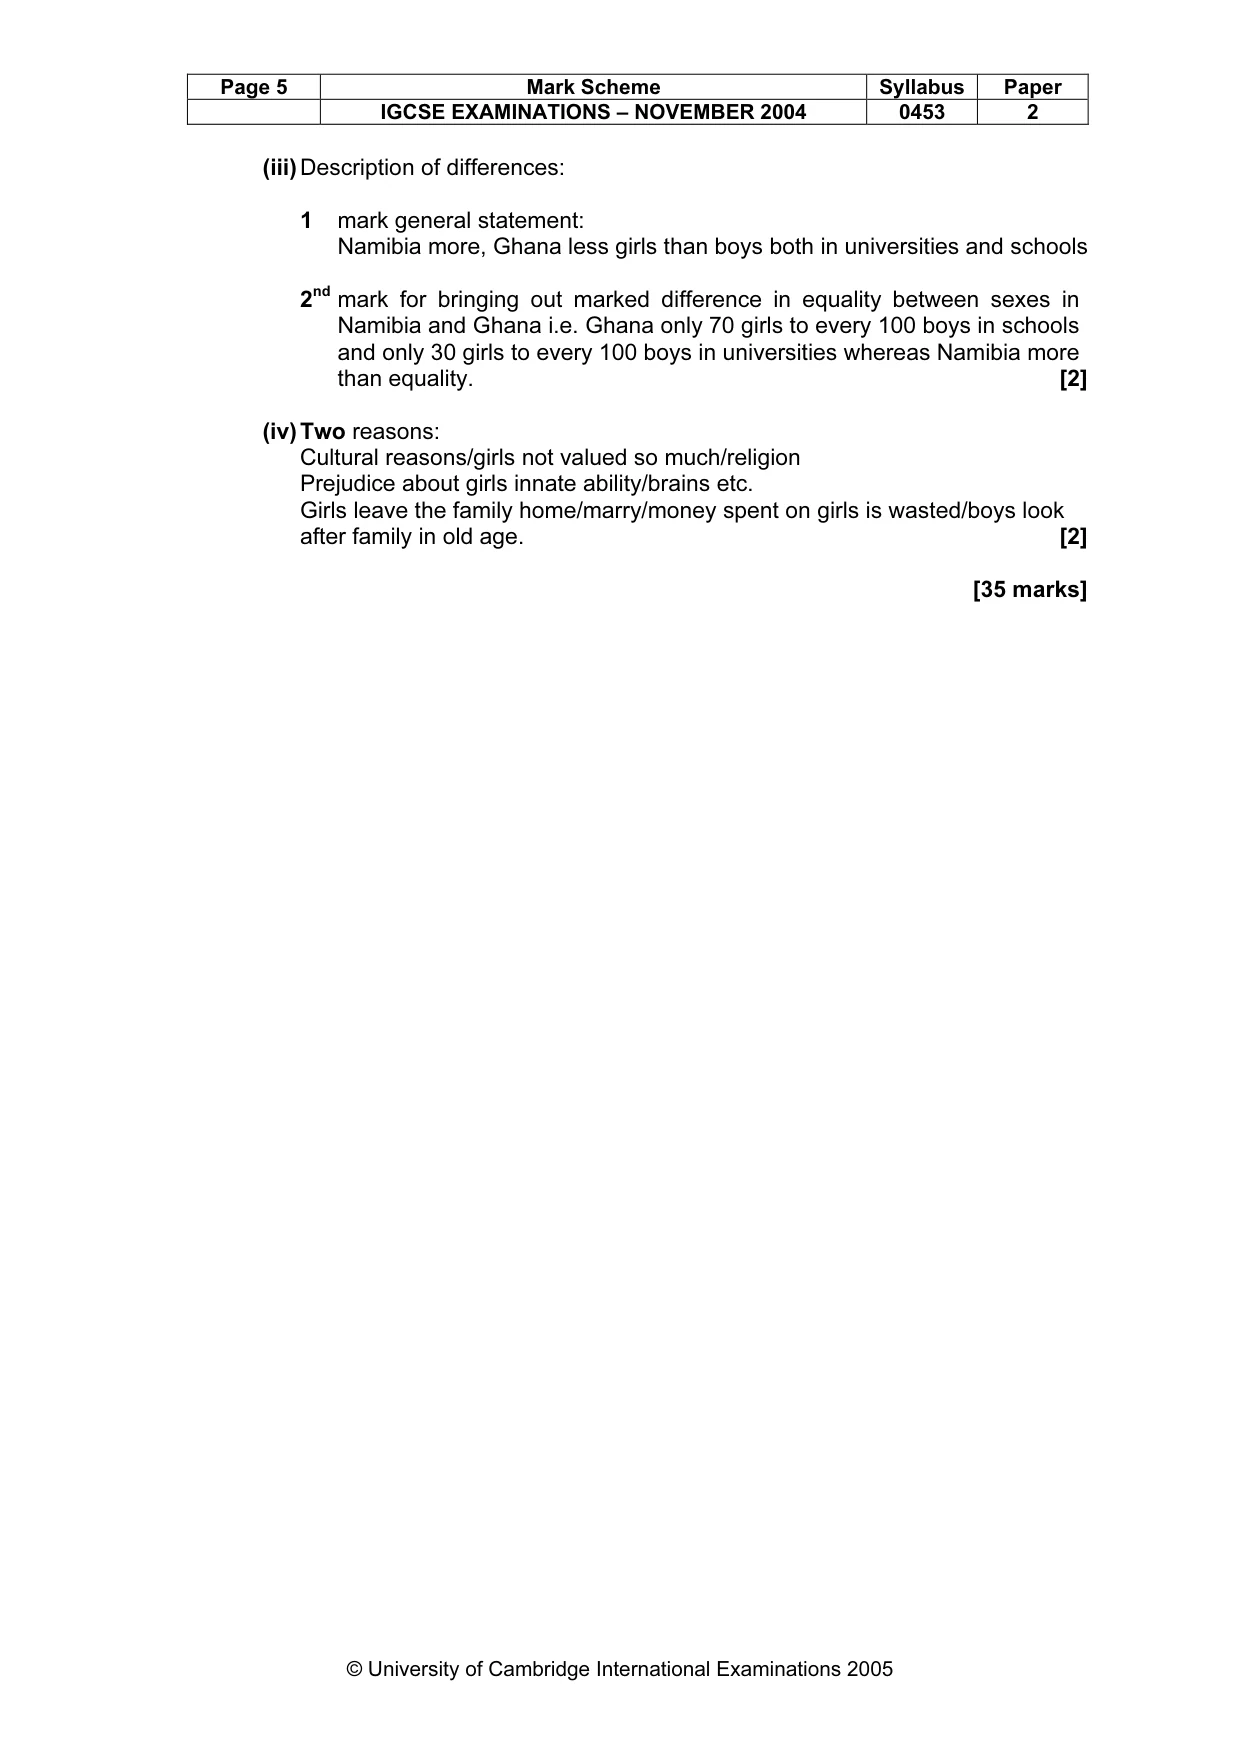
Page 5 Mark Scheme Syllabus Paper IGCSE EXAMINATIONS – NOVEMBER 2004 0453 2 © University of Cambridge International Examinations 2005 (iii) Description of differences: 1 mark general statement: Namibia more, Ghana less girls than boys both in universities and schools 2nd mark for bringing out marked difference in equality between sexes in Namibia and Ghana i.e. Ghana only 70 girls to every 100 boys in schools and only 30 girls to every 100 boys in universities whereas Namibia more than equality. [2] (iv) Two reasons: Cultural reasons/girls not valued so much/religion Prejudice about girls innate ability/brains etc. Girls leave the family home/marry/money spent on girls is wasted/boys look after family in old age. [2] [35 marks]