Cambridge IGCSE Biology (9-1) 0970 — 2022 Oct/Nov Paper 4 · Variant 2
0970/42/O/N/22 · 6 questions · 80 marks · ≈90 min
The question paper and its mark scheme, free to read here and free to download. This is Cambridge’s own paper, exactly as it was sat.
Question paper20 pages


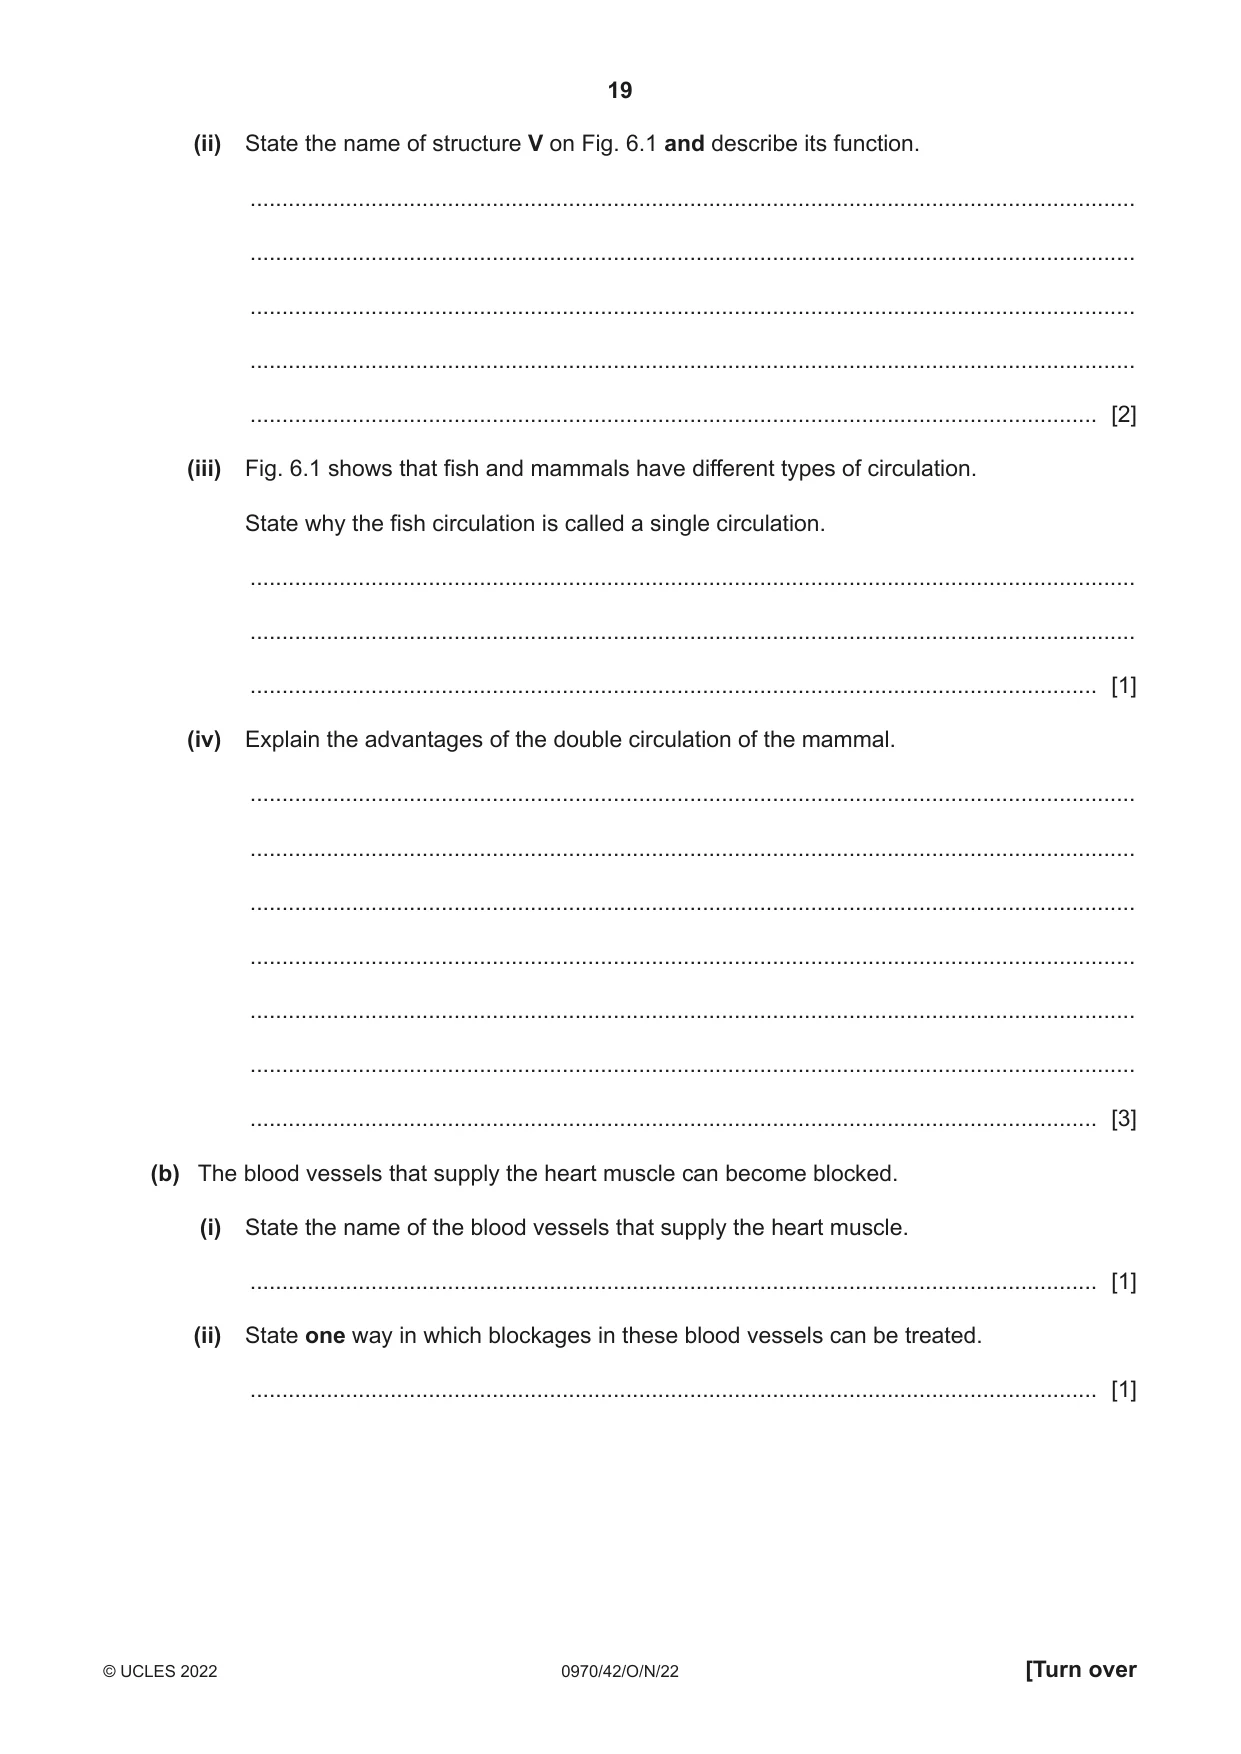
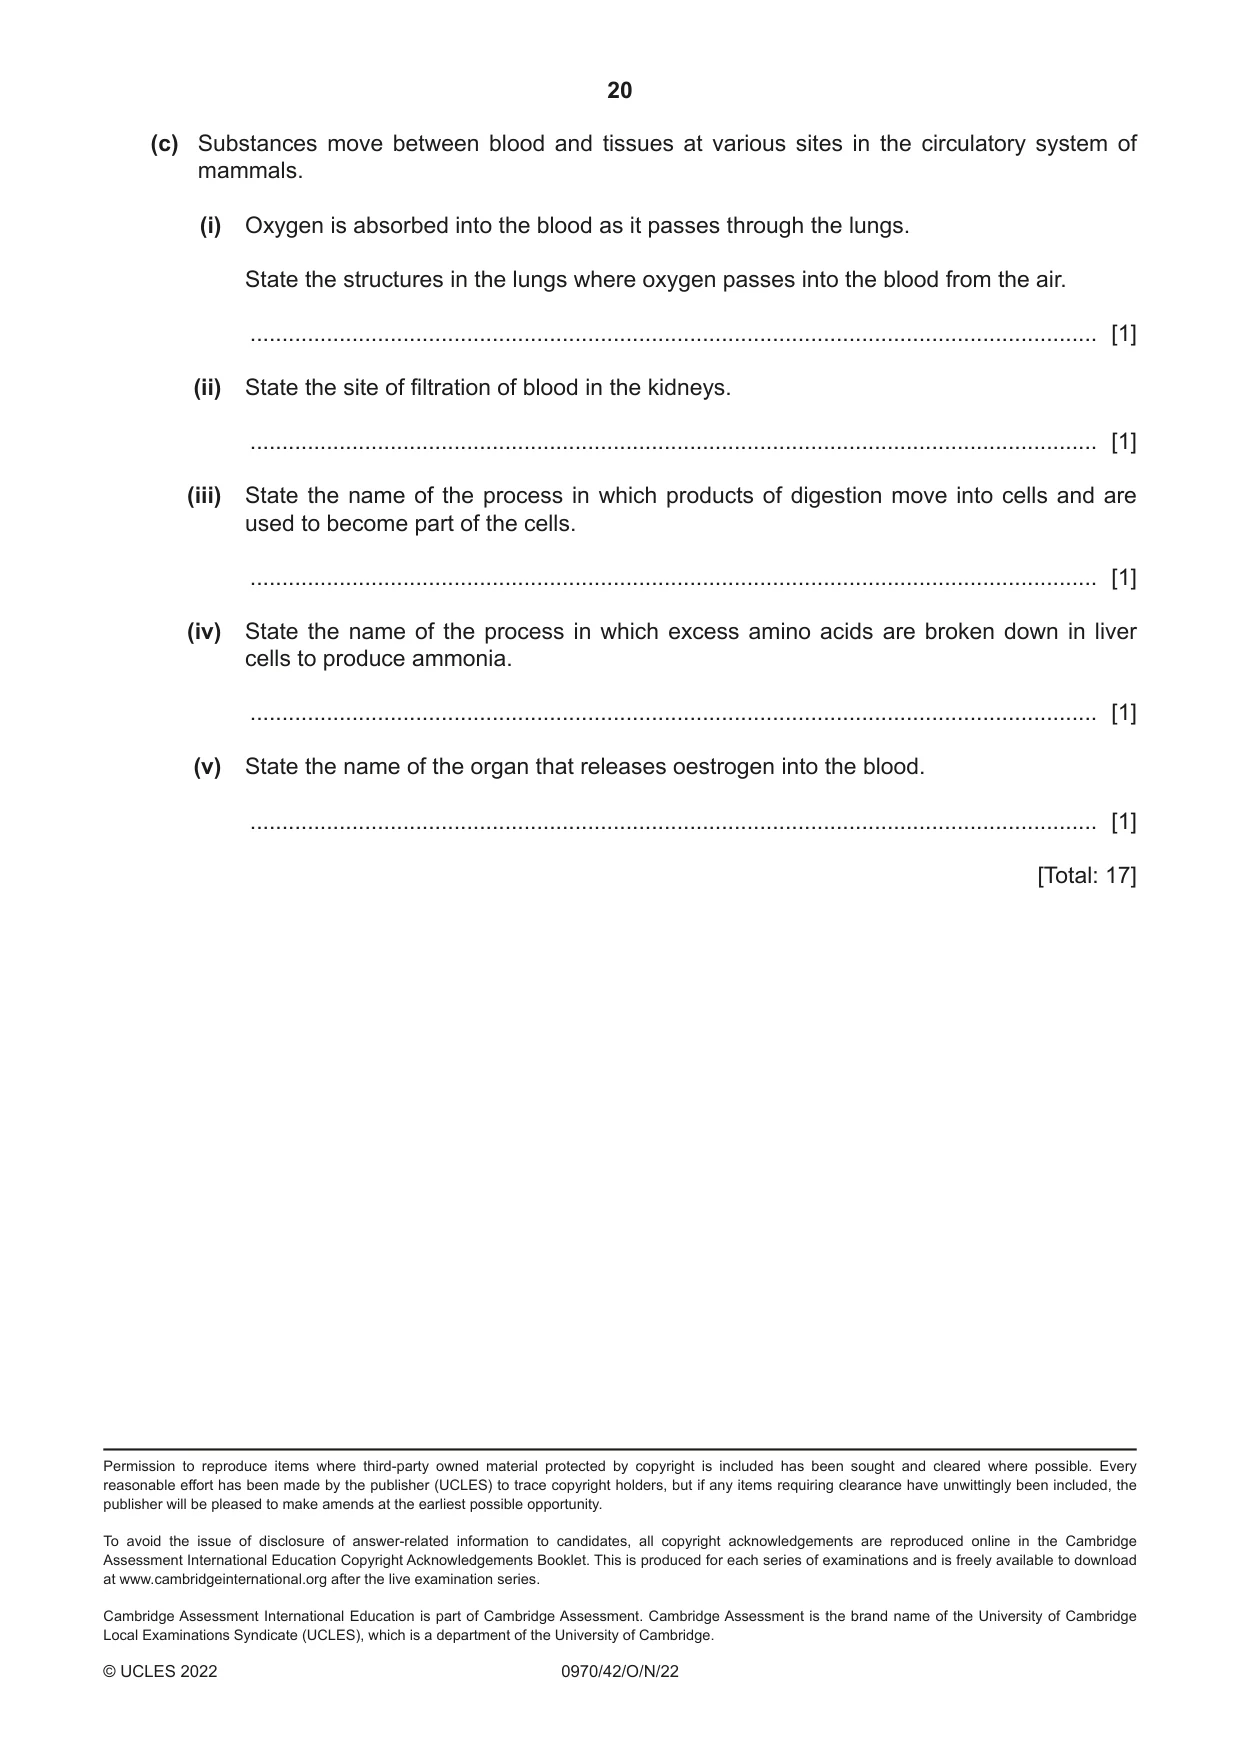
Mark scheme15 pages
Answers below. Sit the paper first if you are practising.
Questions as text
Q1 · Phytoplankton consist of many species of single‑celled and many‑celled algae
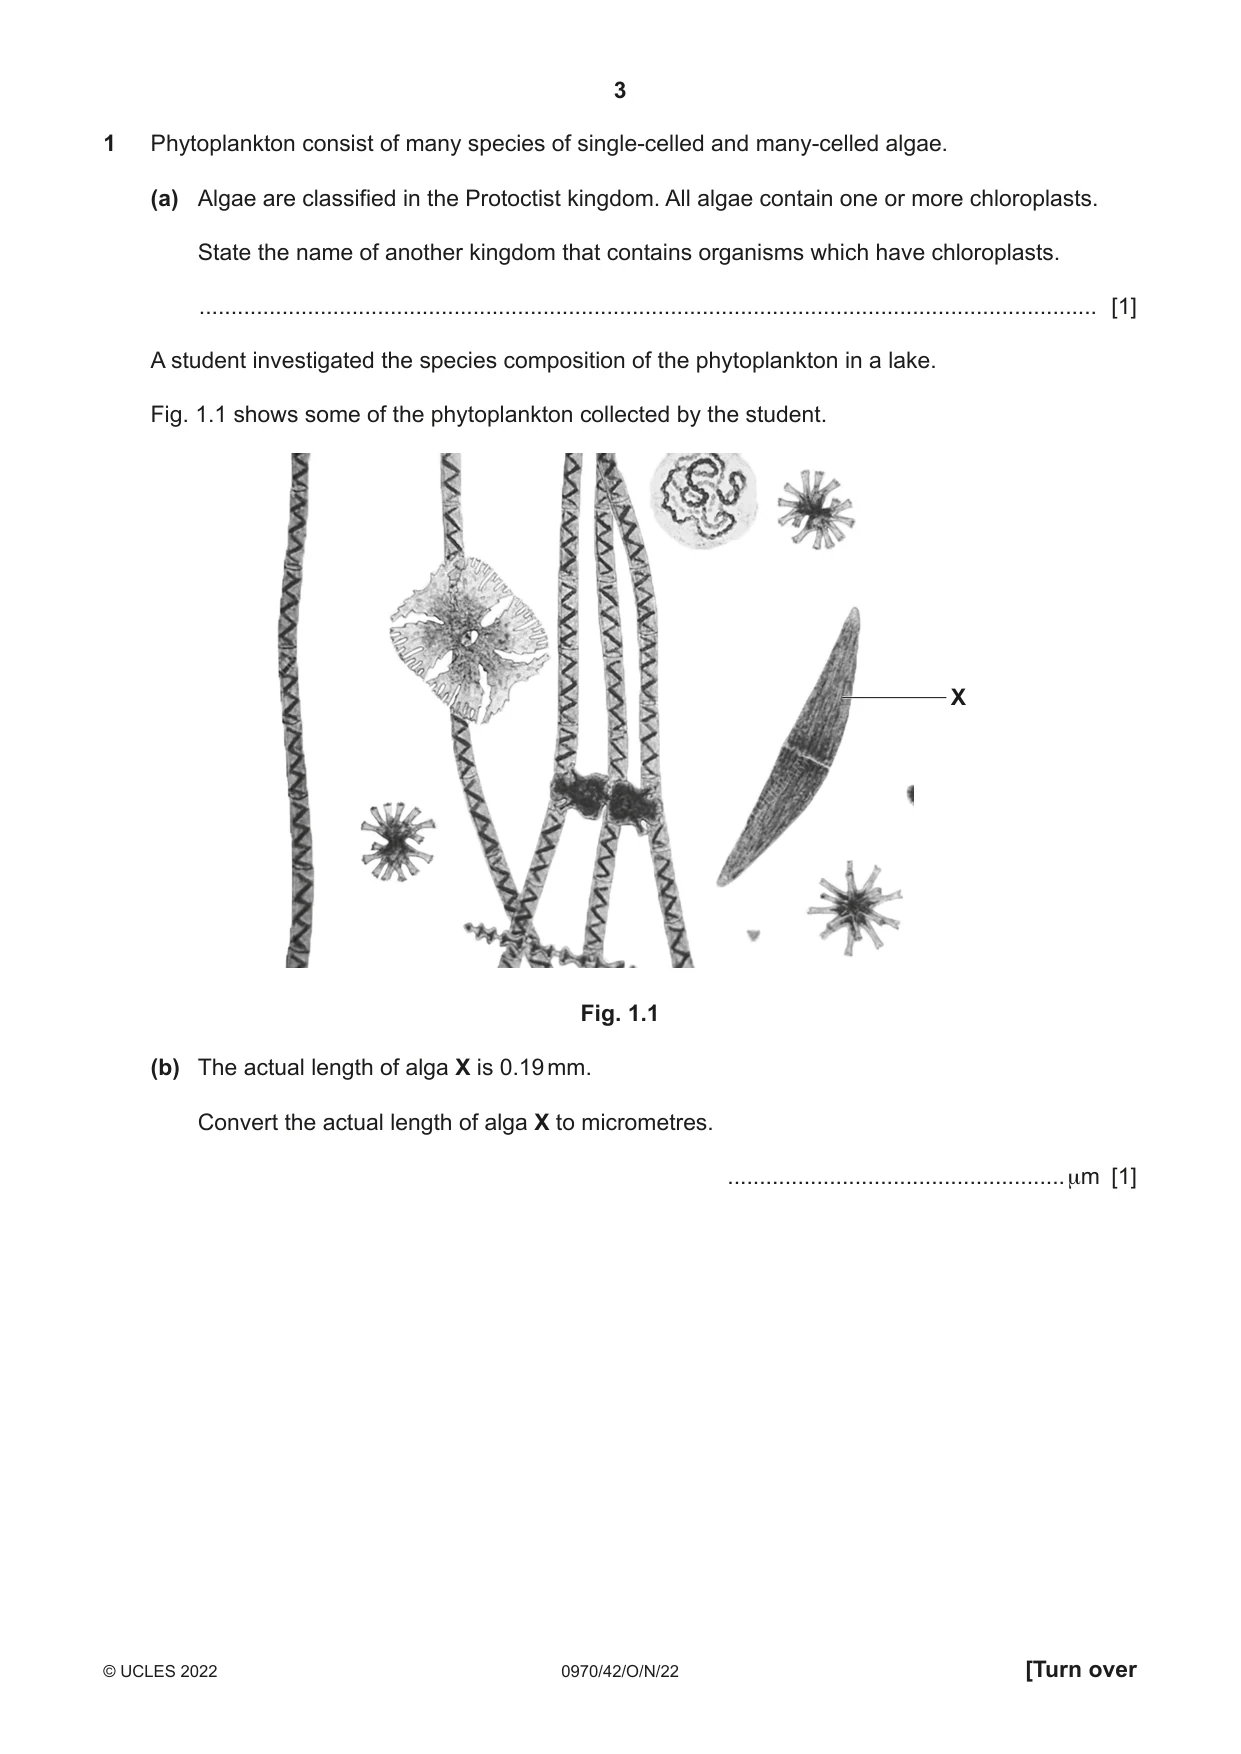
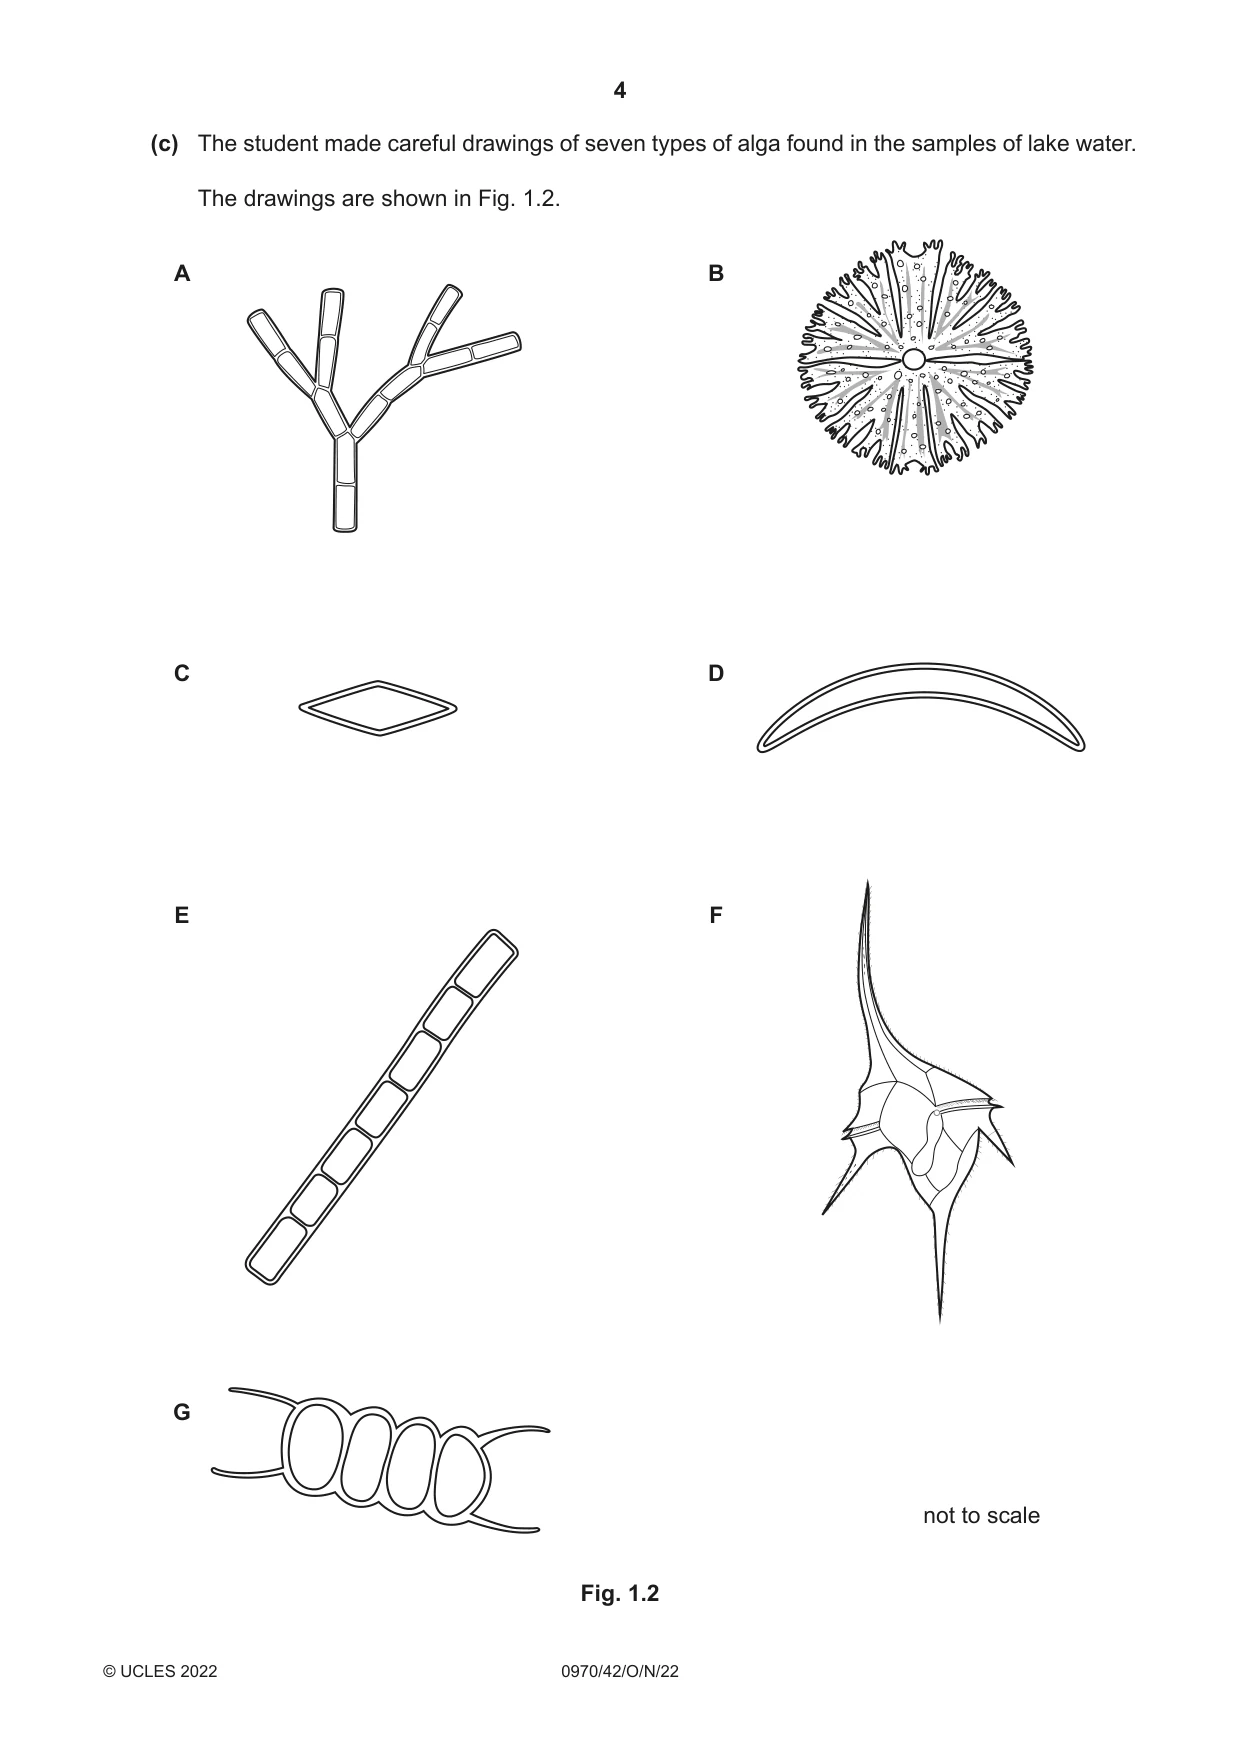
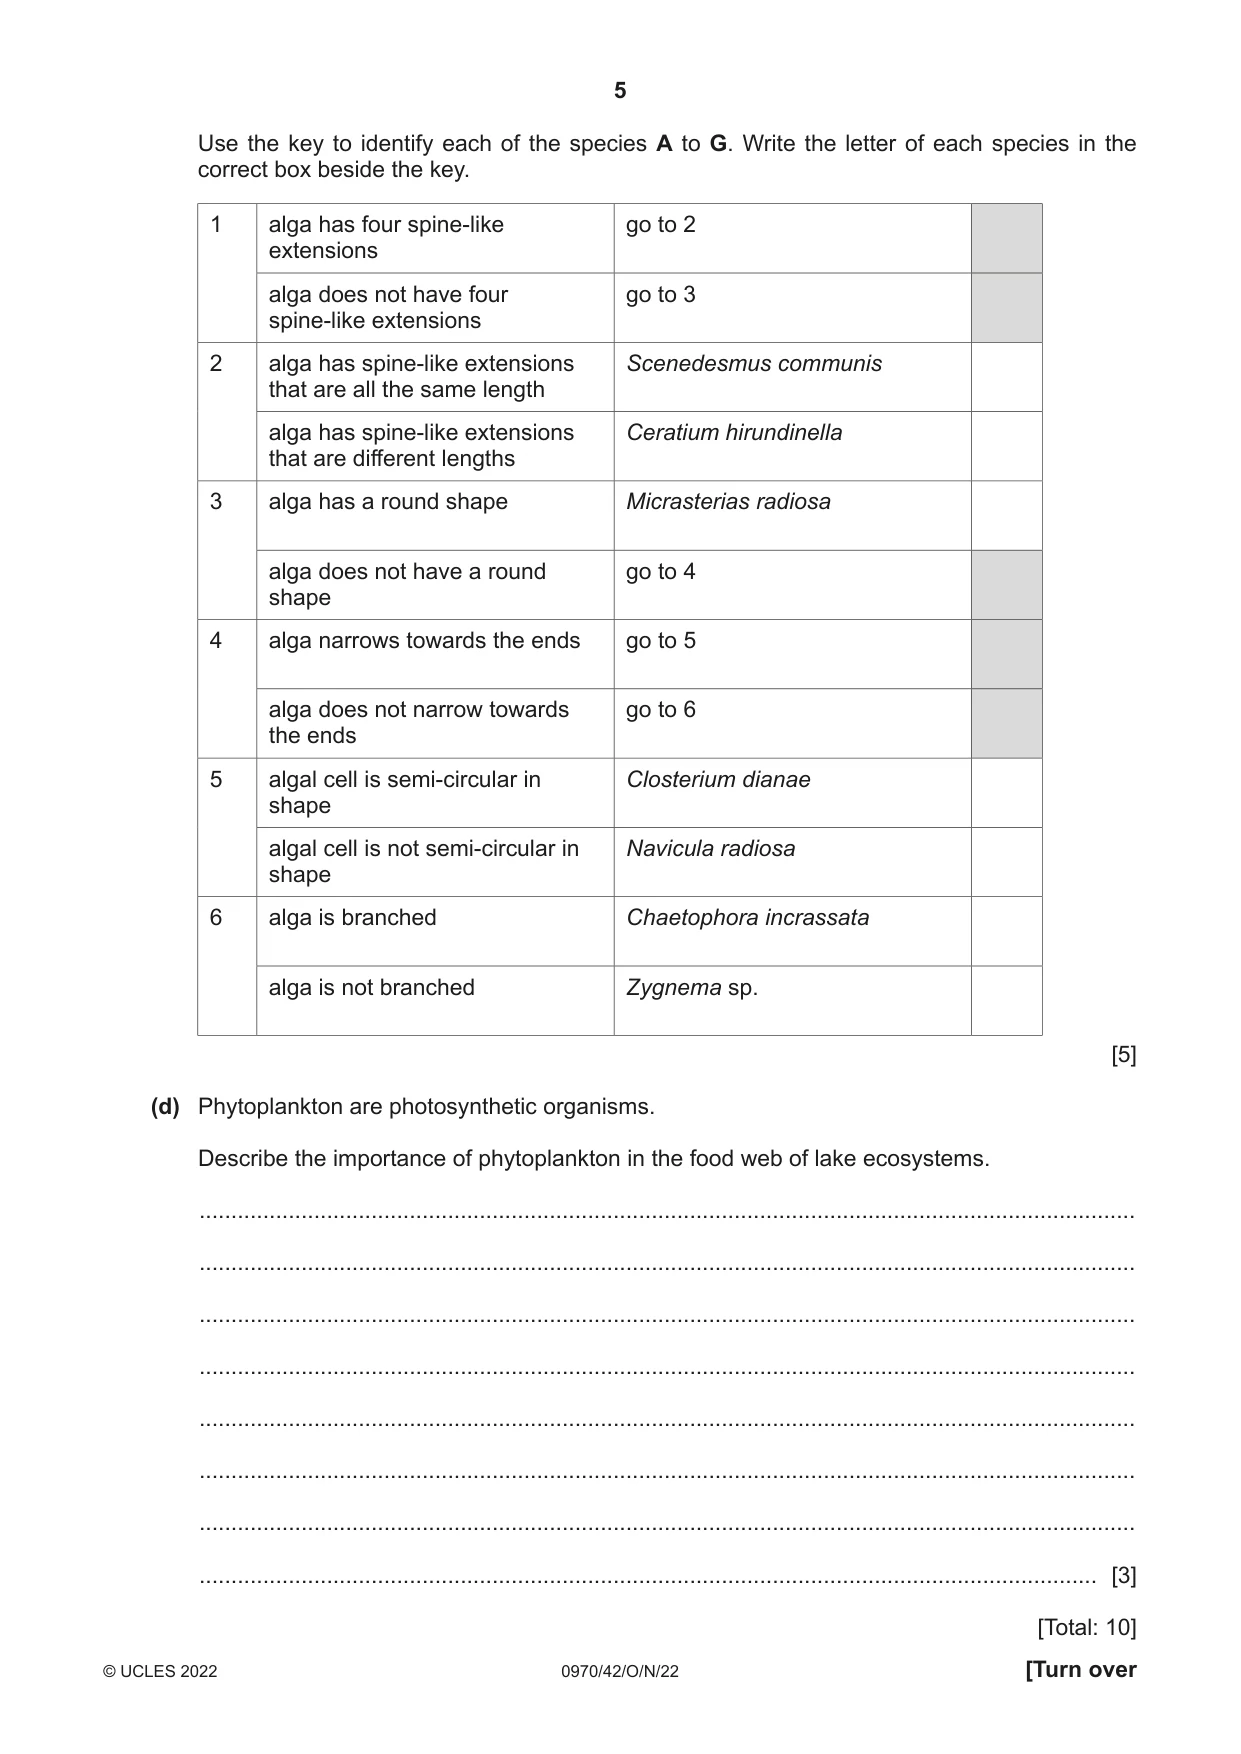
1 Phytoplankton consist of many species of single‑celled and many‑celled algae. (a) Algae are classified in the Protoctist kingdom. All algae contain one or more chloroplasts. State the name of another kingdom that contains organisms which have chloroplasts. ............................................................................................................................................. [1] A student investigated the species composition of the phytoplankton in a lake. Fig. 1.1 shows some of the phytoplankton collected by the student. X Fig. 1.1 (b) The actual length of alga X is 0.19 mm. Convert the actual length of alga X to micrometres. ..................................................... μm [1] (c) The student made careful drawings of seven types of alga found in the samples of lake water. The drawings are shown in Fig. 1.2. A B C D E F G not to scale Fig. 1.2 Use the key to identify each of the species A to G. Write the letter of each species in the correct box beside the key. 1 alga has four spine‑like go to 2 extensions alga does not have four go to 3 spine‑like extensions 2 alga has spine‑like extensions Scenedesmus communis that are all the same length alga has spine‑like extensions Ceratium hirundinella that are different lengths 3 alga has a round shape Micrasterias radiosa alga does not have a round go to 4 shape 4 alga narrows towards the ends go to 5 alga does not narrow towards go to 6 the ends 5 algal cell is semi‑circular in Closterium dianae shape algal cell is not semi‑circular in Navicula radiosa shape 6 alga is branched Chaetophora incrassata alga is not branched Zygnema sp. [5] (d) Phytoplankton are photosynthetic organisms. Describe the importance of phytoplankton in the food web of lake ecosystems. ................................................................................................................................................... ................................................................................................................................................... ................................................................................................................................................... ................................................................................................................................................... ................................................................................................................................................... ................................................................................................................................................... ................................................................................................................................................... ............................................................................................................................................. [3] [Total: 10]
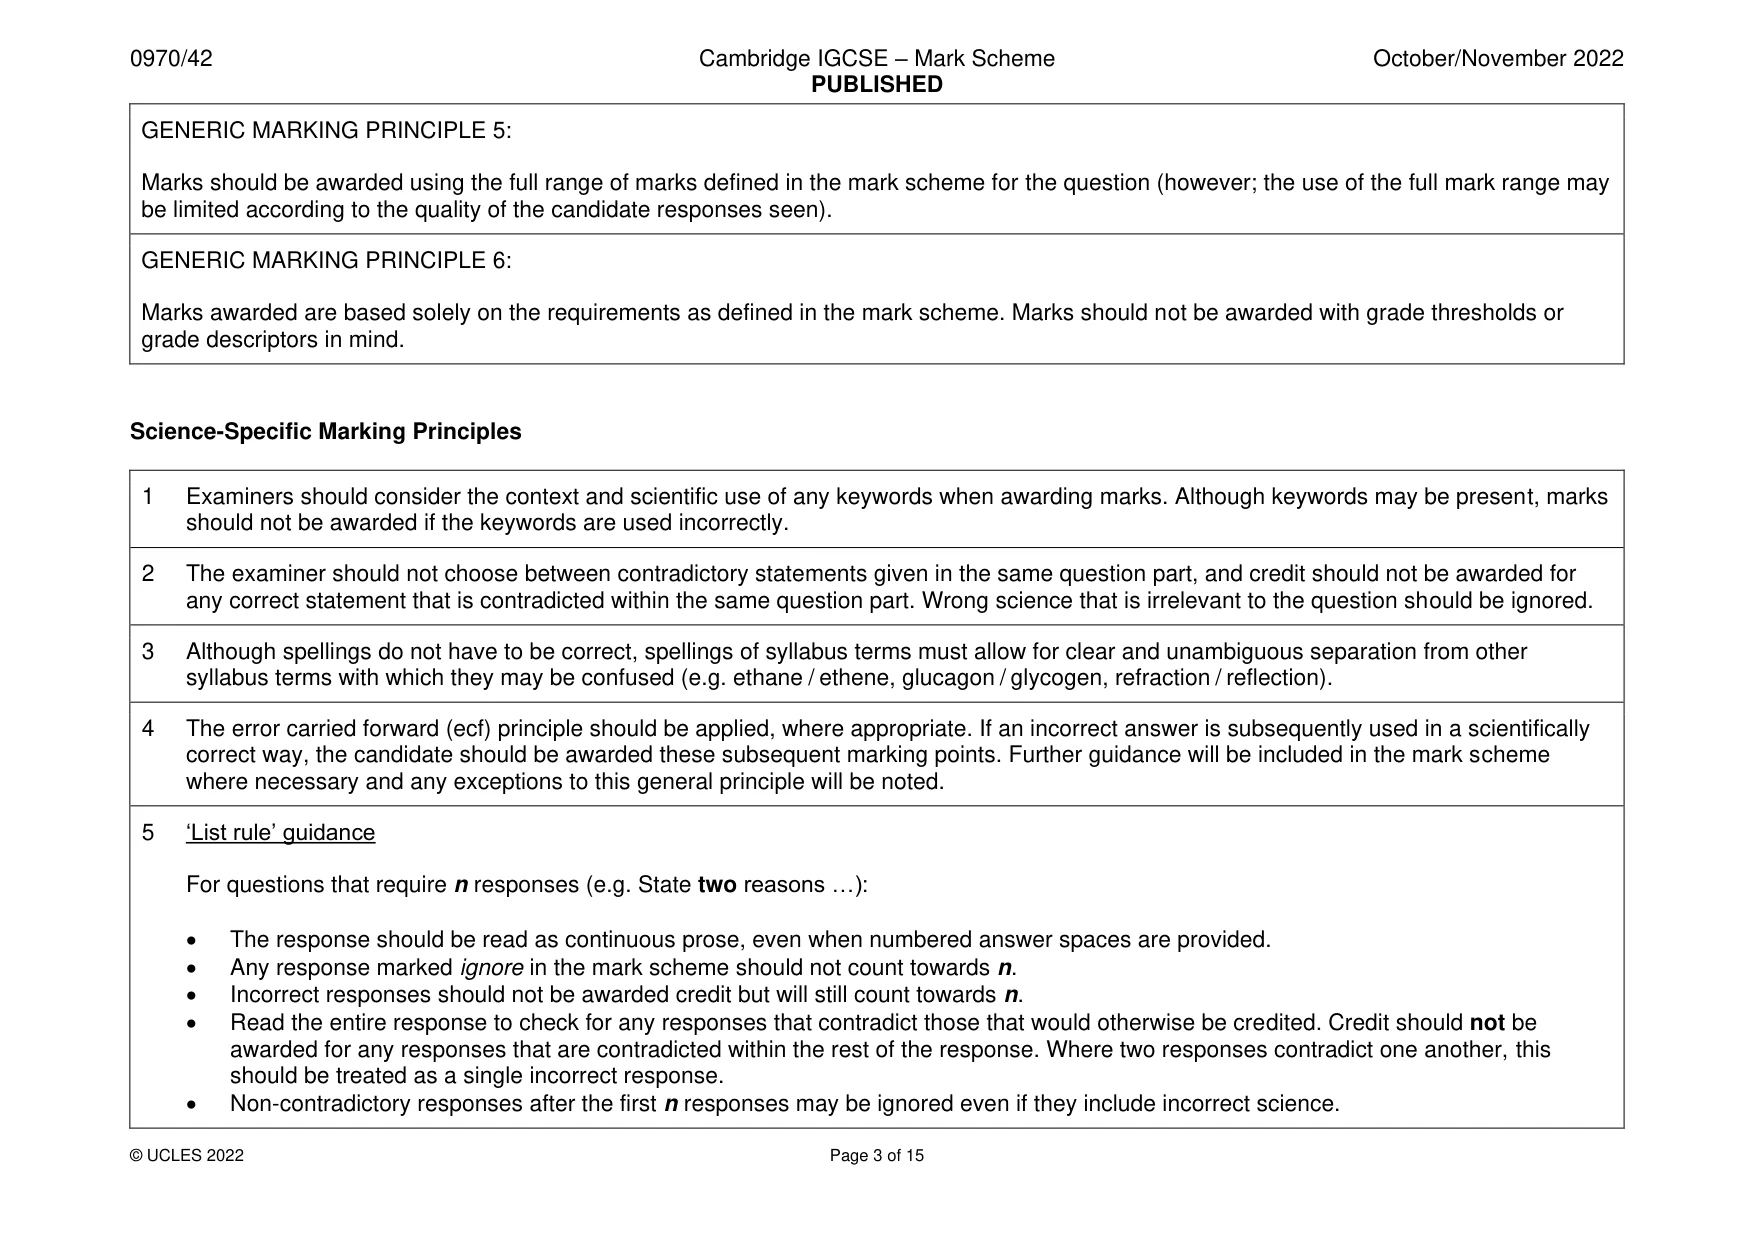
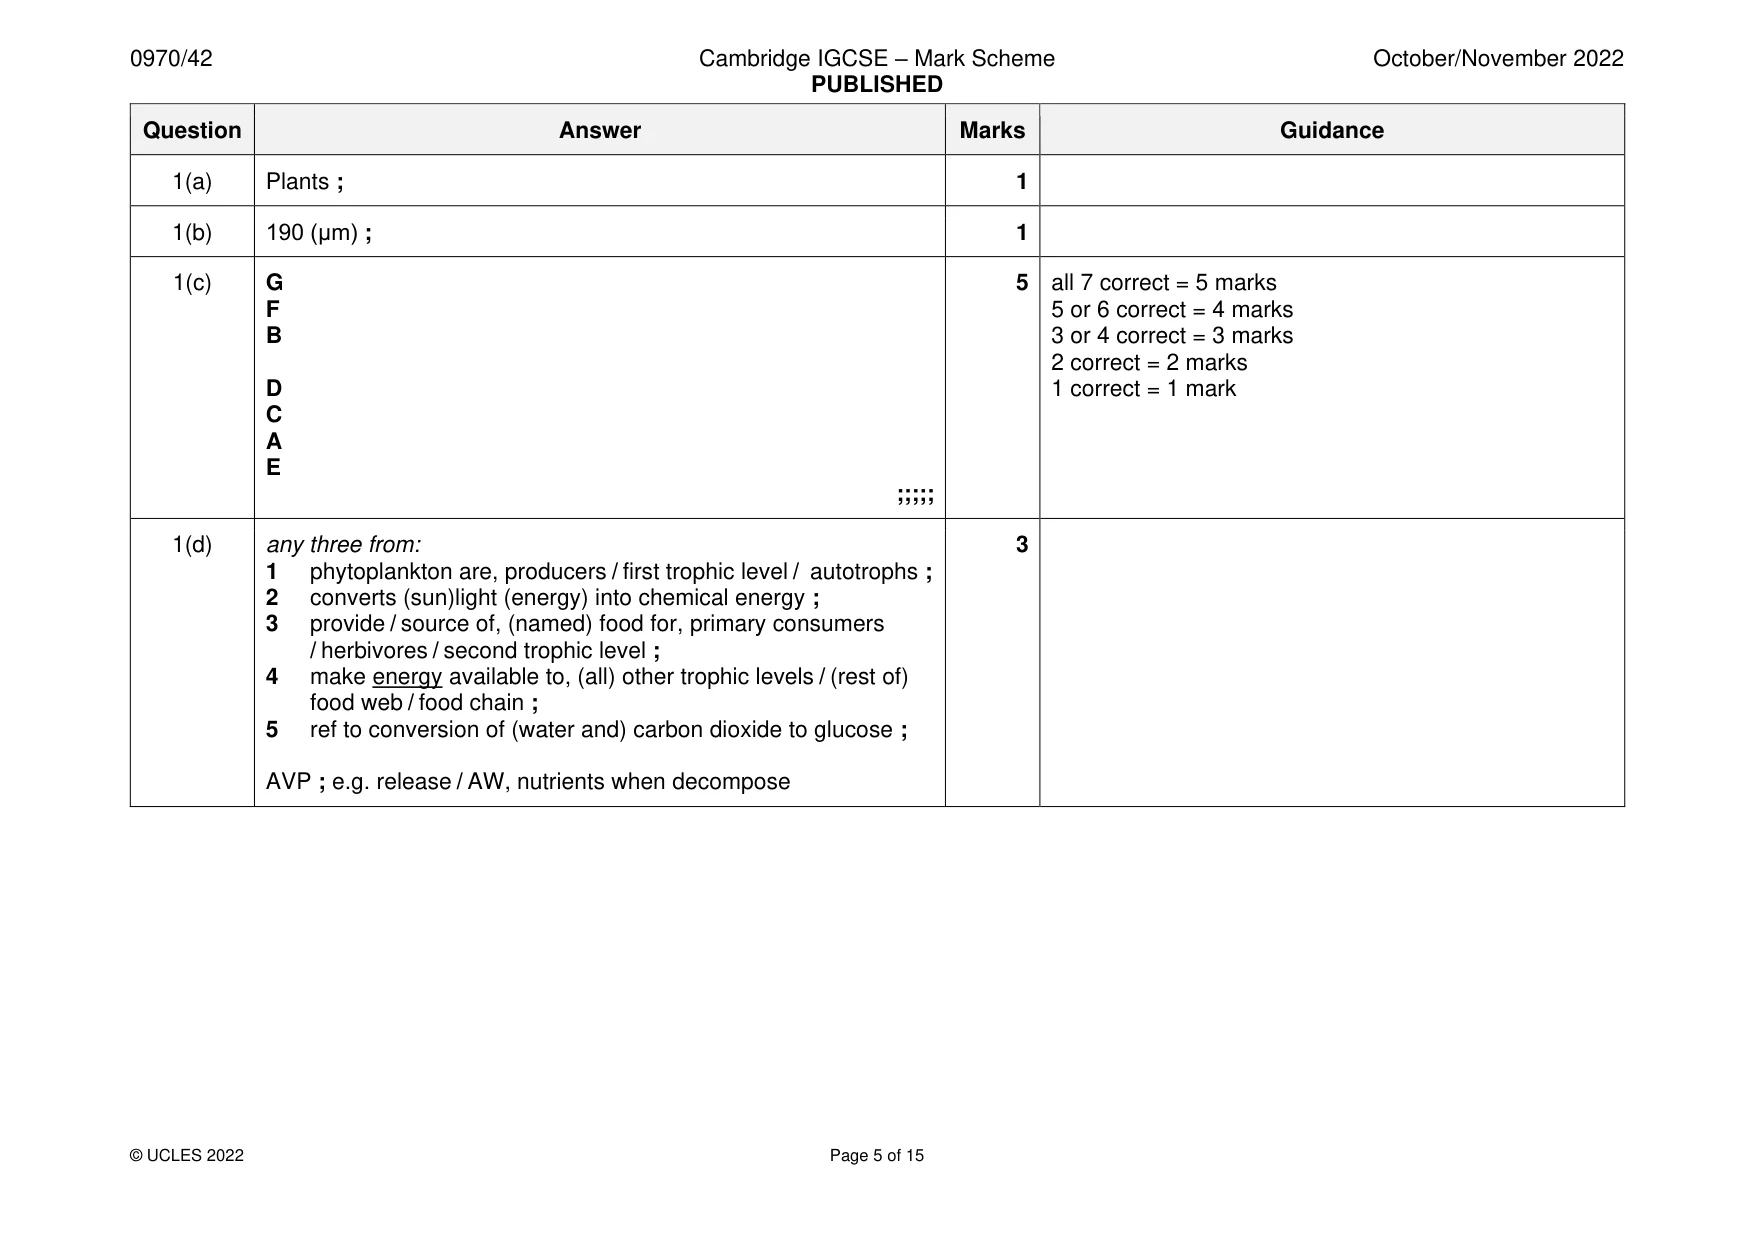
Mark scheme: Question Answer Marks Guidance 1(a) Plants ; 1 1(b) 190 (μm) ; 1 1(c) G 5 all 7 correct = 5 marks F 5 or 6 correct = 4 marks B 3 or 4 correct = 3 marks 2 correct = 2 marks D 1 correct = 1 mark C A E ;;;;; 1(d) any three from: 3 1 phytoplankton are, producers / first trophic level / autotrophs ; 2 converts (sun)light (energy) into chemical energy ; 3 provide / source of, (named) food for, primary consumers / herbivores / second trophic level ; 4 make energy available to, (all) other trophic levels / (rest of) food web / food chain ; 5 ref to conversion of (water and) carbon dioxide to glucose ; AVP ; e.g. release / AW, nutrients when decompose
More questions on Concept and uses of classification systems
Q2 · A diagram of the human alimentary canal and associated organs
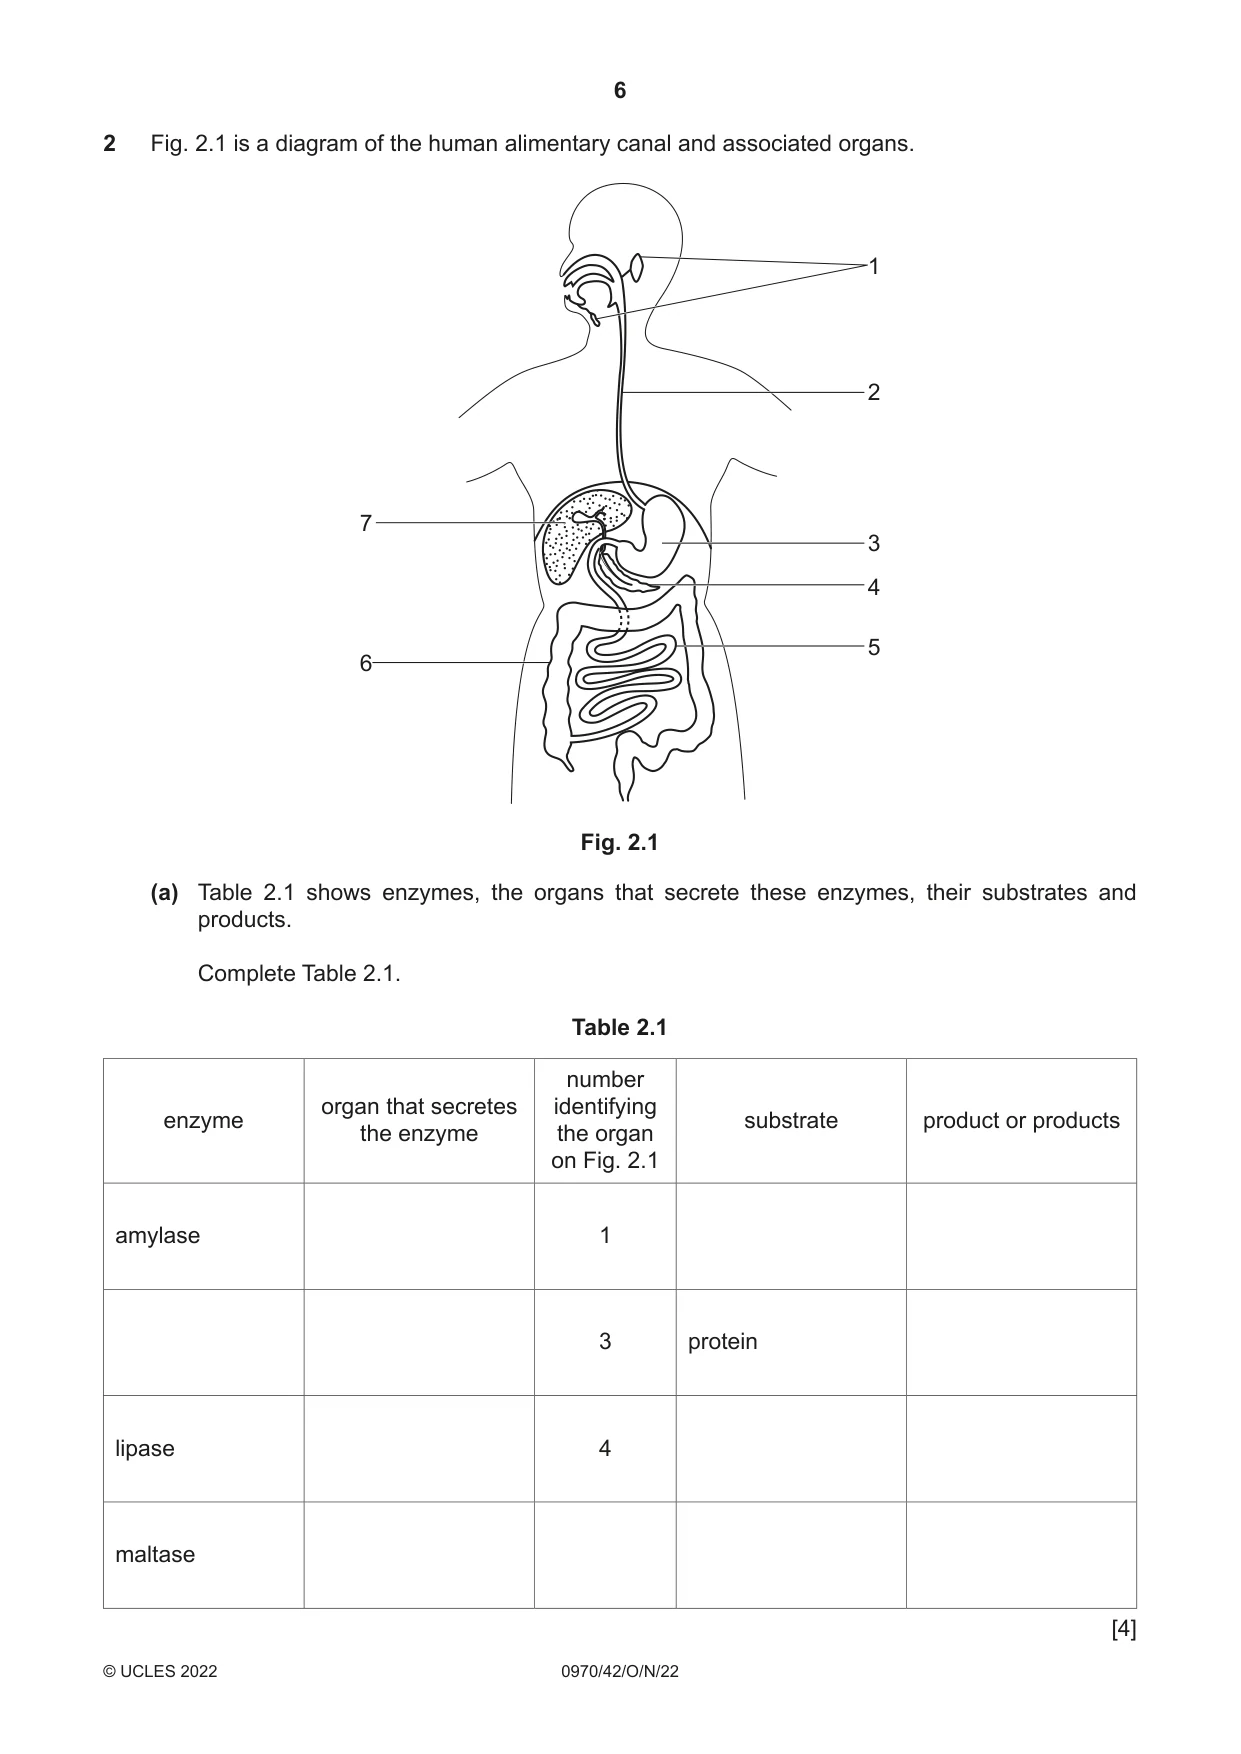
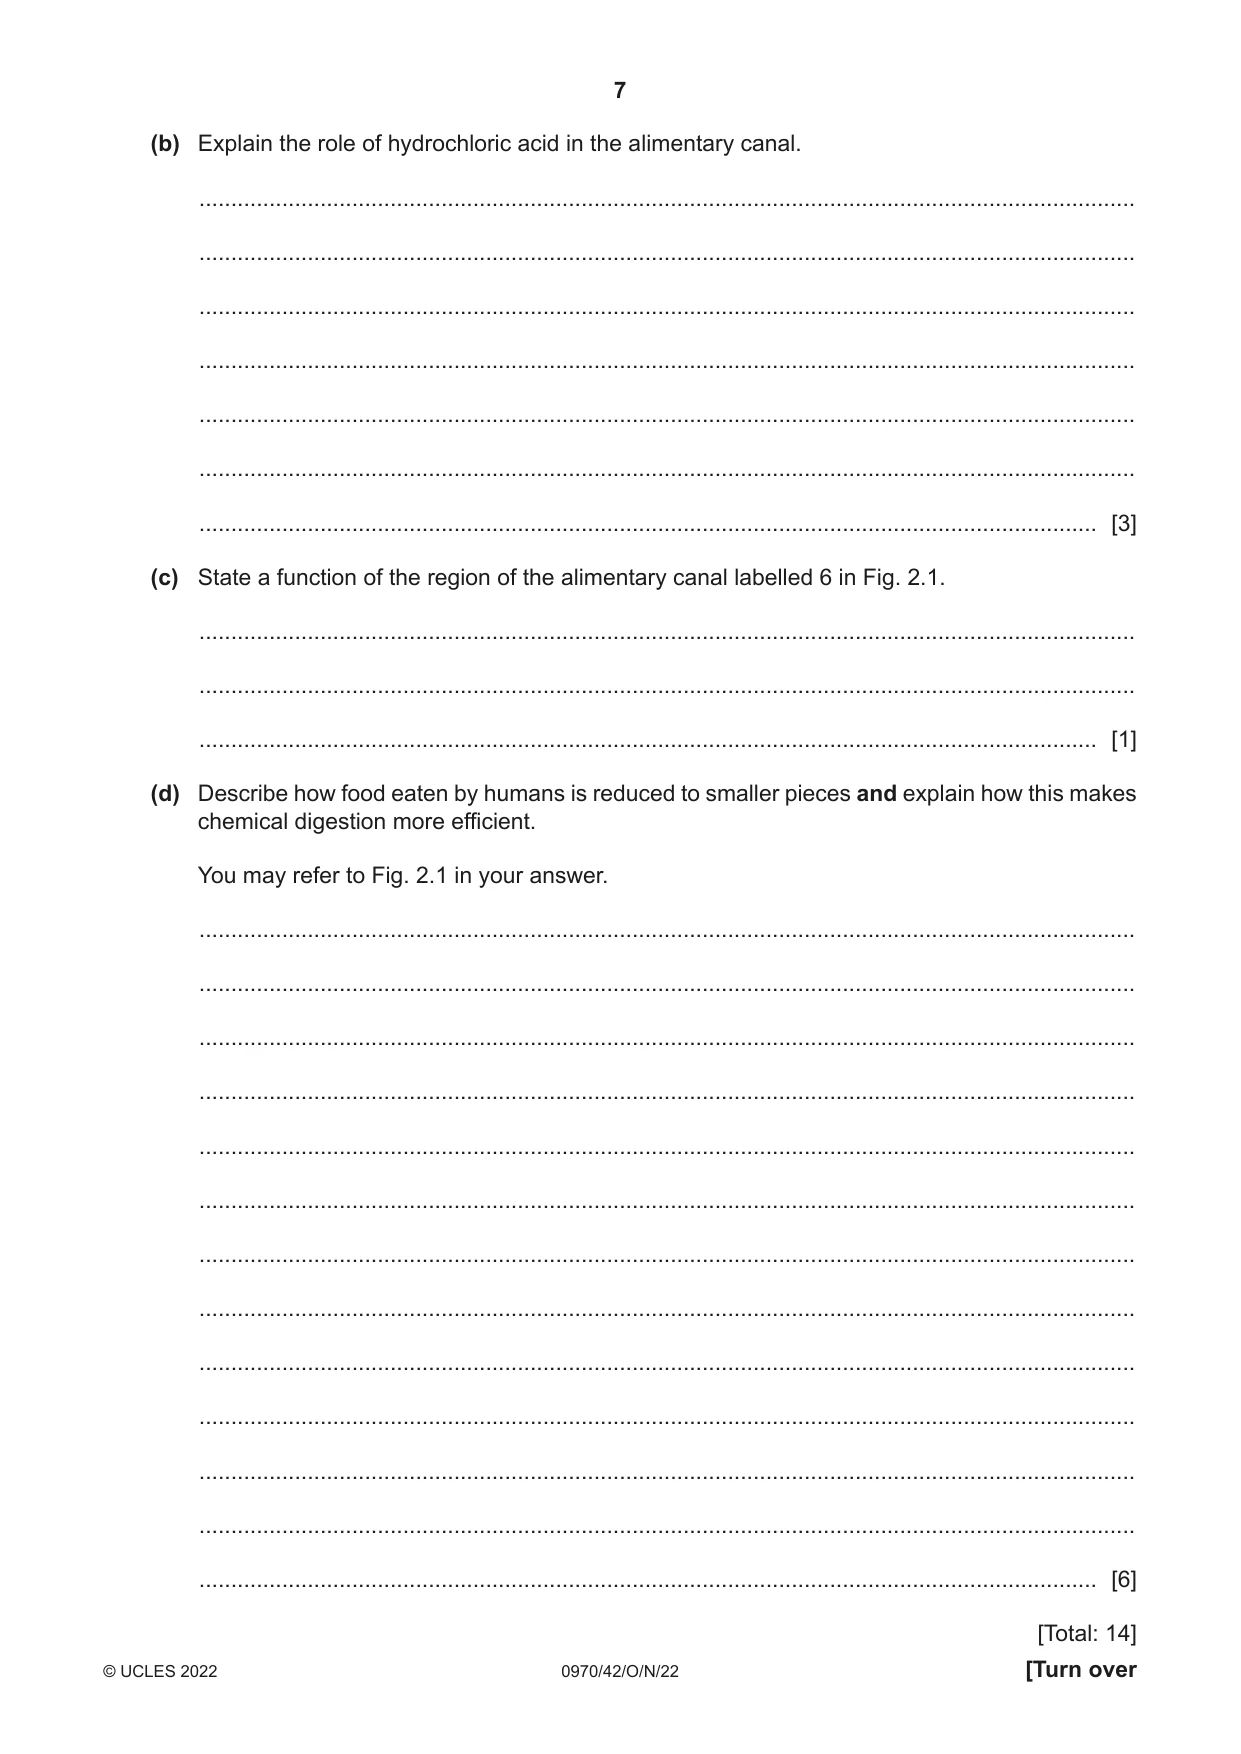
2 Fig. 2.1 is a diagram of the human alimentary canal and associated organs. 1 2 7 3 4 5 6 Fig. 2.1 (a) Table 2.1 shows enzymes, the organs that secrete these enzymes, their substrates and products. Complete Table 2.1. Table 2.1 number organ that secretes identifying enzyme substrate product or products the enzyme the organ on Fig. 2.1 amylase 1 3 protein lipase 4 maltase [4] (b) Explain the role of hydrochloric acid in the alimentary canal. ................................................................................................................................................... ................................................................................................................................................... ................................................................................................................................................... ................................................................................................................................................... ................................................................................................................................................... ................................................................................................................................................... ............................................................................................................................................. [3] (c) State a function of the region of the alimentary canal labelled 6 in Fig. 2.1. ................................................................................................................................................... ................................................................................................................................................... ............................................................................................................................................. [1] (d) Describe how food eaten by humans is reduced to smaller pieces and explain how this makes chemical digestion more efficient. You may refer to Fig. 2.1 in your answer. ................................................................................................................................................... ................................................................................................................................................... ................................................................................................................................................... ................................................................................................................................................... ................................................................................................................................................... ................................................................................................................................................... ................................................................................................................................................... ................................................................................................................................................... ................................................................................................................................................... ................................................................................................................................................... ................................................................................................................................................... ................................................................................................................................................... ............................................................................................................................................. [6] [Total: 14]
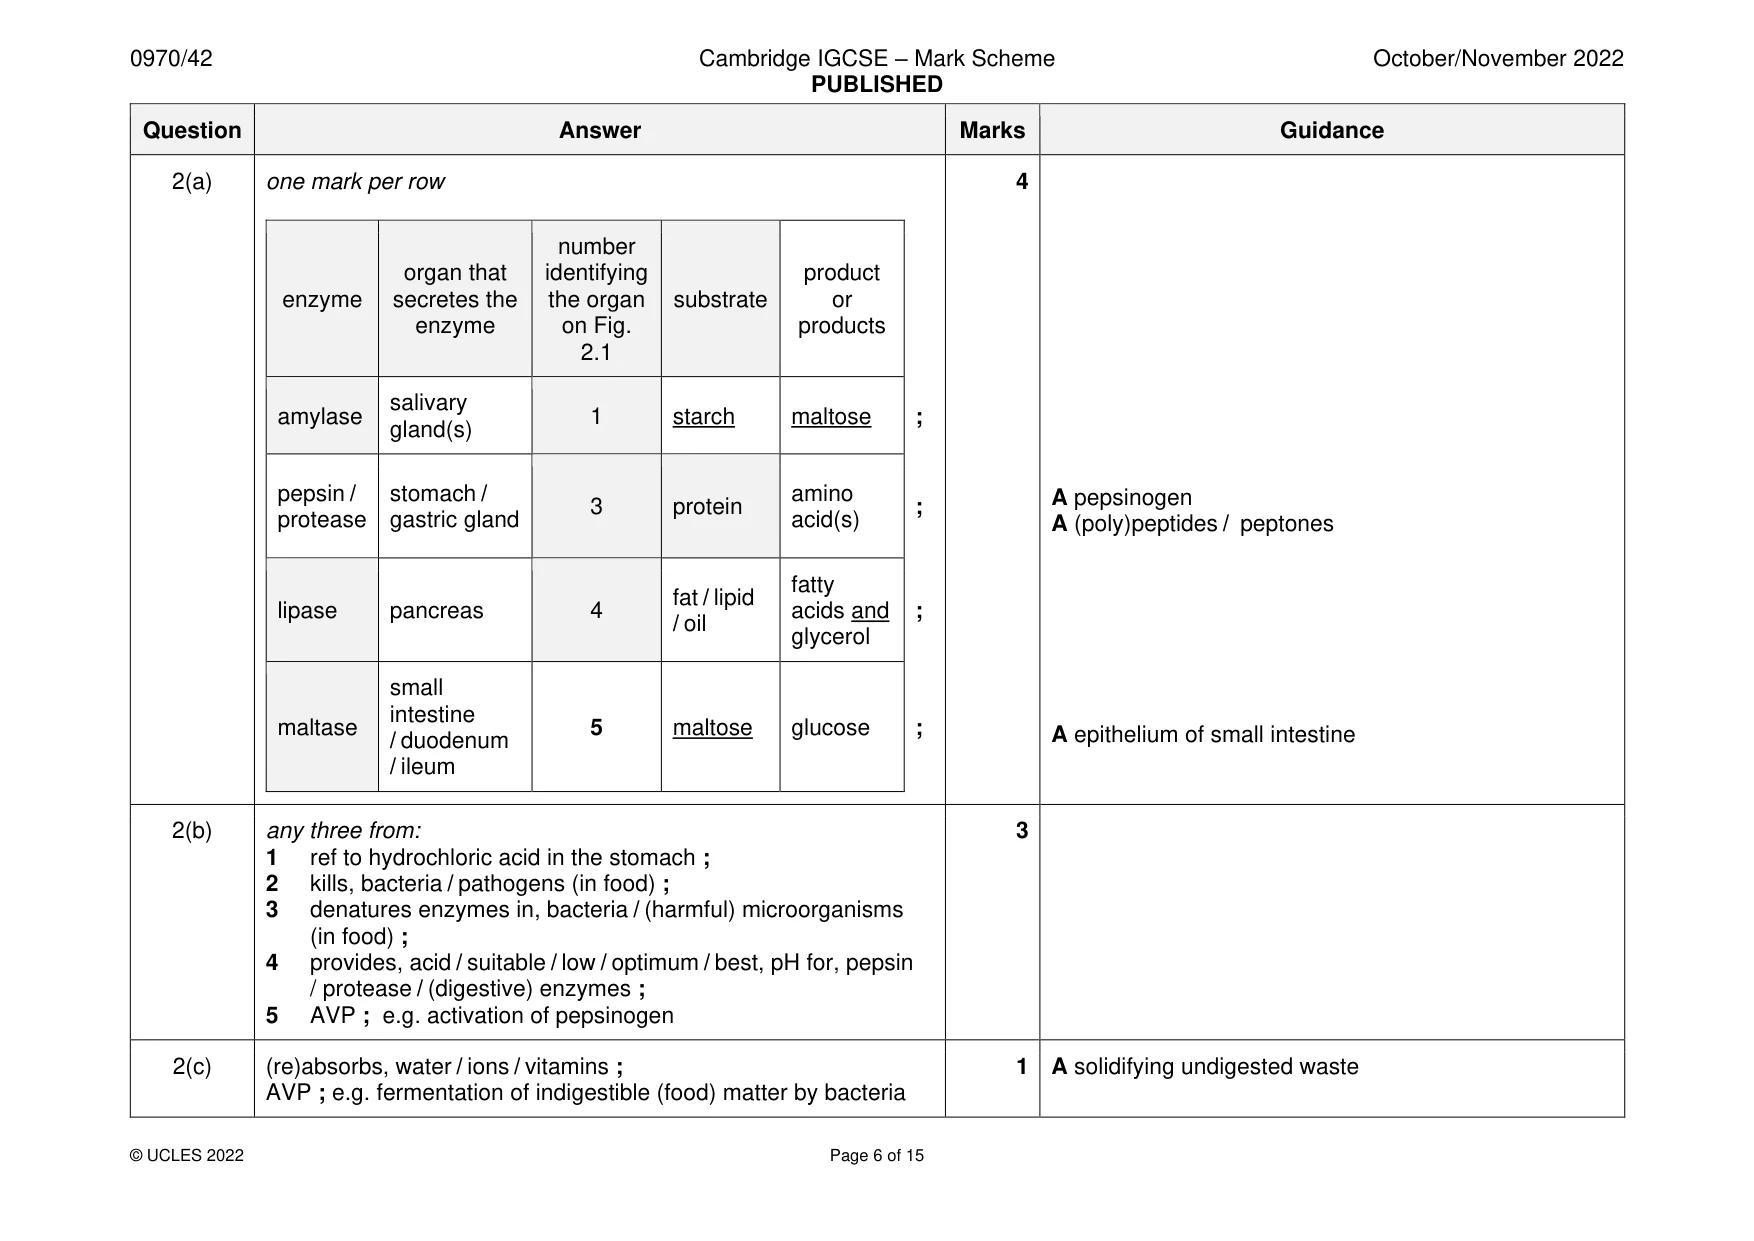
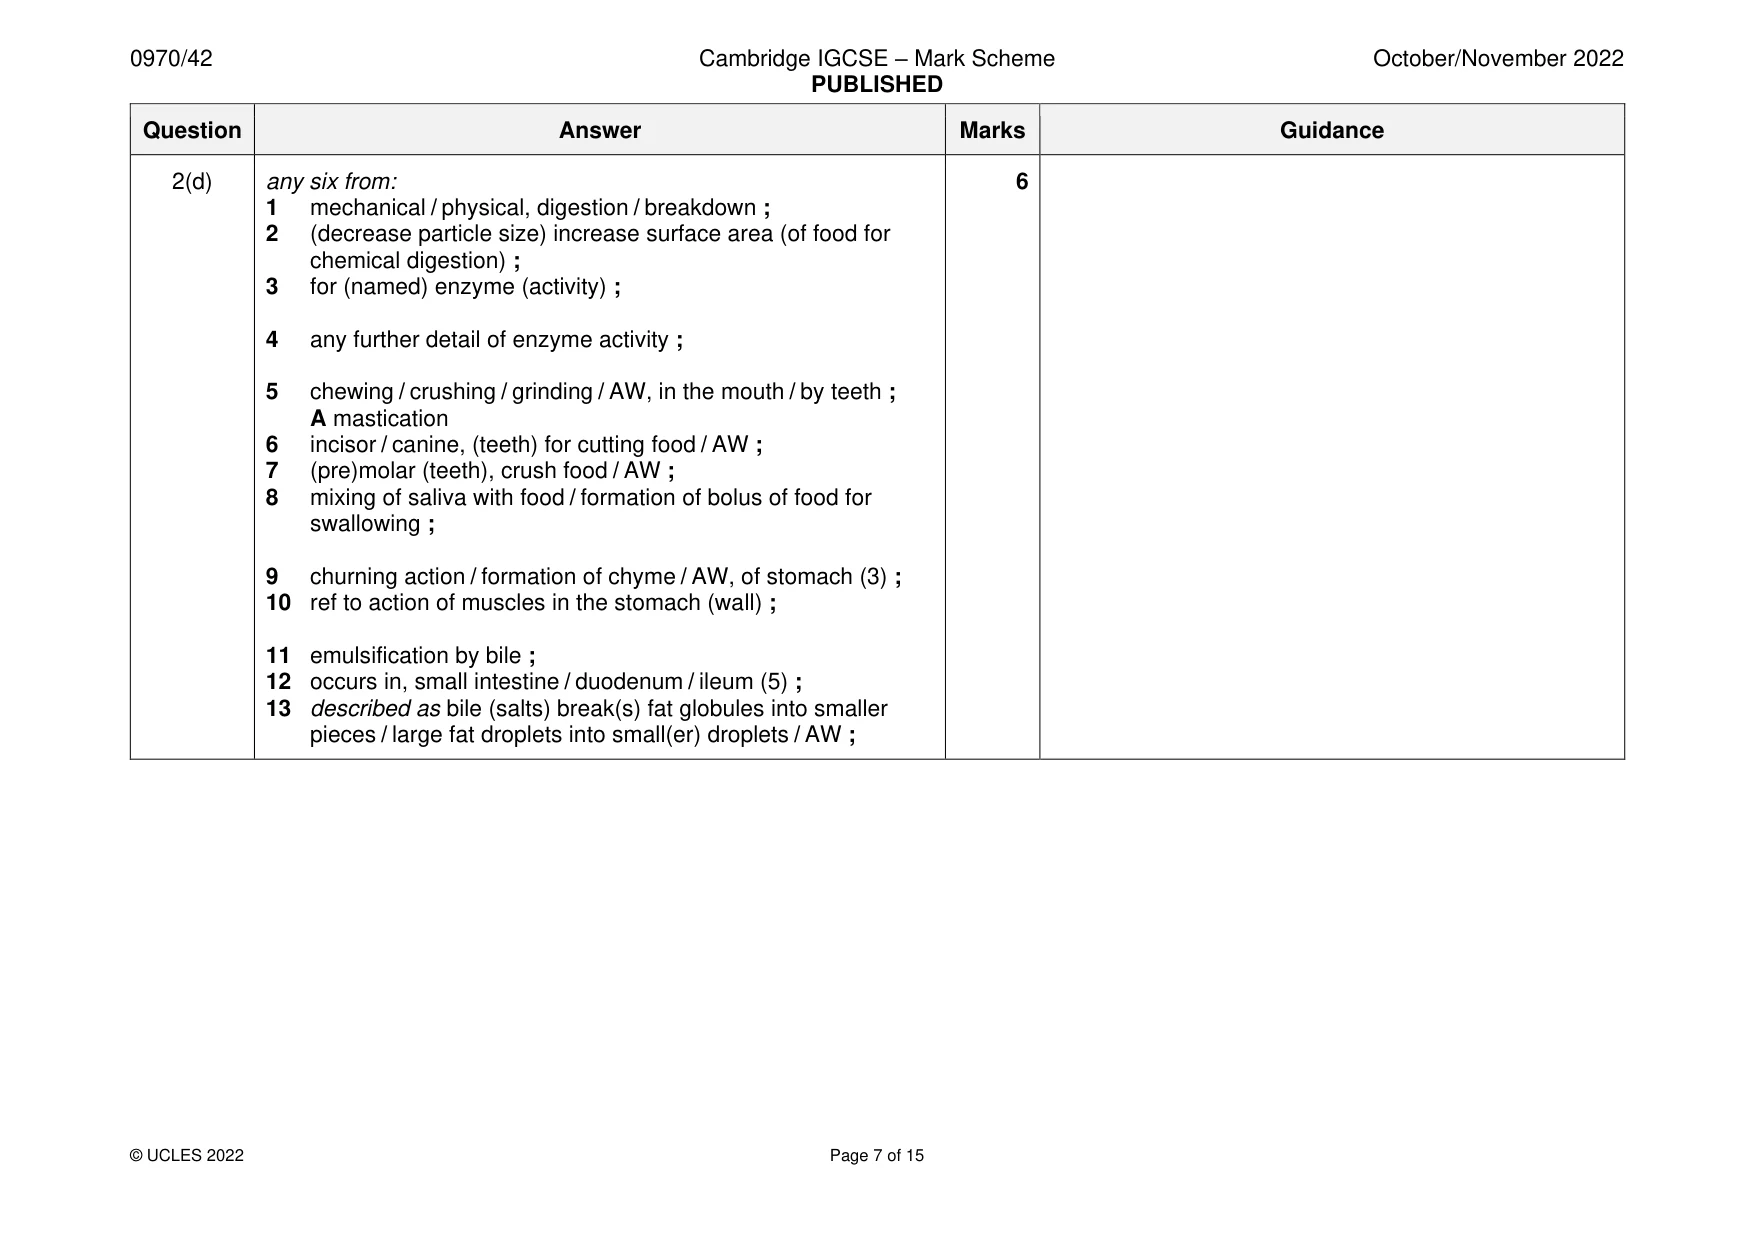
Mark scheme: 2(a) one mark per row 4 number organ that identifying product enzyme secretes the the organ substrate or enzyme on Fig. products 2.1 salivary amylase 1 starch maltose ; gland(s) pepsin / stomach / amino A pepsinogen 3 protein ; protease gastric gland acid(s) A (poly)peptides / peptones fatty fat / lipid lipase pancreas 4 acids and ; / oil glycerol small intestine maltase 5 maltose glucose ; / duodenum A epithelium of small intestine / ileum 2(b) any three from: 3 1 ref to hydrochloric acid in the stomach ; 2 kills, bacteria / pathogens (in food) ; 3 denatures enzymes in, bacteria / (harmful) microorganisms (in food) ; 4 provides, acid / suitable / low / optimum / best, pH for, pepsin / protease / (digestive) enzymes ; 5 AVP ; e.g. activation of pepsinogen 2(c) (re)absorbs, water / ions / vitamins ; 1 A solidifying undigested waste AVP ; e.g. fermentation of indigestible (food) matter by bacteria 2(d) any six from: 6 1 mechanical / physical, digestion / breakdown ; 2 (decrease particle size) increase surface area (of food for chemical digestion) ; 3 for (named) enzyme (activity) ; 4 any further detail of enzyme activity ; 5 chewing / crushing / grinding / AW, in the mouth / by teeth ; A mastication 6 incisor / canine, (teeth) for cutting food / AW ; 7 (pre)molar (teeth), crush food / AW ; 8 mixing of saliva with food / formation of bolus of food for swallowing ; 9 churning action / formation of chyme / AW, of stomach (3) ; 10 ref to action of muscles in the stomach (wall) ; 11 emulsification by bile ; 12 occurs in, small intestine / duodenum / ileum (5) ; 13 described as bile (salts) break(s) fat globules into smaller pieces / large fat droplets into small(er) droplets / AW ;
Q3 · Aphids are insects that feed on phloem sap by inserting their mouthparts into phloem…
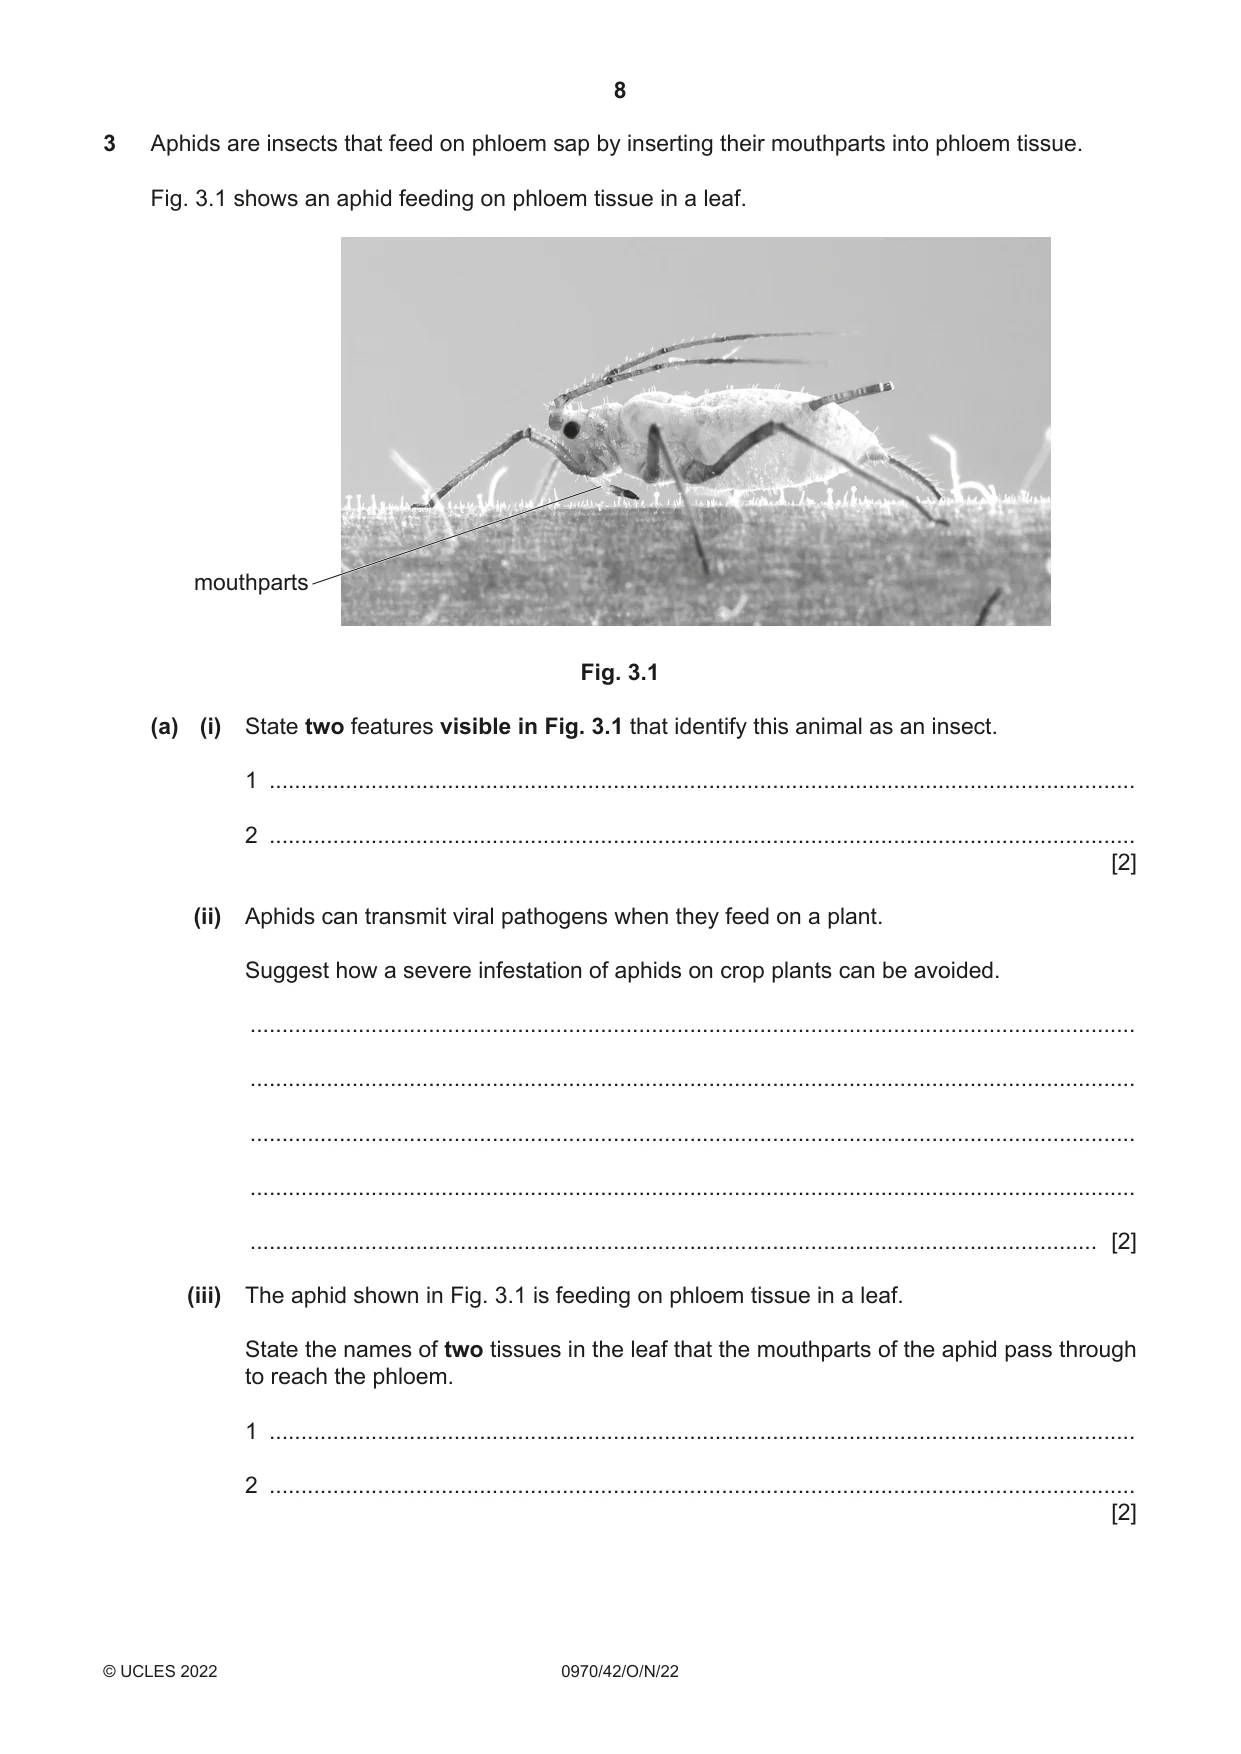
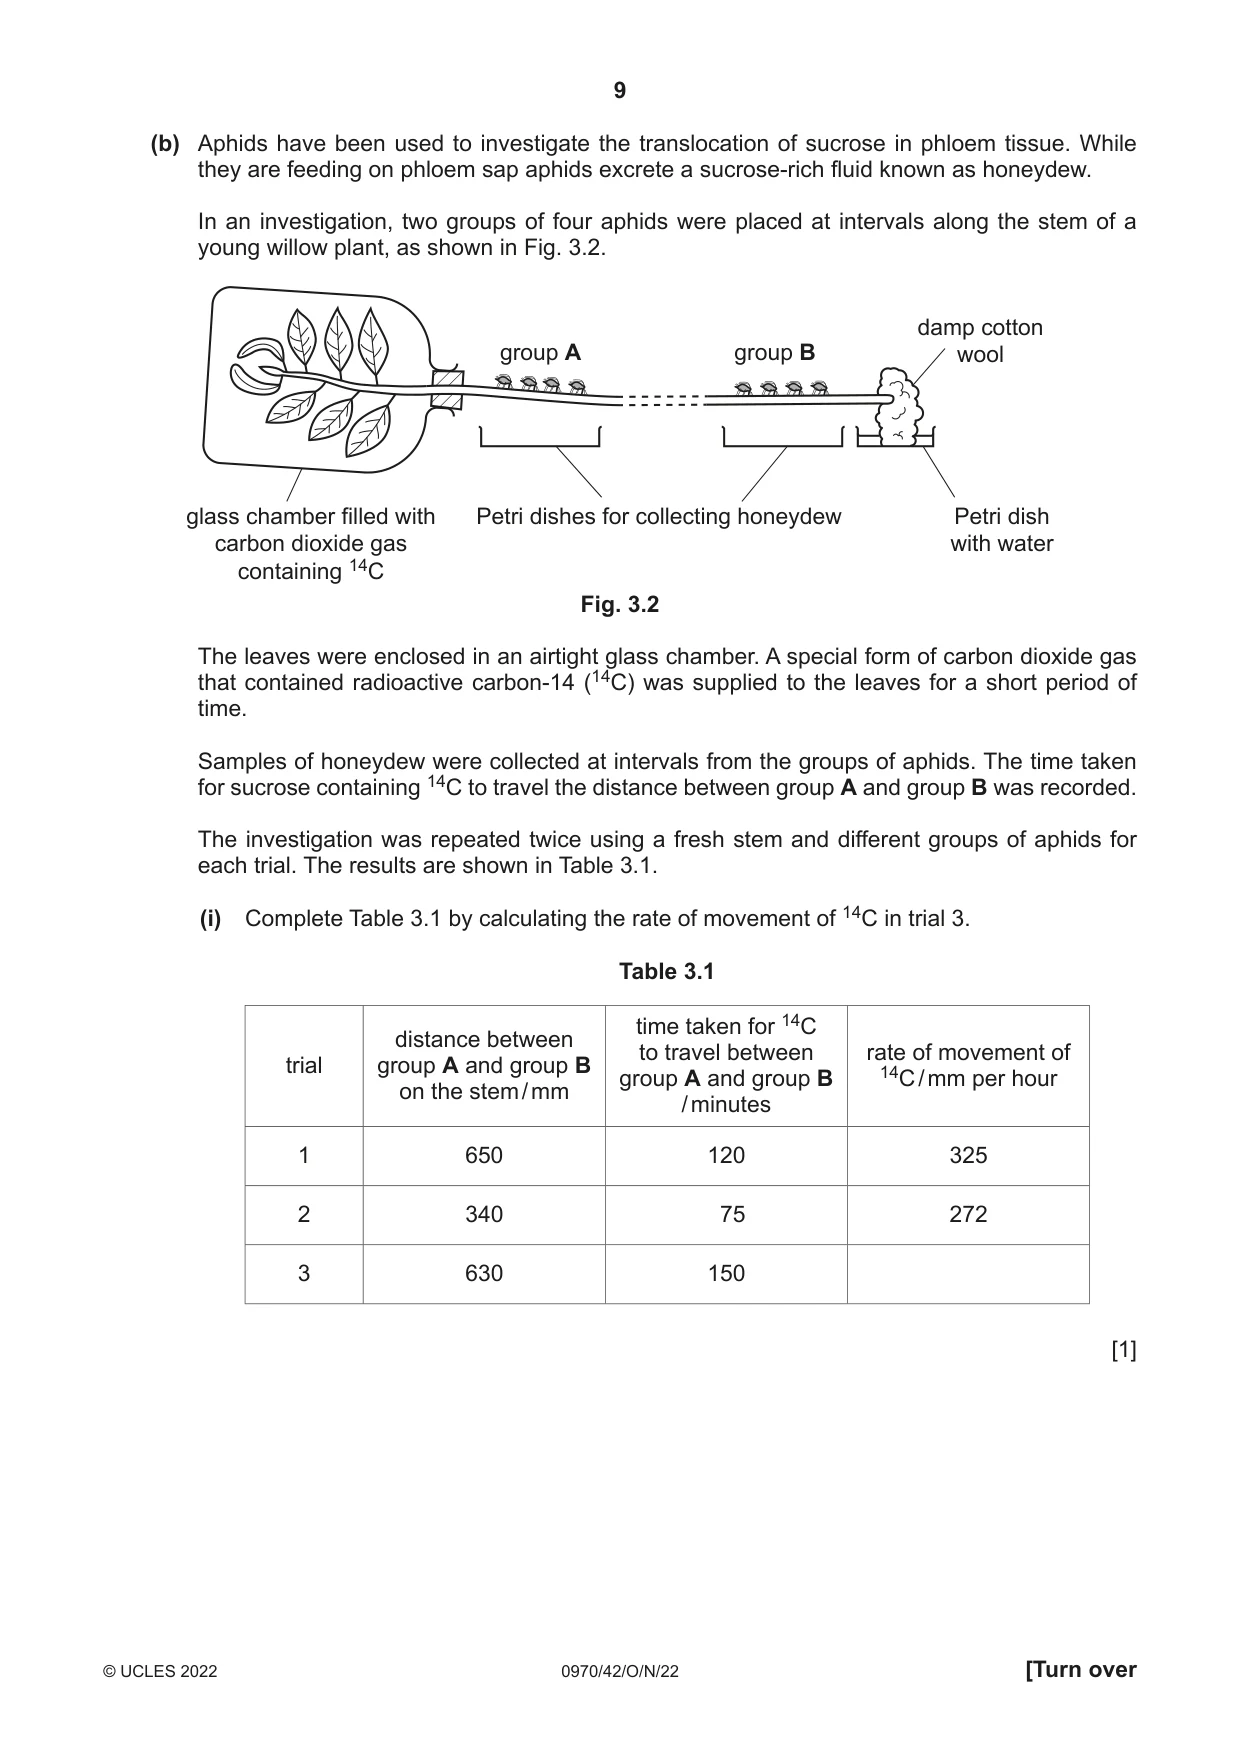
3 Aphids are insects that feed on phloem sap by inserting their mouthparts into phloem tissue. Fig. 3.1 shows an aphid feeding on phloem tissue in a leaf. mouthparts Fig. 3.1 (a) (i) State two features visible in Fig. 3.1 that identify this animal as an insect. 1 ........................................................................................................................................ 2 ........................................................................................................................................ [2] (ii) Aphids can transmit viral pathogens when they feed on a plant. Suggest how a severe infestation of aphids on crop plants can be avoided. ........................................................................................................................................... ........................................................................................................................................... ........................................................................................................................................... ........................................................................................................................................... ..................................................................................................................................... [2] (iii) The aphid shown in Fig. 3.1 is feeding on phloem tissue in a leaf. State the names of two tissues in the leaf that the mouthparts of the aphid pass through to reach the phloem. 1 ........................................................................................................................................ 2 ........................................................................................................................................ [2] (b) Aphids have been used to investigate the translocation of sucrose in phloem tissue. While they are feeding on phloem sap aphids excrete a sucrose‑rich fluid known as honeydew. In an investigation, two groups of four aphids were placed at intervals along the stem of a young willow plant, as shown in Fig. 3.2. damp cotton group A group B wool glass chamber filled with Petri dishes for collecting honeydew Petri dish carbon dioxide gas with water containing 14C Fig. 3.2 The leaves were enclosed in an airtight glass chamber. A special form of carbon dioxide gas that contained radioactive carbon‑14 (14C) was supplied to the leaves for a short period of time. Samples of honeydew were collected at intervals from the groups of aphids. The time taken for sucrose containing 14C to travel the distance between group A and group B was recorded. The investigation was repeated twice using a fresh stem and different groups of aphids for each trial. The results are shown in Table 3.1. (i) Complete Table 3.1 by calculating the rate of movement of 14C in trial 3. Table 3.1 time taken for 14C distance between to travel between rate of movement of trial group A and group B group A and group B 14C / mm per hour on the stem / mm / minutes 1 650 120 325 2 340 75 272 3 630 150 [1] (ii) Outline how 14C in carbon dioxide gas becomes incorporated into the sucrose molecules that are translocated in the phloem. ........................................................................................................................................... ........................................................................................................................................... ........................................................................................................................................... ........................................................................................................................................... ........................................................................................................................................... ........................................................................................................................................... ..................................................................................................................................... [3] (c) Sucrose travels from the stem to other parts of the plant known as sinks, where it is used. (i) State two parts of a plant that are sinks for sucrose. 1 ........................................................................................................................................ 2 ........................................................................................................................................ [2] (ii) Sucrose is used in the cells of the sinks in a plant. Describe the uses of sucrose by sinks. ........................................................................................................................................... ........................................................................................................................................... ........................................................................................................................................... ........................................................................................................................................... ........................................................................................................................................... ........................................................................................................................................... ..................................................................................................................................... [3] [Total: 15]
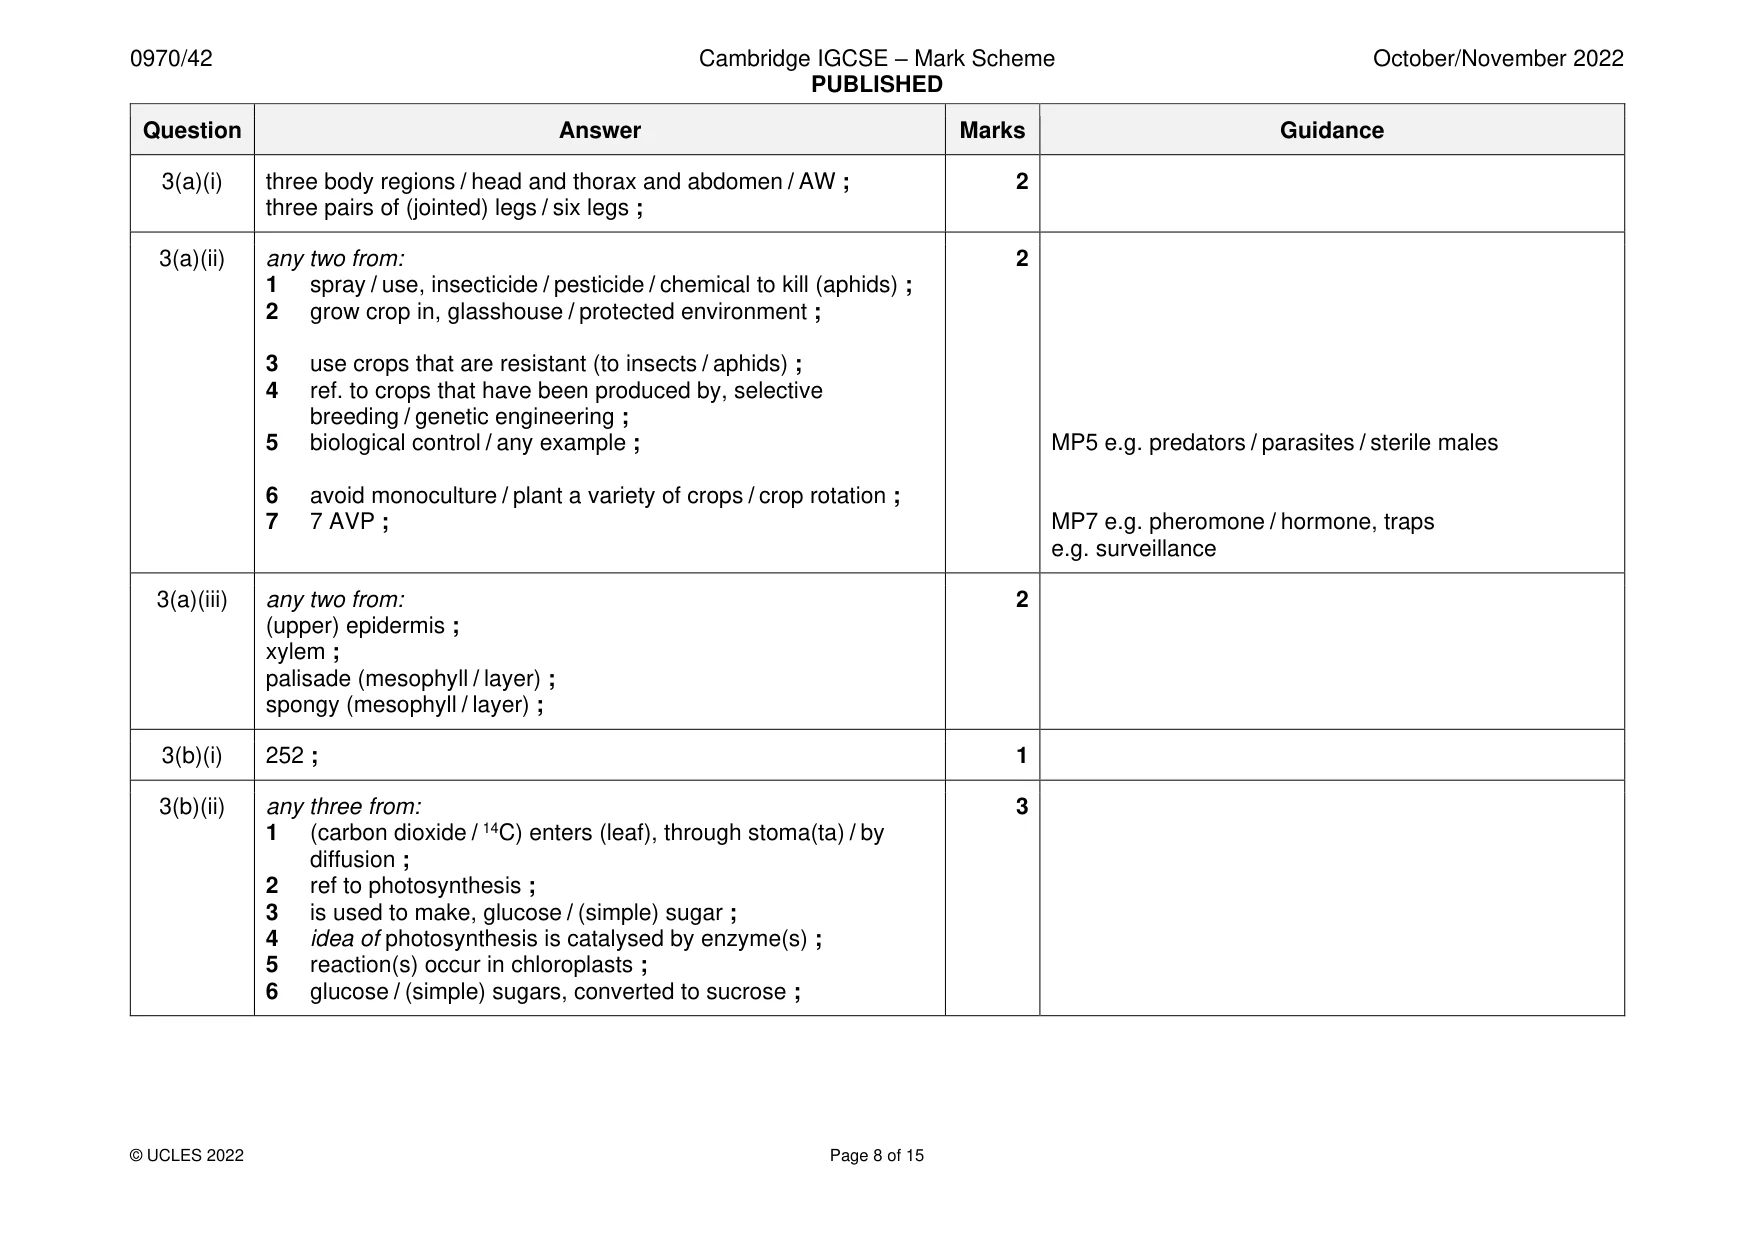
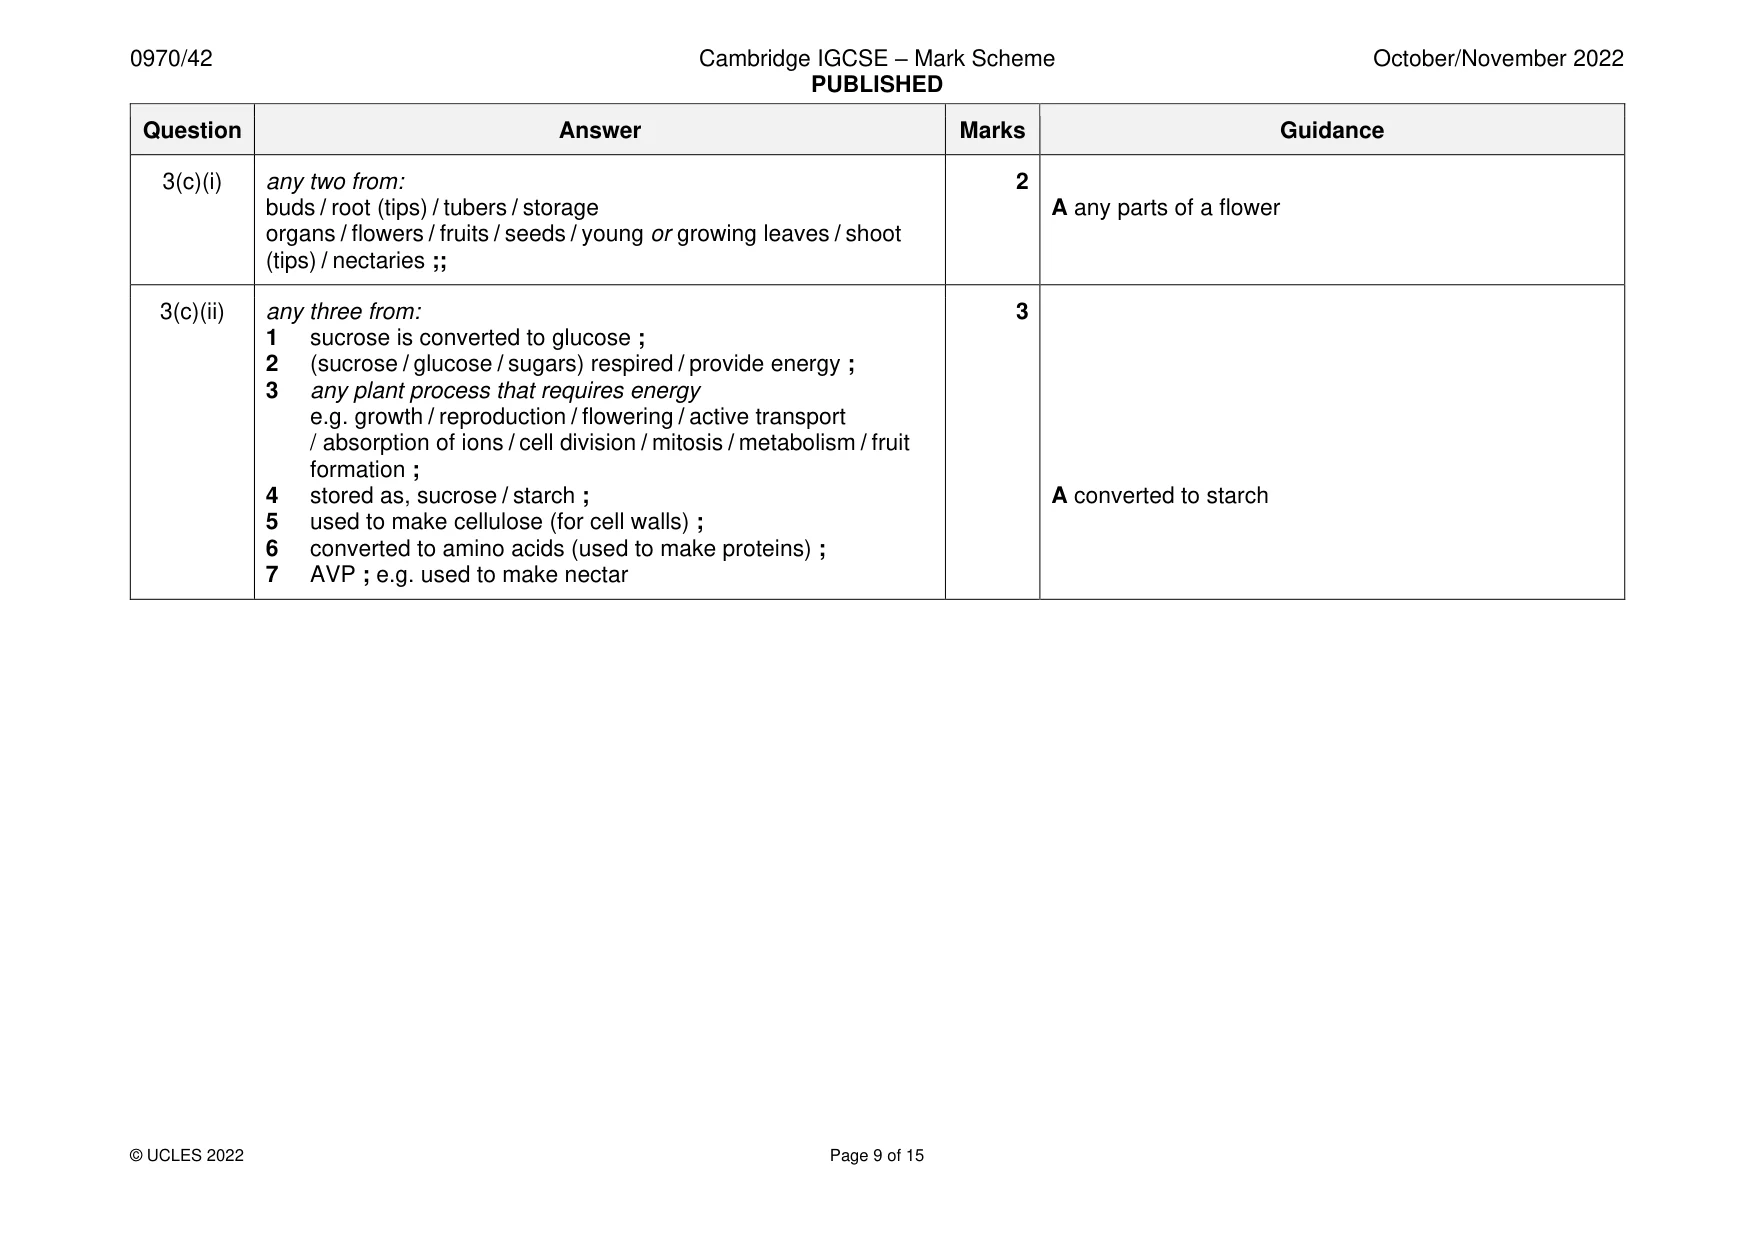
Mark scheme: 3(a)(i) three body regions / head and thorax and abdomen / AW ; 2 three pairs of (jointed) legs / six legs ; 3(a)(ii) any two from: 2 1 spray / use, insecticide / pesticide / chemical to kill (aphids) ; 2 grow crop in, glasshouse / protected environment ; 3 use crops that are resistant (to insects / aphids) ; 4 ref. to crops that have been produced by, selective breeding / genetic engineering ; 5 biological control / any example ; MP5 e.g. predators / parasites / sterile males 6 avoid monoculture / plant a variety of crops / crop rotation ; 7 7 AVP ; MP7 e.g. pheromone / hormone, traps e.g. surveillance 3(a)(iii) any two from: 2 (upper) epidermis ; xylem ; palisade (mesophyll / layer) ; spongy (mesophyll / layer) ; 3(b)(i) 252 ; 1 3(b)(ii) any three from: 3 1 (carbon dioxide / 14C) enters (leaf), through stoma(ta) / by diffusion ; 2 ref to photosynthesis ; 3 is used to make, glucose / (simple) sugar ; 4 idea of photosynthesis is catalysed by enzyme(s) ; 5 reaction(s) occur in chloroplasts ; 6 glucose / (simple) sugars, converted to sucrose ; 3(c)(i) any two from: 2 buds / root (tips) / tubers / storage A any parts of a flower organs / flowers / fruits / seeds / young or growing leaves / shoot (tips) / nectaries ;; 3(c)(ii) any three from: 3 1 sucrose is converted to glucose ; 2 (sucrose / glucose / sugars) respired / provide energy ; 3 any plant process that requires energy e.g. growth / reproduction / flowering / active transport / absorption of ions / cell division / mitosis / metabolism / fruit formation ; 4 stored as, sucrose / starch ; A converted to starch 5 used to make cellulose (for cell walls) ; 6 converted to amino acids (used to make proteins) ; 7 AVP ; e.g. used to make nectar
Q4 · A flow chart showing some of the processes that occur in a biofuels power plant
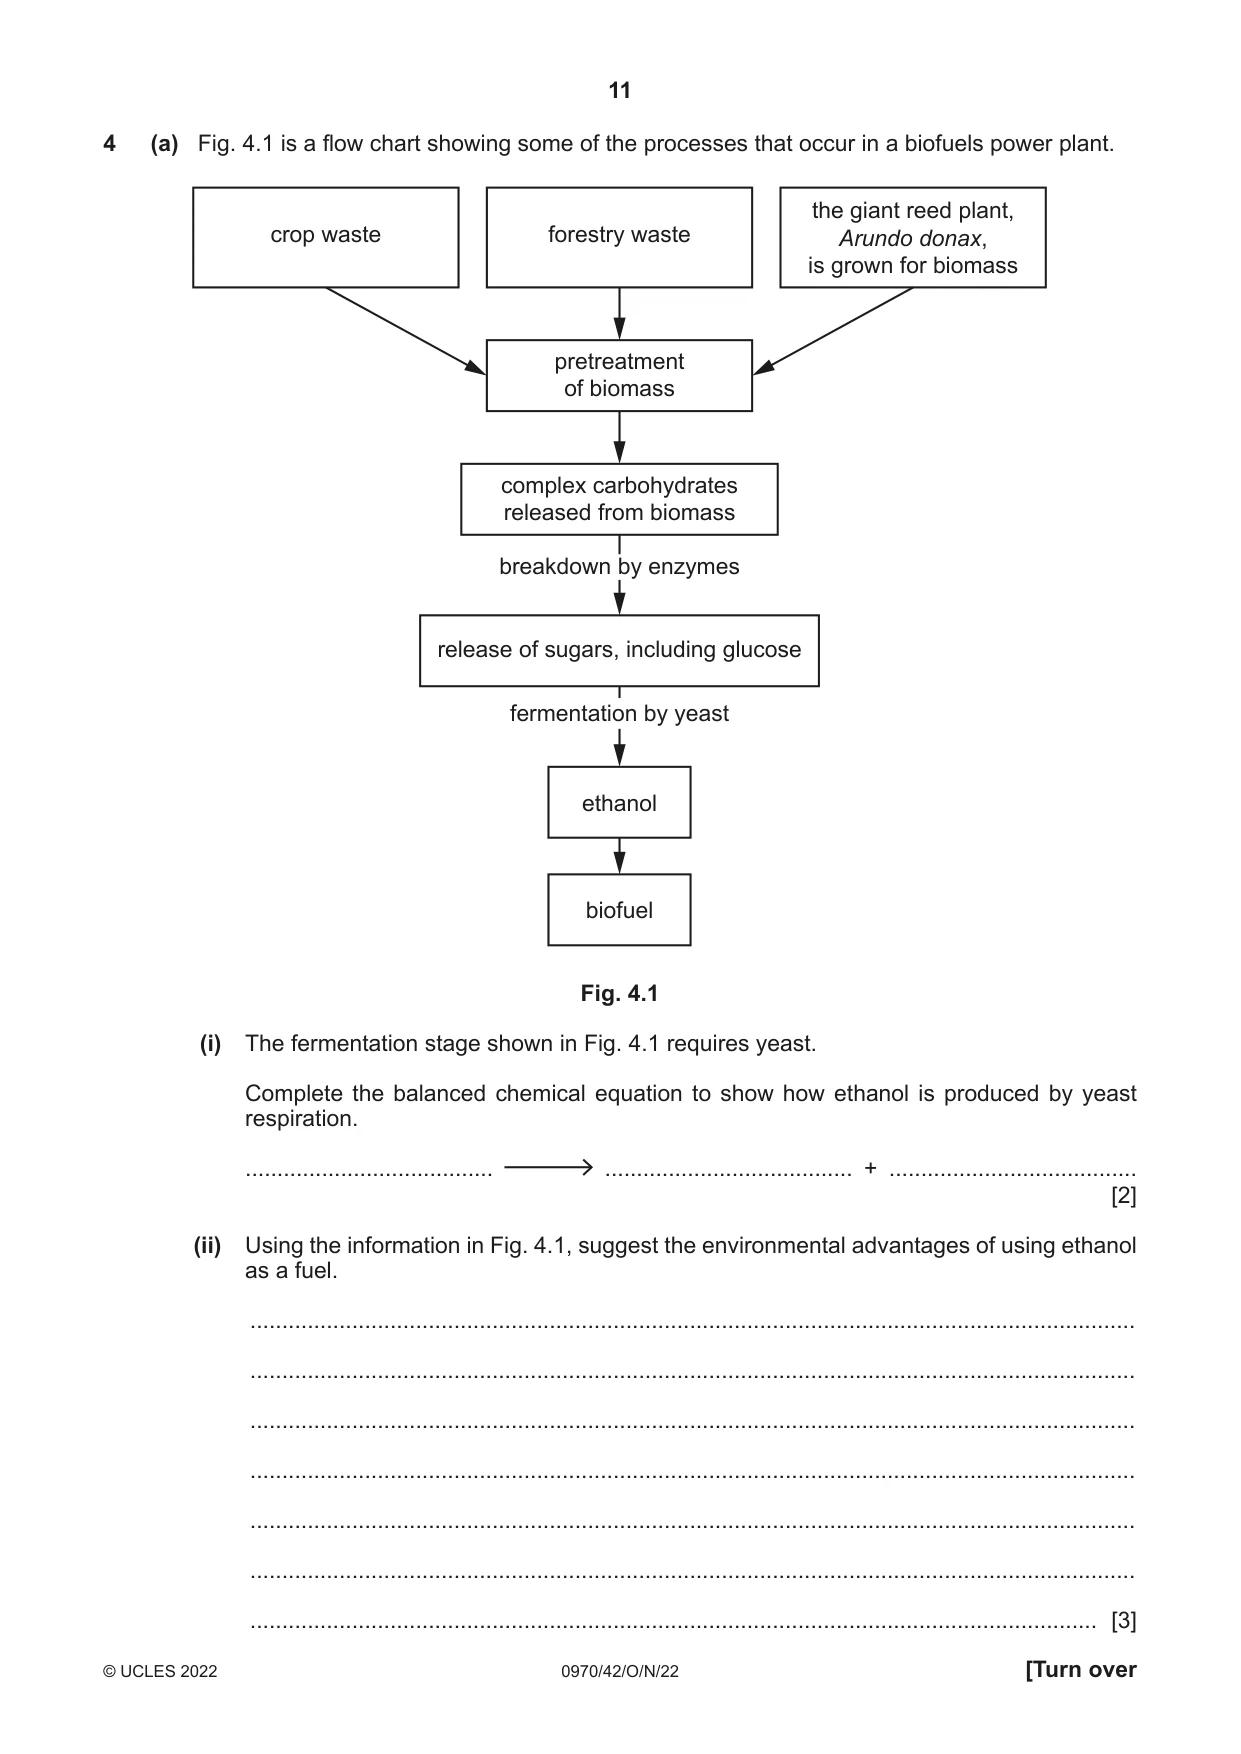
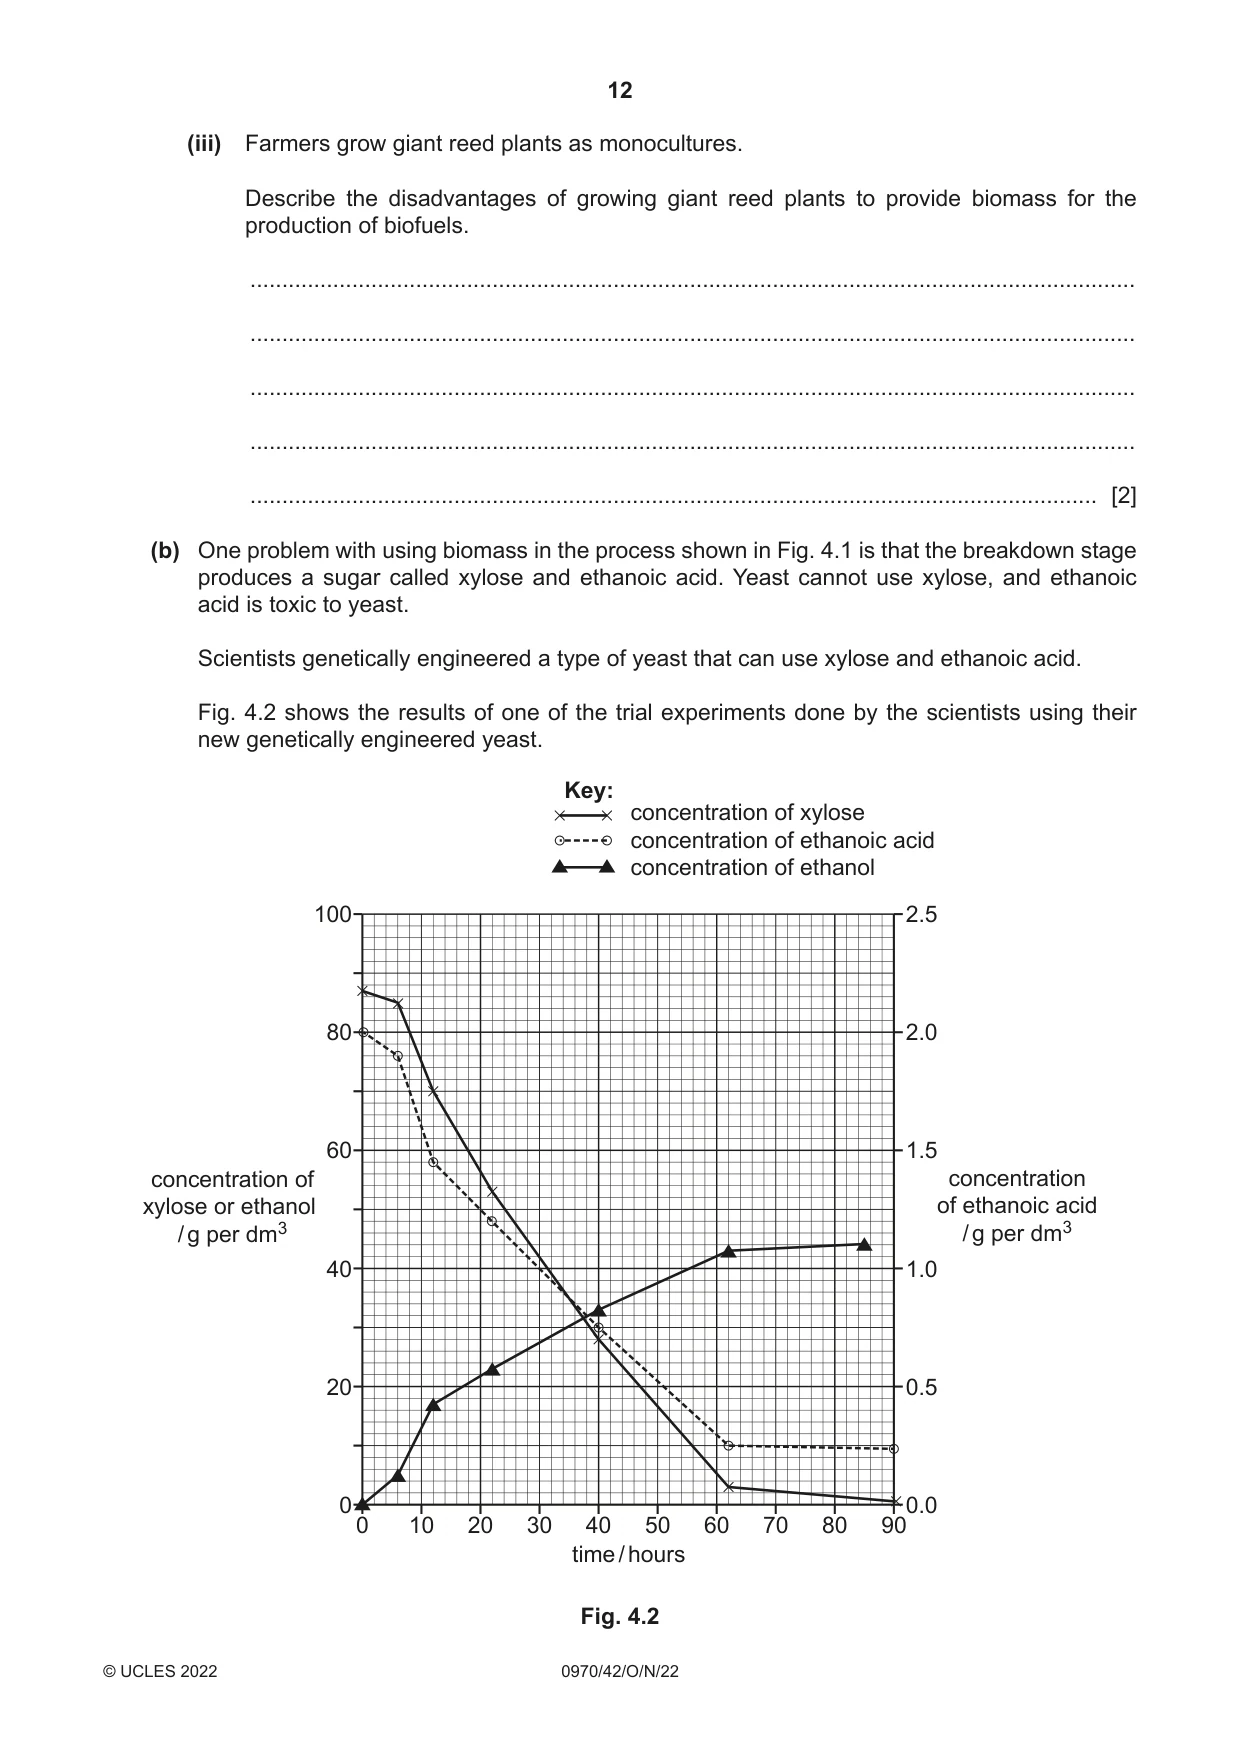
4 (a) Fig. 4.1 is a flow chart showing some of the processes that occur in a biofuels power plant. the giant reed plant, crop waste forestry waste Arundo donax, is grown for biomass pretreatment of biomass complex carbohydrates released from biomass breakdown by enzymes release of sugars, including glucose fermentation by yeast ethanol biofuel Fig. 4.1 (i) The fermentation stage shown in Fig. 4.1 requires yeast. Complete the balanced chemical equation to show how ethanol is produced by yeast respiration. ....................................... ....................................... + ....................................... [2] (ii) Using the information in Fig. 4.1, suggest the environmental advantages of using ethanol as a fuel. ........................................................................................................................................... ........................................................................................................................................... ........................................................................................................................................... ........................................................................................................................................... ........................................................................................................................................... ........................................................................................................................................... ..................................................................................................................................... [3] (iii) Farmers grow giant reed plants as monocultures. Describe the disadvantages of growing giant reed plants to provide biomass for the production of biofuels. ........................................................................................................................................... ........................................................................................................................................... ........................................................................................................................................... ........................................................................................................................................... ..................................................................................................................................... [2] (b) One problem with using biomass in the process shown in Fig. 4.1 is that the breakdown stage produces a sugar called xylose and ethanoic acid. Yeast cannot use xylose, and ethanoic acid is toxic to yeast. Scientists genetically engineered a type of yeast that can use xylose and ethanoic acid. Fig. 4.2 shows the results of one of the trial experiments done by the scientists using their new genetically engineered yeast. Key: concentration of xylose concentration of ethanoic acid concentration of ethanol 100 2.5 80 2.0 60 1.5 concentration of concentration xylose or ethanol of ethanoic acid / g per dm3 / g per dm3 40 1.0 20 0.5 0 0.0 0 10 20 30 40 50 60 70 80 90 time / hours Fig. 4.2 (i) Describe the results shown in Fig. 4.2. ........................................................................................................................................... ........................................................................................................................................... ........................................................................................................................................... ........................................................................................................................................... ........................................................................................................................................... ........................................................................................................................................... ..................................................................................................................................... [3] (ii) The experiment was done at 30 °C. The scientists repeated the experiment at 20 °C. Predict the results that you would expect for the concentration of ethanol. ........................................................................................................................................... ........................................................................................................................................... ..................................................................................................................................... [1] [Total: 11]
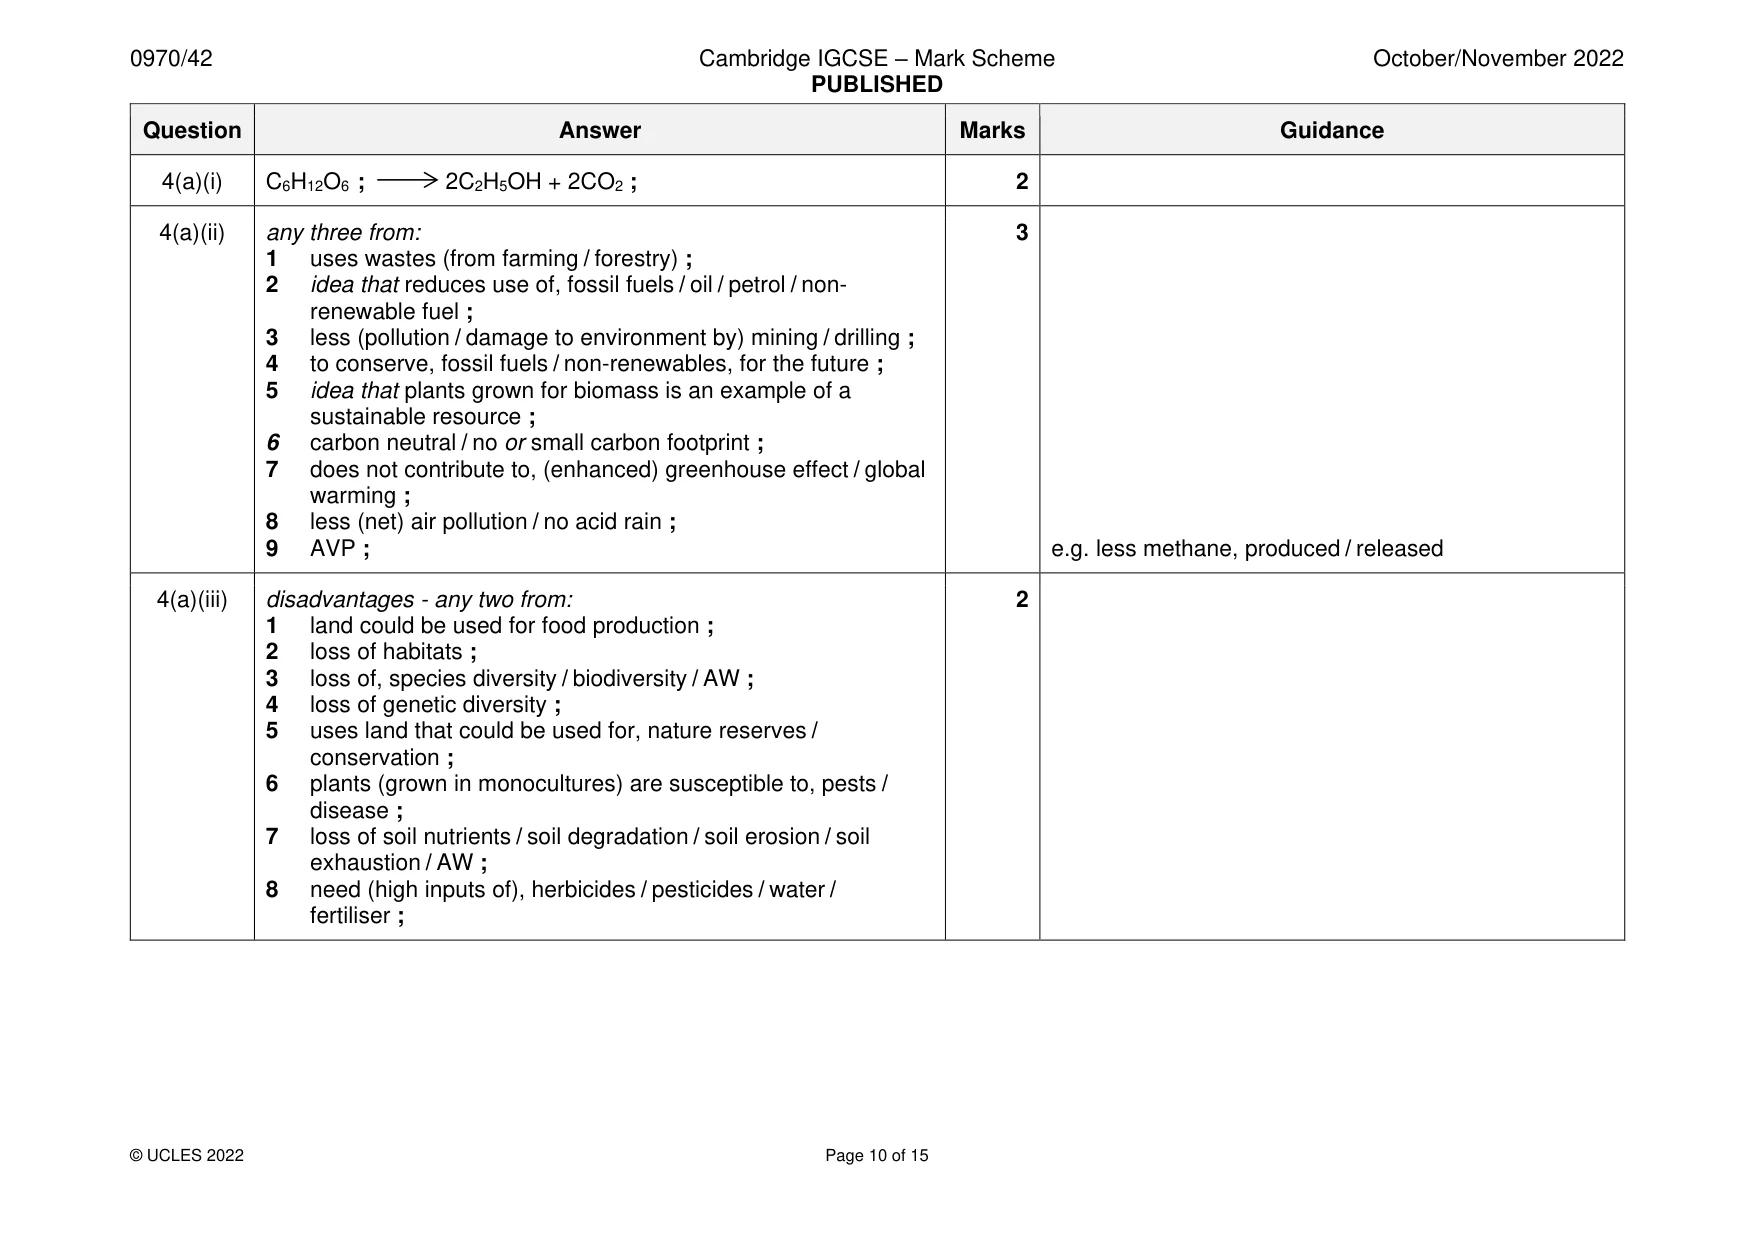
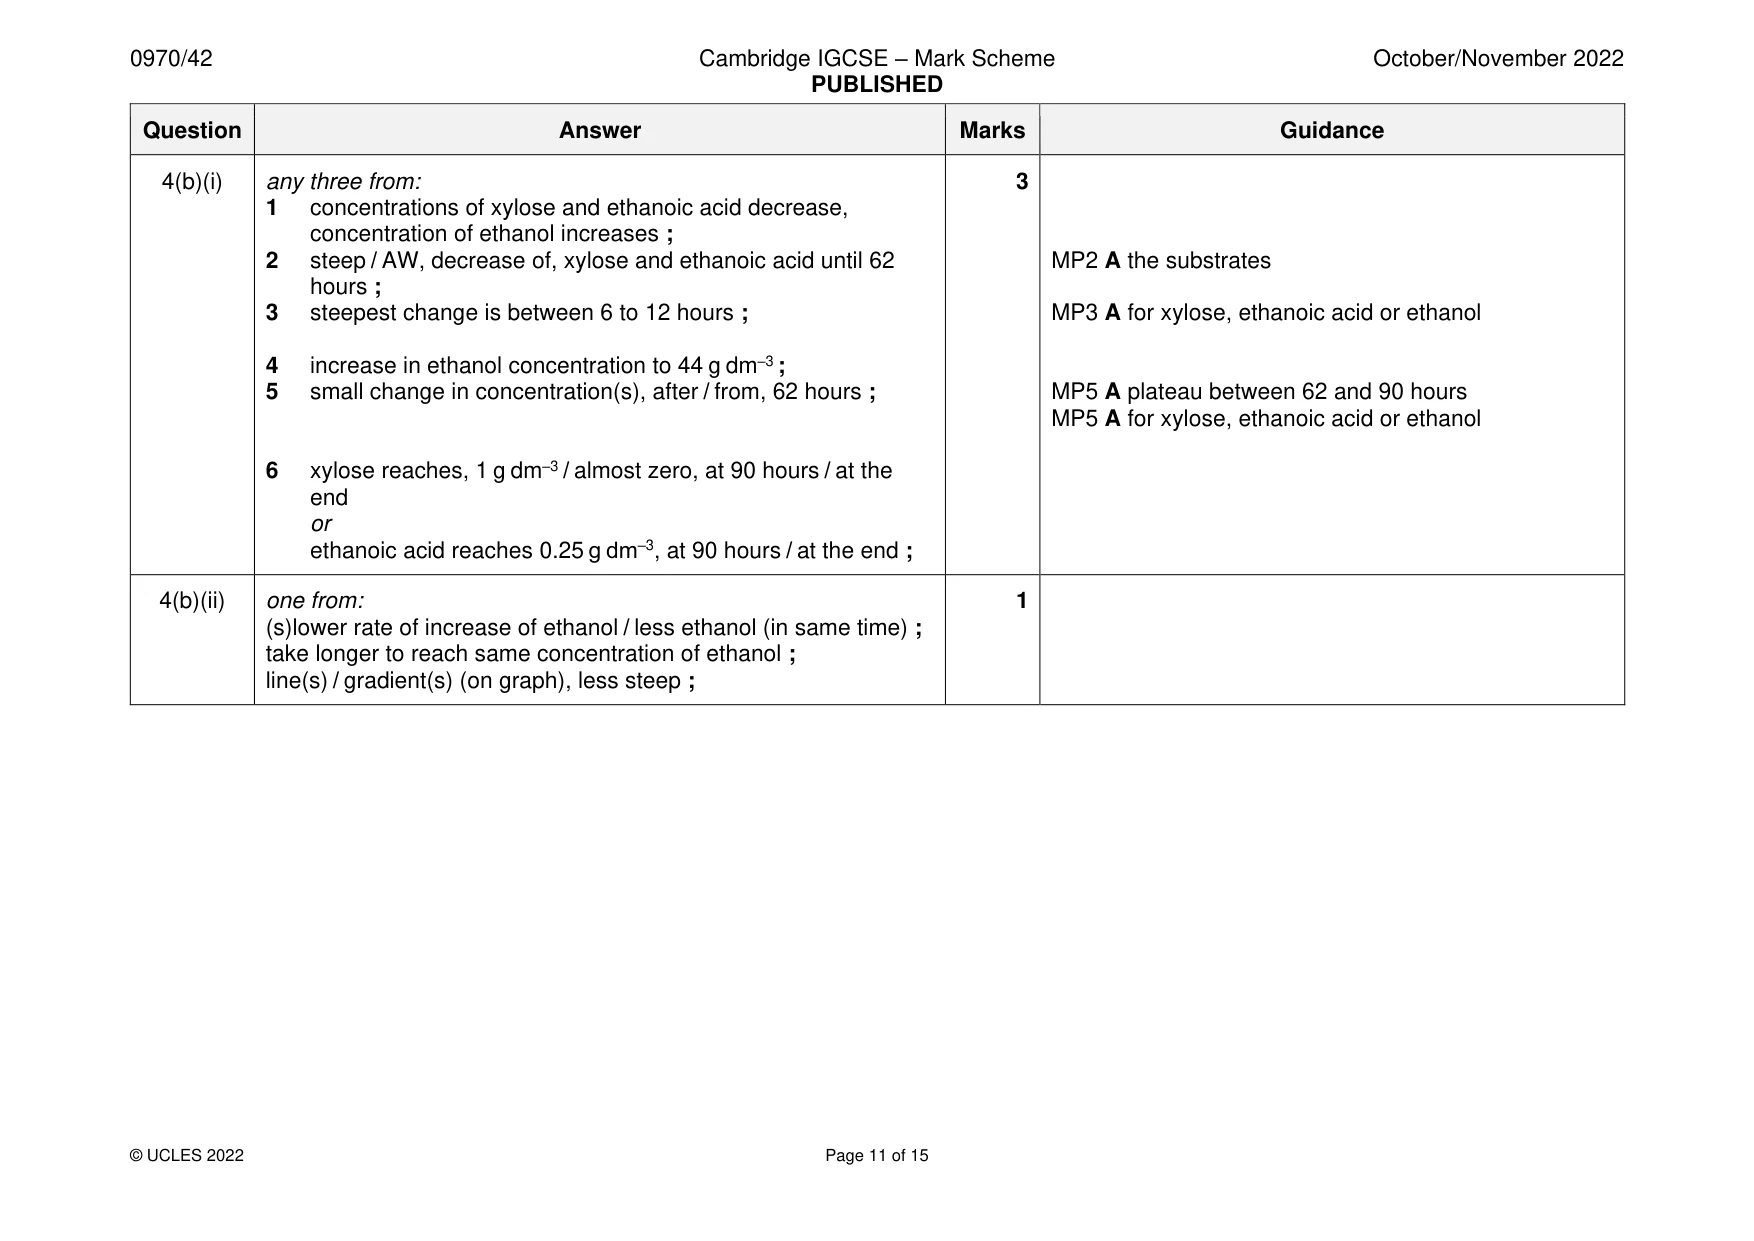
Mark scheme: 4(a)(i) C6H12O6 ; 2C2H5OH + 2CO2 ; 2 4(a)(ii) any three from: 3 1 uses wastes (from farming / forestry) ; 2 idea that reduces use of, fossil fuels / oil / petrol / non- renewable fuel ; 3 less (pollution / damage to environment by) mining / drilling ; 4 to conserve, fossil fuels / non-renewables, for the future ; 5 idea that plants grown for biomass is an example of a sustainable resource ; 6 carbon neutral / no or small carbon footprint ; 7 does not contribute to, (enhanced) greenhouse effect / global warming ; 8 less (net) air pollution / no acid rain ; 9 AVP ; e.g. less methane, produced / released 4(a)(iii) disadvantages - any two from: 2 1 land could be used for food production ; 2 loss of habitats ; 3 loss of, species diversity / biodiversity / AW ; 4 loss of genetic diversity ; 5 uses land that could be used for, nature reserves / conservation ; 6 plants (grown in monocultures) are susceptible to, pests / disease ; 7 loss of soil nutrients / soil degradation / soil erosion / soil exhaustion / AW ; 8 need (high inputs of), herbicides / pesticides / water / fertiliser ; 4(b)(i) any three from: 3 1 concentrations of xylose and ethanoic acid decrease, concentration of ethanol increases ; 2 steep / AW, decrease of, xylose and ethanoic acid until 62 MP2 A the substrates hours ; 3 steepest change is between 6 to 12 hours ; MP3 A for xylose, ethanoic acid or ethanol 4 increase in ethanol concentration to 44 g dm–3 ; 5 small change in concentration(s), after / from, 62 hours ; MP5 A plateau between 62 and 90 hours MP5 A for xylose, ethanoic acid or ethanol 6 xylose reaches, 1 g dm–3 / almost zero, at 90 hours / at the end or ethanoic acid reaches 0.25 g dm–3, at 90 hours / at the end ; 4(b)(ii) one from: 1 (s)lower rate of increase of ethanol / less ethanol (in same time) ; take longer to reach same concentration of ethanol ; line(s) / gradient(s) (on graph), less steep ;
Q5 · Mackinlay’s cuckoo‑dove, Macropygia mackinlayi, which is found on most of the islands in…
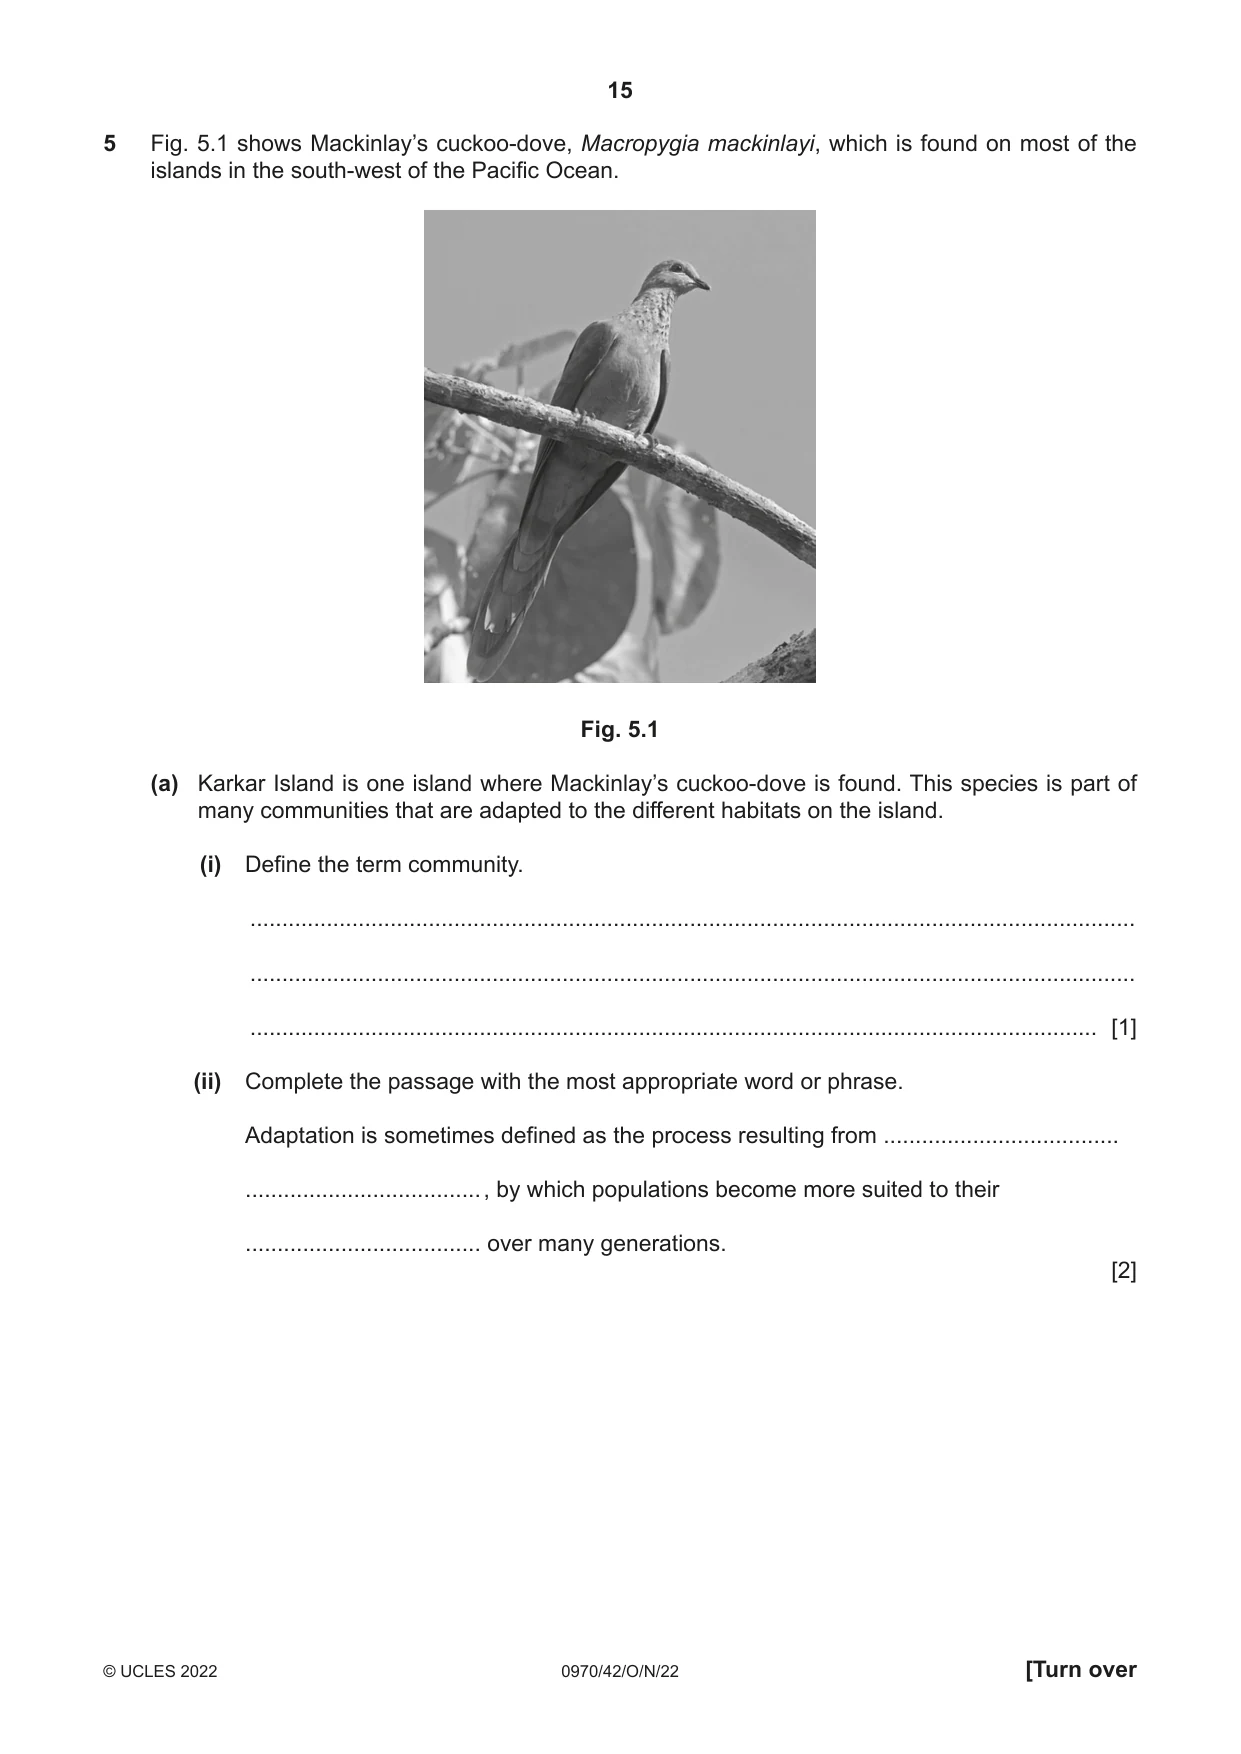
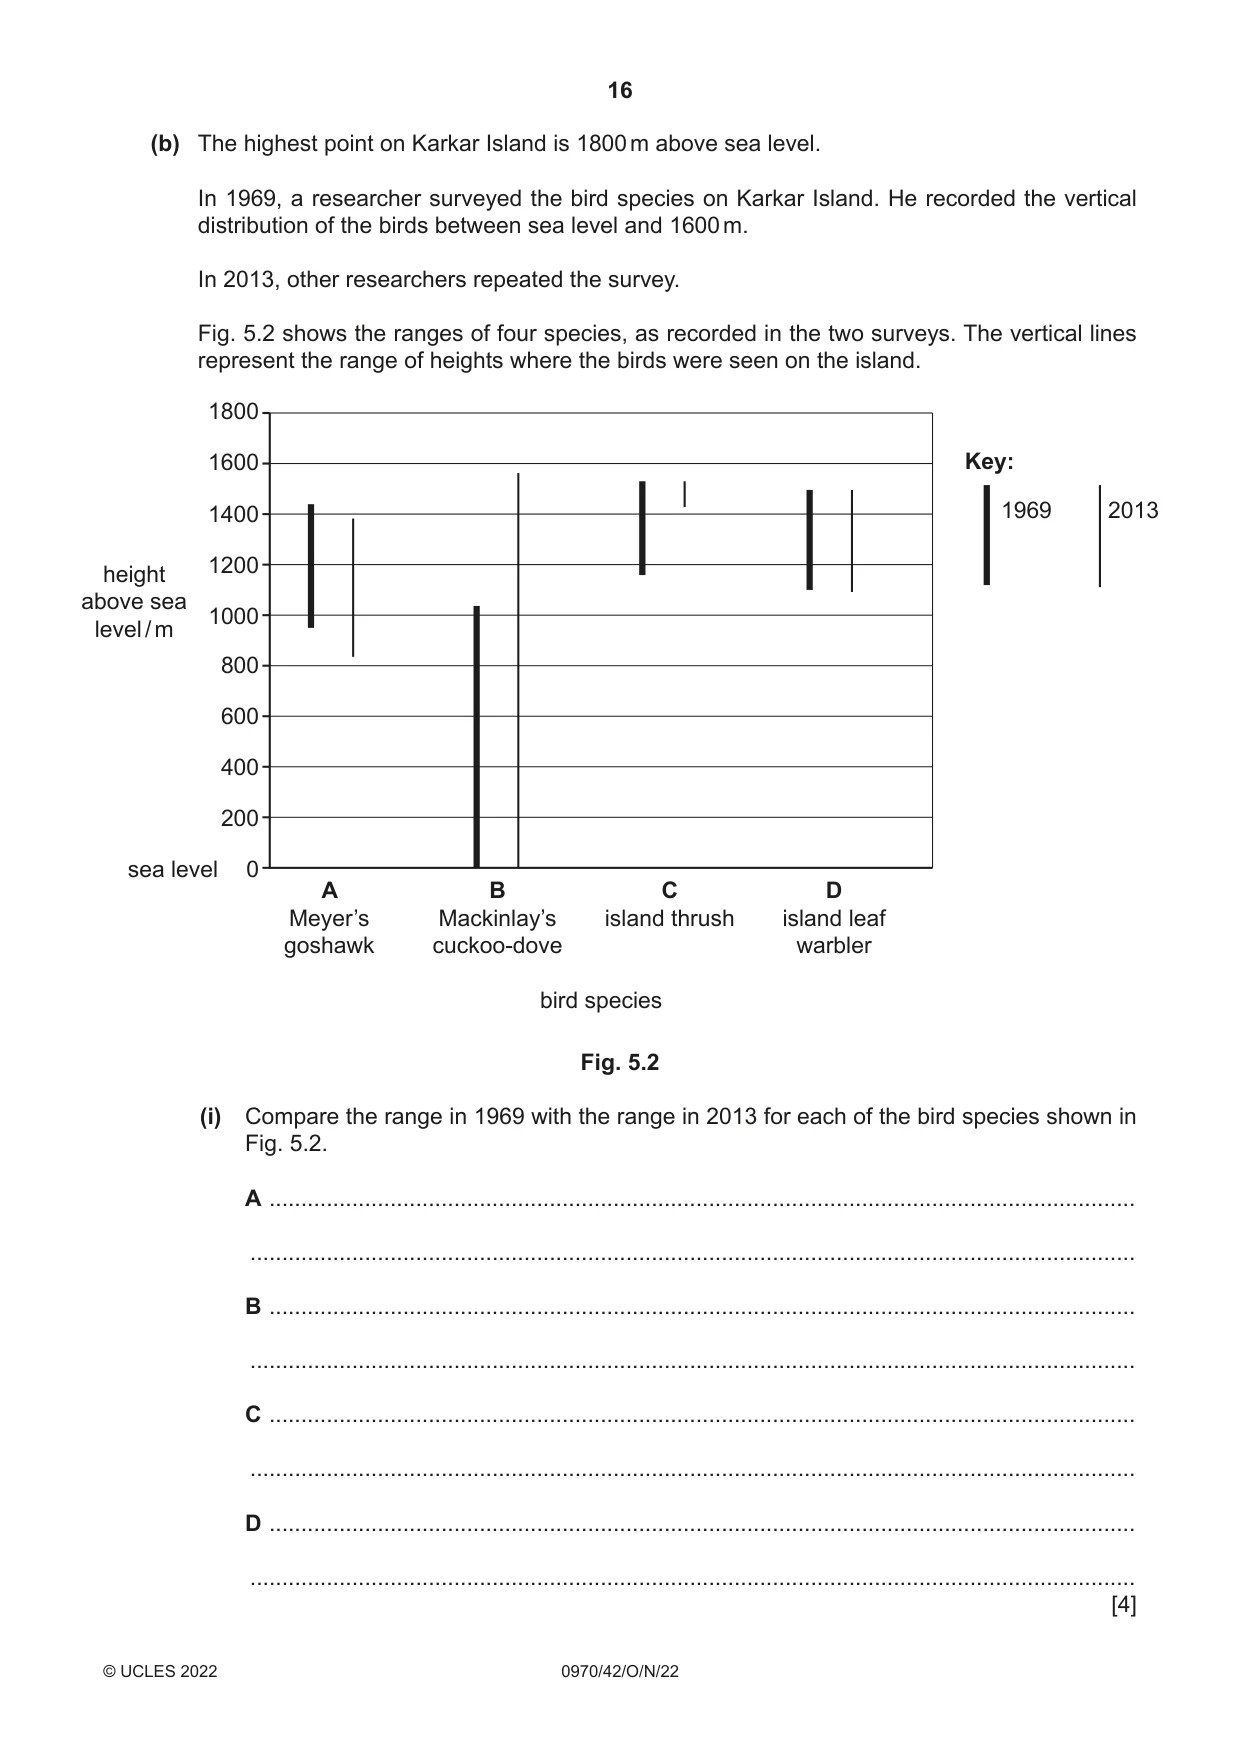
5 Fig. 5.1 shows Mackinlay’s cuckoo‑dove, Macropygia mackinlayi, which is found on most of the islands in the south‑west of the Pacific Ocean. Fig. 5.1 (a) Karkar Island is one island where Mackinlay’s cuckoo‑dove is found. This species is part of many communities that are adapted to the different habitats on the island. (i) Define the term community. ........................................................................................................................................... ........................................................................................................................................... ..................................................................................................................................... [1] (ii) Complete the passage with the most appropriate word or phrase. Adaptation is sometimes defined as the process resulting from ..................................... ..................................... , by which populations become more suited to their ..................................... over many generations. [2] (b) The highest point on Karkar Island is 1800 m above sea level. In 1969, a researcher surveyed the bird species on Karkar Island. He recorded the vertical distribution of the birds between sea level and 1600 m. In 2013, other researchers repeated the survey. Fig. 5.2 shows the ranges of four species, as recorded in the two surveys. The vertical lines represent the range of heights where the birds were seen on the island. 1800 1600 Key: 1400 1969 2013 1200 height above sea 1000 level / m 800 600 400 200 sea level 0 A B C D Meyer’s Mackinlay’s island thrush island leaf goshawk cuckoo-dove warbler bird species Fig. 5.2 (i) Compare the range in 1969 with the range in 2013 for each of the bird species shown in Fig. 5.2. A ........................................................................................................................................ ........................................................................................................................................... B ........................................................................................................................................ ........................................................................................................................................... C ........................................................................................................................................ ........................................................................................................................................... D ........................................................................................................................................ ........................................................................................................................................... [4] (ii) Using the information in Fig. 5.2, suggest reasons for the change in the range of the island thrush (C) on Karkar Island. ........................................................................................................................................... ........................................................................................................................................... ........................................................................................................................................... ........................................................................................................................................... ........................................................................................................................................... ........................................................................................................................................... ..................................................................................................................................... [3] (c) Small oceanic islands are often inhabited by species of birds that are found nowhere else. Many of these species have decreasing populations and are often endangered. Explain the risks to these species of birds that have decreasing populations. ................................................................................................................................................... ................................................................................................................................................... ................................................................................................................................................... ................................................................................................................................................... ................................................................................................................................................... ................................................................................................................................................... ............................................................................................................................................. [3] [Total: 13]
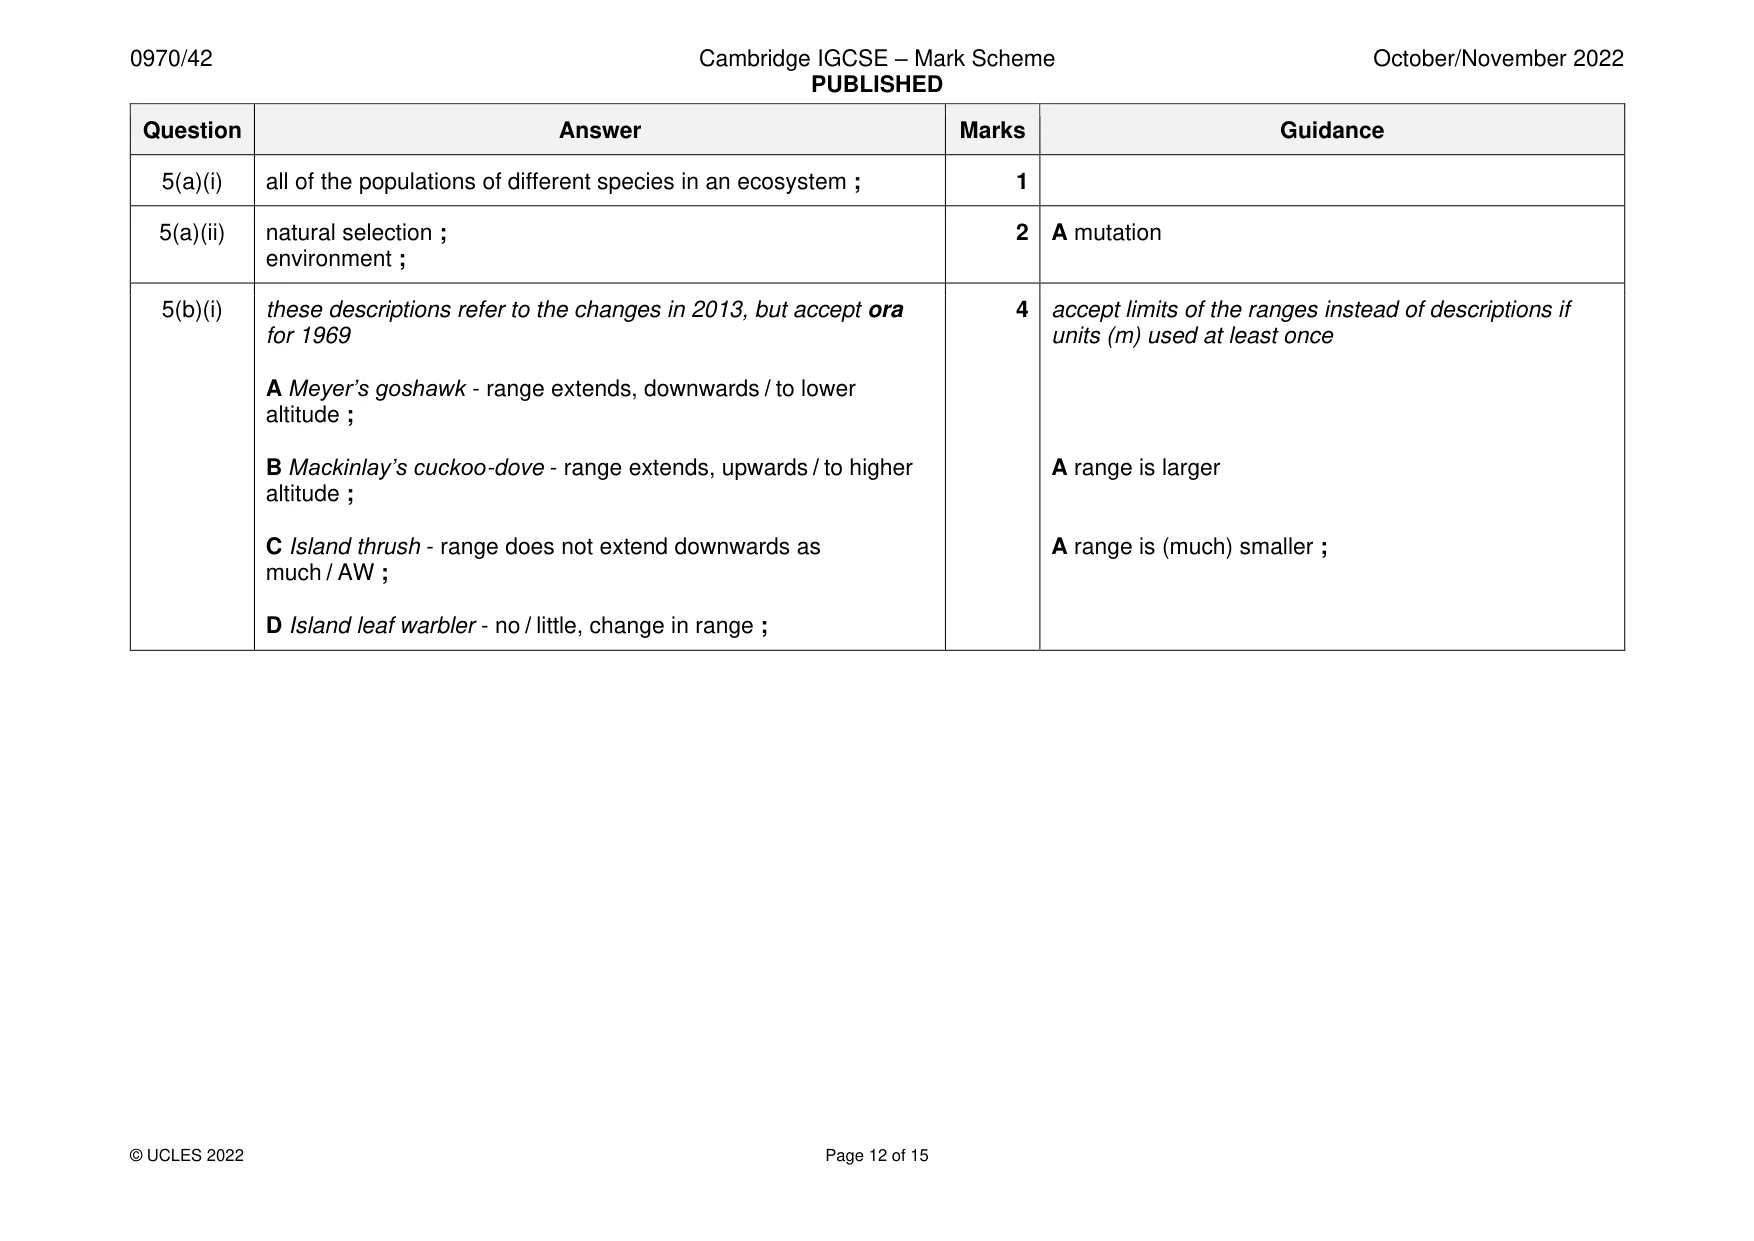
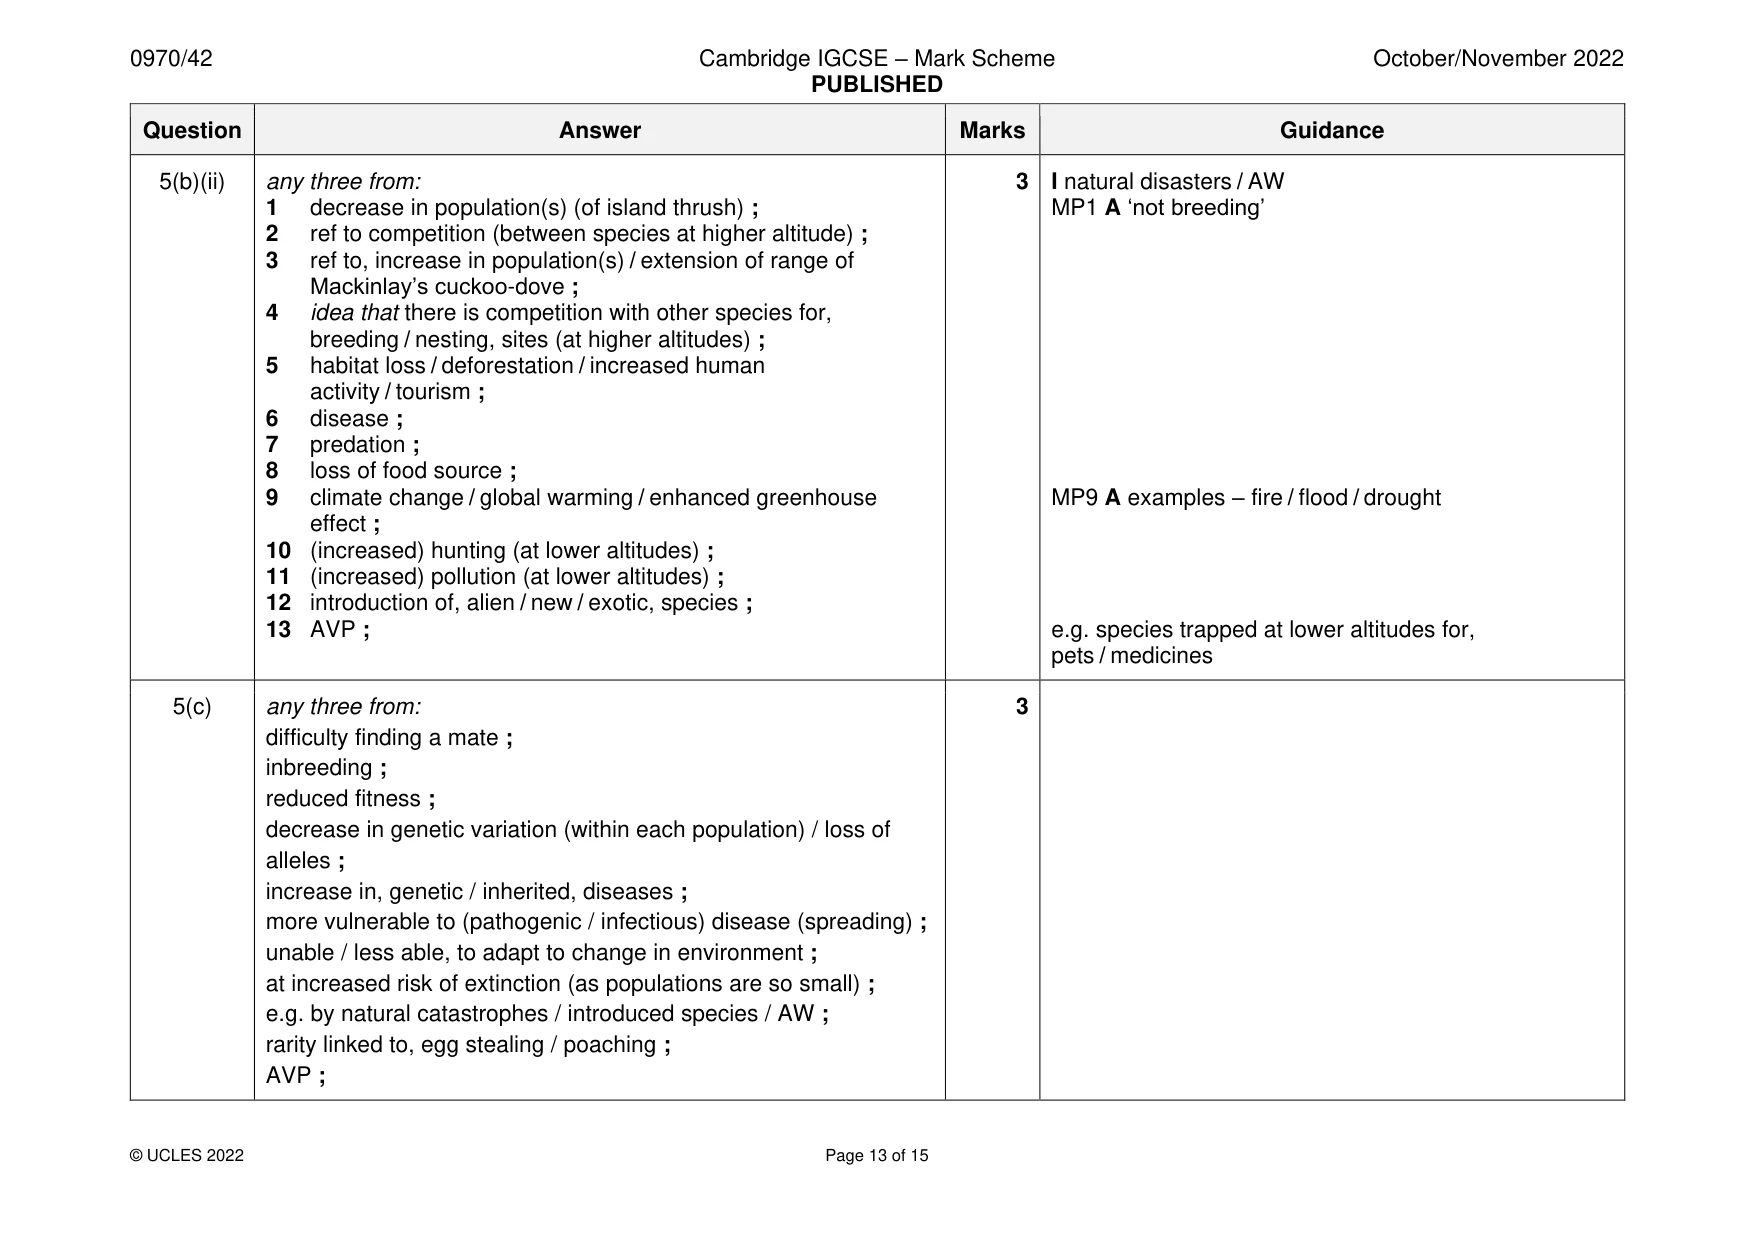
Mark scheme: 5(a)(i) all of the populations of different species in an ecosystem ; 1 5(a)(ii) natural selection ; 2 A mutation environment ; 5(b)(i) these descriptions refer to the changes in 2013, but accept ora 4 accept limits of the ranges instead of descriptions if for 1969 units (m) used at least once A Meyer’s goshawk - range extends, downwards / to lower altitude ; B Mackinlay’s cuckoo-dove - range extends, upwards / to higher A range is larger altitude ; C Island thrush - range does not extend downwards as A range is (much) smaller ; much / AW ; D Island leaf warbler - no / little, change in range ; 5(b)(ii) any three from: 3 I natural disasters / AW 1 decrease in population(s) (of island thrush) ; MP1 A ‘not breeding’ 2 ref to competition (between species at higher altitude) ; 3 ref to, increase in population(s) / extension of range of Mackinlay’s cuckoo-dove ; 4 idea that there is competition with other species for, breeding / nesting, sites (at higher altitudes) ; 5 habitat loss / deforestation / increased human activity / tourism ; 6 disease ; 7 predation ; 8 loss of food source ; 9 climate change / global warming / enhanced greenhouse MP9 A examples – fire / flood / drought effect ; 10 (increased) hunting (at lower altitudes) ; 11 (increased) pollution (at lower altitudes) ; 12 introduction of, alien / new / exotic, species ; 13 AVP ; e.g. species trapped at lower altitudes for, pets / medicines 5(c) any three from: 3 difficulty finding a mate ; inbreeding ; reduced fitness ; decrease in genetic variation (within each population) / loss of alleles ; increase in, genetic / inherited, diseases ; more vulnerable to (pathogenic / infectious) disease (spreading) ; unable / less able, to adapt to change in environment ; at increased risk of extinction (as populations are so small) ; e.g. by natural catastrophes / introduced species / AW ; rarity linked to, egg stealing / poaching ; AVP ;
Q6 · Diagrams of the circulatory systems of a fish and a mammal
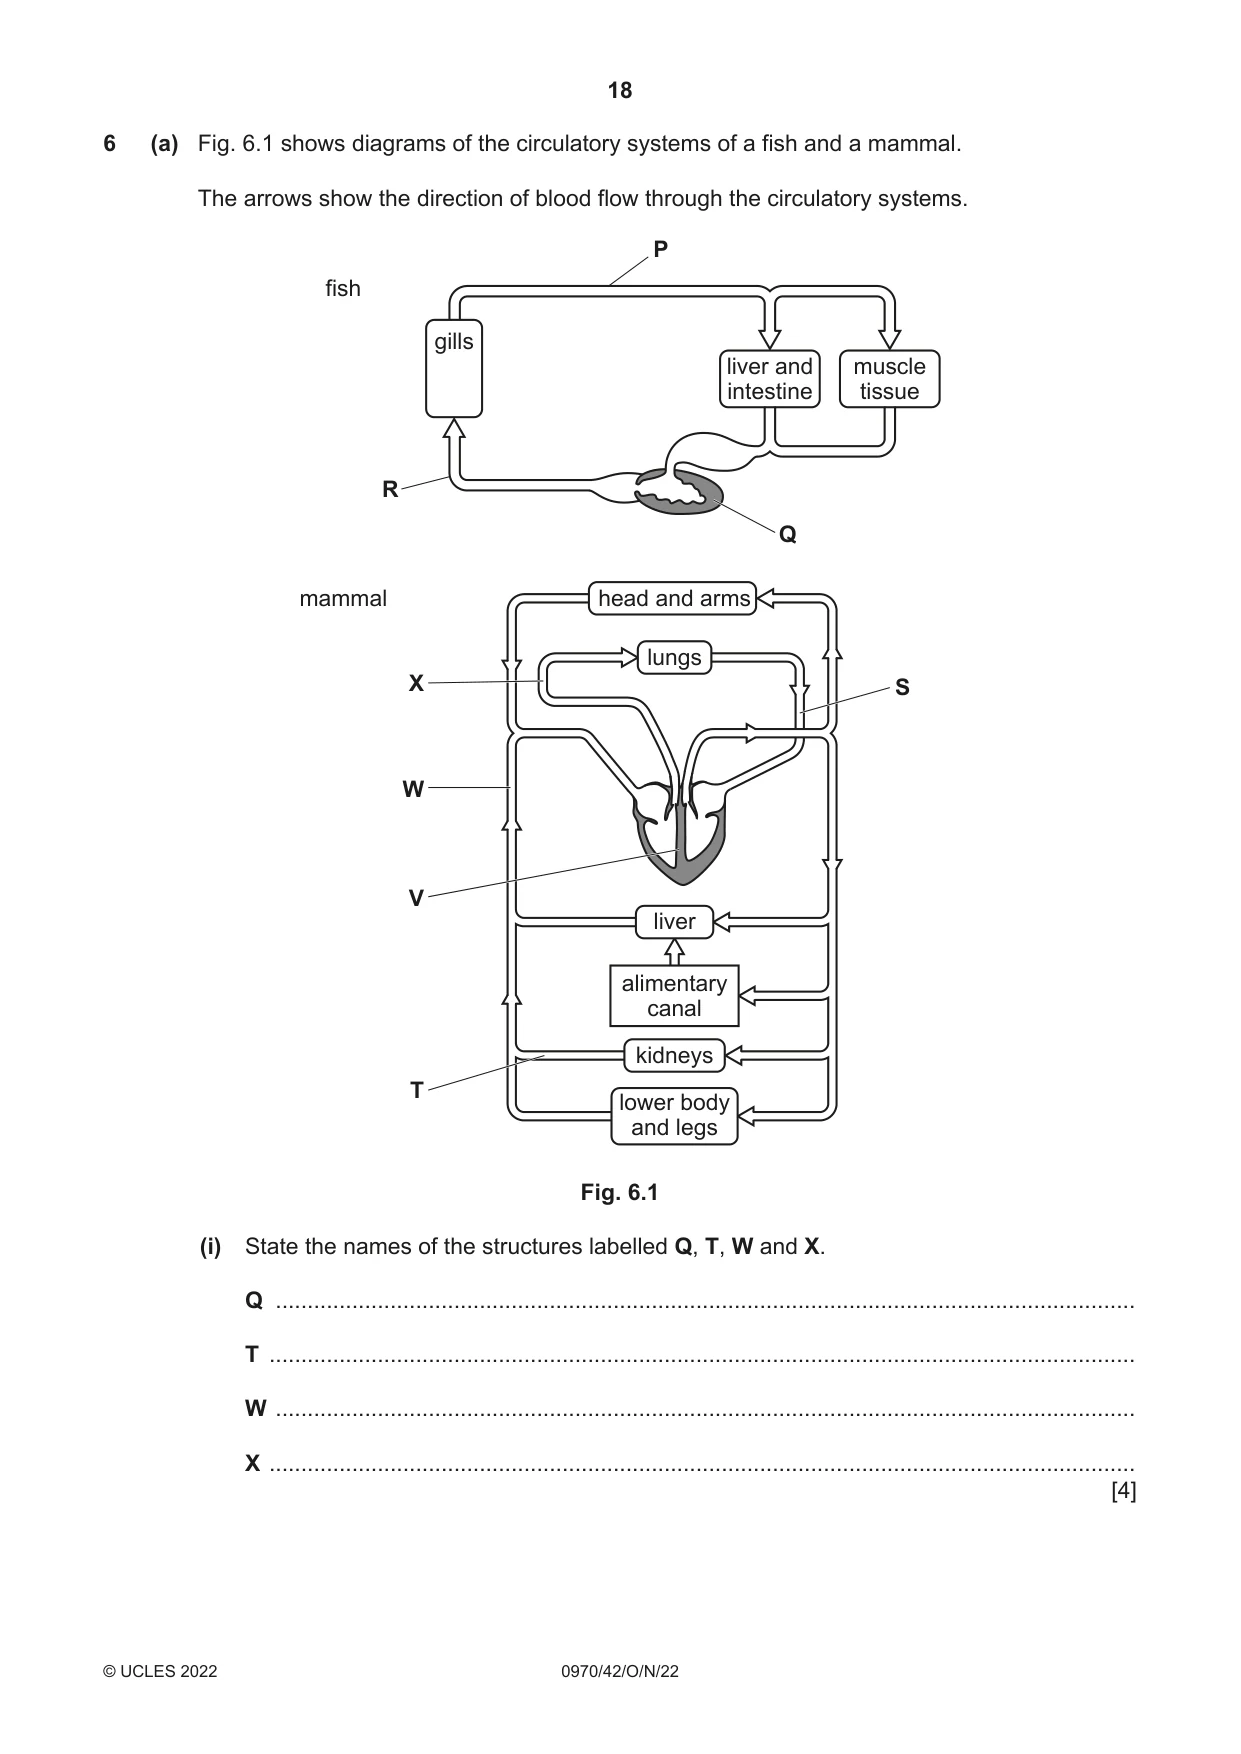
6 (a) Fig. 6.1 shows diagrams of the circulatory systems of a fish and a mammal. The arrows show the direction of blood flow through the circulatory systems. P fish gills liver and muscle intestine tissue R Q mammal head and arms lungs X S W V liver alimentary canal kidneys T lower body and legs Fig. 6.1 (i) State the names of the structures labelled Q, T, W and X. Q ....................................................................................................................................... T ........................................................................................................................................ W ....................................................................................................................................... X ........................................................................................................................................ [4] (ii) State the name of structure V on Fig. 6.1 and describe its function. ........................................................................................................................................... ........................................................................................................................................... ........................................................................................................................................... ........................................................................................................................................... ..................................................................................................................................... [2] (iii) Fig. 6.1 shows that fish and mammals have different types of circulation. State why the fish circulation is called a single circulation. ........................................................................................................................................... ........................................................................................................................................... ..................................................................................................................................... [1] (iv) Explain the advantages of the double circulation of the mammal. ........................................................................................................................................... ........................................................................................................................................... ........................................................................................................................................... ........................................................................................................................................... ........................................................................................................................................... ........................................................................................................................................... ..................................................................................................................................... [3] (b) The blood vessels that supply the heart muscle can become blocked. (i) State the name of the blood vessels that supply the heart muscle. ..................................................................................................................................... [1] (ii) State one way in which blockages in these blood vessels can be treated. ..................................................................................................................................... [1] (c) Substances move between blood and tissues at various sites in the circulatory system of mammals. (i) Oxygen is absorbed into the blood as it passes through the lungs. State the structures in the lungs where oxygen passes into the blood from the air. ..................................................................................................................................... [1] (ii) State the site of filtration of blood in the kidneys. ..................................................................................................................................... [1] (iii) State the name of the process in which products of digestion move into cells and are used to become part of the cells. ..................................................................................................................................... [1] (iv) State the name of the process in which excess amino acids are broken down in liver cells to produce ammonia. ..................................................................................................................................... [1] (v) State the name of the organ that releases oestrogen into the blood. ..................................................................................................................................... [1] [Total: 17]
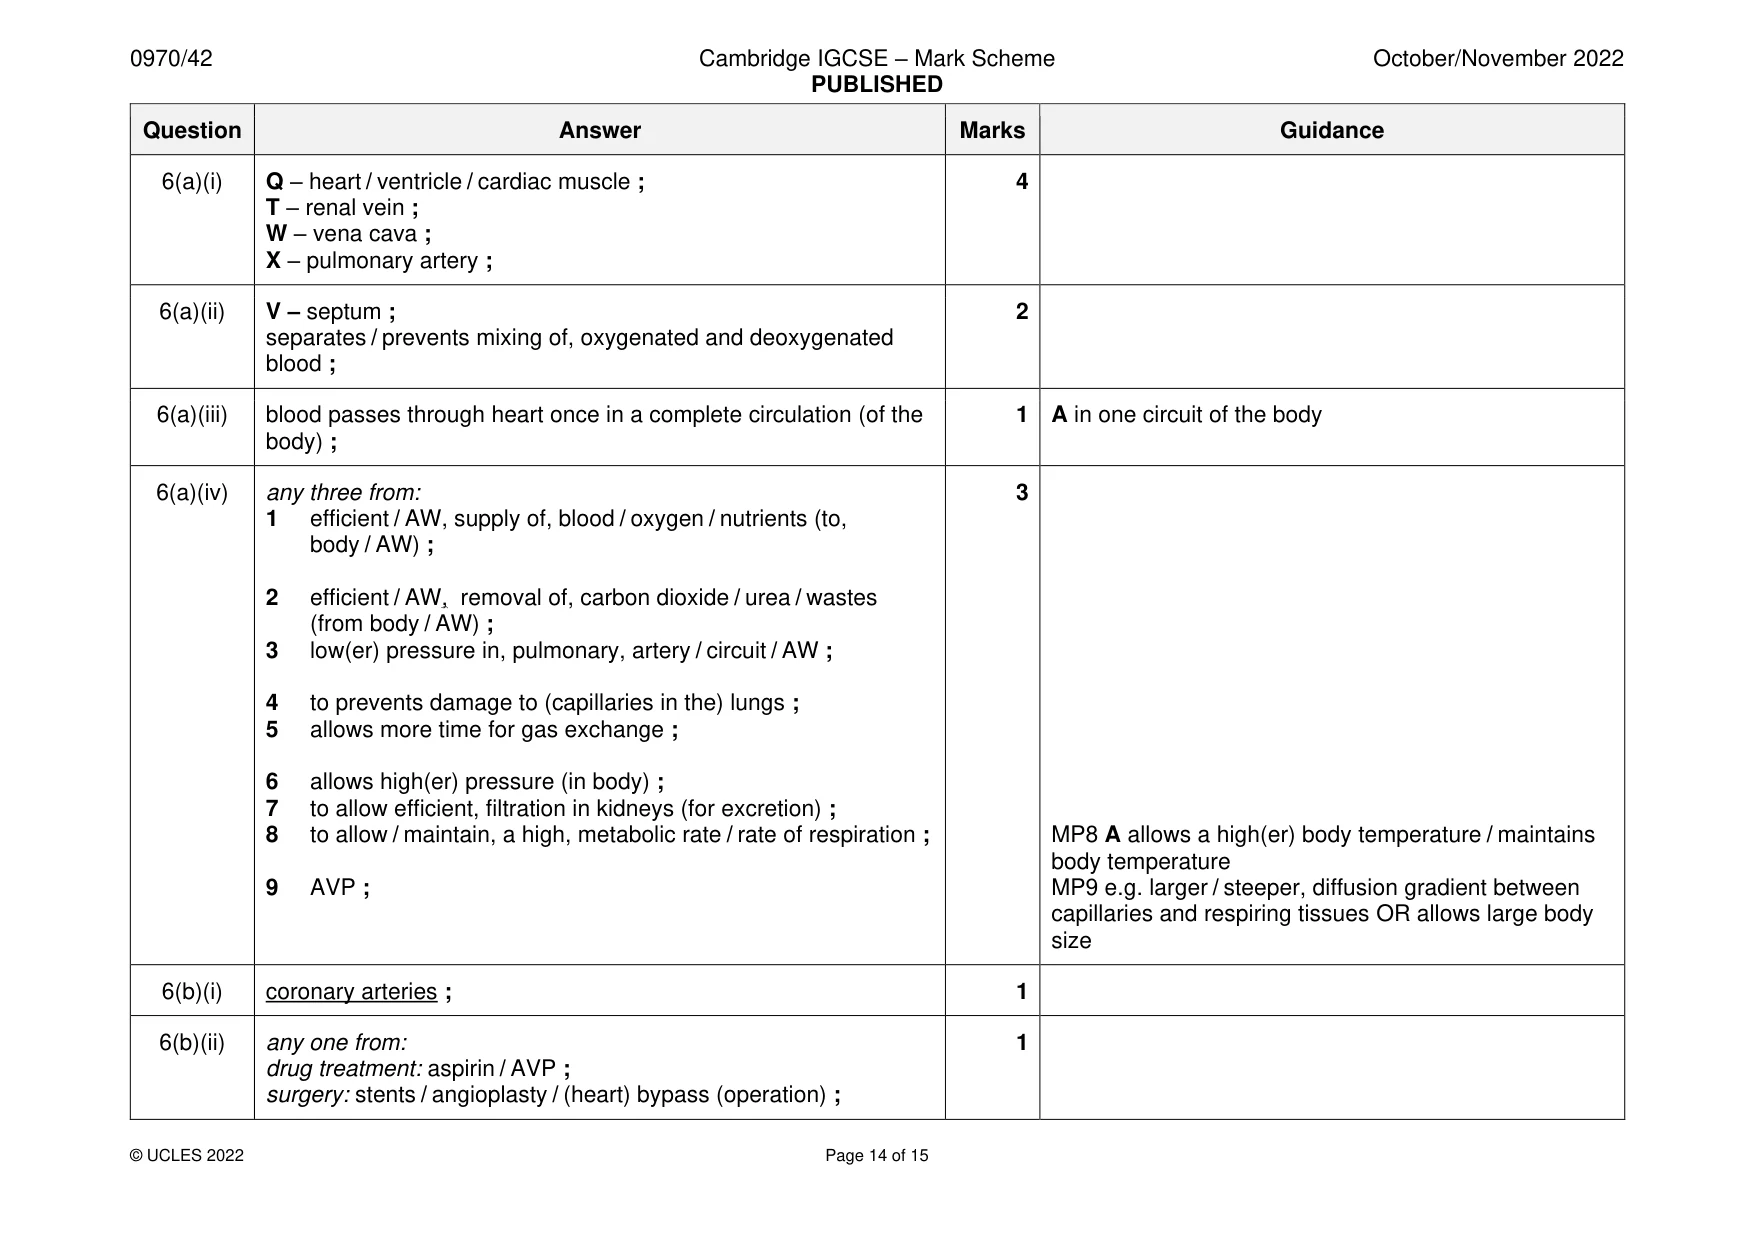
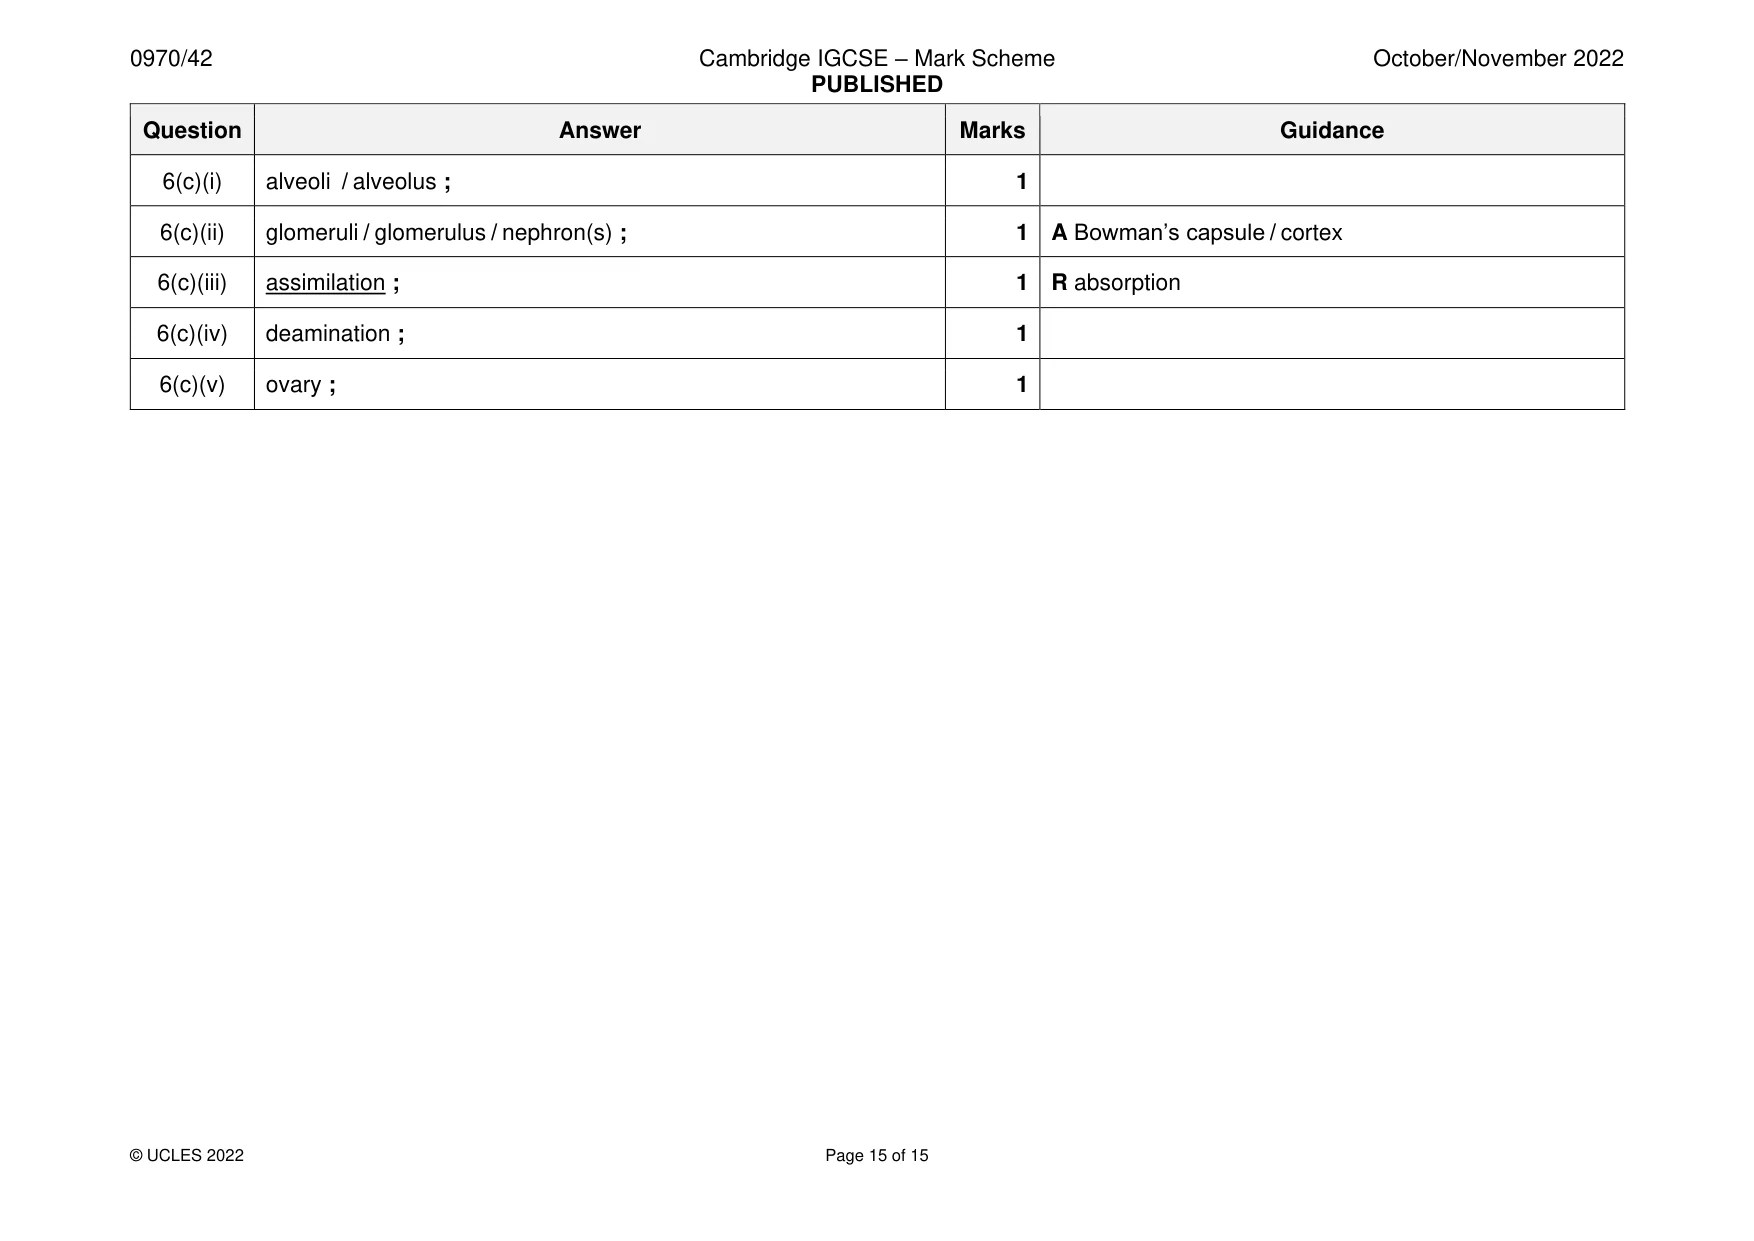
Mark scheme: 6(a)(i) Q – heart / ventricle / cardiac muscle ; 4 T – renal vein ; W – vena cava ; X – pulmonary artery ; 6(a)(ii) V – septum ; 2 separates / prevents mixing of, oxygenated and deoxygenated blood ; 6(a)(iii) blood passes through heart once in a complete circulation (of the 1 A in one circuit of the body body) ; 6(a)(iv) any three from: 3 1 efficient / AW, supply of, blood / oxygen / nutrients (to, body / AW) ; 2 efficient / AW, removal of, carbon dioxide / urea / wastes (from body / AW) ; 3 low(er) pressure in, pulmonary, artery / circuit / AW ; 4 to prevents damage to (capillaries in the) lungs ; 5 allows more time for gas exchange ; 6 allows high(er) pressure (in body) ; 7 to allow efficient, filtration in kidneys (for excretion) ; 8 to allow / maintain, a high, metabolic rate / rate of respiration ; MP8 A allows a high(er) body temperature / maintains body temperature 9 AVP ; MP9 e.g. larger / steeper, diffusion gradient between capillaries and respiring tissues OR allows large body size 6(b)(i) coronary arteries ; 1 6(b)(ii) any one from: 1 drug treatment: aspirin / AVP ; surgery: stents / angioplasty / (heart) bypass (operation) ; 6(c)(i) alveoli / alveolus ; 1 6(c)(ii) glomeruli / glomerulus / nephron(s) ; 1 A Bowman’s capsule / cortex 6(c)(iii) assimilation ; 1 R absorption 6(c)(iv) deamination ; 1 6(c)(v) ovary ; 1
What was in this paper
The subtopics covered by these 6 questions, and how many questions each got. Open one in a new tab to see every Cambridge question on it.
What you needed in this session
Cambridge’s own grade thresholds for 2022 Oct/Nov, Paper 4 · Variant 2. A higher threshold means an easier paper — the bar moves with how the cohort did.