Cambridge A Level Psychology (from 2018) 9990 — 2021 Feb/March Paper 3 · Variant 2
9990/32/F/M/21 · 8 questions · 60 marks · ≈68 min
The question paper and its mark scheme, free to read here and free to download. This is Cambridge’s own paper, exactly as it was sat.
Question paper4 pages

Mark scheme22 pages
Answers below. Sit the paper first if you are practising.
Questions as text
Q1 · Outline two common obsessions in obsessive-compulsive disorder (OCD)
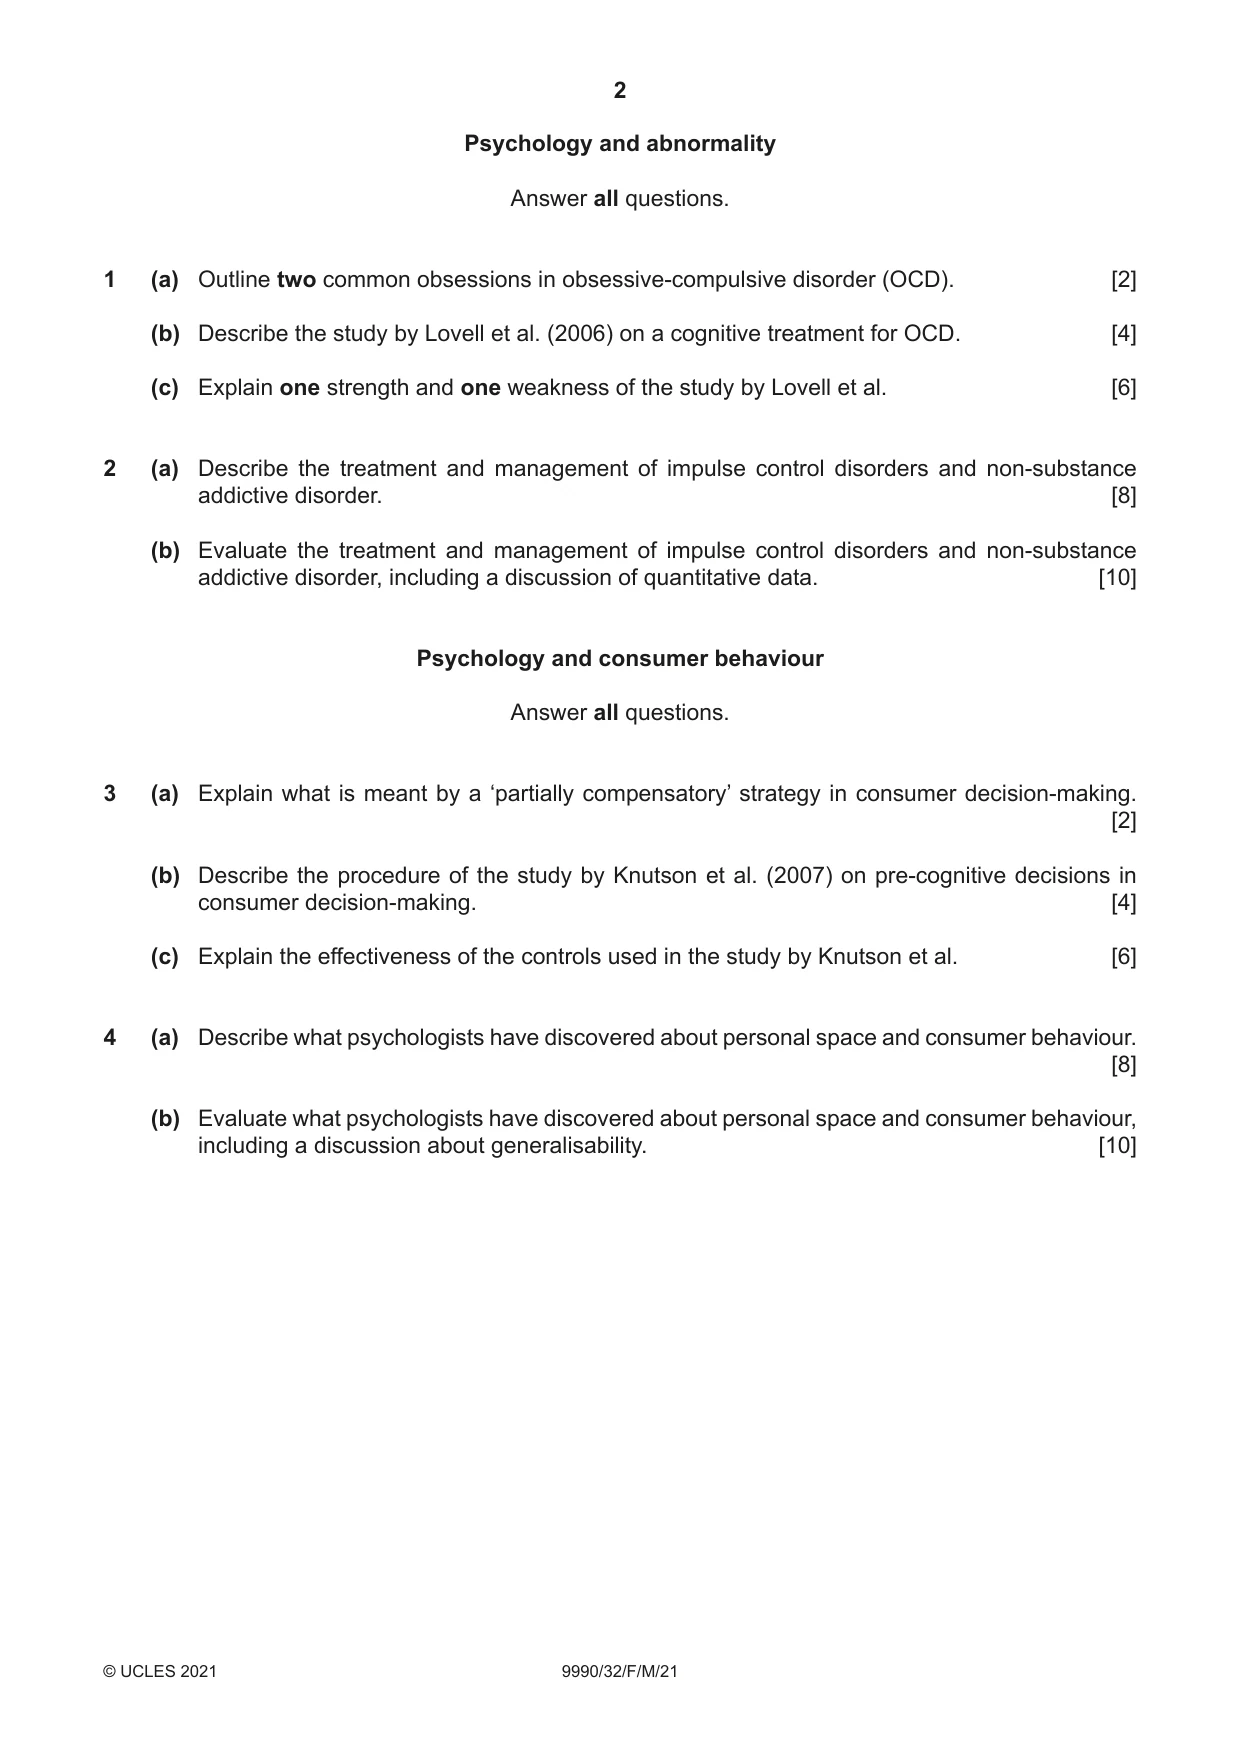
1 (a) Outline two common obsessions in obsessive-compulsive disorder (OCD). [2] (b) Describe the study by Lovell et al. (2006) on a cognitive treatment for OCD. [4] (c) Explain one strength and one weakness of the study by Lovell et al. [6]
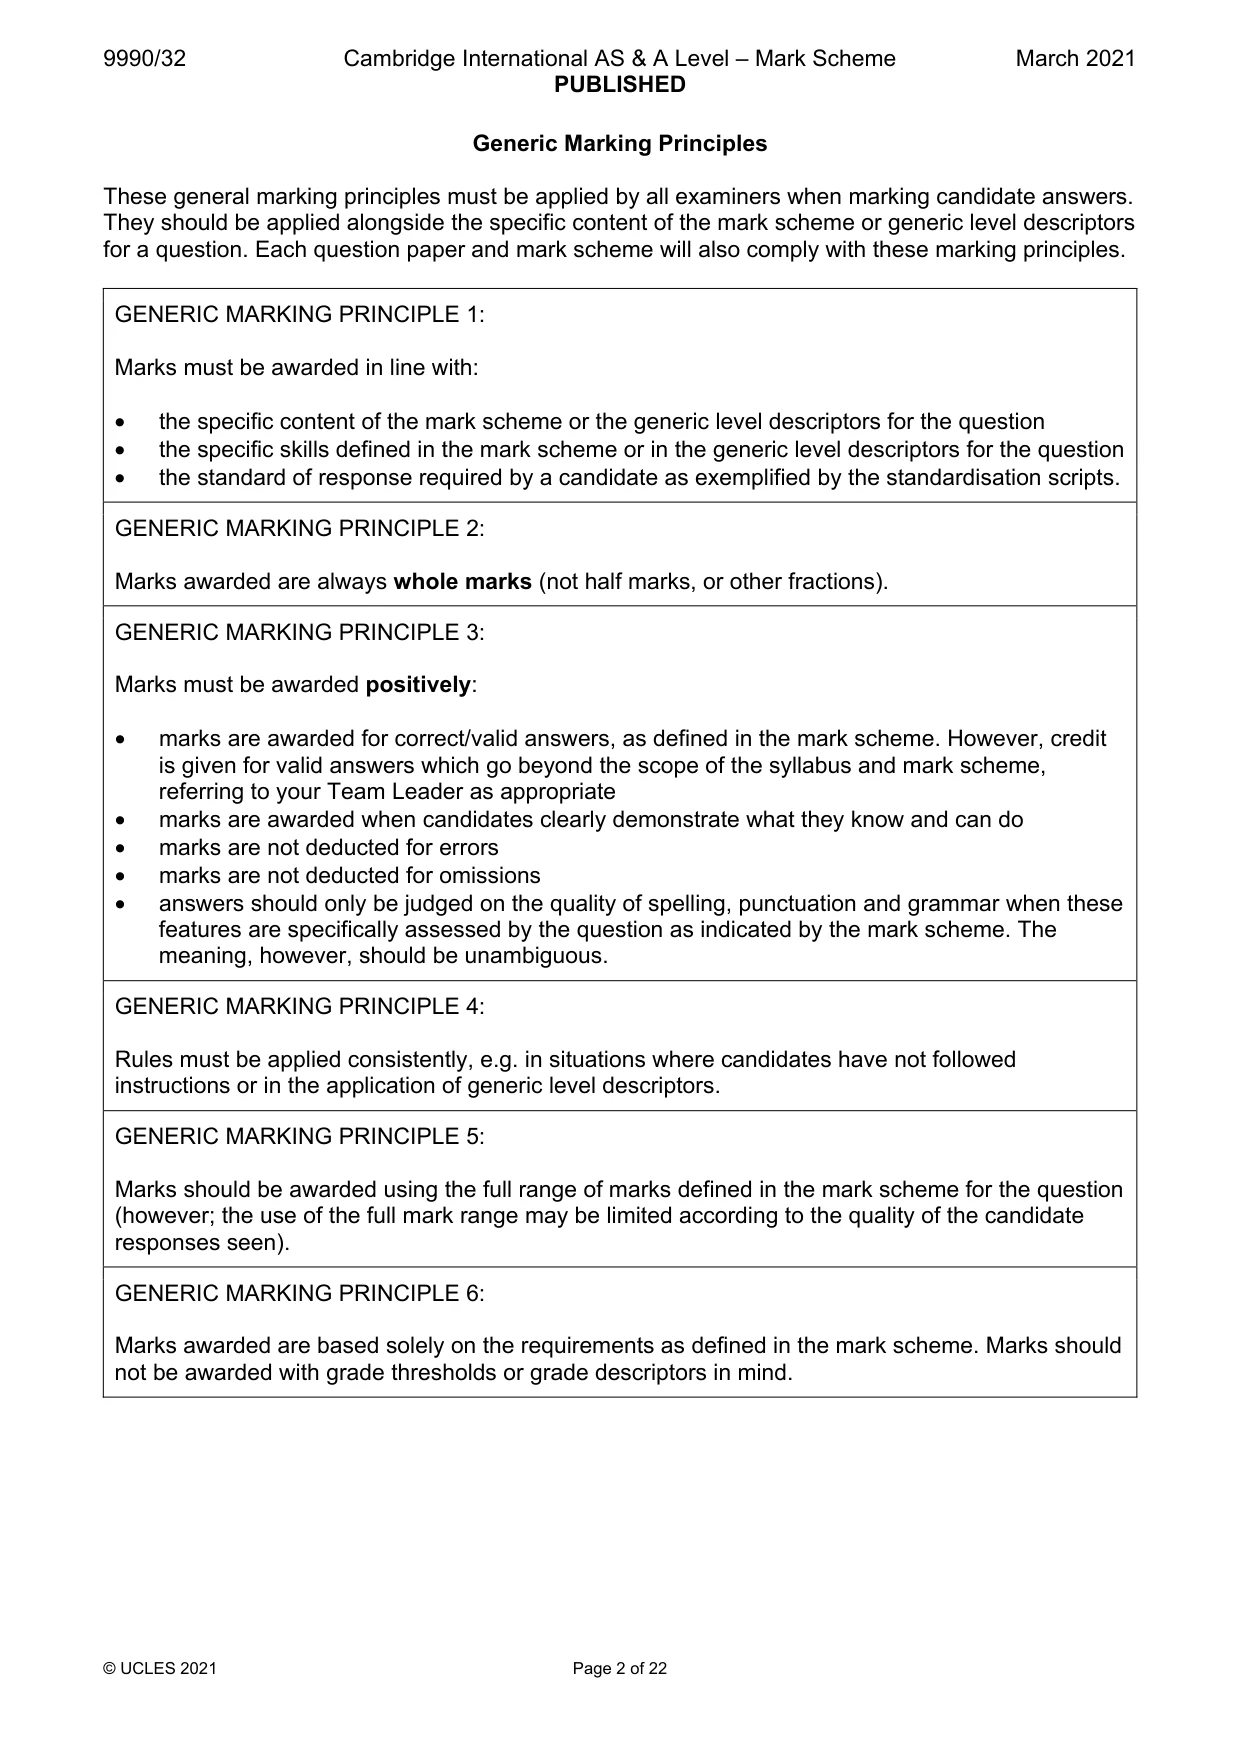
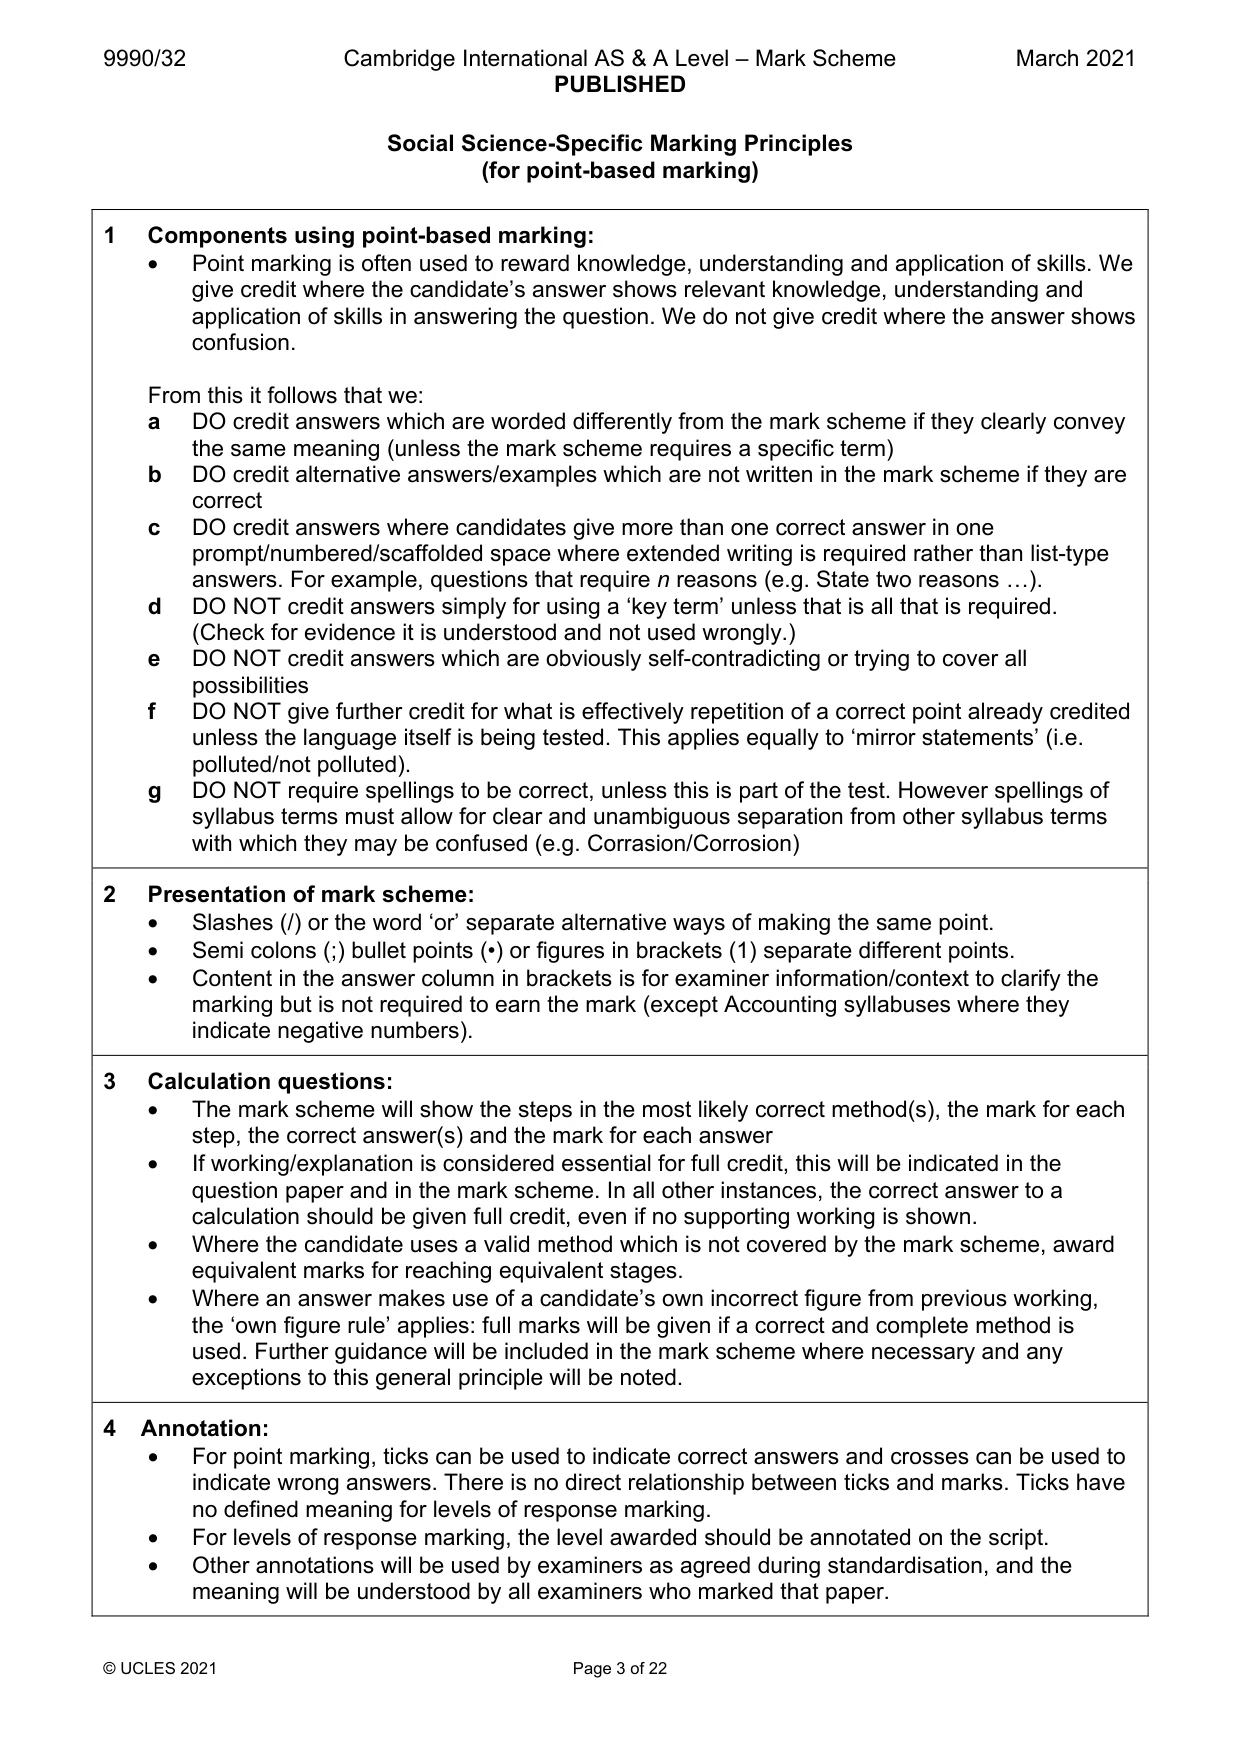
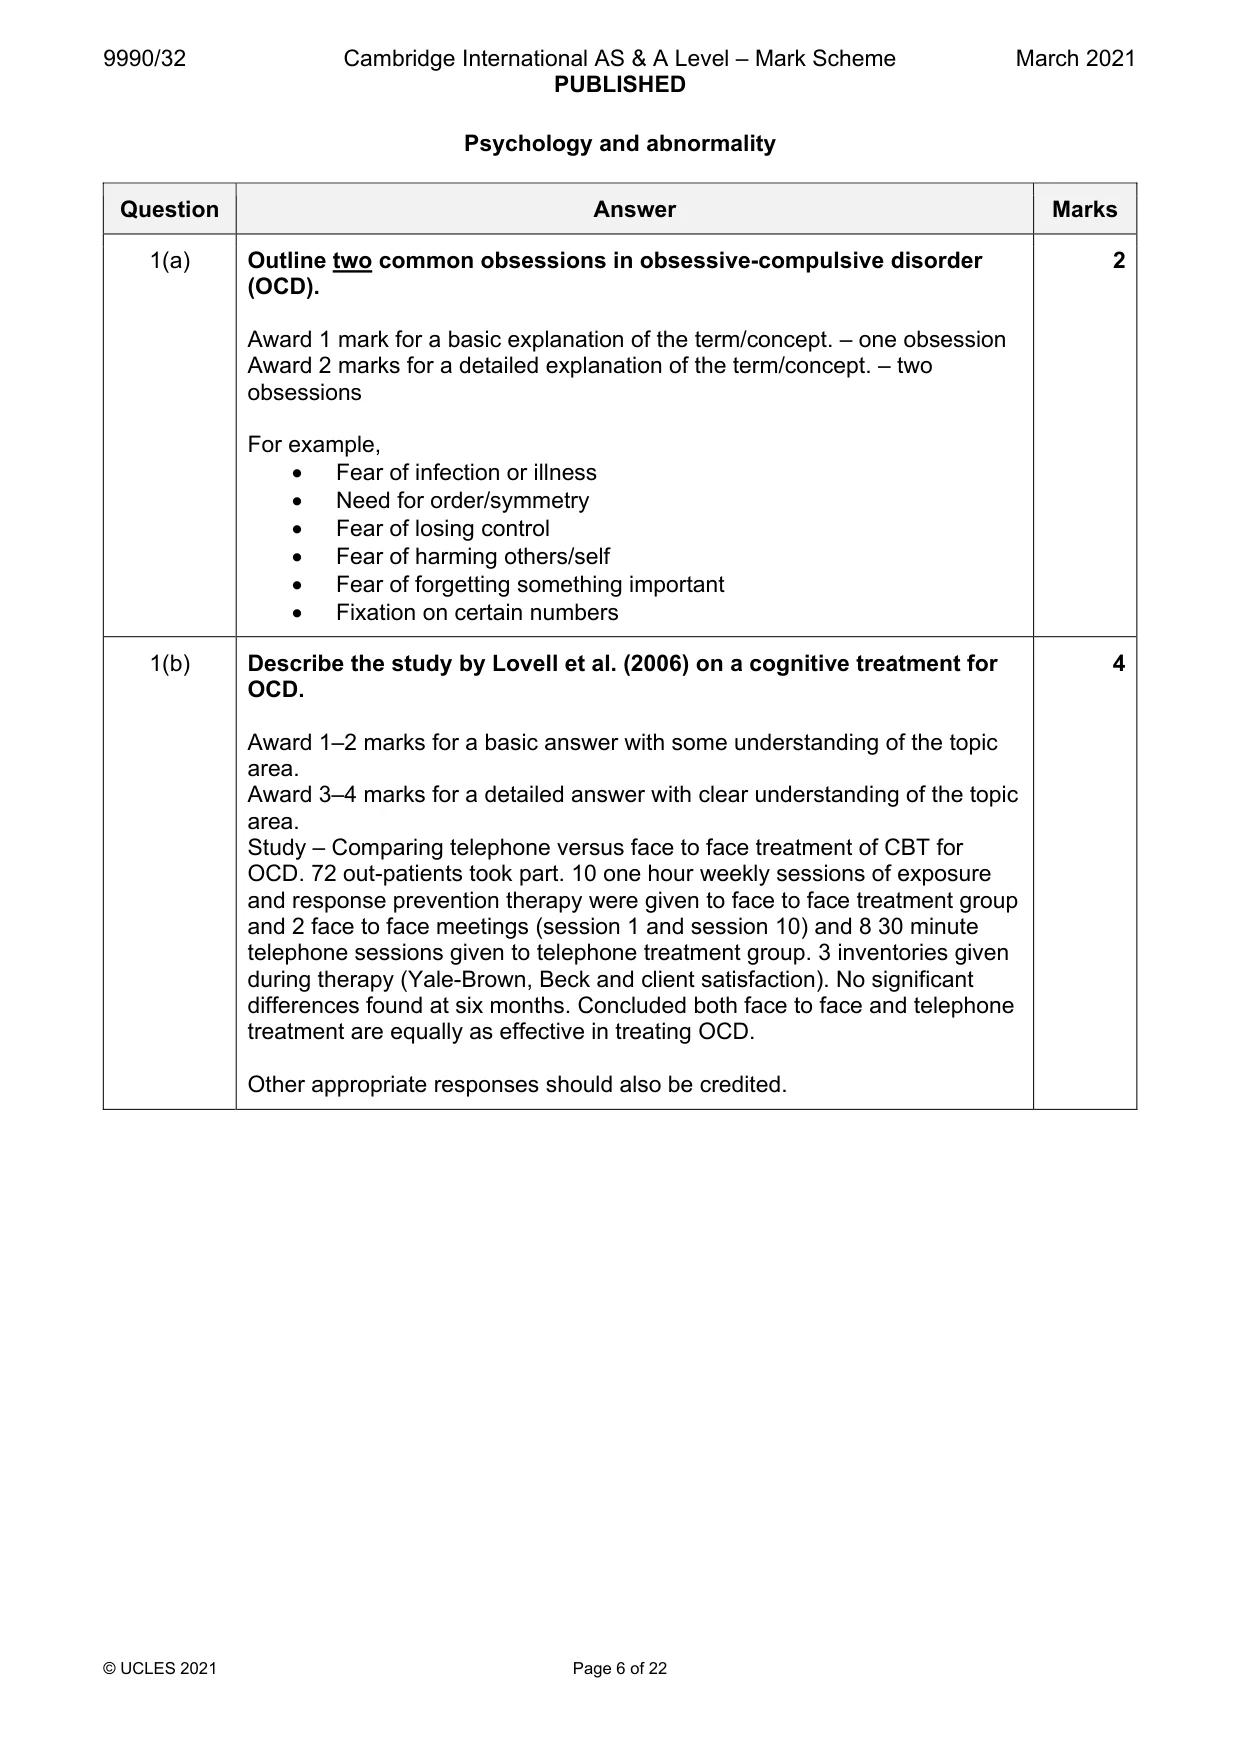
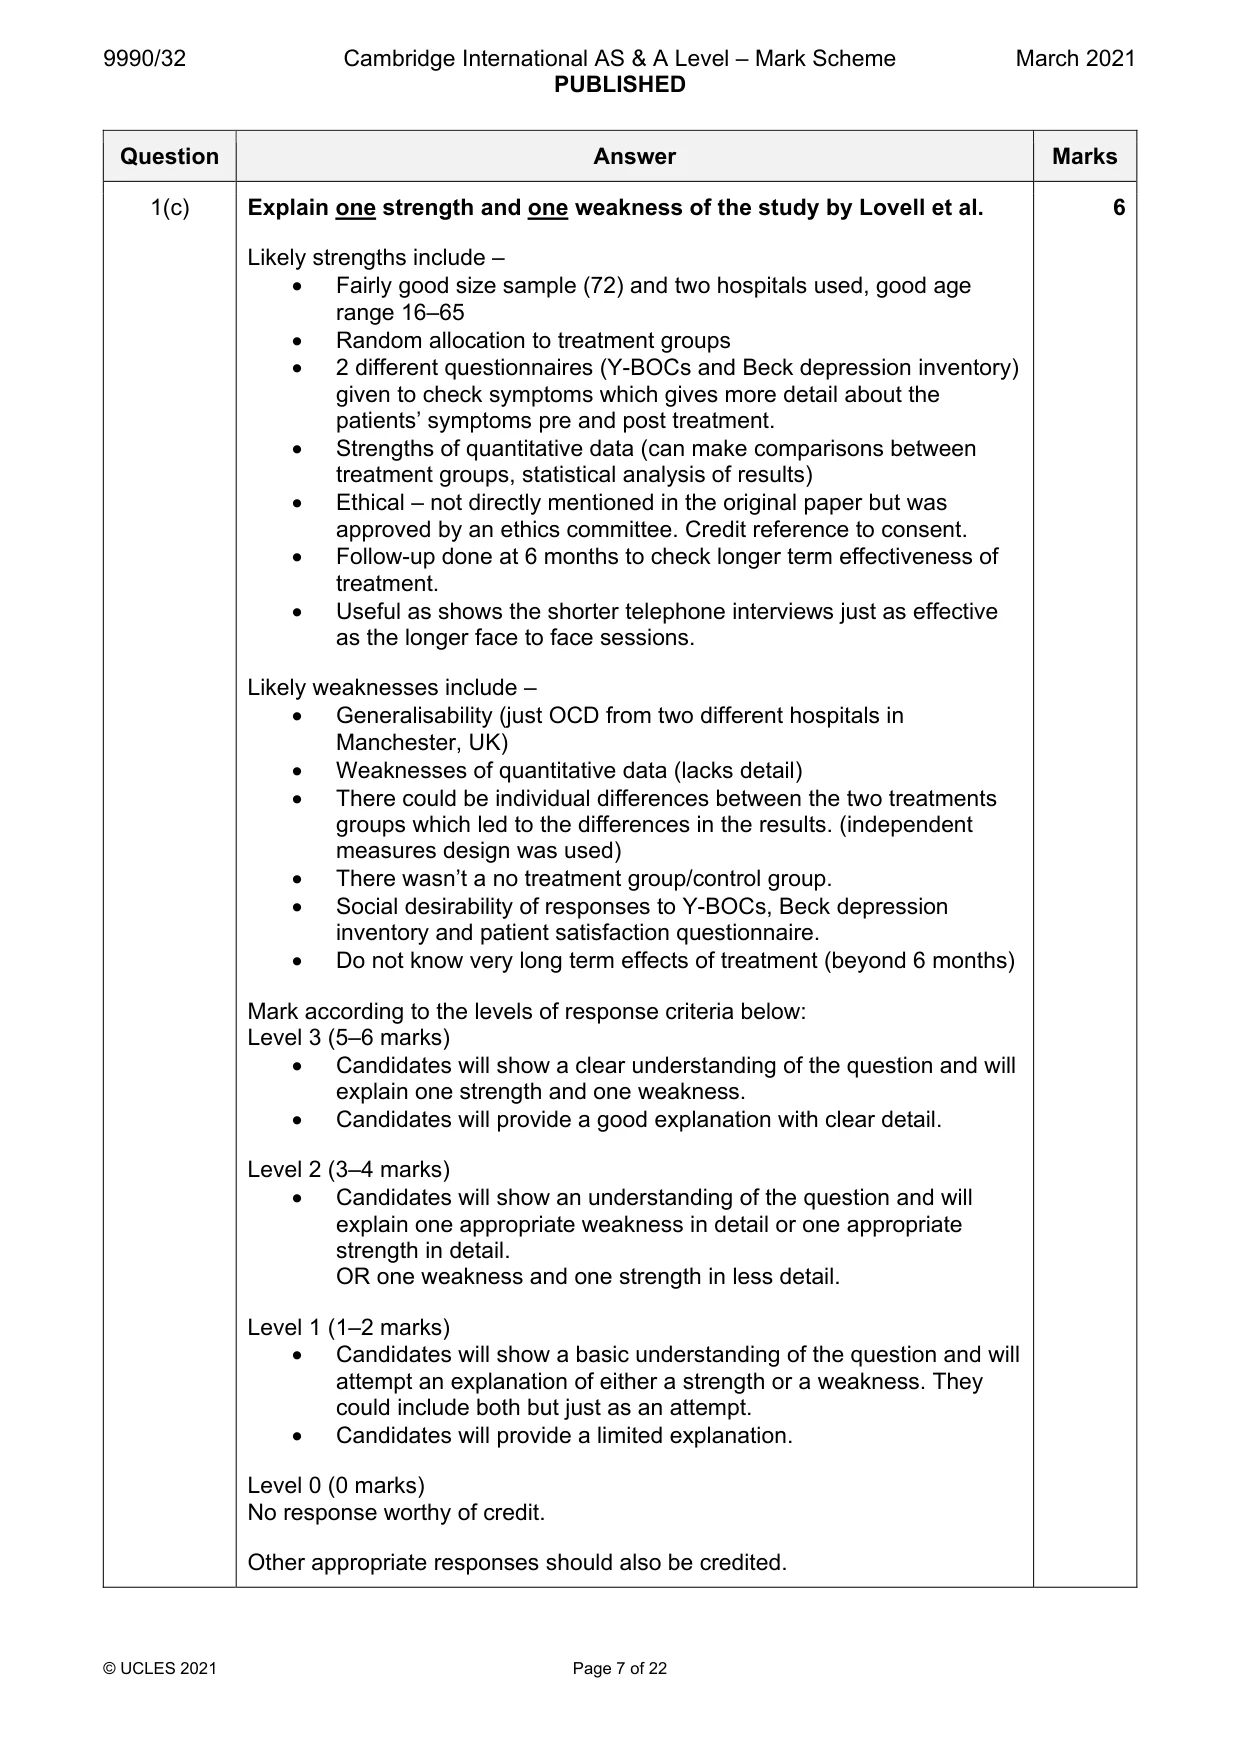
Mark scheme: Question Answer Marks 1(a) Outline two common obsessions in obsessive-compulsive disorder 2 (OCD). Award 1 mark for a basic explanation of the term/concept. – one obsession Award 2 marks for a detailed explanation of the term/concept. – two obsessions For example, • Fear of infection or illness • Need for order/symmetry • Fear of losing control • Fear of harming others/self • Fear of forgetting something important • Fixation on certain numbers 1(b) Describe the study by Lovell et al. (2006) on a cognitive treatment for 4 OCD. Award 1–2 marks for a basic answer with some understanding of the topic area. Award 3–4 marks for a detailed answer with clear understanding of the topic area. Study – Comparing telephone versus face to face treatment of CBT for OCD. 72 out-patients took part. 10 one hour weekly sessions of exposure and response prevention therapy were given to face to face treatment group and 2 face to face meetings (session 1 and session 10) and 8 30 minute telephone sessions given to telephone treatment group. 3 inventories given during therapy (Yale-Brown, Beck and client satisfaction). No significant differences found at six months. Concluded both face to face and telephone treatment are equally as effective in treating OCD. Other appropriate responses should also be credited. 1(c) Explain one strength and one weakness of the study by Lovell et al. 6 Likely strengths include – • Fairly good size sample (72) and two hospitals used, good age range 16–65 • Random allocation to treatment groups • 2 different questionnaires (Y-BOCs and Beck depression inventory) given to check symptoms which gives more detail about the patients’ symptoms pre and post treatment. • Strengths of quantitative data (can make comparisons between treatment groups, statistical analysis of results) • Ethical – not directly mentioned in the original paper but was approved by an ethics committee. Credit reference to consent. • Follow-up done at 6 months to check longer term effectiveness of treatment. • Useful as shows the shorter telephone interviews just as effective as the longer face to face sessions. Likely weaknesses include – • Generalisability (just OCD from two different hospitals in Manchester, UK) • Weaknesses of quantitative data (lacks detail) • There could be individual differences between the two treatments groups which led to the differences in the results. (independent measures design was used) • There wasn’t a no treatment group/control group. • Social desirability of responses to Y-BOCs, Beck depression inventory and patient satisfaction questionnaire. • Do not know very long term effects of treatment (beyond 6 months) Mark according to the levels of response criteria below: Level 3 (5–6 marks) • Candidates will show a clear understanding of the question and will explain one strength and one weakness. • Candidates will provide a good explanation with clear detail. Level 2 (3–4 marks) • Candidates will show an understanding of the question and will explain one appropriate weakness in detail or one appropriate strength in detail. OR one weakness and one strength in less detail. Level 1 (1–2 marks) • Candidates will show a basic understanding of the question and will attempt an explanation of either a strength or a weakness. They could include both but just as an attempt. • Candidates will provide a limited explanation. Level 0 (0 marks) No response worthy of credit. Other appropriate responses should also be credited.
Q2 · Describe the treatment and management of impulse control disorders and non-substance…
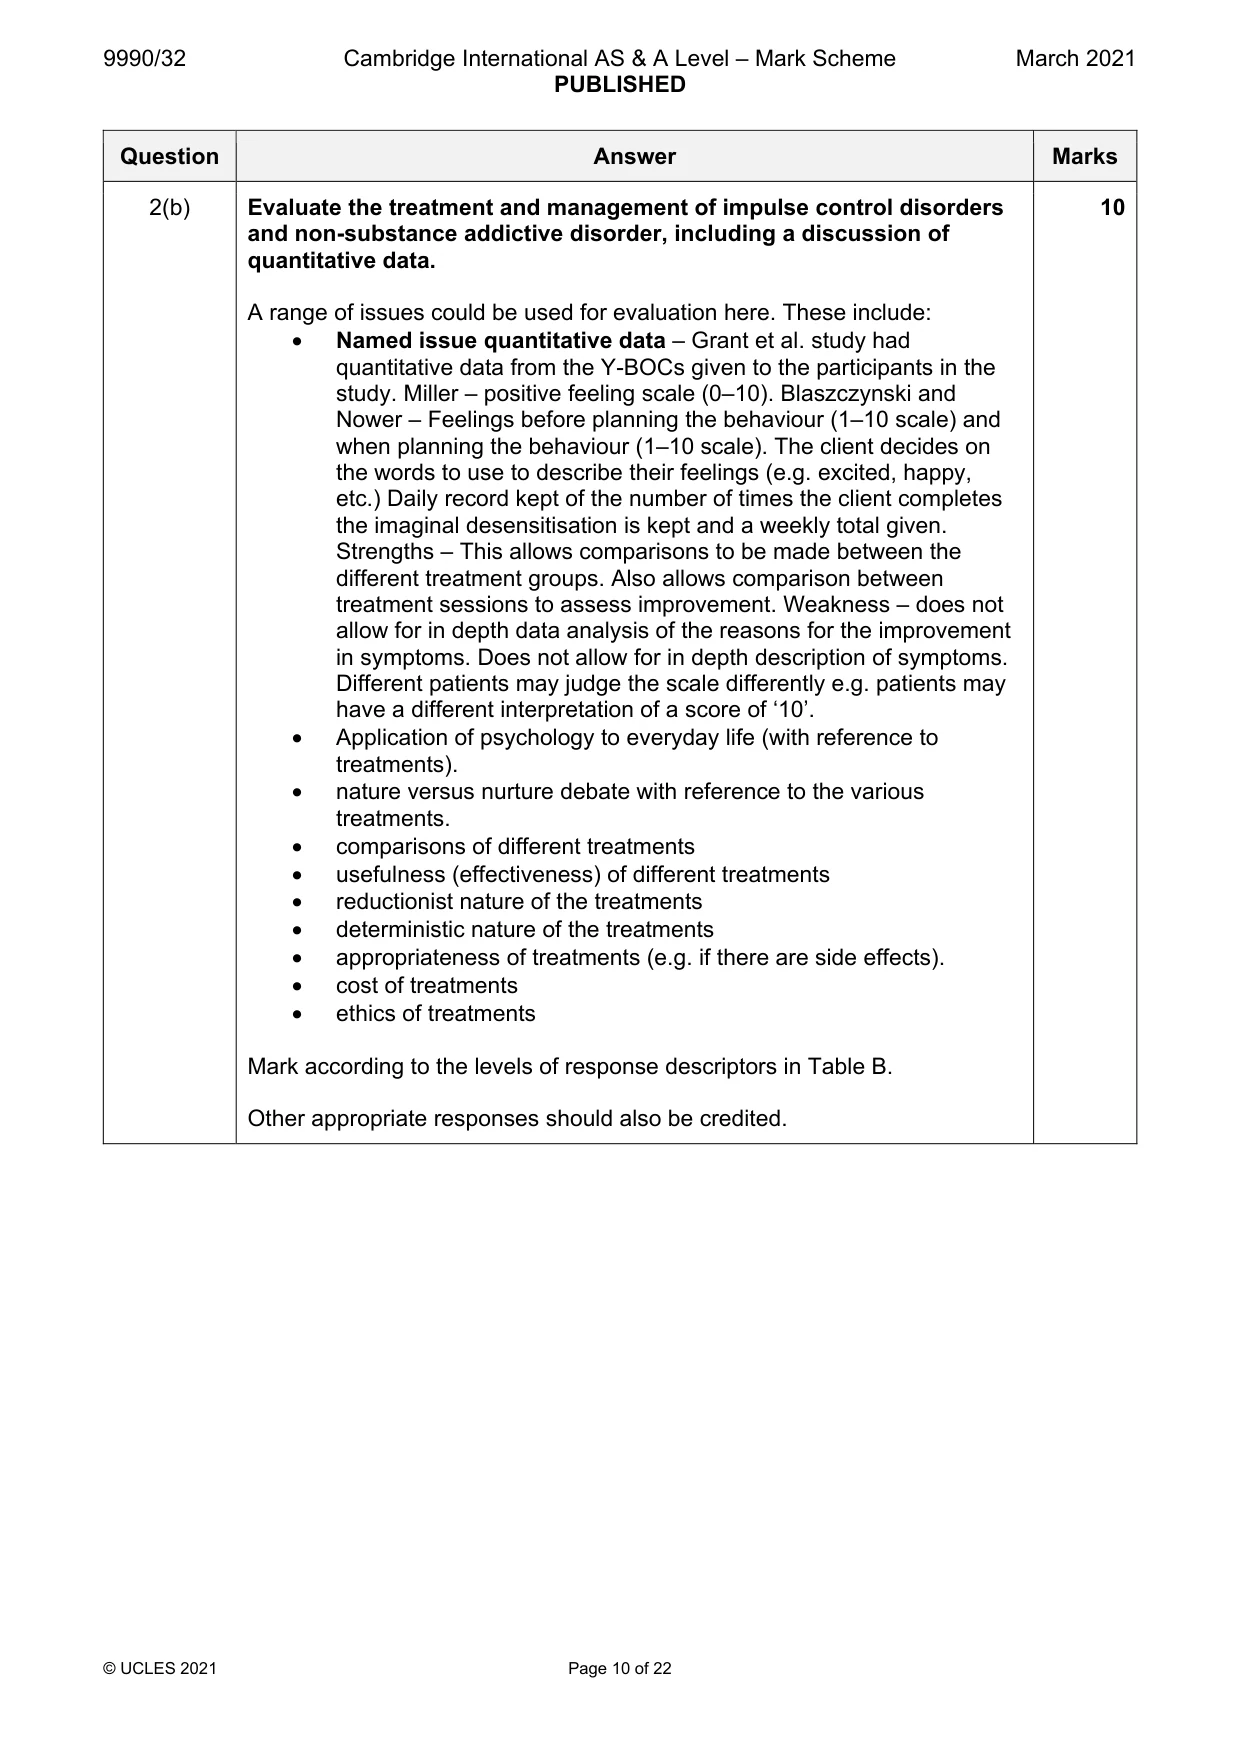
2 (a) Describe the treatment and management of impulse control disorders and non-substance addictive disorder. [8] (b) Evaluate the treatment and management of impulse control disorders and non-substance addictive disorder, including a discussion of quantitative data. [10] Psychology and consumer behaviour Answer all questions.
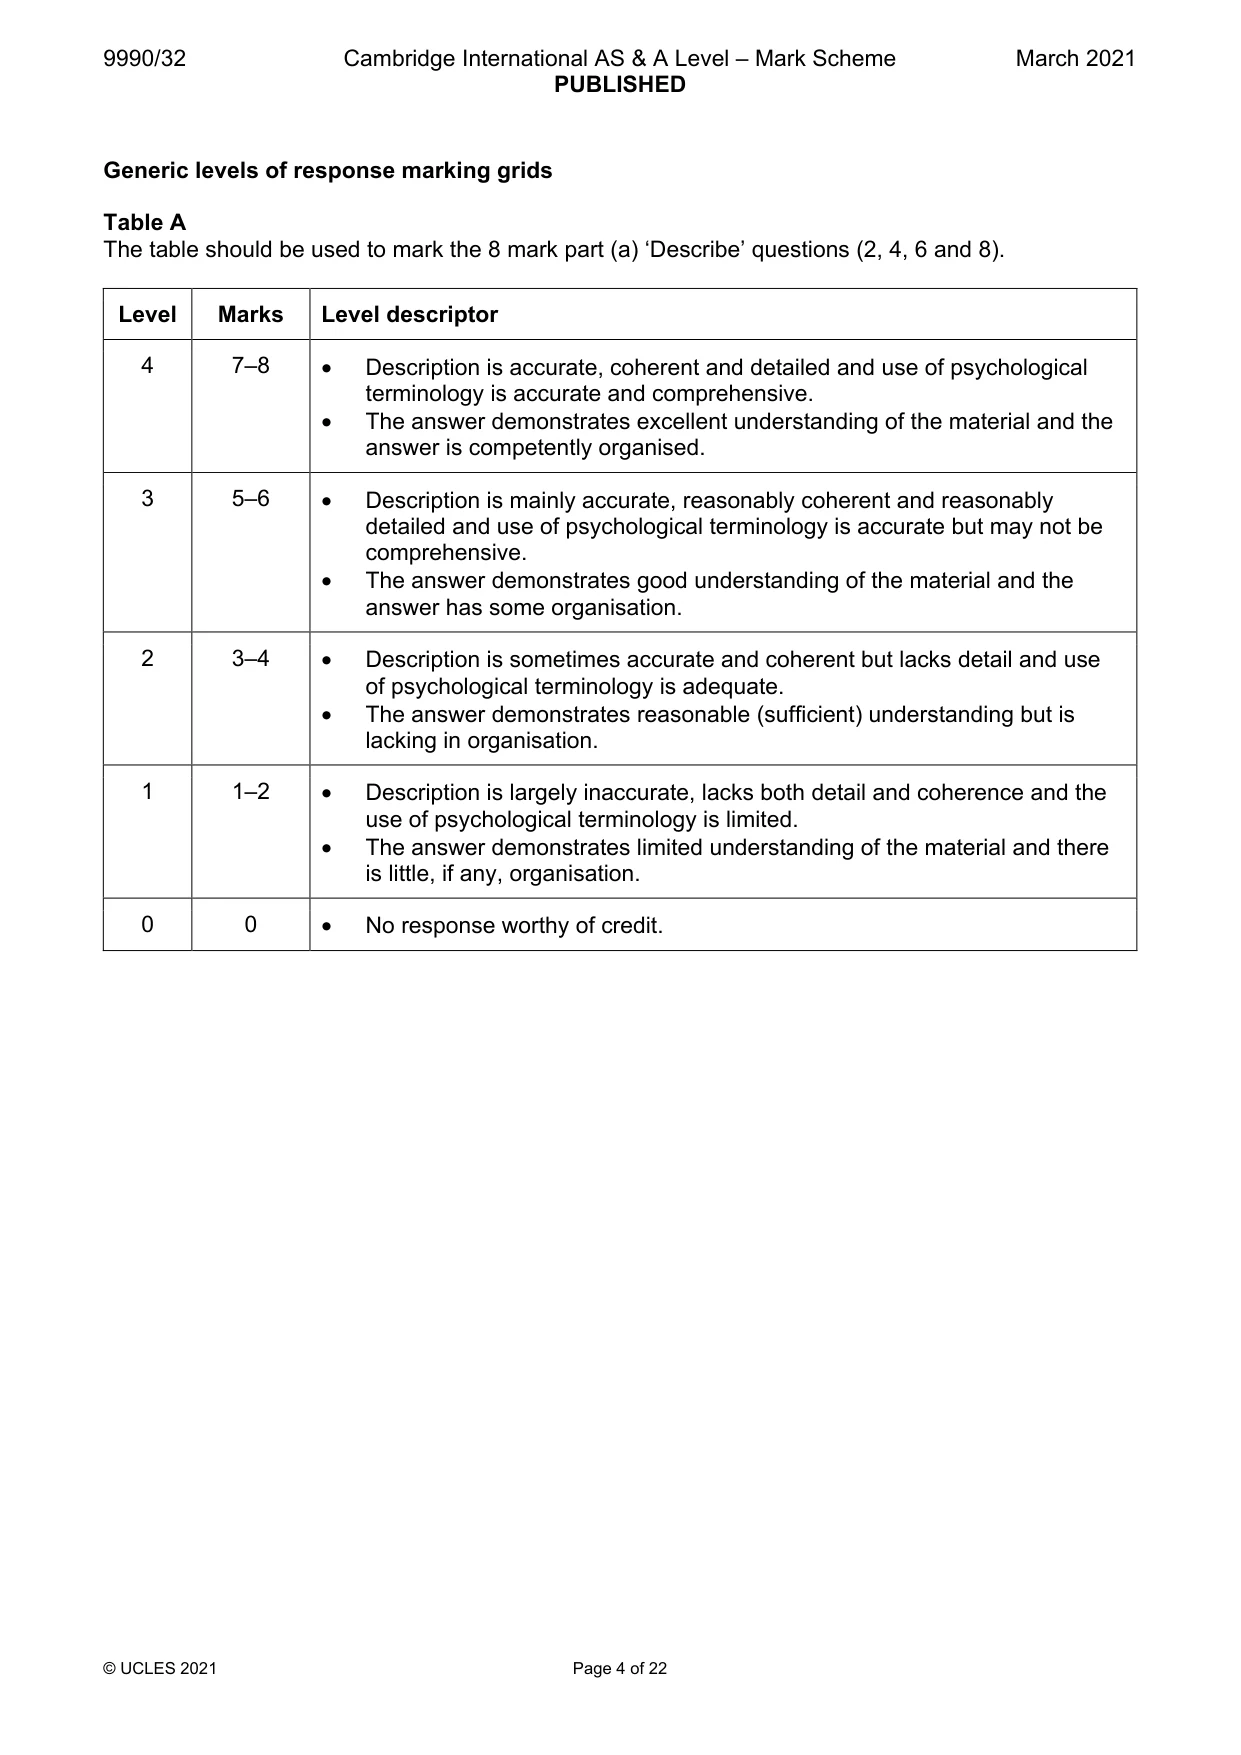
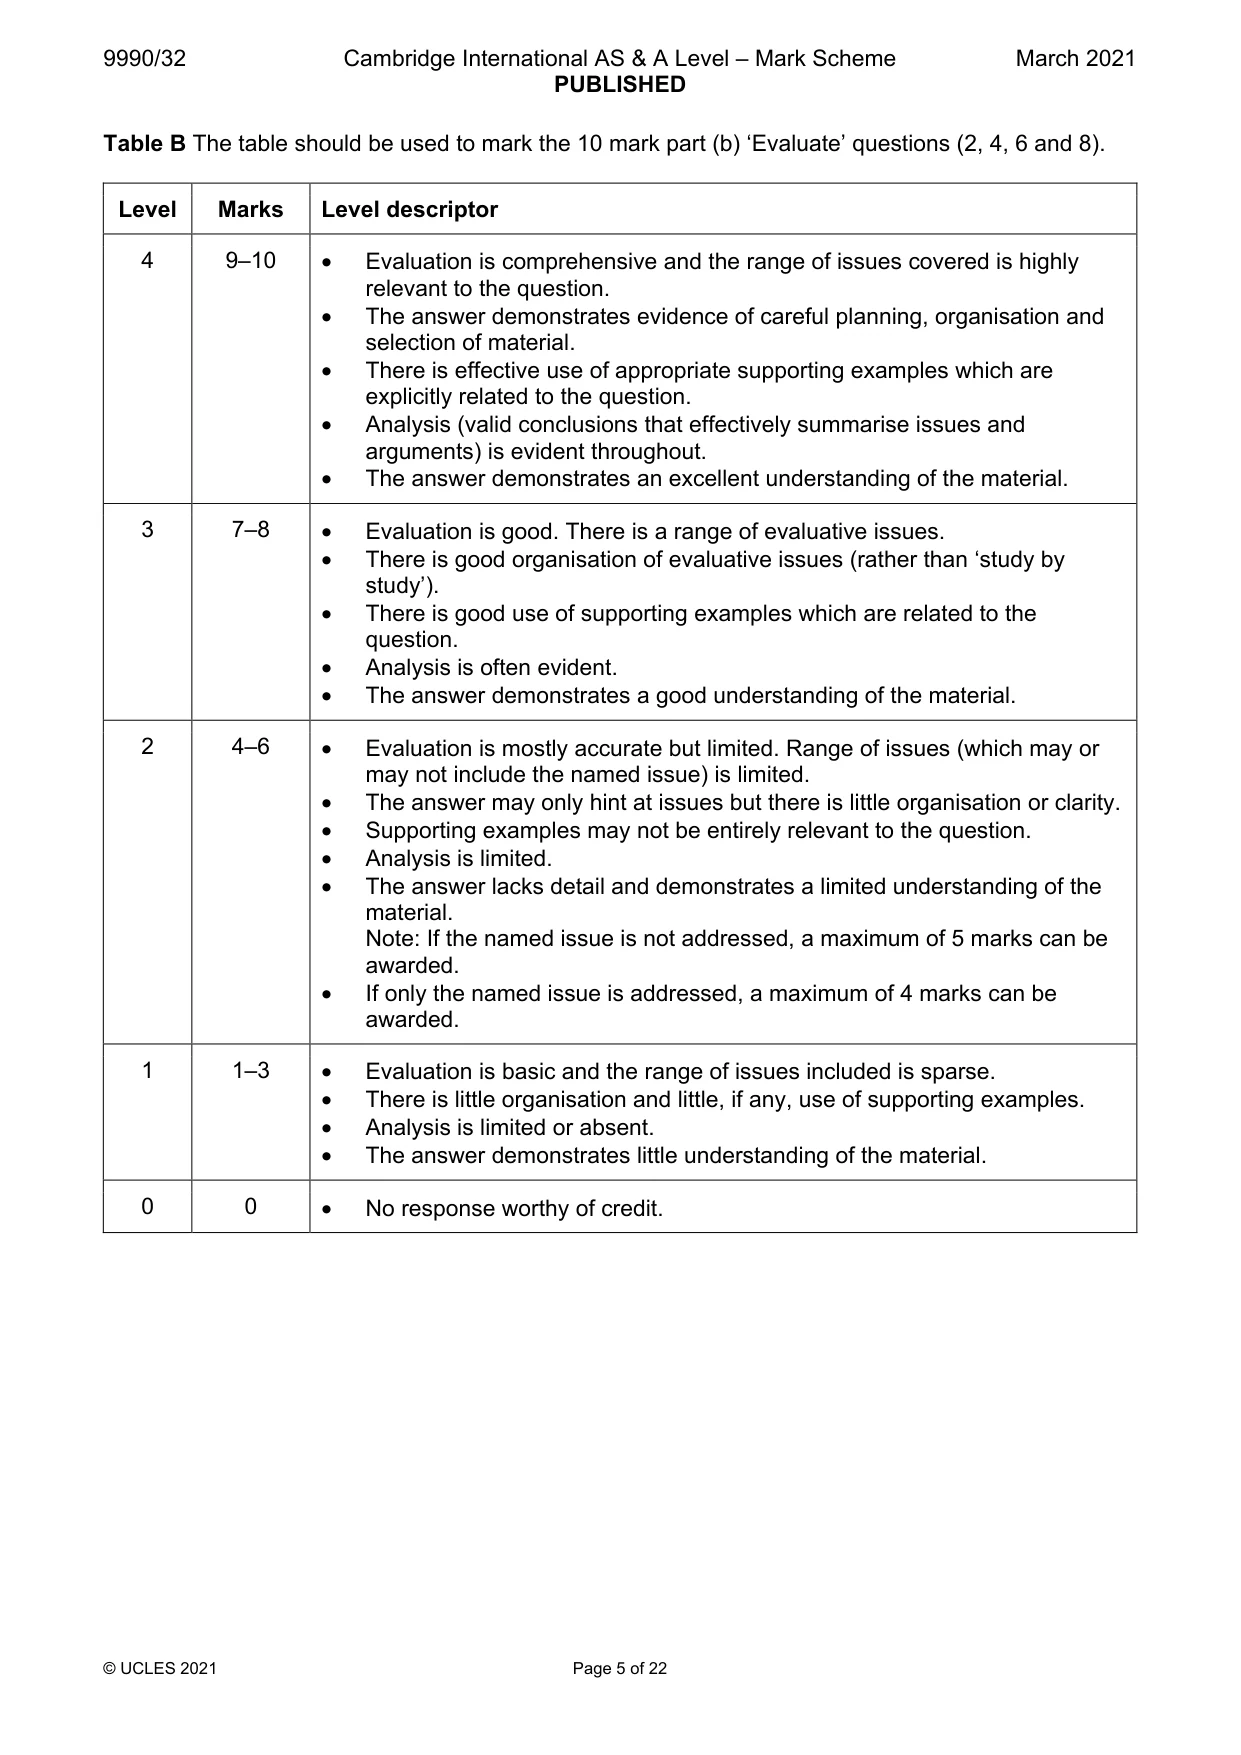
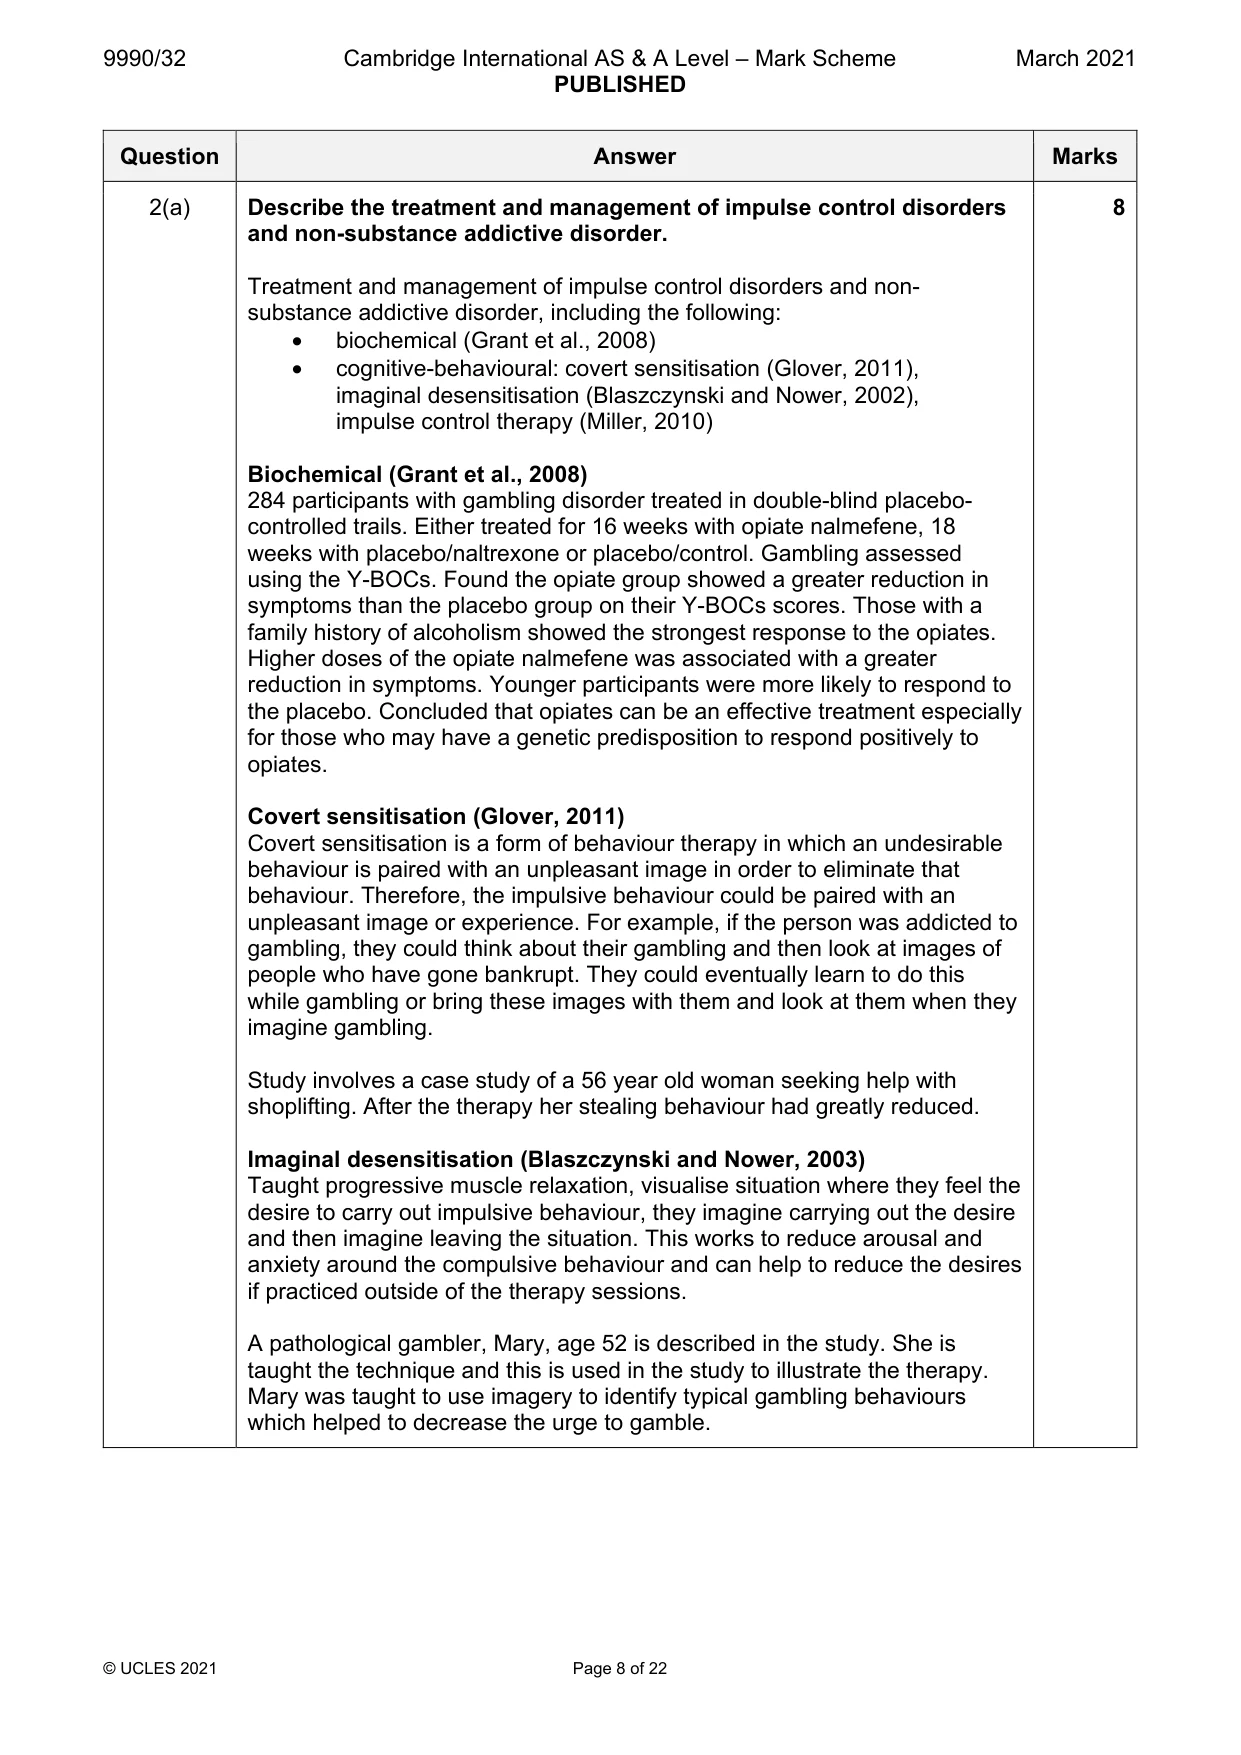
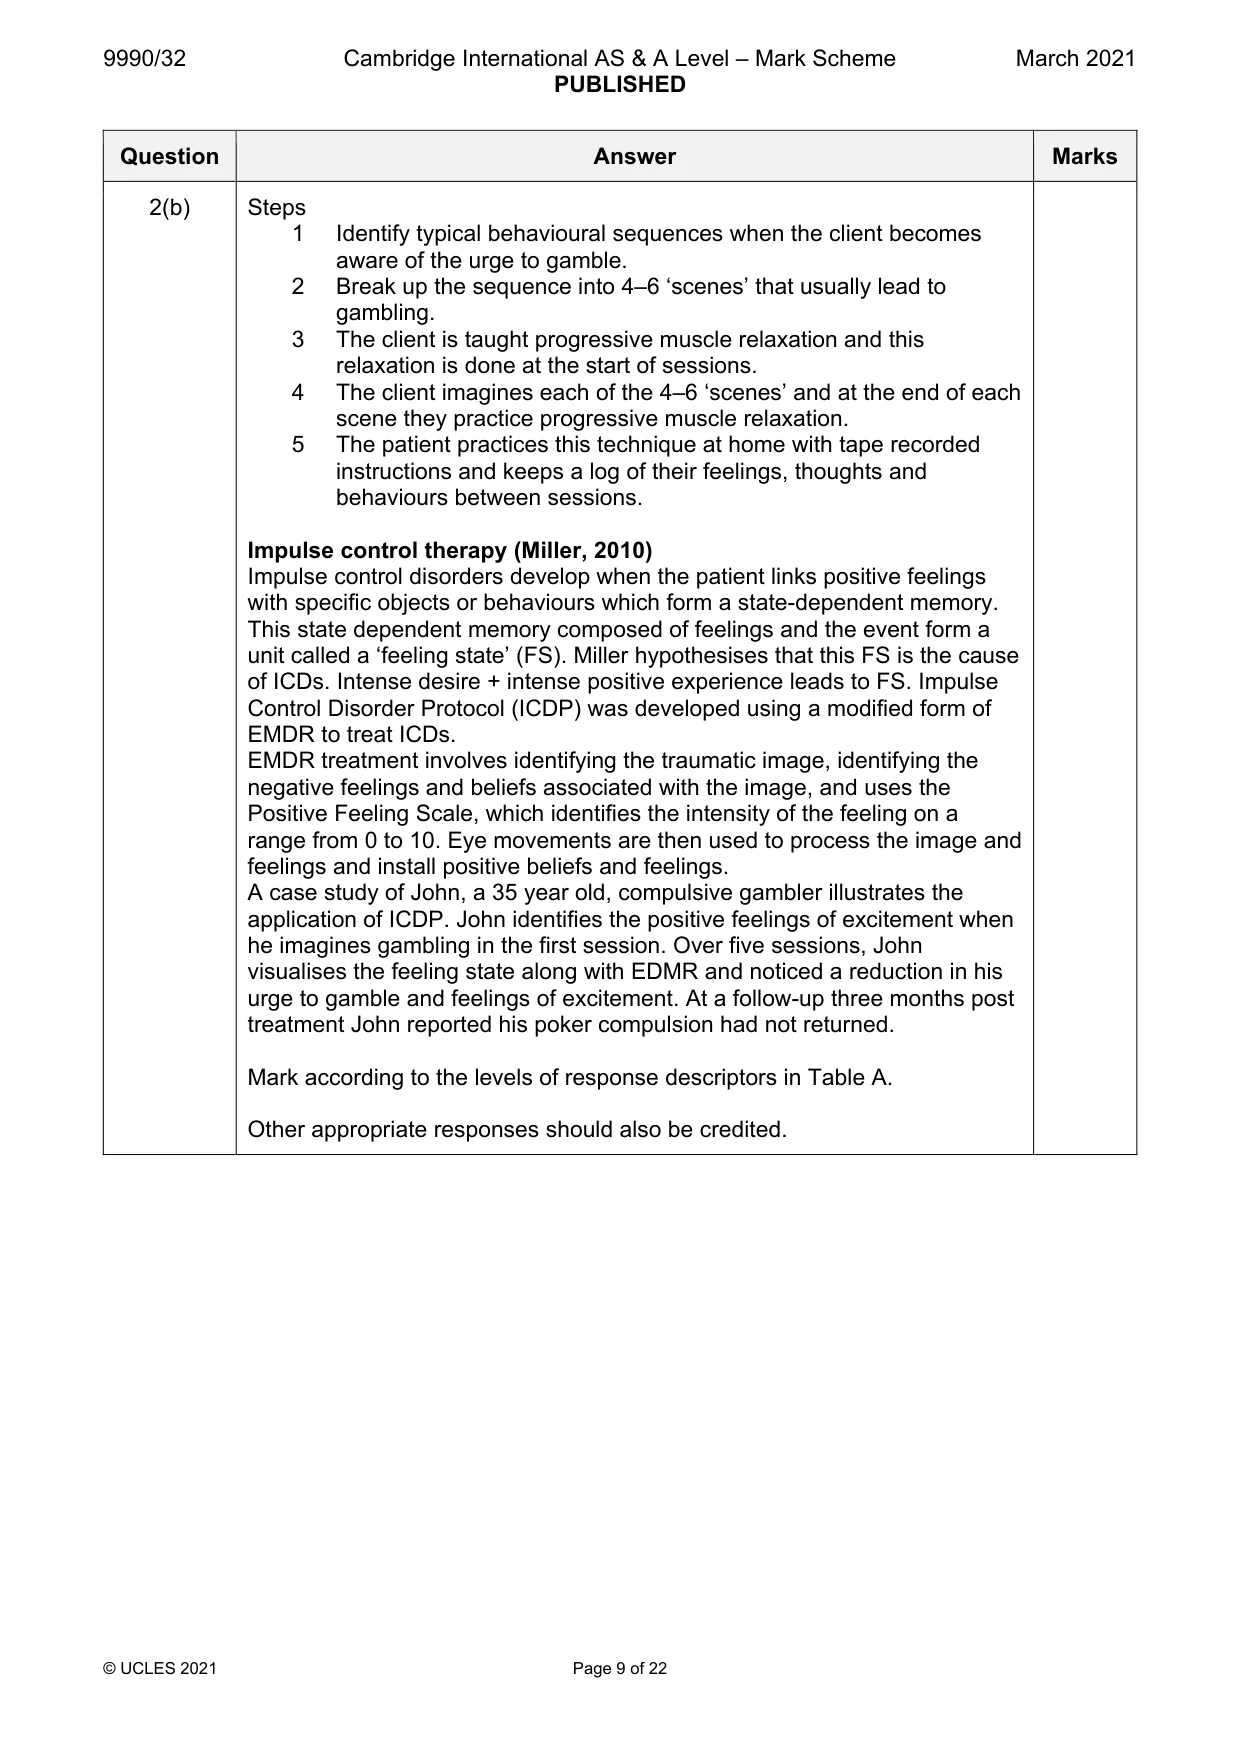
Mark scheme: 2(a) Describe the treatment and management of impulse control disorders 8 and non-substance addictive disorder. Treatment and management of impulse control disorders and non- substance addictive disorder, including the following: • biochemical (Grant et al., 2008) • cognitive-behavioural: covert sensitisation (Glover, 2011), imaginal desensitisation (Blaszczynski and Nower, 2002), impulse control therapy (Miller, 2010) Biochemical (Grant et al., 2008) 284 participants with gambling disorder treated in double-blind placebo- controlled trails. Either treated for 16 weeks with opiate nalmefene, 18 weeks with placebo/naltrexone or placebo/control. Gambling assessed using the Y-BOCs. Found the opiate group showed a greater reduction in symptoms than the placebo group on their Y-BOCs scores. Those with a family history of alcoholism showed the strongest response to the opiates. Higher doses of the opiate nalmefene was associated with a greater reduction in symptoms. Younger participants were more likely to respond to the placebo. Concluded that opiates can be an effective treatment especially for those who may have a genetic predisposition to respond positively to opiates. Covert sensitisation (Glover, 2011) Covert sensitisation is a form of behaviour therapy in which an undesirable behaviour is paired with an unpleasant image in order to eliminate that behaviour. Therefore, the impulsive behaviour could be paired with an unpleasant image or experience. For example, if the person was addicted to gambling, they could think about their gambling and then look at images of people who have gone bankrupt. They could eventually learn to do this while gambling or bring these images with them and look at them when they imagine gambling. Study involves a case study of a 56 year old woman seeking help with shoplifting. After the therapy her stealing behaviour had greatly reduced. Imaginal desensitisation (Blaszczynski and Nower, 2003) Taught progressive muscle relaxation, visualise situation where they feel the desire to carry out impulsive behaviour, they imagine carrying out the desire and then imagine leaving the situation. This works to reduce arousal and anxiety around the compulsive behaviour and can help to reduce the desires if practiced outside of the therapy sessions. A pathological gambler, Mary, age 52 is described in the study. She is taught the technique and this is used in the study to illustrate the therapy. Mary was taught to use imagery to identify typical gambling behaviours which helped to decrease the urge to gamble. 2(b) Steps 1 Identify typical behavioural sequences when the client becomes aware of the urge to gamble. 2 Break up the sequence into 4–6 ‘scenes’ that usually lead to gambling. 3 The client is taught progressive muscle relaxation and this relaxation is done at the start of sessions. 4 The client imagines each of the 4–6 ‘scenes’ and at the end of each scene they practice progressive muscle relaxation. 5 The patient practices this technique at home with tape recorded instructions and keeps a log of their feelings, thoughts and behaviours between sessions. Impulse control therapy (Miller, 2010) Impulse control disorders develop when the patient links positive feelings with specific objects or behaviours which form a state-dependent memory. This state dependent memory composed of feelings and the event form a unit called a ‘feeling state’ (FS). Miller hypothesises that this FS is the cause of ICDs. Intense desire + intense positive experience leads to FS. Impulse Control Disorder Protocol (ICDP) was developed using a modified form of EMDR to treat ICDs. EMDR treatment involves identifying the traumatic image, identifying the negative feelings and beliefs associated with the image, and uses the Positive Feeling Scale, which identifies the intensity of the feeling on a range from 0 to 10. Eye movements are then used to process the image and feelings and install positive beliefs and feelings. A case study of John, a 35 year old, compulsive gambler illustrates the application of ICDP. John identifies the positive feelings of excitement when he imagines gambling in the first session. Over five sessions, John visualises the feeling state along with EDMR and noticed a reduction in his urge to gamble and feelings of excitement. At a follow-up three months post treatment John reported his poker compulsion had not returned. Mark according to the levels of response descriptors in Table A. Other appropriate responses should also be credited. 2(b) Evaluate the treatment and management of impulse control disorders 10 and non-substance addictive disorder, including a discussion of quantitative data. A range of issues could be used for evaluation here. These include: • Named issue quantitative data – Grant et al. study had quantitative data from the Y-BOCs given to the participants in the study. Miller – positive feeling scale (0–10). Blaszczynski and Nower – Feelings before planning the behaviour (1–10 scale) and when planning the behaviour (1–10 scale). The client decides on the words to use to describe their feelings (e.g. excited, happy, etc.) Daily record kept of the number of times the client completes the imaginal desensitisation is kept and a weekly total given. Strengths – This allows comparisons to be made between the different treatment groups. Also allows comparison between treatment sessions to assess improvement. Weakness – does not allow for in depth data analysis of the reasons for the improvement in symptoms. Does not allow for in depth description of symptoms. Different patients may judge the scale differently e.g. patients may have a different interpretation of a score of ‘10’. • Application of psychology to everyday life (with reference to treatments). • nature versus nurture debate with reference to the various treatments. • comparisons of different treatments • usefulness (effectiveness) of different treatments • reductionist nature of the treatments • deterministic nature of the treatments • appropriateness of treatments (e.g. if there are side effects). • cost of treatments • ethics of treatments Mark according to the levels of response descriptors in Table B. Other appropriate responses should also be credited. Psychology and consumer behaviour
Q3 · Explain what is meant by a ‘partially compensatory’ strategy in consumer decision-making
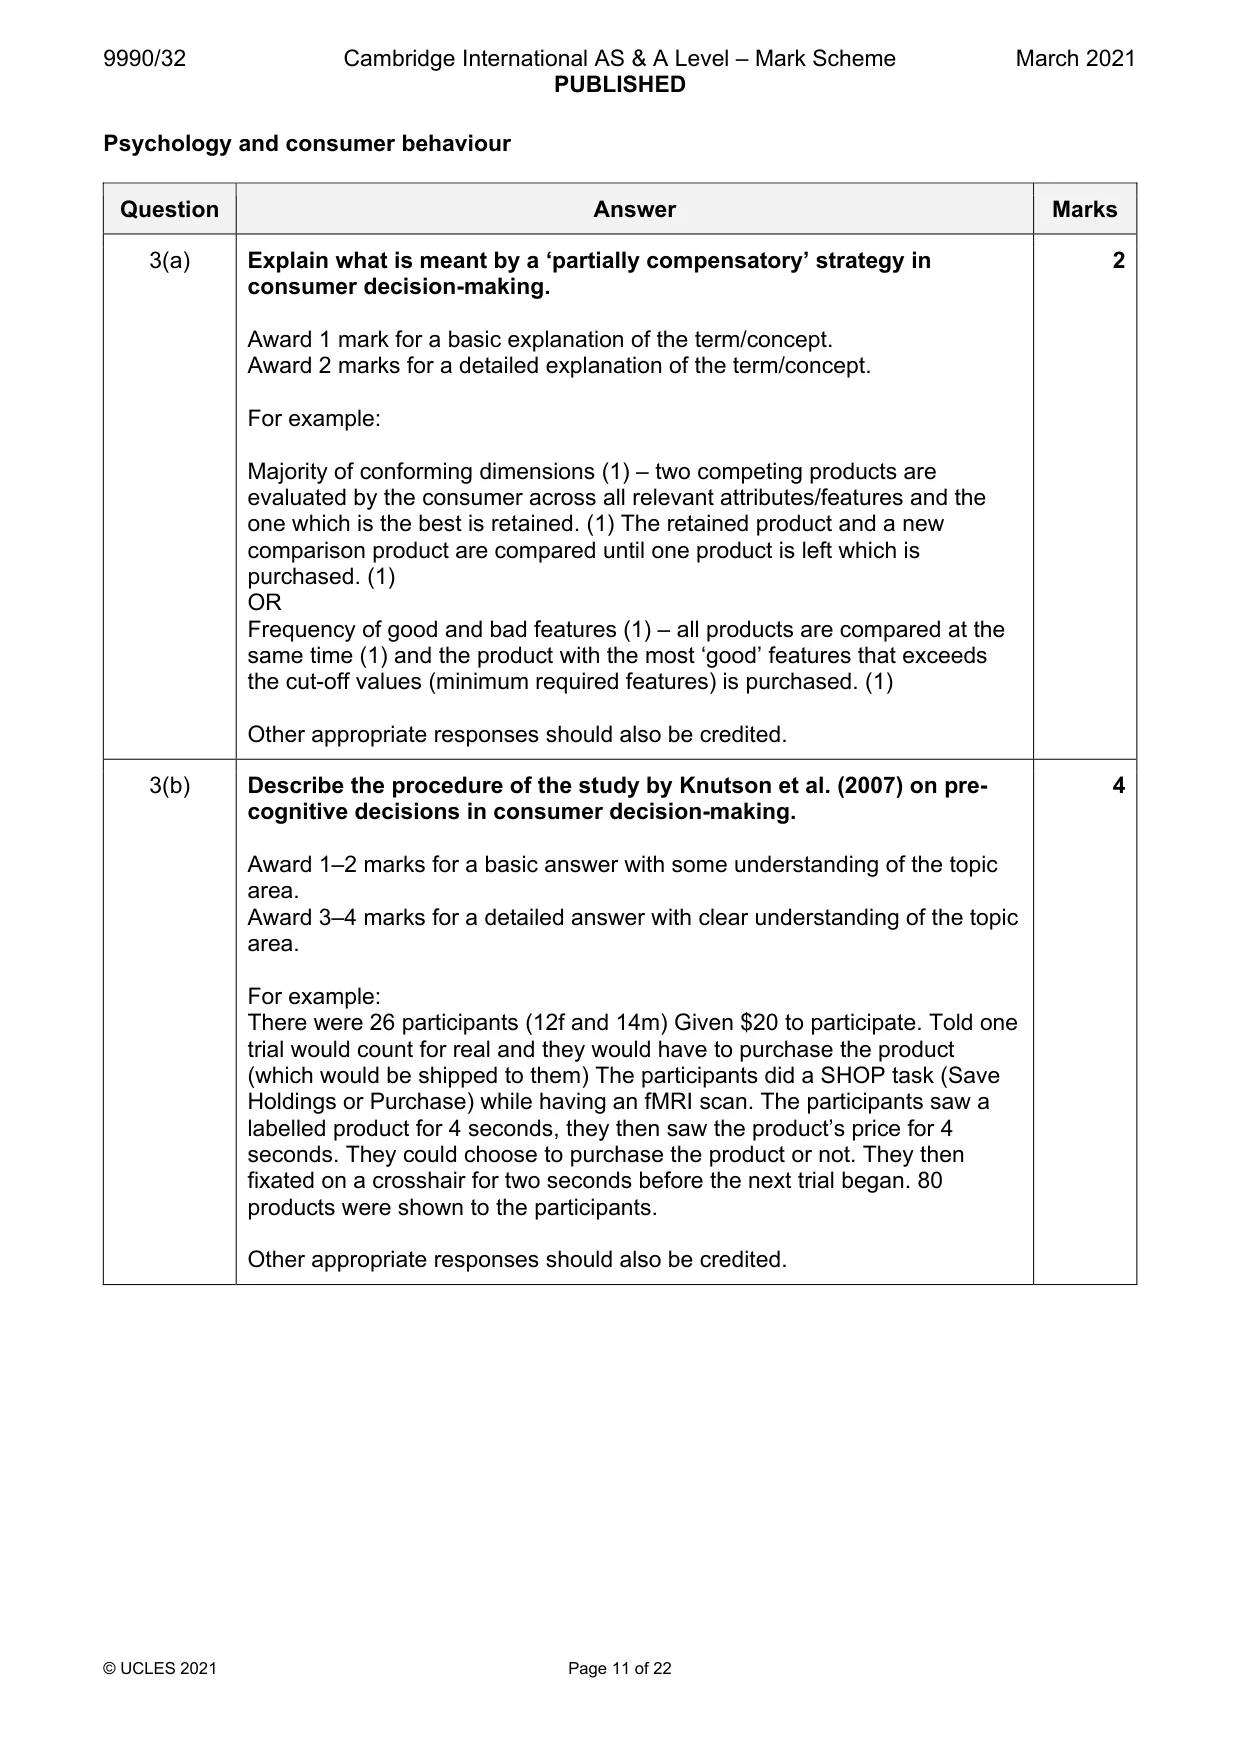
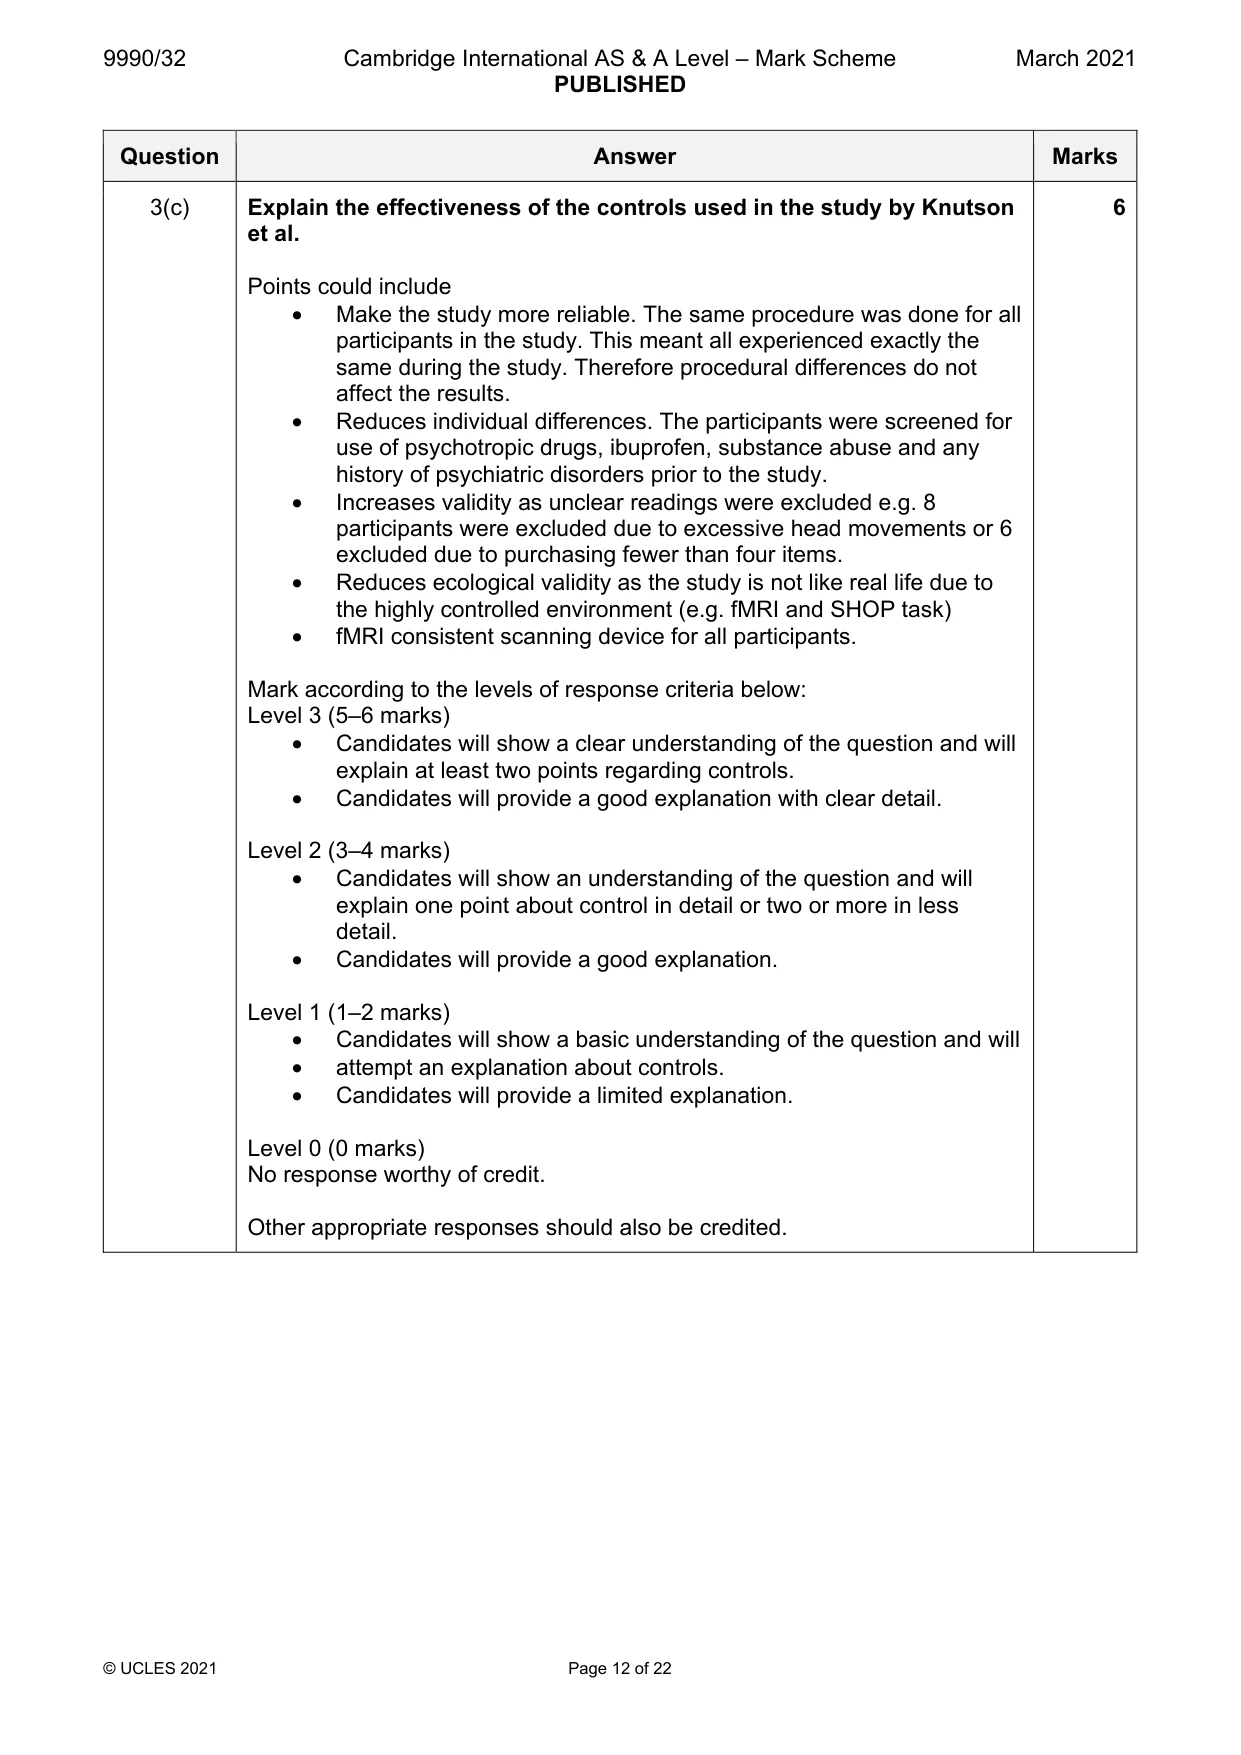
3 (a) Explain what is meant by a ‘partially compensatory’ strategy in consumer decision-making. [2] (b) Describe the procedure of the study by Knutson et al. (2007) on pre-cognitive decisions in consumer decision-making. [4] (c) Explain the effectiveness of the controls used in the study by Knutson et al. [6]
Mark scheme: 3(a) Explain what is meant by a ‘partially compensatory’ strategy in 2 consumer decision-making. Award 1 mark for a basic explanation of the term/concept. Award 2 marks for a detailed explanation of the term/concept. For example: Majority of conforming dimensions (1) – two competing products are evaluated by the consumer across all relevant attributes/features and the one which is the best is retained. (1) The retained product and a new comparison product are compared until one product is left which is purchased. (1) OR Frequency of good and bad features (1) – all products are compared at the same time (1) and the product with the most ‘good’ features that exceeds the cut-off values (minimum required features) is purchased. (1) Other appropriate responses should also be credited. 3(b) Describe the procedure of the study by Knutson et al. (2007) on pre- 4 cognitive decisions in consumer decision-making. Award 1–2 marks for a basic answer with some understanding of the topic area. Award 3–4 marks for a detailed answer with clear understanding of the topic area. For example: There were 26 participants (12f and 14m) Given $20 to participate. Told one trial would count for real and they would have to purchase the product (which would be shipped to them) The participants did a SHOP task (Save Holdings or Purchase) while having an fMRI scan. The participants saw a labelled product for 4 seconds, they then saw the product’s price for 4 seconds. They could choose to purchase the product or not. They then fixated on a crosshair for two seconds before the next trial began. 80 products were shown to the participants. Other appropriate responses should also be credited. 3(c) Explain the effectiveness of the controls used in the study by Knutson 6 et al. Points could include • Make the study more reliable. The same procedure was done for all participants in the study. This meant all experienced exactly the same during the study. Therefore procedural differences do not affect the results. • Reduces individual differences. The participants were screened for use of psychotropic drugs, ibuprofen, substance abuse and any history of psychiatric disorders prior to the study. • Increases validity as unclear readings were excluded e.g. 8 participants were excluded due to excessive head movements or 6 excluded due to purchasing fewer than four items. • Reduces ecological validity as the study is not like real life due to the highly controlled environment (e.g. fMRI and SHOP task) • fMRI consistent scanning device for all participants. Mark according to the levels of response criteria below: Level 3 (5–6 marks) • Candidates will show a clear understanding of the question and will explain at least two points regarding controls. • Candidates will provide a good explanation with clear detail. Level 2 (3–4 marks) • Candidates will show an understanding of the question and will explain one point about control in detail or two or more in less detail. • Candidates will provide a good explanation. Level 1 (1–2 marks) • Candidates will show a basic understanding of the question and will • attempt an explanation about controls. • Candidates will provide a limited explanation. Level 0 (0 marks) No response worthy of credit. Other appropriate responses should also be credited.
Q4 · Describe what psychologists have discovered about personal space and consumer behaviour
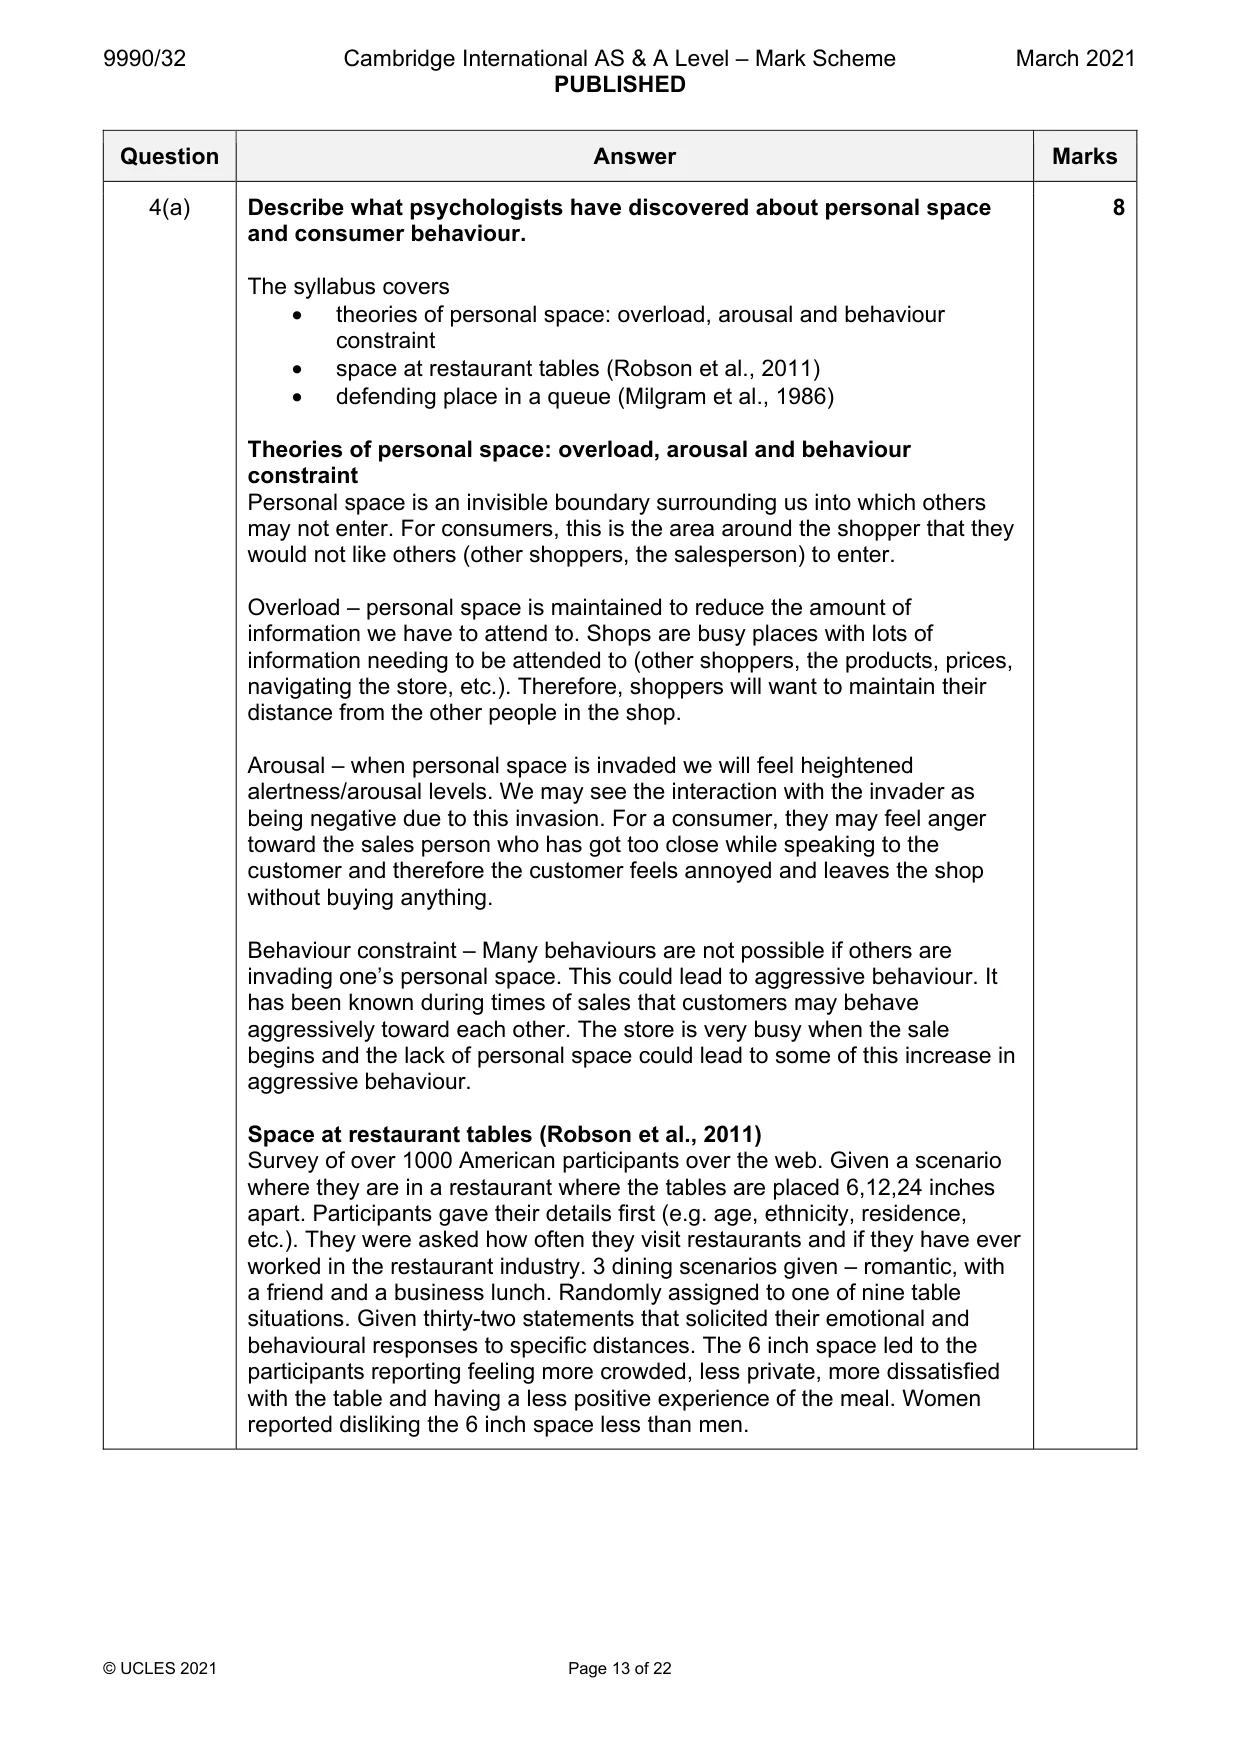
4 (a) Describe what psychologists have discovered about personal space and consumer behaviour. [8] (b) Evaluate what psychologists have discovered about personal space and consumer behaviour, including a discussion about generalisability. [10] Psychology and health Answer all questions.
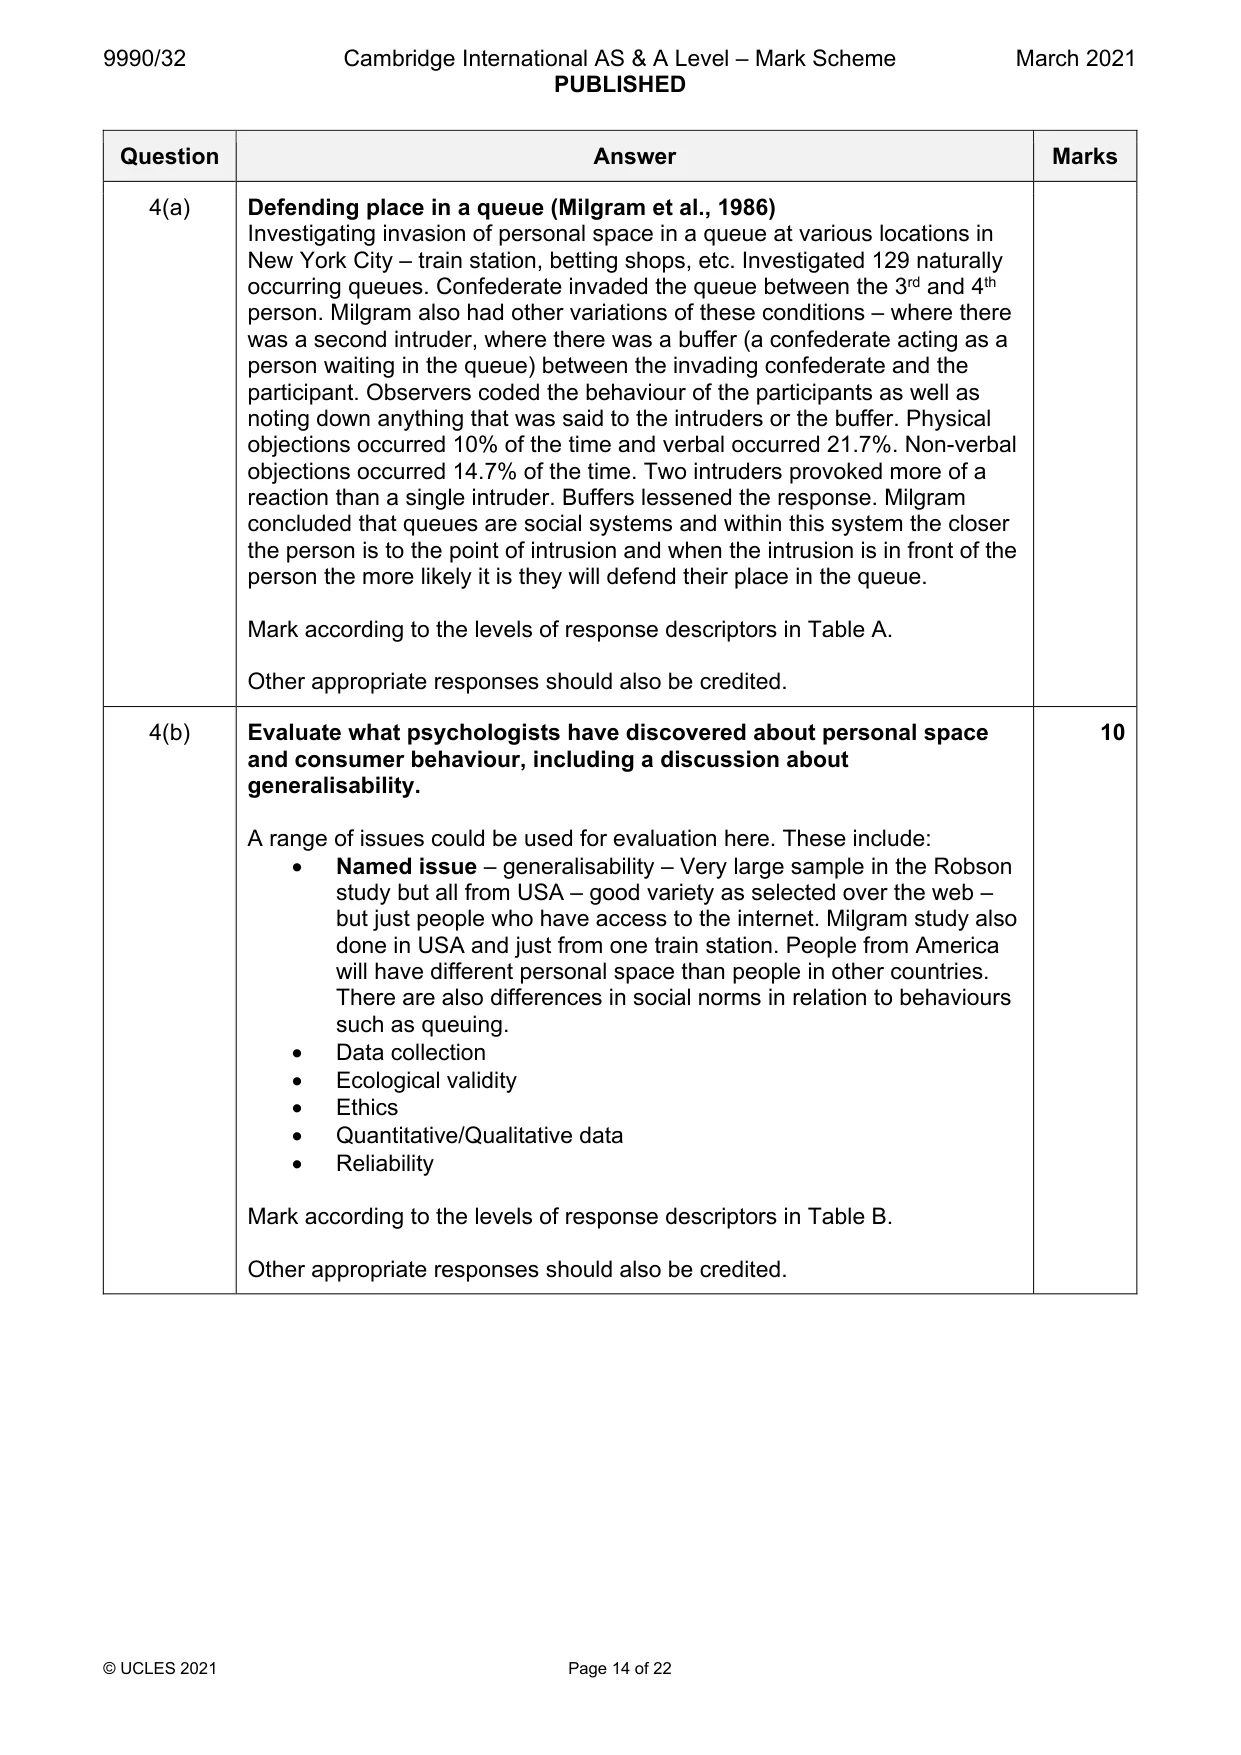
Mark scheme: 4(a) Describe what psychologists have discovered about personal space 8 and consumer behaviour. The syllabus covers • theories of personal space: overload, arousal and behaviour constraint • space at restaurant tables (Robson et al., 2011) • defending place in a queue (Milgram et al., 1986) Theories of personal space: overload, arousal and behaviour constraint Personal space is an invisible boundary surrounding us into which others may not enter. For consumers, this is the area around the shopper that they would not like others (other shoppers, the salesperson) to enter. Overload – personal space is maintained to reduce the amount of information we have to attend to. Shops are busy places with lots of information needing to be attended to (other shoppers, the products, prices, navigating the store, etc.). Therefore, shoppers will want to maintain their distance from the other people in the shop. Arousal – when personal space is invaded we will feel heightened alertness/arousal levels. We may see the interaction with the invader as being negative due to this invasion. For a consumer, they may feel anger toward the sales person who has got too close while speaking to the customer and therefore the customer feels annoyed and leaves the shop without buying anything. Behaviour constraint – Many behaviours are not possible if others are invading one’s personal space. This could lead to aggressive behaviour. It has been known during times of sales that customers may behave aggressively toward each other. The store is very busy when the sale begins and the lack of personal space could lead to some of this increase in aggressive behaviour. Space at restaurant tables (Robson et al., 2011) Survey of over 1000 American participants over the web. Given a scenario where they are in a restaurant where the tables are placed 6,12,24 inches apart. Participants gave their details first (e.g. age, ethnicity, residence, etc.). They were asked how often they visit restaurants and if they have ever worked in the restaurant industry. 3 dining scenarios given – romantic, with a friend and a business lunch. Randomly assigned to one of nine table situations. Given thirty-two statements that solicited their emotional and behavioural responses to specific distances. The 6 inch space led to the participants reporting feeling more crowded, less private, more dissatisfied with the table and having a less positive experience of the meal. Women reported disliking the 6 inch space less than men. 4(a) Defending place in a queue (Milgram et al., 1986) Investigating invasion of personal space in a queue at various locations in New York City – train station, betting shops, etc. Investigated 129 naturally occurring queues. Confederate invaded the queue between the 3rd and 4th person. Milgram also had other variations of these conditions – where there was a second intruder, where there was a buffer (a confederate acting as a person waiting in the queue) between the invading confederate and the participant. Observers coded the behaviour of the participants as well as noting down anything that was said to the intruders or the buffer. Physical objections occurred 10% of the time and verbal occurred 21.7%. Non-verbal objections occurred 14.7% of the time. Two intruders provoked more of a reaction than a single intruder. Buffers lessened the response. Milgram concluded that queues are social systems and within this system the closer the person is to the point of intrusion and when the intrusion is in front of the person the more likely it is they will defend their place in the queue. Mark according to the levels of response descriptors in Table A. Other appropriate responses should also be credited. 4(b) Evaluate what psychologists have discovered about personal space 10 and consumer behaviour, including a discussion about generalisability. A range of issues could be used for evaluation here. These include: • Named issue – generalisability – Very large sample in the Robson study but all from USA – good variety as selected over the web – but just people who have access to the internet. Milgram study also done in USA and just from one train station. People from America will have different personal space than people in other countries. There are also differences in social norms in relation to behaviours such as queuing. • Data collection • Ecological validity • Ethics • Quantitative/Qualitative data • Reliability Mark according to the levels of response descriptors in Table B. Other appropriate responses should also be credited.
Q5 · Explain what is meant by ‘hypochondriasis’
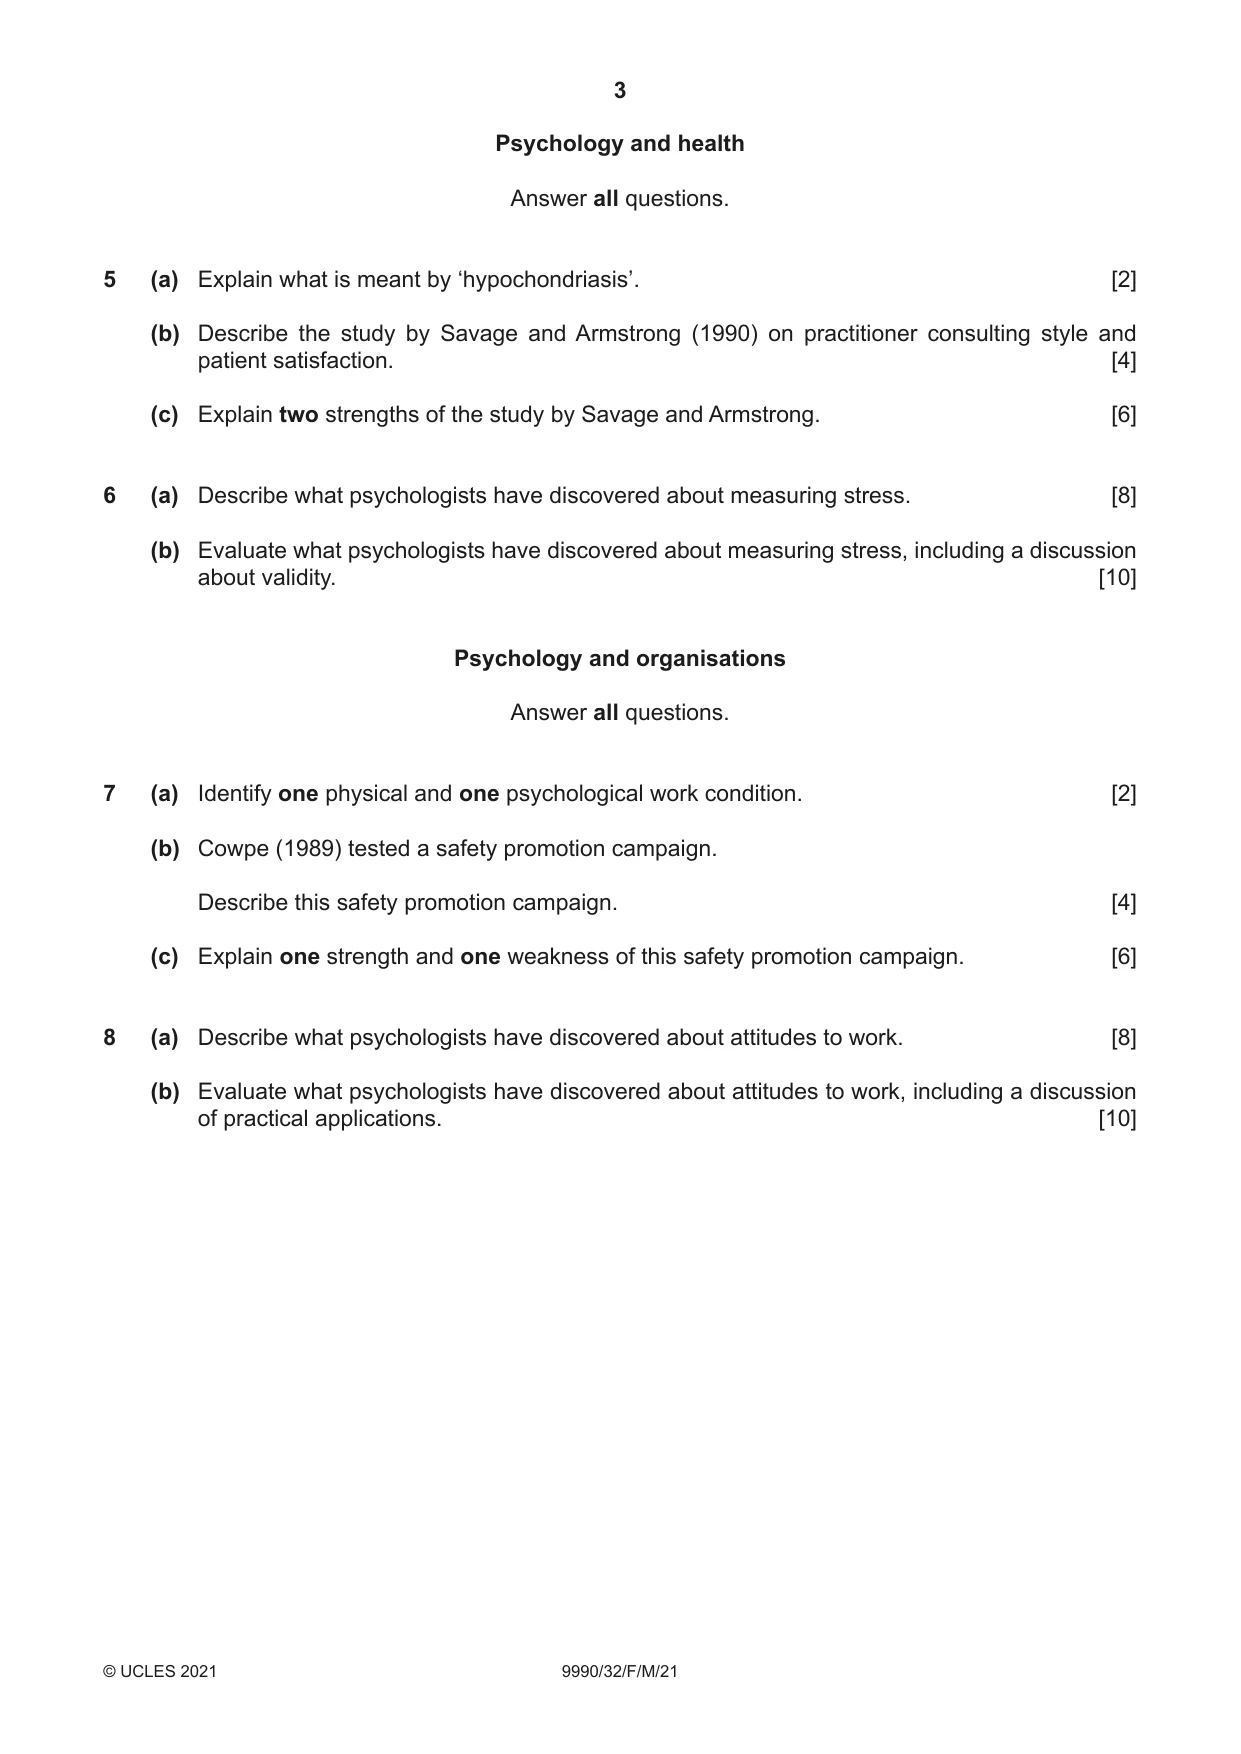
5 (a) Explain what is meant by ‘hypochondriasis’. [2] (b) Describe the study by Savage and Armstrong (1990) on practitioner consulting style and patient satisfaction. [4] (c) Explain two strengths of the study by Savage and Armstrong. [6]
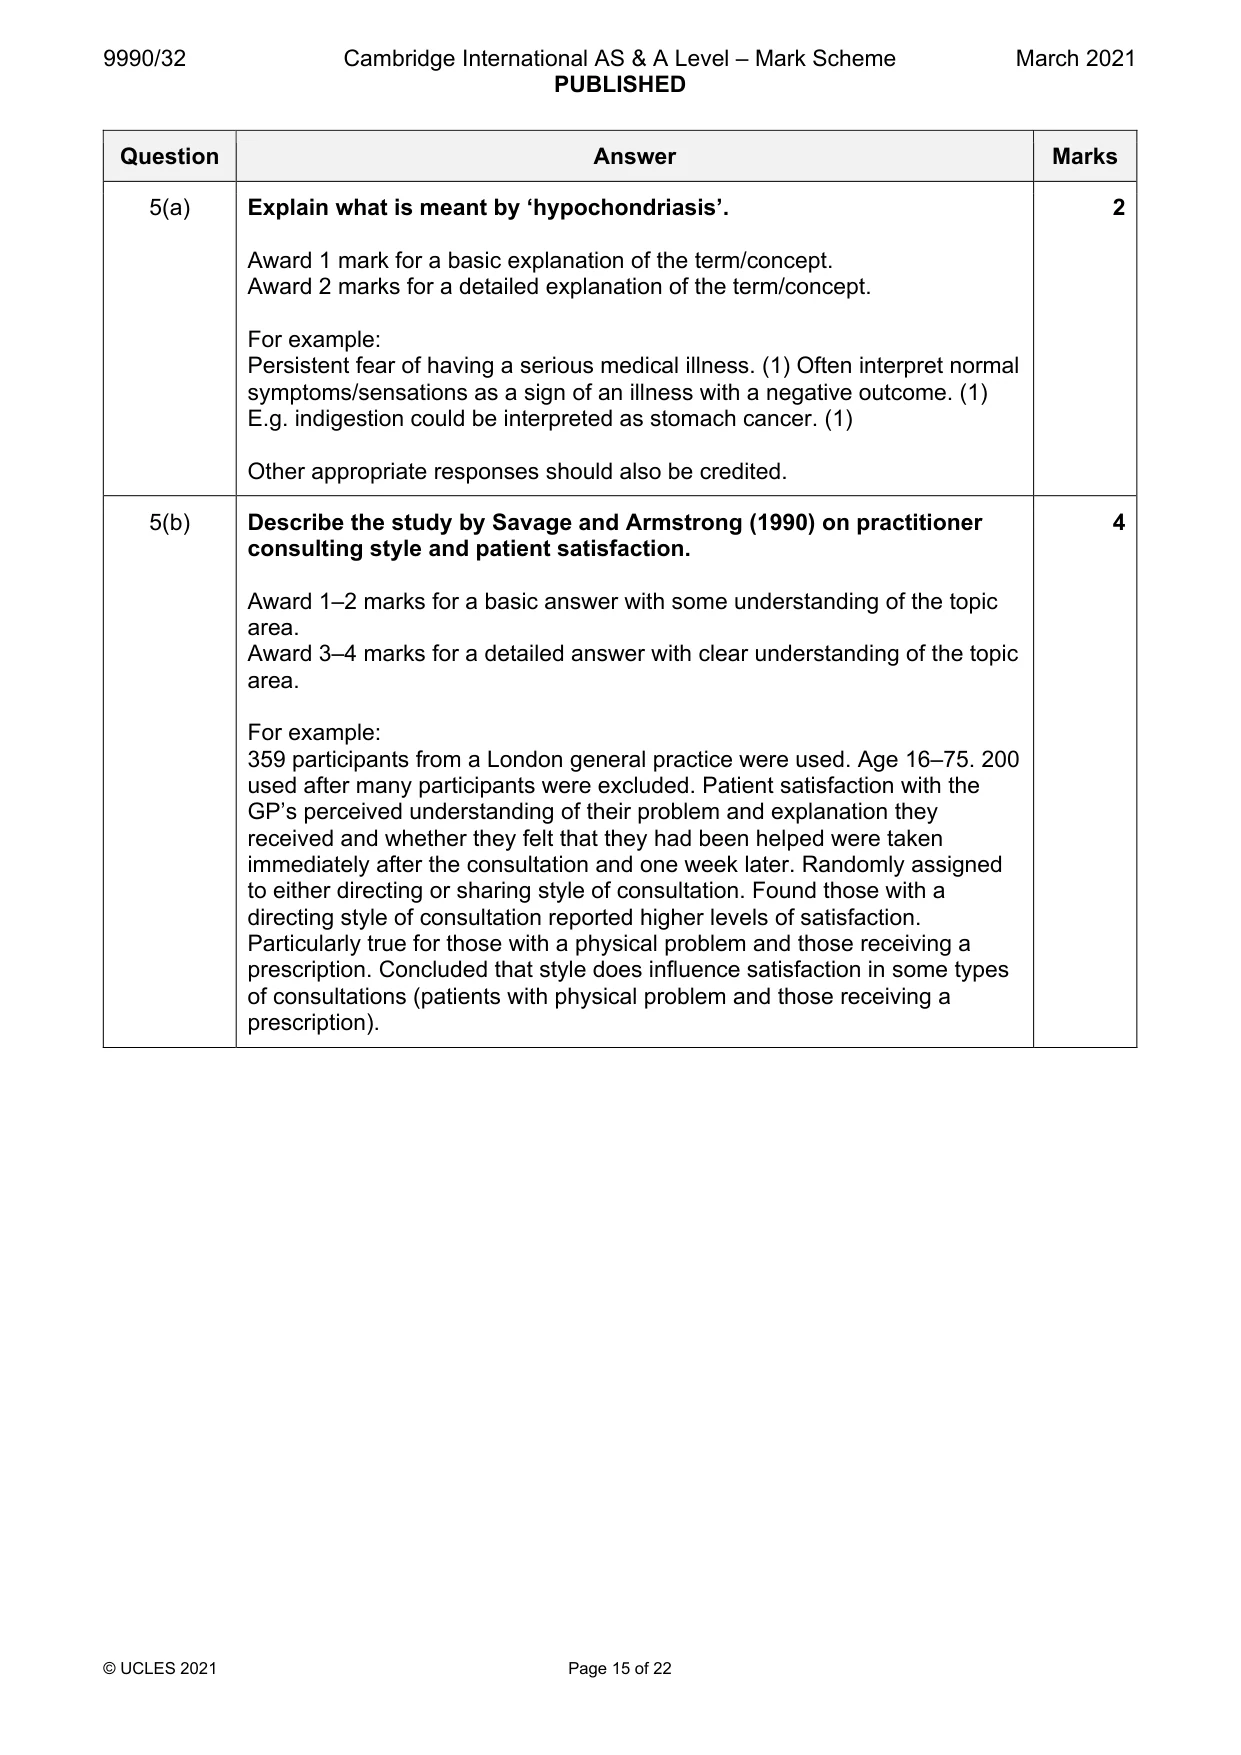
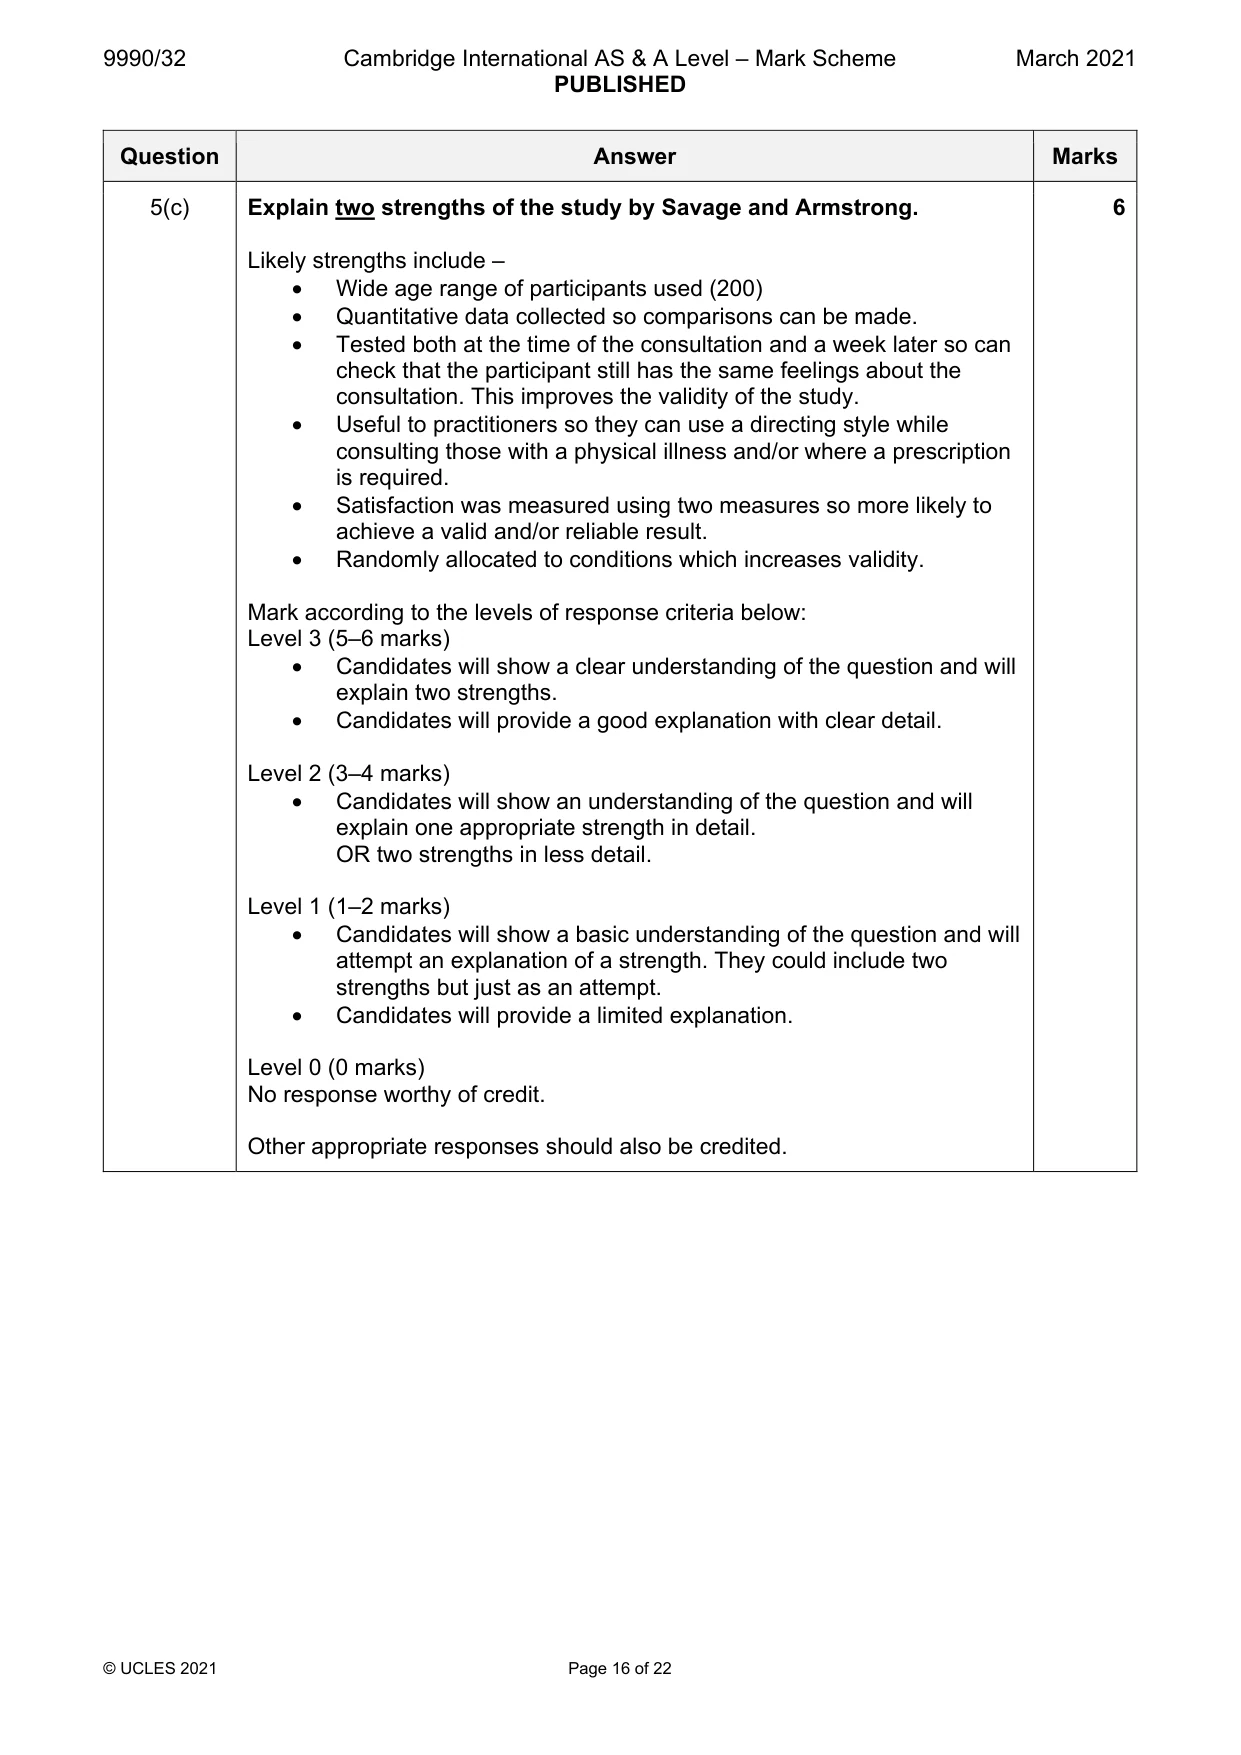
Mark scheme: 5(a) Explain what is meant by ‘hypochondriasis’. 2 Award 1 mark for a basic explanation of the term/concept. Award 2 marks for a detailed explanation of the term/concept. For example: Persistent fear of having a serious medical illness. (1) Often interpret normal symptoms/sensations as a sign of an illness with a negative outcome. (1) E.g. indigestion could be interpreted as stomach cancer. (1) Other appropriate responses should also be credited. 5(b) Describe the study by Savage and Armstrong (1990) on practitioner 4 consulting style and patient satisfaction. Award 1–2 marks for a basic answer with some understanding of the topic area. Award 3–4 marks for a detailed answer with clear understanding of the topic area. For example: 359 participants from a London general practice were used. Age 16–75. 200 used after many participants were excluded. Patient satisfaction with the GP’s perceived understanding of their problem and explanation they received and whether they felt that they had been helped were taken immediately after the consultation and one week later. Randomly assigned to either directing or sharing style of consultation. Found those with a directing style of consultation reported higher levels of satisfaction. Particularly true for those with a physical problem and those receiving a prescription. Concluded that style does influence satisfaction in some types of consultations (patients with physical problem and those receiving a prescription). 5(c) Explain two strengths of the study by Savage and Armstrong. 6 Likely strengths include – • Wide age range of participants used (200) • Quantitative data collected so comparisons can be made. • Tested both at the time of the consultation and a week later so can check that the participant still has the same feelings about the consultation. This improves the validity of the study. • Useful to practitioners so they can use a directing style while consulting those with a physical illness and/or where a prescription is required. • Satisfaction was measured using two measures so more likely to achieve a valid and/or reliable result. • Randomly allocated to conditions which increases validity. Mark according to the levels of response criteria below: Level 3 (5–6 marks) • Candidates will show a clear understanding of the question and will explain two strengths. • Candidates will provide a good explanation with clear detail. Level 2 (3–4 marks) • Candidates will show an understanding of the question and will explain one appropriate strength in detail. OR two strengths in less detail. Level 1 (1–2 marks) • Candidates will show a basic understanding of the question and will attempt an explanation of a strength. They could include two strengths but just as an attempt. • Candidates will provide a limited explanation. Level 0 (0 marks) No response worthy of credit. Other appropriate responses should also be credited.
Q6 · Describe what psychologists have discovered about measuring stress
6 (a) Describe what psychologists have discovered about measuring stress. [8] (b) Evaluate what psychologists have discovered about measuring stress, including a discussion about validity. [10] Psychology and organisations Answer all questions.
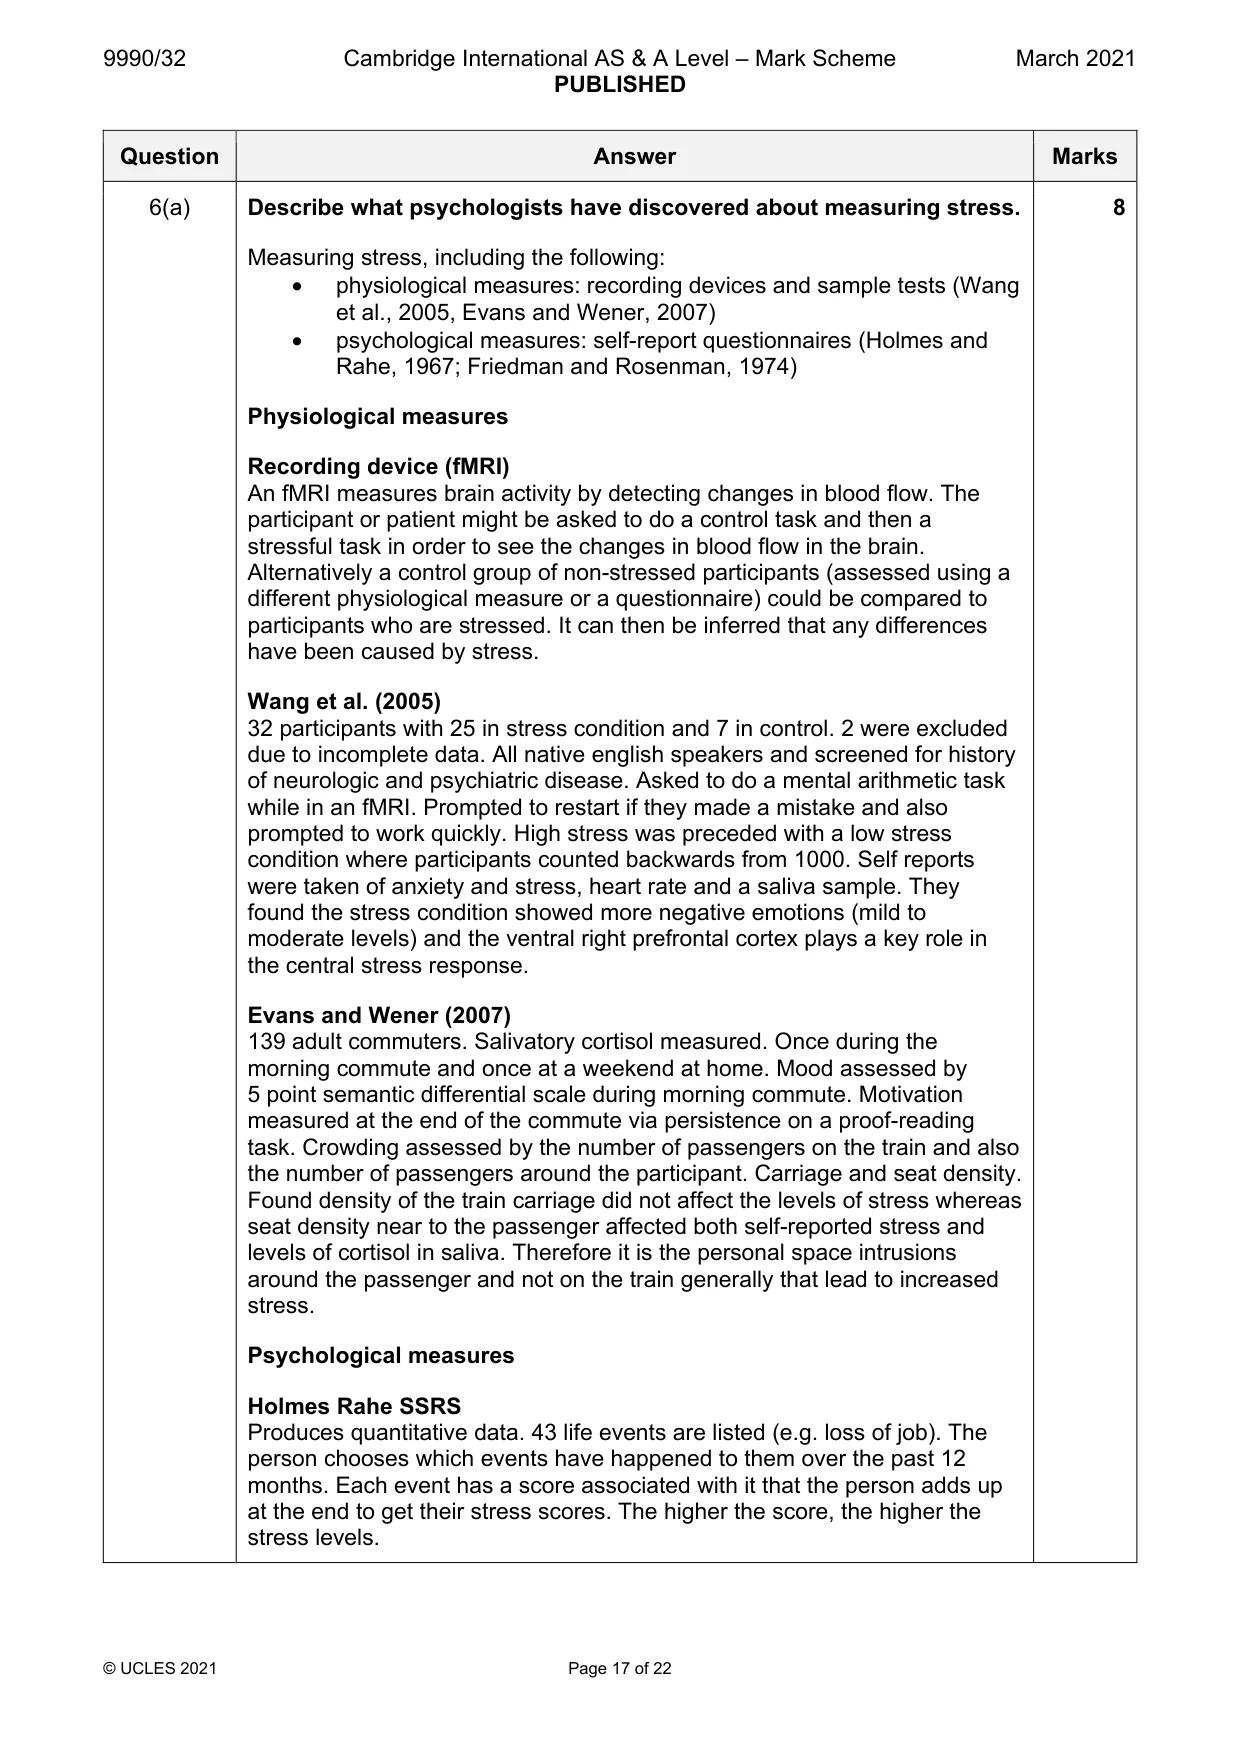
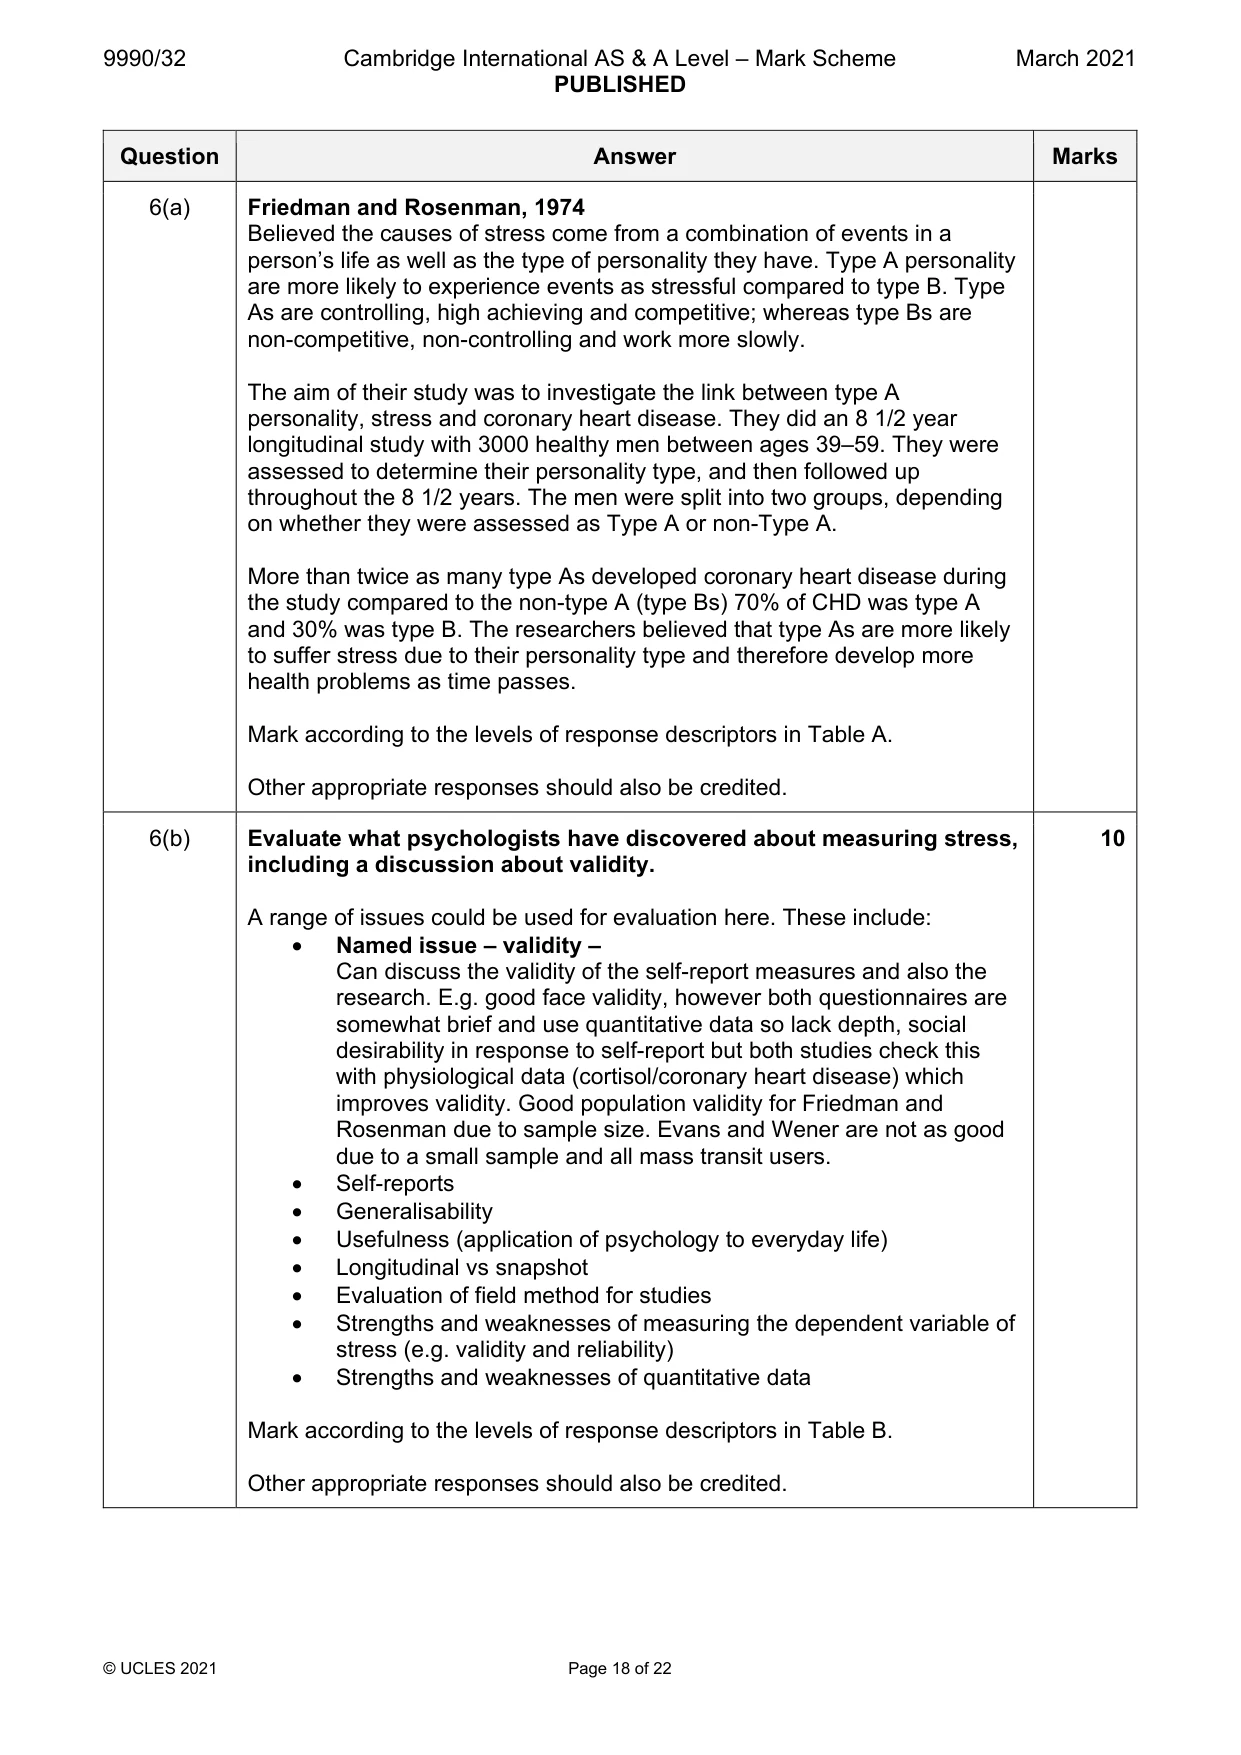
Mark scheme: 6(a) Describe what psychologists have discovered about measuring stress. 8 Measuring stress, including the following: • physiological measures: recording devices and sample tests (Wang et al., 2005, Evans and Wener, 2007) • psychological measures: self-report questionnaires (Holmes and Rahe, 1967; Friedman and Rosenman, 1974) Physiological measures Recording device (fMRI) An fMRI measures brain activity by detecting changes in blood flow. The participant or patient might be asked to do a control task and then a stressful task in order to see the changes in blood flow in the brain. Alternatively a control group of non-stressed participants (assessed using a different physiological measure or a questionnaire) could be compared to participants who are stressed. It can then be inferred that any differences have been caused by stress. Wang et al. (2005) 32 participants with 25 in stress condition and 7 in control. 2 were excluded due to incomplete data. All native english speakers and screened for history of neurologic and psychiatric disease. Asked to do a mental arithmetic task while in an fMRI. Prompted to restart if they made a mistake and also prompted to work quickly. High stress was preceded with a low stress condition where participants counted backwards from 1000. Self reports were taken of anxiety and stress, heart rate and a saliva sample. They found the stress condition showed more negative emotions (mild to moderate levels) and the ventral right prefrontal cortex plays a key role in the central stress response. Evans and Wener (2007) 139 adult commuters. Salivatory cortisol measured. Once during the morning commute and once at a weekend at home. Mood assessed by 5 point semantic differential scale during morning commute. Motivation measured at the end of the commute via persistence on a proof-reading task. Crowding assessed by the number of passengers on the train and also the number of passengers around the participant. Carriage and seat density. Found density of the train carriage did not affect the levels of stress whereas seat density near to the passenger affected both self-reported stress and levels of cortisol in saliva. Therefore it is the personal space intrusions around the passenger and not on the train generally that lead to increased stress. Psychological measures Holmes Rahe SSRS Produces quantitative data. 43 life events are listed (e.g. loss of job). The person chooses which events have happened to them over the past 12 months. Each event has a score associated with it that the person adds up at the end to get their stress scores. The higher the score, the higher the stress levels. 6(a) Friedman and Rosenman, 1974 Believed the causes of stress come from a combination of events in a person’s life as well as the type of personality they have. Type A personality are more likely to experience events as stressful compared to type B. Type As are controlling, high achieving and competitive; whereas type Bs are non-competitive, non-controlling and work more slowly. The aim of their study was to investigate the link between type A personality, stress and coronary heart disease. They did an 8 1/2 year longitudinal study with 3000 healthy men between ages 39–59. They were assessed to determine their personality type, and then followed up throughout the 8 1/2 years. The men were split into two groups, depending on whether they were assessed as Type A or non-Type A. More than twice as many type As developed coronary heart disease during the study compared to the non-type A (type Bs) 70% of CHD was type A and 30% was type B. The researchers believed that type As are more likely to suffer stress due to their personality type and therefore develop more health problems as time passes. Mark according to the levels of response descriptors in Table A. Other appropriate responses should also be credited. 6(b) Evaluate what psychologists have discovered about measuring stress, 10 including a discussion about validity. A range of issues could be used for evaluation here. These include: • Named issue – validity – Can discuss the validity of the self-report measures and also the research. E.g. good face validity, however both questionnaires are somewhat brief and use quantitative data so lack depth, social desirability in response to self-report but both studies check this with physiological data (cortisol/coronary heart disease) which improves validity. Good population validity for Friedman and Rosenman due to sample size. Evans and Wener are not as good due to a small sample and all mass transit users. • Self-reports • Generalisability • Usefulness (application of psychology to everyday life) • Longitudinal vs snapshot • Evaluation of field method for studies • Strengths and weaknesses of measuring the dependent variable of stress (e.g. validity and reliability) • Strengths and weaknesses of quantitative data Mark according to the levels of response descriptors in Table B. Other appropriate responses should also be credited. Psychology and organisations
Q7 · Identify one physical and one psychological work condition
7 (a) Identify one physical and one psychological work condition. [2] (b) Cowpe (1989) tested a safety promotion campaign. Describe this safety promotion campaign. [4] (c) Explain one strength and one weakness of this safety promotion campaign. [6]
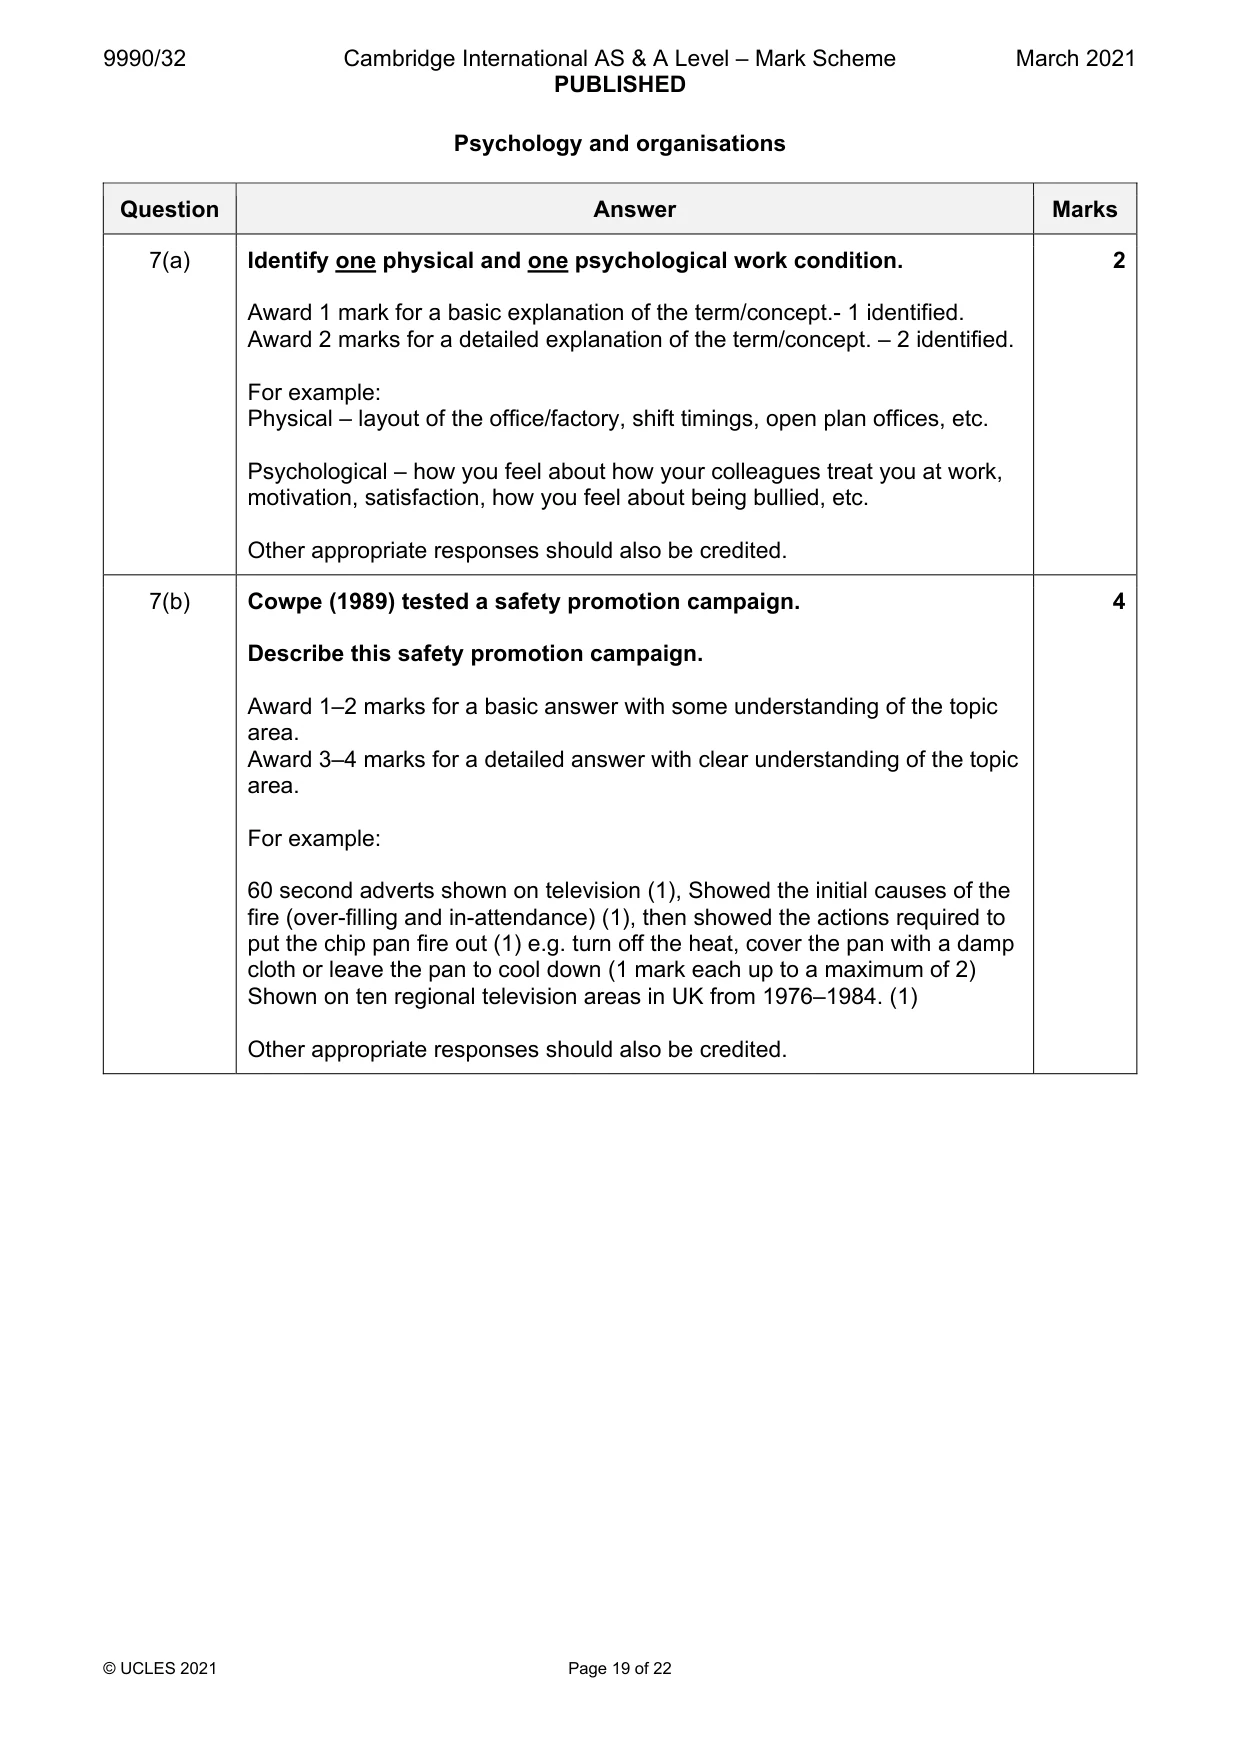
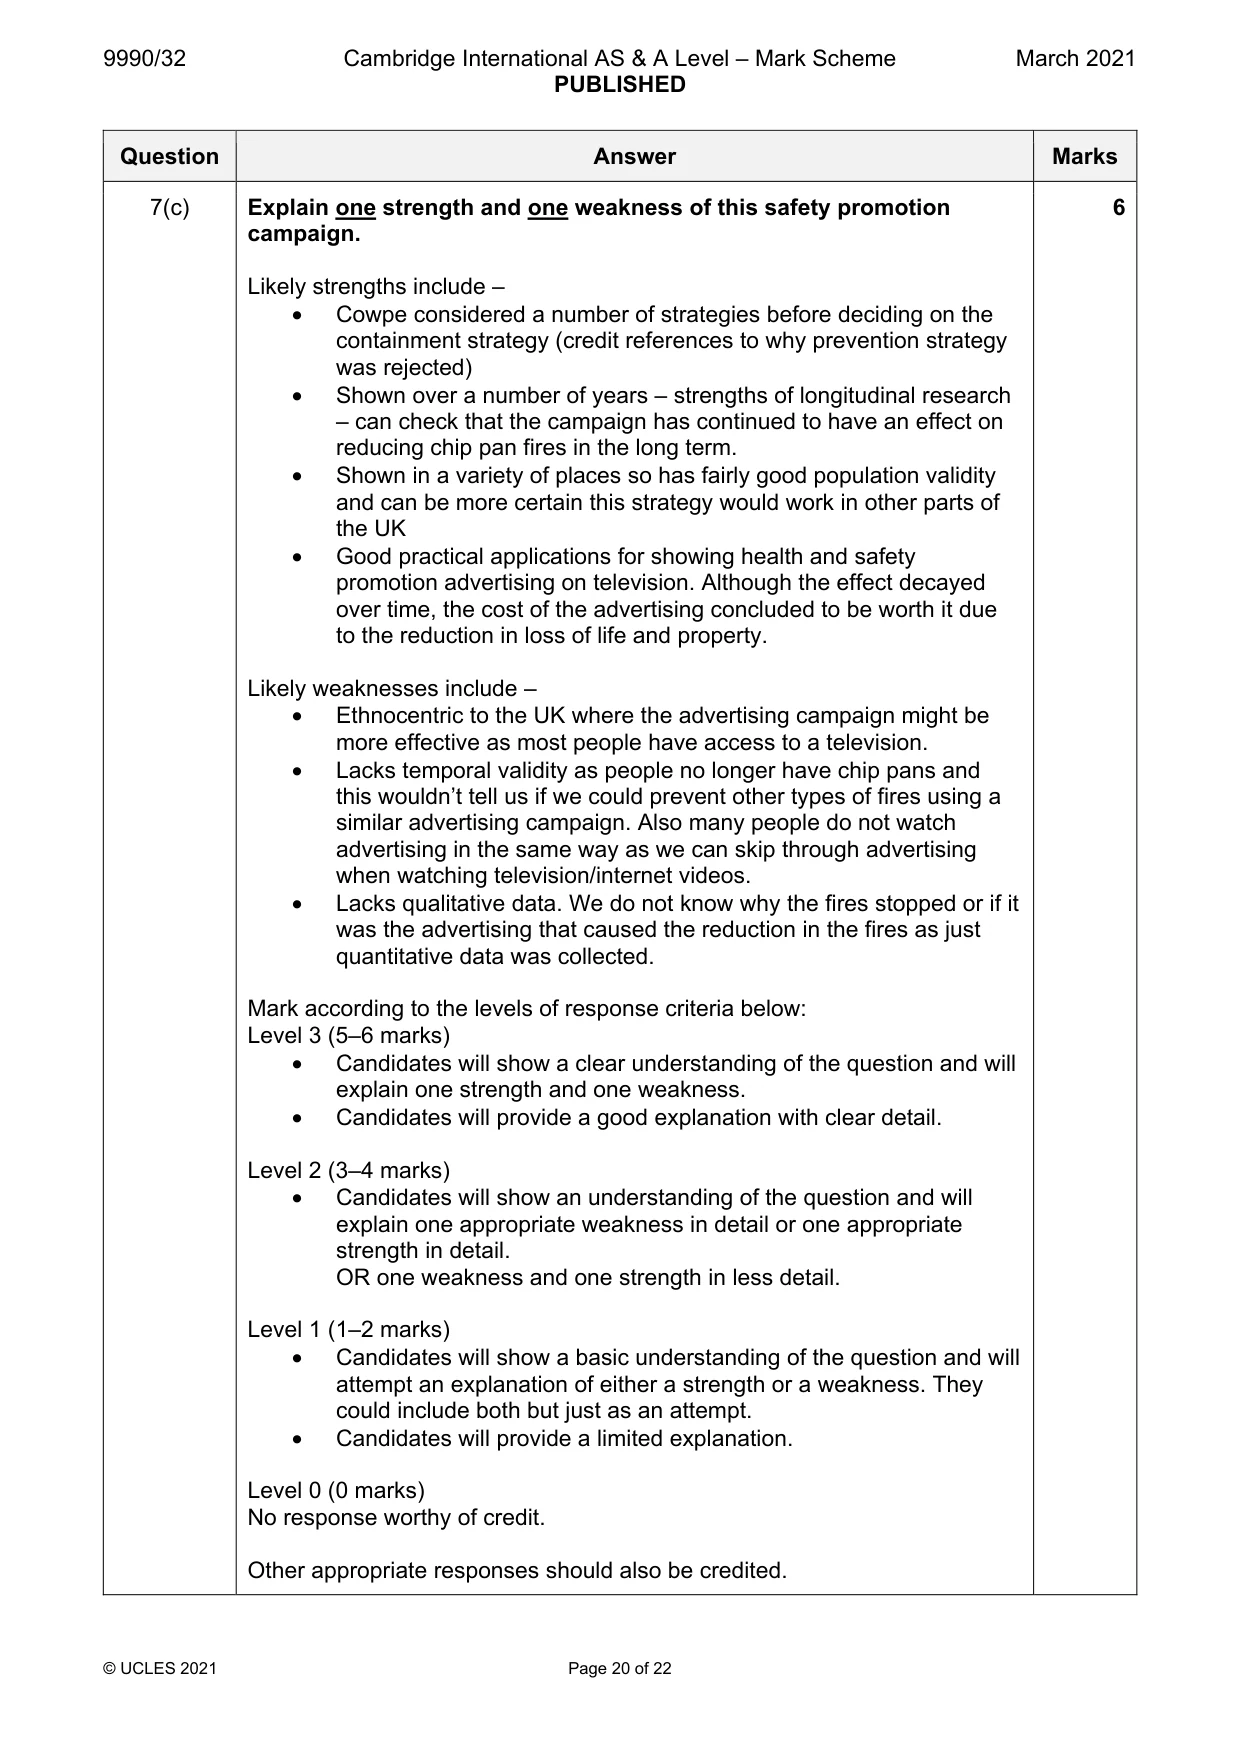
Mark scheme: 7(a) Identify one physical and one psychological work condition. 2 Award 1 mark for a basic explanation of the term/concept.- 1 identified. Award 2 marks for a detailed explanation of the term/concept. – 2 identified. For example: Physical – layout of the office/factory, shift timings, open plan offices, etc. Psychological – how you feel about how your colleagues treat you at work, motivation, satisfaction, how you feel about being bullied, etc. Other appropriate responses should also be credited. 7(b) Cowpe (1989) tested a safety promotion campaign. 4 Describe this safety promotion campaign. Award 1–2 marks for a basic answer with some understanding of the topic area. Award 3–4 marks for a detailed answer with clear understanding of the topic area. For example: 60 second adverts shown on television (1), Showed the initial causes of the fire (over-filling and in-attendance) (1), then showed the actions required to put the chip pan fire out (1) e.g. turn off the heat, cover the pan with a damp cloth or leave the pan to cool down (1 mark each up to a maximum of 2) Shown on ten regional television areas in UK from 1976–1984. (1) Other appropriate responses should also be credited. 7(c) Explain one strength and one weakness of this safety promotion 6 campaign. Likely strengths include – • Cowpe considered a number of strategies before deciding on the containment strategy (credit references to why prevention strategy was rejected) • Shown over a number of years – strengths of longitudinal research – can check that the campaign has continued to have an effect on reducing chip pan fires in the long term. • Shown in a variety of places so has fairly good population validity and can be more certain this strategy would work in other parts of the UK • Good practical applications for showing health and safety promotion advertising on television. Although the effect decayed over time, the cost of the advertising concluded to be worth it due to the reduction in loss of life and property. Likely weaknesses include – • Ethnocentric to the UK where the advertising campaign might be more effective as most people have access to a television. • Lacks temporal validity as people no longer have chip pans and this wouldn’t tell us if we could prevent other types of fires using a similar advertising campaign. Also many people do not watch advertising in the same way as we can skip through advertising when watching television/internet videos. • Lacks qualitative data. We do not know why the fires stopped or if it was the advertising that caused the reduction in the fires as just quantitative data was collected. Mark according to the levels of response criteria below: Level 3 (5–6 marks) • Candidates will show a clear understanding of the question and will explain one strength and one weakness. • Candidates will provide a good explanation with clear detail. Level 2 (3–4 marks) • Candidates will show an understanding of the question and will explain one appropriate weakness in detail or one appropriate strength in detail. OR one weakness and one strength in less detail. Level 1 (1–2 marks) • Candidates will show a basic understanding of the question and will attempt an explanation of either a strength or a weakness. They could include both but just as an attempt. • Candidates will provide a limited explanation. Level 0 (0 marks) No response worthy of credit. Other appropriate responses should also be credited.
More questions on 2 Health promotion in schools and worksites
Q8 · Describe what psychologists have discovered about attitudes to work
8 (a) Describe what psychologists have discovered about attitudes to work. [8] (b) Evaluate what psychologists have discovered about attitudes to work, including a discussion of practical applications. [10]
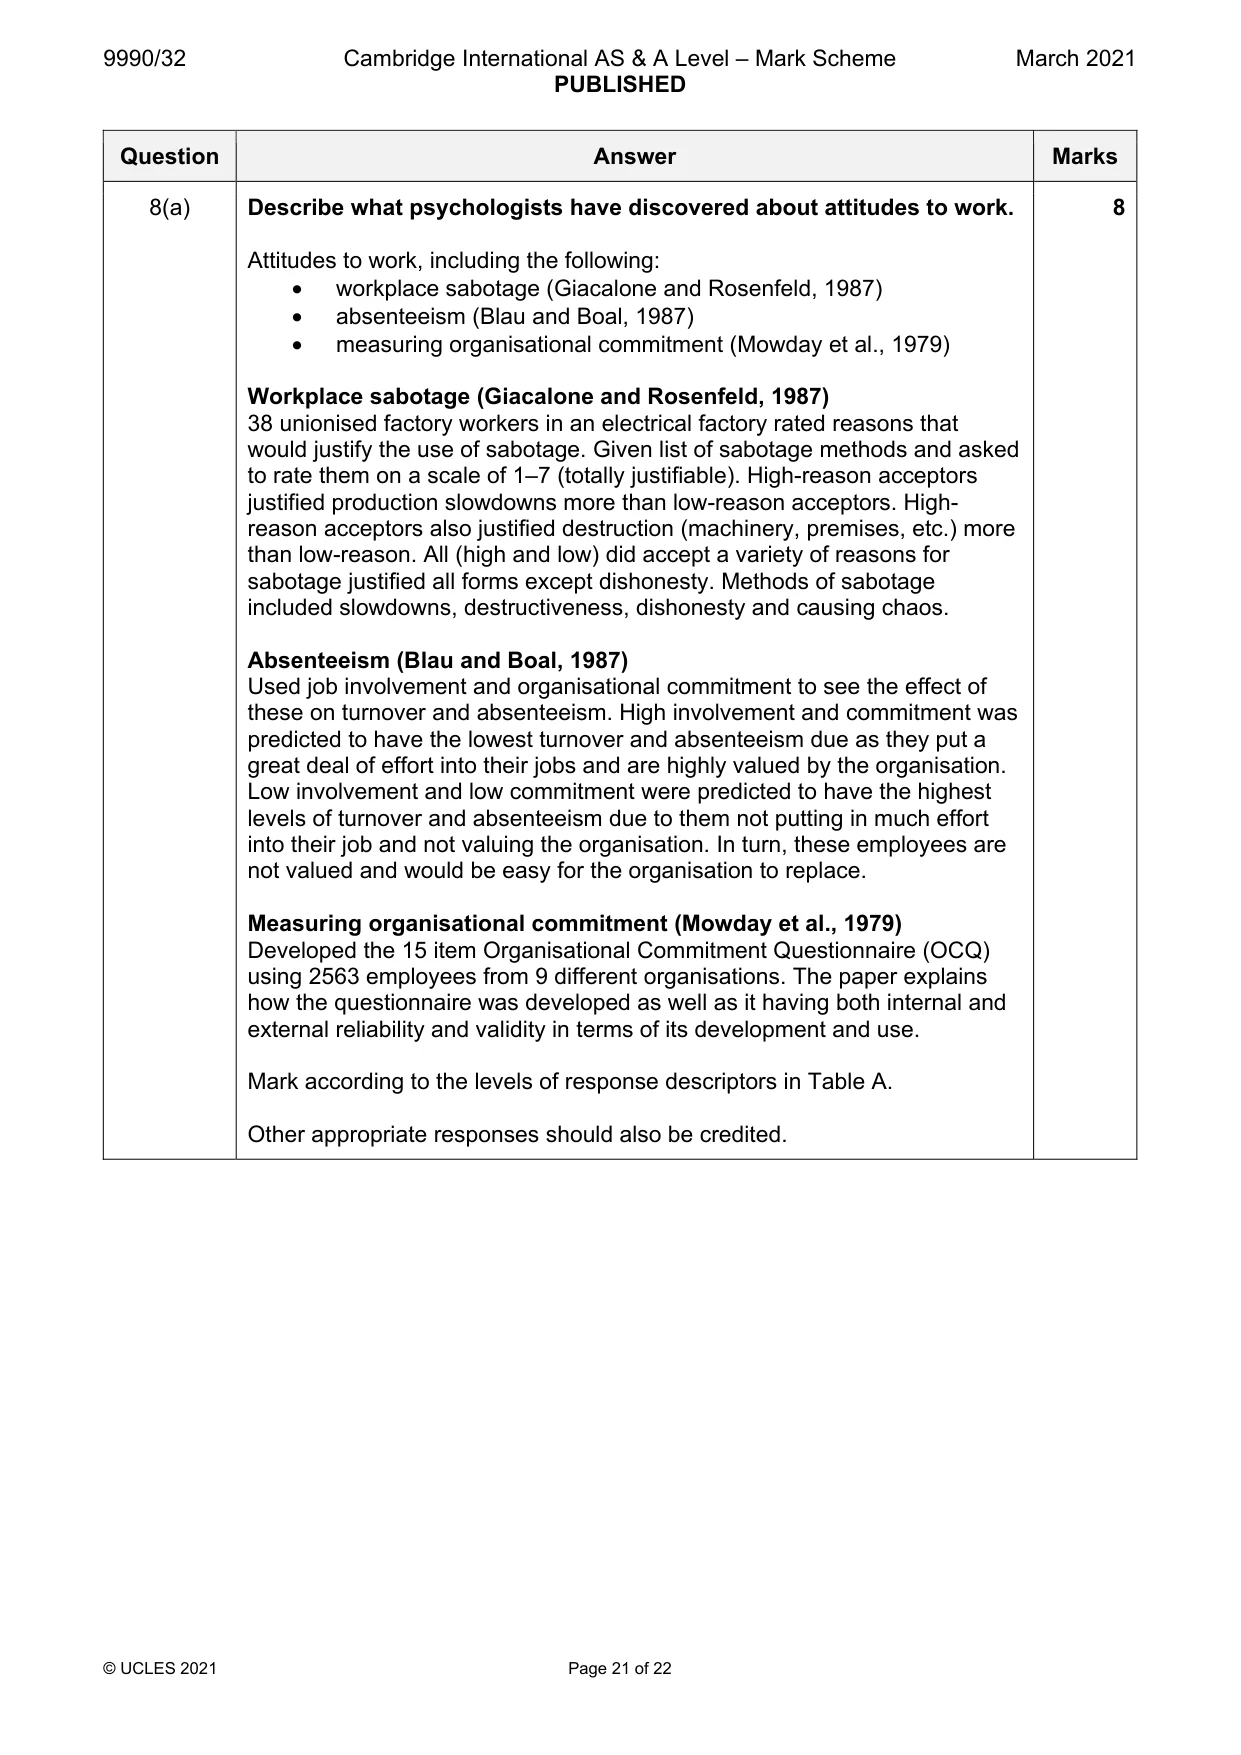
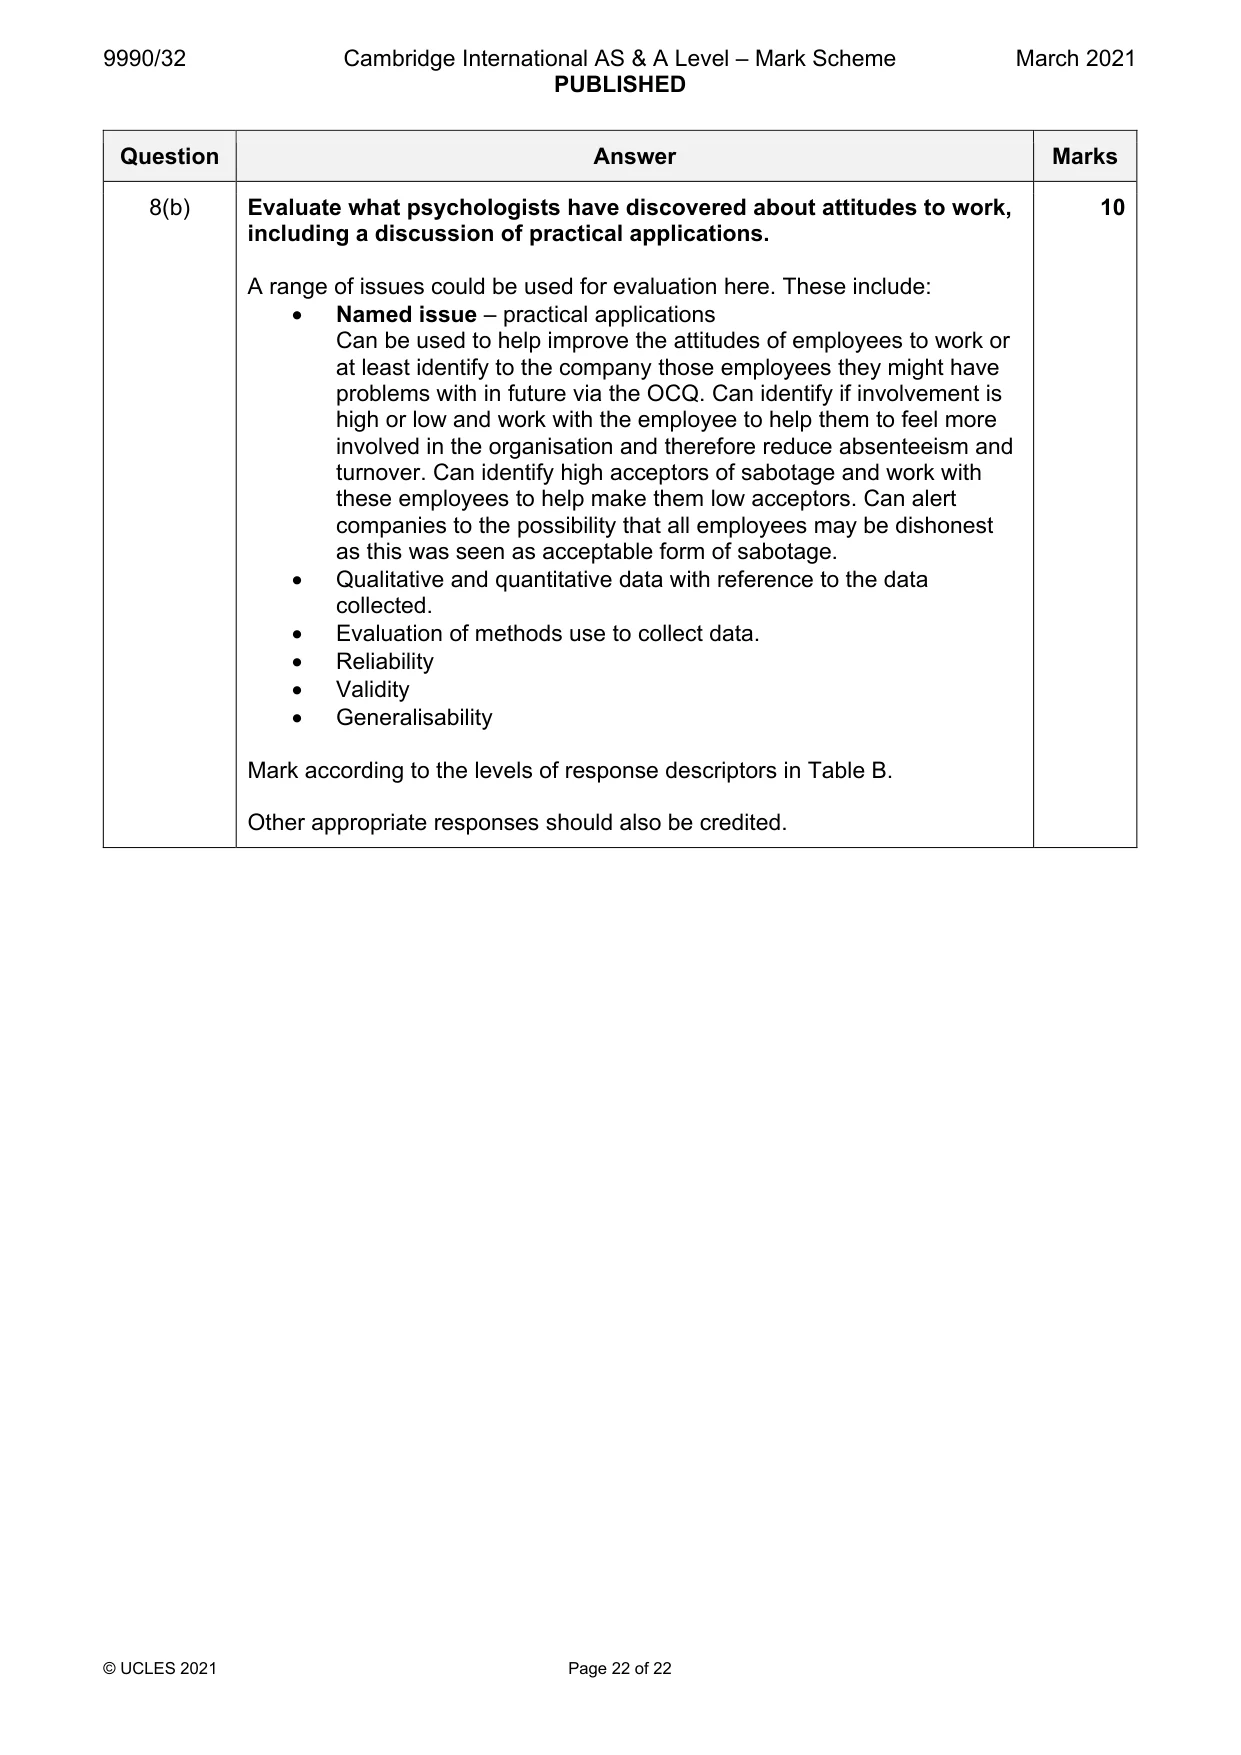
Mark scheme: 8(a) Describe what psychologists have discovered about attitudes to work. 8 Attitudes to work, including the following: • workplace sabotage (Giacalone and Rosenfeld, 1987) • absenteeism (Blau and Boal, 1987) • measuring organisational commitment (Mowday et al., 1979) Workplace sabotage (Giacalone and Rosenfeld, 1987) 38 unionised factory workers in an electrical factory rated reasons that would justify the use of sabotage. Given list of sabotage methods and asked to rate them on a scale of 1–7 (totally justifiable). High-reason acceptors justified production slowdowns more than low-reason acceptors. High- reason acceptors also justified destruction (machinery, premises, etc.) more than low-reason. All (high and low) did accept a variety of reasons for sabotage justified all forms except dishonesty. Methods of sabotage included slowdowns, destructiveness, dishonesty and causing chaos. Absenteeism (Blau and Boal, 1987) Used job involvement and organisational commitment to see the effect of these on turnover and absenteeism. High involvement and commitment was predicted to have the lowest turnover and absenteeism due as they put a great deal of effort into their jobs and are highly valued by the organisation. Low involvement and low commitment were predicted to have the highest levels of turnover and absenteeism due to them not putting in much effort into their job and not valuing the organisation. In turn, these employees are not valued and would be easy for the organisation to replace. Measuring organisational commitment (Mowday et al., 1979) Developed the 15 item Organisational Commitment Questionnaire (OCQ) using 2563 employees from 9 different organisations. The paper explains how the questionnaire was developed as well as it having both internal and external reliability and validity in terms of its development and use. Mark according to the levels of response descriptors in Table A. Other appropriate responses should also be credited. 8(b) Evaluate what psychologists have discovered about attitudes to work, 10 including a discussion of practical applications. A range of issues could be used for evaluation here. These include: • Named issue – practical applications Can be used to help improve the attitudes of employees to work or at least identify to the company those employees they might have problems with in future via the OCQ. Can identify if involvement is high or low and work with the employee to help them to feel more involved in the organisation and therefore reduce absenteeism and turnover. Can identify high acceptors of sabotage and work with these employees to help make them low acceptors. Can alert companies to the possibility that all employees may be dishonest as this was seen as acceptable form of sabotage. • Qualitative and quantitative data with reference to the data collected. • Evaluation of methods use to collect data. • Reliability • Validity • Generalisability Mark according to the levels of response descriptors in Table B. Other appropriate responses should also be credited.
What was in this paper
The subtopics covered by these 8 questions, and how many questions each got. Open one in a new tab to see every Cambridge question on it.
What you needed in this session
Cambridge’s own grade thresholds for 2021 Feb/March, Paper 3 · Variant 2. A higher threshold means an easier paper — the bar moves with how the cohort did.