Cambridge A Level Physics 9702 — 2023 Oct/Nov Paper 2 · Variant 1
9702/21/O/N/23 · 7 questions · 60 marks · ≈68 min
The question paper and its mark scheme, free to read here and free to download. This is Cambridge’s own paper, exactly as it was sat.
Question paper16 pages

Mark scheme14 pages
Answers below. Sit the paper first if you are practising.
Questions as text
Q1 · Compare scalar and vector quantities
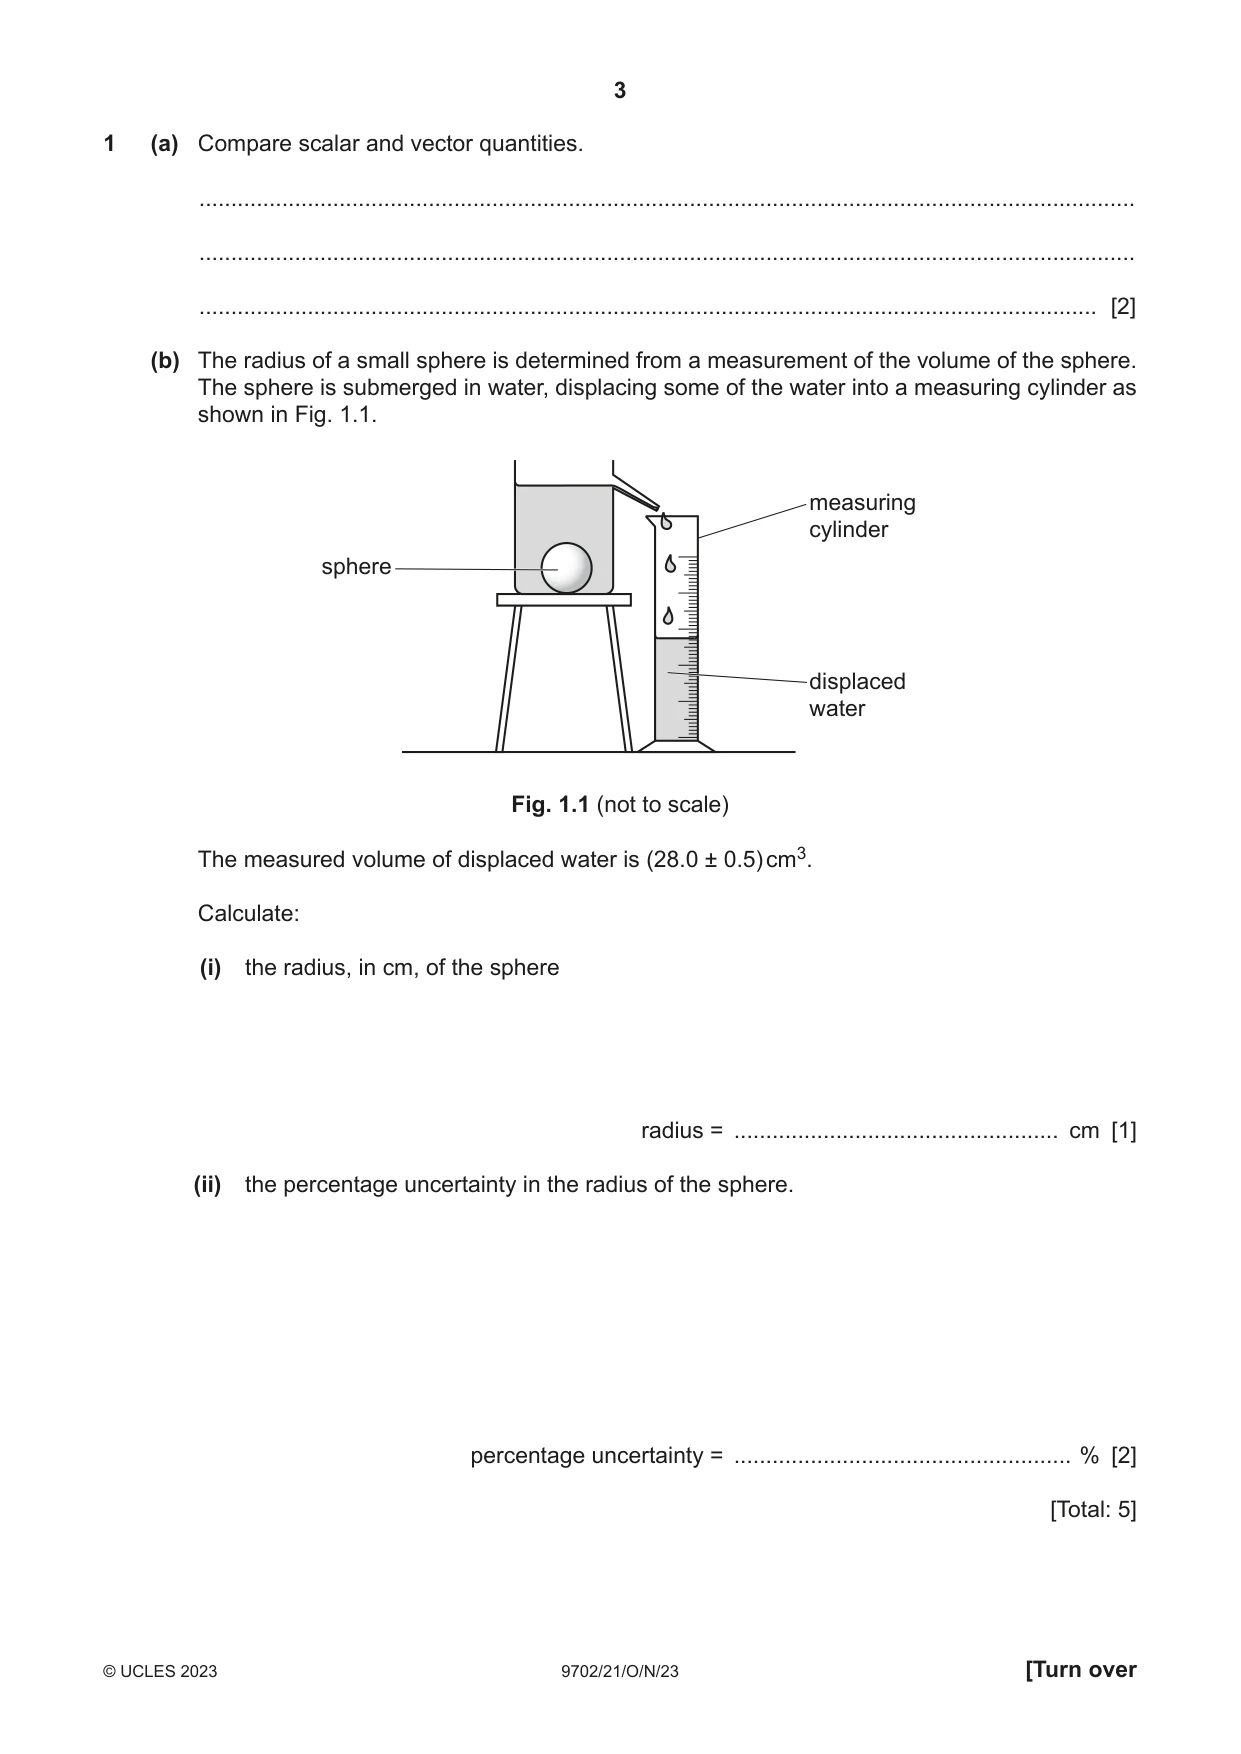
1 (a) Compare scalar and vector quantities. ................................................................................................................................................... ................................................................................................................................................... ............................................................................................................................................. [2] (b) The radius of a small sphere is determined from a measurement of the volume of the sphere. The sphere is submerged in water, displacing some of the water into a measuring cylinder as shown in Fig. 1.1. measuring cylinder sphere displaced water Fig. 1.1 (not to scale) The measured volume of displaced water is (28.0 ± 0.5) cm3. Calculate: (i) the radius, in cm, of the sphere radius = ................................................... cm [1] (ii) the percentage uncertainty in the radius of the sphere. percentage uncertainty = ..................................................... % [2] [Total: 5]
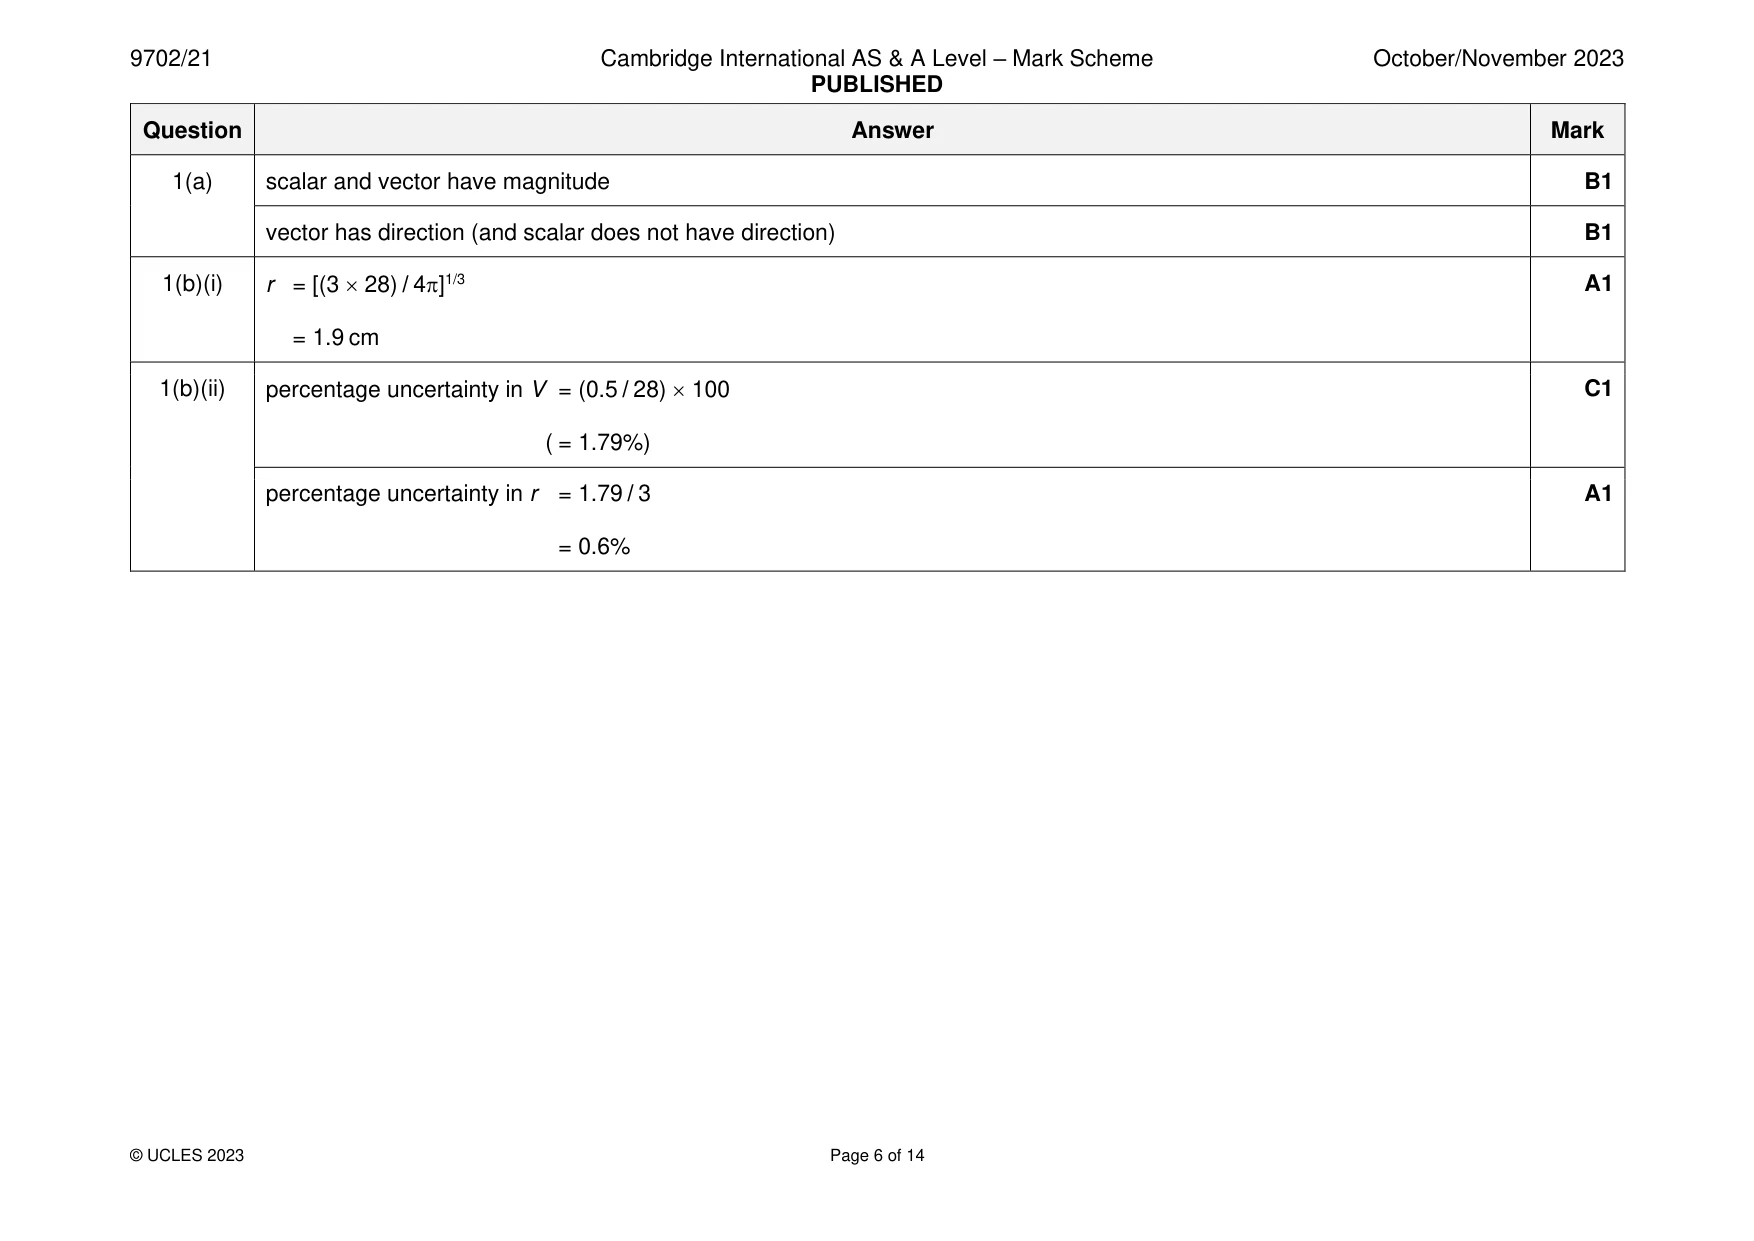
Mark scheme: Question Answer Mark 1(a) scalar and vector have magnitude B1 vector has direction (and scalar does not have direction) B1 1(b)(i) r = [(3 28) / 4]1/3 A1 = 1.9 cm 1(b)(ii) percentage uncertainty in V = (0.5 / 28) 100 C1 ( = 1.79%) percentage uncertainty in r = 1.79 / 3 A1 = 0.6%
Q2 · A hot-air balloon floats just above the ground
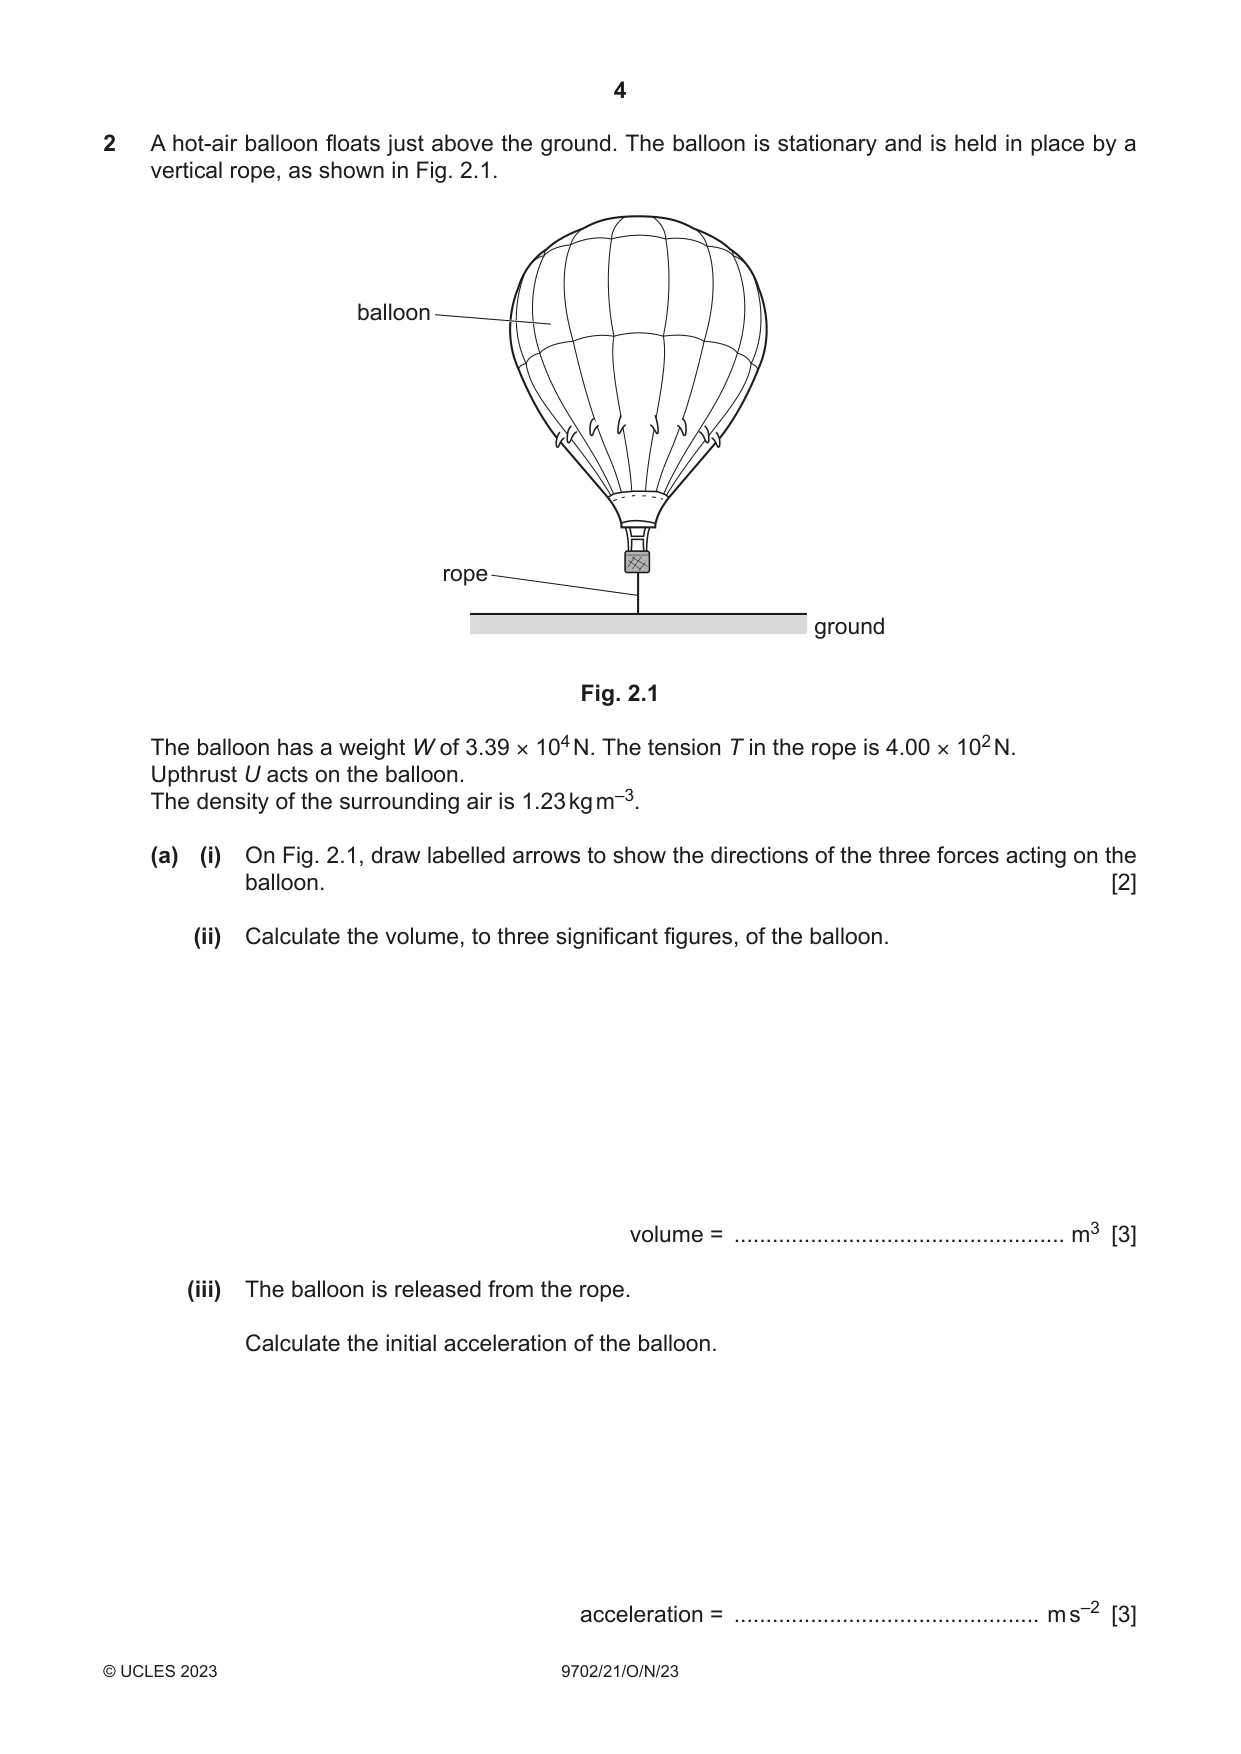
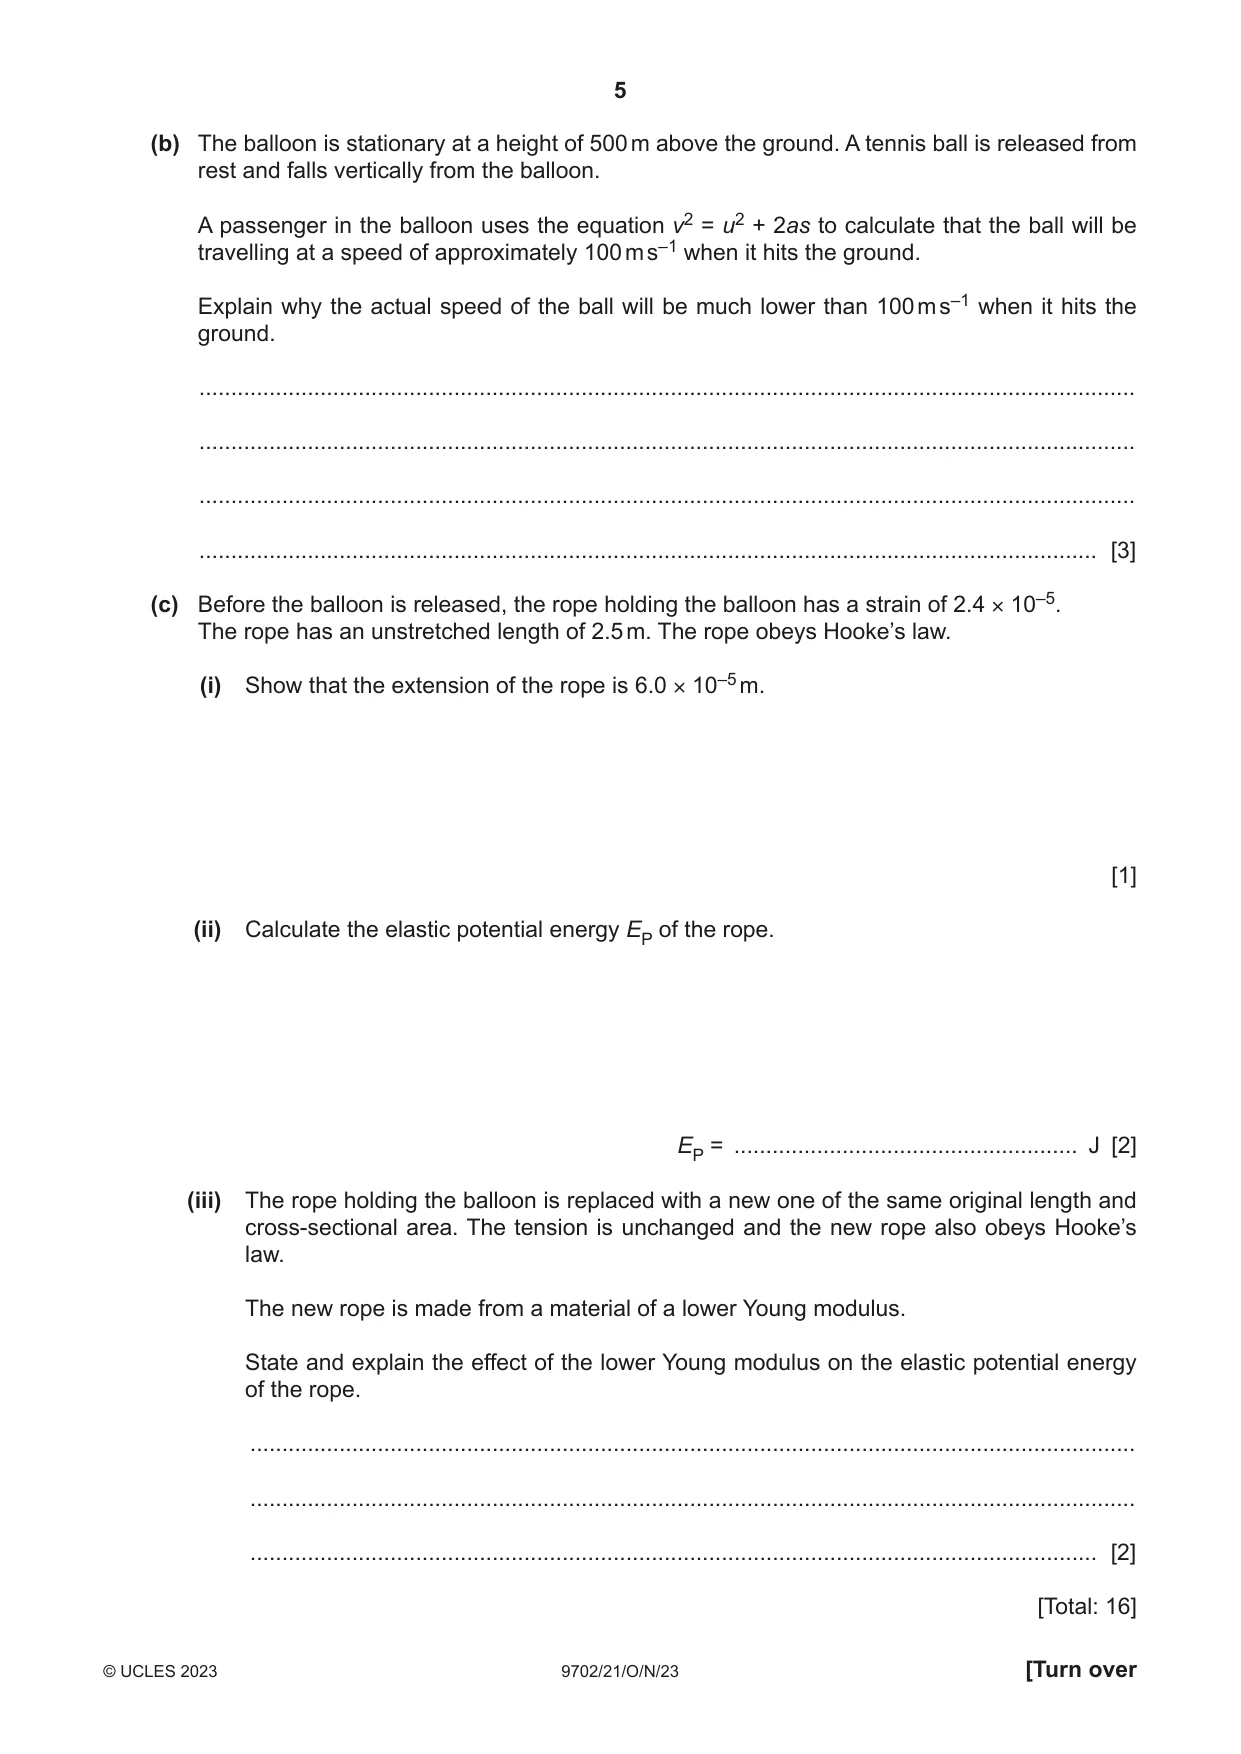
2 A hot-air balloon floats just above the ground. The balloon is stationary and is held in place by a vertical rope, as shown in Fig. 2.1. balloon rope ground Fig. 2.1 The balloon has a weight W of 3.39 × 10⁴ N. The tension T in the rope is 4.00 × 10² N. Upthrust U acts on the balloon. The density of the surrounding air is 1.23 kg m–3. (a) (i) On Fig. 2.1, draw labelled arrows to show the directions of the three forces acting on the balloon. [2] (ii) Calculate the volume, to three significant figures, of the balloon. volume = .................................................... m3 [3] (iii) The balloon is released from the rope. Calculate the initial acceleration of the balloon. acceleration = ................................................ m s–2 [3] (b) The balloon is stationary at a height of 500 m above the ground. A tennis ball is released from rest and falls vertically from the balloon. A passenger in the balloon uses the equation v2 = u2 + 2as to calculate that the ball will be travelling at a speed of approximately 100 m s–1 when it hits the ground. Explain why the actual speed of the ball will be much lower than 100 m s–1 when it hits the ground. ................................................................................................................................................... ................................................................................................................................................... ................................................................................................................................................... ............................................................................................................................................. [3] (c) Before the balloon is released, the rope holding the balloon has a strain of 2.4 × 10⁻⁵. The rope has an unstretched length of 2.5 m. The rope obeys Hooke’s law. (i) Show that the extension of the rope is 6.0 × 10⁻⁵ m. [1] (ii) Calculate the elastic potential energy EP of the rope. EP = ...................................................... J [2] (iii) The rope holding the balloon is replaced with a new one of the same original length and cross-sectional area. The tension is unchanged and the new rope also obeys Hooke’s law. The new rope is made from a material of a lower Young modulus. State and explain the effect of the lower Young modulus on the elastic potential energy of the rope. ........................................................................................................................................... ........................................................................................................................................... ..................................................................................................................................... [2] [Total: 16]
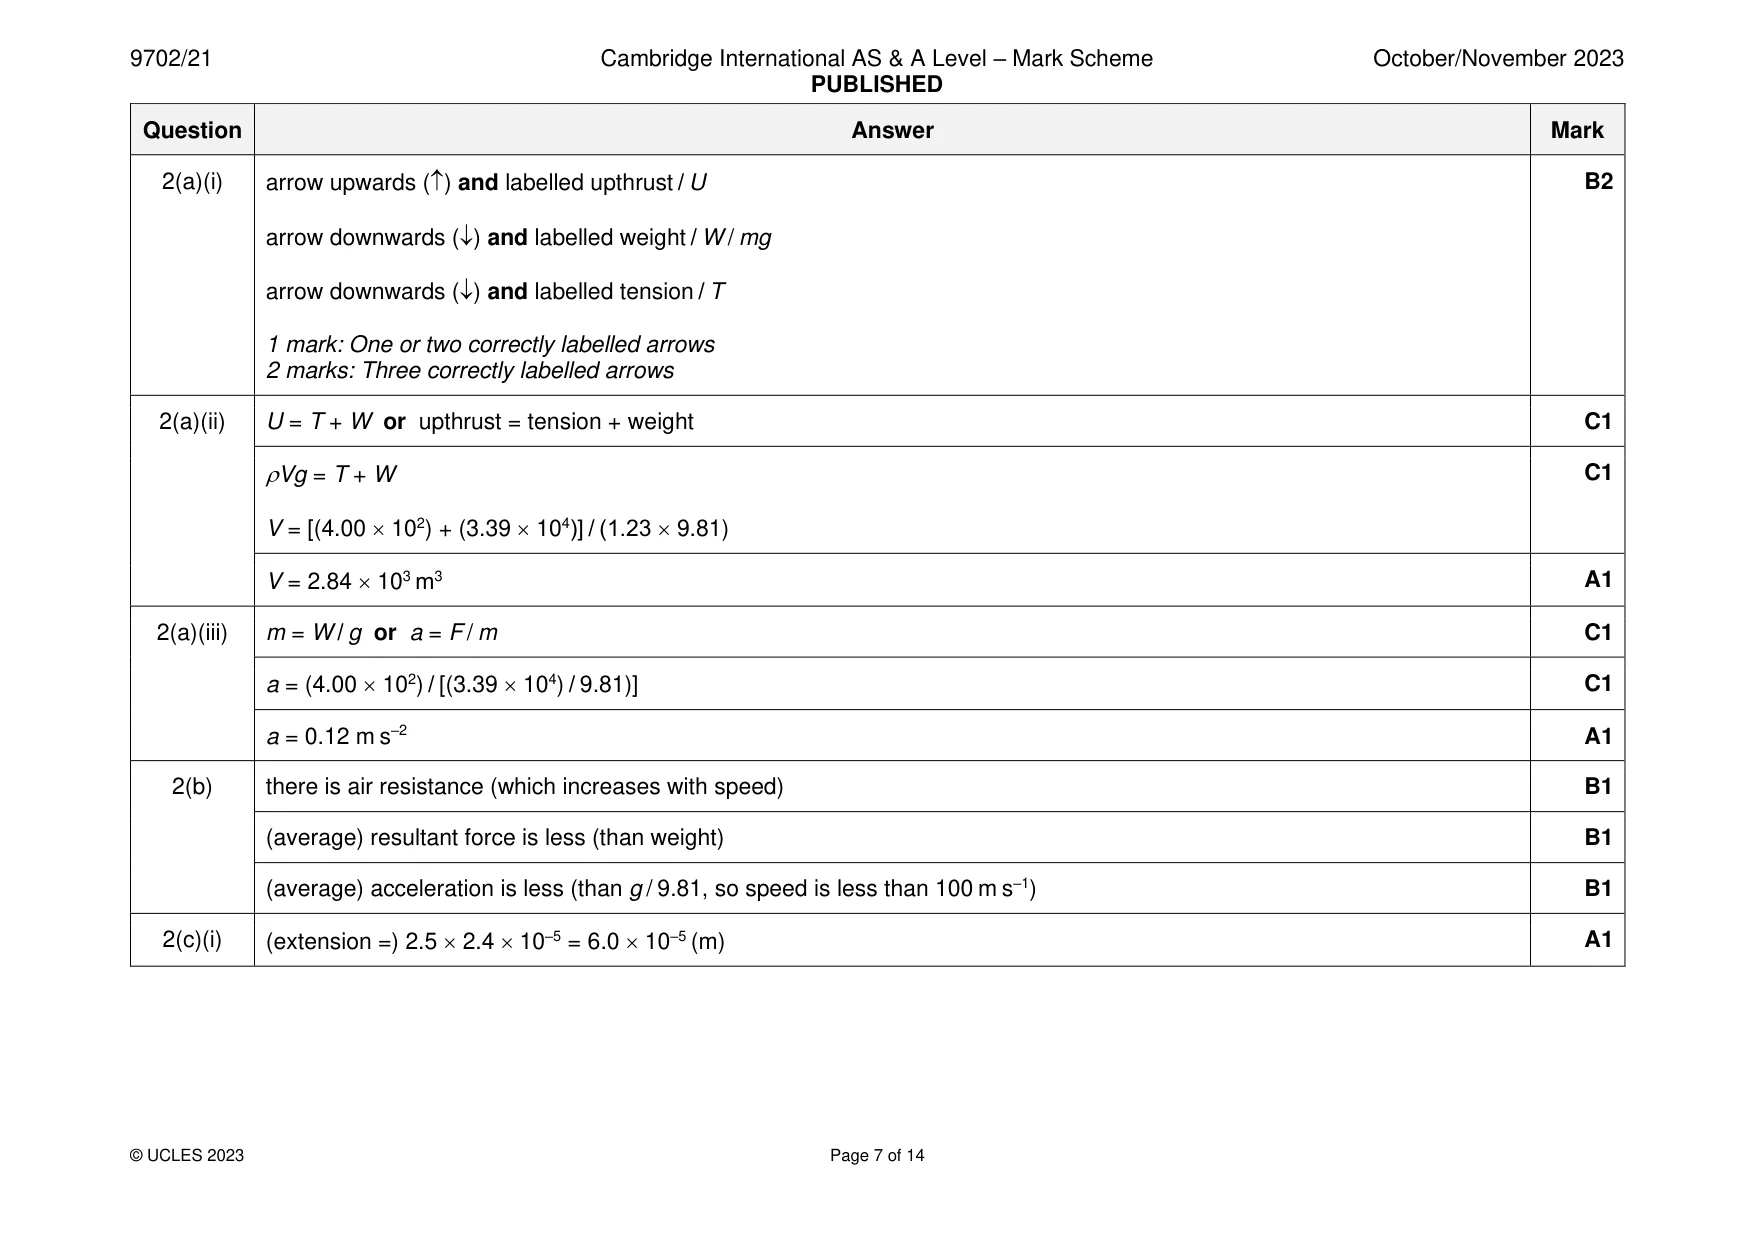
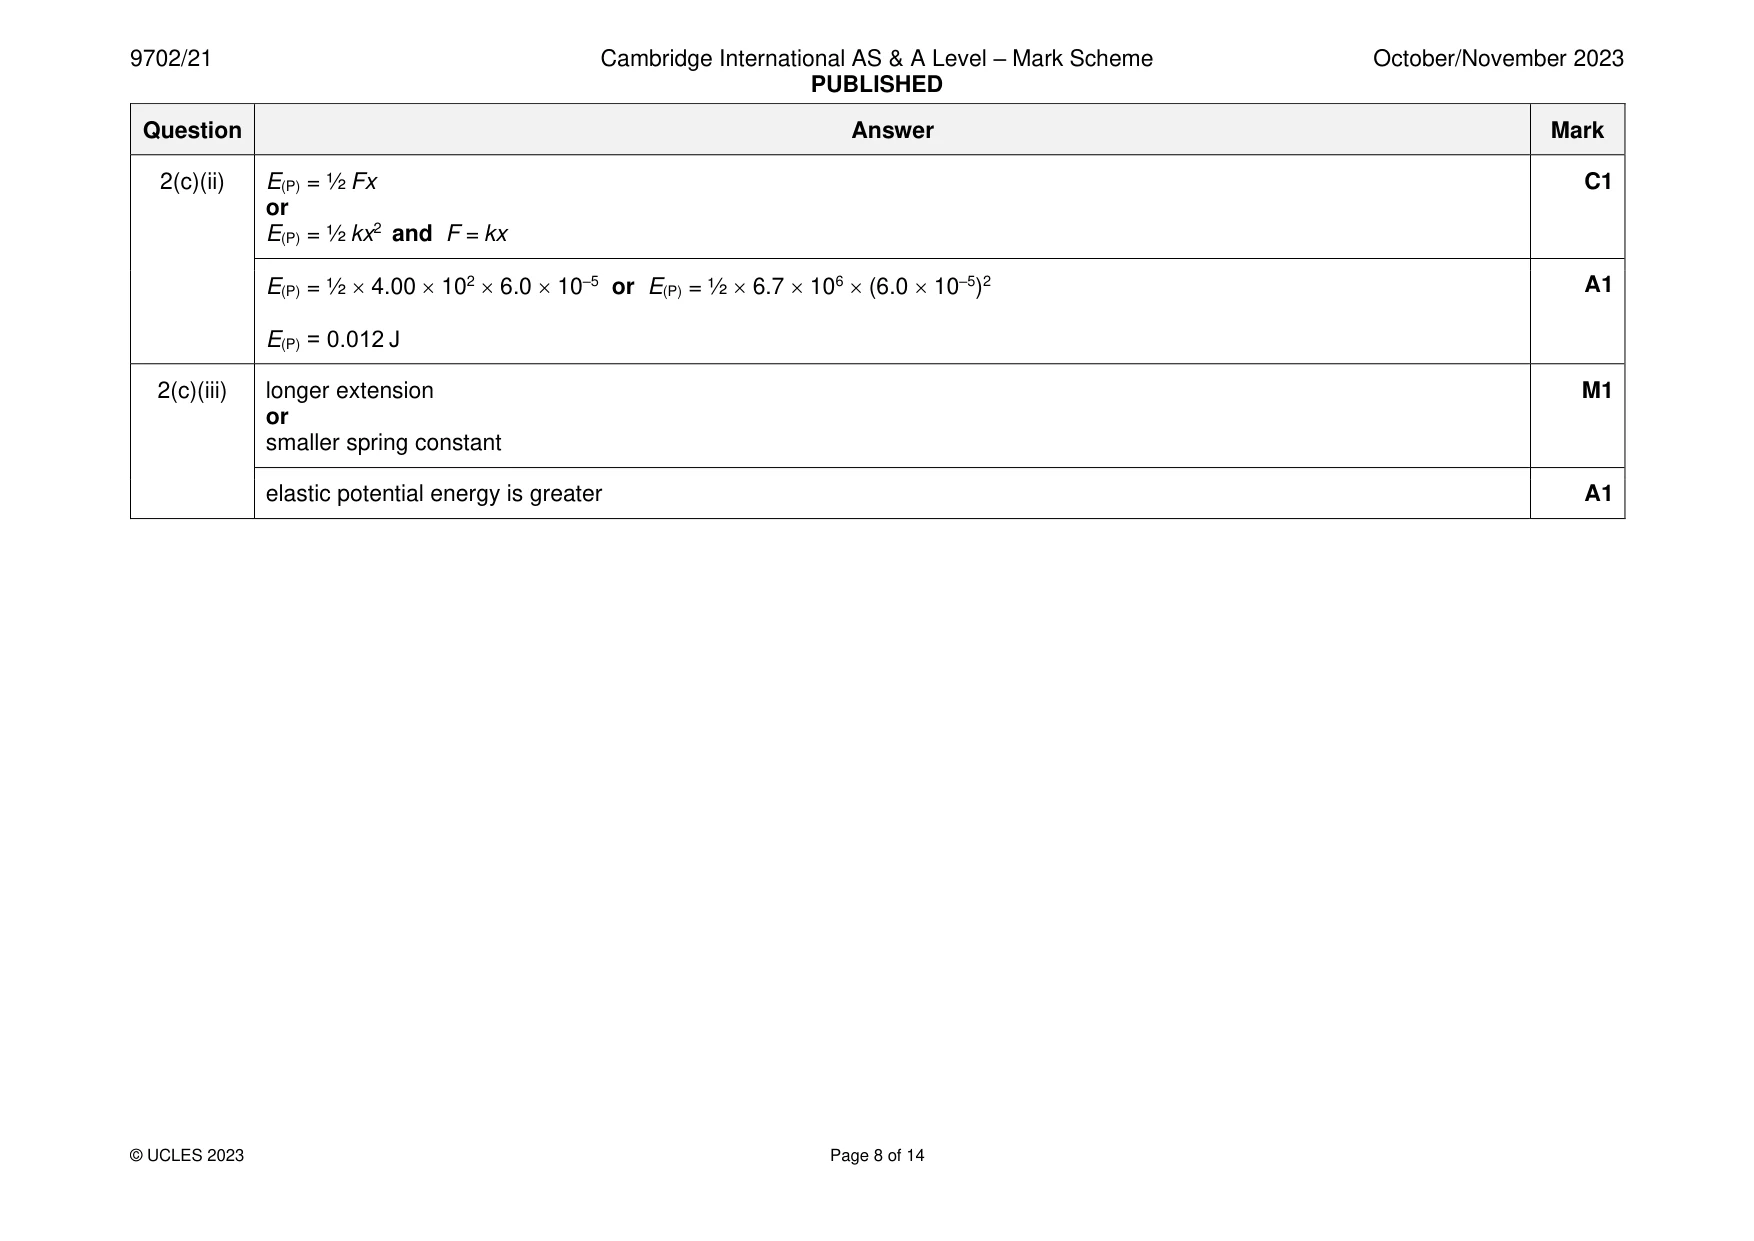
Mark scheme: 2(a)(i) arrow upwards () and labelled upthrust / U B2 arrow downwards () and labelled weight / W / mg arrow downwards () and labelled tension / T 1 mark: One or two correctly labelled arrows 2 marks: Three correctly labelled arrows 2(a)(ii) U = T + W or upthrust = tension + weight C1 Vg = T + W C1 V = [(4.00 102) + (3.39 104)] / (1.23 9.81) V = 2.84 103 m3 A1 2(a)(iii) m = W / g or a = F / m C1 a = (4.00 102) / [(3.39 104) / 9.81)] C1 a = 0.12 m s–2 A1 2(b) there is air resistance (which increases with speed) B1 (average) resultant force is less (than weight) B1 (average) acceleration is less (than g / 9.81, so speed is less than 100 m s–1) B1 2(c)(i) (extension =) 2.5 2.4 10–5 = 6.0 10–5 (m) A1 2(c)(ii) E(P) = ½ Fx C1 or E(P) = ½ kx2 and F = kx E(P) = ½ 4.00 102 6.0 10–5 or E(P) = ½ 6.7 106 (6.0 10–5)2 A1 E(P) = 0.012 J 2(c)(iii) longer extension M1 or smaller spring constant elastic potential energy is greater A1
Q3 · A trolley A moves along a horizontal surface at a constant velocity towards another…
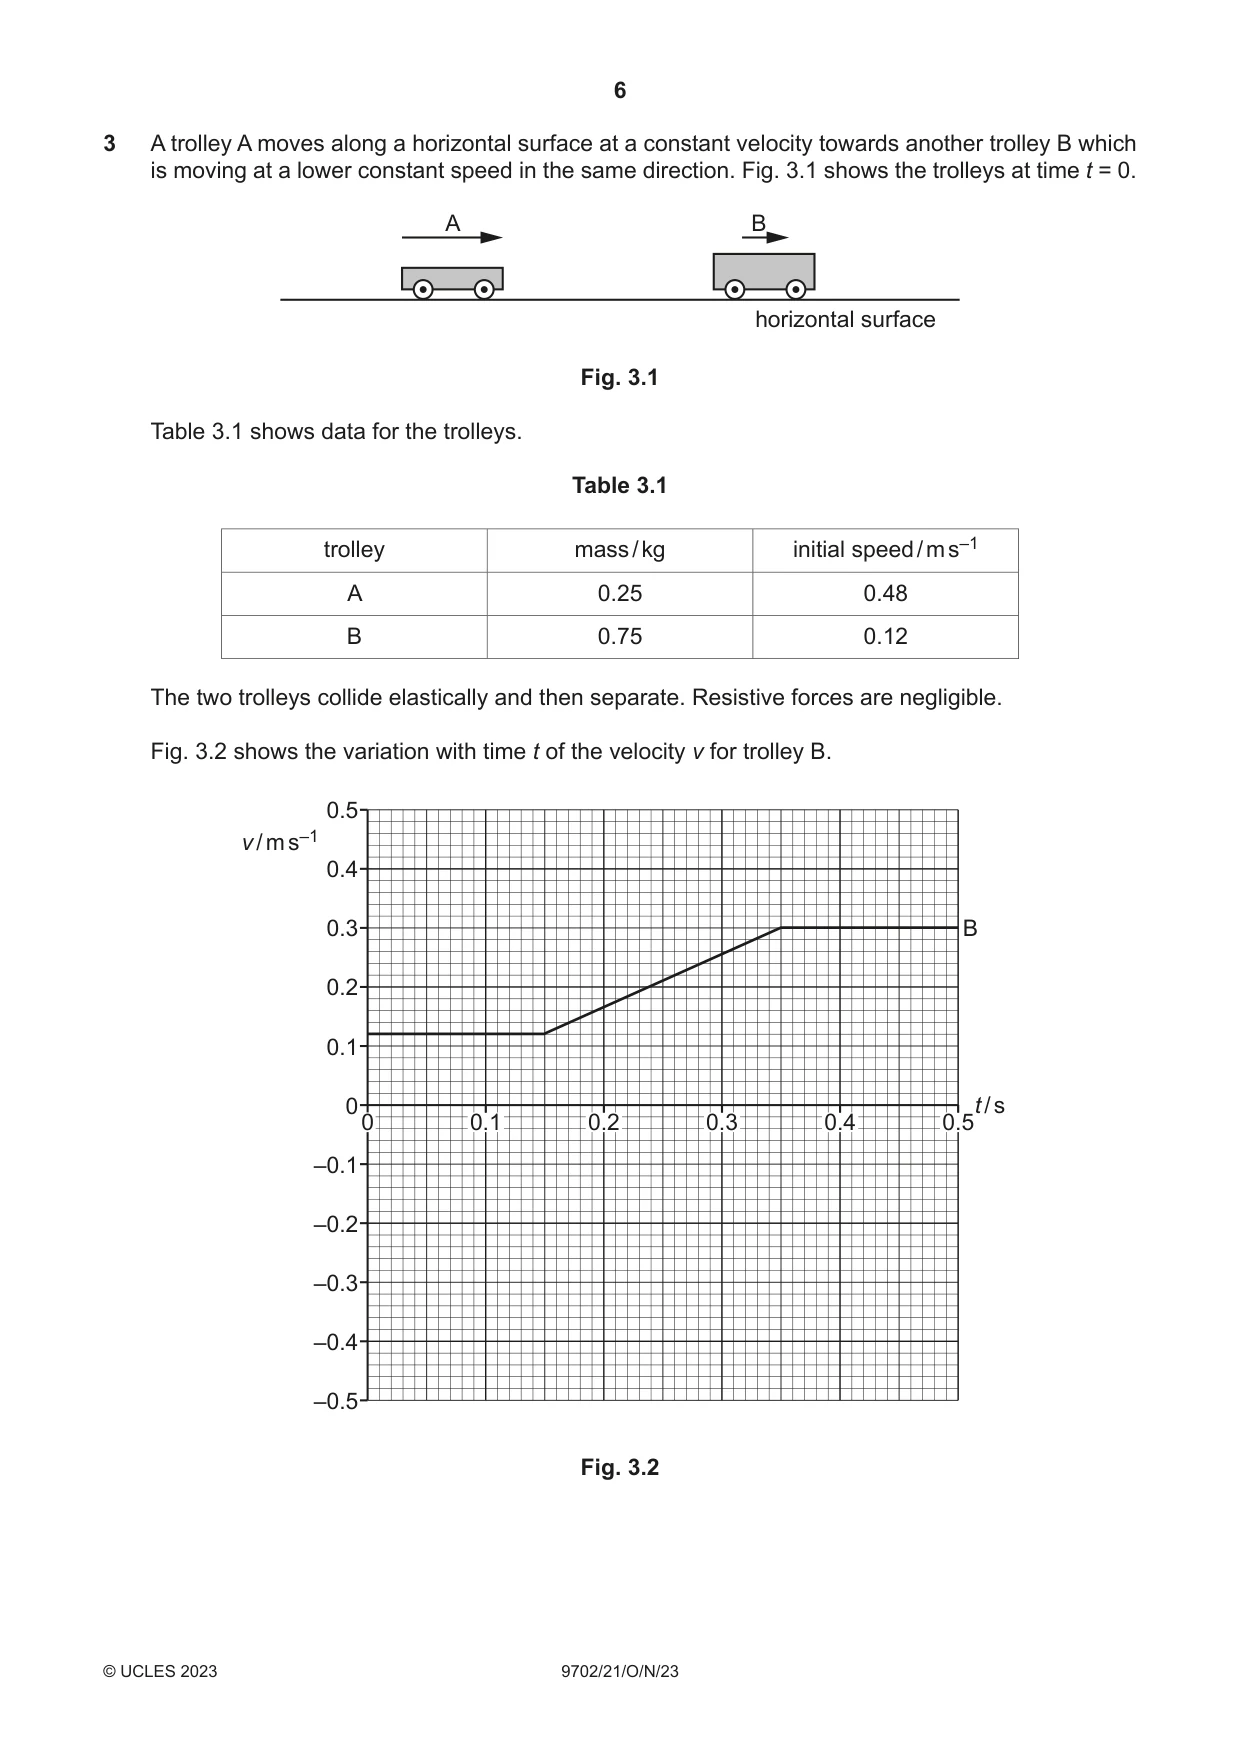
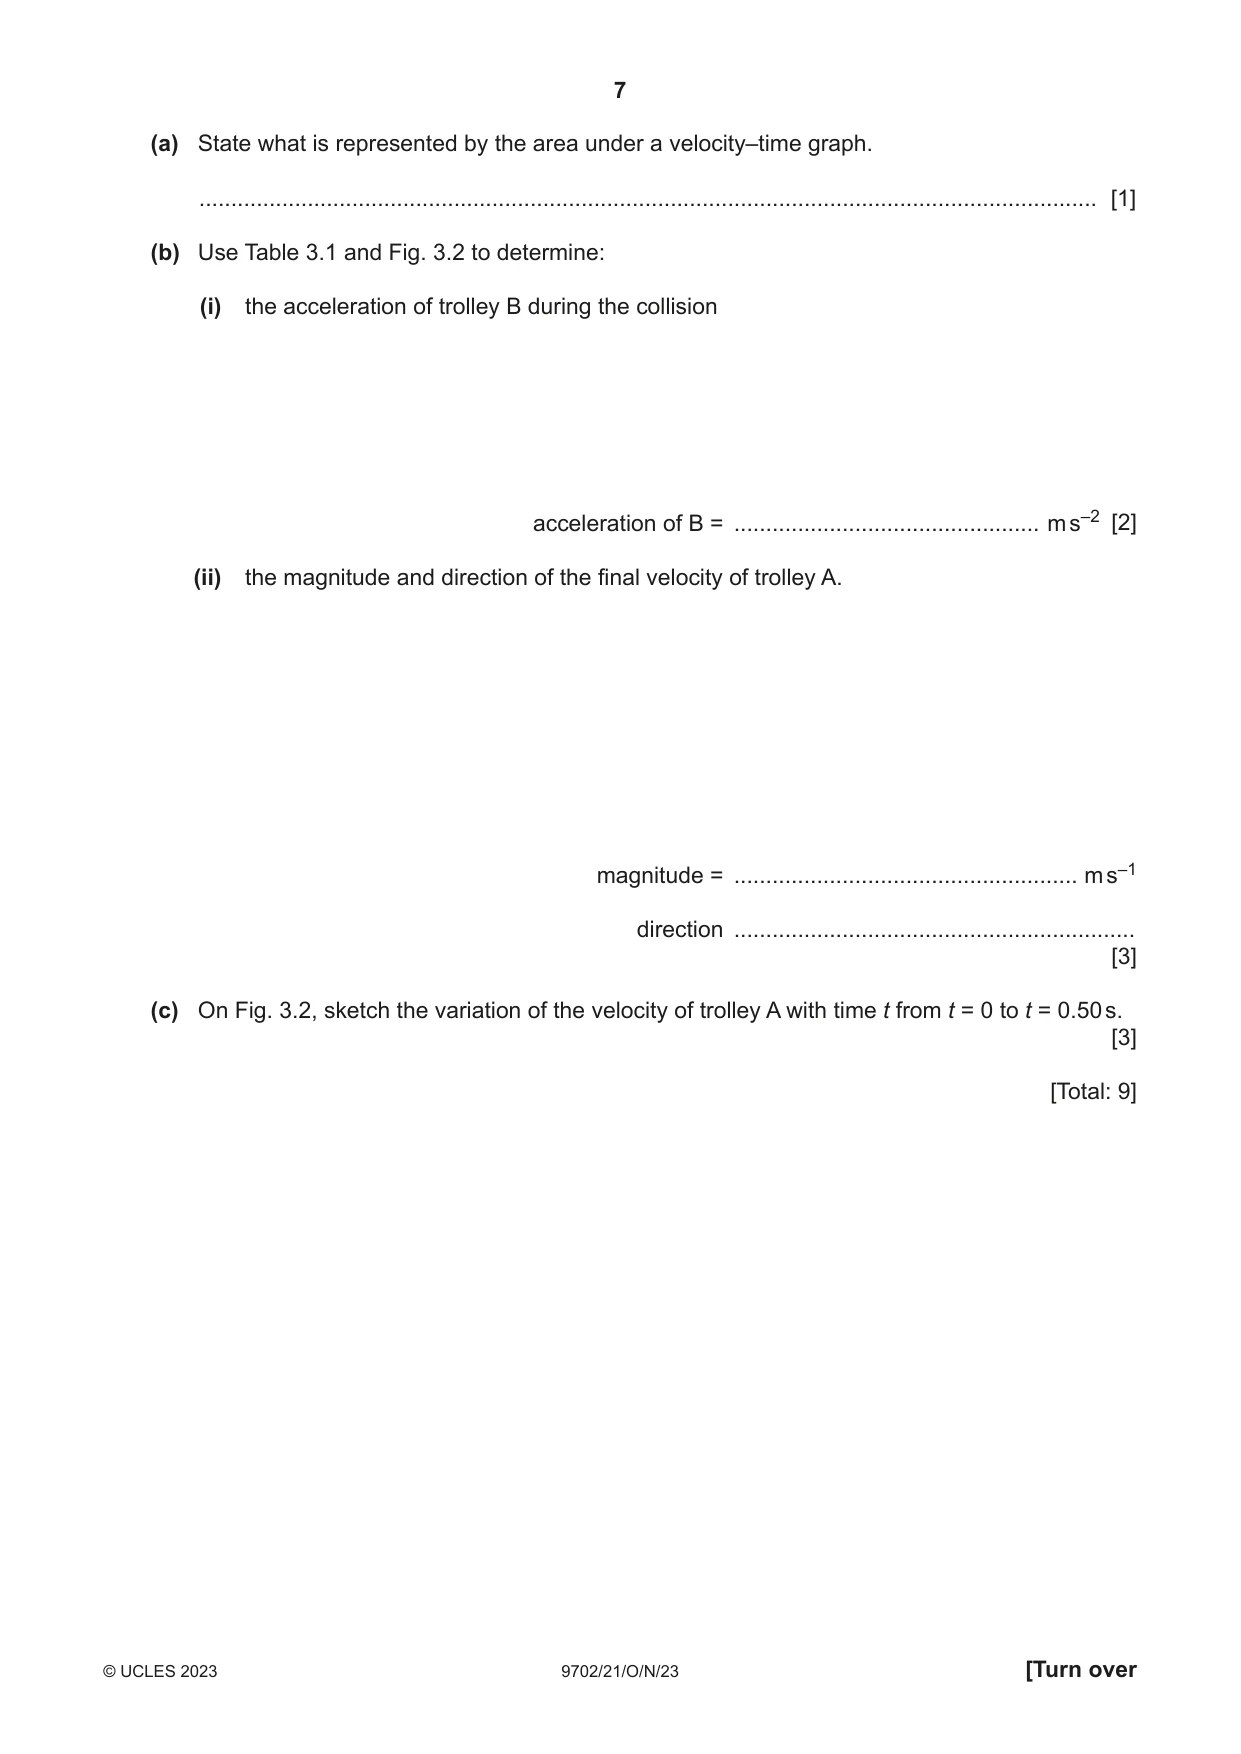
3 A trolley A moves along a horizontal surface at a constant velocity towards another trolley B which is moving at a lower constant speed in the same direction. Fig. 3.1 shows the trolleys at time t = 0. A B horizontal surface Fig. 3.1 Table 3.1 shows data for the trolleys. Table 3.1 trolley mass / kg initial speed / m s–1 A 0.25 0.48 B 0.75 0.12 The two trolleys collide elastically and then separate. Resistive forces are negligible. Fig. 3.2 shows the variation with time t of the velocity v for trolley B. 0.5 v / m s–1 0.4 0.3 B 0.2 0.1 0 / s 0 0.1 0.2 0.3 0.4 0.5t –0.1 –0.2 –0.3 –0.4 –0.5 Fig. 3.2 (a) State what is represented by the area under a velocity–time graph. ............................................................................................................................................. [1] (b) Use Table 3.1 and Fig. 3.2 to determine: (i) the acceleration of trolley B during the collision acceleration of B = ................................................ m s–2 [2] (ii) the magnitude and direction of the final velocity of trolley A. magnitude = ...................................................... m s–1 direction ............................................................... [3] (c) On Fig. 3.2, sketch the variation of the velocity of trolley A with time t from t = 0 to t = 0.50 s. [3] [Total: 9]
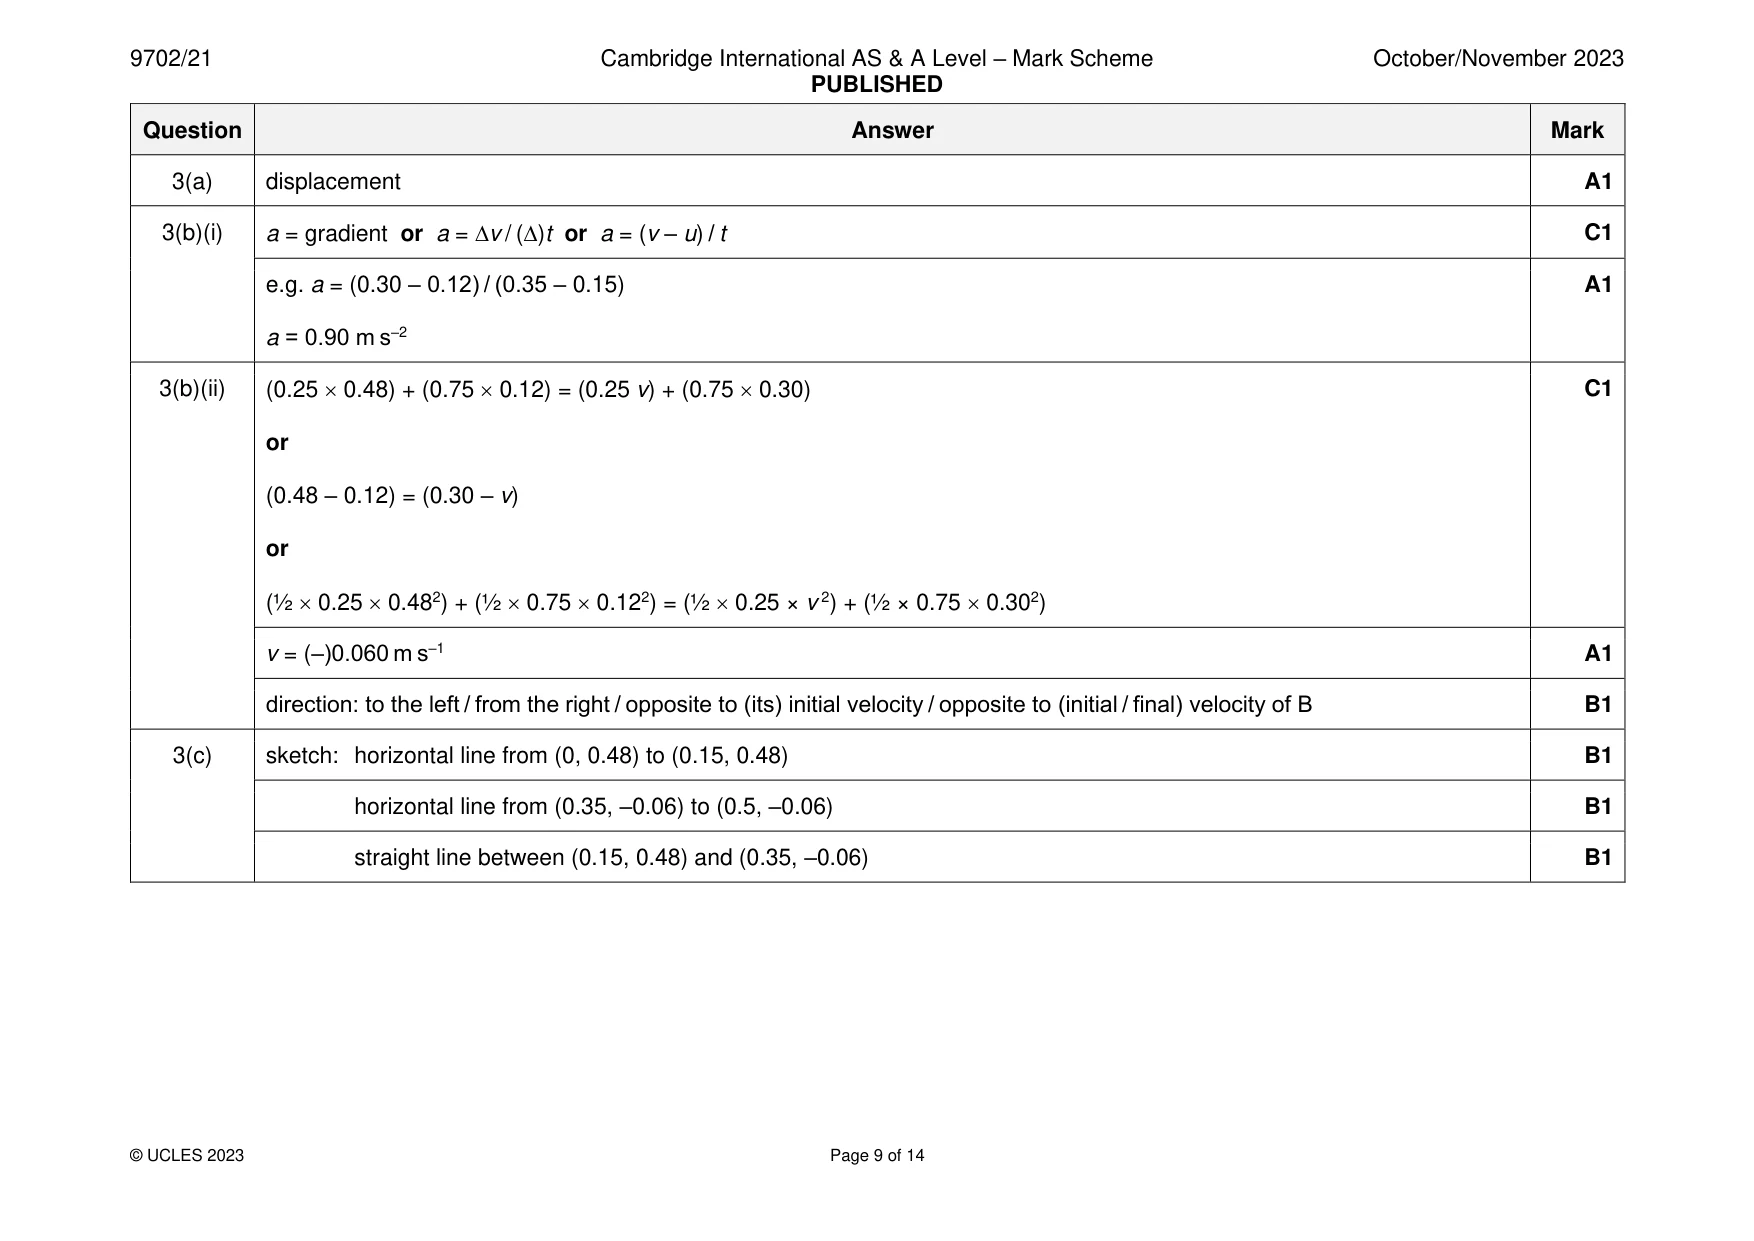
Mark scheme: 3(a) displacement A1 3(b)(i) a = gradient or a = v / ()t or a = (v – u) / t C1 e.g. a = (0.30 – 0.12) / (0.35 – 0.15) A1 a = 0.90 m s–2 3(b)(ii) (0.25 0.48) + (0.75 0.12) = (0.25 v) + (0.75 0.30) C1 or (0.48 – 0.12) = (0.30 – v) or (½ 0.25 0.482) + (½ 0.75 0.122) = (½ 0.25 × v 2) + (½ × 0.75 0.302) v = (–)0.060 m s–1 A1 direction: to the left / from the right / opposite to (its) initial velocity / opposite to (initial / final) velocity of B B1 3(c) sketch: horizontal line from (0, 0.48) to (0.15, 0.48) B1 horizontal line from (0.35, –0.06) to (0.5, –0.06) B1 straight line between (0.15, 0.48) and (0.35, –0.06) B1
Q4 · State the principle of superposition
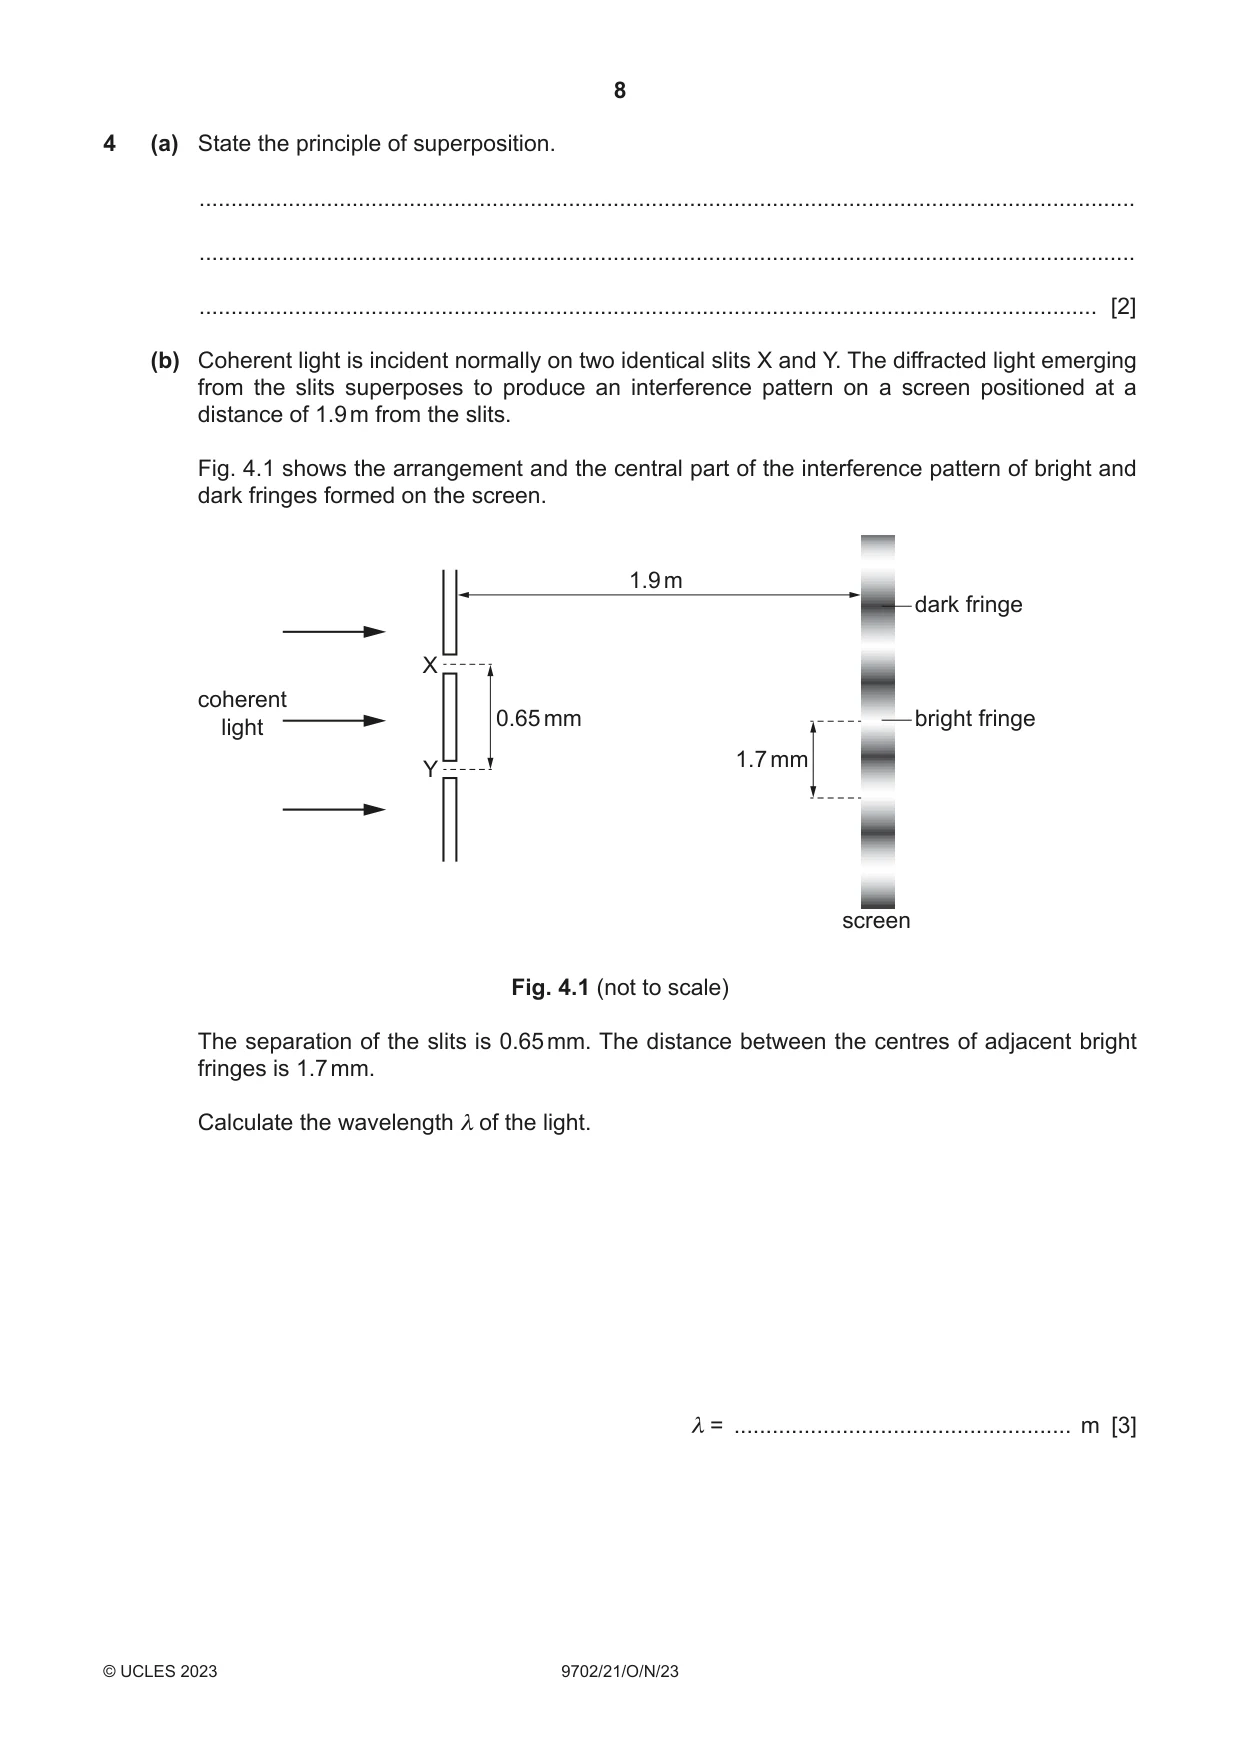
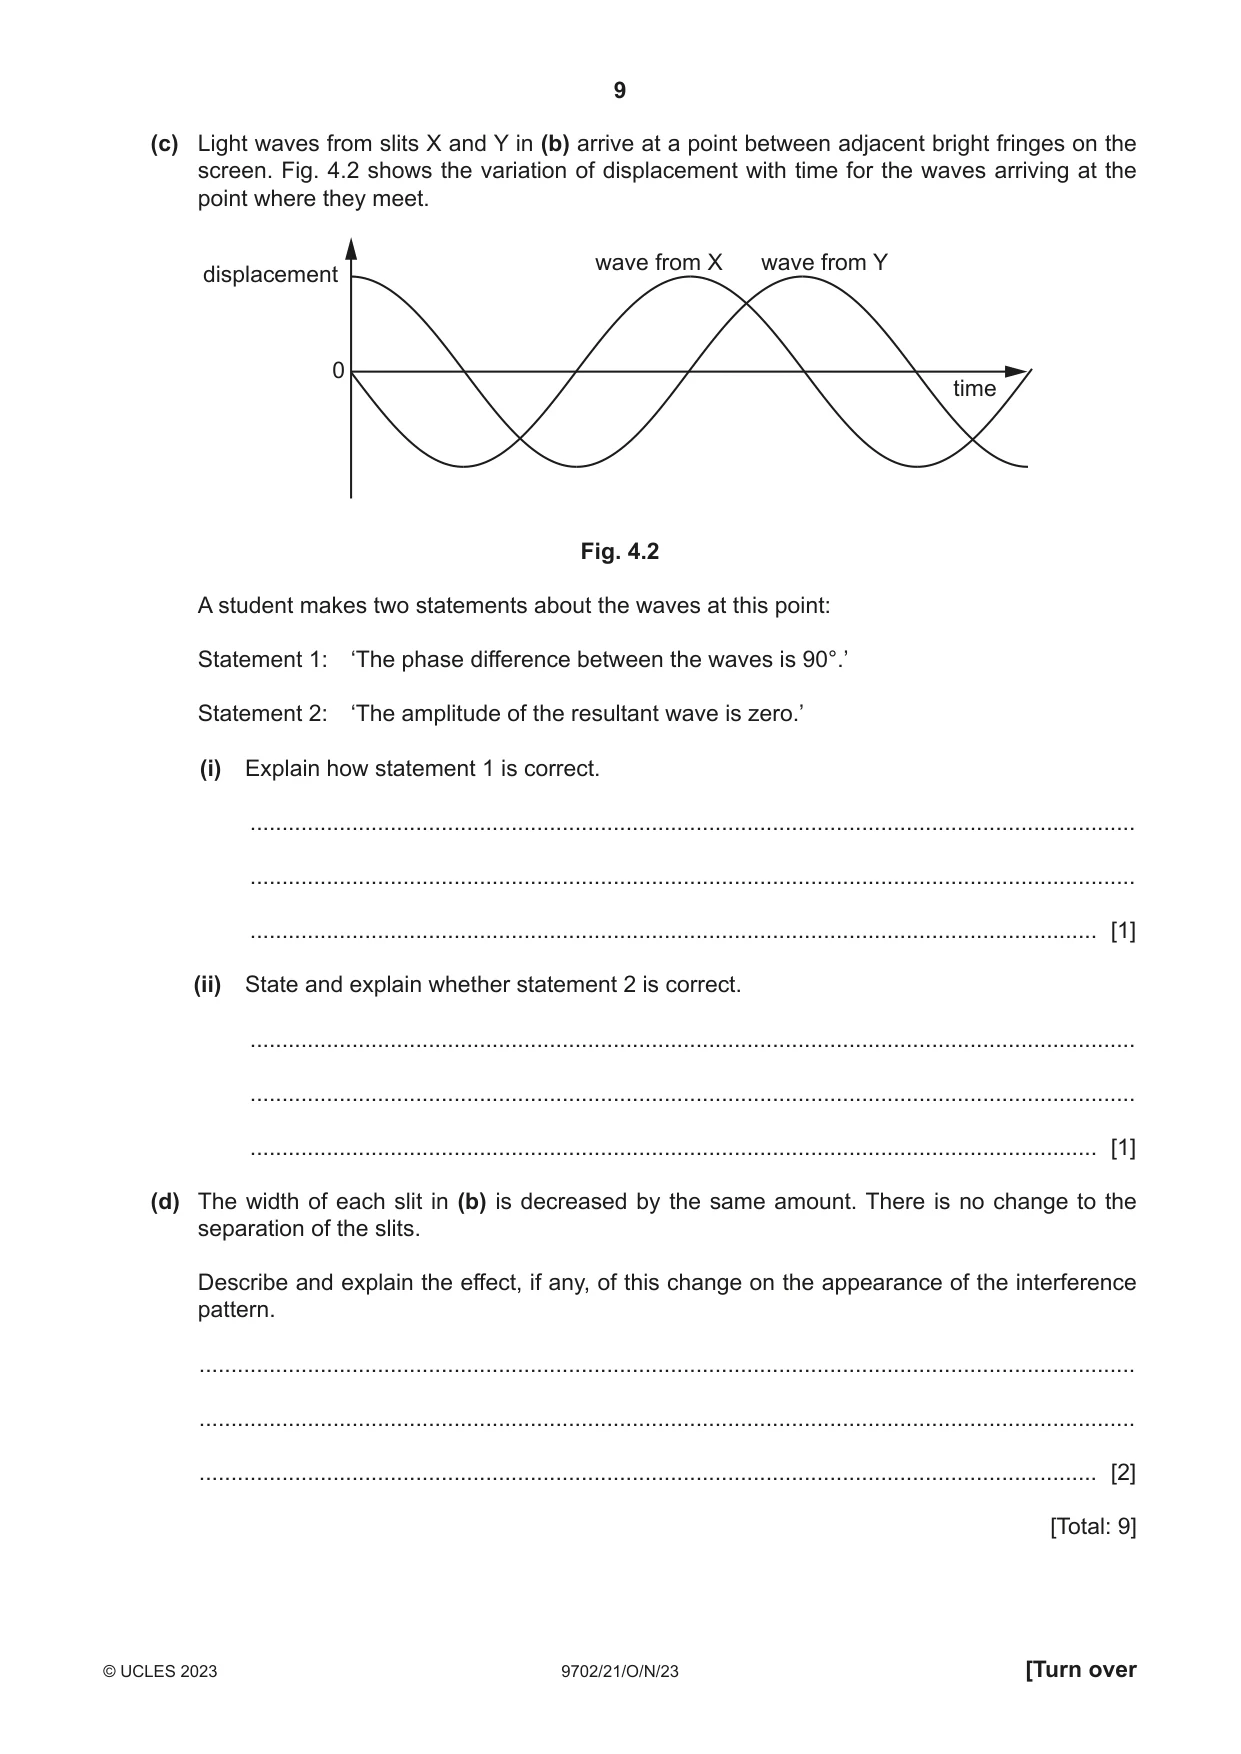
4 (a) State the principle of superposition. ................................................................................................................................................... ................................................................................................................................................... ............................................................................................................................................. [2] (b) Coherent light is incident normally on two identical slits X and Y. The diffracted light emerging from the slits superposes to produce an interference pattern on a screen positioned at a distance of 1.9 m from the slits. Fig. 4.1 shows the arrangement and the central part of the interference pattern of bright and dark fringes formed on the screen. 1.9 m dark fringe X coherent 0.65 mm bright fringe light 1.7 mm Y screen Fig. 4.1 (not to scale) The separation of the slits is 0.65 mm. The distance between the centres of adjacent bright fringes is 1.7 mm. Calculate the wavelength λ of the light. λ = ..................................................... m [3] (c) Light waves from slits X and Y in (b) arrive at a point between adjacent bright fringes on the screen. Fig. 4.2 shows the variation of displacement with time for the waves arriving at the point where they meet. wave from X wave from Y displacement 0 time Fig. 4.2 A student makes two statements about the waves at this point: Statement 1: ‘The phase difference between the waves is 90°.’ Statement 2: ‘The amplitude of the resultant wave is zero.’ (i) Explain how statement 1 is correct. ........................................................................................................................................... ........................................................................................................................................... ..................................................................................................................................... [1] (ii) State and explain whether statement 2 is correct. ........................................................................................................................................... ........................................................................................................................................... ..................................................................................................................................... [1] (d) The width of each slit in (b) is decreased by the same amount. There is no change to the separation of the slits. Describe and explain the effect, if any, of this change on the appearance of the interference pattern. ................................................................................................................................................... ................................................................................................................................................... ............................................................................................................................................. [2] [Total: 9]
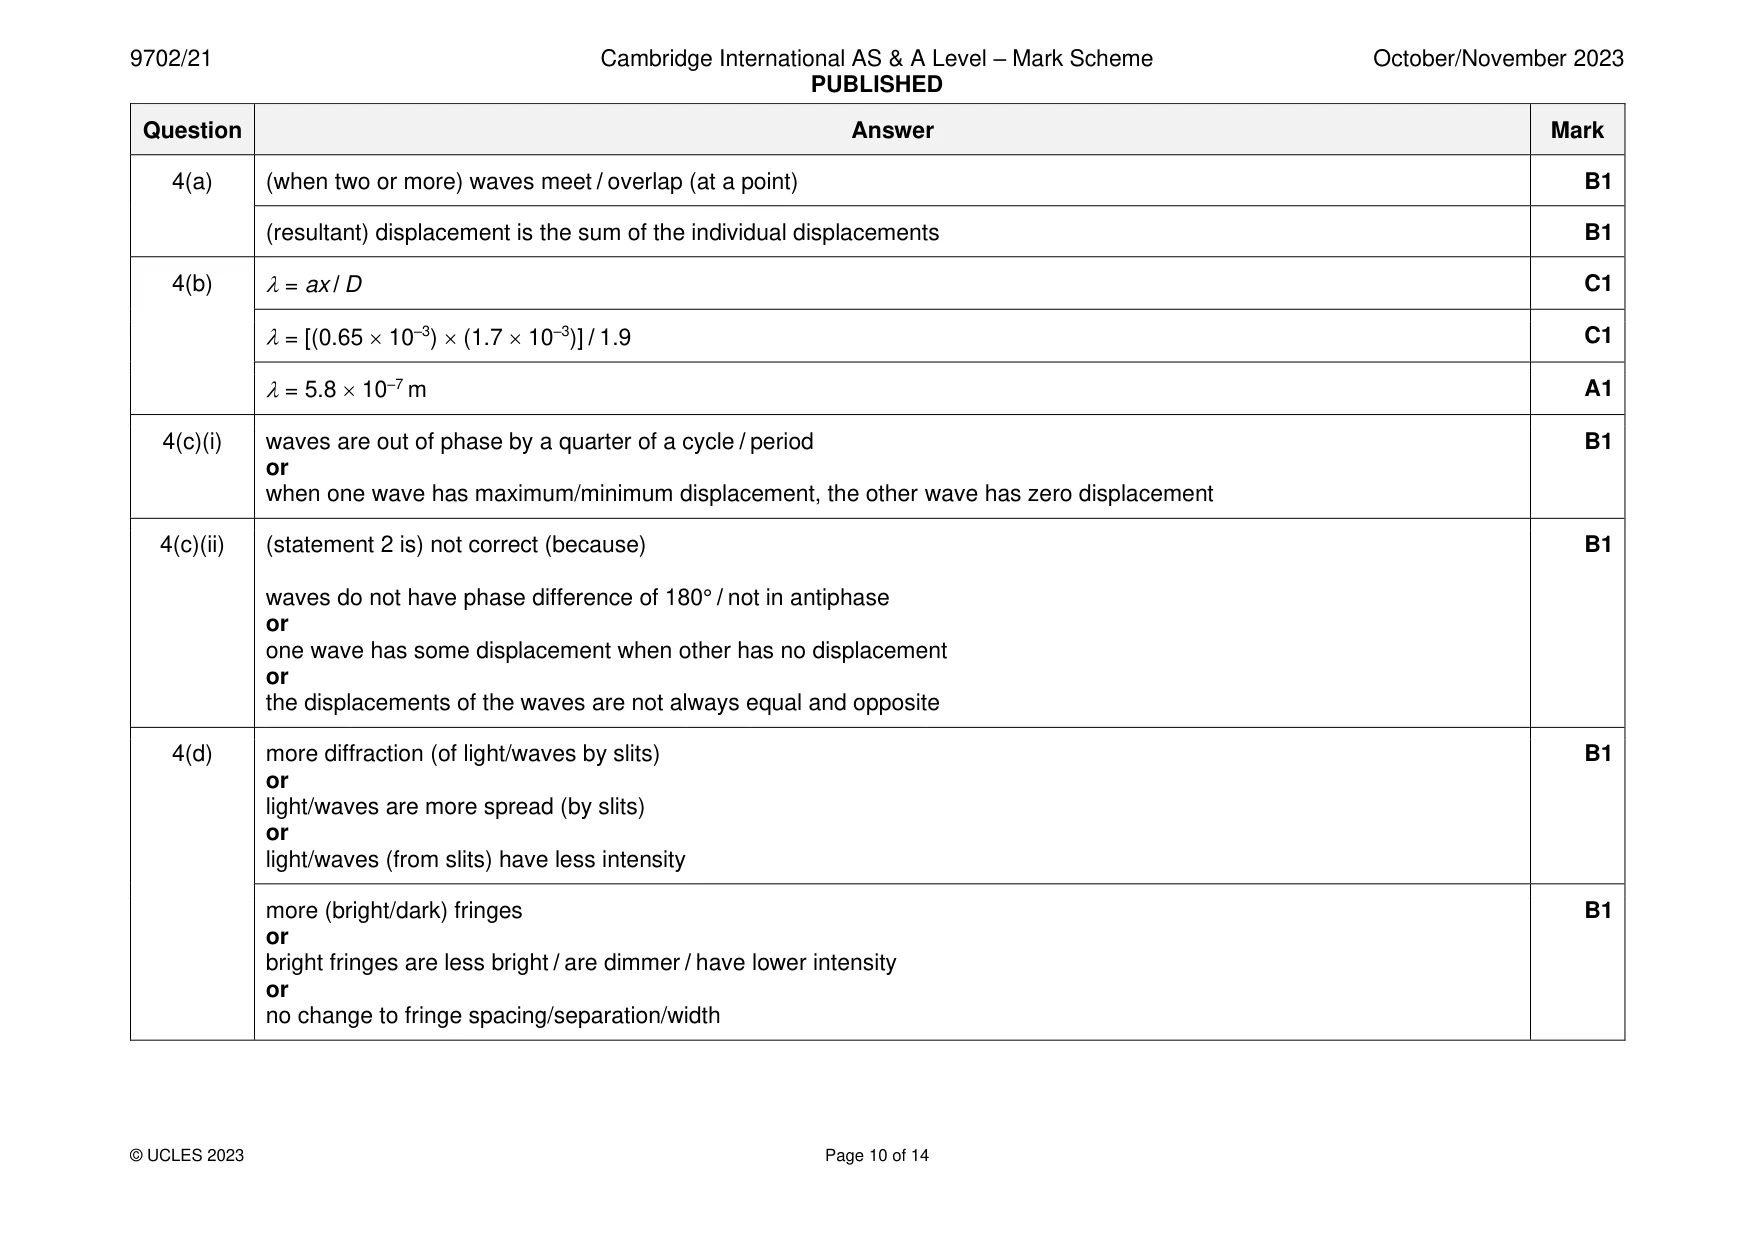
Mark scheme: 4(a) (when two or more) waves meet / overlap (at a point) B1 (resultant) displacement is the sum of the individual displacements B1 4(b) = ax / D C1 = [(0.65 10–3) (1.7 10–3)] / 1.9 C1 = 5.8 10–7 m A1 4(c)(i) waves are out of phase by a quarter of a cycle / period B1 or when one wave has maximum/minimum displacement, the other wave has zero displacement 4(c)(ii) (statement 2 is) not correct (because) B1 waves do not have phase difference of 180° / not in antiphase or one wave has some displacement when other has no displacement or the displacements of the waves are not always equal and opposite 4(d) more diffraction (of light/waves by slits) B1 or light/waves are more spread (by slits) or light/waves (from slits) have less intensity more (bright/dark) fringes B1 or bright fringes are less bright / are dimmer / have lower intensity or no change to fringe spacing/separation/width
Q5 · A train travels at a constant high speed along a straight horizontal track towards an…
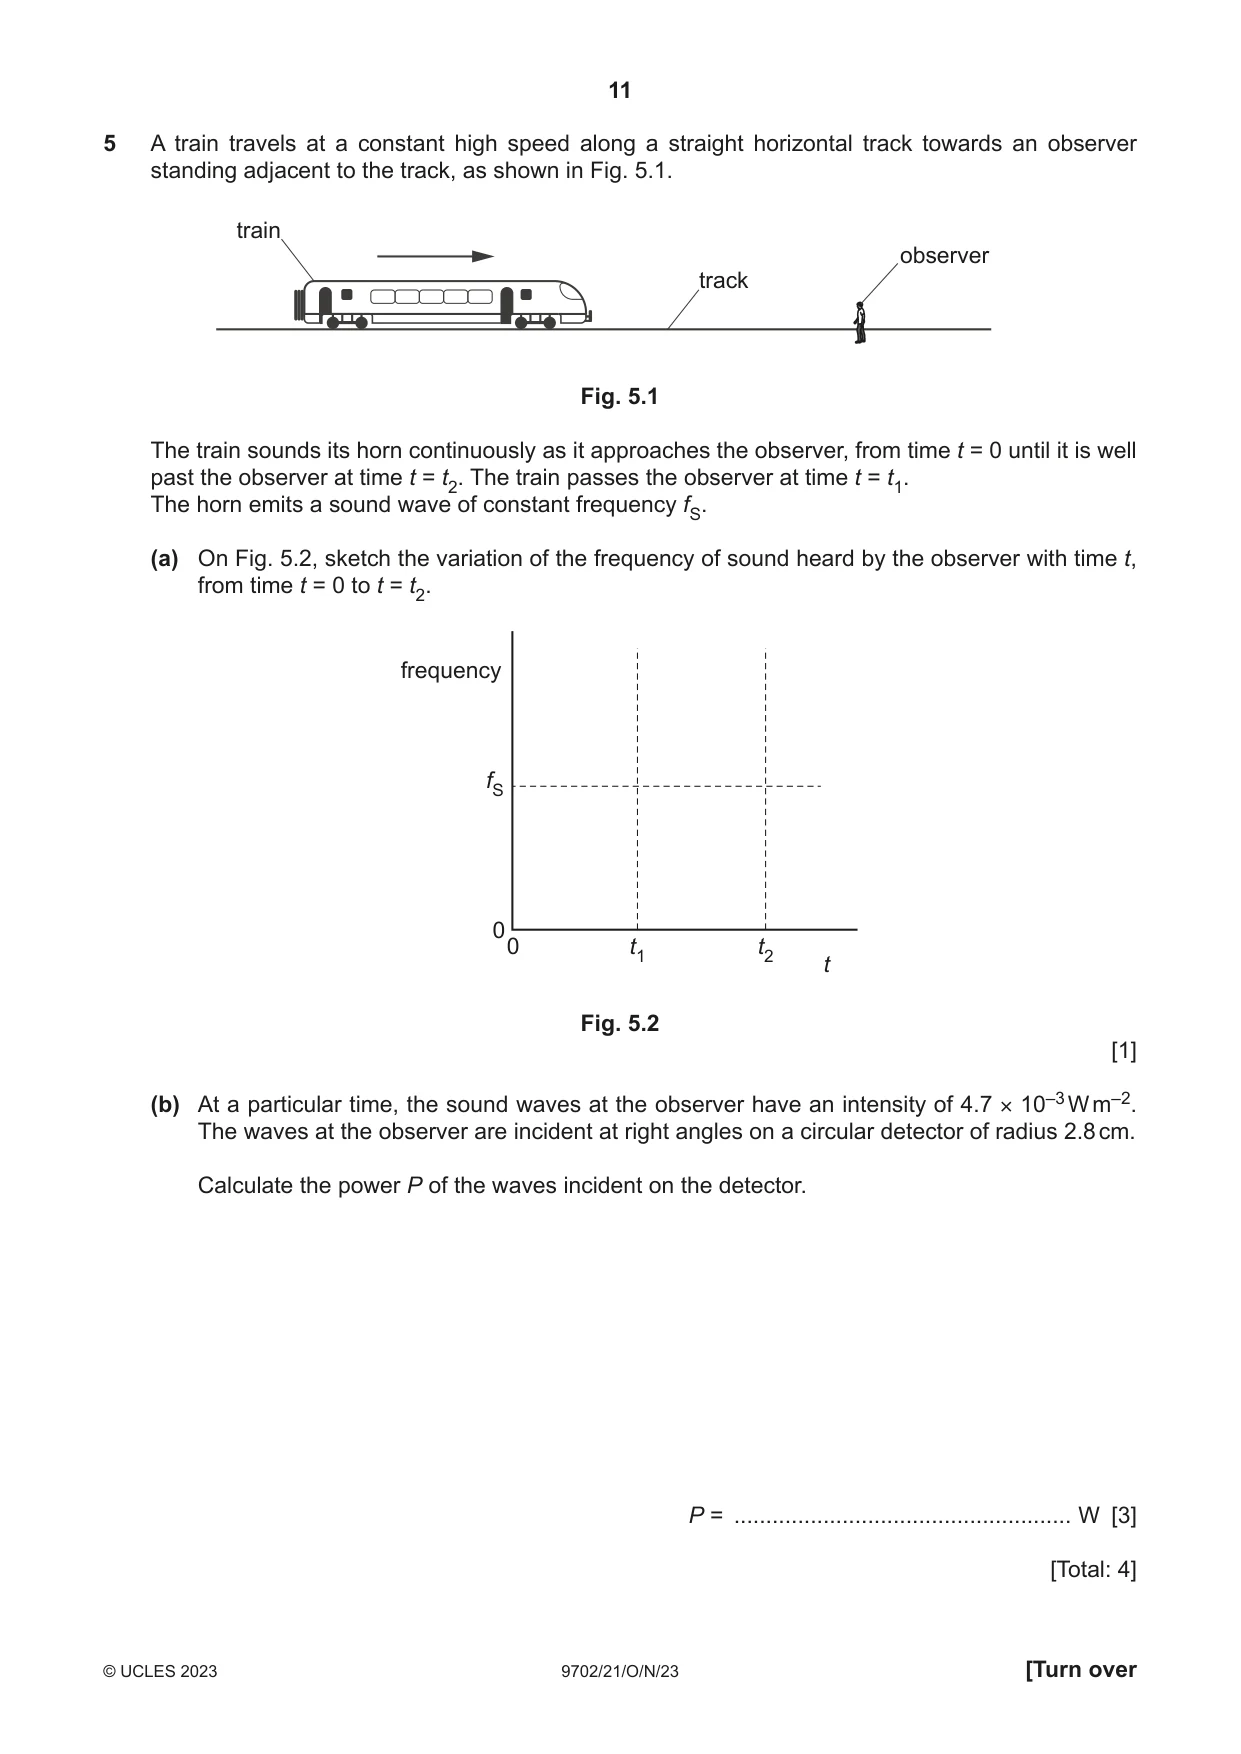
5 A train travels at a constant high speed along a straight horizontal track towards an observer standing adjacent to the track, as shown in Fig. 5.1. train observer track Fig. 5.1 The train sounds its horn continuously as it approaches the observer, from time t = 0 until it is well past the observer at time t = t2. The train passes the observer at time t = t1. The horn emits a sound wave of constant frequency fS. (a) On Fig. 5.2, sketch the variation of the frequency of sound heard by the observer with time t, from time t = 0 to t = t2. frequency fS 0 0 t1 t2 t Fig. 5.2 [1] (b) At a particular time, the sound waves at the observer have an intensity of 4.7 × 10⁻³ W m–2. The waves at the observer are incident at right angles on a circular detector of radius 2.8 cm. Calculate the power P of the waves incident on the detector. P = ..................................................... W [3] [Total: 4]
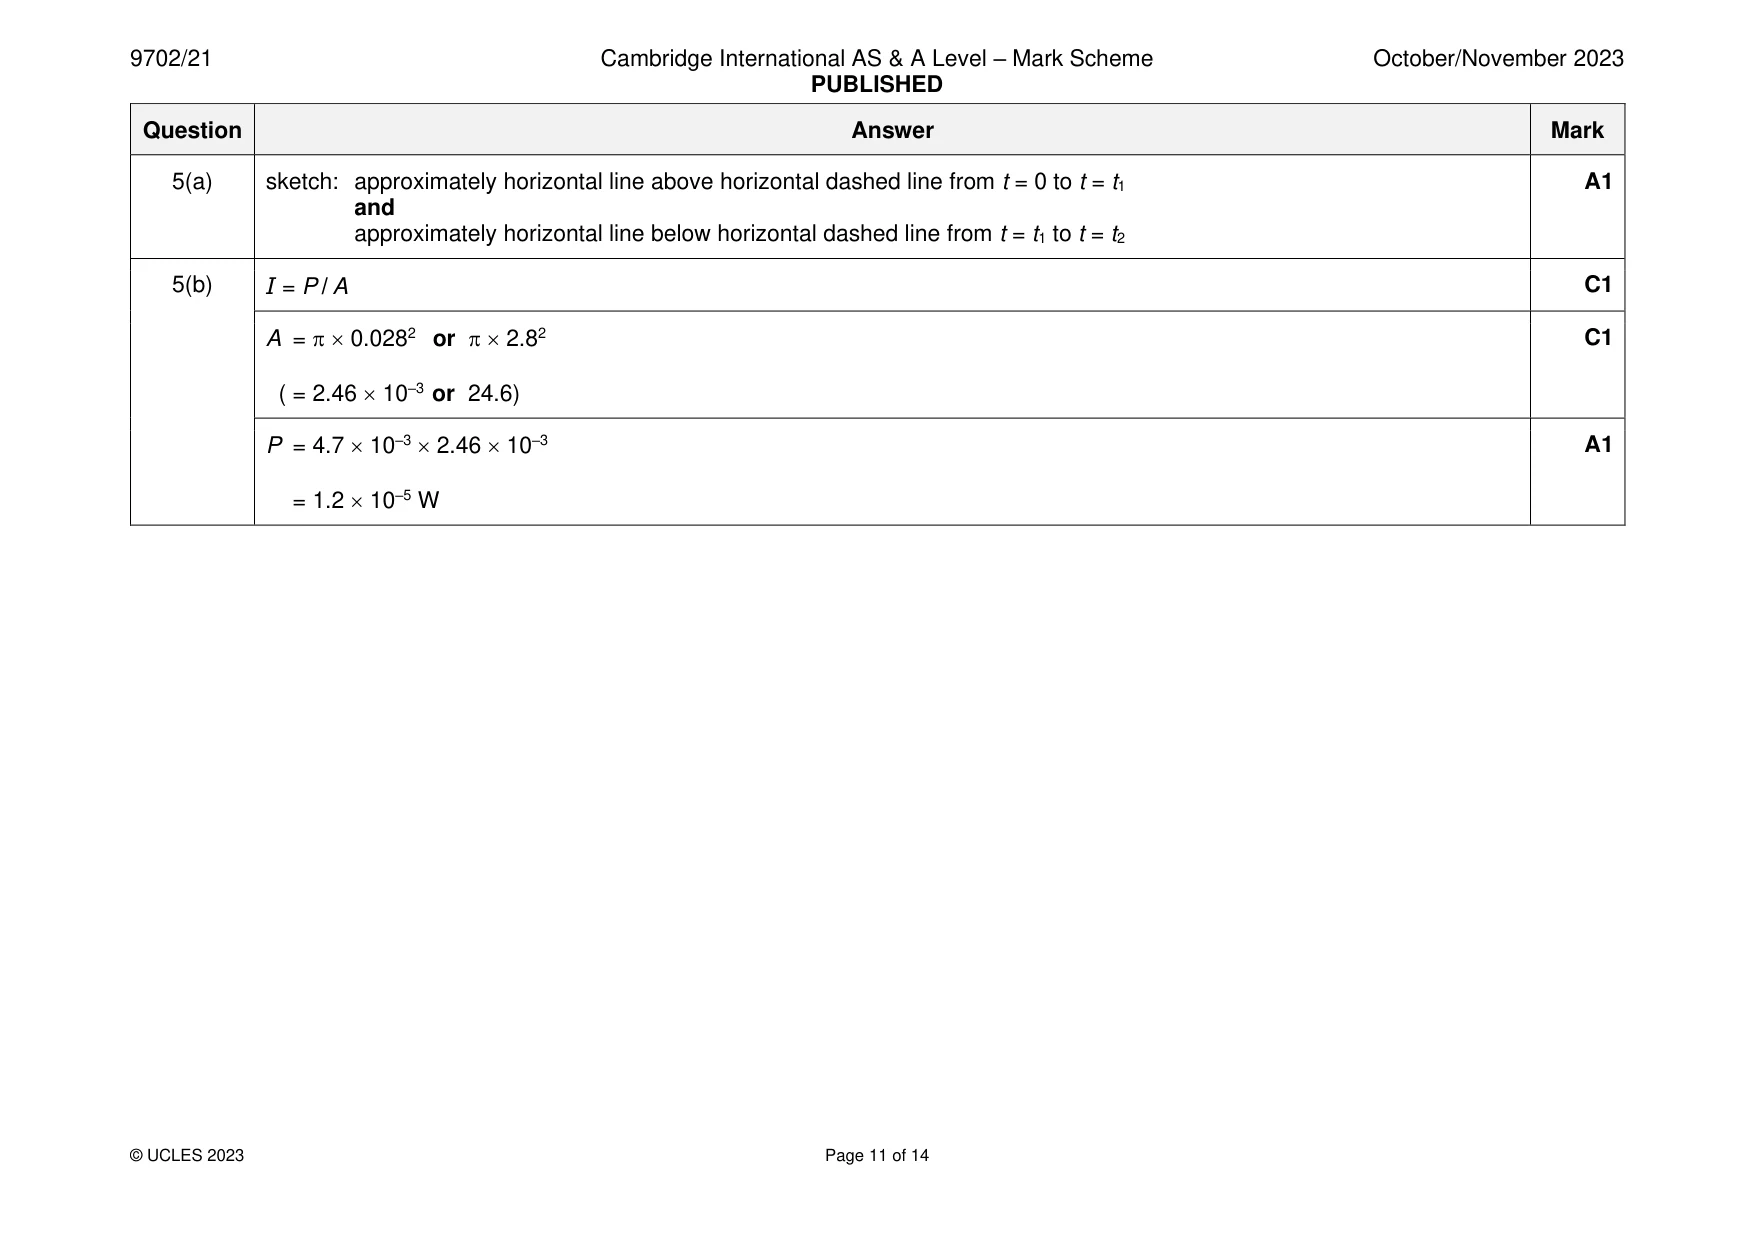
Mark scheme: 5(a) sketch: approximately horizontal line above horizontal dashed line from t = 0 to t = t1 A1 and approximately horizontal line below horizontal dashed line from t = t1 to t = t2 5(b) I = P / A C1 A = 0.0282 or 2.82 C1 ( = 2.46 10–3 or 24.6) P = 4.7 10–3 2.46 10–3 A1 = 1.2 10–5 W
Q6 · A battery is connected in a circuit with a light-dependent resistor (LDR), two fixed…
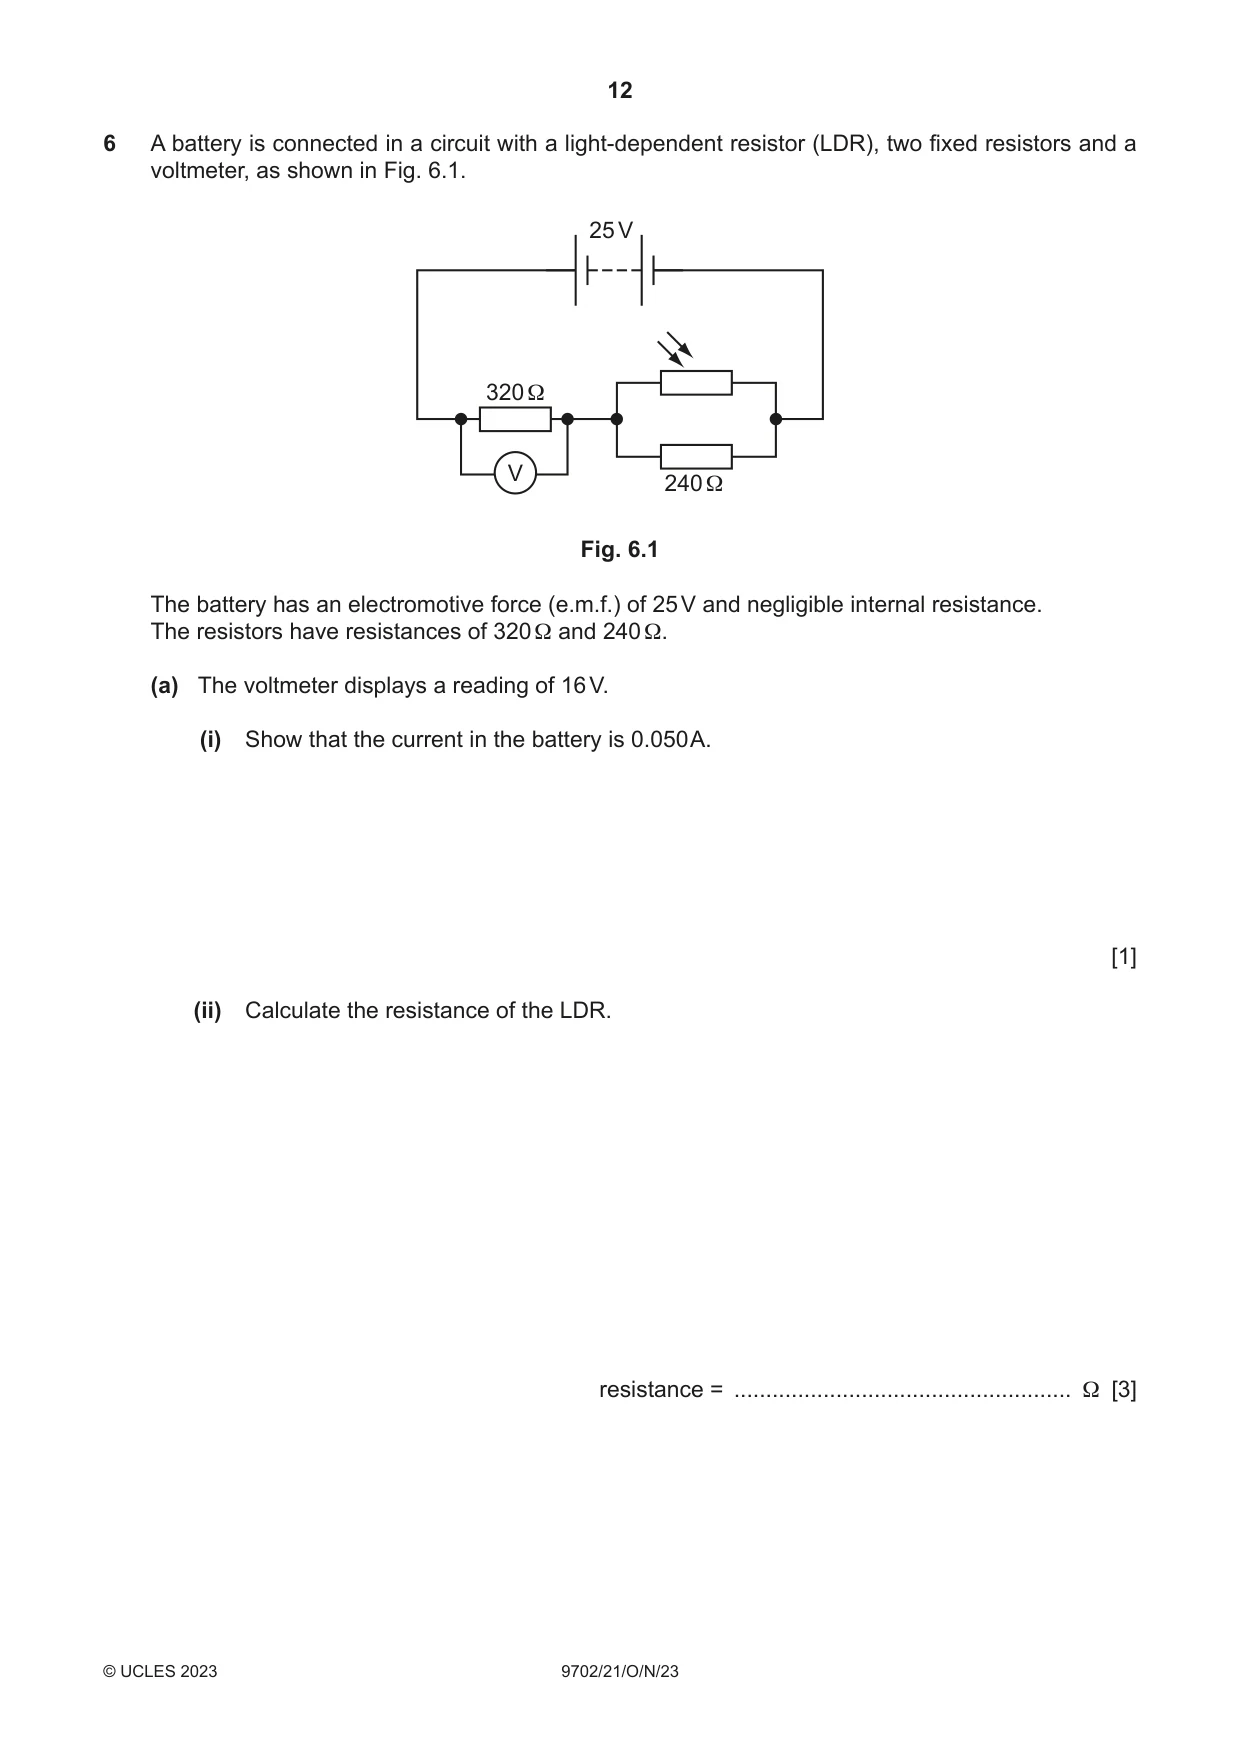
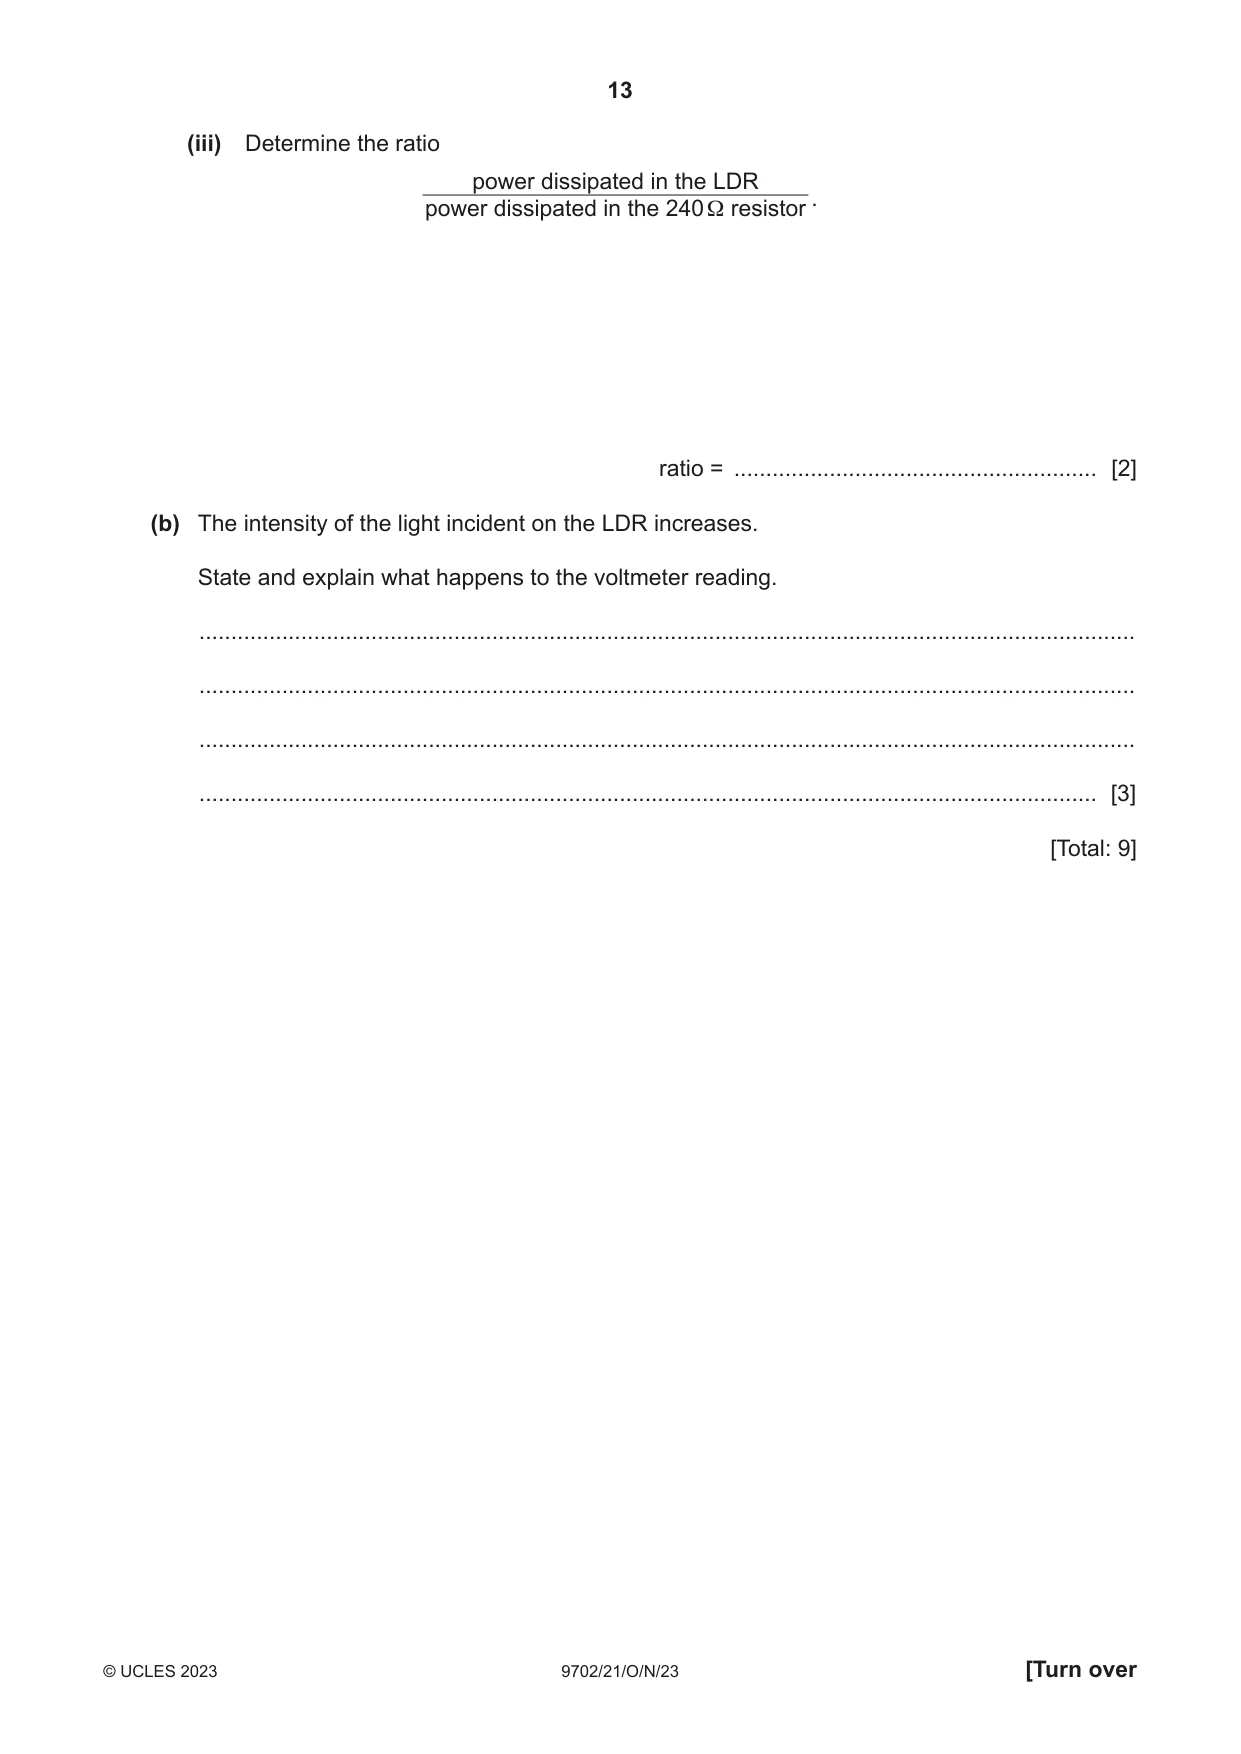
6 A battery is connected in a circuit with a light-dependent resistor (LDR), two fixed resistors and a voltmeter, as shown in Fig. 6.1. 25 V 320 Ω V 240 Ω Fig. 6.1 The battery has an electromotive force (e.m.f.) of 25 V and negligible internal resistance. The resistors have resistances of 320 Ω and 240 Ω. (a) The voltmeter displays a reading of 16 V. (i) Show that the current in the battery is 0.050 A. [1] (ii) Calculate the resistance of the LDR. resistance = ..................................................... Ω [3] (iii) Determine the ratio power dissipated in the LDR . power dissipated in the 240 Ω resistor ratio = ......................................................... [2] (b) The intensity of the light incident on the LDR increases. State and explain what happens to the voltmeter reading. ................................................................................................................................................... ................................................................................................................................................... ................................................................................................................................................... ............................................................................................................................................. [3] [Total: 9]
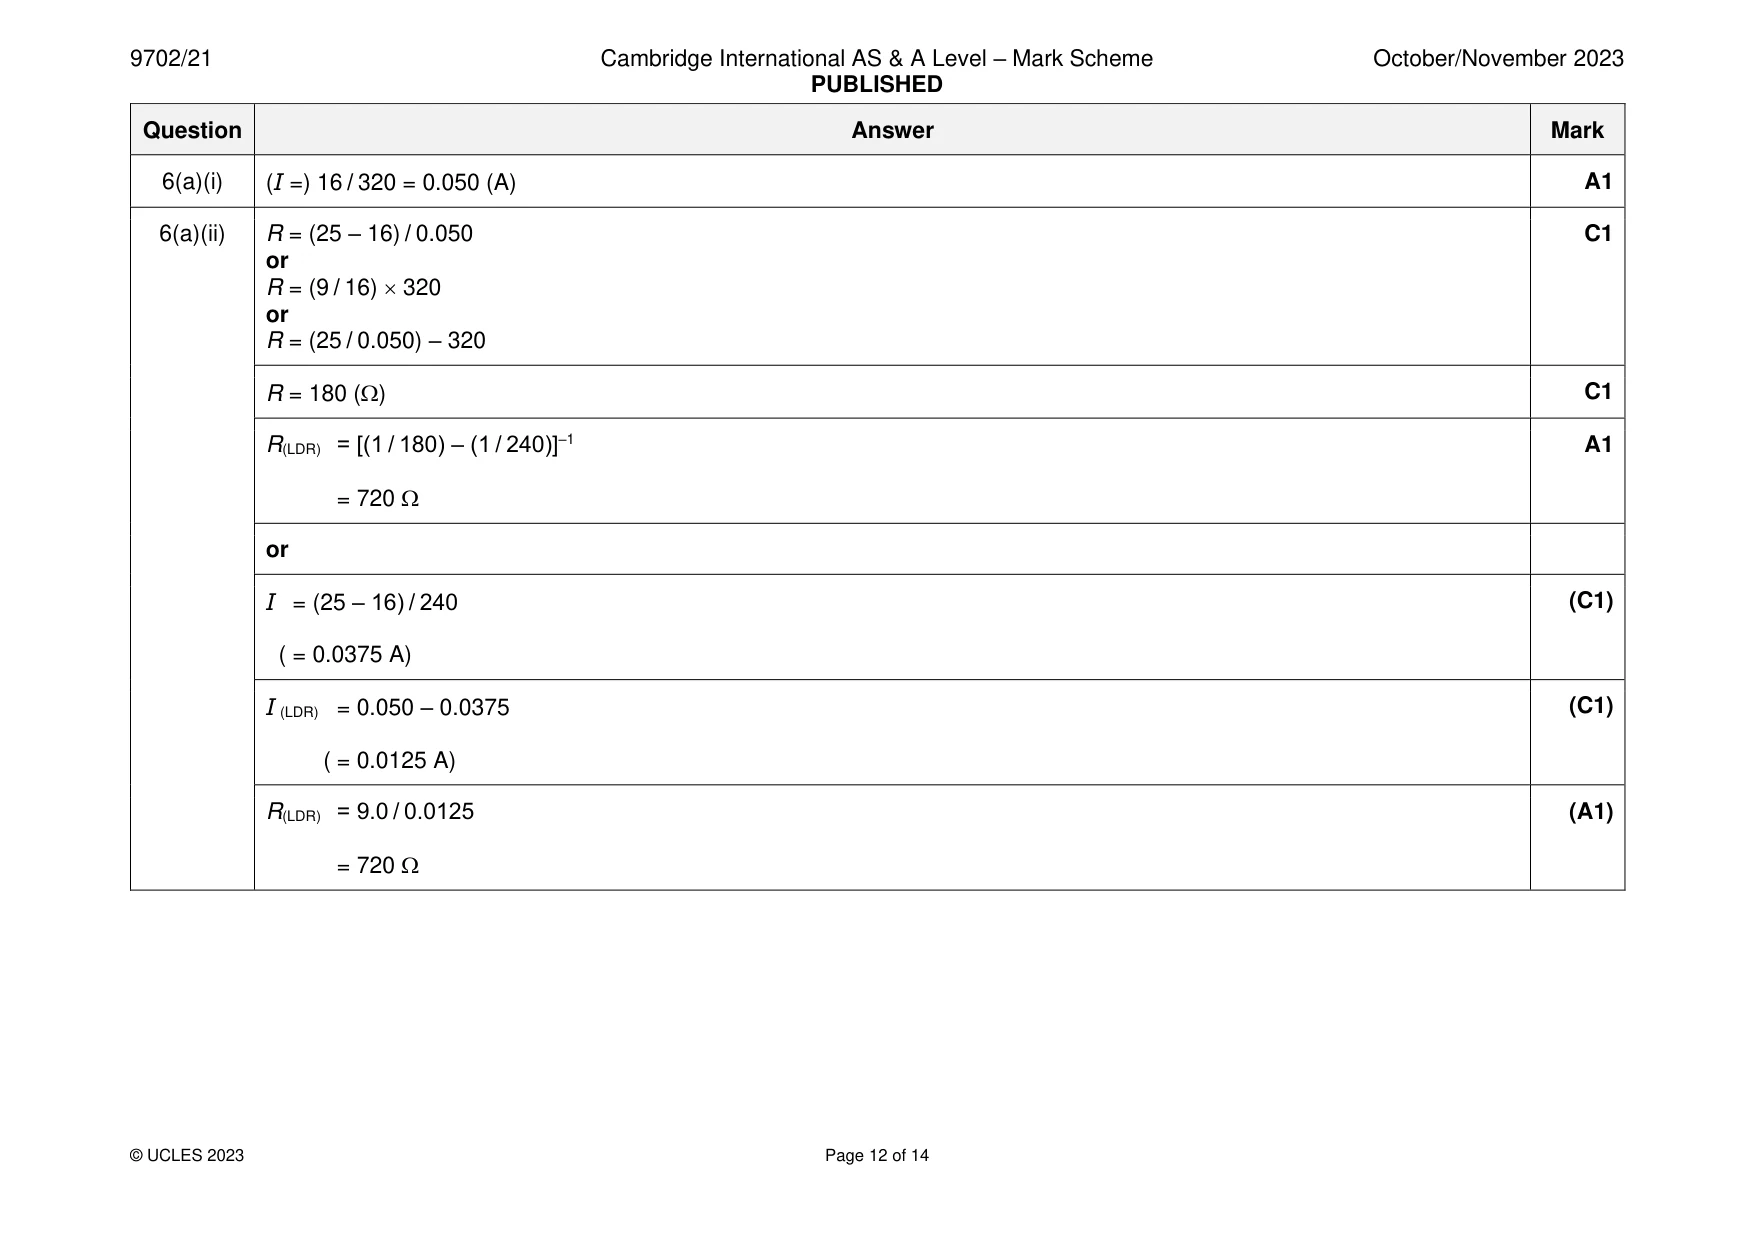
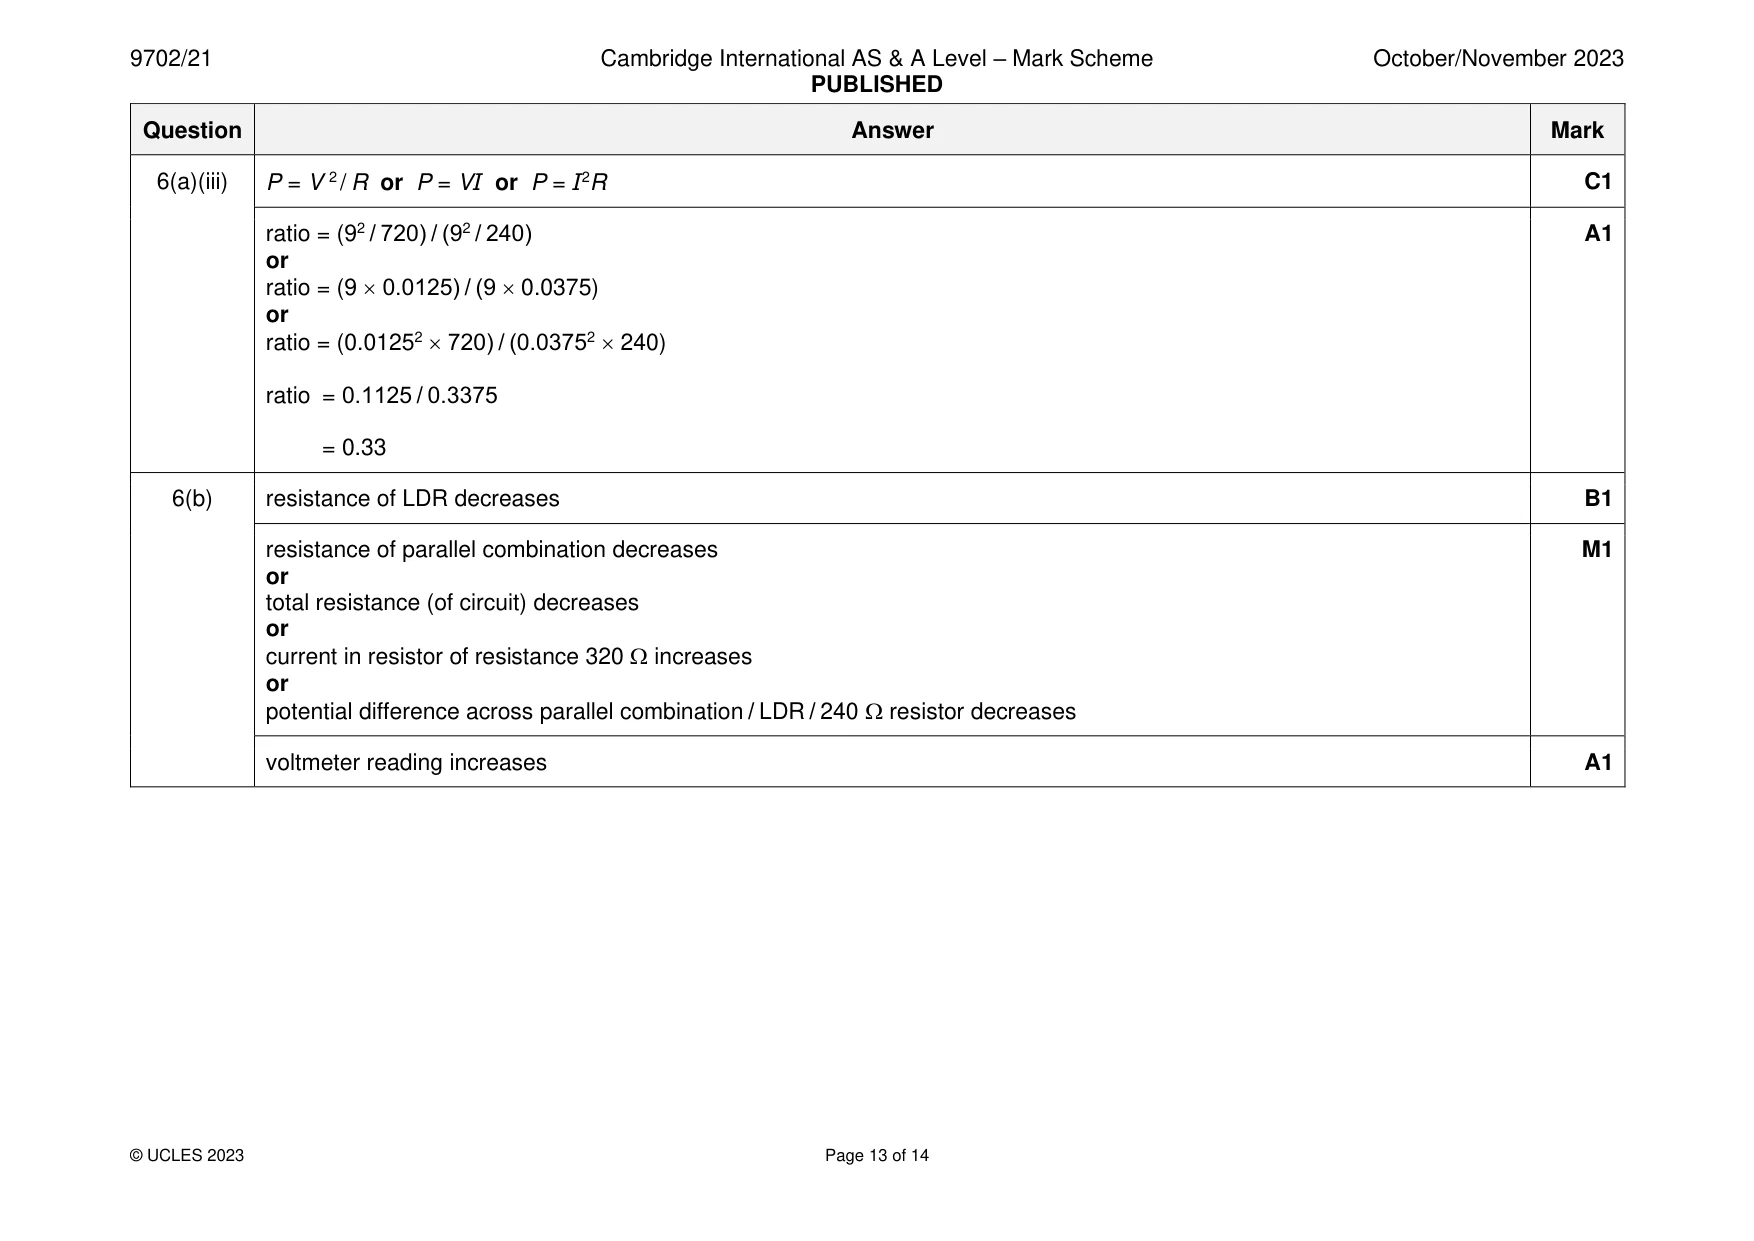
Mark scheme: 6(a)(i) (I =) 16 / 320 = 0.050 (A) A1 6(a)(ii) R = (25 – 16) / 0.050 C1 or R = (9 / 16) 320 or R = (25 / 0.050) – 320 R = 180 () C1 R(LDR) = [(1 / 180) – (1 / 240)]–1 A1 = 720 or I = (25 – 16) / 240 (C1) ( = 0.0375 A) I (LDR) = 0.050 – 0.0375 (C1) ( = 0.0125 A) R(LDR) = 9.0 / 0.0125 (A1) = 720 6(a)(iii) P = V 2 / R or P = VI or P = I2R C1 ratio = (92 / 720) / (92 / 240) A1 or ratio = (9 0.0125) / (9 0.0375) or ratio = (0.01252 720) / (0.03752 240) ratio = 0.1125 / 0.3375 = 0.33 6(b) resistance of LDR decreases B1 resistance of parallel combination decreases M1 or total resistance (of circuit) decreases or current in resistor of resistance 320 increases or potential difference across parallel combination / LDR / 240 resistor decreases voltmeter reading increases A1
Q7 · The results of the α-particle scattering experiment led to the development of the nuclear…
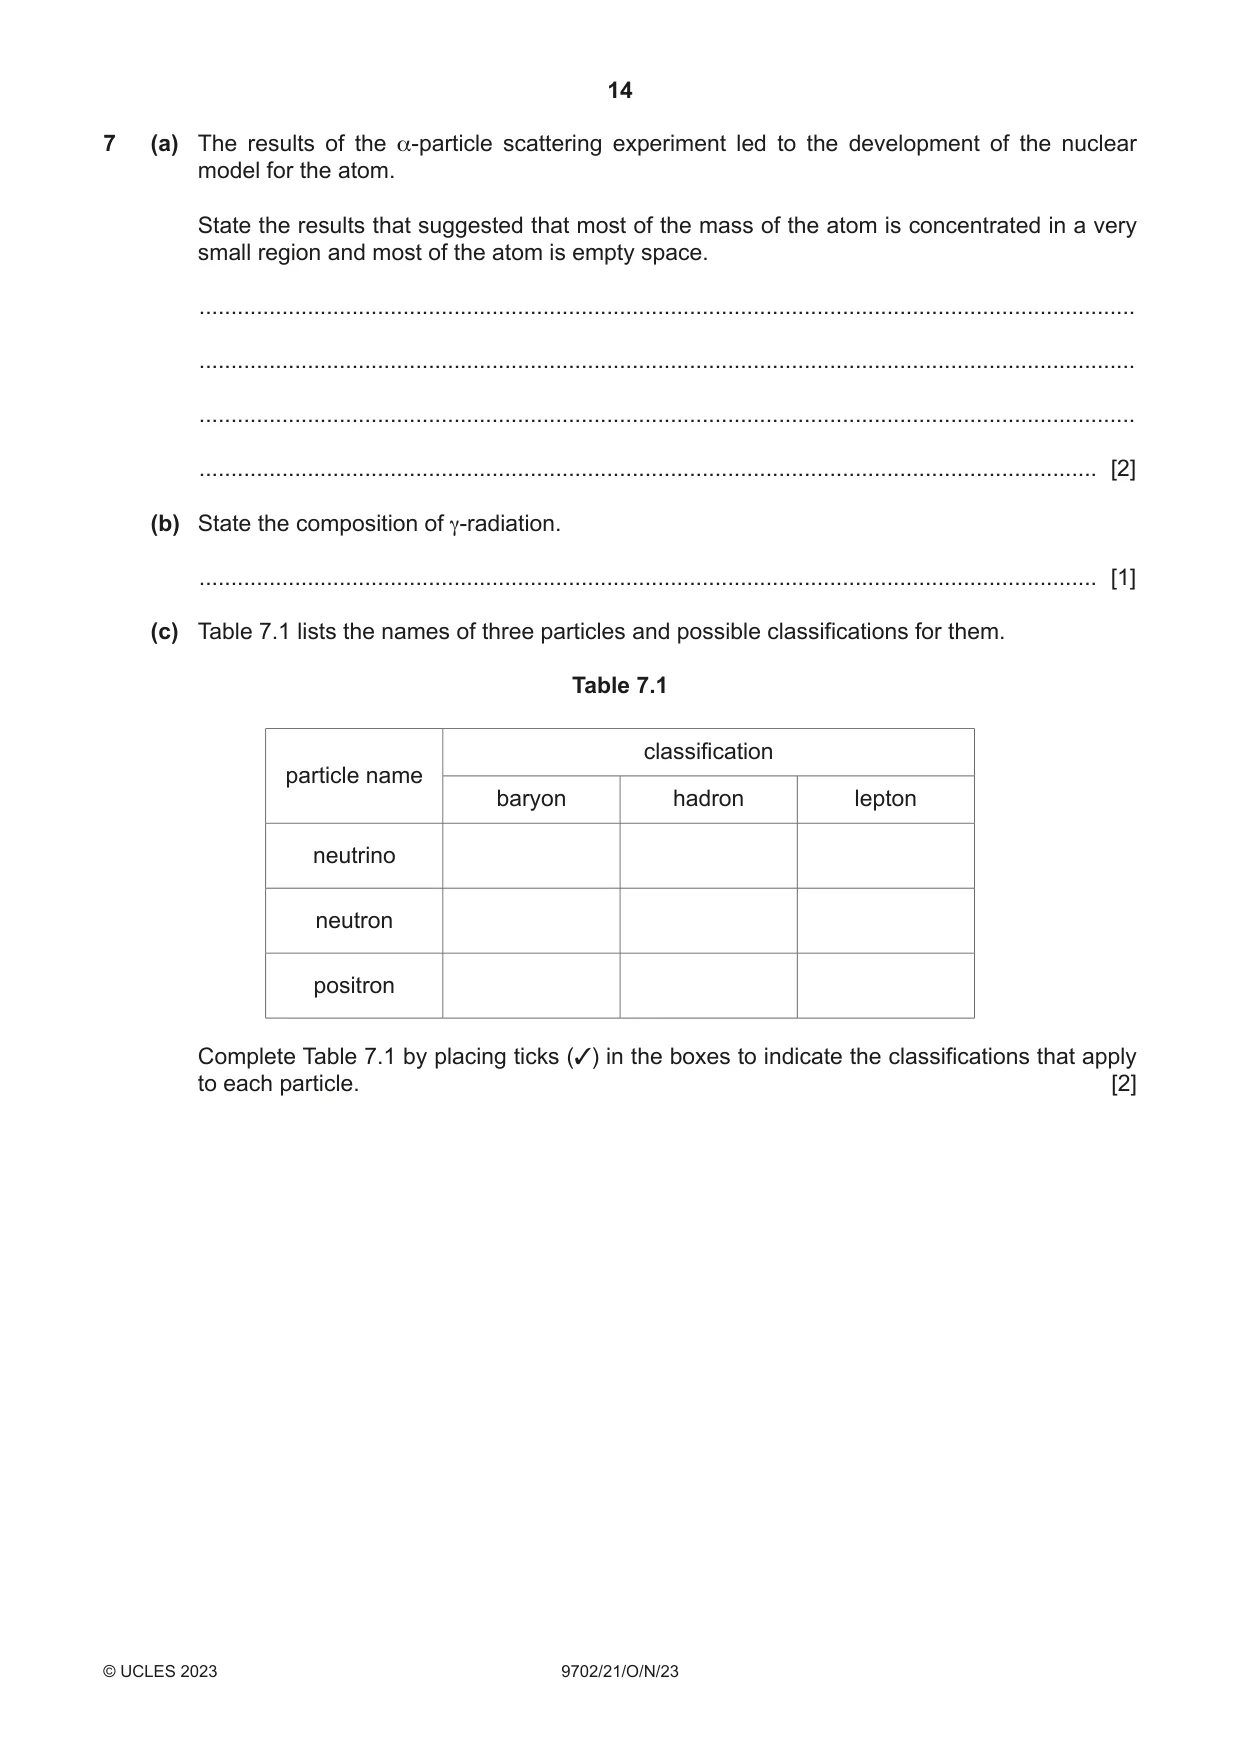
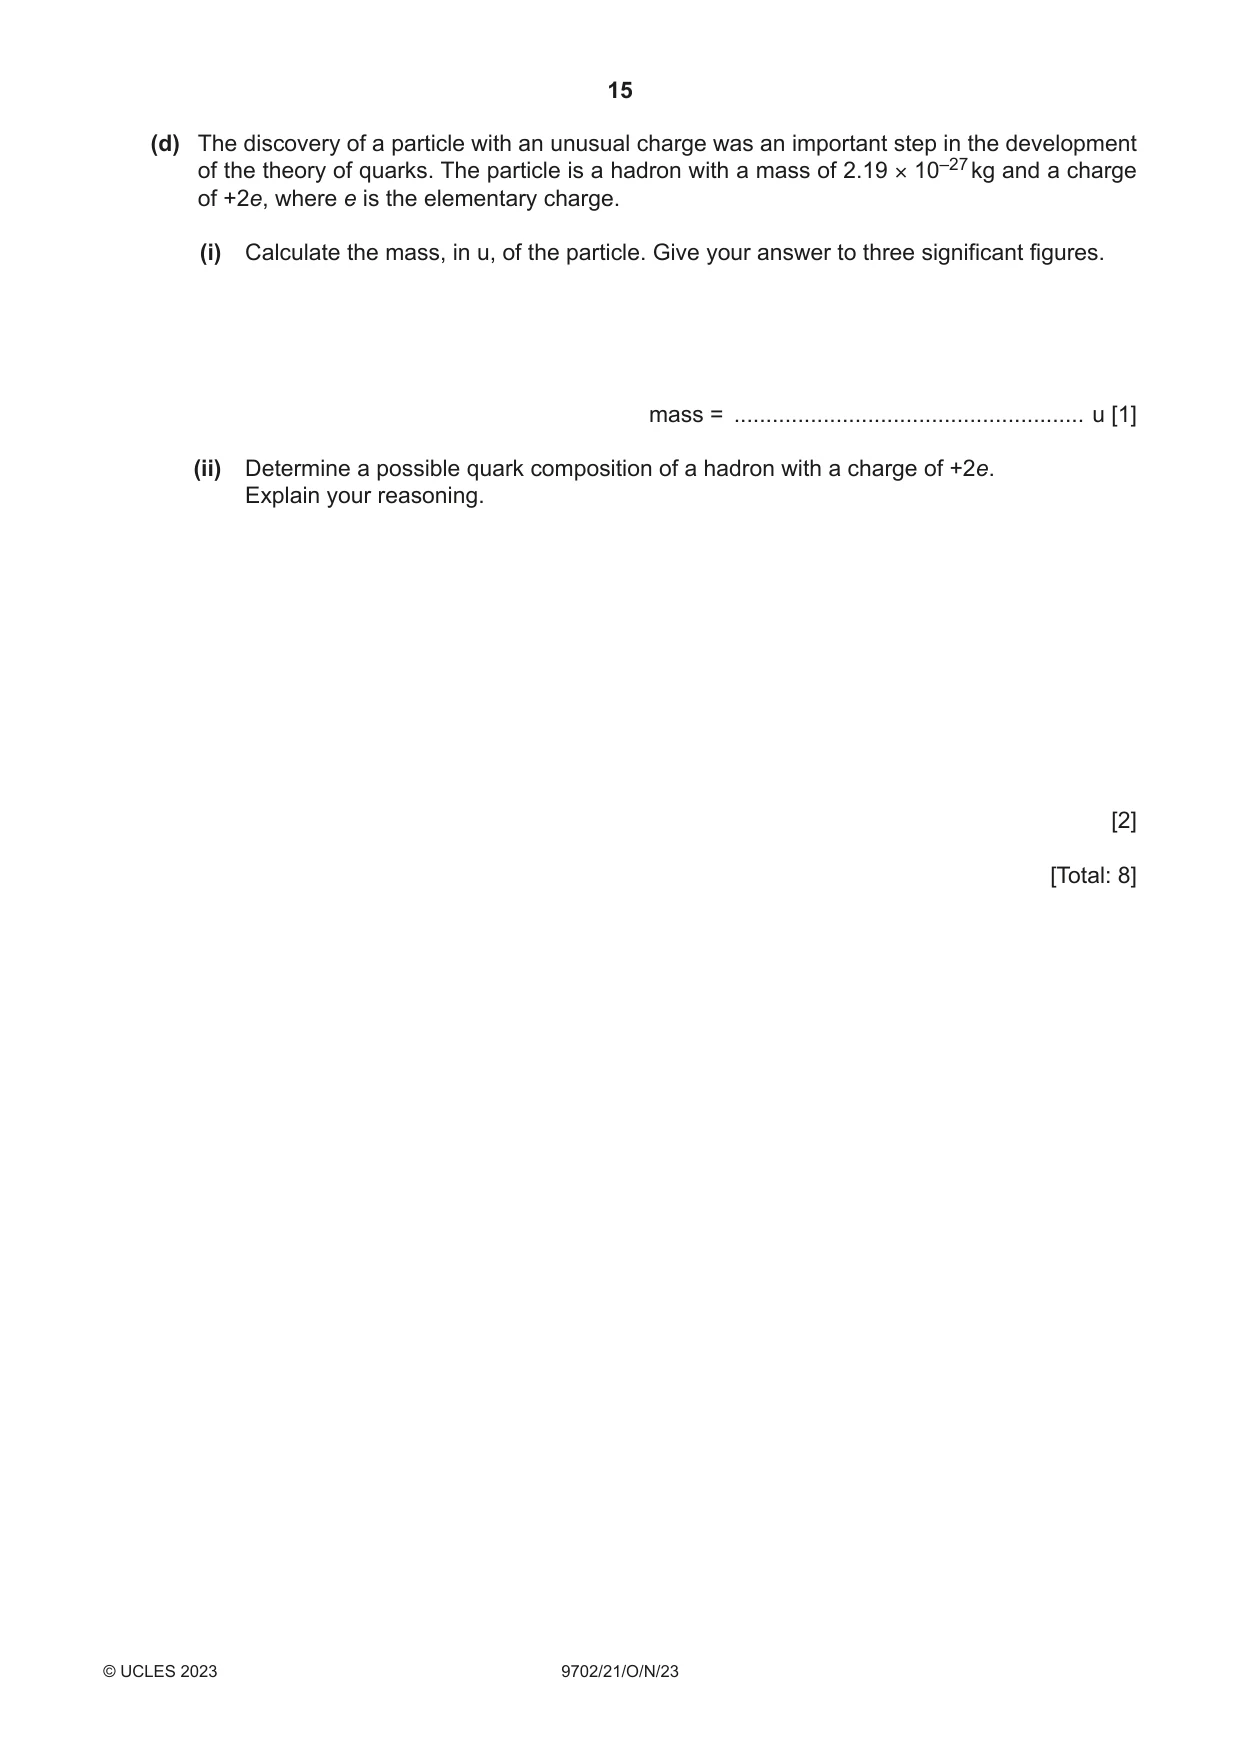
7 (a) The results of the α-particle scattering experiment led to the development of the nuclear model for the atom. State the results that suggested that most of the mass of the atom is concentrated in a very small region and most of the atom is empty space. ................................................................................................................................................... ................................................................................................................................................... ................................................................................................................................................... ............................................................................................................................................. [2] (b) State the composition of γ-radiation. ............................................................................................................................................. [1] (c) Table 7.1 lists the names of three particles and possible classifications for them. Table 7.1 classification particle name baryon hadron lepton neutrino neutron positron Complete Table 7.1 by placing ticks (3) in the boxes to indicate the classifications that apply to each particle. [2] (d) The discovery of a particle with an unusual charge was an important step in the development of the theory of quarks. The particle is a hadron with a mass of 2.19 × 10⁻²⁷ kg and a charge of +2e, where e is the elementary charge. (i) Calculate the mass, in u, of the particle. Give your answer to three significant figures. mass = ....................................................... u [1] (ii) Determine a possible quark composition of a hadron with a charge of +2e. Explain your reasoning. [2] [Total: 8]
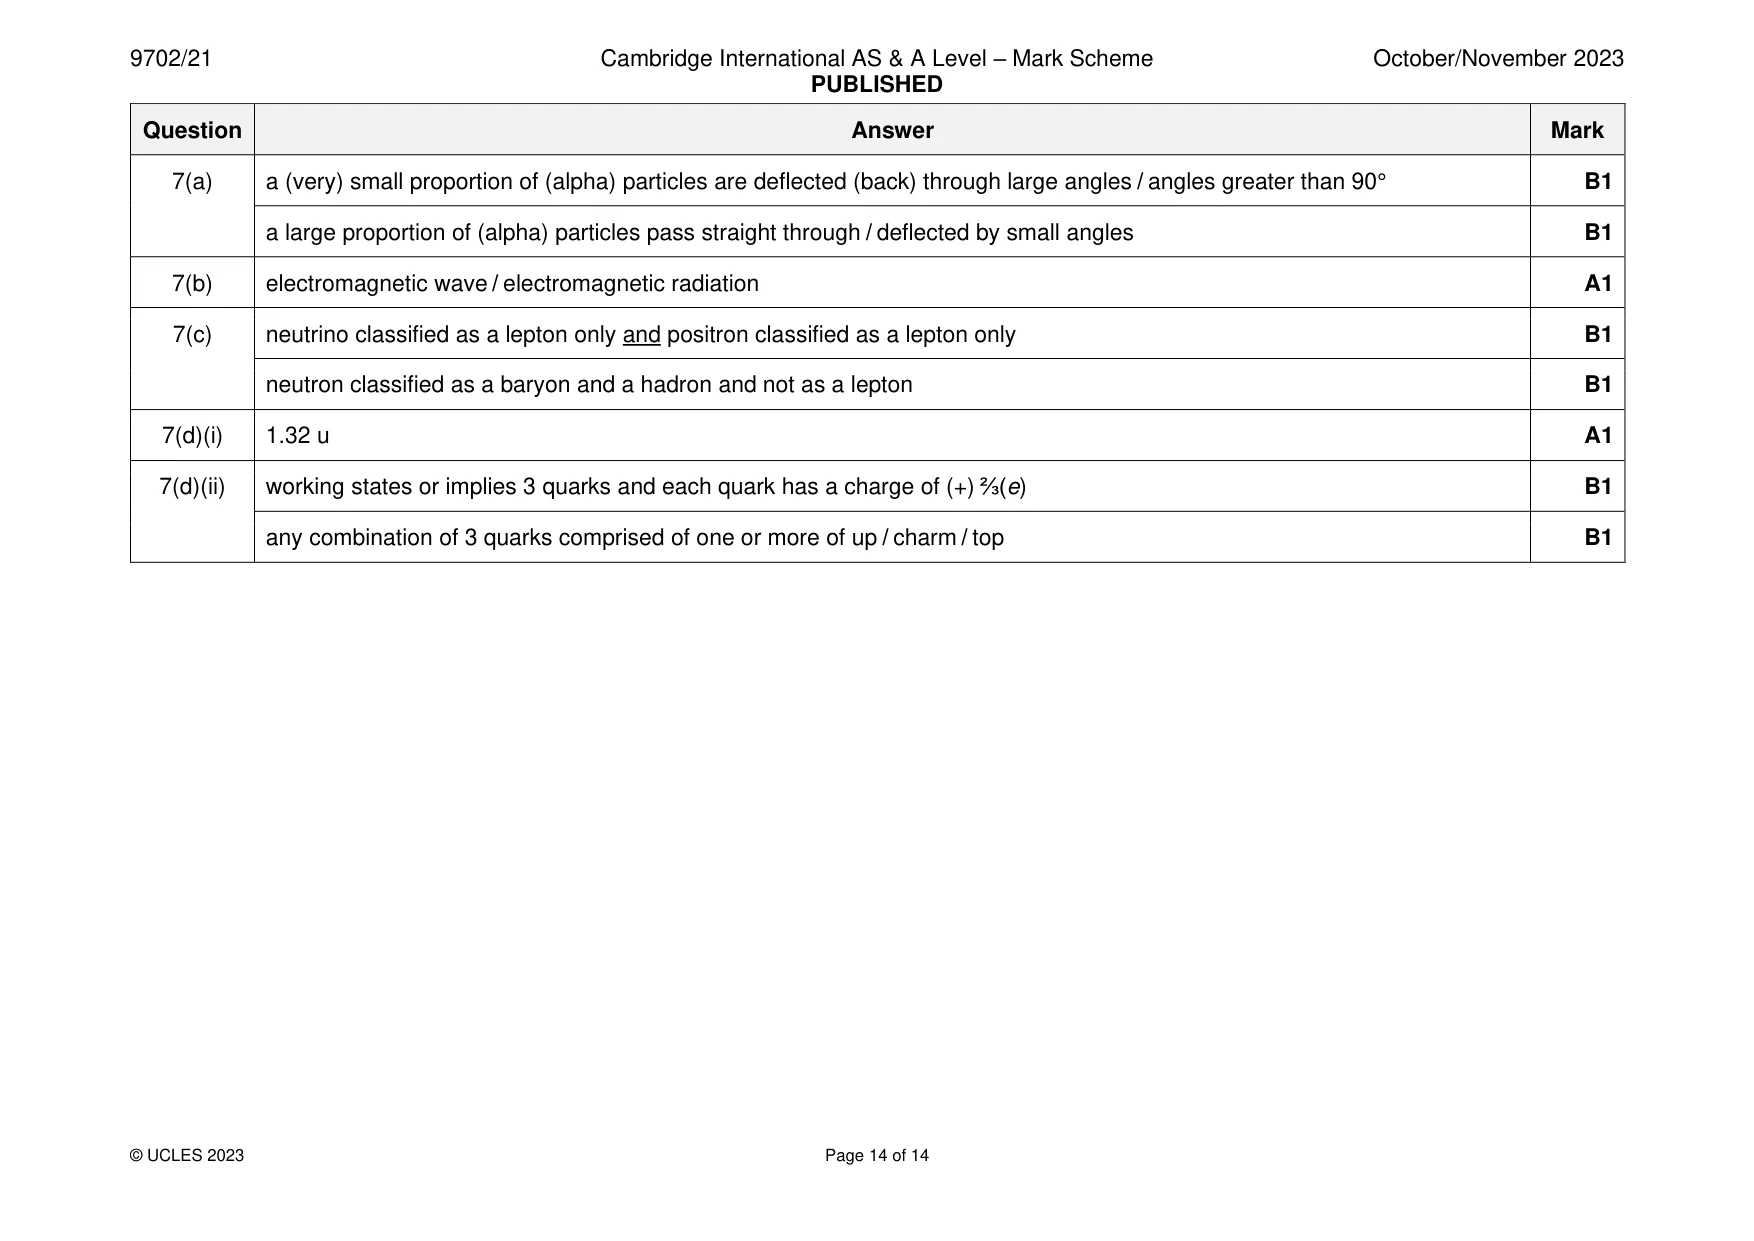
Mark scheme: 7(a) a (very) small proportion of (alpha) particles are deflected (back) through large angles / angles greater than 90° B1 a large proportion of (alpha) particles pass straight through / deflected by small angles B1 7(b) electromagnetic wave / electromagnetic radiation A1 7(c) neutrino classified as a lepton only and positron classified as a lepton only B1 neutron classified as a baryon and a hadron and not as a lepton B1 7(d)(i) 1.32 u A1 7(d)(ii) working states or implies 3 quarks and each quark has a charge of (+) ⅔(e) B1 any combination of 3 quarks comprised of one or more of up / charm / top B1
What was in this paper
The subtopics covered by these 7 questions, and how many questions each got. Open one in a new tab to see every Cambridge question on it.
What you needed in this session
Cambridge’s own grade thresholds for 2023 Oct/Nov, Paper 2 · Variant 1. A higher threshold means an easier paper — the bar moves with how the cohort did.