Cambridge A Level Physics 9702 — 2015 Oct/Nov Paper 2 · Variant 2
9702/22/O/N/15 · 8 questions · 60 marks · ≈68 min
The question paper and its mark scheme, free to read here and free to download. This is Cambridge’s own paper, exactly as it was sat.
Question paper16 pages
Mark scheme5 pages
Answers below. Sit the paper first if you are practising.
Questions as text
Q1 · The frequency of an X-ray wave is 4.6 × 10²⁰ Hz
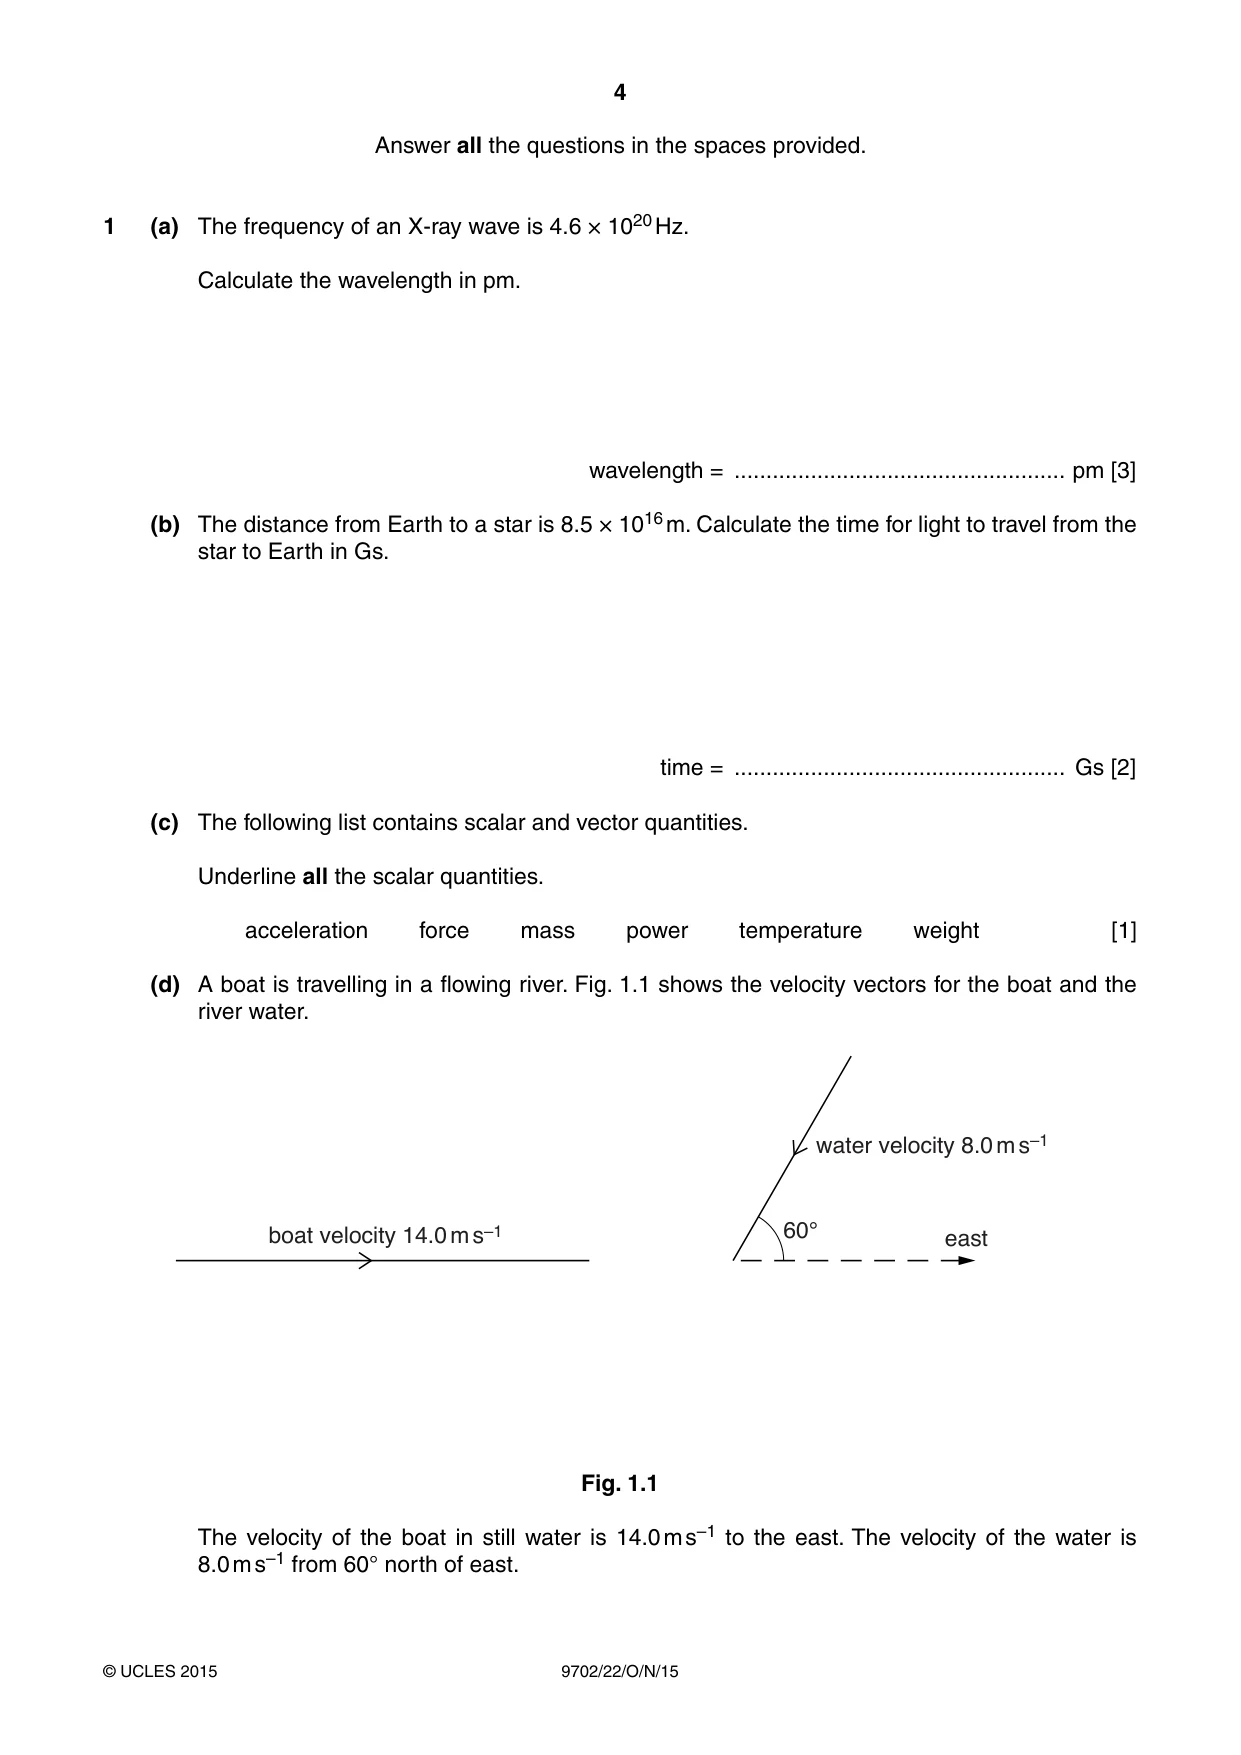
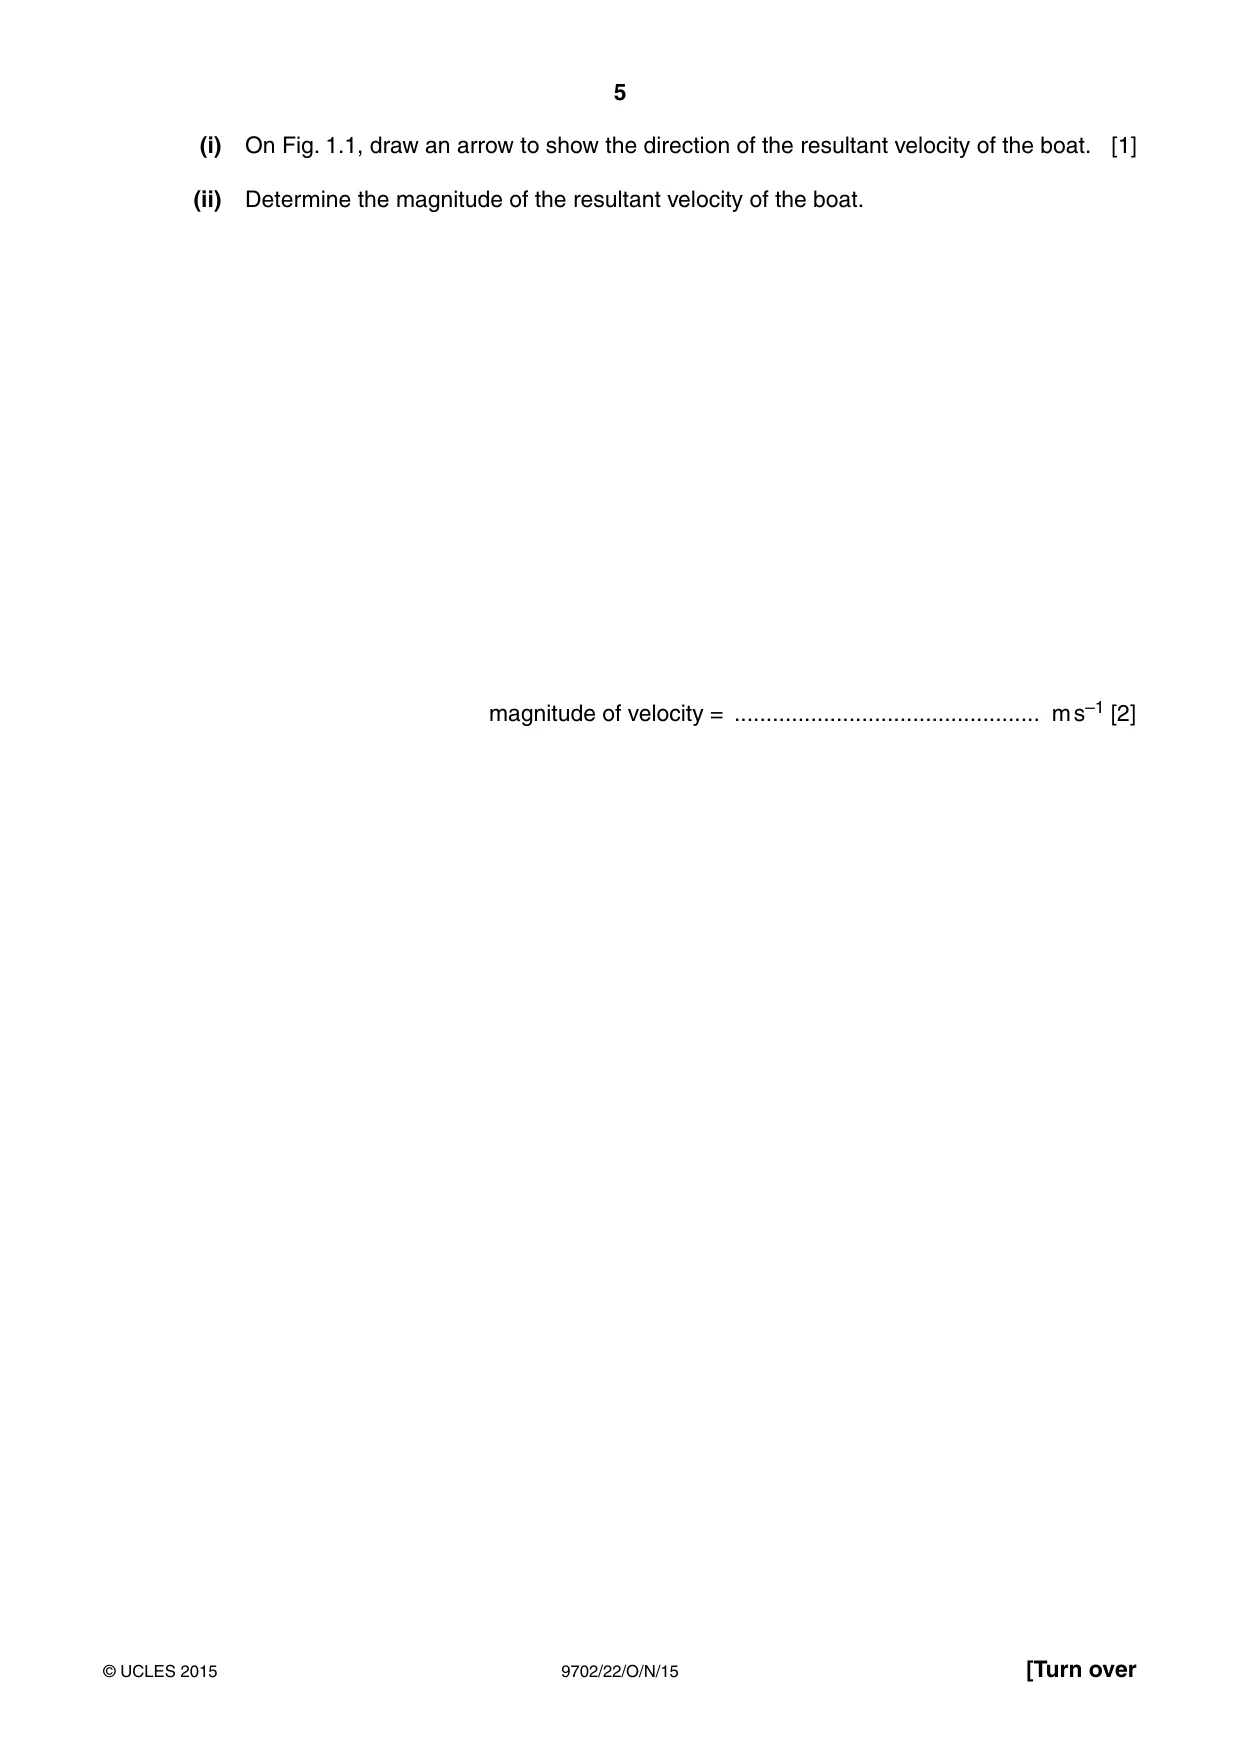
1 (a) The frequency of an X-ray wave is 4.6 × 10²⁰ Hz. Calculate the wavelength in pm. wavelength = .................................................... pm [3] (b) The distance from Earth to a star is 8.5 × 10¹⁶ m. Calculate the time for light to travel from the star to Earth in Gs. time = .................................................... Gs [2] (c) The following list contains scalar and vector quantities. Underline all the scalar quantities. acceleration force mass power temperature weight [1] (d) A boat is travelling in a flowing river. Fig. 1.1 shows the velocity vectors for the boat and the river water. water velocity 8.0 m s–1 boat velocity 14.0 m s–1 60° east Fig. 1.1 The velocity of the boat in still water is 14.0 m s–1 to the east. The velocity of the water is 8.0 m s–1 from 60° north of east. (i) On Fig. 1.1, draw an arrow to show the direction of the resultant velocity of the boat. [1] (ii) Determine the magnitude of the resultant velocity of the boat. magnitude of velocity = ................................................ m s–1 [2]
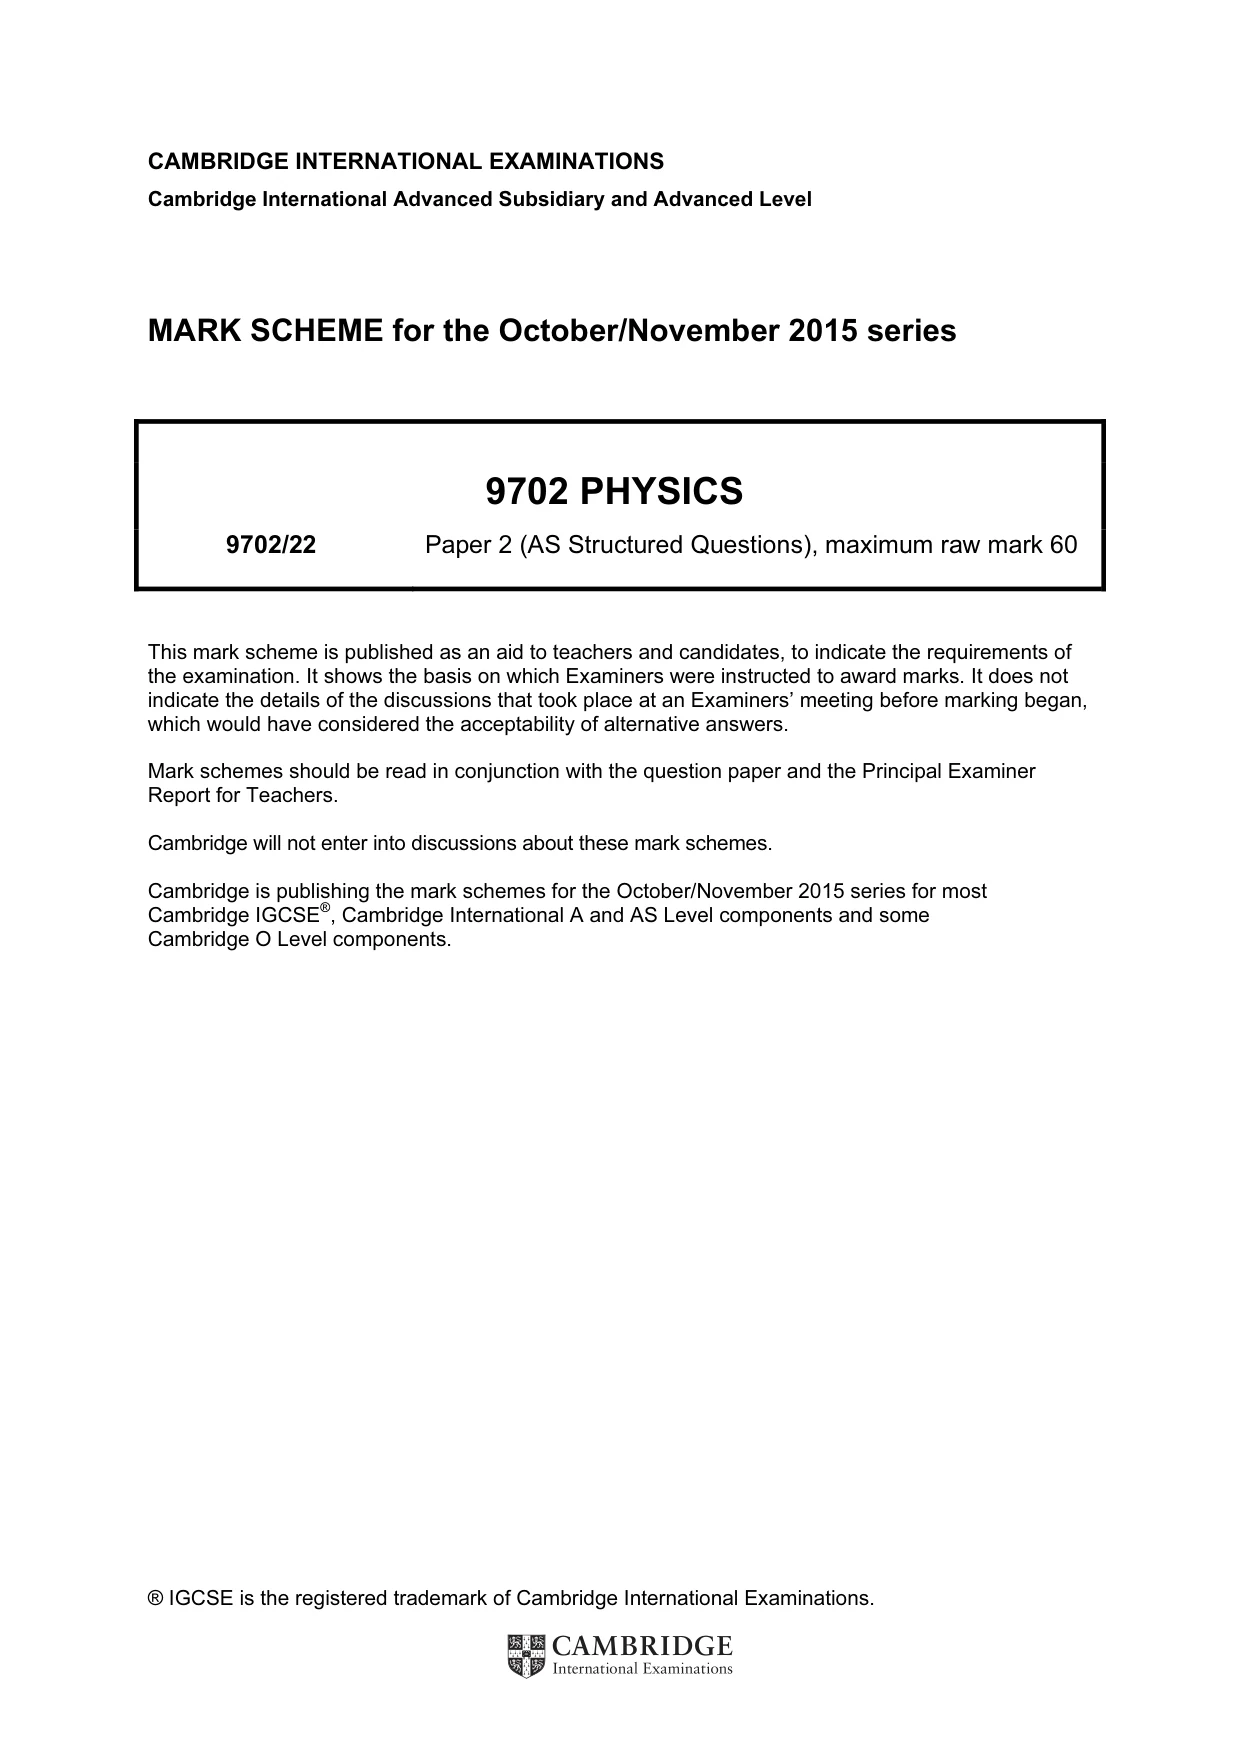
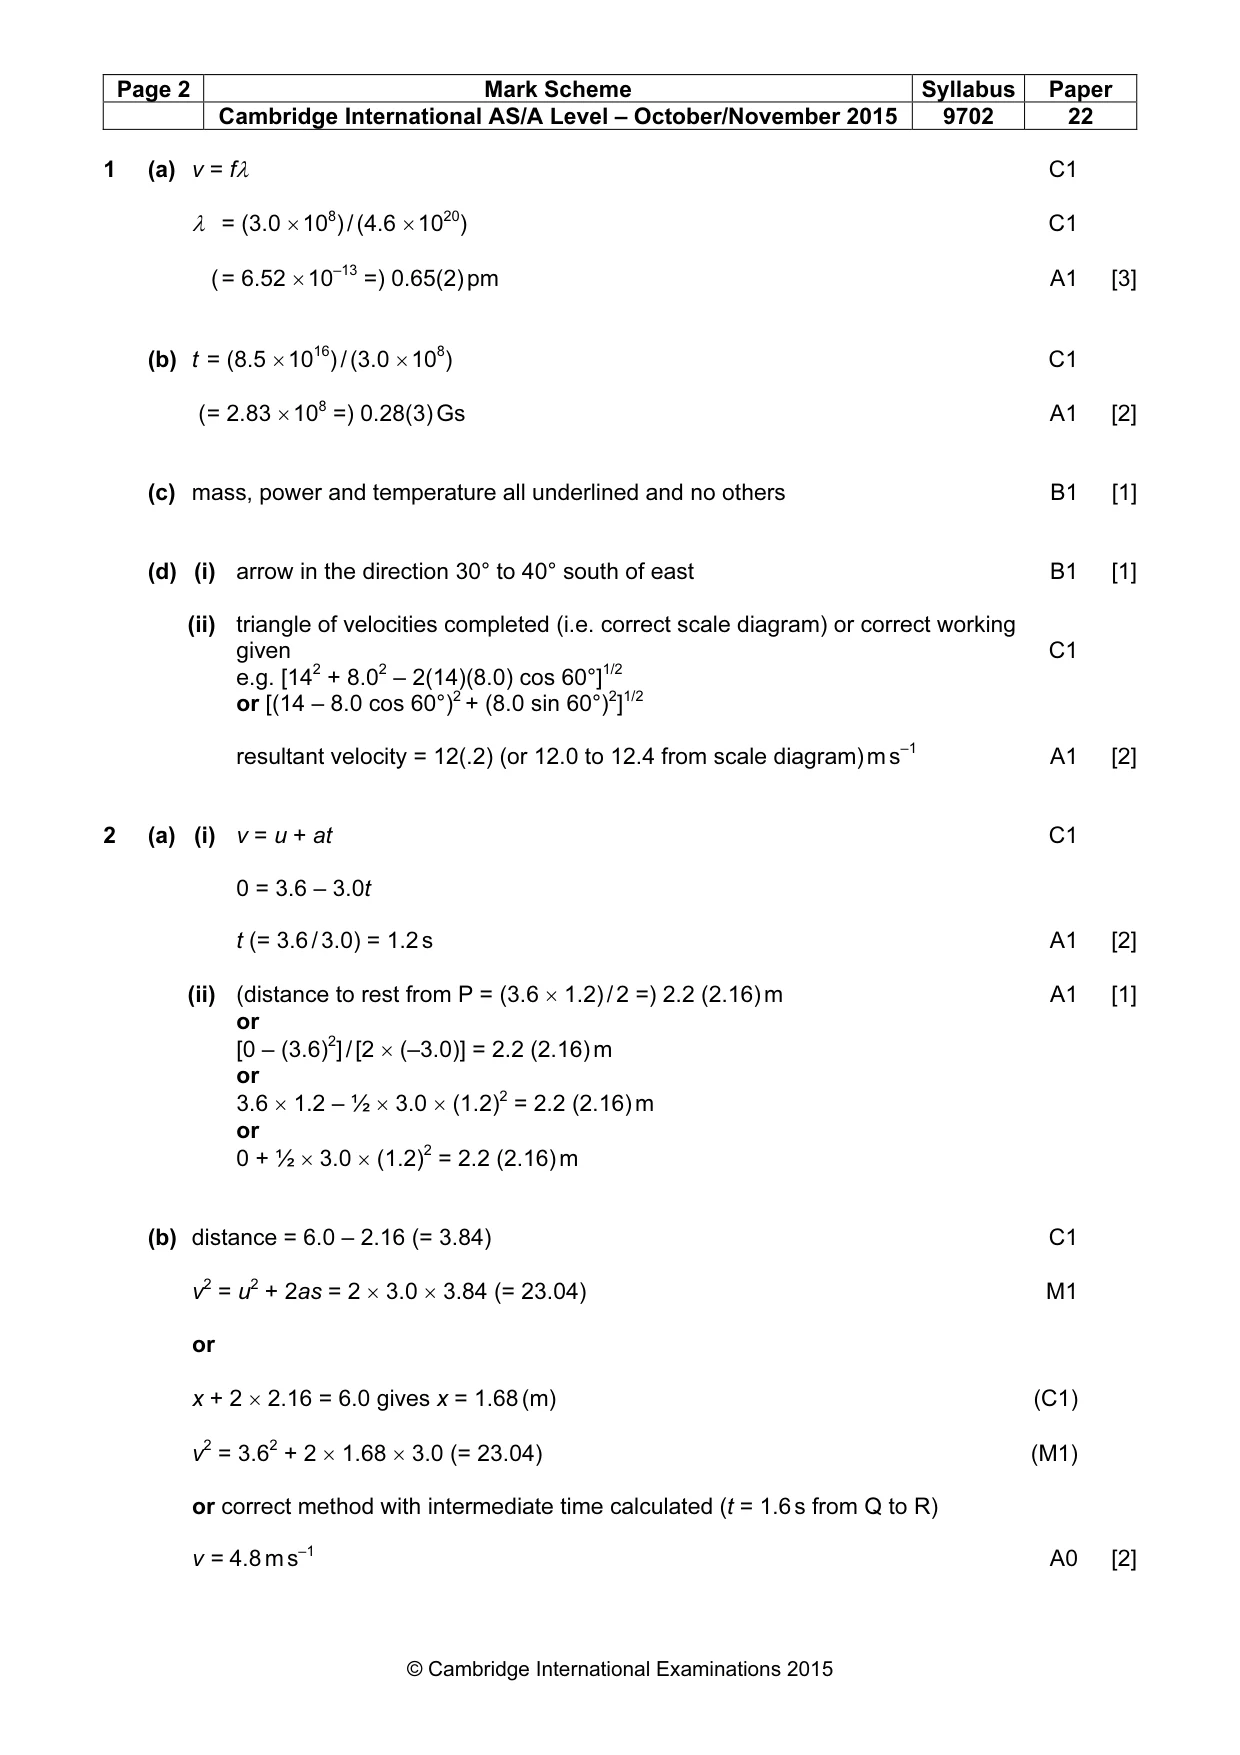
Mark scheme: 1 (a) v = fλ C1 λ = (3.0 × 10⁸) / (4.6 × 10²⁰) C1 ( = 6.52 × 10–13 =) 0.65(2) pm A1 [3] (b) t = (8.5 × 10¹⁶) / (3.0 × 10⁸) C1 ( = 2.83 × 108 =) 0.28(3) Gs A1 [2] (c) mass, power and temperature all underlined and no others B1 [1] (d) (i) arrow in the direction 30° to 40° south of east B1 [1] (ii) triangle of velocities completed (i.e. correct scale diagram) or correct working given C1 e.g. [142 + 8.02 – 2(14)(8.0) cos 60°]1/2 or [(14 – 8.0 cos 60°)2 + (8.0 sin 60°)2]1/2 resultant velocity = 12(.2) (or 12.0 to 12.4 from scale diagram) m s–1 A1 [2]
Q2 · An object M on a slope
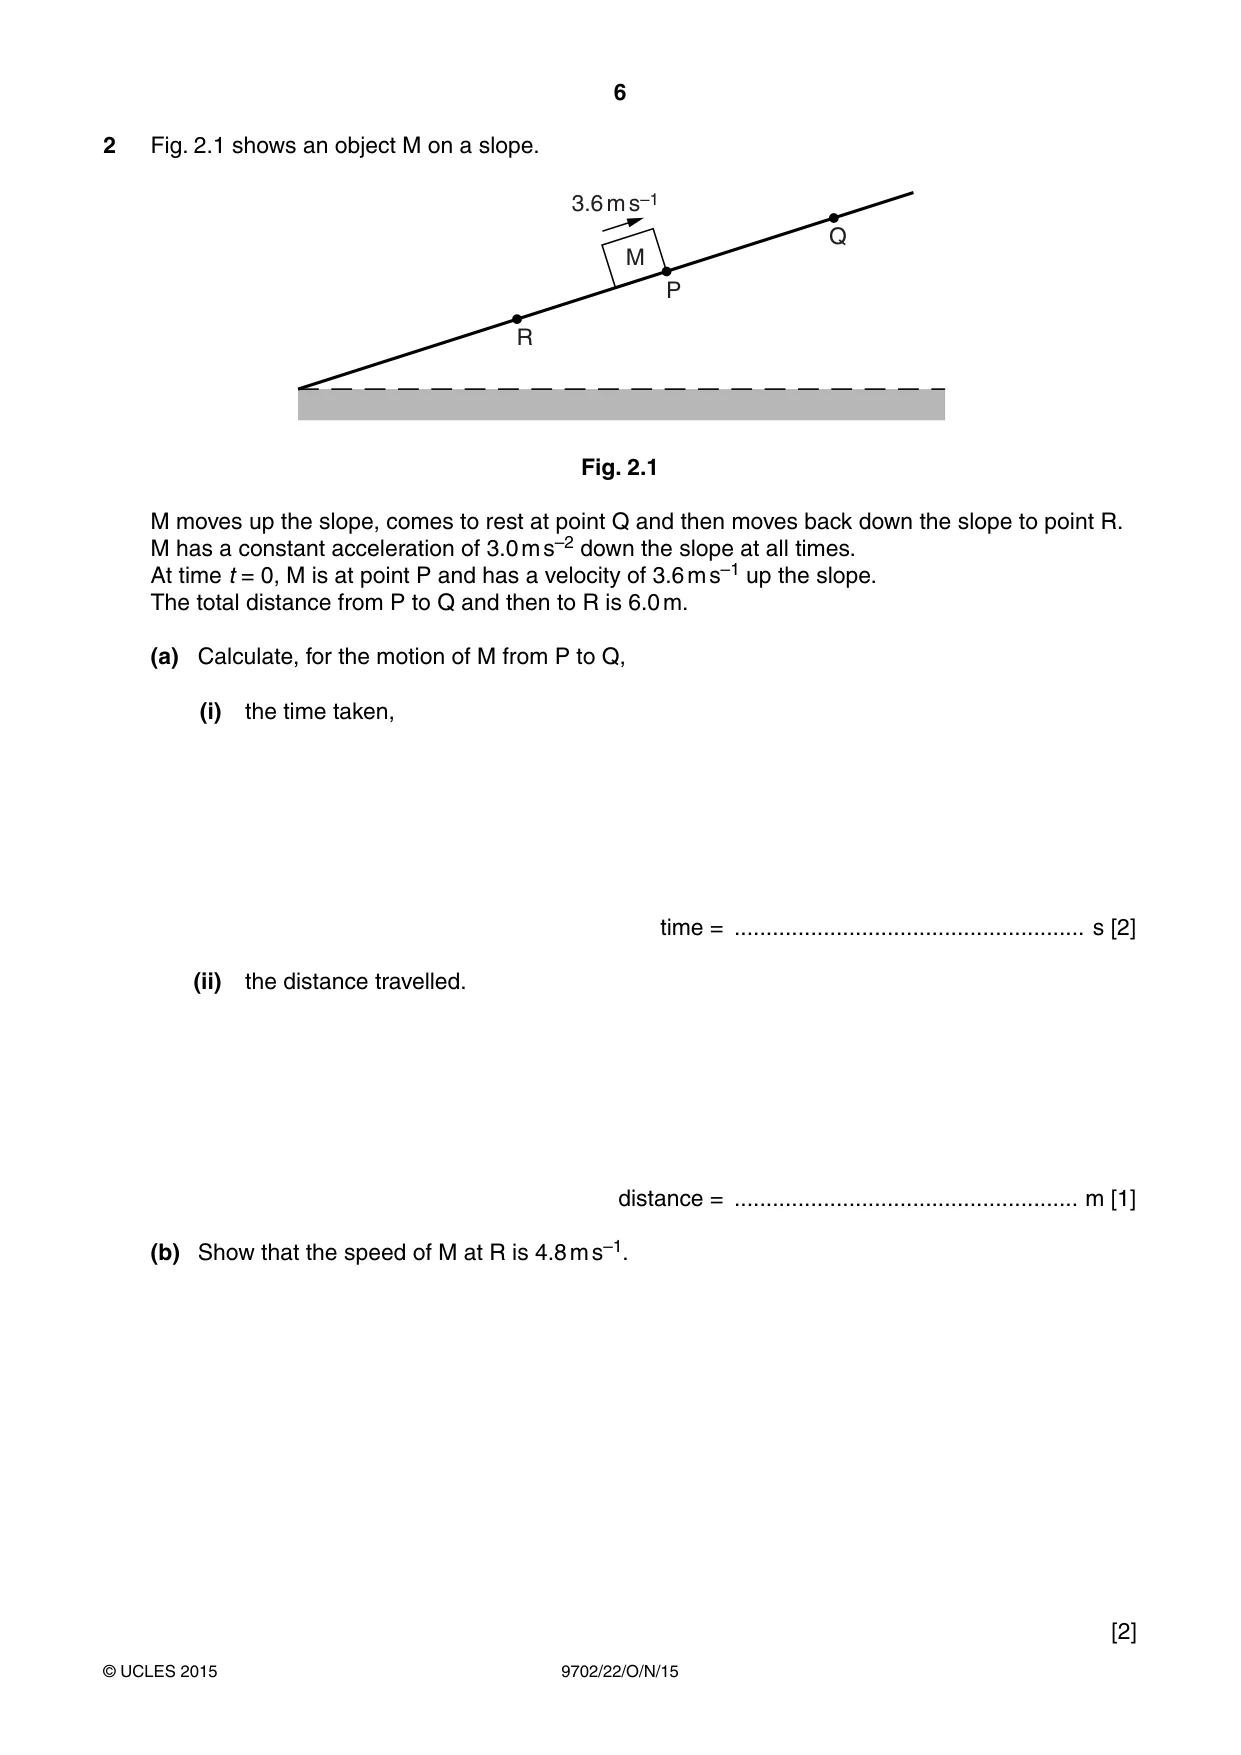
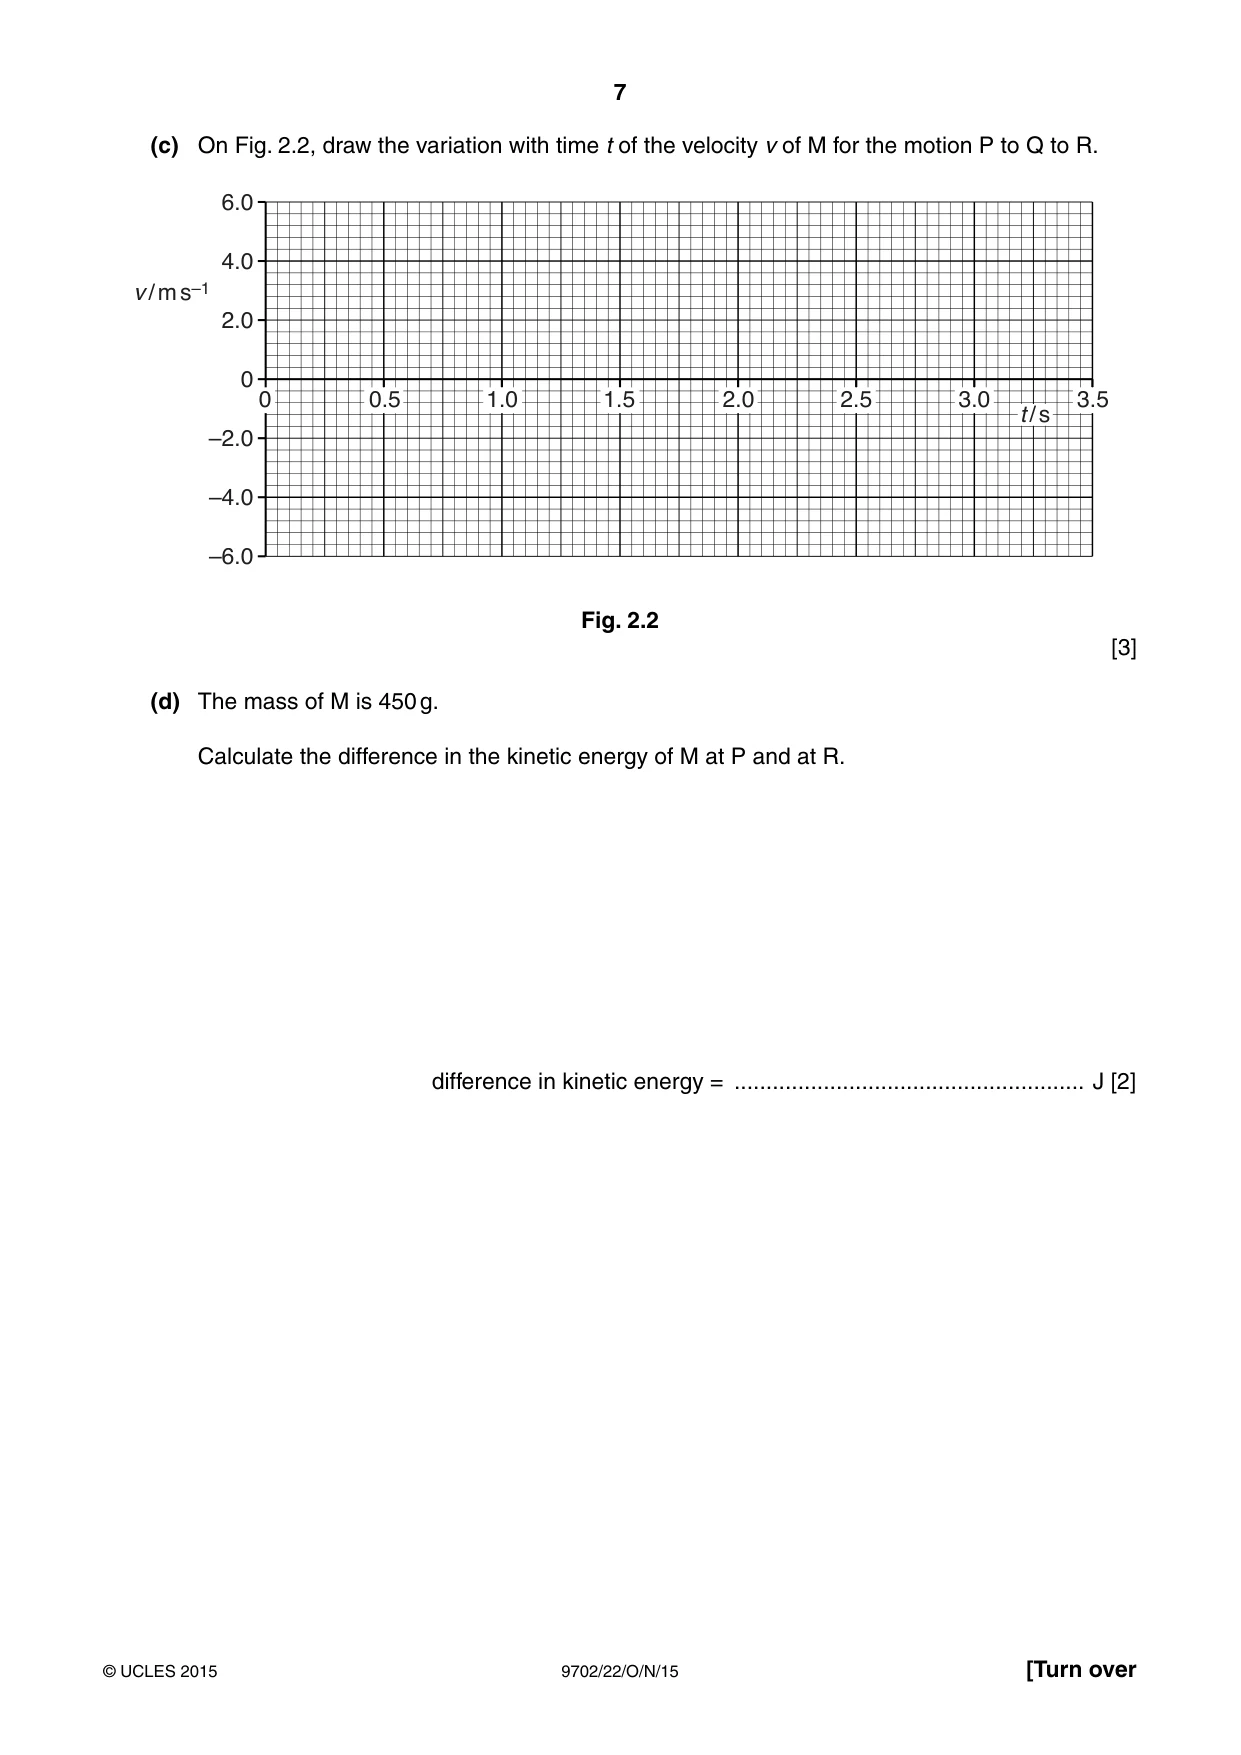
2 Fig. 2.1 shows an object M on a slope. 3.6 m s–1 Q M P R Fig. 2.1 M moves up the slope, comes to rest at point Q and then moves back down the slope to point R. M has a constant acceleration of 3.0 m s–2 down the slope at all times. At time t = 0, M is at point P and has a velocity of 3.6 m s–1 up the slope. The total distance from P to Q and then to R is 6.0 m. (a) Calculate, for the motion of M from P to Q, (i) the time taken, time = ....................................................... s [2] (ii) the distance travelled. distance = ...................................................... m [1] (b) Show that the speed of M at R is 4.8 m s–1. [2] (c) On Fig. 2.2, draw the variation with time t of the velocity v of M for the motion P to Q to R. 6.0 4.0 v / m s–1 2.0 0 0 0.5 1.0 1.5 2.0 2.5 3.0 3.5 t / s –2.0 –4.0 –6.0 Fig. 2.2 [3] (d) The mass of M is 450 g. Calculate the difference in the kinetic energy of M at P and at R. difference in kinetic energy = ....................................................... J [2]
Mark scheme: 2 (a) (i) v = u + at C1 0 = 3.6 – 3.0t t (= 3.6 / 3.0) = 1.2 s A1 [2] (ii) (distance to rest from P = (3.6 × 1.2) / 2 =) 2.2 (2.16) m A1 [1] or [0 – (3.6)2] / [2 × (–3.0)] = 2.2 (2.16) m or 3.6 × 1.2 – ½ × 3.0 × (1.2)2 = 2.2 (2.16) m or 0 + ½ × 3.0 × (1.2)2 = 2.2 (2.16) m (b) distance = 6.0 – 2.16 (= 3.84) C1 v2 = u2 + 2as = 2 × 3.0 × 3.84 (= 23.04) M1 or x + 2 × 2.16 = 6.0 gives x = 1.68 (m) (C1) v2 = 3.62 + 2 × 1.68 × 3.0 (= 23.04) (M1) or correct method with intermediate time calculated (t = 1.6 s from Q to R) v = 4.8 m s–1 A0 [2] (c) straight line from v = 3.6 m s–1 to v = 0 at t = 1.2 s B1 straight line continues with the same gradient as v changes sign B1 straight line from v = 0 intercept to v = –4.8 m s–1 B1 [3] (d) difference in KE = ½m(v2 – u2) = 0.5 × 0.45 (4.82 – 3.62) [= 5.184 – 2.916] C1 = 2.3 (2.27) J A1 [2]
Q3 · A trolley T moves at speed 1.2 m s–1 along a horizontal frictionless surface
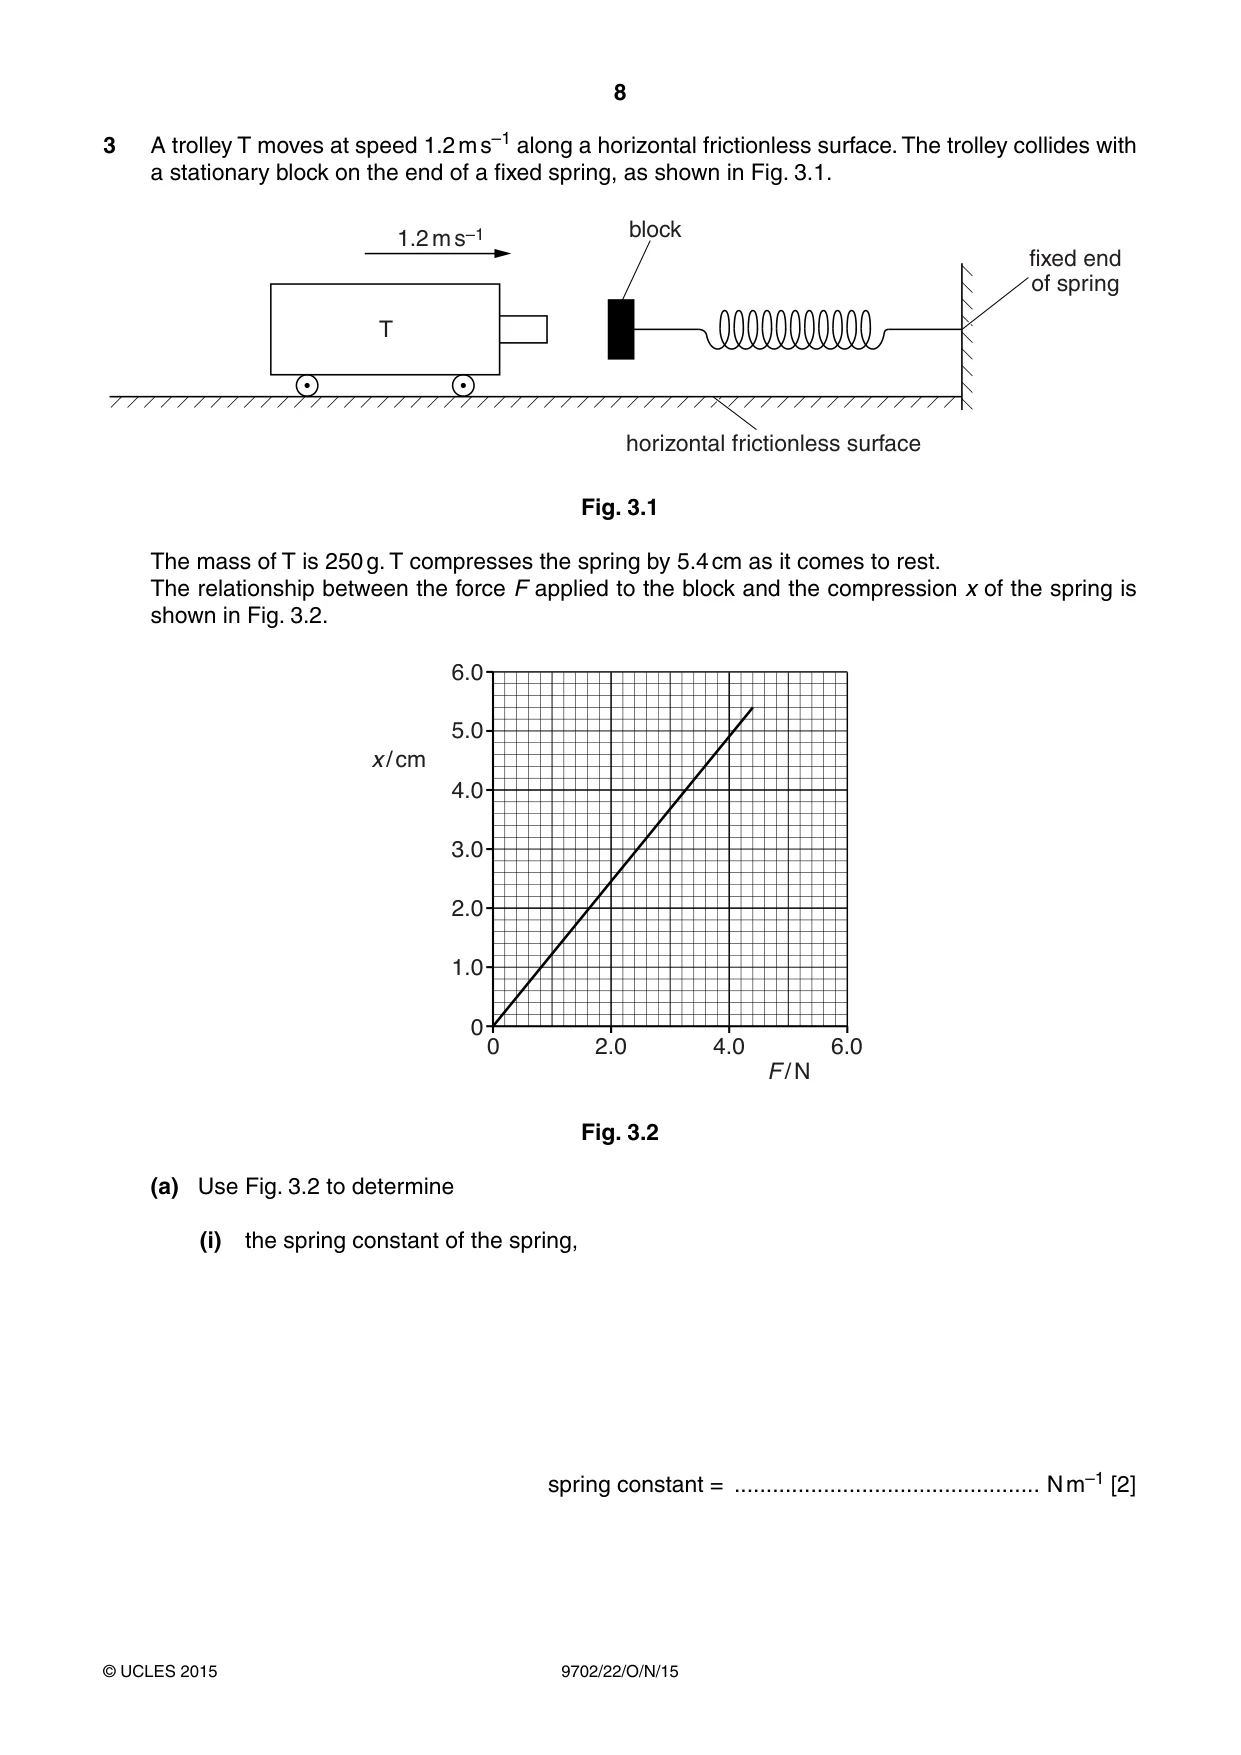
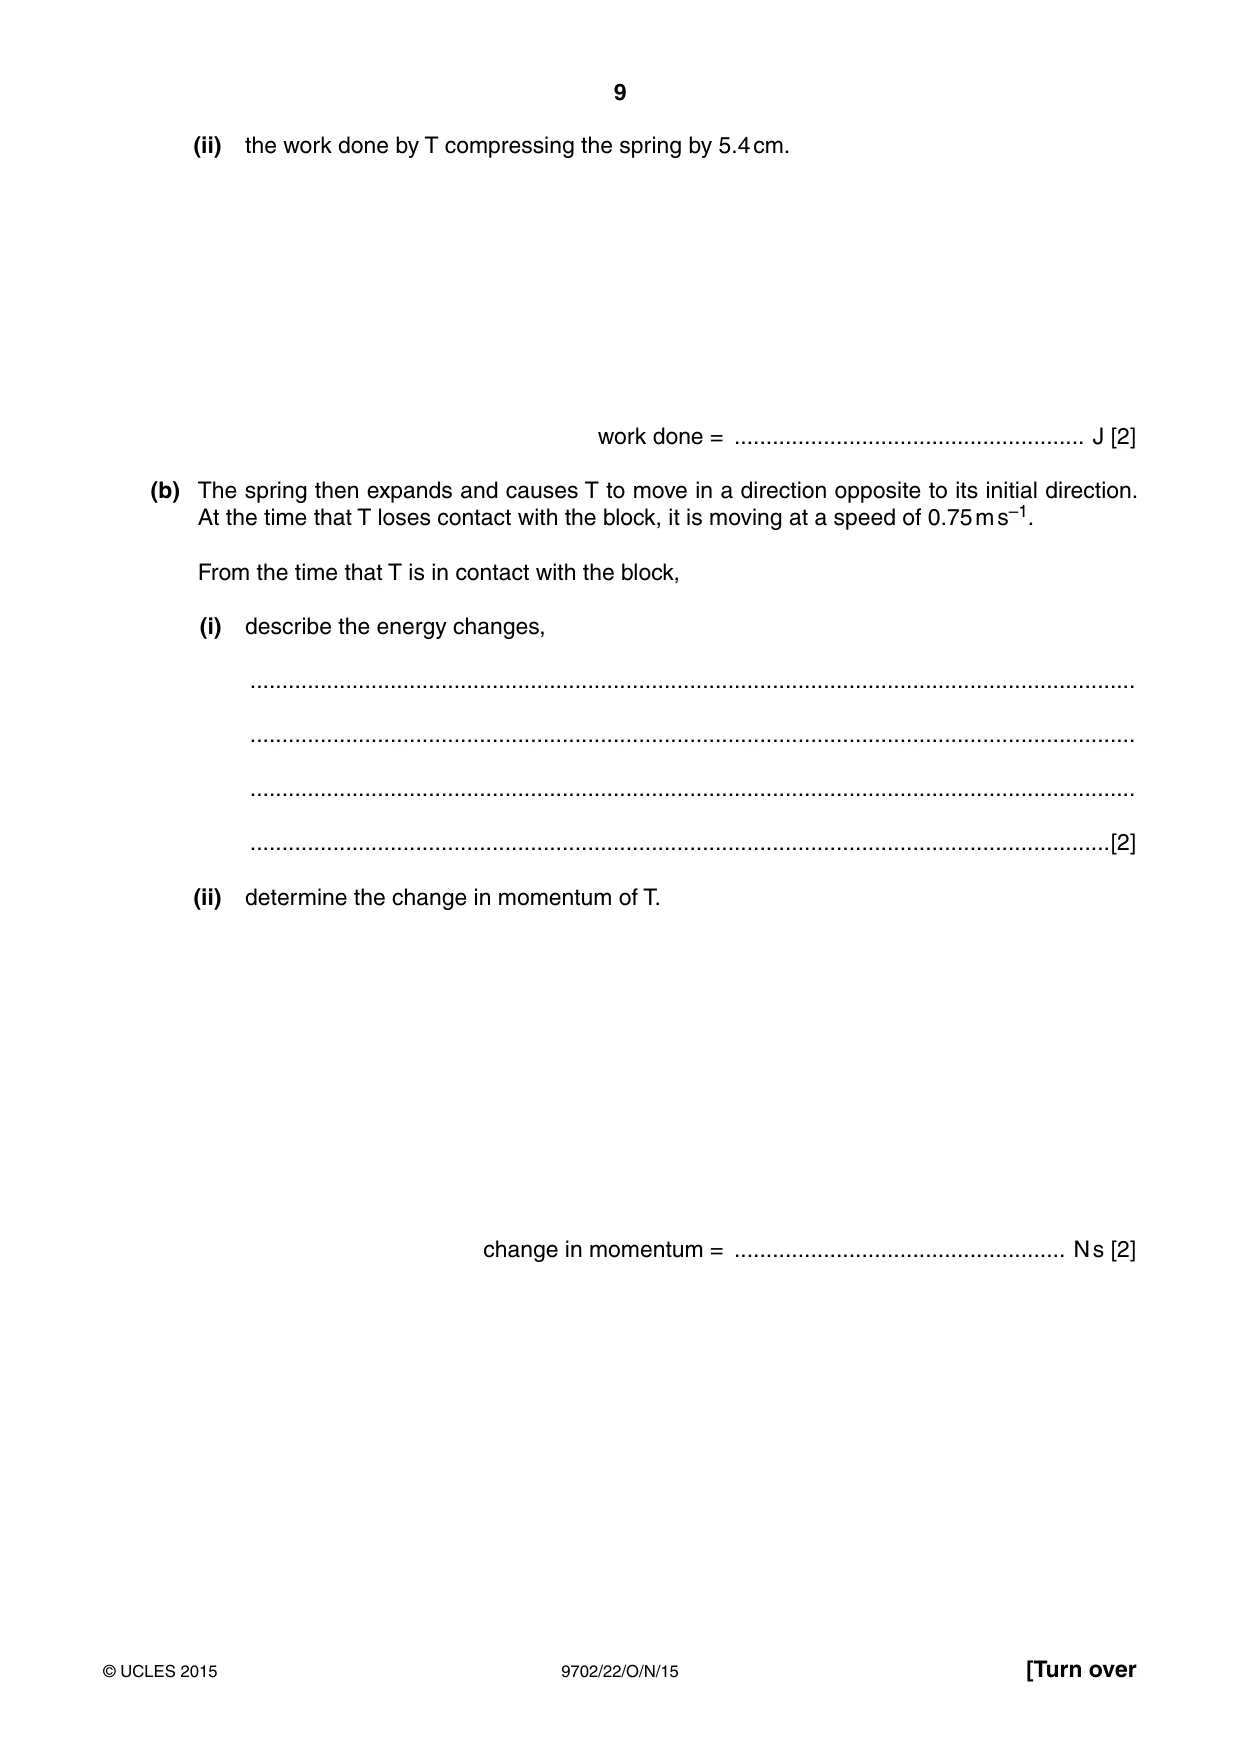
3 A trolley T moves at speed 1.2 m s–1 along a horizontal frictionless surface. The trolley collides with a stationary block on the end of a fixed spring, as shown in Fig. 3.1. block 1.2 m s–1 fixed end of spring T horizontal frictionless surface Fig. 3.1 The mass of T is 250 g. T compresses the spring by 5.4 cm as it comes to rest. The relationship between the force F applied to the block and the compression x of the spring is shown in Fig. 3.2. 6.0 5.0 x / cm 4.0 3.0 2.0 1.0 0 0 2.0 4.0 6.0 F / N Fig. 3.2 (a) Use Fig. 3.2 to determine (i) the spring constant of the spring, spring constant = ................................................ N m–1 [2] (ii) the work done by T compressing the spring by 5.4 cm. work done = ....................................................... J [2] (b) The spring then expands and causes T to move in a direction opposite to its initial direction. At the time that T loses contact with the block, it is moving at a speed of 0.75 m s–1. From the time that T is in contact with the block, (i) describe the energy changes, ........................................................................................................................................... ........................................................................................................................................... ........................................................................................................................................... .......................................................................................................................................[2] (ii) determine the change in momentum of T. change in momentum = .................................................... N s [2]
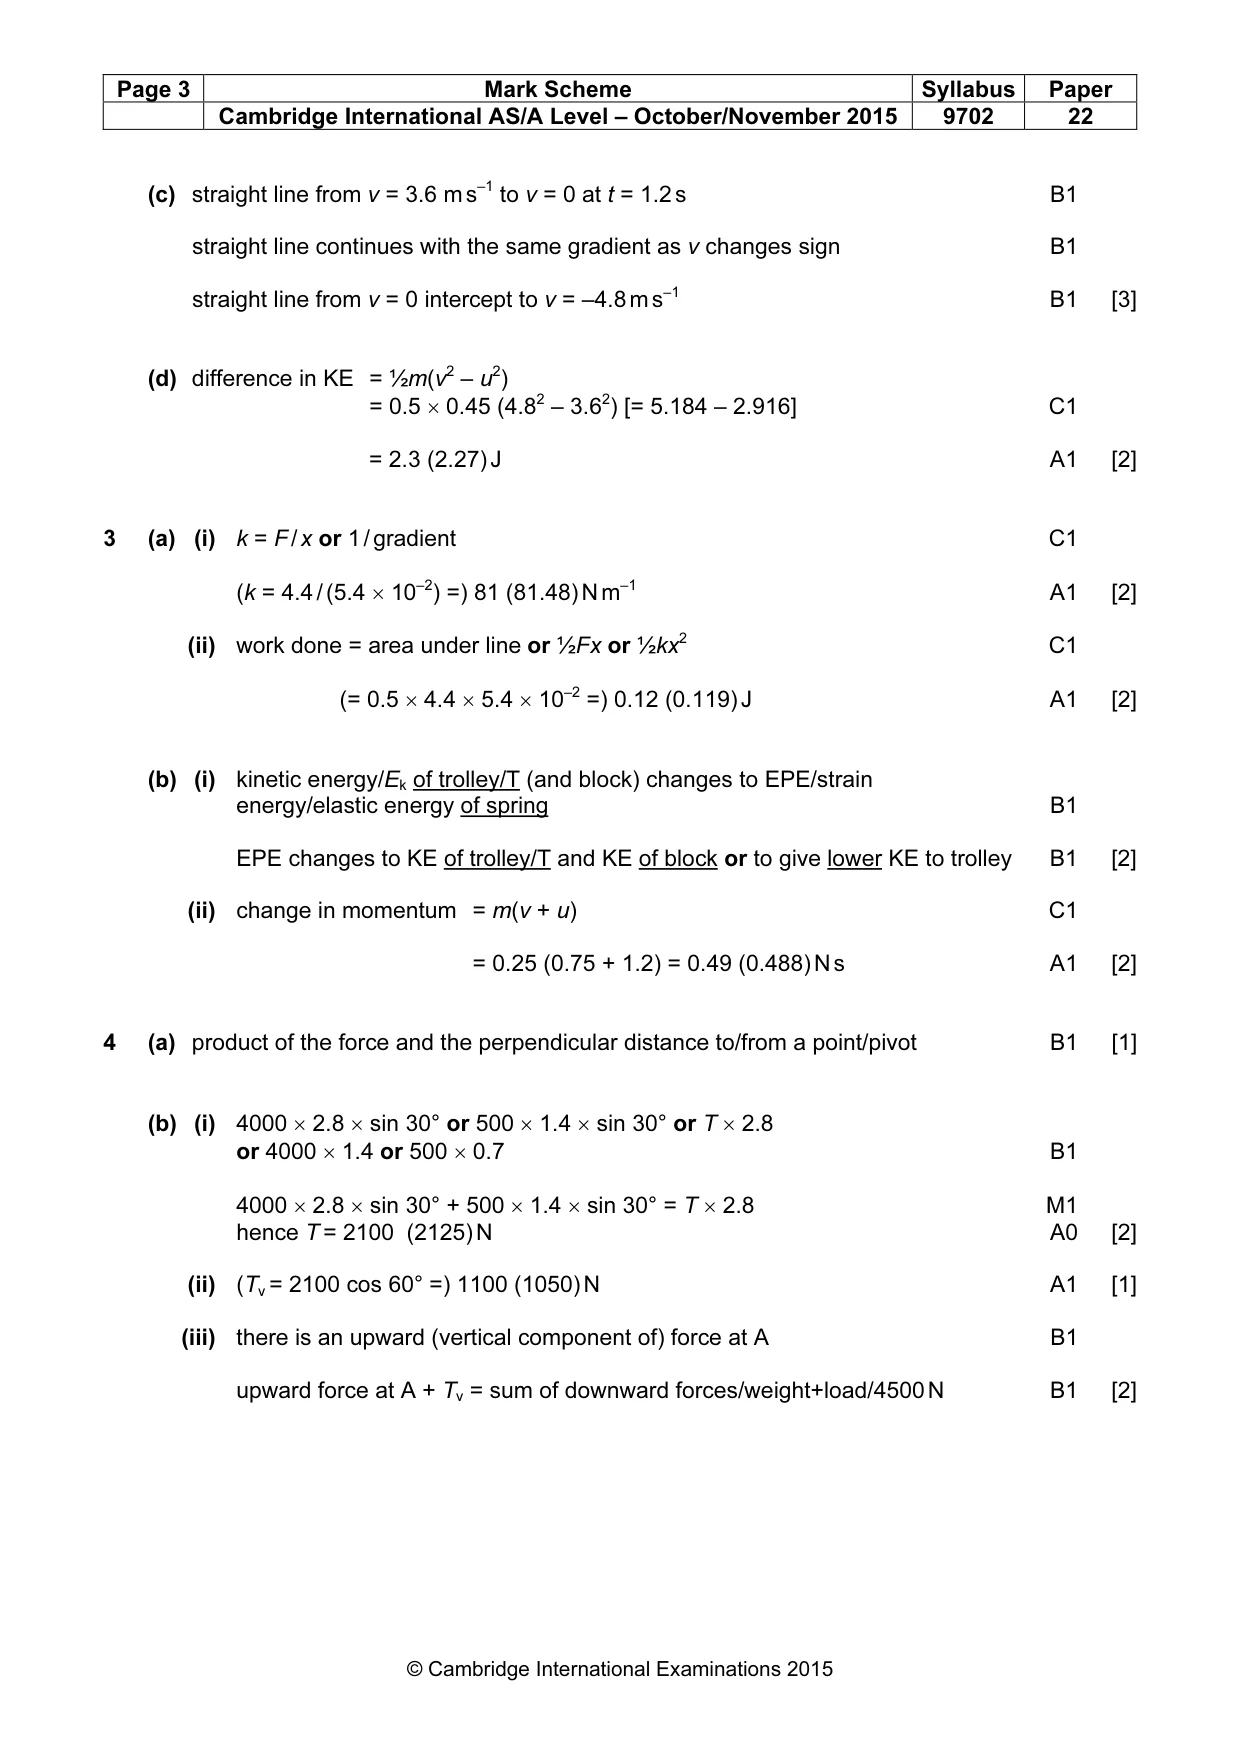
Mark scheme: 3 (a) (i) k = F / x or 1 / gradient C1 (k = 4.4 / (5.4 × 10⁻²) =) 81 (81.48) N m–1 A1 [2] (ii) work done = area under line or ½Fx or ½kx2 C1 (= 0.5 × 4.4 × 5.4 × 10–2 =) 0.12 (0.119) J A1 [2] (b) (i) kinetic energy/Ek of trolley/T (and block) changes to EPE/strain energy/elastic energy of spring B1 EPE changes to KE of trolley/T and KE of block or to give lower KE to trolley B1 [2] (ii) change in momentum = m(v + u) C1 = 0.25 (0.75 + 1.2) = 0.49 (0.488) N s A1 [2]
Q4 · Define moment of a force
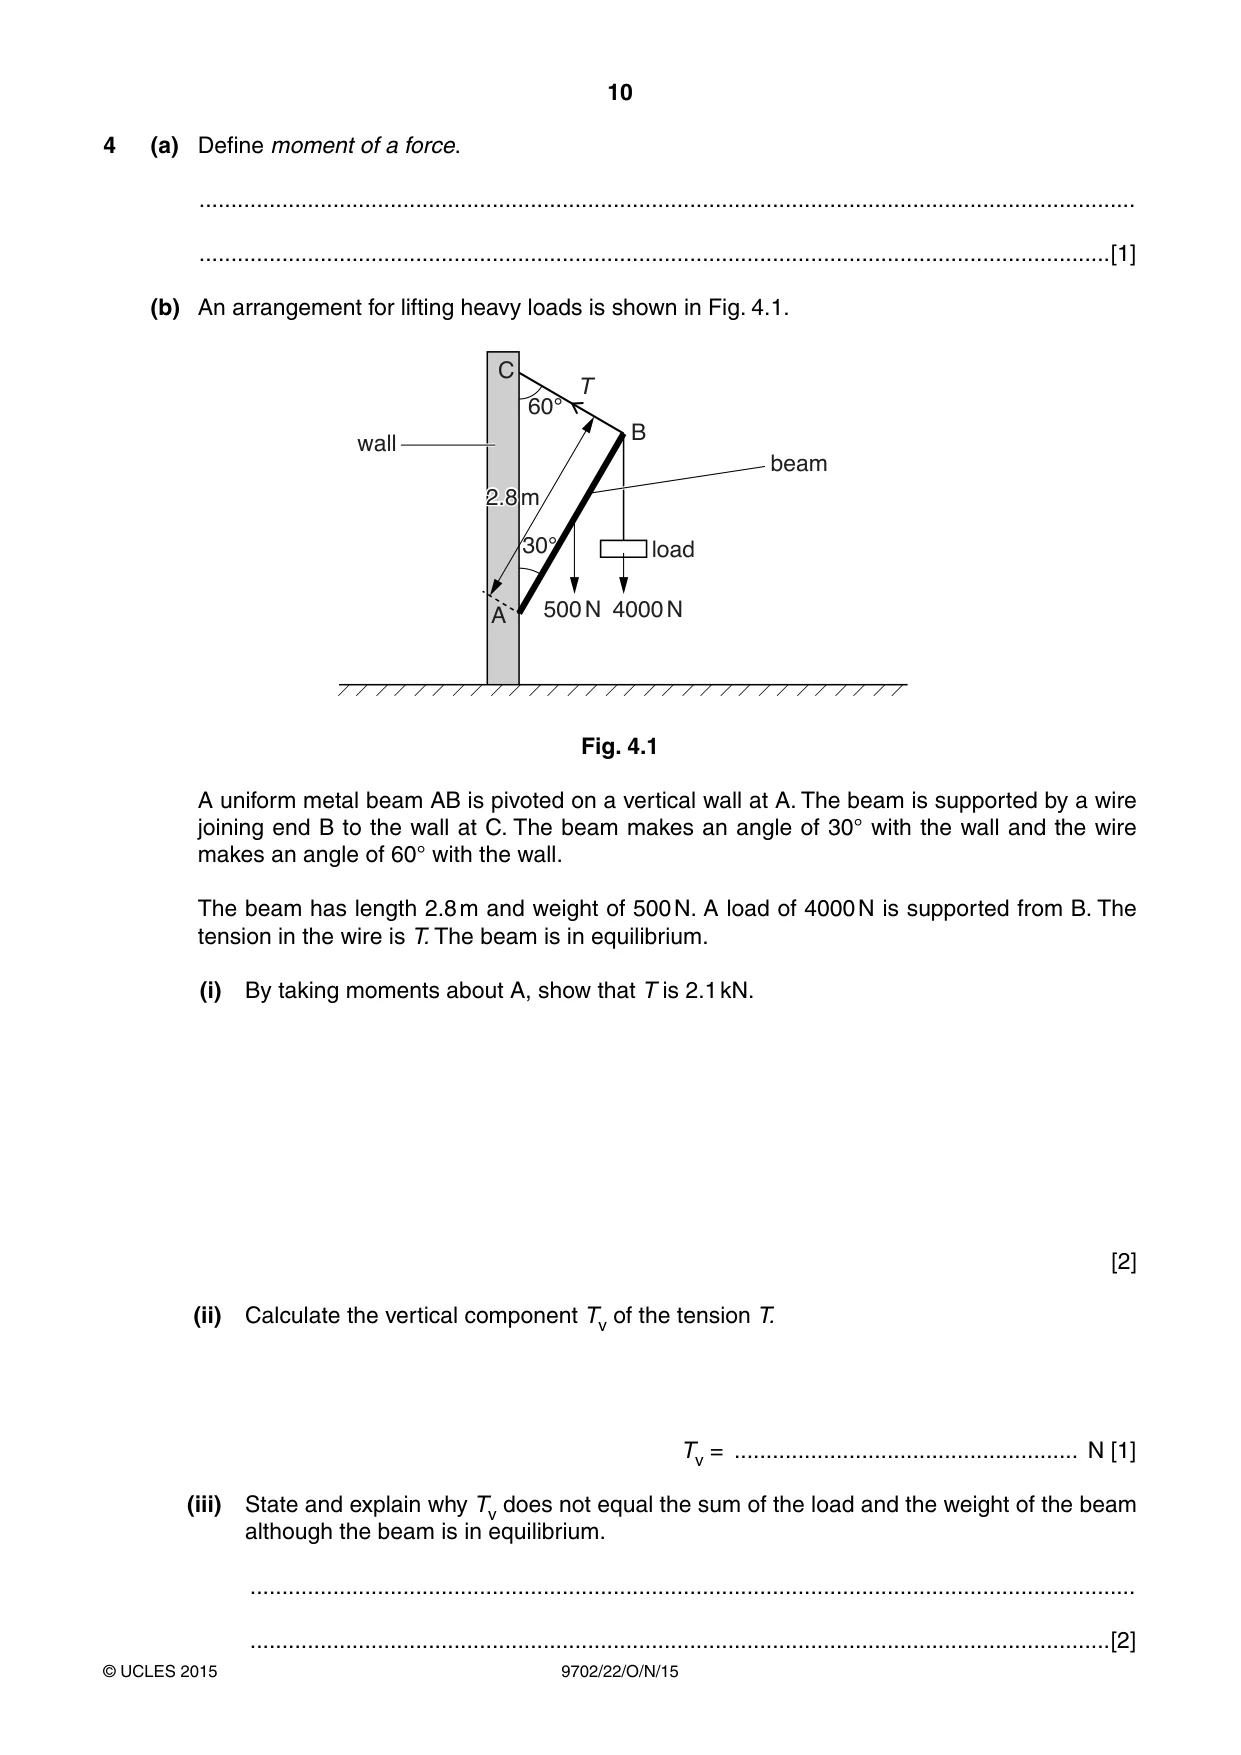
4 (a) Define moment of a force. ................................................................................................................................................... ...............................................................................................................................................[1] (b) An arrangement for lifting heavy loads is shown in Fig. 4.1. C T 60° B wall beam 2.82.8 mm 30° load 500 N 4000 N A Fig. 4.1 A uniform metal beam AB is pivoted on a vertical wall at A. The beam is supported by a wire joining end B to the wall at C. The beam makes an angle of 30° with the wall and the wire makes an angle of 60° with the wall. The beam has length 2.8 m and weight of 500 N. A load of 4000 N is supported from B. The tension in the wire is T. The beam is in equilibrium. (i) By taking moments about A, show that T is 2.1 kN. [2] (ii) Calculate the vertical component Tv of the tension T. Tv = ...................................................... N [1] (iii) State and explain why Tv does not equal the sum of the load and the weight of the beam although the beam is in equilibrium. ........................................................................................................................................... .......................................................................................................................................[2]
Mark scheme: 4 (a) product of the force and the perpendicular distance to/from a point/pivot B1 [1] (b) (i) 4000 × 2.8 × sin 30° or 500 × 1.4 × sin 30° or T × 2.8 or 4000 × 1.4 or 500 × 0.7 B1 4000 × 2.8 × sin 30° + 500 × 1.4 × sin 30° = T × 2.8 M1 hence T = 2100 (2125) N A0 [2] (ii) (Tv = 2100 cos 60° =) 1100 (1050) N A1 [1] (iii) there is an upward (vertical component of) force at A B1 upward force at A + Tv = sum of downward forces/weight+load/4500 N B1 [2]
Q5 · A 240 V power supply S with negligible internal resistance is connected to four…
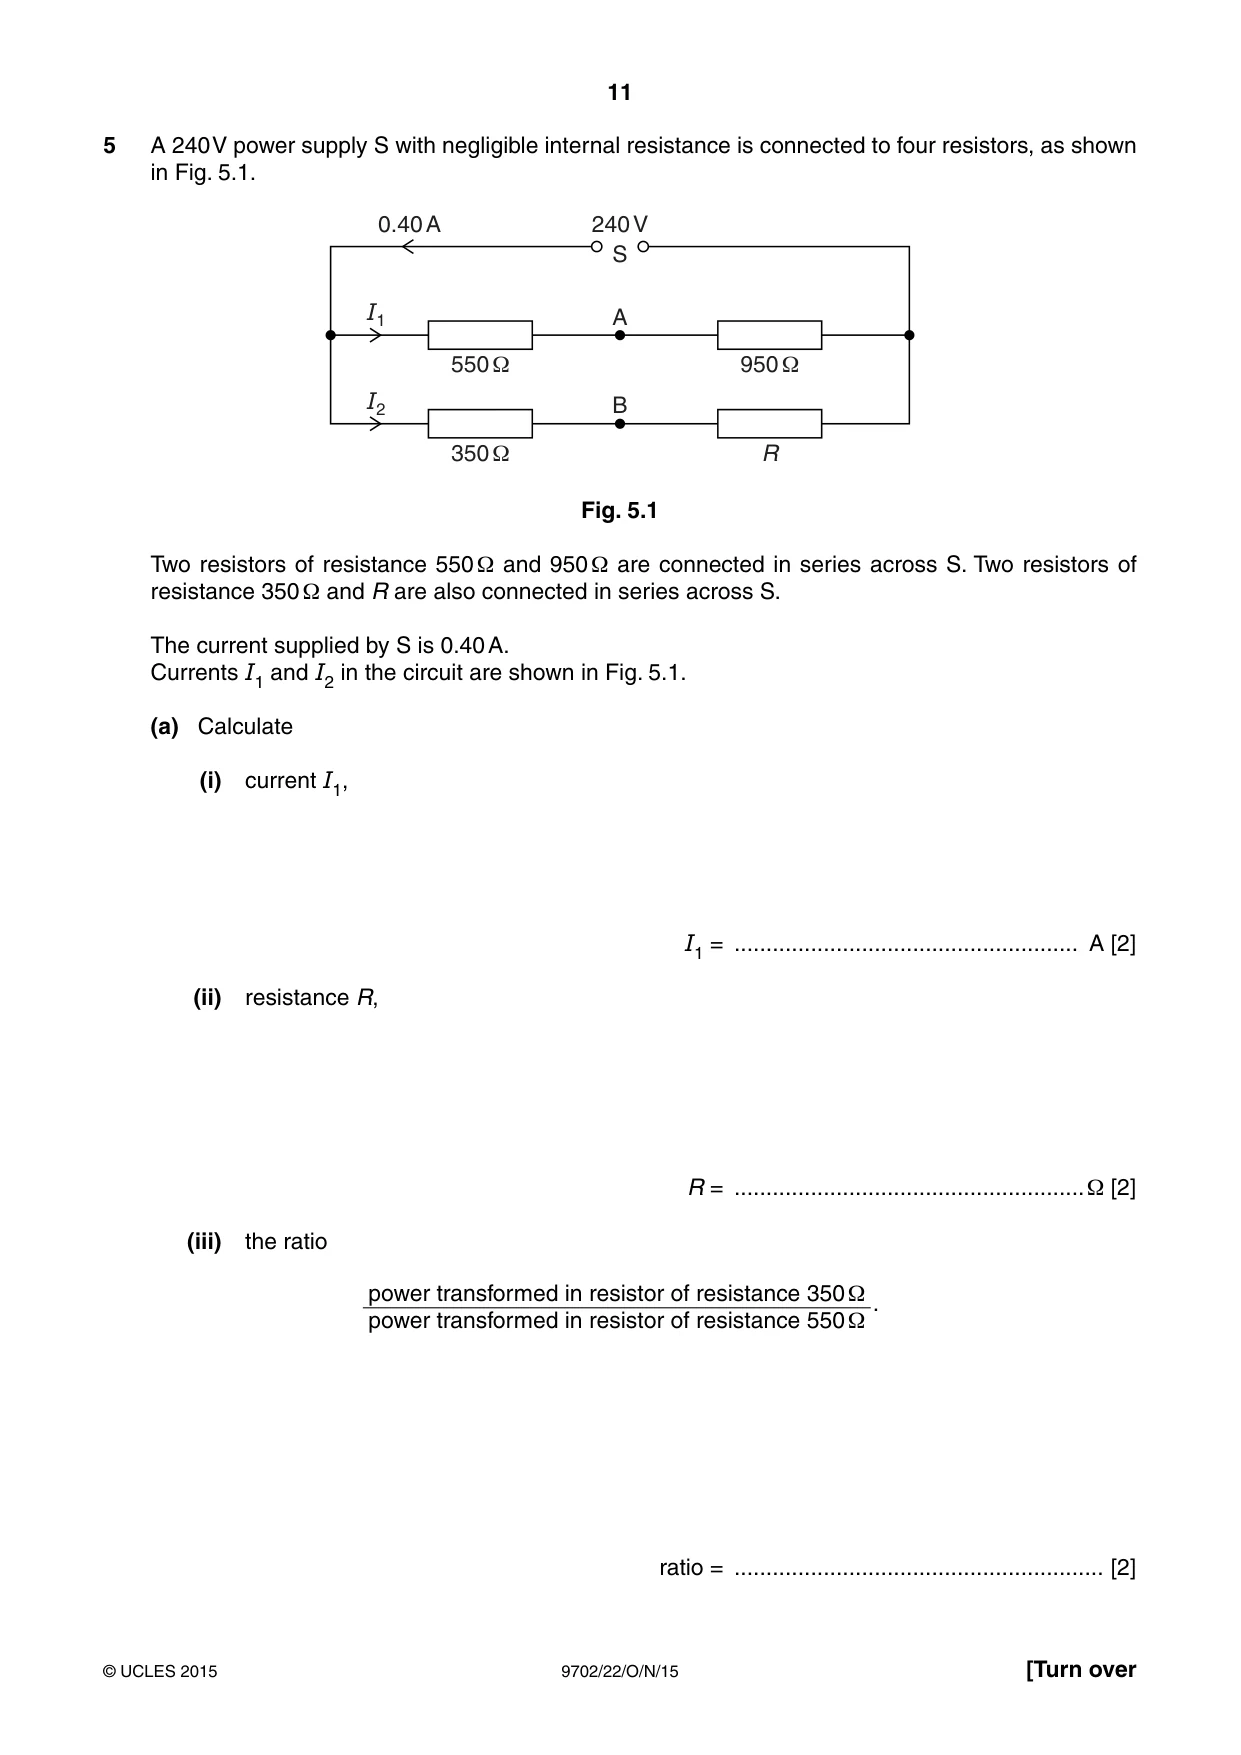
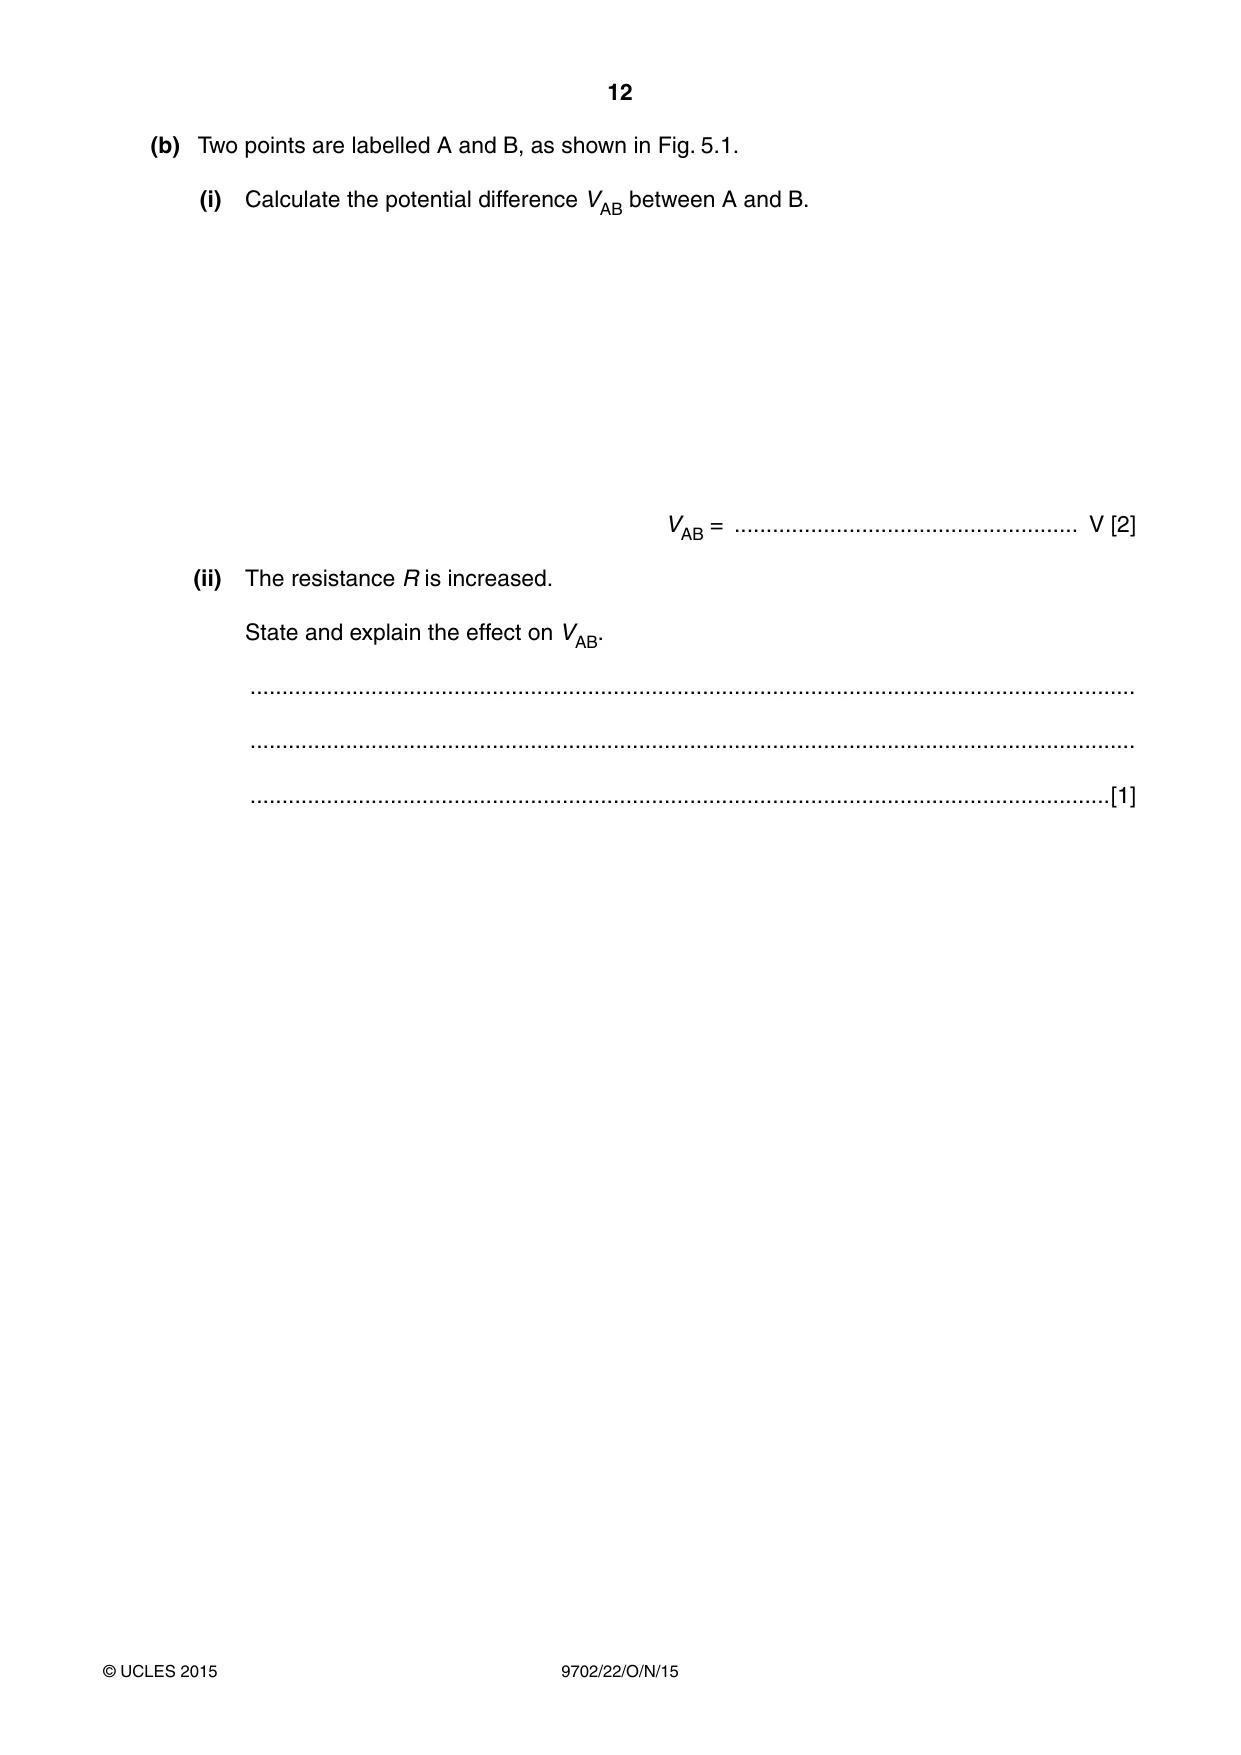
5 A 240 V power supply S with negligible internal resistance is connected to four resistors, as shown in Fig. 5.1. 0.40 A 240 V S I1 A 550 1 950 1 I2 B 350 1 R Fig. 5.1 Two resistors of resistance 550 Ω and 950 Ω are connected in series across S. Two resistors of resistance 350 Ω and R are also connected in series across S. The current supplied by S is 0.40 A. Currents I1 and I2 in the circuit are shown in Fig. 5.1. (a) Calculate (i) current I1, I1 = ...................................................... A [2] (ii) resistance R, R = .......................................................Ω [2] (iii) the ratio power transformed in resistor of resistance 350 Ω . power transformed in resistor of resistance 550 Ω ratio = .......................................................... [2] (b) Two points are labelled A and B, as shown in Fig. 5.1. (i) Calculate the potential difference VAB between A and B. VAB = ...................................................... V [2] (ii) The resistance R is increased. State and explain the effect on VAB. ........................................................................................................................................... ........................................................................................................................................... .......................................................................................................................................[1]
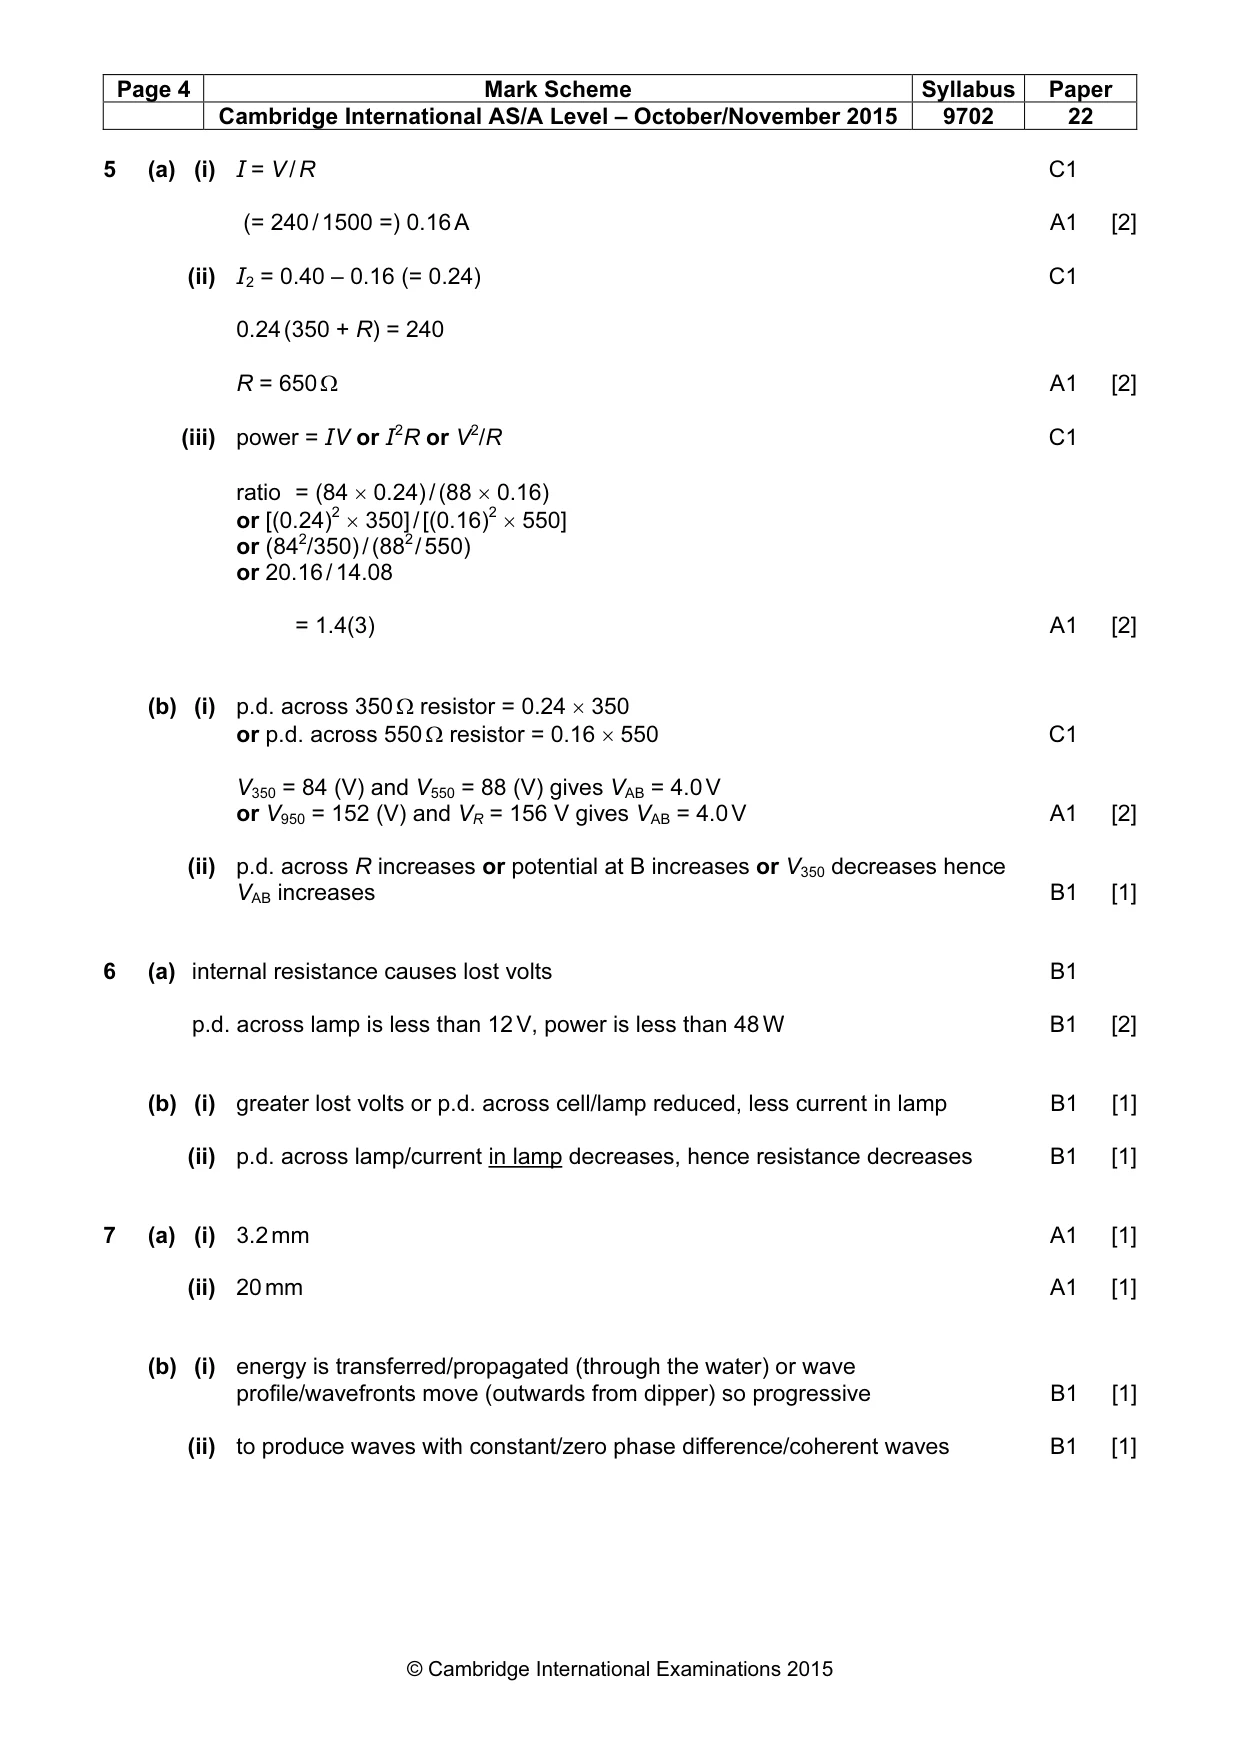
Mark scheme: 5 (a) (i) I = V / R C1 ( = 240 / 1500 =) 0.16 A A1 [2] (ii) I2 = 0.40 – 0.16 (= 0.24) C1 0.24 (350 + R) = 240 R = 650 Ω A1 [2] (iii) power = IV or I2R or V2/R C1 ratio = (84 × 0.24) / (88 × 0.16) or [(0.24)2 × 350] / [(0.16)2 × 550] or (842/350) / (882 / 550) or 20.16 / 14.08 = 1.4(3) A1 [2] (b) (i) p.d. across 350 Ω resistor = 0.24 × 350 or p.d. across 550 Ω resistor = 0.16 × 550 C1 V350 = 84 (V) and V550 = 88 (V) gives VAB = 4.0 V or V950 = 152 (V) and VR = 156 V gives VAB = 4.0 V A1 [2] (ii) p.d. across R increases or potential at B increases or V350 decreases hence VAB increases B1 [1]
Q6 · A 12 V battery with internal resistance 0.50 Ω is connected to two identical filament…
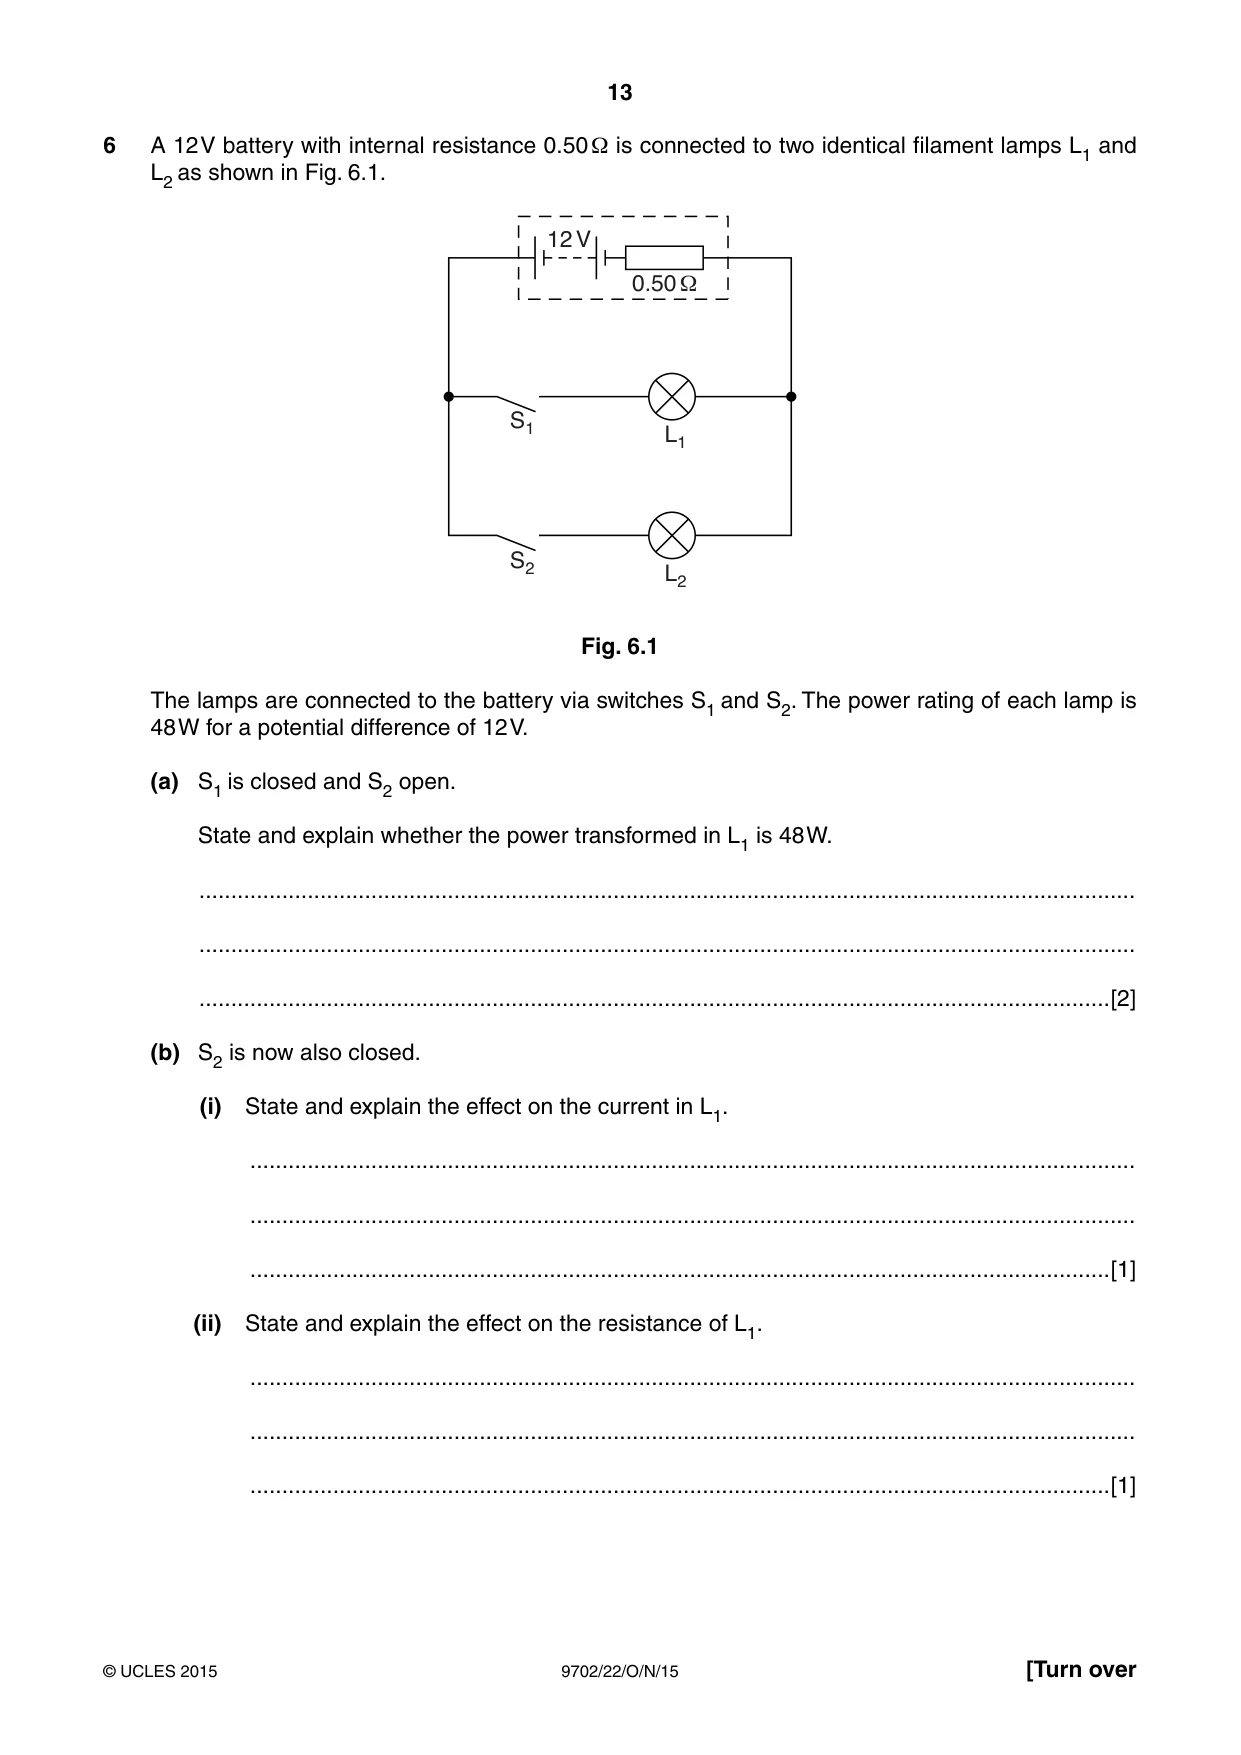
6 A 12 V battery with internal resistance 0.50 Ω is connected to two identical filament lamps L1 and L2 as shown in Fig. 6.1. 12 V 0.50 1 S1 L1 S2 L2 Fig. 6.1 The lamps are connected to the battery via switches S1 and S2. The power rating of each lamp is 48 W for a potential difference of 12 V. (a) S1 is closed and S2 open. State and explain whether the power transformed in L1 is 48 W. ................................................................................................................................................... ................................................................................................................................................... ...............................................................................................................................................[2] (b) S2 is now also closed. (i) State and explain the effect on the current in L1. ........................................................................................................................................... ........................................................................................................................................... .......................................................................................................................................[1] (ii) State and explain the effect on the resistance of L1. ........................................................................................................................................... ........................................................................................................................................... .......................................................................................................................................[1]
Mark scheme: 6 (a) internal resistance causes lost volts B1 p.d. across lamp is less than 12 V, power is less than 48 W B1 [2] (b) (i) greater lost volts or p.d. across cell/lamp reduced, less current in lamp B1 [1] (ii) p.d. across lamp/current in lamp decreases, hence resistance decreases B1 [1]
Q7 · An arrangement that is used to demonstrate interference with waves on the surface of…
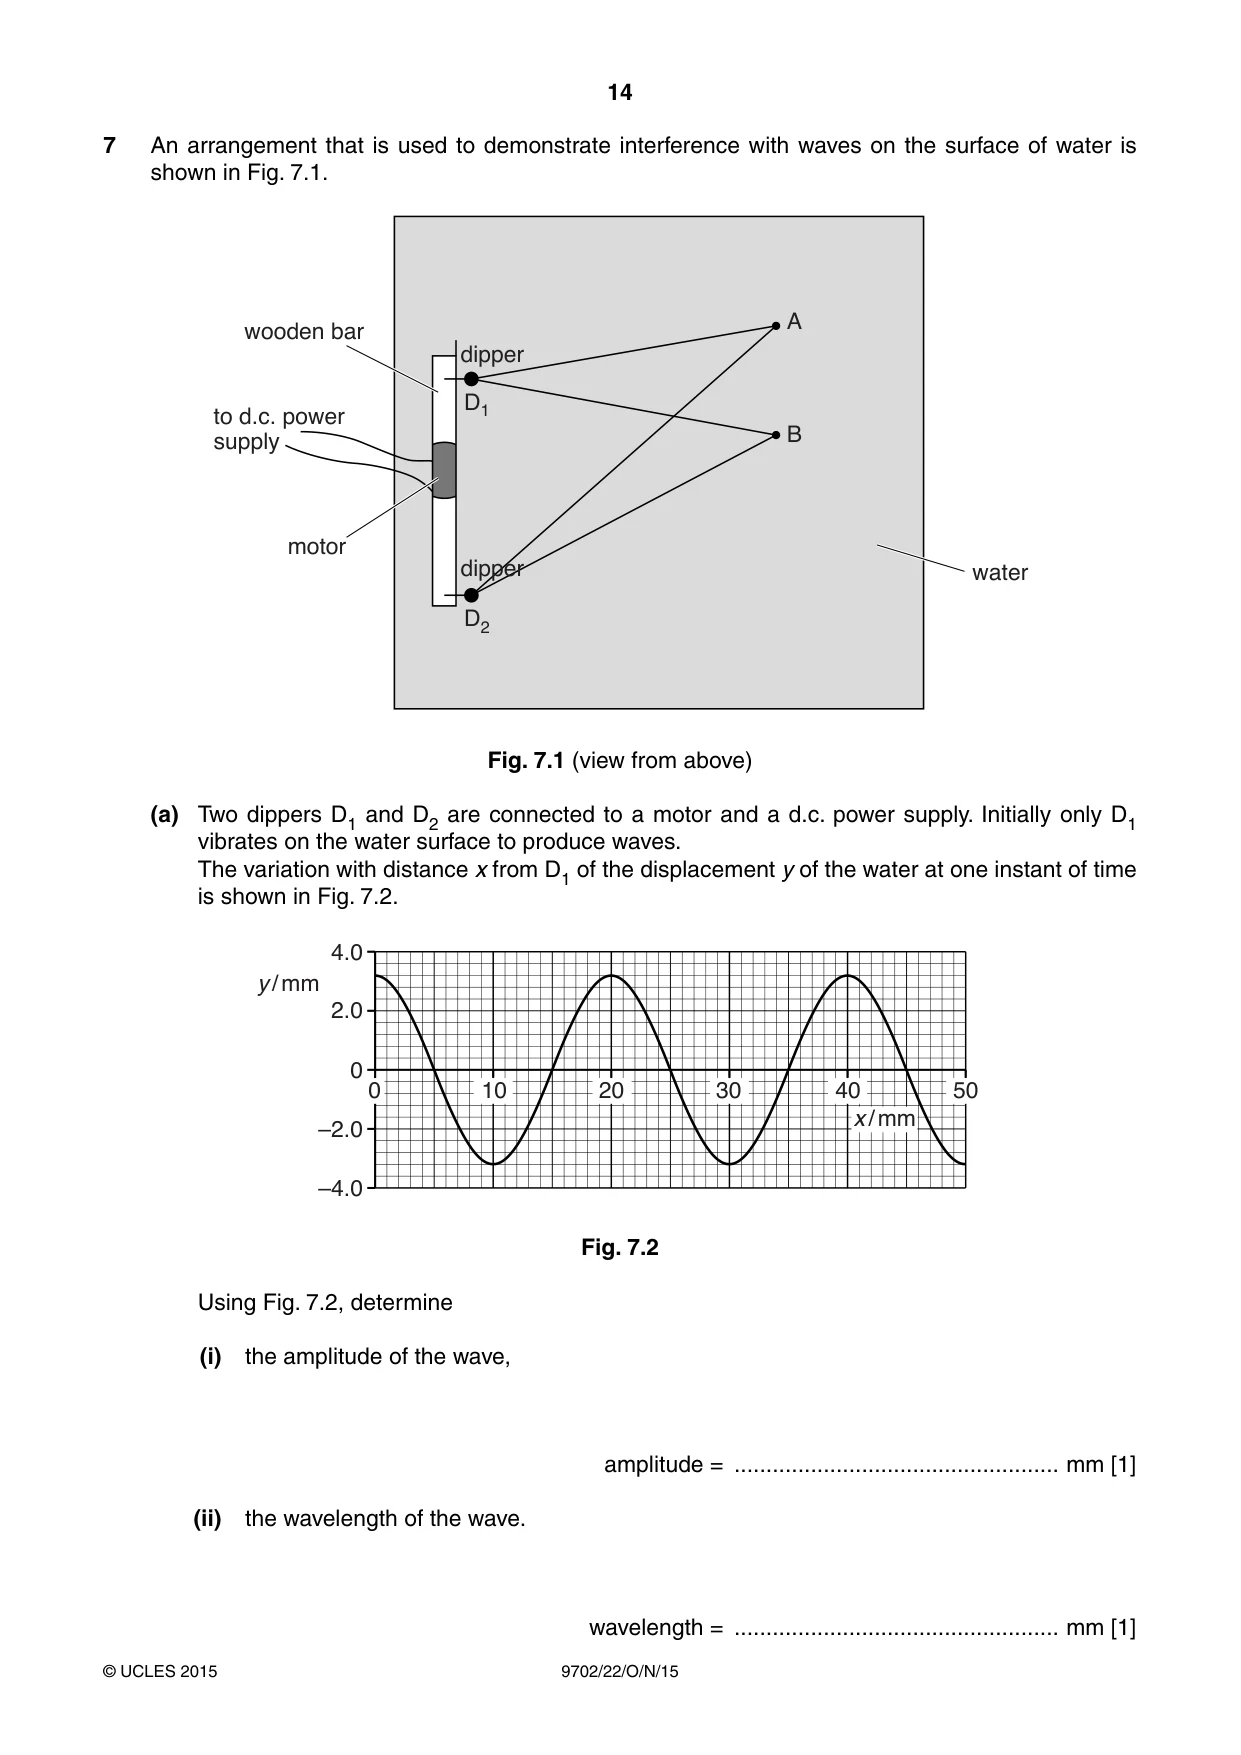
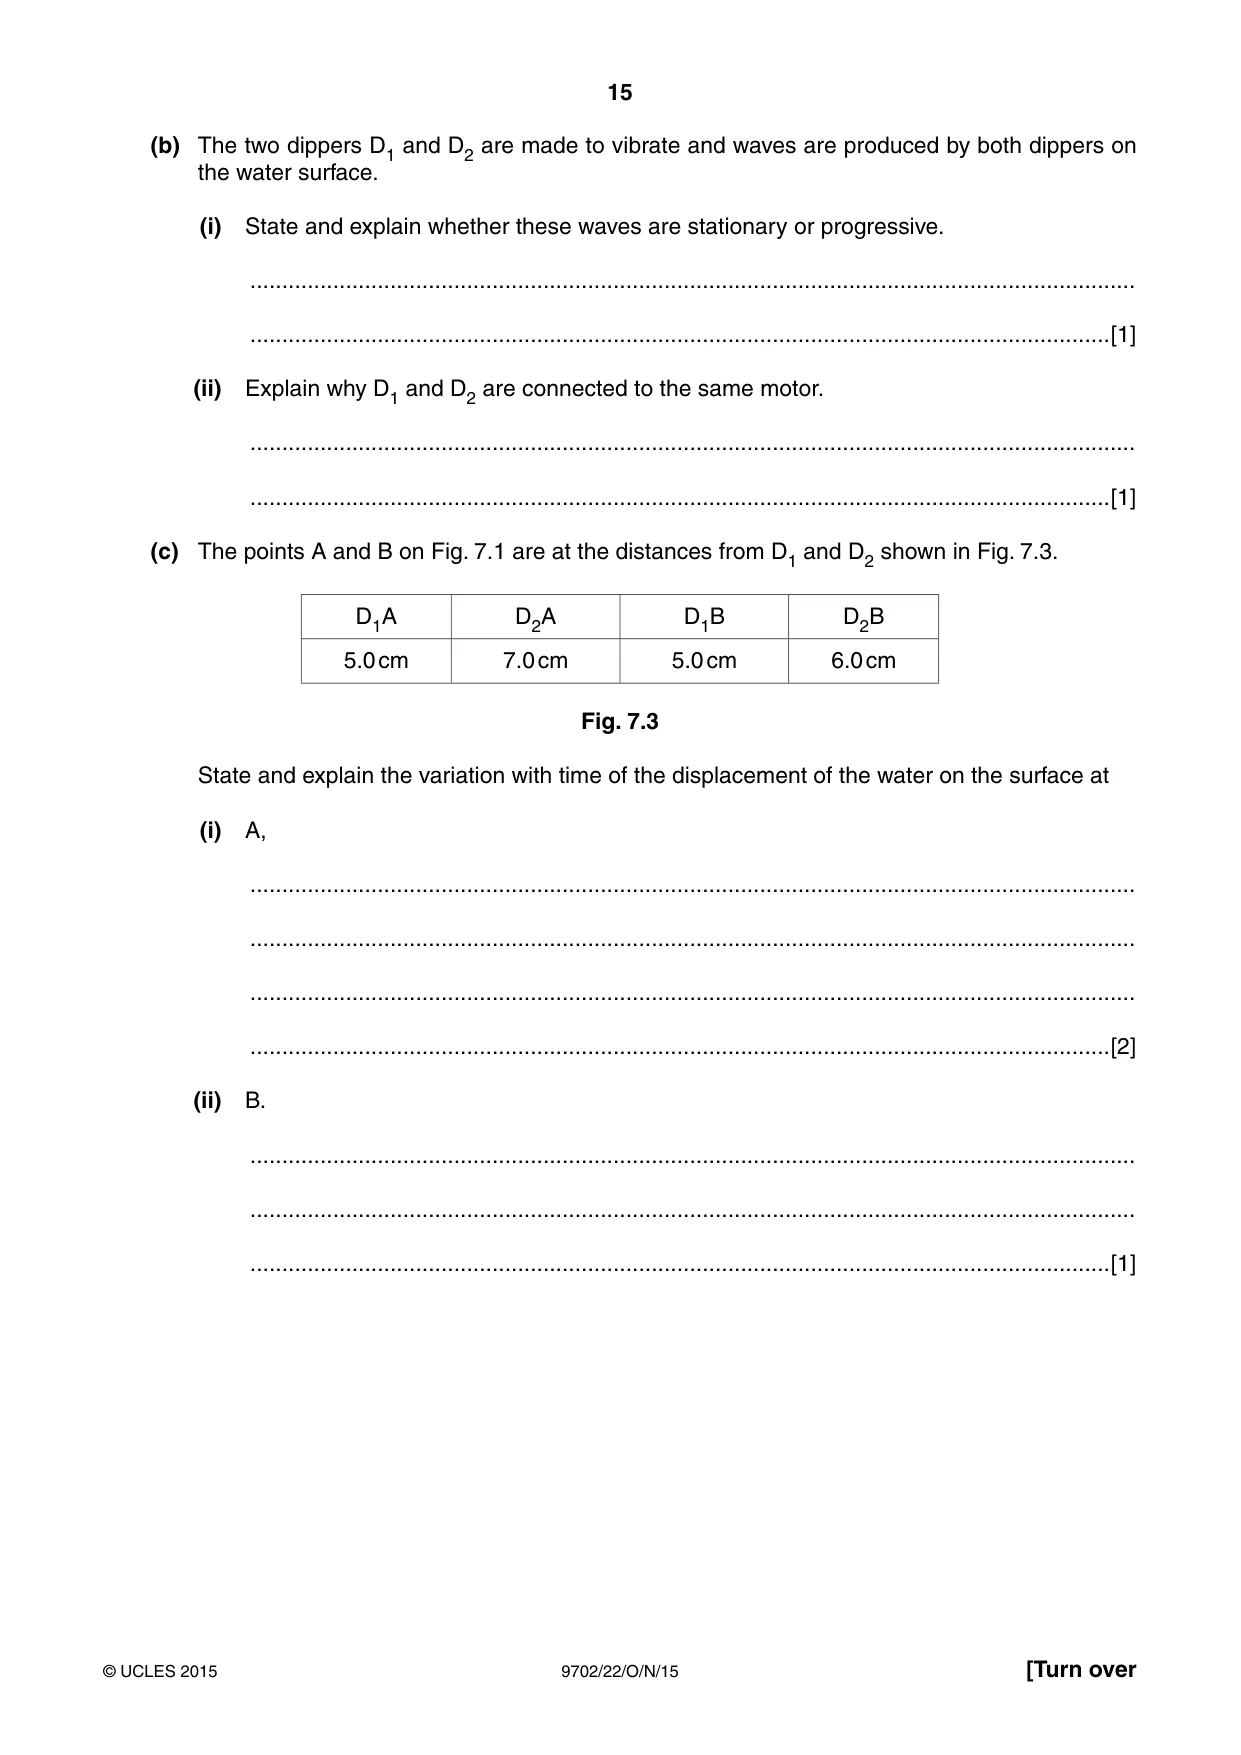
7 An arrangement that is used to demonstrate interference with waves on the surface of water is shown in Fig. 7.1. A wooden bar dipper D1 to d.c. power B supply motor dipper water D2 Fig. 7.1 (view from above) (a) Two dippers D1 and D2 are connected to a motor and a d.c. power supply. Initially only D1 vibrates on the water surface to produce waves. The variation with distance x from D1 of the displacement y of the water at one instant of time is shown in Fig. 7.2. 4.0 y / mm 2.0 0 0 10 20 30 40 50 x / mm –2.0 –4.0 Fig. 7.2 Using Fig. 7.2, determine (i) the amplitude of the wave, amplitude = ................................................... mm [1] (ii) the wavelength of the wave. wavelength = ................................................... mm [1] (b) The two dippers D1 and D2 are made to vibrate and waves are produced by both dippers on the water surface. (i) State and explain whether these waves are stationary or progressive. ........................................................................................................................................... .......................................................................................................................................[1] (ii) Explain why D1 and D2 are connected to the same motor. ........................................................................................................................................... .......................................................................................................................................[1] (c) The points A and B on Fig. 7.1 are at the distances from D1 and D2 shown in Fig. 7.3. D1A D2A D1B D2B 5.0 cm 7.0 cm 5.0 cm 6.0 cm Fig. 7.3 State and explain the variation with time of the displacement of the water on the surface at (i) A, ........................................................................................................................................... ........................................................................................................................................... ........................................................................................................................................... .......................................................................................................................................[2] (ii) B. ........................................................................................................................................... ........................................................................................................................................... .......................................................................................................................................[1]
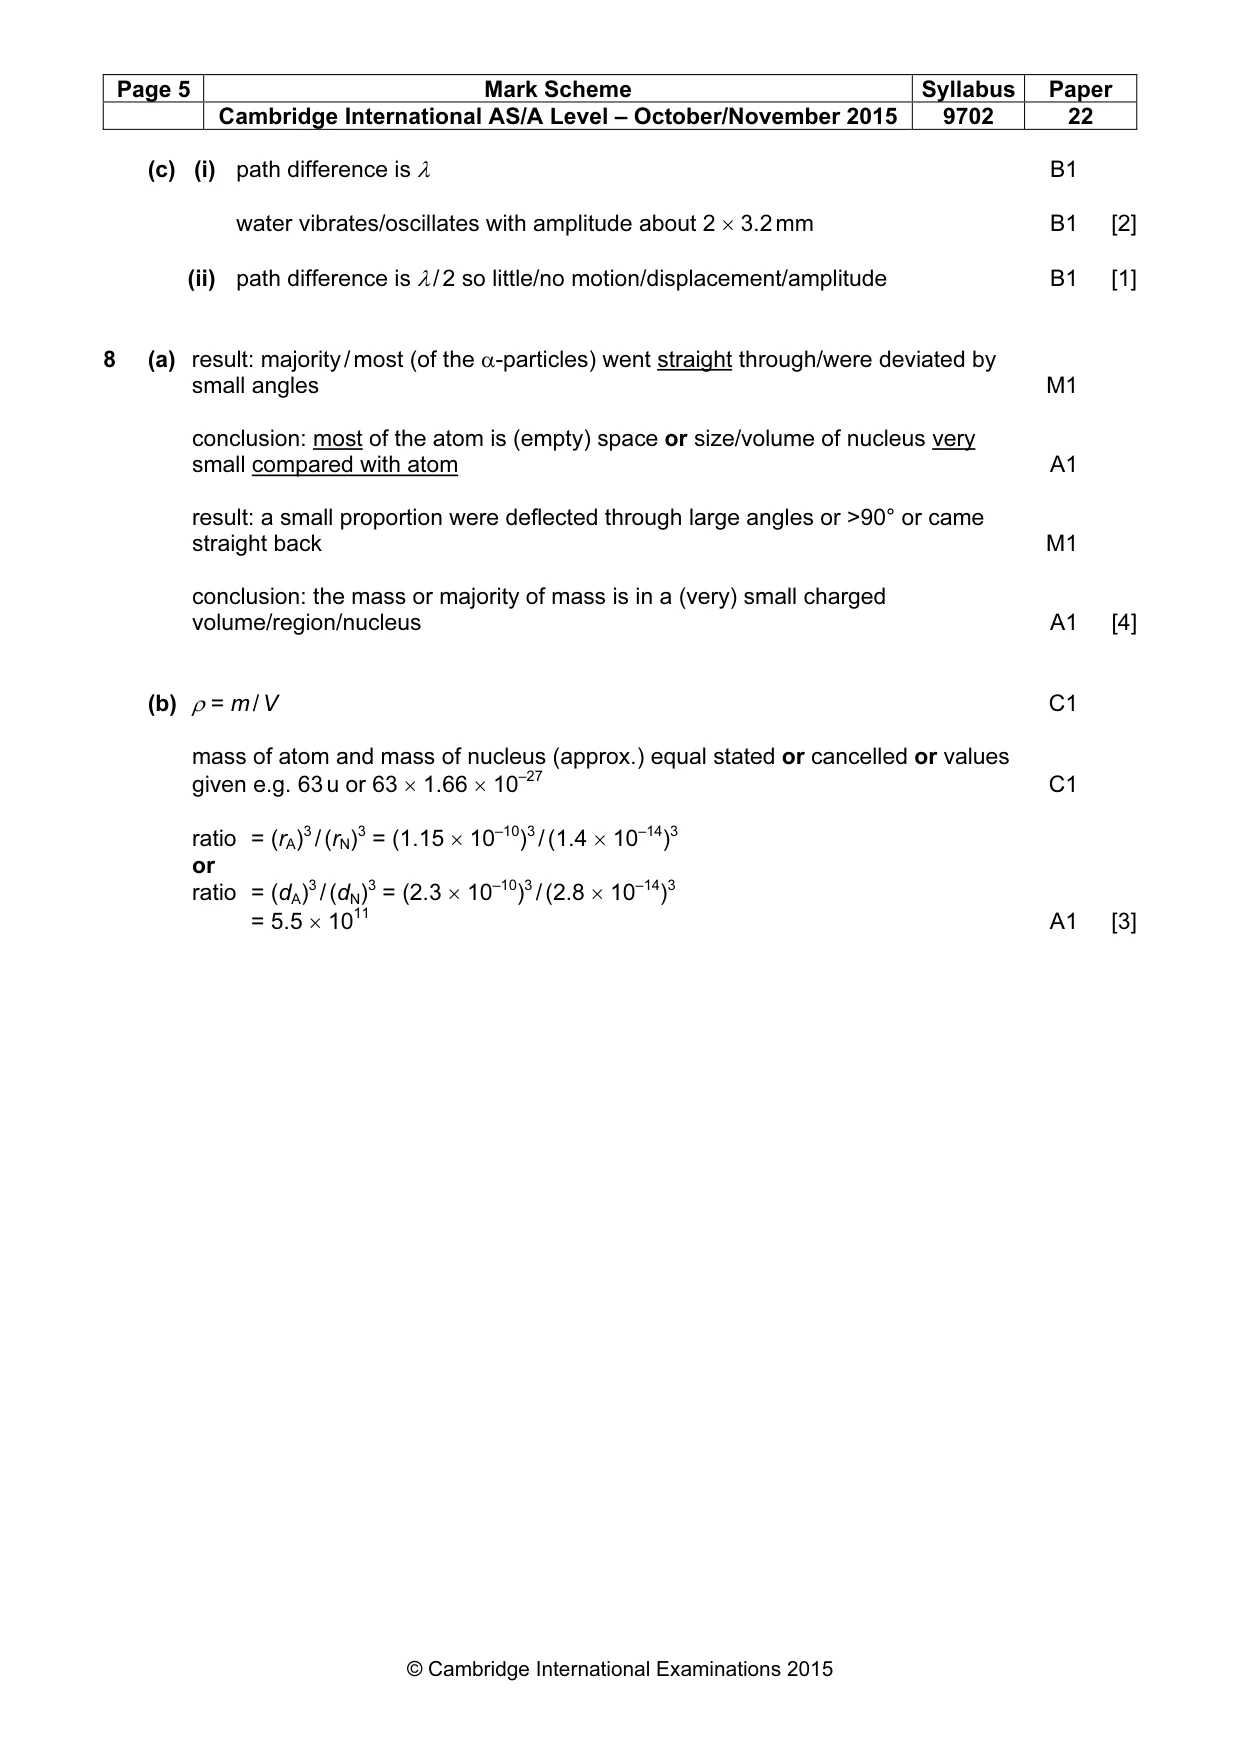
Mark scheme: 7 (a) (i) 3.2 mm A1 [1] (ii) 20 mm A1 [1] (b) (i) energy is transferred/propagated (through the water) or wave profile/wavefronts move (outwards from dipper) so progressive B1 [1] (ii) to produce waves with constant/zero phase difference/coherent waves B1 [1] (c) (i) path difference is λ B1 water vibrates/oscillates with amplitude about 2 × 3.2 mm B1 [2] (ii) path difference is λ / 2 so little/no motion/displacement/amplitude B1 [1]
Q8 · The results of the α-particle scattering experiment gave evidence for the structure of…
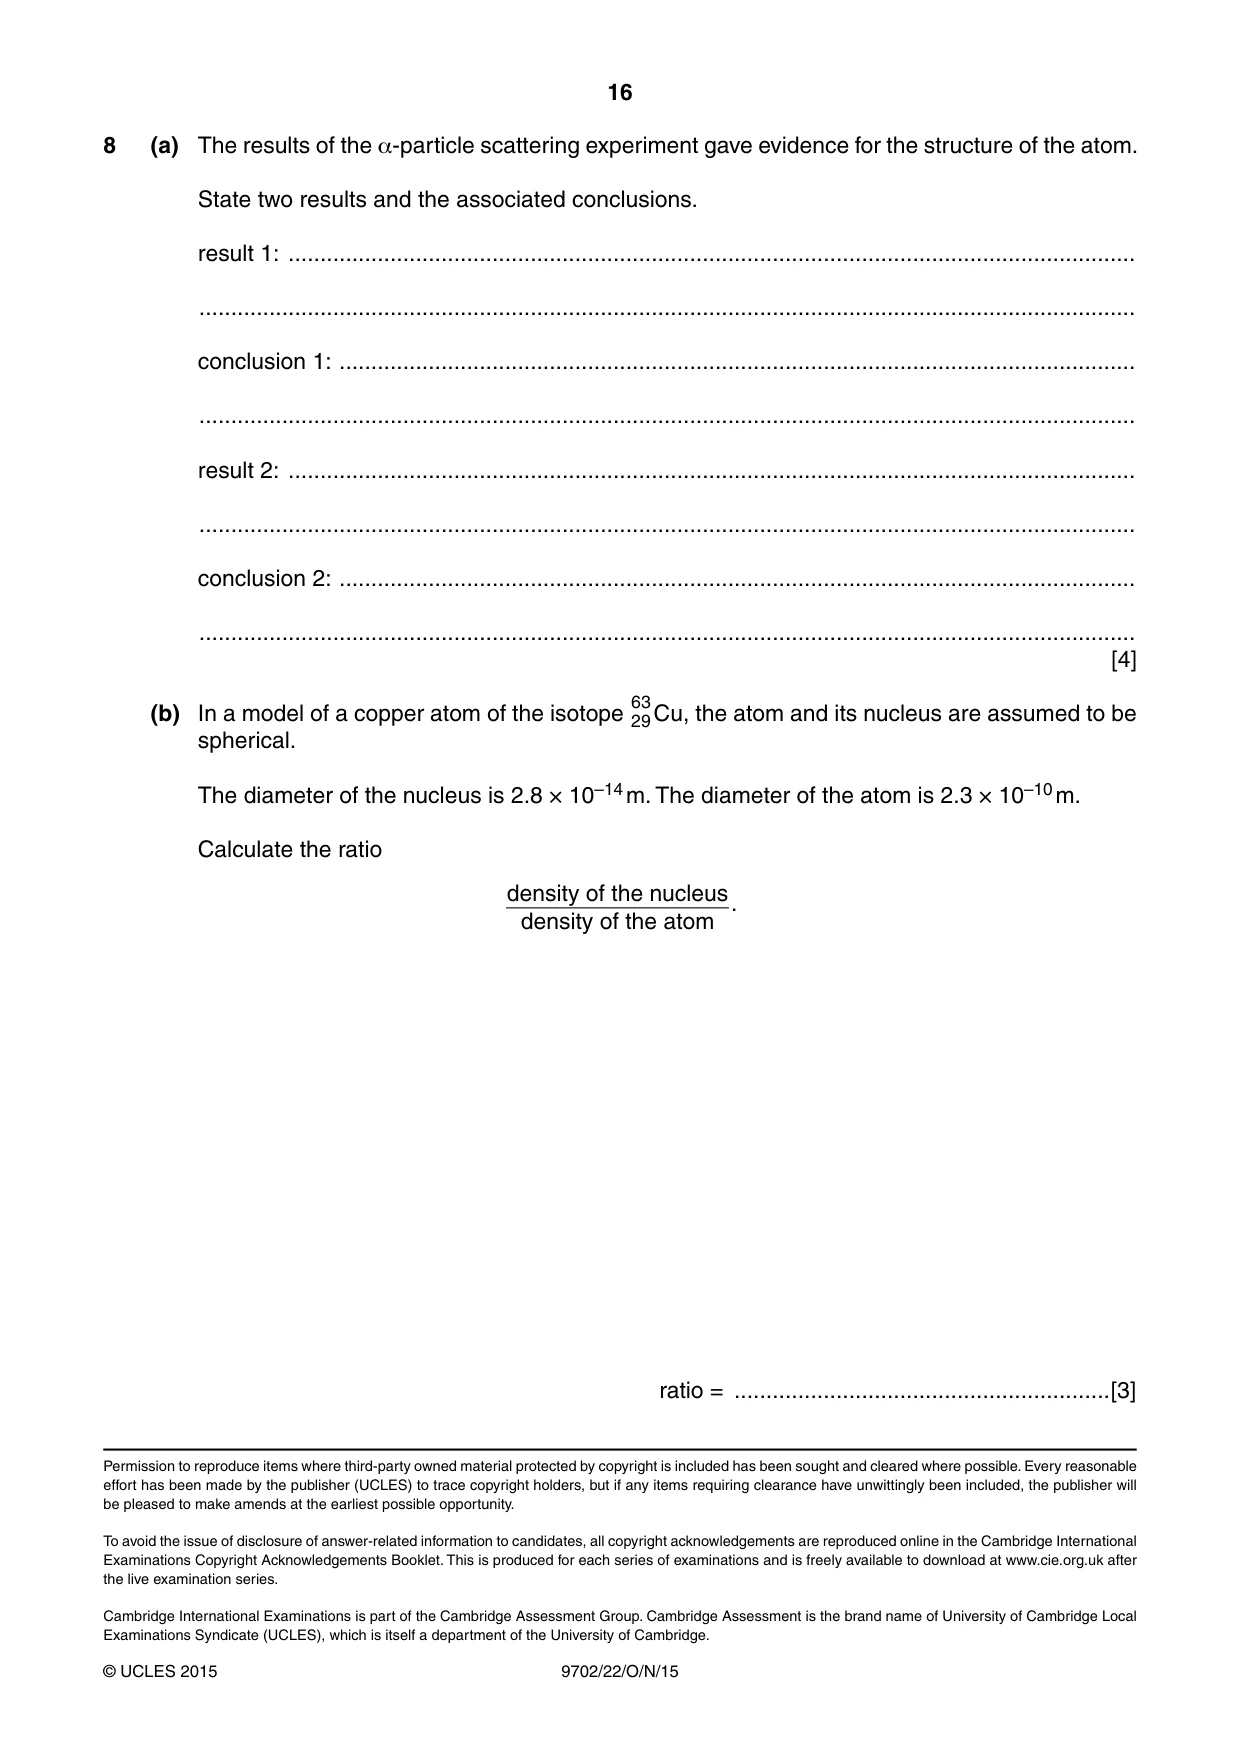
8 (a) The results of the α-particle scattering experiment gave evidence for the structure of the atom. State two results and the associated conclusions. result 1: ..................................................................................................................................... ................................................................................................................................................... conclusion 1: ............................................................................................................................. ................................................................................................................................................... result 2: ..................................................................................................................................... ................................................................................................................................................... conclusion 2: ............................................................................................................................. ................................................................................................................................................... [4] 63 (b) In a model of a copper atom of the isotope 29 Cu, the atom and its nucleus are assumed to be spherical. The diameter of the nucleus is 2.8 × 10⁻¹⁴ m. The diameter of the atom is 2.3 × 10⁻¹⁰ m. Calculate the ratio density of the nucleus . density of the atom ratio = ...........................................................[3]
Mark scheme: 8 (a) result: majority / most (of the α-particles) went straight through/were deviated by small angles M1 conclusion: most of the atom is (empty) space or size/volume of nucleus very small compared with atom A1 result: a small proportion were deflected through large angles or >90° or came straight back M1 conclusion: the mass or majority of mass is in a (very) small charged volume/region/nucleus A1 [4] (b) ρ = m / V C1 mass of atom and mass of nucleus (approx.) equal stated or cancelled or values given e.g. 63 u or 63 × 1.66 × 10–27 C1 ratio = (rA)3 / (rN)3 = (1.15 × 10⁻¹⁰)3 / (1.4 × 10⁻¹⁴)3 or ratio = (dA)3 / (dN)3 = (2.3 × 10⁻¹⁰)3 / (2.8 × 10⁻¹⁴)3 = 5.5 × 10¹¹ A1 [3]
What was in this paper
The subtopics covered by these 8 questions, and how many questions each got. Open one in a new tab to see every Cambridge question on it.
What you needed in this session
Cambridge’s own grade thresholds for 2015 Oct/Nov, Paper 2 · Variant 2. A higher threshold means an easier paper — the bar moves with how the cohort did.