Cambridge A Level Marine Science 9693 — 2025 May/June Paper 2 · Variant 1
9693/21/M/J/25 · 5 questions · 75 marks · 105 min
The question paper and its mark scheme, free to read here and free to download. This is Cambridge’s own paper, exactly as it was sat.
Question paper28 pages




Mark scheme19 pages
Answers below. Sit the paper first if you are practising.
Questions as text
Q1 · Blue crabs are crustaceans
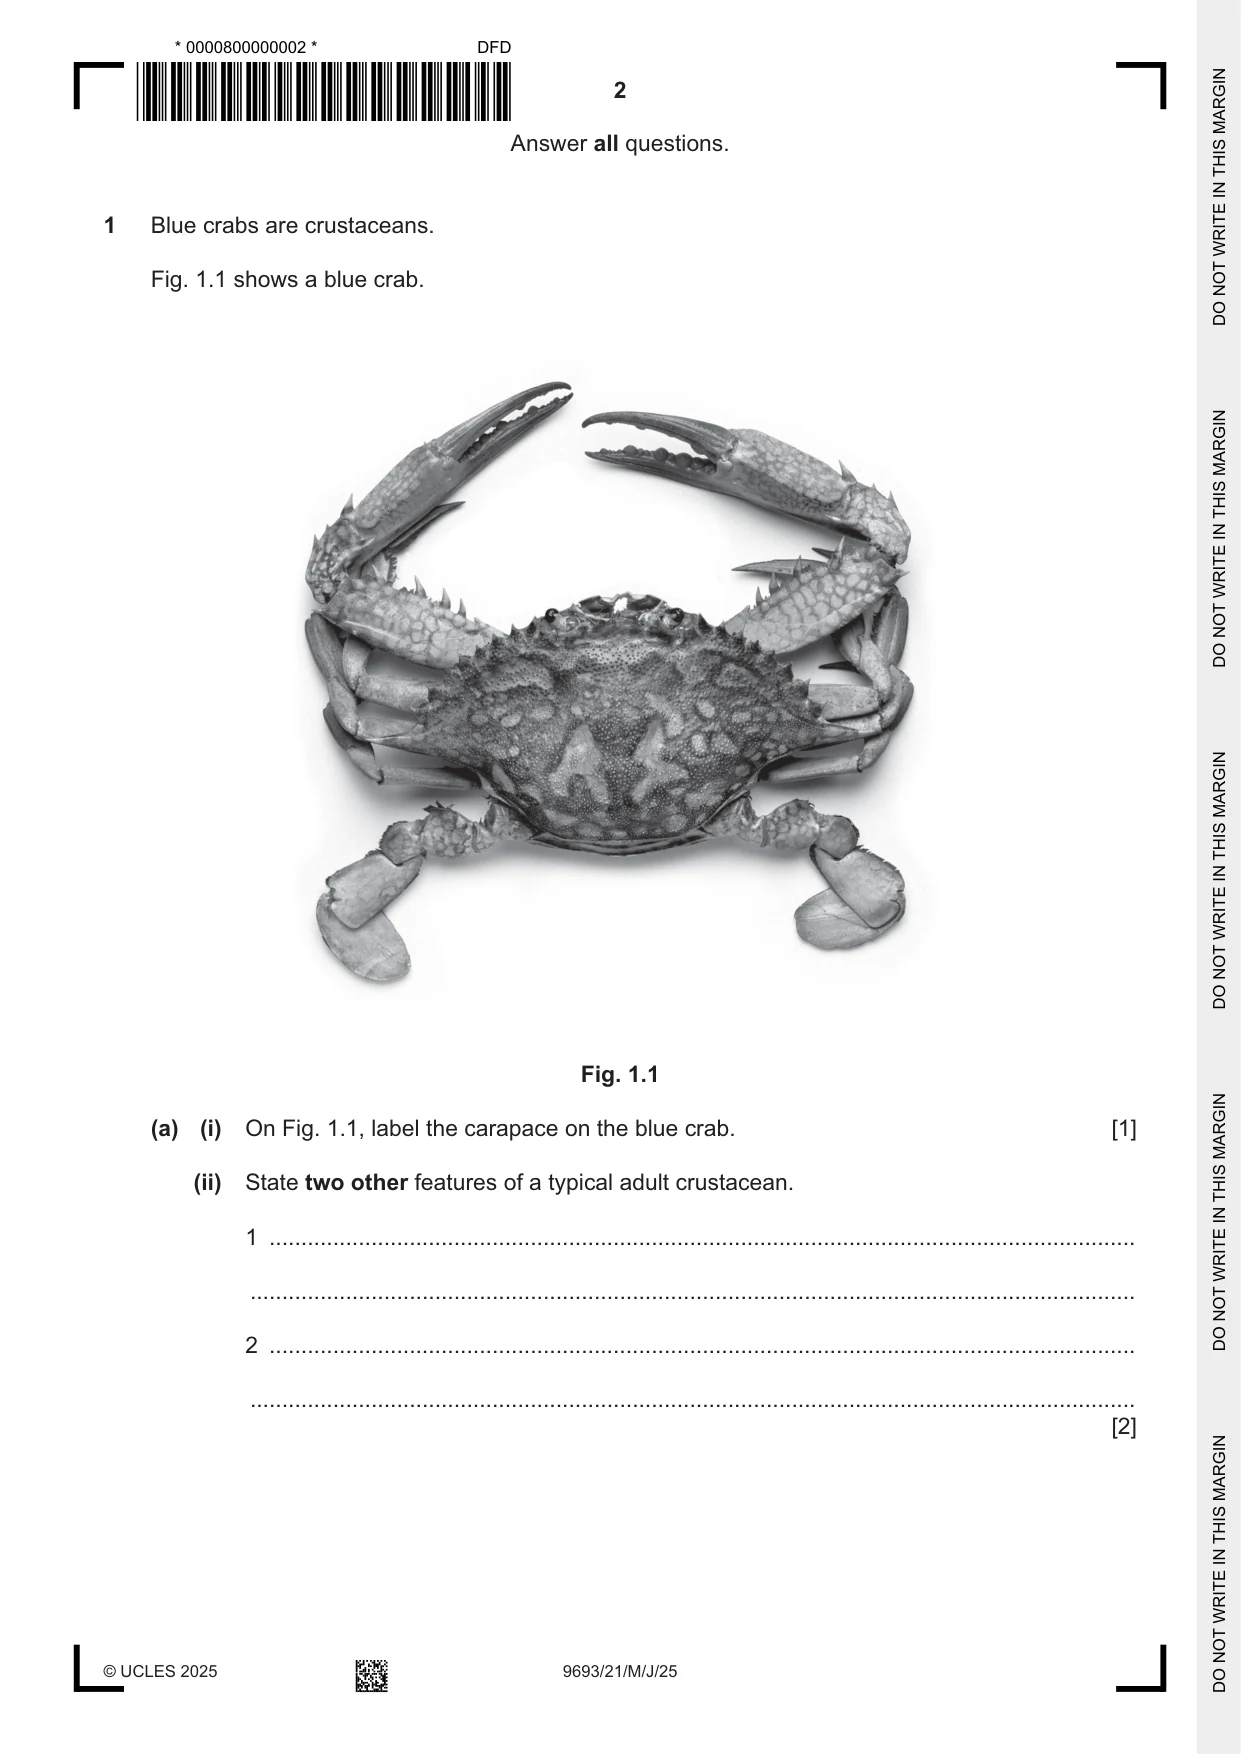
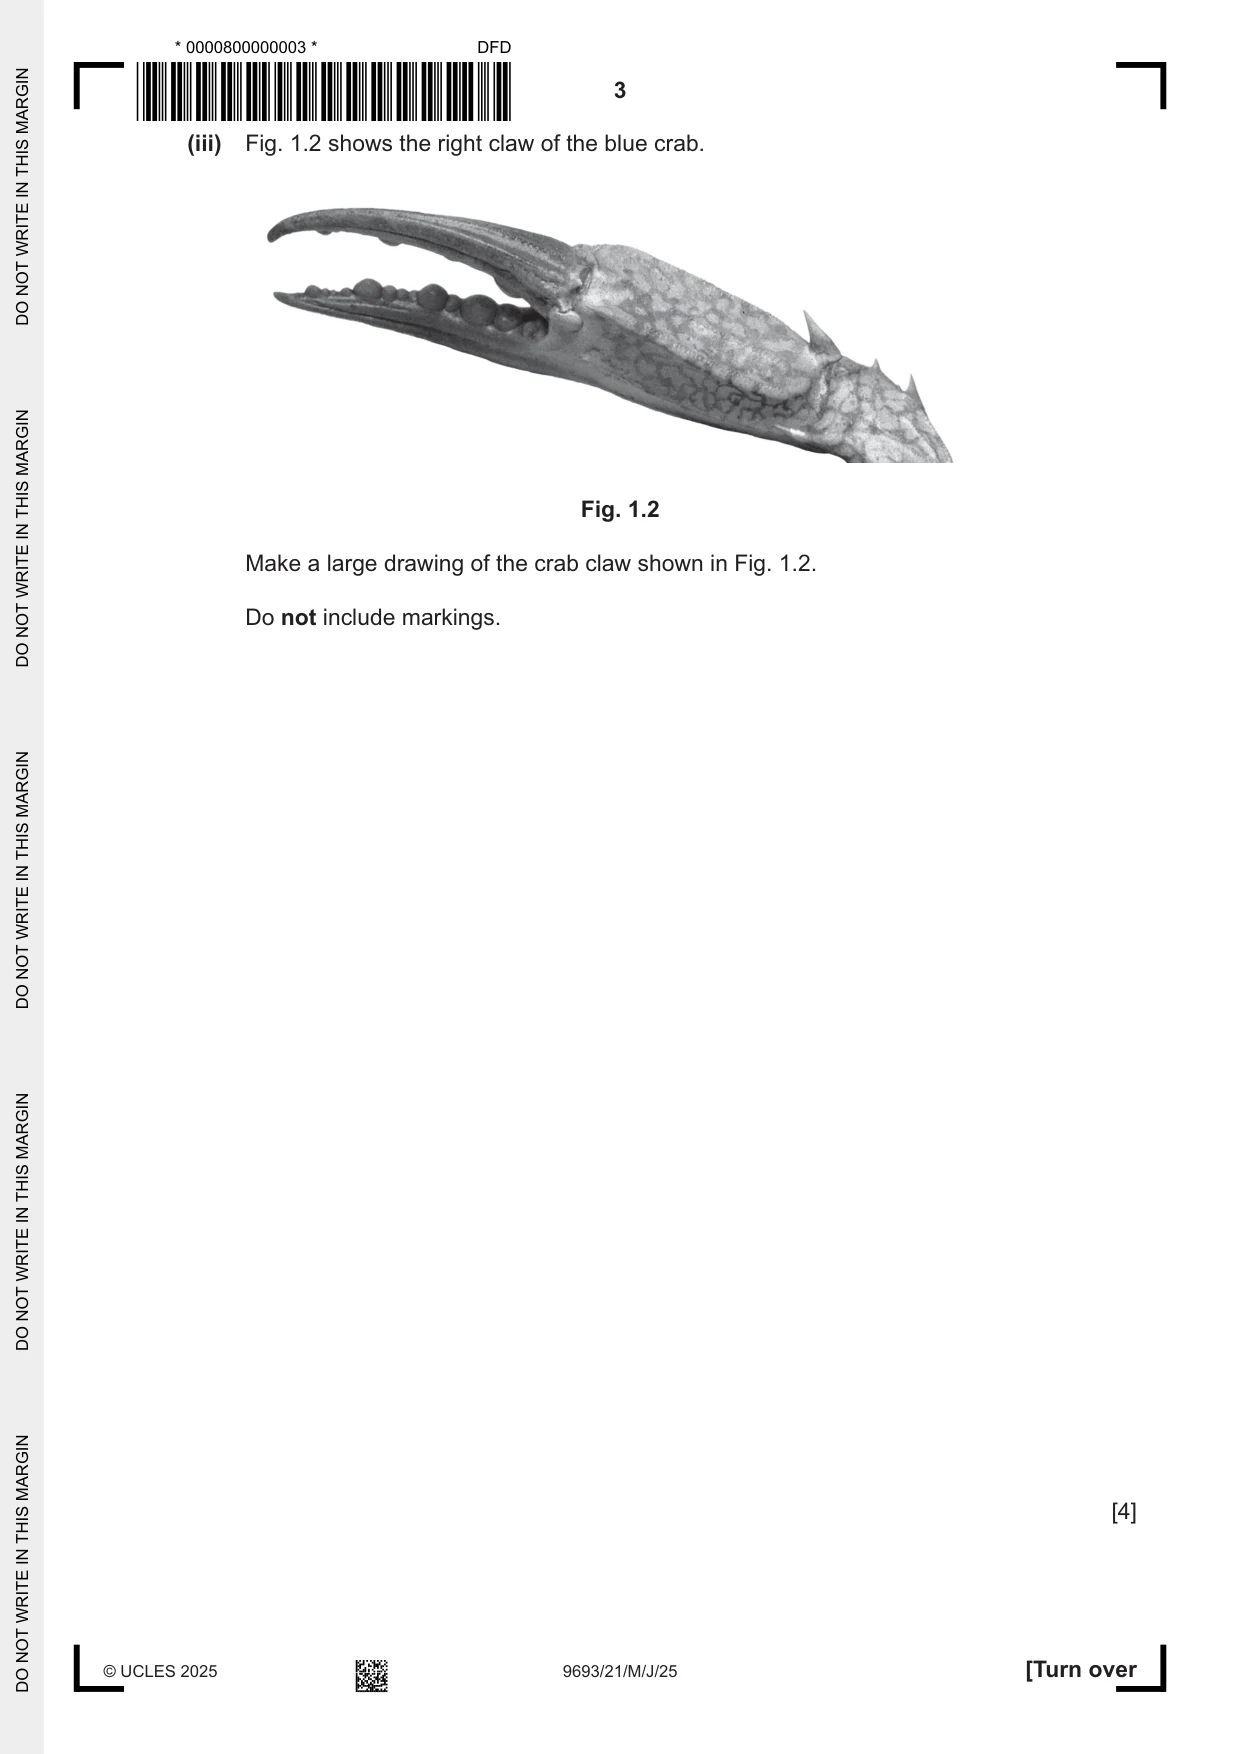
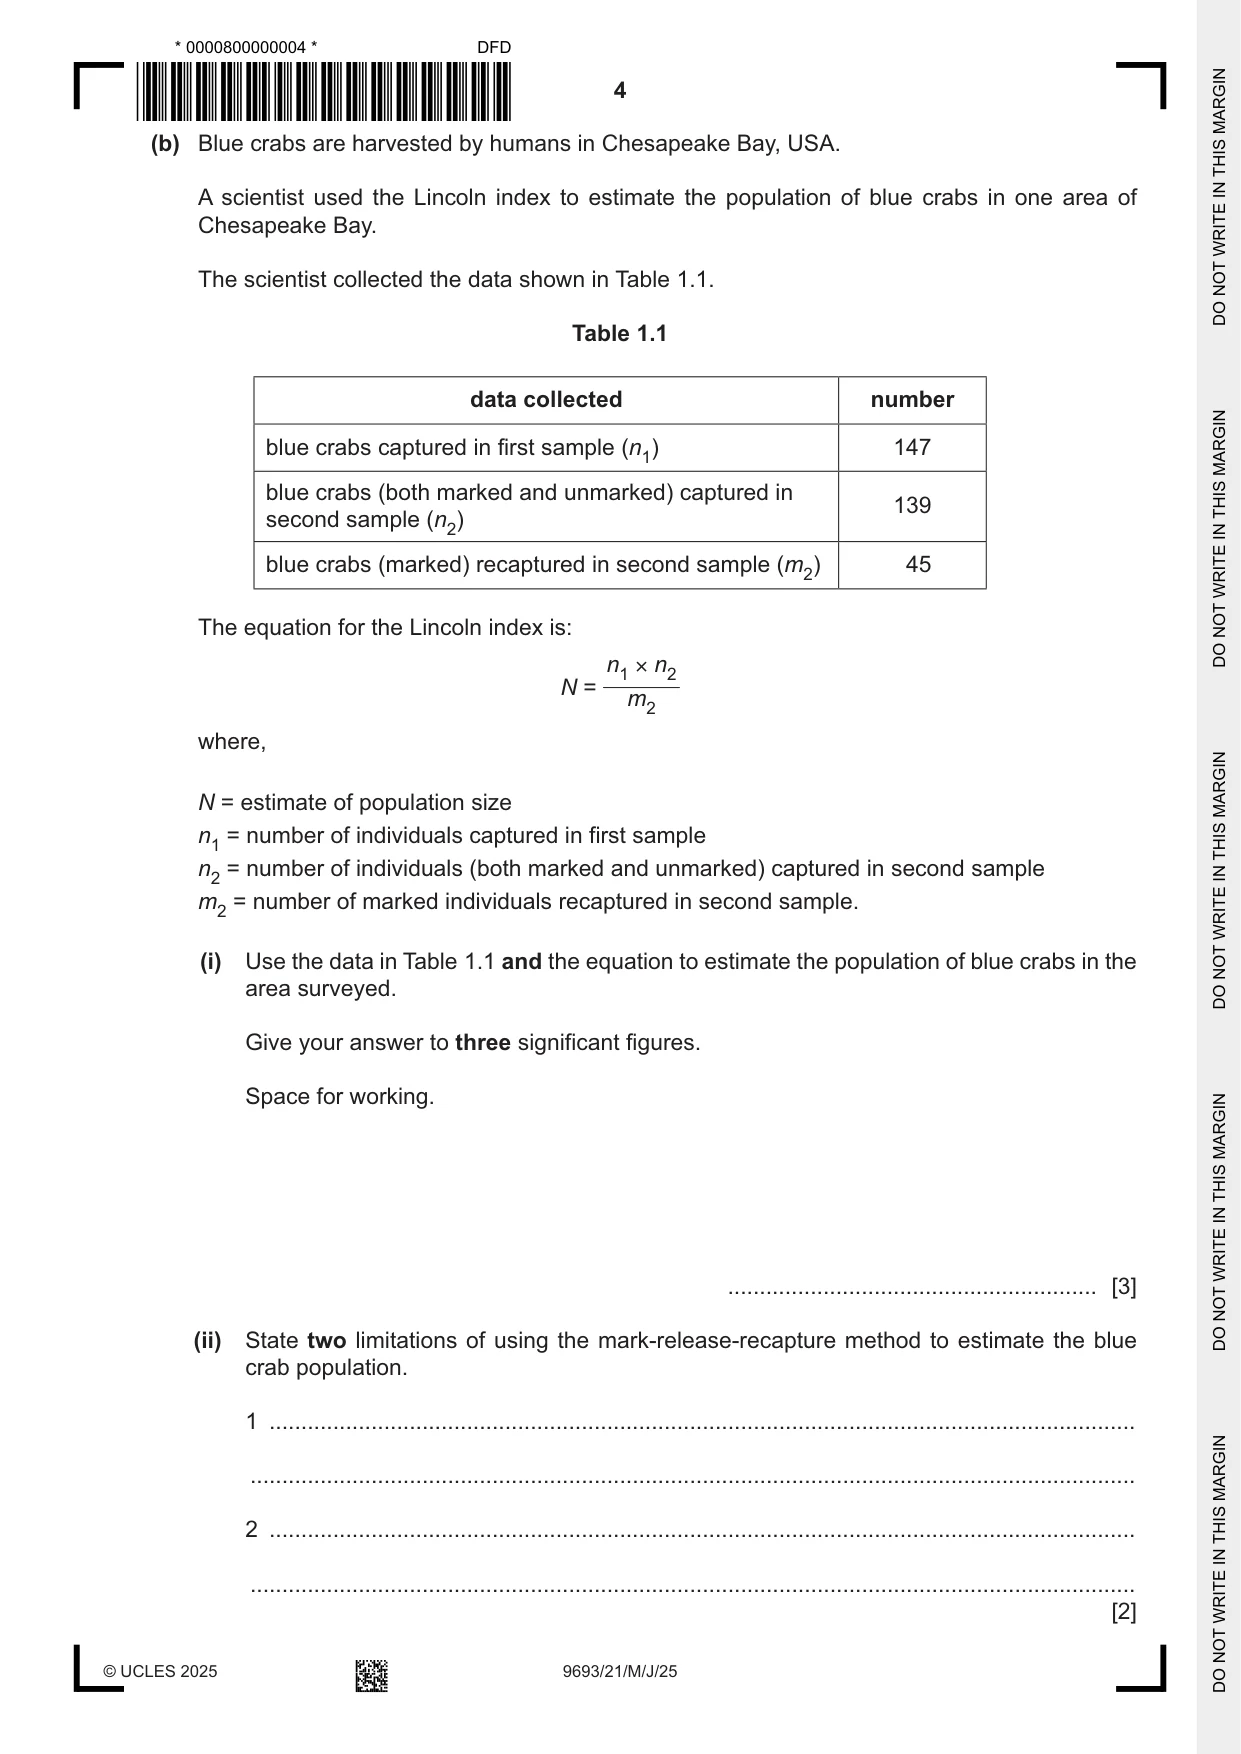
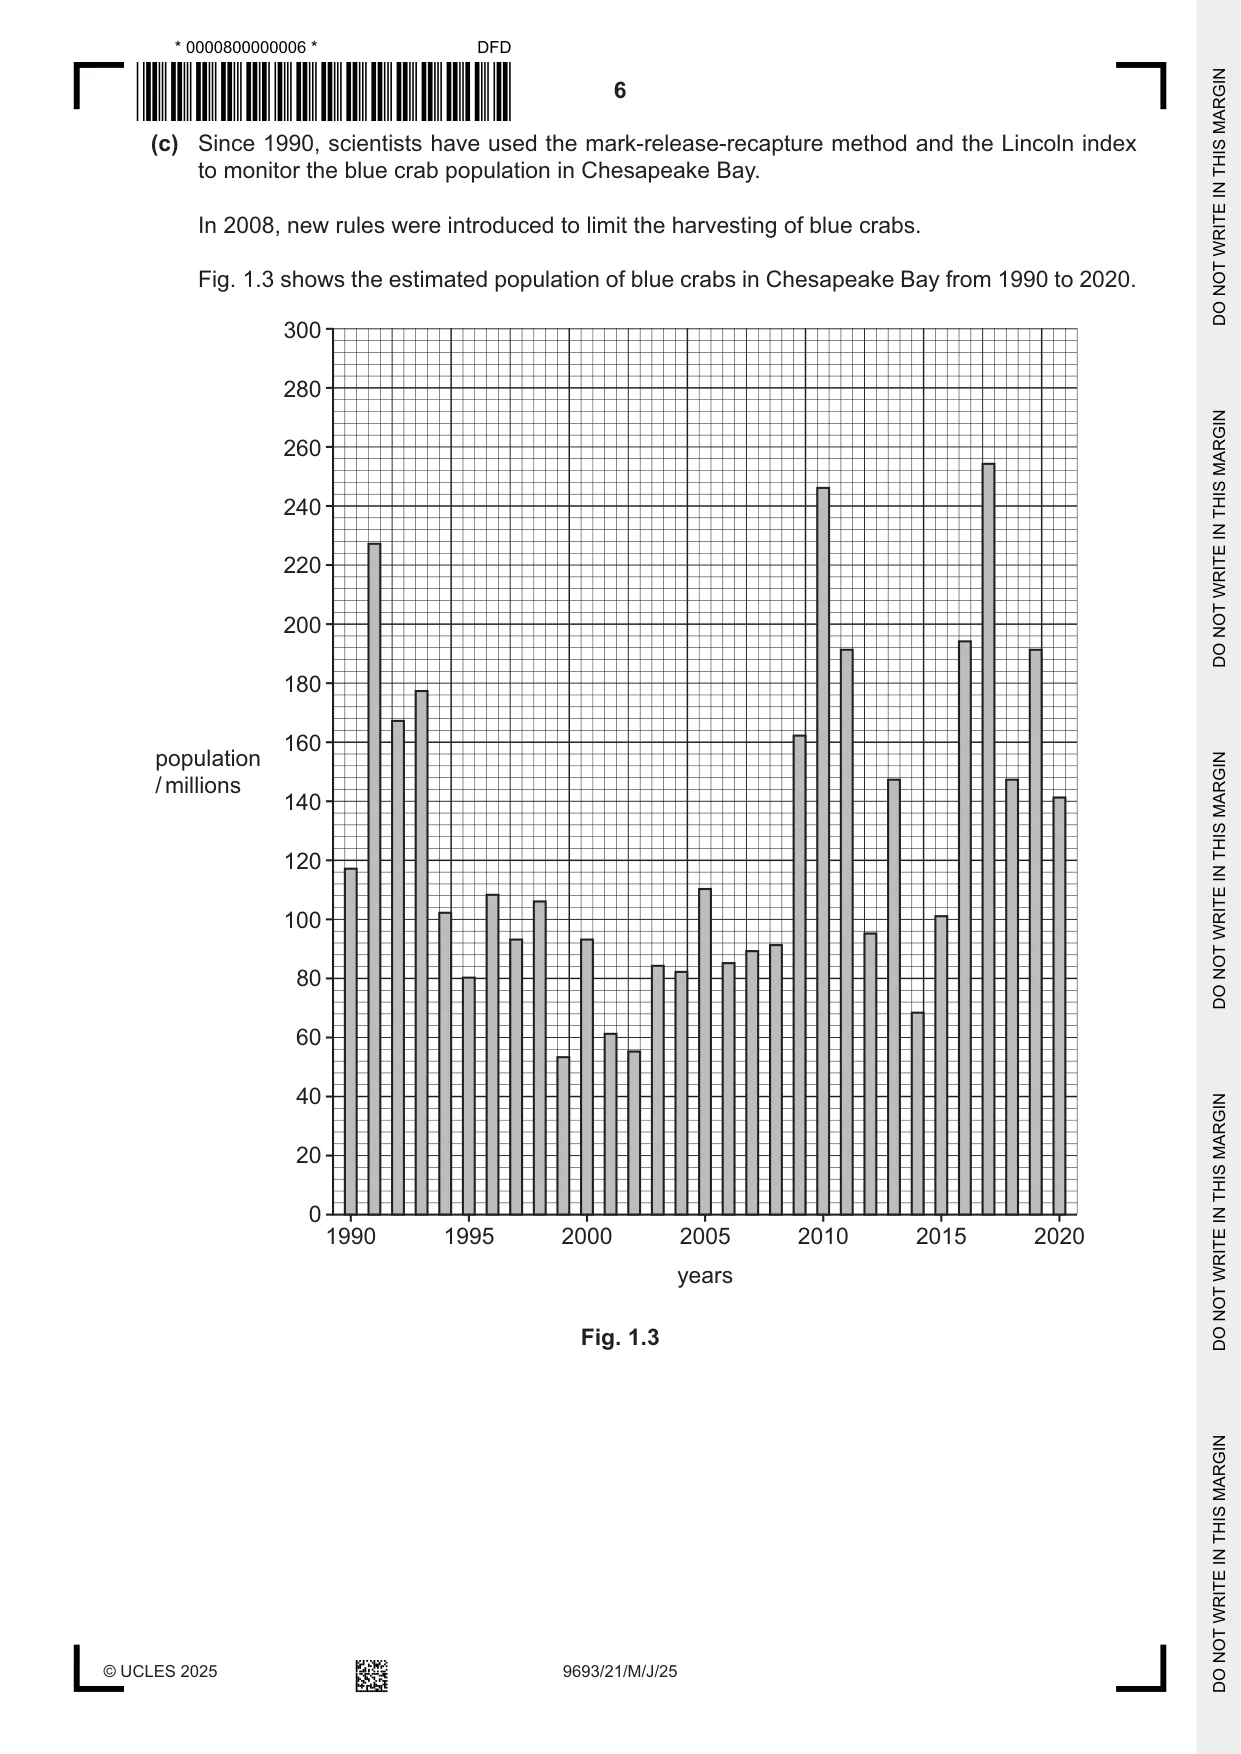
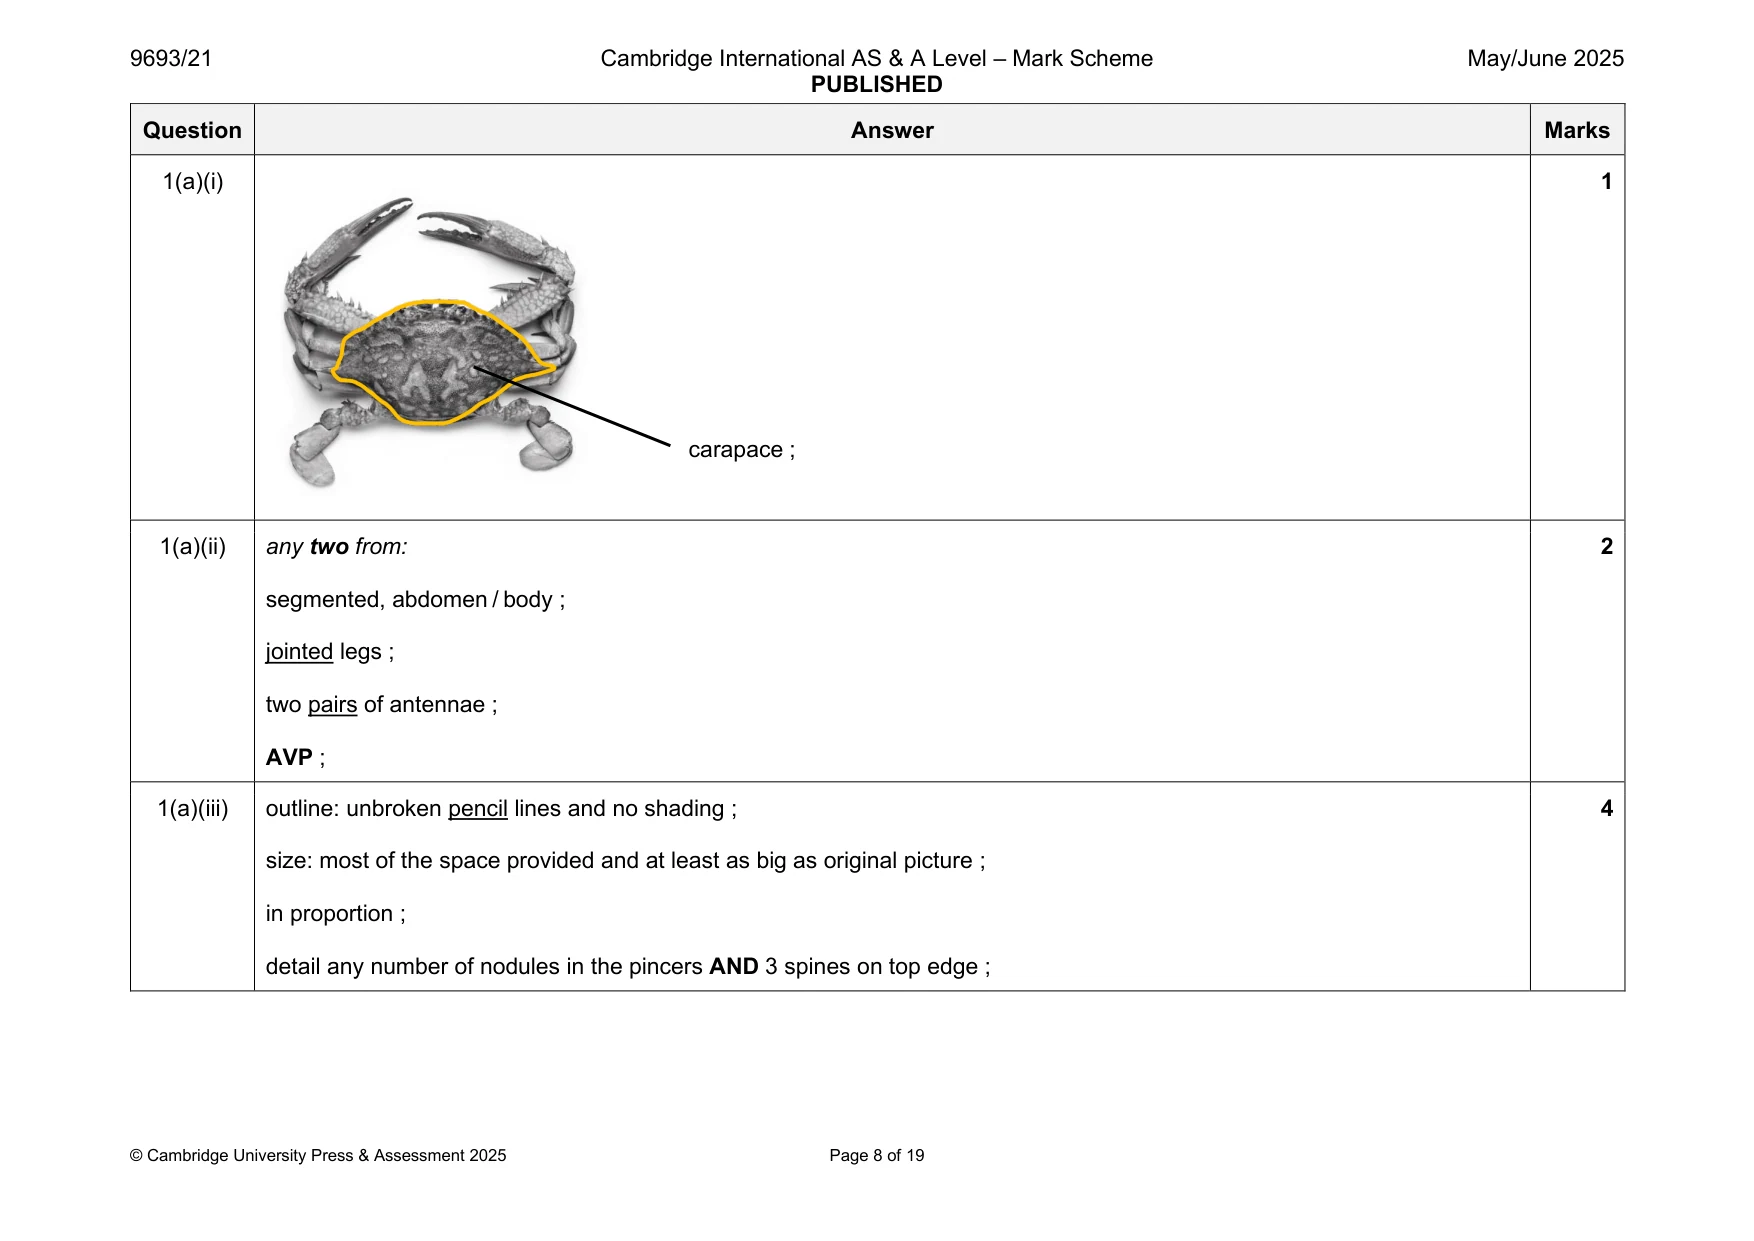
1 Blue crabs are crustaceans. Fig. 1.1 shows a blue crab. Fig. 1.1 (a) (i) On Fig. 1.1, label the carapace on the blue crab. [1] (ii) State two other features of a typical adult crustacean. 1 ........................................................................................................................................ ........................................................................................................................................... 2 ........................................................................................................................................ ........................................................................................................................................... [2] (iii) Fig. 1.2 shows the right claw of the blue crab. Fig. 1.2 Make a large drawing of the crab claw shown in Fig. 1.2. Do not include markings. [4] (b) Blue crabs are harvested by humans in Chesapeake Bay, USA. A scientist used the Lincoln index to estimate the population of blue crabs in one area of Chesapeake Bay. The scientist collected the data shown in Table 1.1. Table 1.1 data collected number blue crabs captured in first sample (n1) 147 blue crabs (both marked and unmarked) captured in 139 second sample (n2) blue crabs (marked) recaptured in second sample (m2) 45 The equation for the Lincoln index is: n1 × n2 N = m2 where, N = estimate of population size n1 = number of individuals captured in first sample n2 = number of individuals (both marked and unmarked) captured in second sample m2 = number of marked individuals recaptured in second sample. (i) Use the data in Table 1.1 and the equation to estimate the population of blue crabs in the area surveyed. Give your answer to three significant figures. Space for working. .......................................................... [3] (ii) State two limitations of using the mark-release-recapture method to estimate the blue crab population. 1 ........................................................................................................................................ ........................................................................................................................................... 2 ........................................................................................................................................ ........................................................................................................................................... [2] (c) Since 1990, scientists have used the mark-release-recapture method and the Lincoln index to monitor the blue crab population in Chesapeake Bay. In 2008, new rules were introduced to limit the harvesting of blue crabs. Fig. 1.3 shows the estimated population of blue crabs in Chesapeake Bay from 1990 to 2020. 300 280 260 240 220 200 180 160 population / millions 140 120 100 80 60 40 20 0 1990 1995 2000 2005 2010 2015 2020 years Fig. 1.3 Use Fig. 1.3 to evaluate the effect of the new harvesting rules on the population of blue crabs. ................................................................................................................................................... ................................................................................................................................................... ................................................................................................................................................... ................................................................................................................................................... ................................................................................................................................................... ................................................................................................................................................... ................................................................................................................................................... ............................................................................................................................................. [4] [Total: 16]
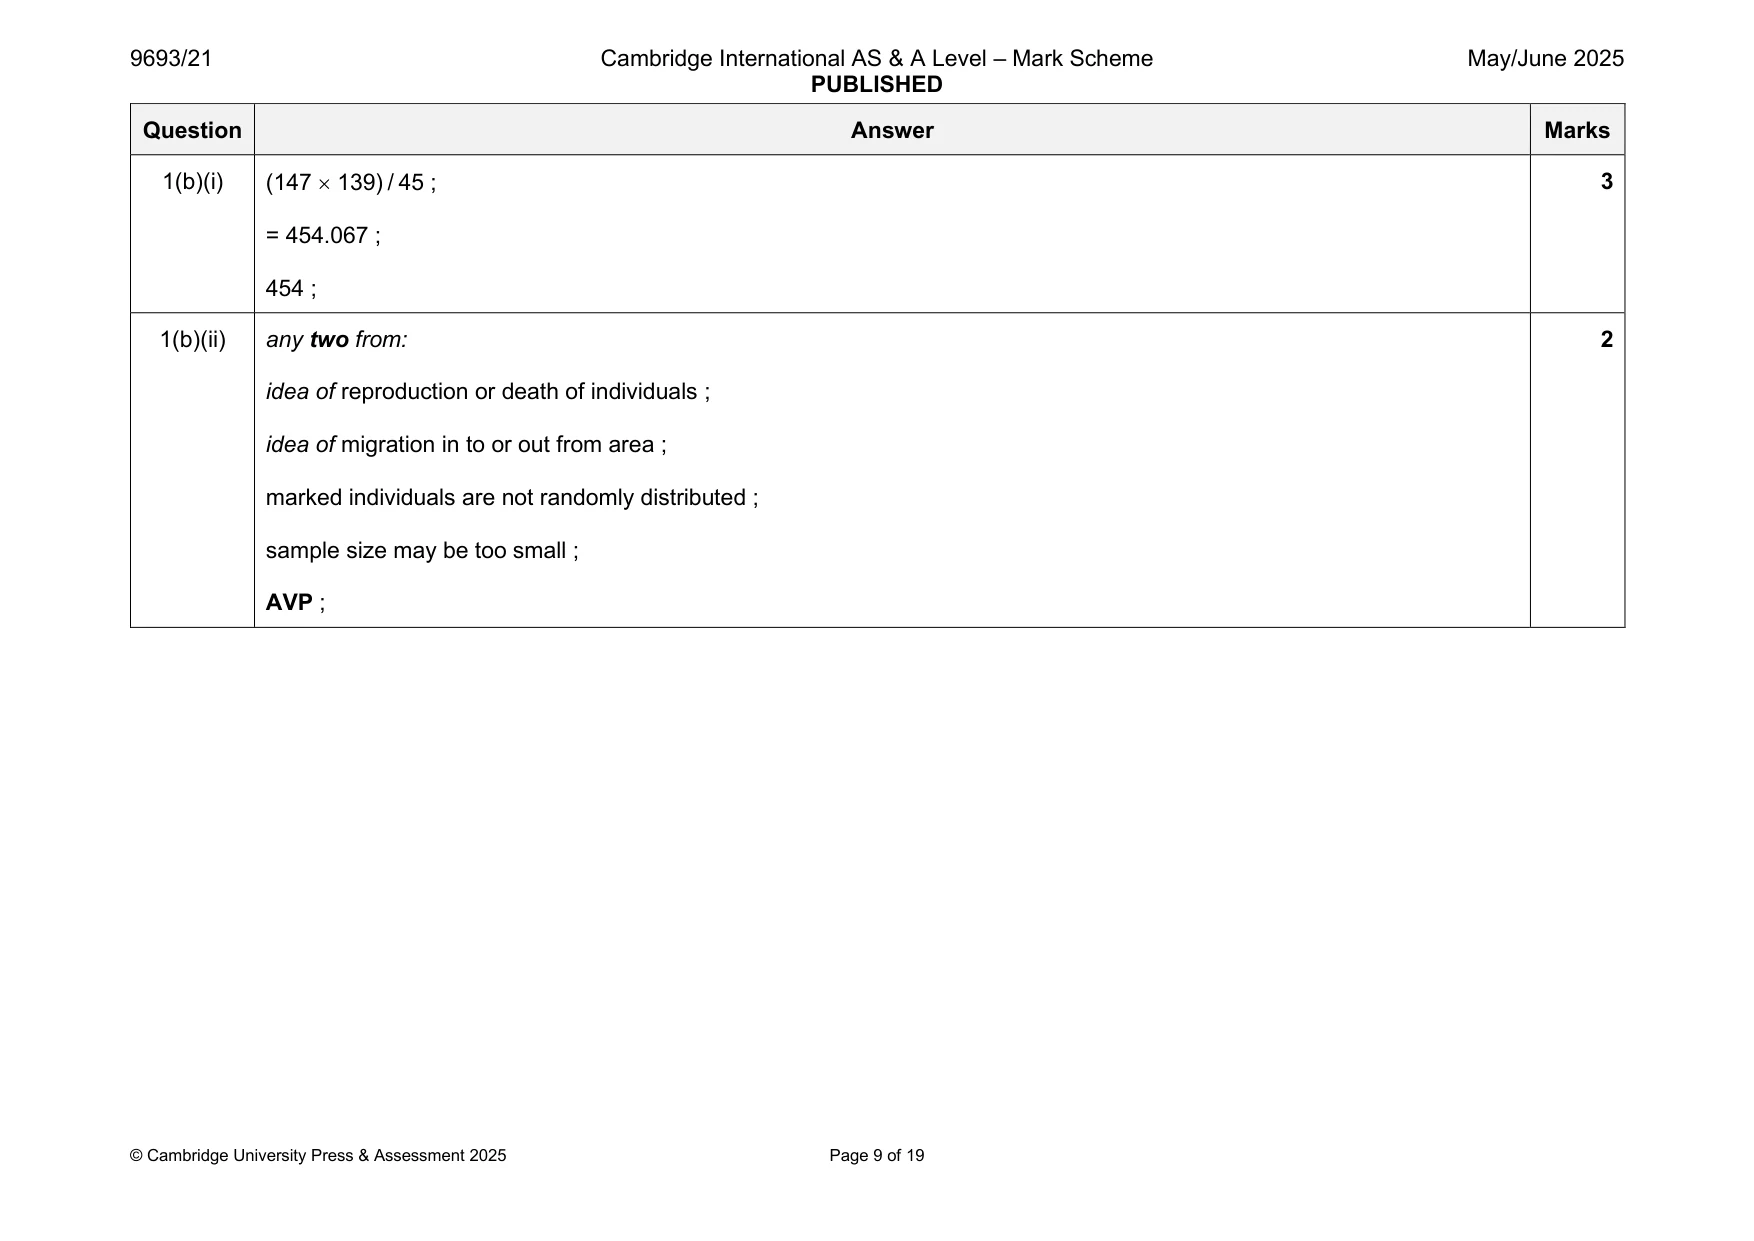
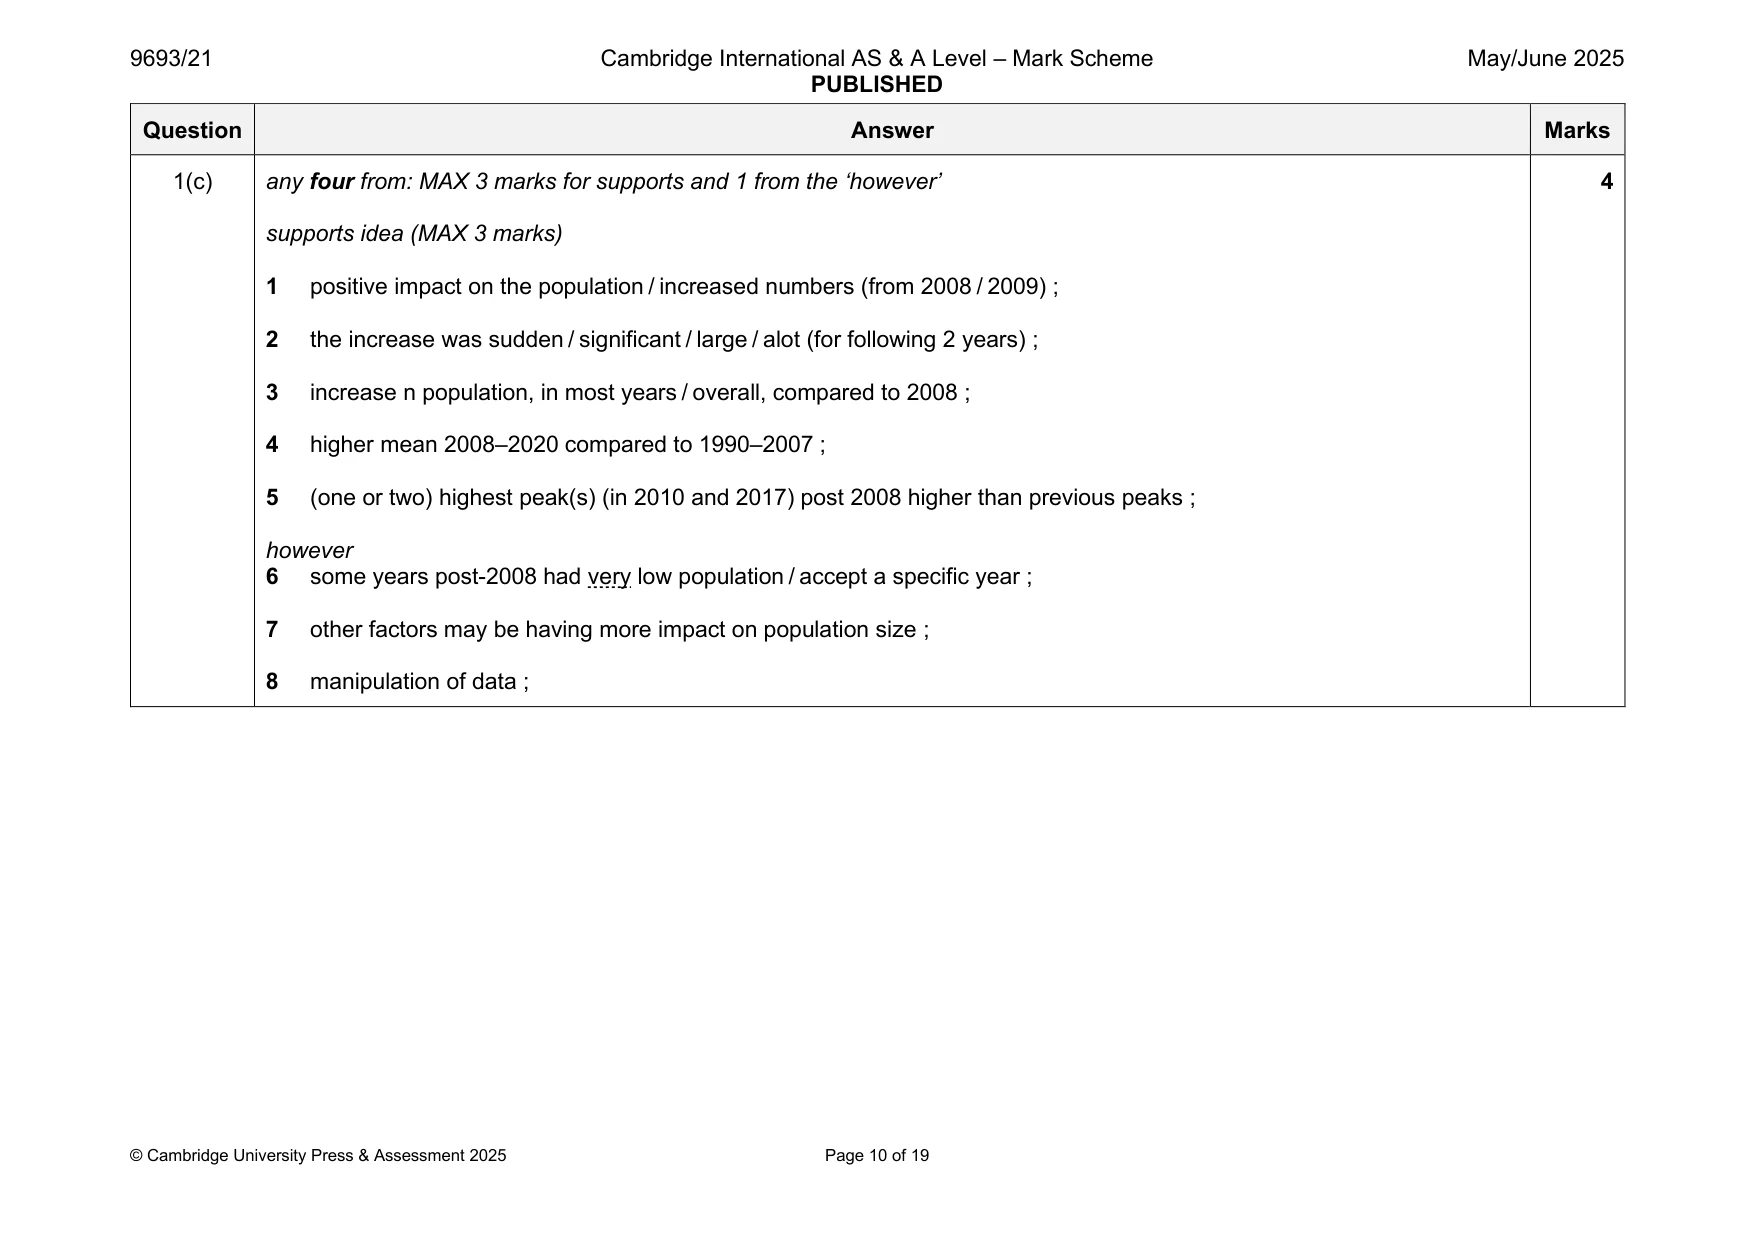
Mark scheme: Question Answer Marks 1(a)(i) 1 carapace ; 1(a)(ii) any two from: 2 segmented, abdomen / body ; jointed legs ; two pairs of antennae ; AVP ; 1(a)(iii) outline: unbroken pencil lines and no shading ; 4 size: most of the space provided and at least as big as original picture ; in proportion ; detail any number of nodules in the pincers AND 3 spines on top edge ; 1(b)(i) (147 139) / 45 ; 3 = 454.067 ; 454 ; 1(b)(ii) any two from: 2 idea of reproduction or death of individuals ; idea of migration in to or out from area ; marked individuals are not randomly distributed ; sample size may be too small ; AVP ; 1(c) any four from: MAX 3 marks for supports and 1 from the ‘however’ 4 supports idea (MAX 3 marks) 1 positive impact on the population / increased numbers (from 2008 / 2009) ; 2 the increase was sudden / significant / large / alot (for following 2 years) ; 3 increase n population, in most years / overall, compared to 2008 ; 4 higher mean 2008–2020 compared to 1990–2007 ; 5 (one or two) highest peak(s) (in 2010 and 2017) post 2008 higher than previous peaks ; however 6 some years post-2008 had very low population / accept a specific year ; 7 other factors may be having more impact on population size ; 8 manipulation of data ;
Q2 · Nitrate ions (NO3–) are a source of nitrogen for marine producers such as seagrass
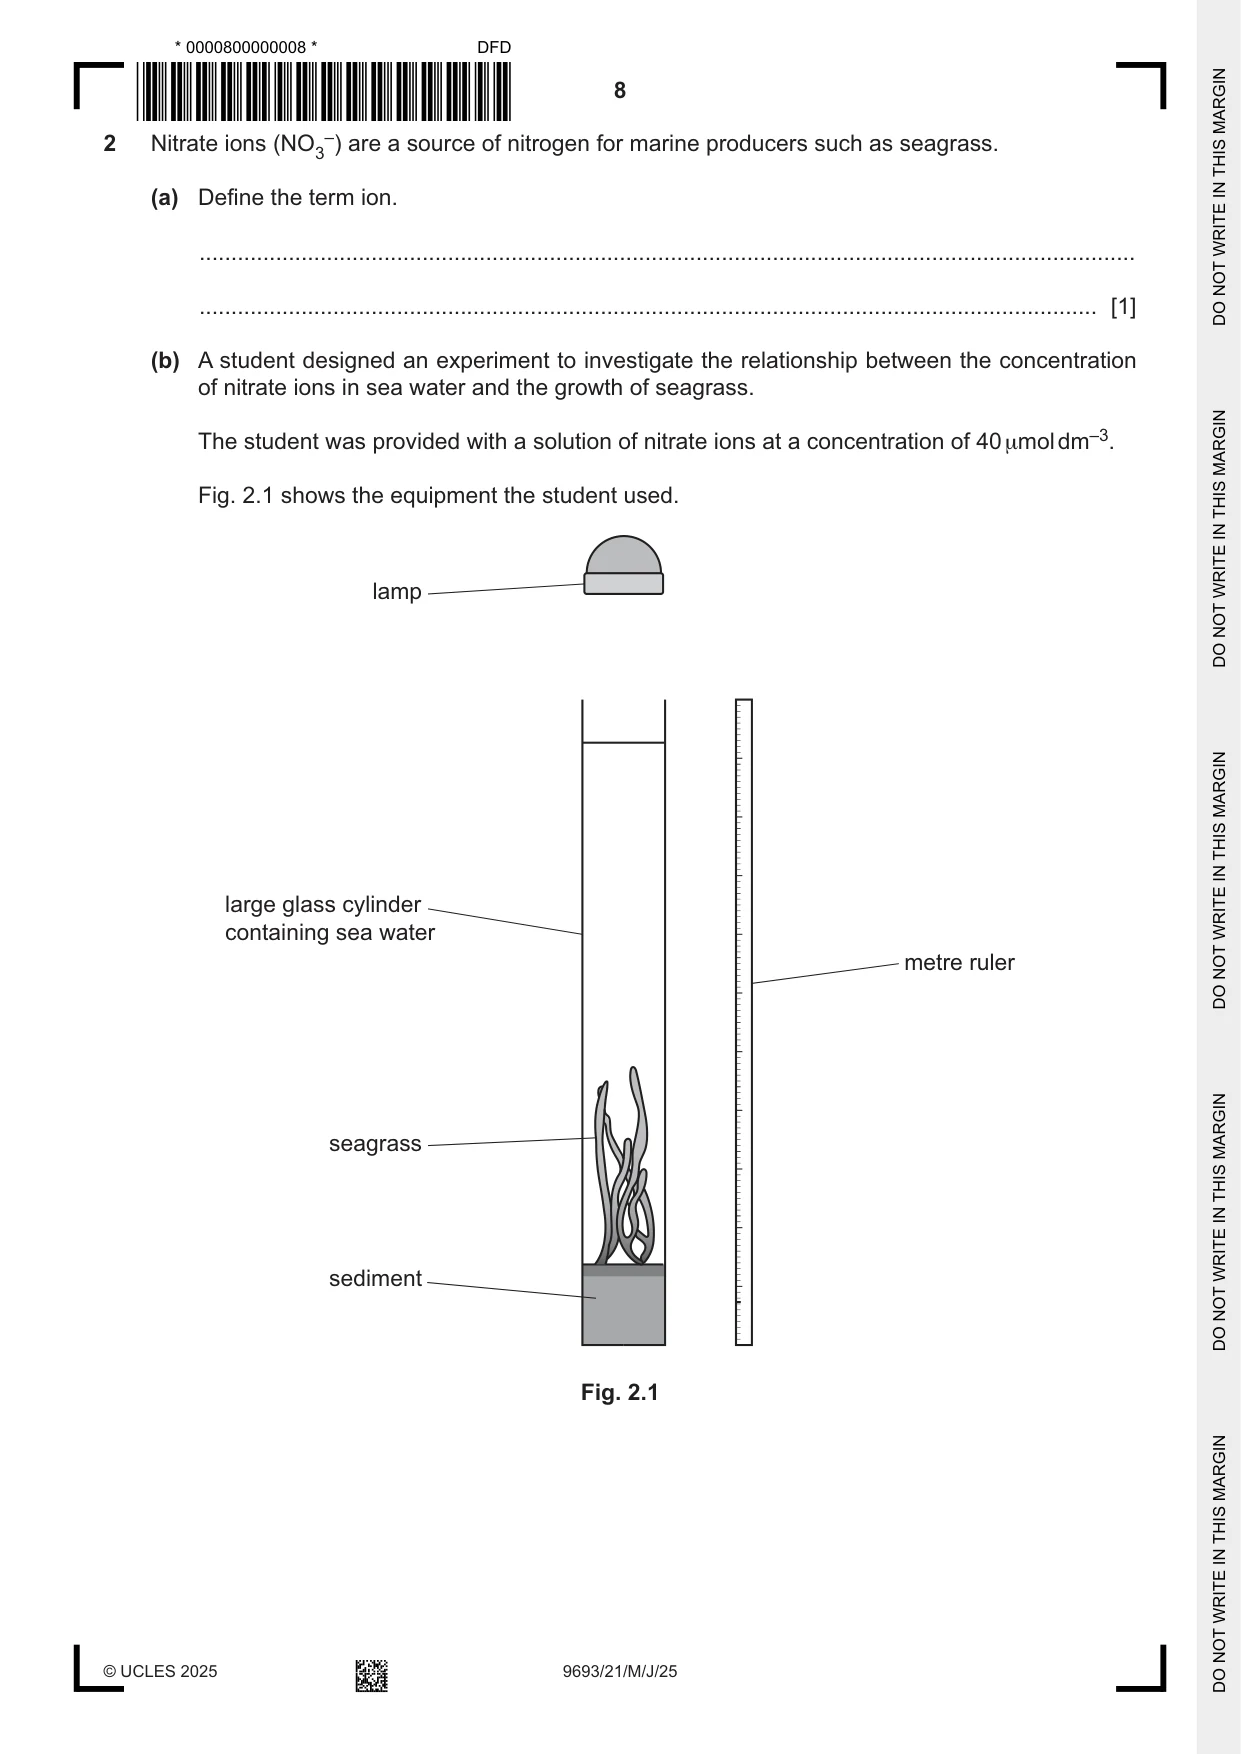
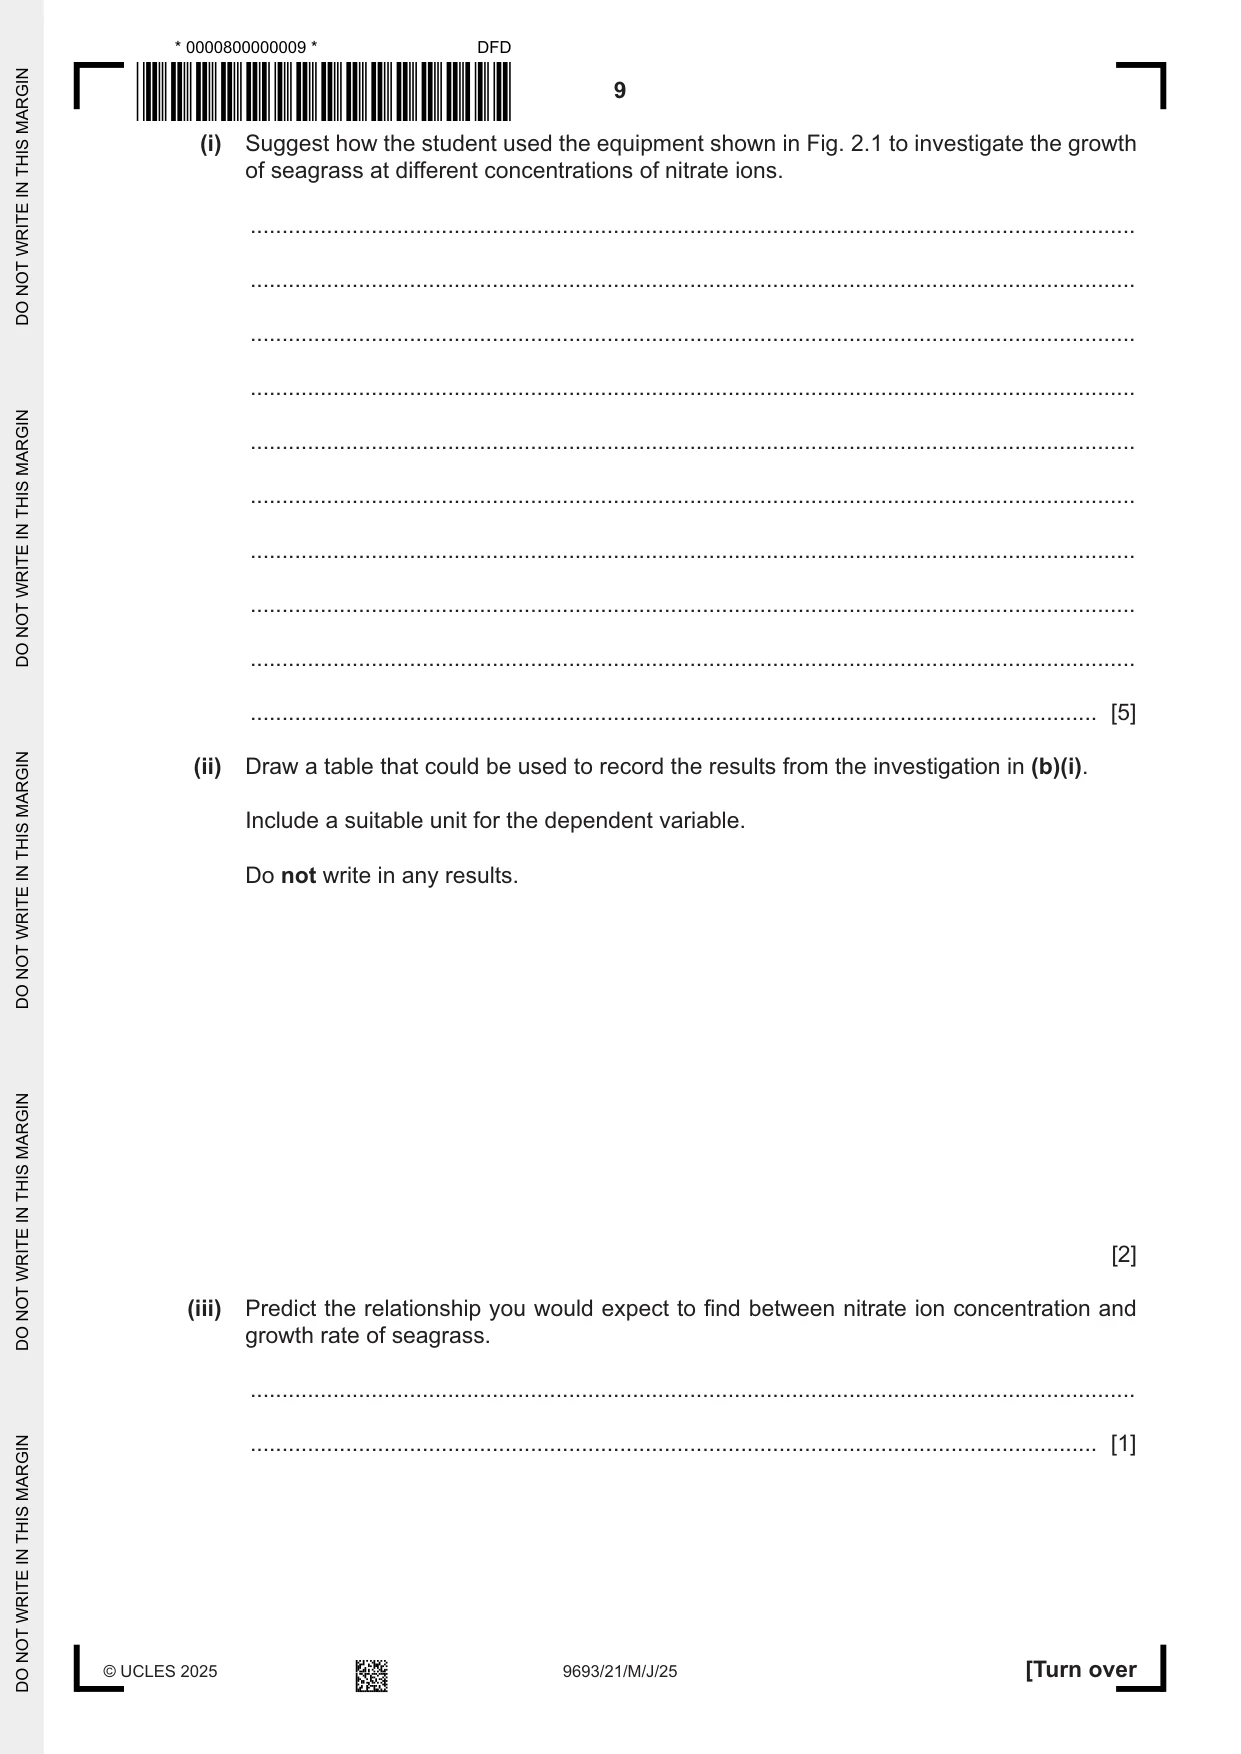
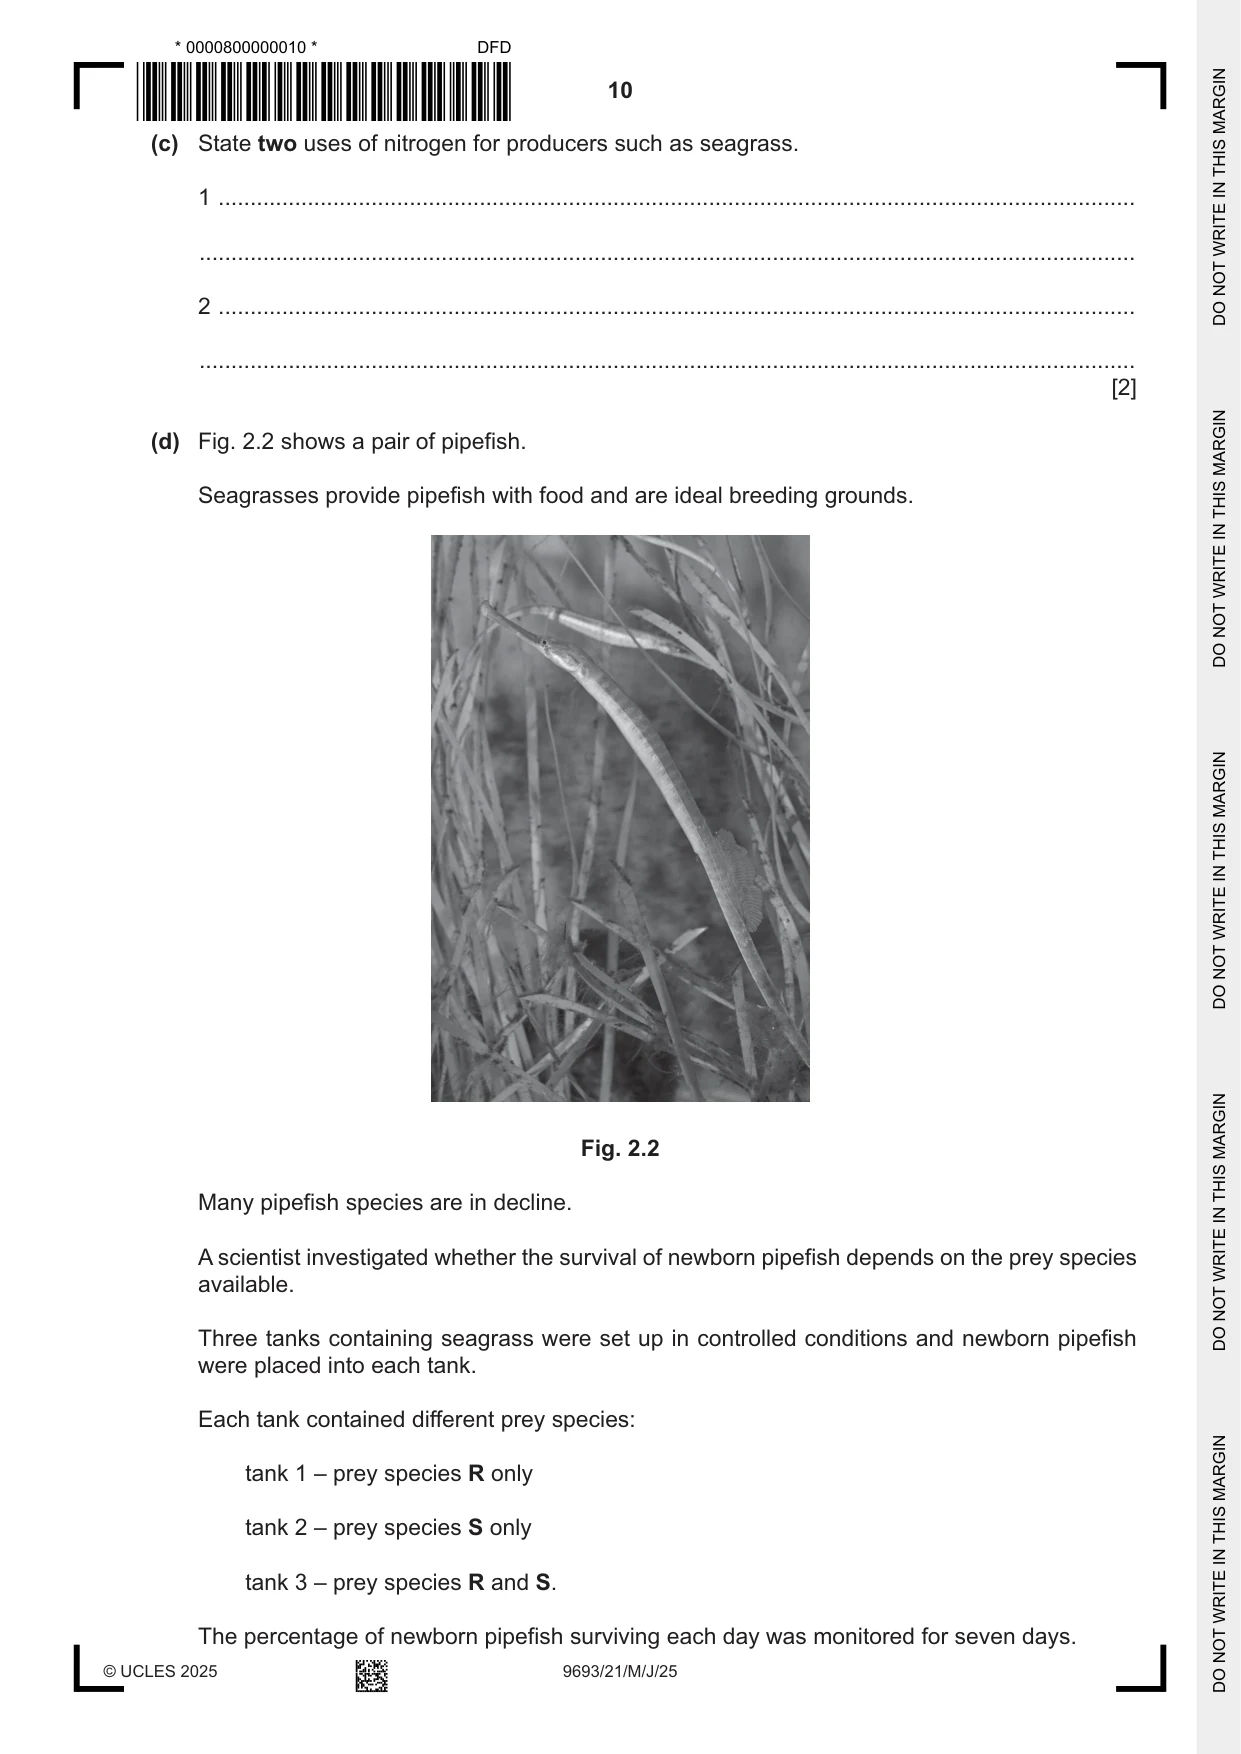
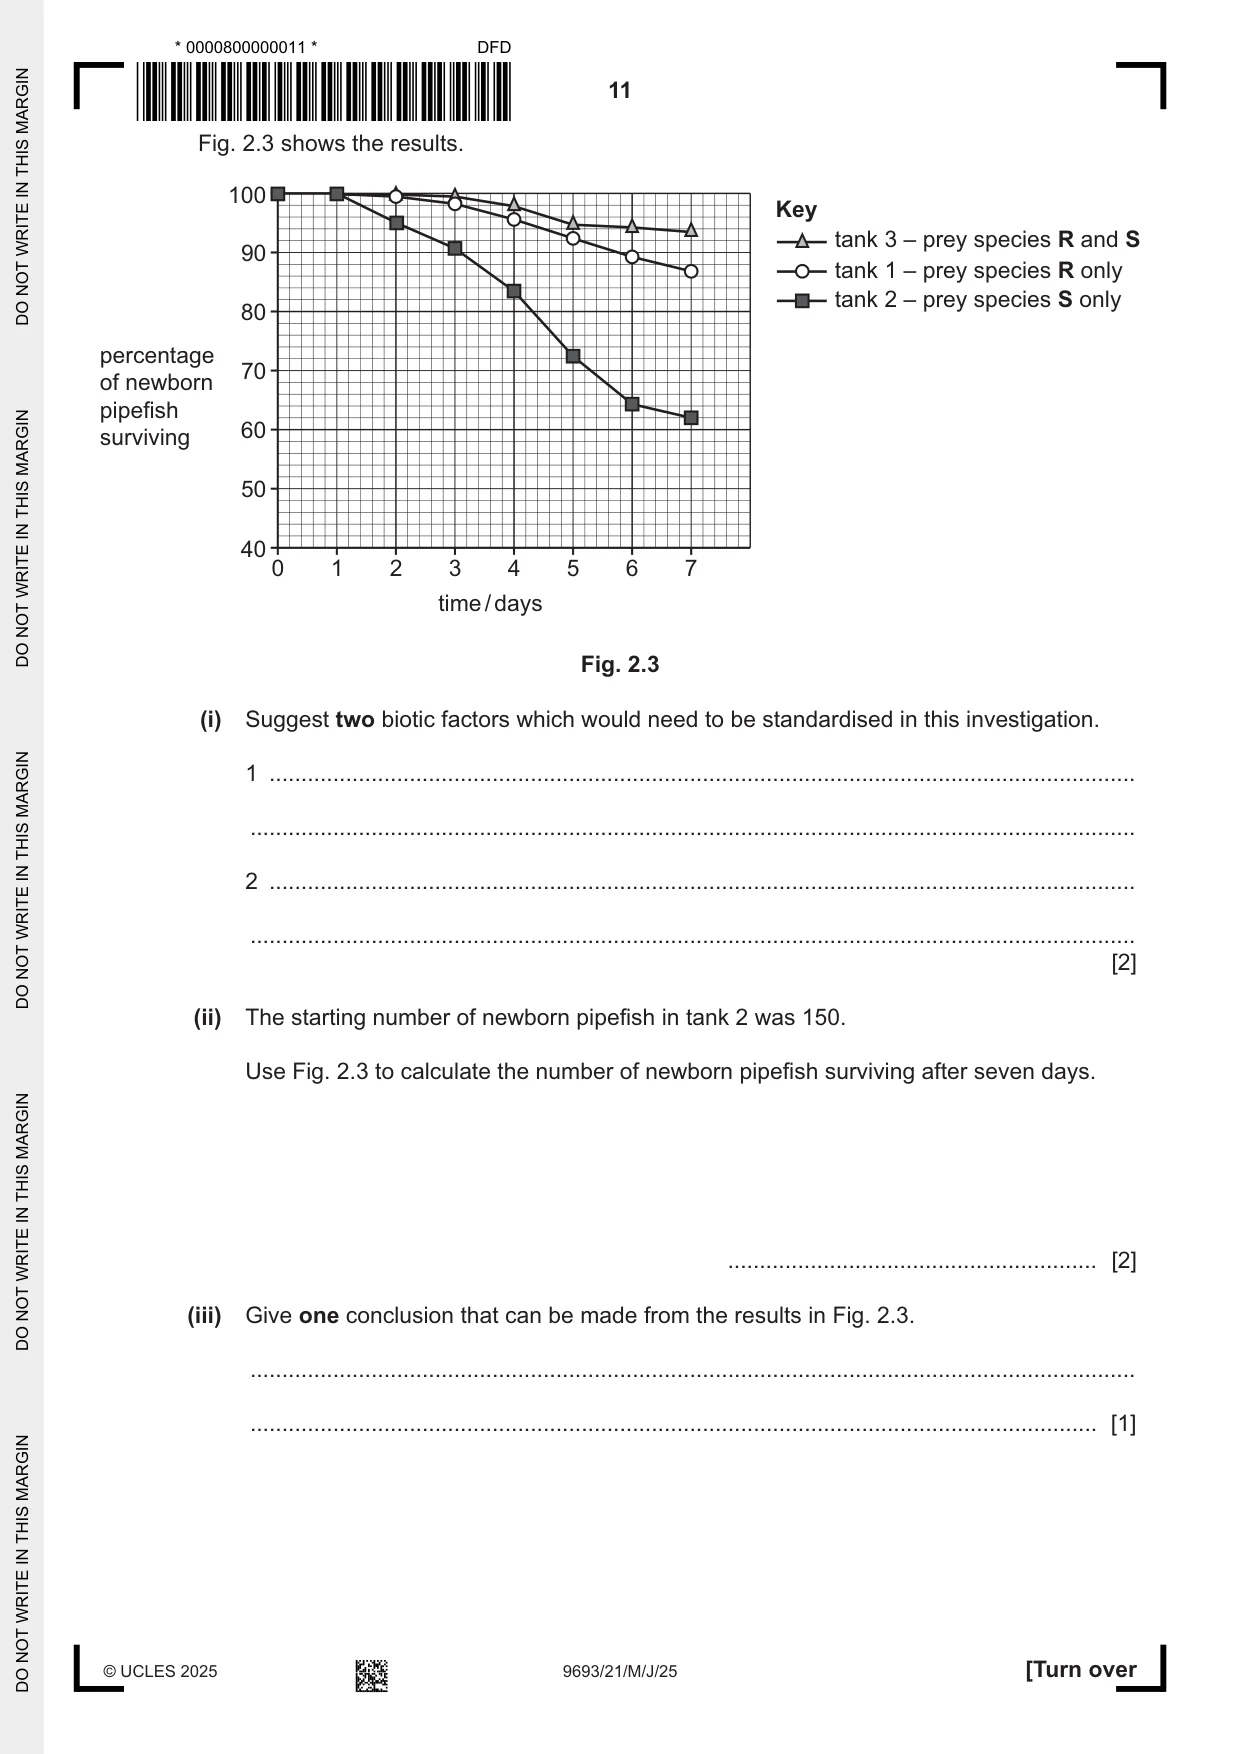
2 Nitrate ions (NO3–) are a source of nitrogen for marine producers such as seagrass. (a) Define the term ion. ................................................................................................................................................... ............................................................................................................................................. [1] (b) A student designed an experiment to investigate the relationship between the concentration of nitrate ions in sea water and the growth of seagrass. The student was provided with a solution of nitrate ions at a concentration of 40 µmol dm–3. Fig. 2.1 shows the equipment the student used. lamp large glass cylinder containing sea water metre ruler seagrass sediment Fig. 2.1 (i) Suggest how the student used the equipment shown in Fig. 2.1 to investigate the growth of seagrass at different concentrations of nitrate ions. ........................................................................................................................................... ........................................................................................................................................... ........................................................................................................................................... ........................................................................................................................................... ........................................................................................................................................... ........................................................................................................................................... ........................................................................................................................................... ........................................................................................................................................... ........................................................................................................................................... ..................................................................................................................................... [5] (ii) Draw a table that could be used to record the results from the investigation in (b)(i). Include a suitable unit for the dependent variable. Do not write in any results. [2] (iii) Predict the relationship you would expect to find between nitrate ion concentration and growth rate of seagrass. ........................................................................................................................................... ..................................................................................................................................... [1] (c) State two uses of nitrogen for producers such as seagrass. 1 ................................................................................................................................................ ................................................................................................................................................... 2 ................................................................................................................................................ ................................................................................................................................................... [2] (d) Fig. 2.2 shows a pair of pipefish. Seagrasses provide pipefish with food and are ideal breeding grounds. Fig. 2.2 Many pipefish species are in decline. A scientist investigated whether the survival of newborn pipefish depends on the prey species available. Three tanks containing seagrass were set up in controlled conditions and newborn pipefish were placed into each tank. Each tank contained different prey species: tank 1 – prey species R only tank 2 – prey species S only tank 3 – prey species R and S. The percentage of newborn pipefish surviving each day was monitored for seven days. Fig. 2.3 shows the results. 100 Key tank 3 – prey species R and S 90 tank 1 – prey species R only tank 2 – prey species S only 80 percentage 70of newborn pipefish 60surviving 50 40 0 1 2 3 4 5 6 7 time / days Fig. 2.3 (i) Suggest two biotic factors which would need to be standardised in this investigation. 1 ........................................................................................................................................ ........................................................................................................................................... 2 ........................................................................................................................................ ........................................................................................................................................... [2] (ii) The starting number of newborn pipefish in tank 2 was 150. Use Fig. 2.3 to calculate the number of newborn pipefish surviving after seven days. .......................................................... [2] (iii) Give one conclusion that can be made from the results in Fig. 2.3. ........................................................................................................................................... ..................................................................................................................................... [1] (iv) Describe two limitations of the data collected in this investigation. 1 ........................................................................................................................................ ........................................................................................................................................... 2 ........................................................................................................................................ ........................................................................................................................................... [2] [Total: 18]
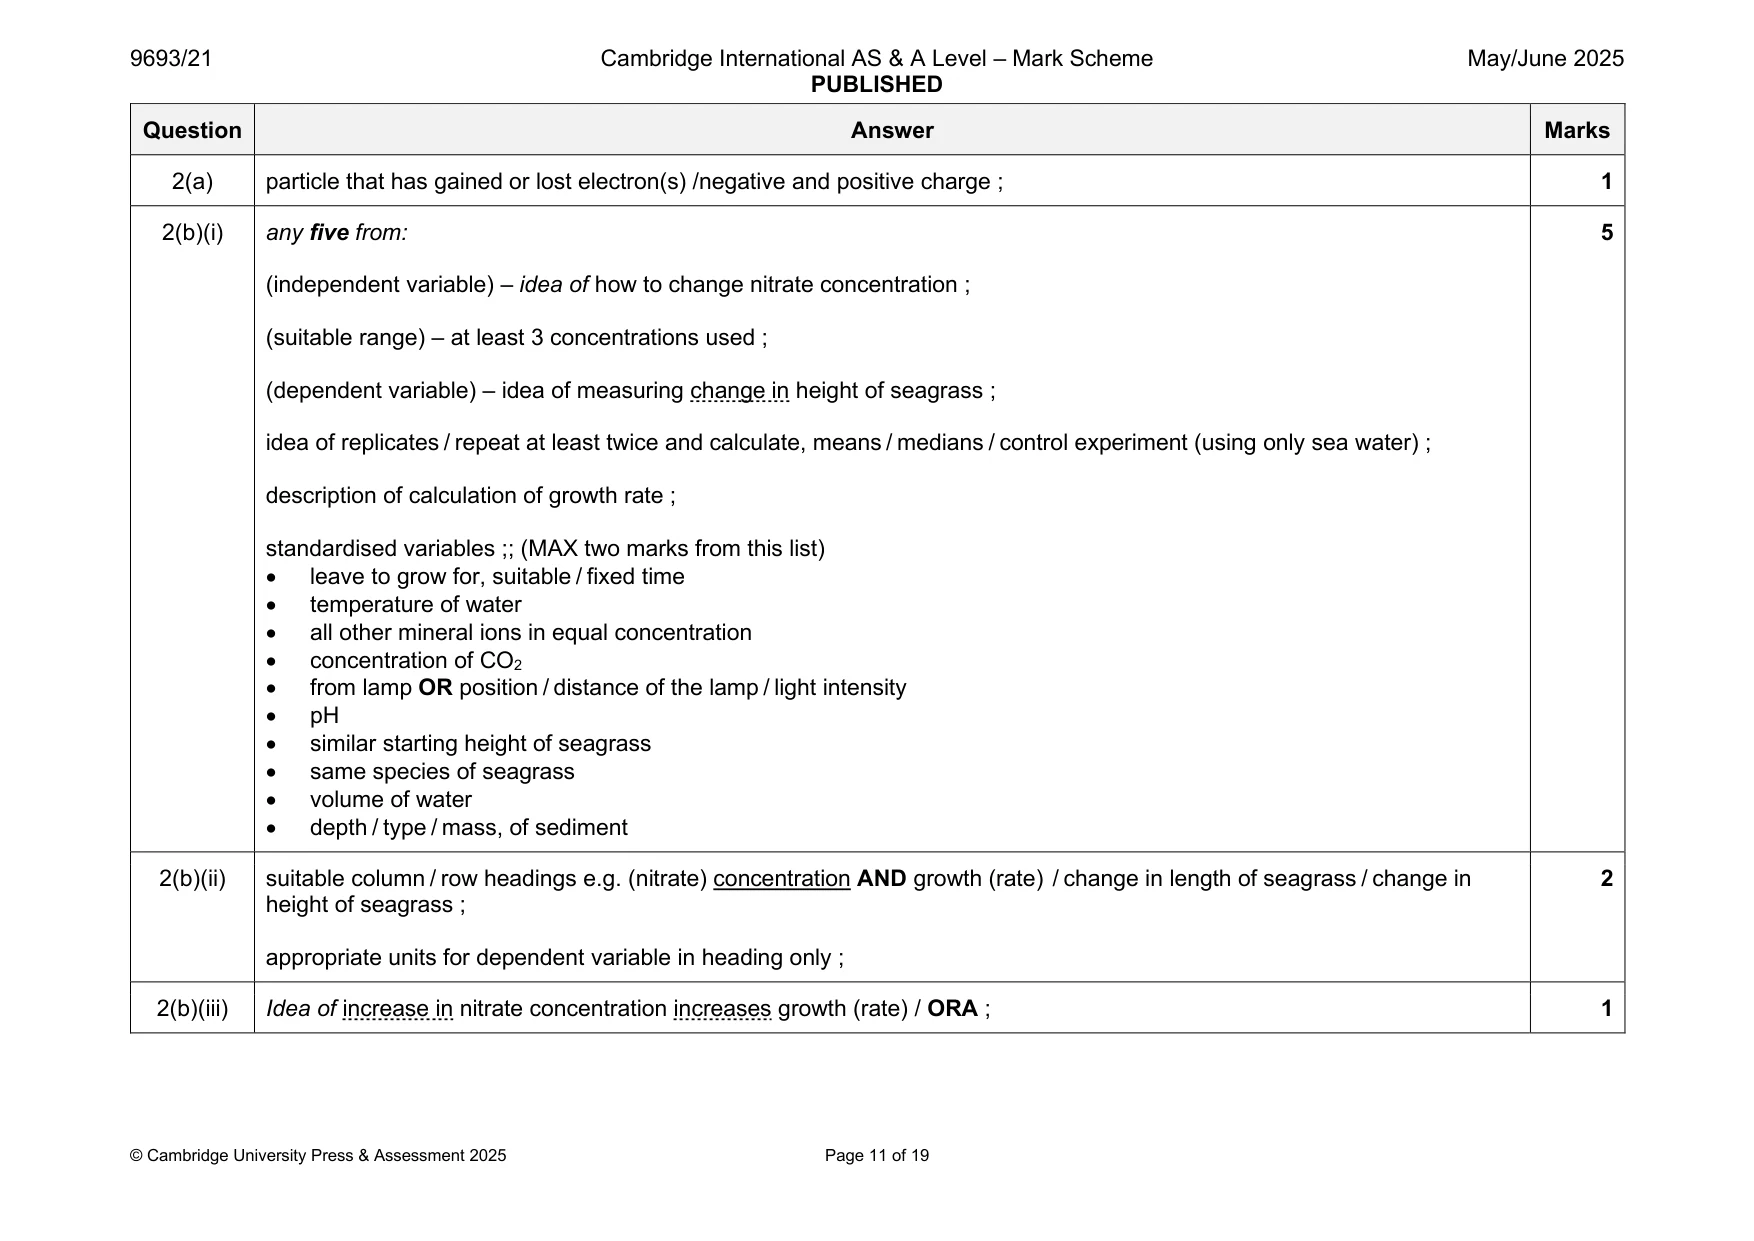
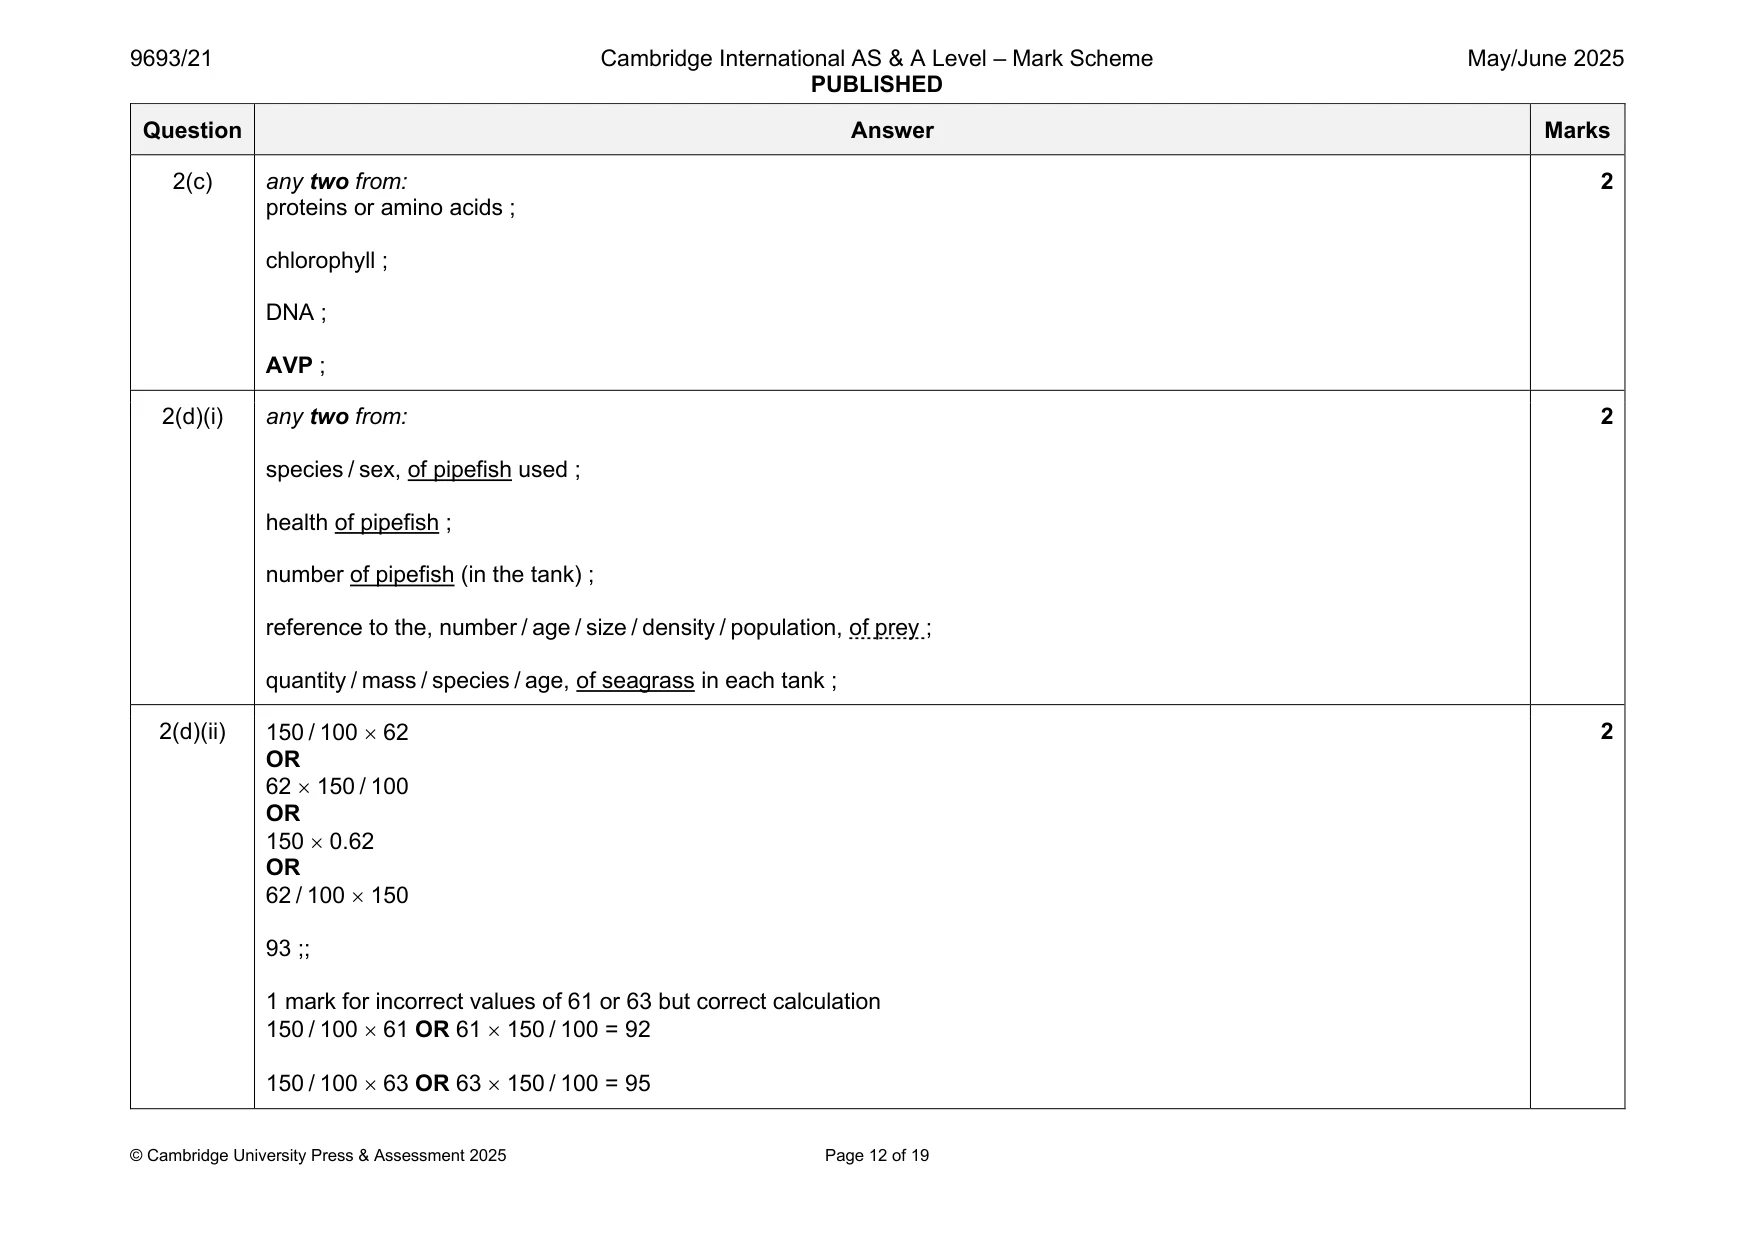
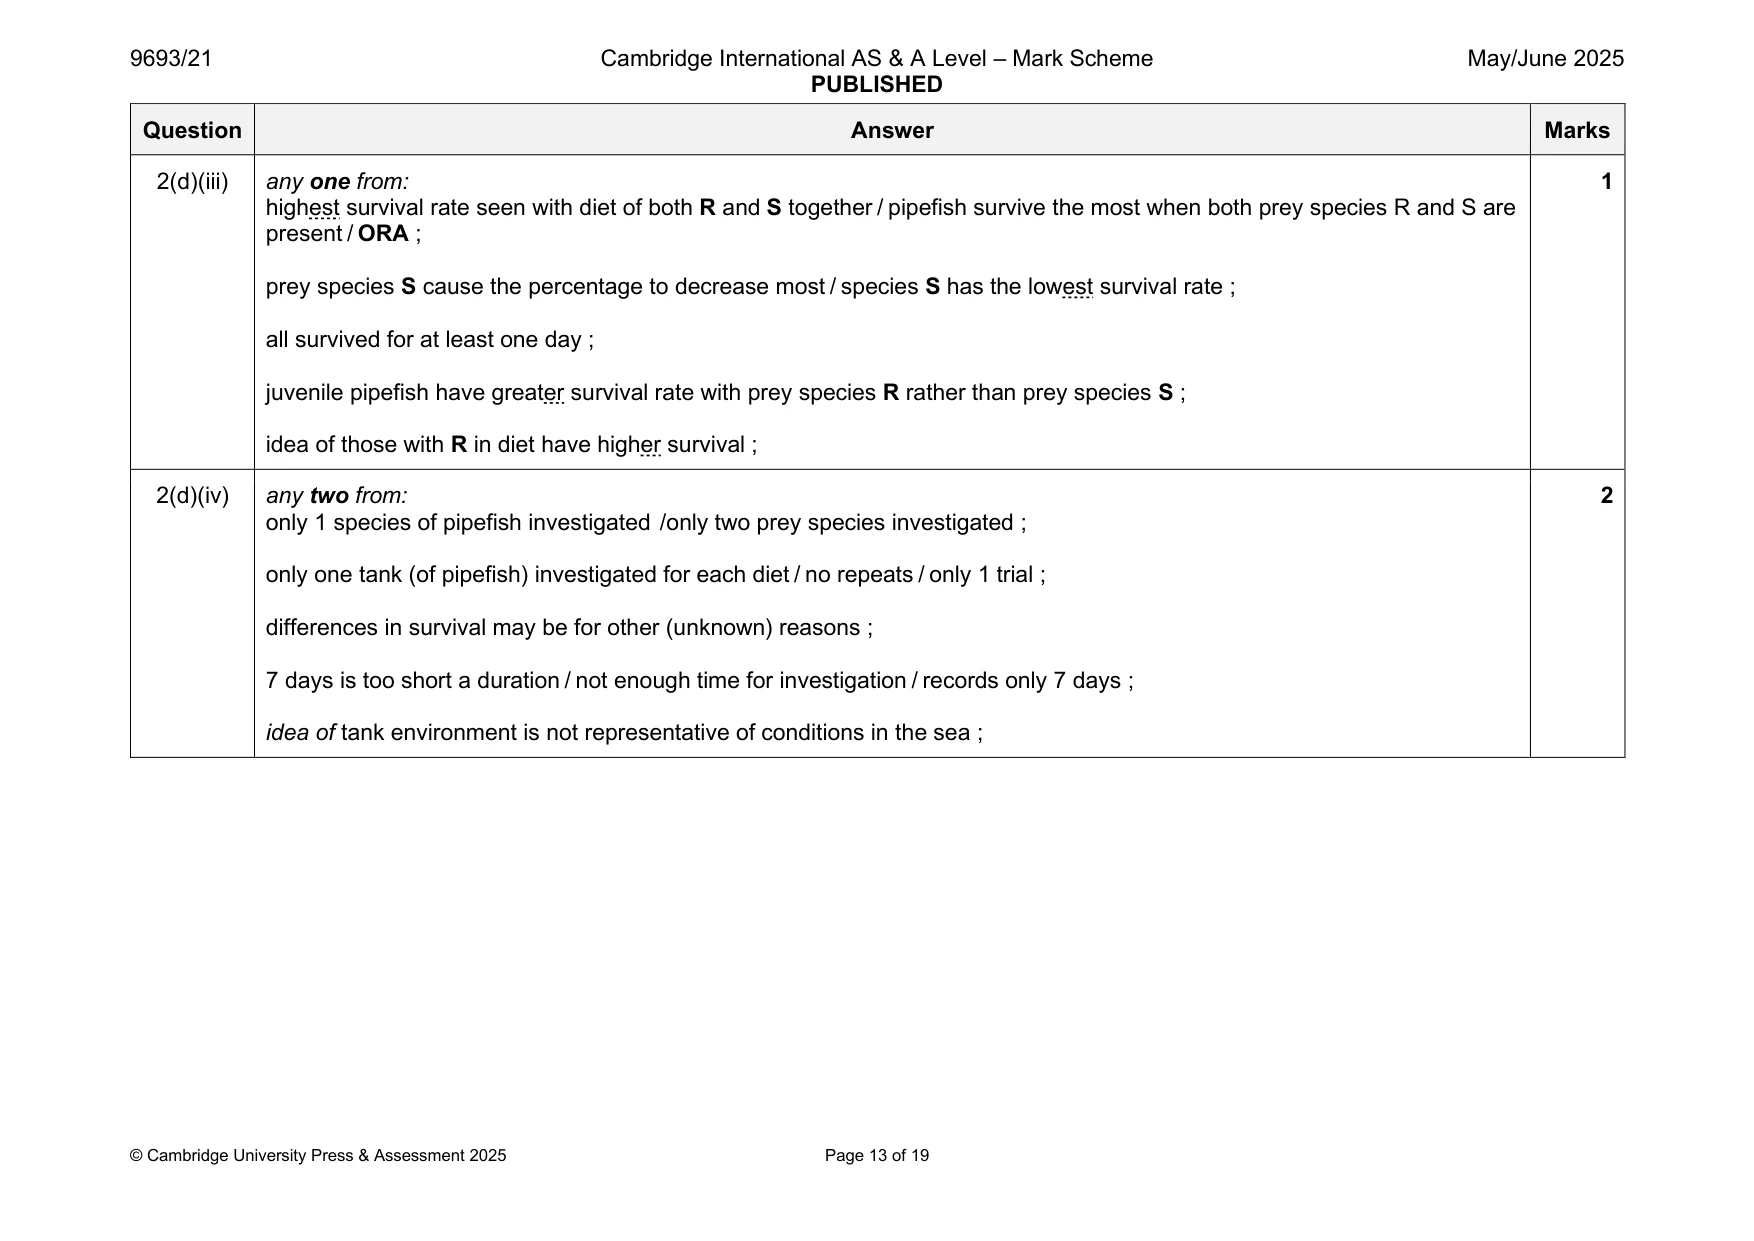
Mark scheme: 2(a) particle that has gained or lost electron(s) /negative and positive charge ; 1 2(b)(i) any five from: 5 (independent variable) – idea of how to change nitrate concentration ; (suitable range) – at least 3 concentrations used ; (dependent variable) – idea of measuring change in height of seagrass ; idea of replicates / repeat at least twice and calculate, means / medians / control experiment (using only sea water) ; description of calculation of growth rate ; standardised variables ;; (MAX two marks from this list) • leave to grow for, suitable / fixed time • temperature of water • all other mineral ions in equal concentration • concentration of CO2 • from lamp OR position / distance of the lamp / light intensity • pH • similar starting height of seagrass • same species of seagrass • volume of water • depth / type / mass, of sediment 2(b)(ii) suitable column / row headings e.g. (nitrate) concentration AND growth (rate) / change in length of seagrass / change in 2 height of seagrass ; appropriate units for dependent variable in heading only ; 2(b)(iii) Idea of increase in nitrate concentration increases growth (rate) / ORA ; 1 2(c) any two from: 2 proteins or amino acids ; chlorophyll ; DNA ; AVP ; 2(d)(i) any two from: 2 species / sex, of pipefish used ; health of pipefish ; number of pipefish (in the tank) ; reference to the, number / age / size / density / population, of prey ; quantity / mass / species / age, of seagrass in each tank ; 2(d)(ii) 150 / 100 62 2 OR 62 150 / 100 OR 150 0.62 OR 62 / 100 150 93 ;; 1 mark for incorrect values of 61 or 63 but correct calculation 150 / 100 61 OR 61 150 / 100 = 92 150 / 100 63 OR 63 150 / 100 = 95 2(d)(iii) any one from: 1 highest survival rate seen with diet of both R and S together / pipefish survive the most when both prey species R and S are present / ORA ; prey species S cause the percentage to decrease most / species S has the lowest survival rate ; all survived for at least one day ; juvenile pipefish have greater survival rate with prey species R rather than prey species S ; idea of those with R in diet have higher survival ; 2(d)(iv) any two from: 2 only 1 species of pipefish investigated /only two prey species investigated ; only one tank (of pipefish) investigated for each diet / no repeats / only 1 trial ; differences in survival may be for other (unknown) reasons ; 7 days is too short a duration / not enough time for investigation / records only 7 days ; idea of tank environment is not representative of conditions in the sea ;
Q3 · Hydrothermal vents occur close to plate boundaries
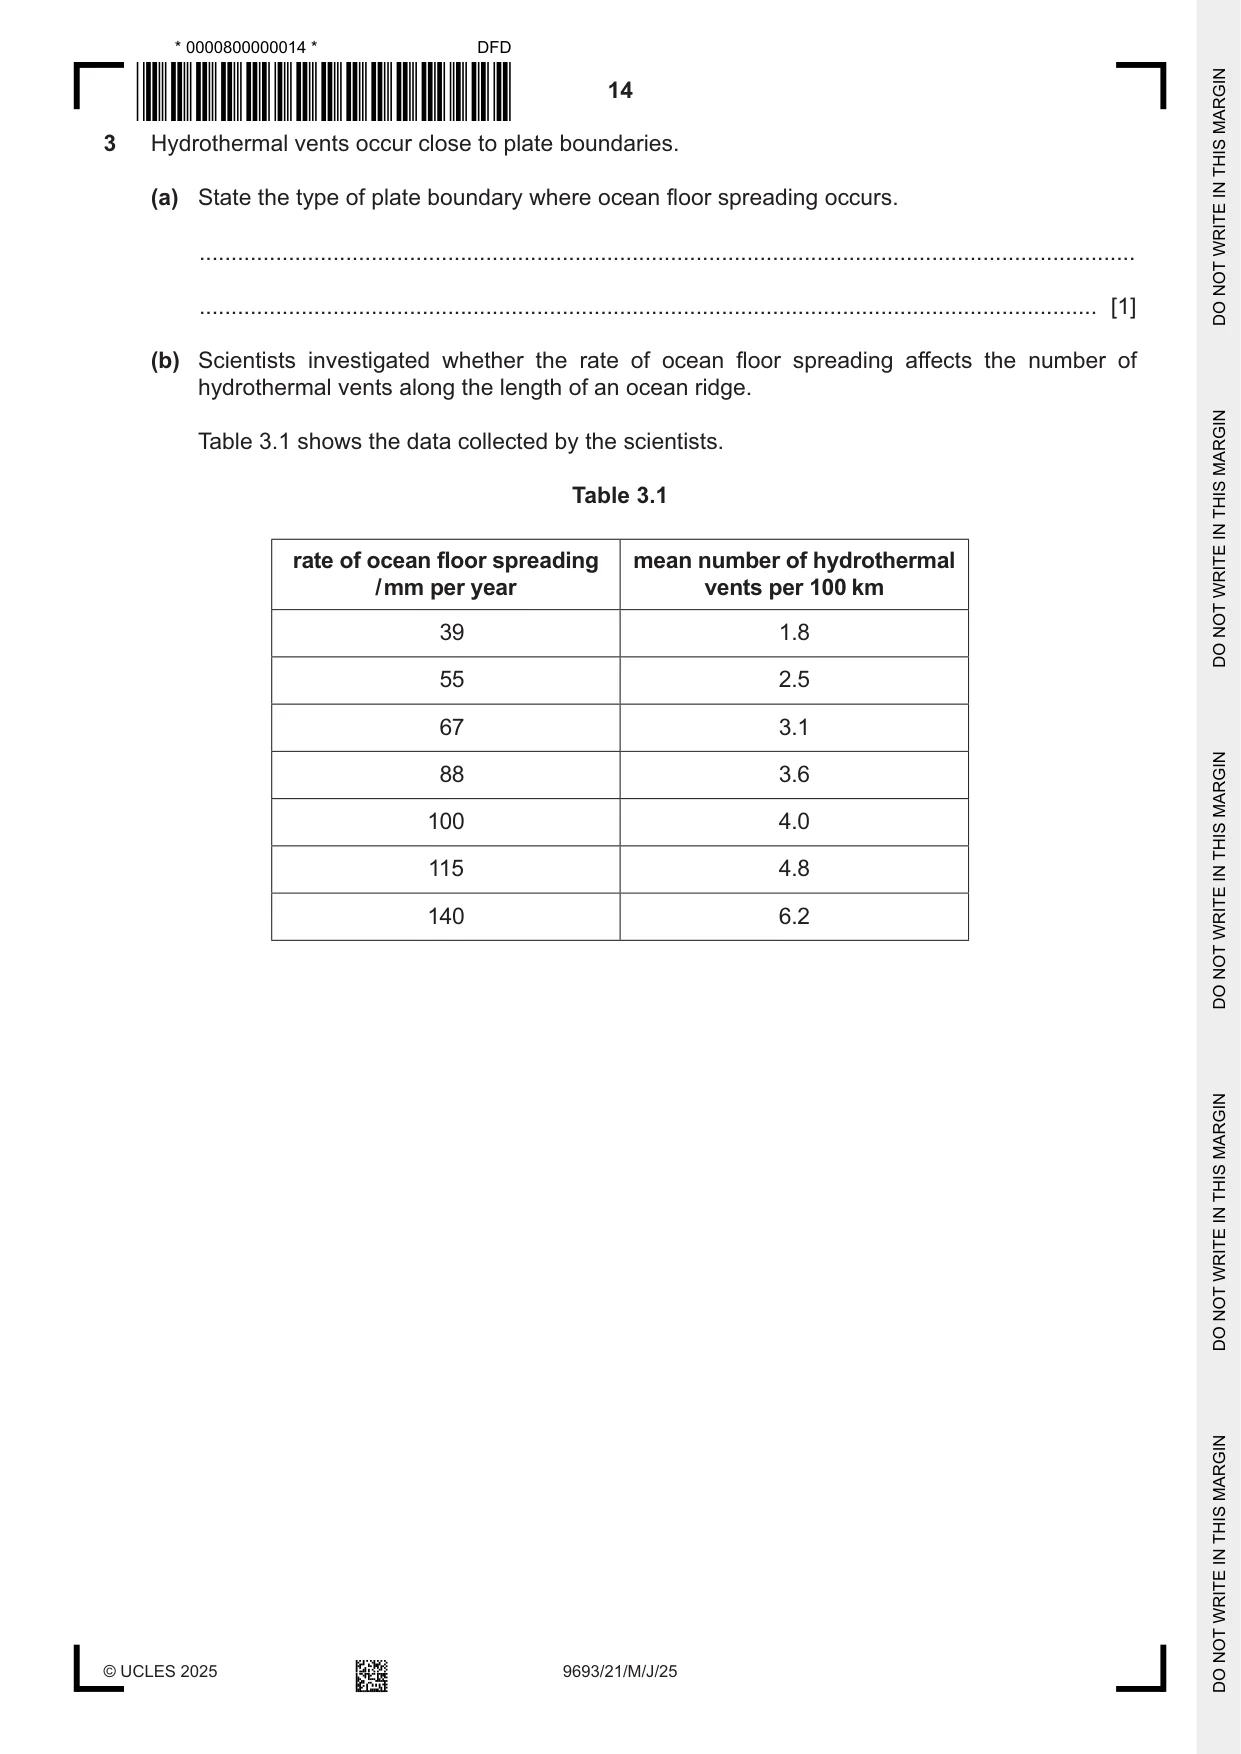
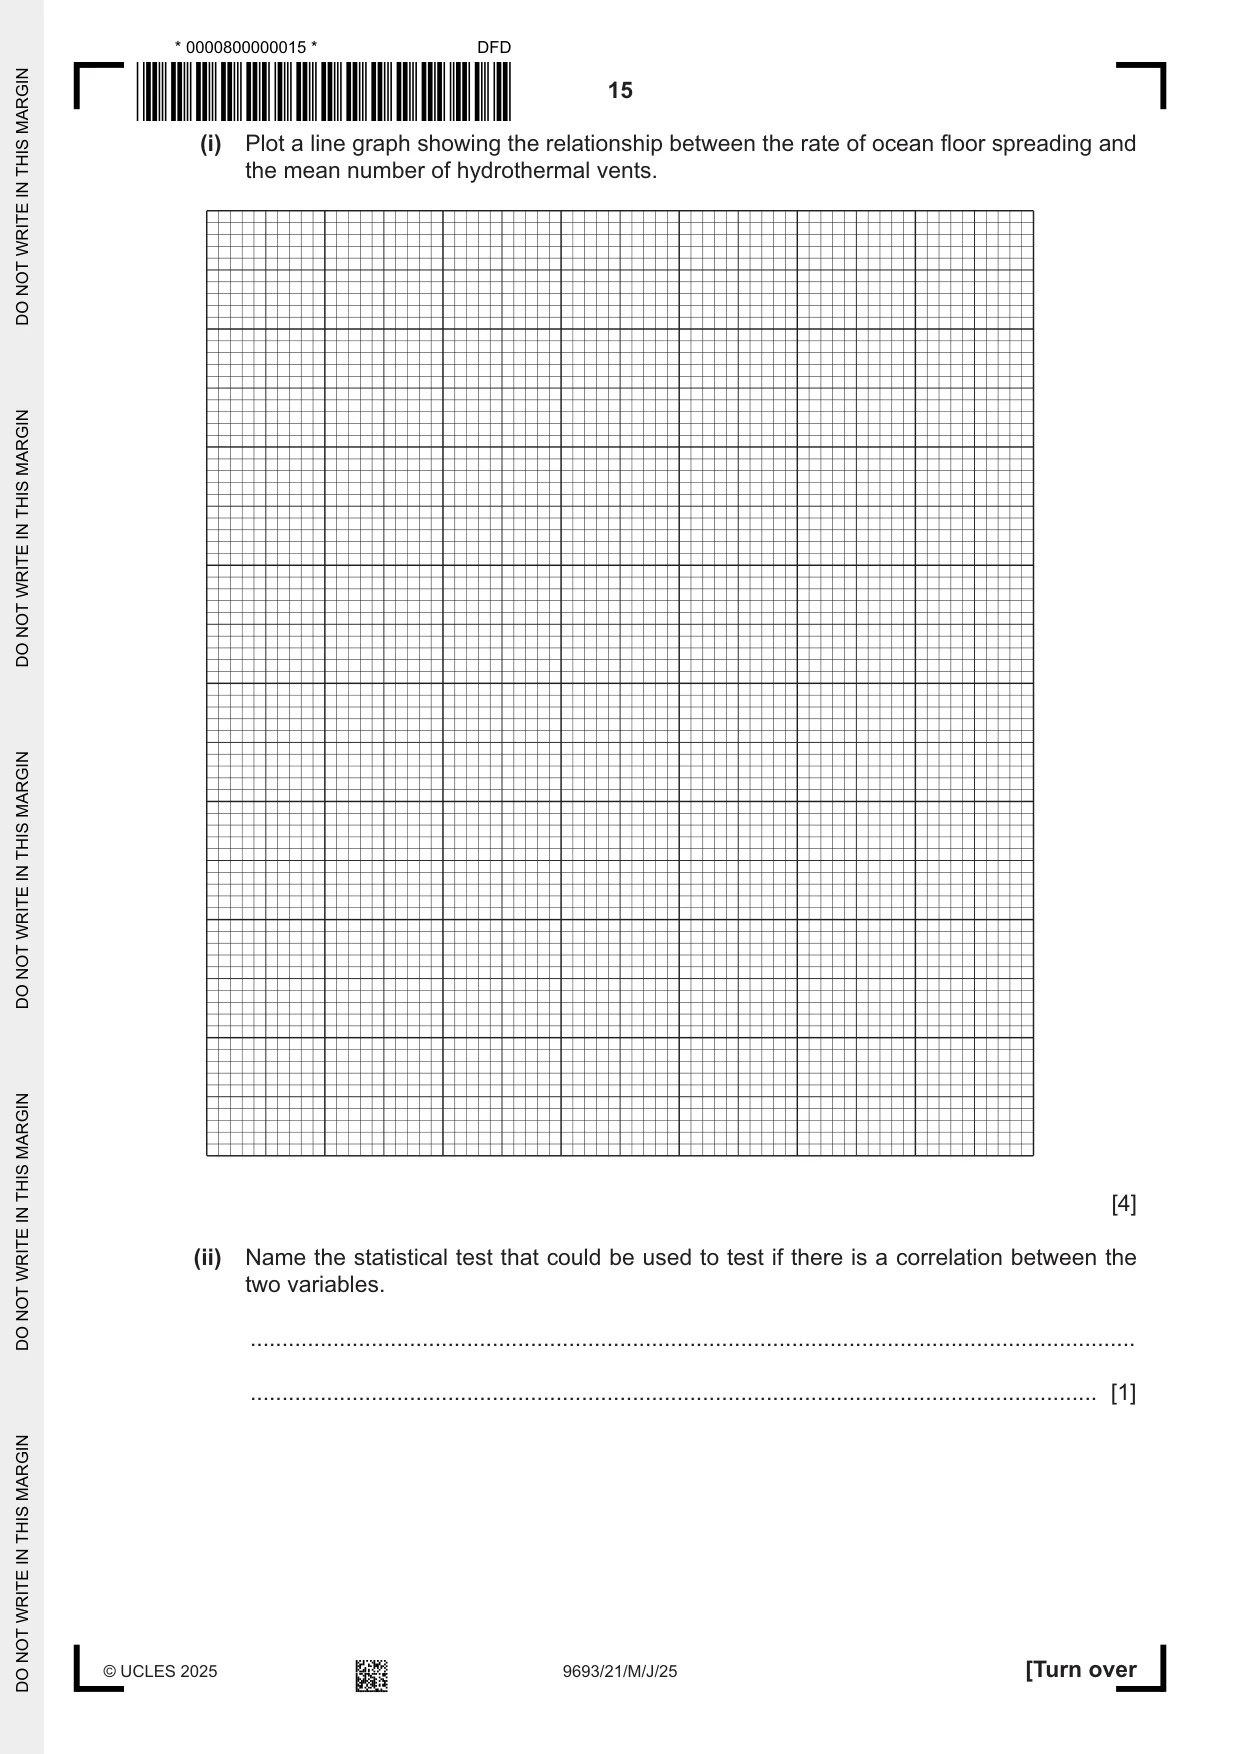
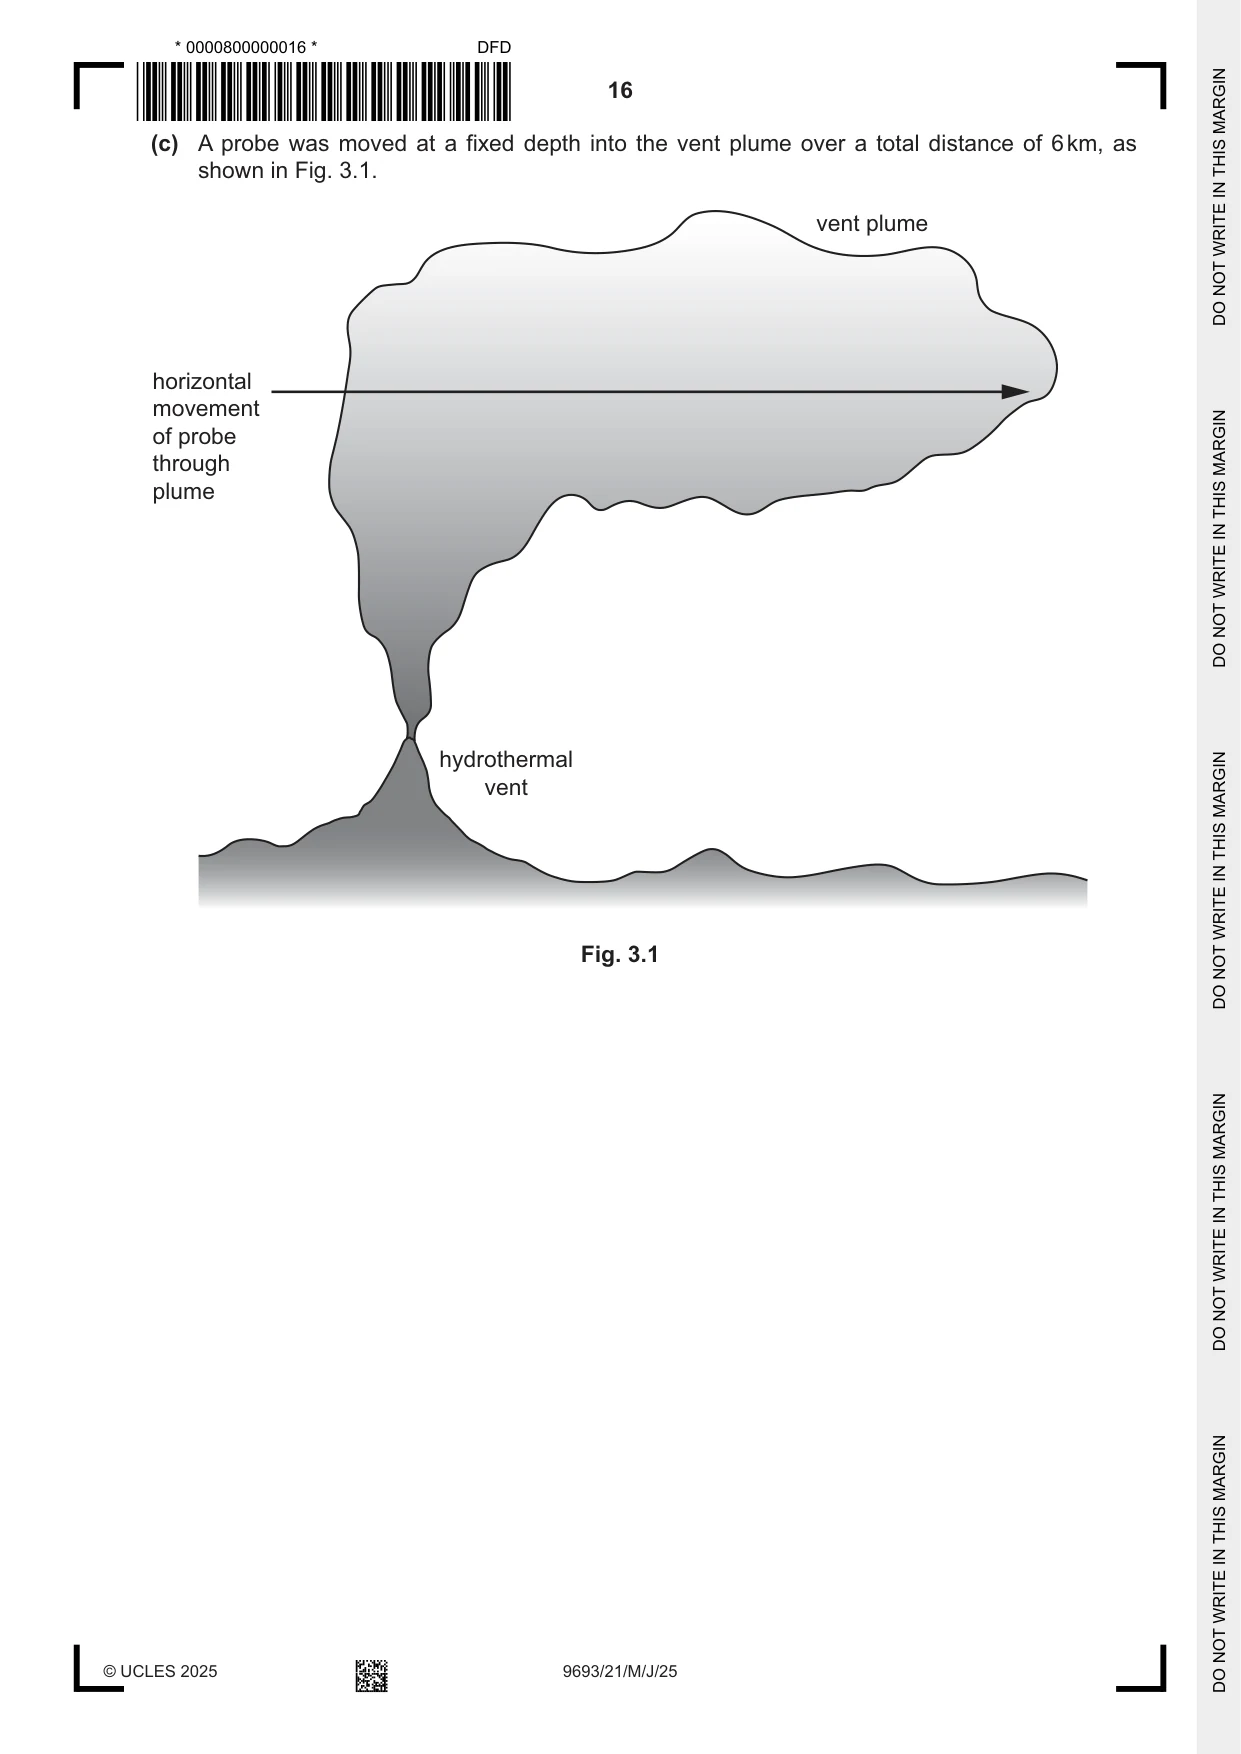
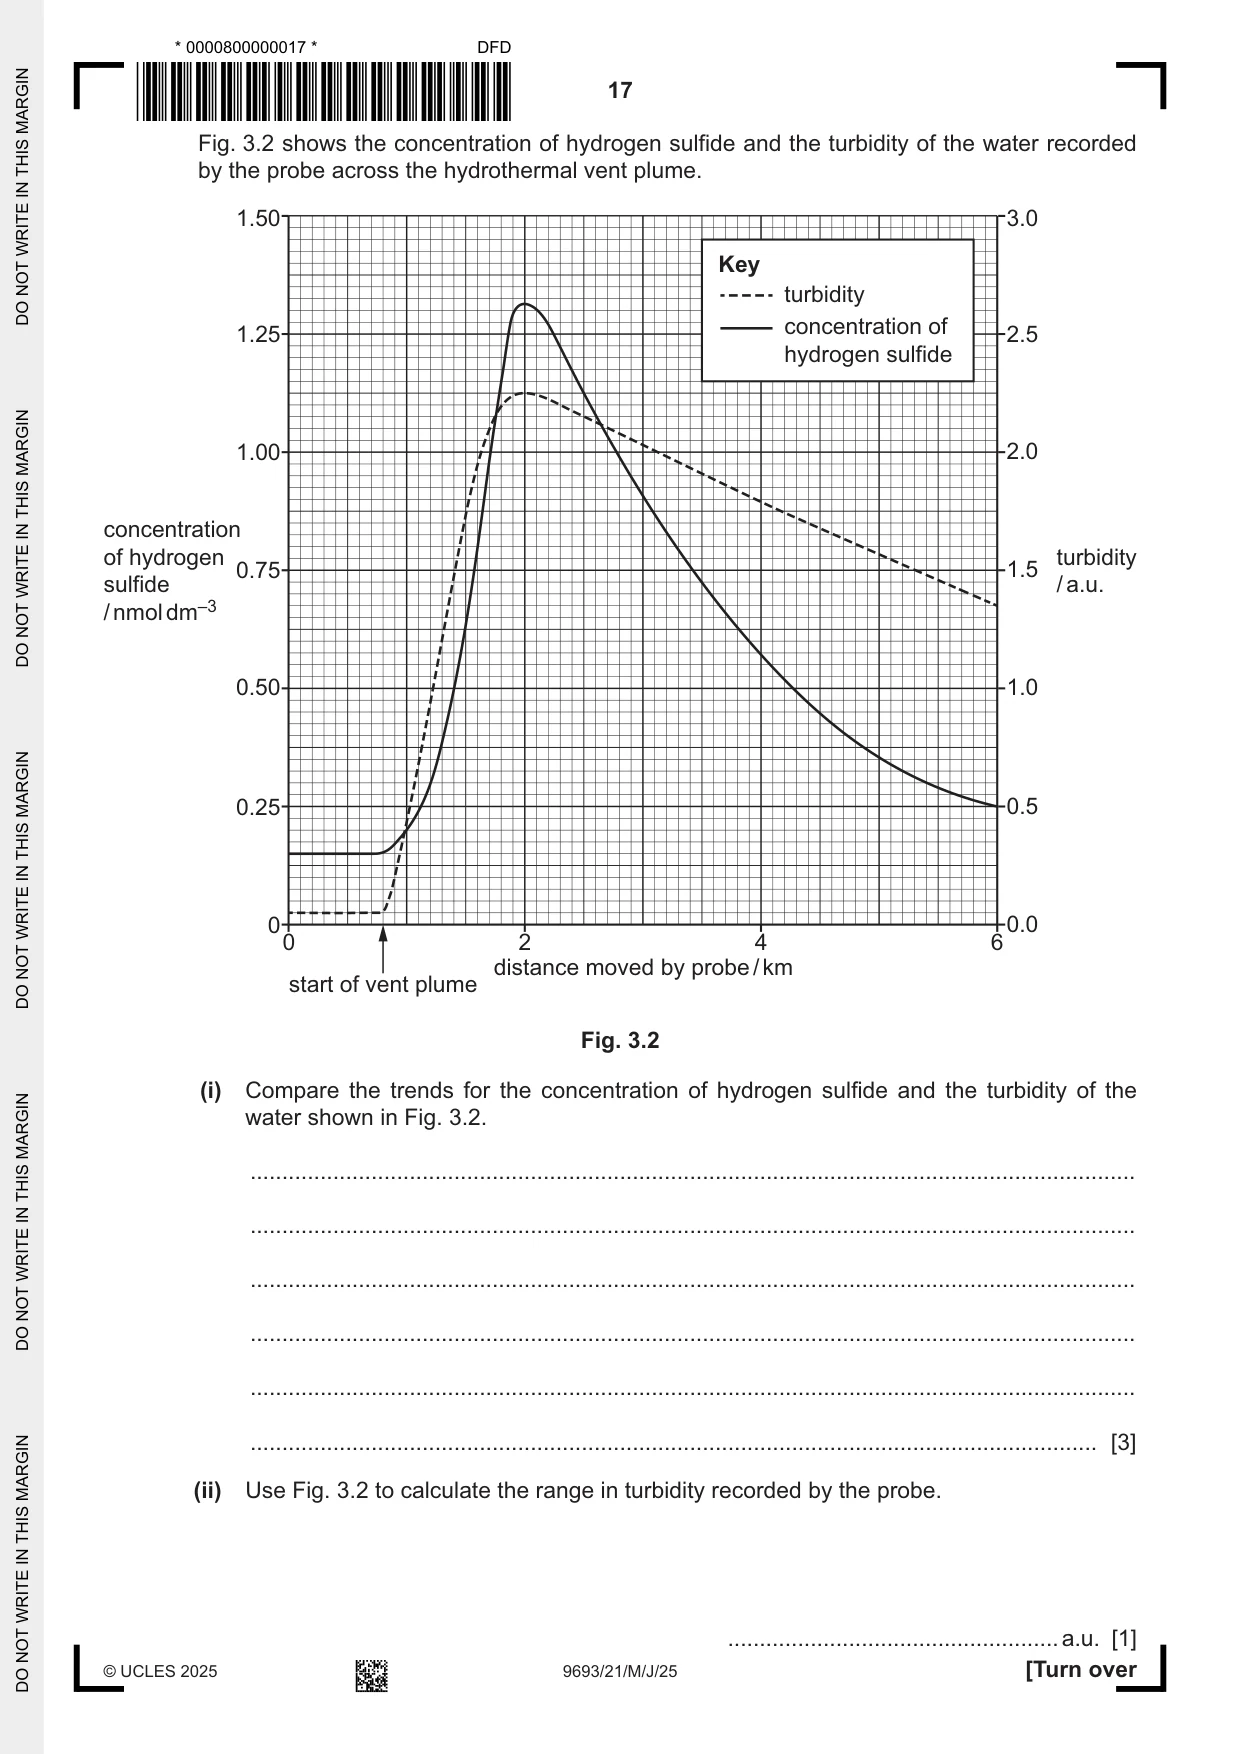
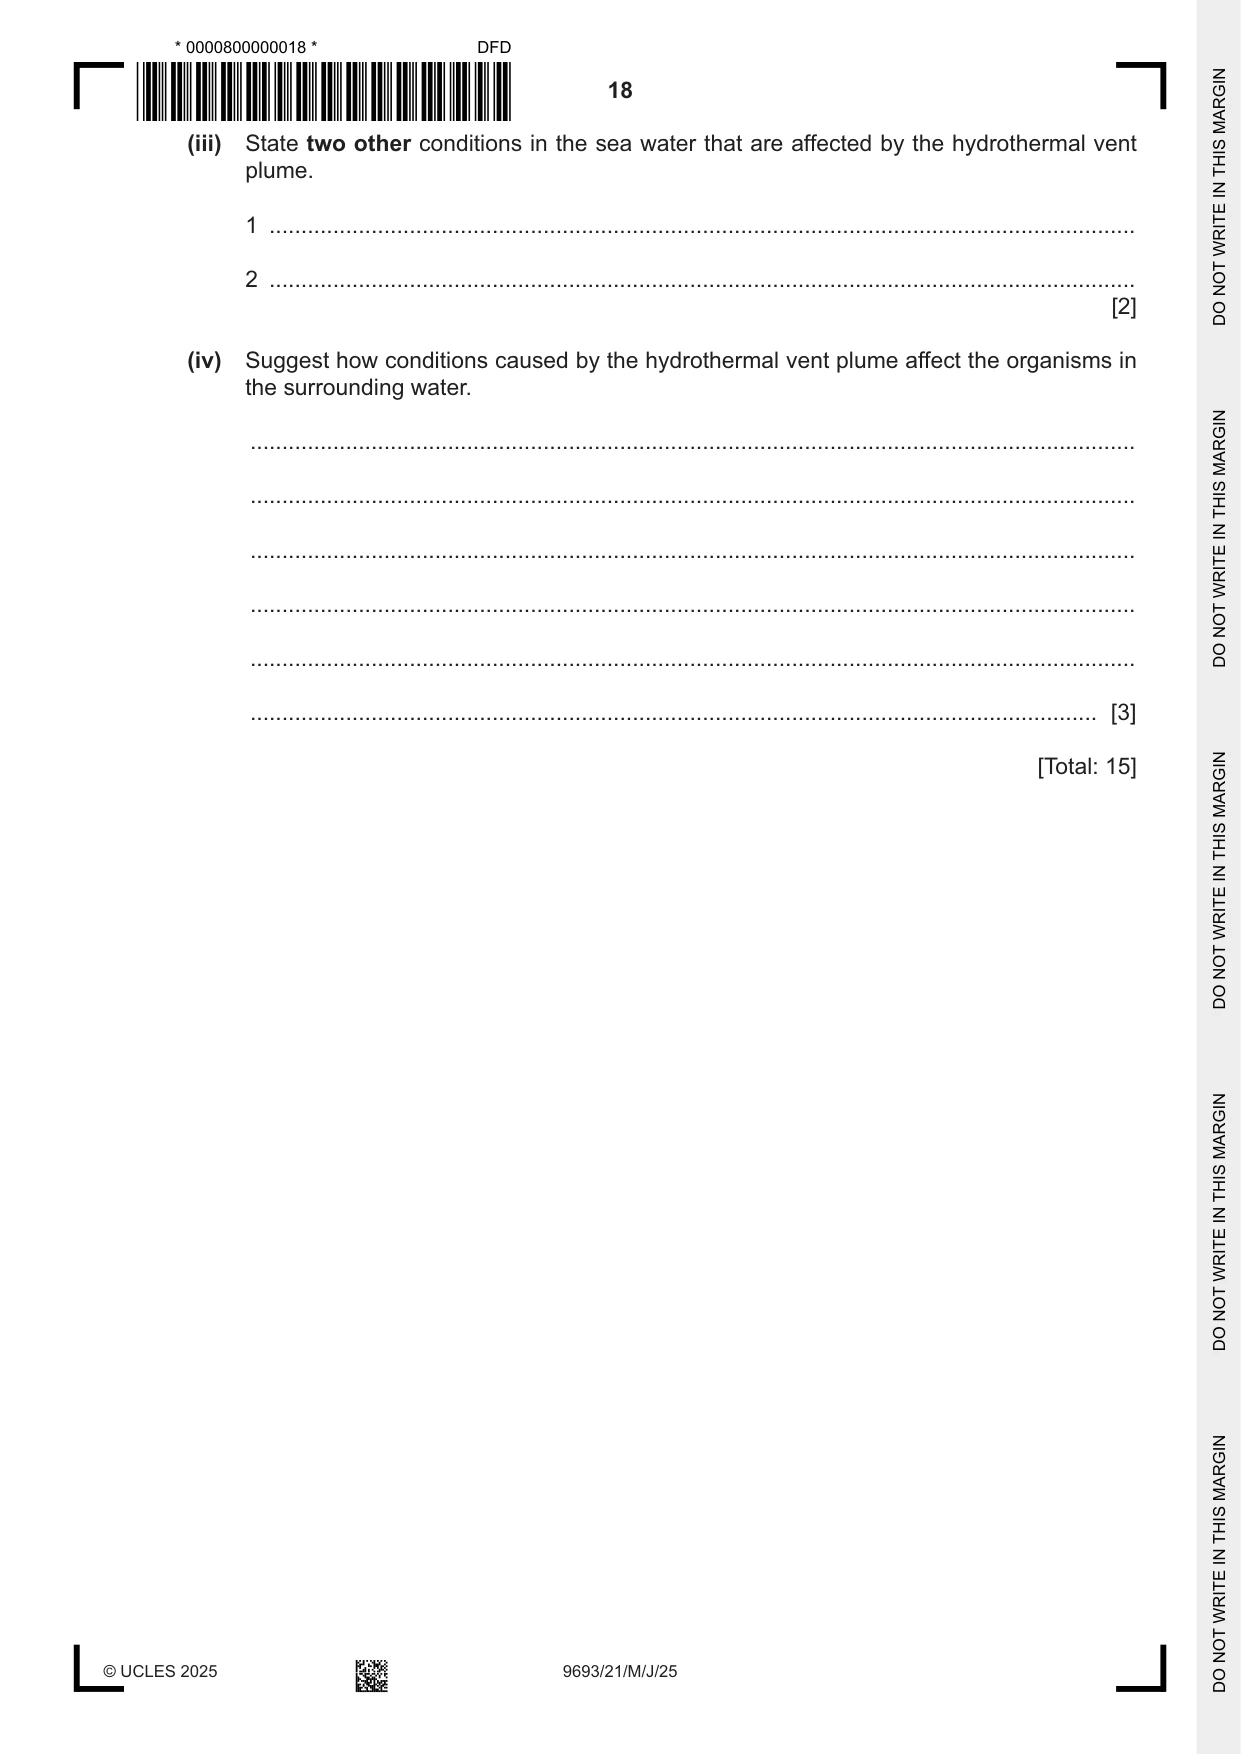
3 Hydrothermal vents occur close to plate boundaries. (a) State the type of plate boundary where ocean floor spreading occurs. ................................................................................................................................................... ............................................................................................................................................. [1] (b) Scientists investigated whether the rate of ocean floor spreading affects the number of hydrothermal vents along the length of an ocean ridge. Table 3.1 shows the data collected by the scientists. Table 3.1 rate of ocean floor spreading mean number of hydrothermal / mm per year vents per 100 km 39 1.8 55 2.5 67 3.1 88 3.6 100 4.0 115 4.8 140 6.2 (i) Plot a line graph showing the relationship between the rate of ocean floor spreading and the mean number of hydrothermal vents. [4] (ii) Name the statistical test that could be used to test if there is a correlation between the two variables. ........................................................................................................................................... ..................................................................................................................................... [1] (c) A probe was moved at a fixed depth into the vent plume over a total distance of 6 km, as shown in Fig. 3.1. vent plume horizontal movement of probe through plume hydrothermal vent Fig. 3.1 Fig. 3.2 shows the concentration of hydrogen sulfide and the turbidity of the water recorded by the probe across the hydrothermal vent plume. 1.50 3.0 Key turbidity concentration of 1.25 2.5 hydrogen sulfide 1.00 2.0 concentration of hydrogen turbidity 0.75 1.5 sulfide / a.u. / nmol dm–3 0.50 1.0 0.25 0.5 0 0.0 0 2 4 6 distance moved by probe / km start of vent plume Fig. 3.2 (i) Compare the trends for the concentration of hydrogen sulfide and the turbidity of the water shown in Fig. 3.2. ........................................................................................................................................... ........................................................................................................................................... ........................................................................................................................................... ........................................................................................................................................... ........................................................................................................................................... ..................................................................................................................................... [3] (ii) Use Fig. 3.2 to calculate the range in turbidity recorded by the probe. .................................................... a.u. [1] (iii) State two other conditions in the sea water that are affected by the hydrothermal vent plume. 1 ........................................................................................................................................ 2 ........................................................................................................................................ [2] (iv) Suggest how conditions caused by the hydrothermal vent plume affect the organisms in the surrounding water. ........................................................................................................................................... ........................................................................................................................................... ........................................................................................................................................... ........................................................................................................................................... ........................................................................................................................................... ..................................................................................................................................... [3] [Total: 15]
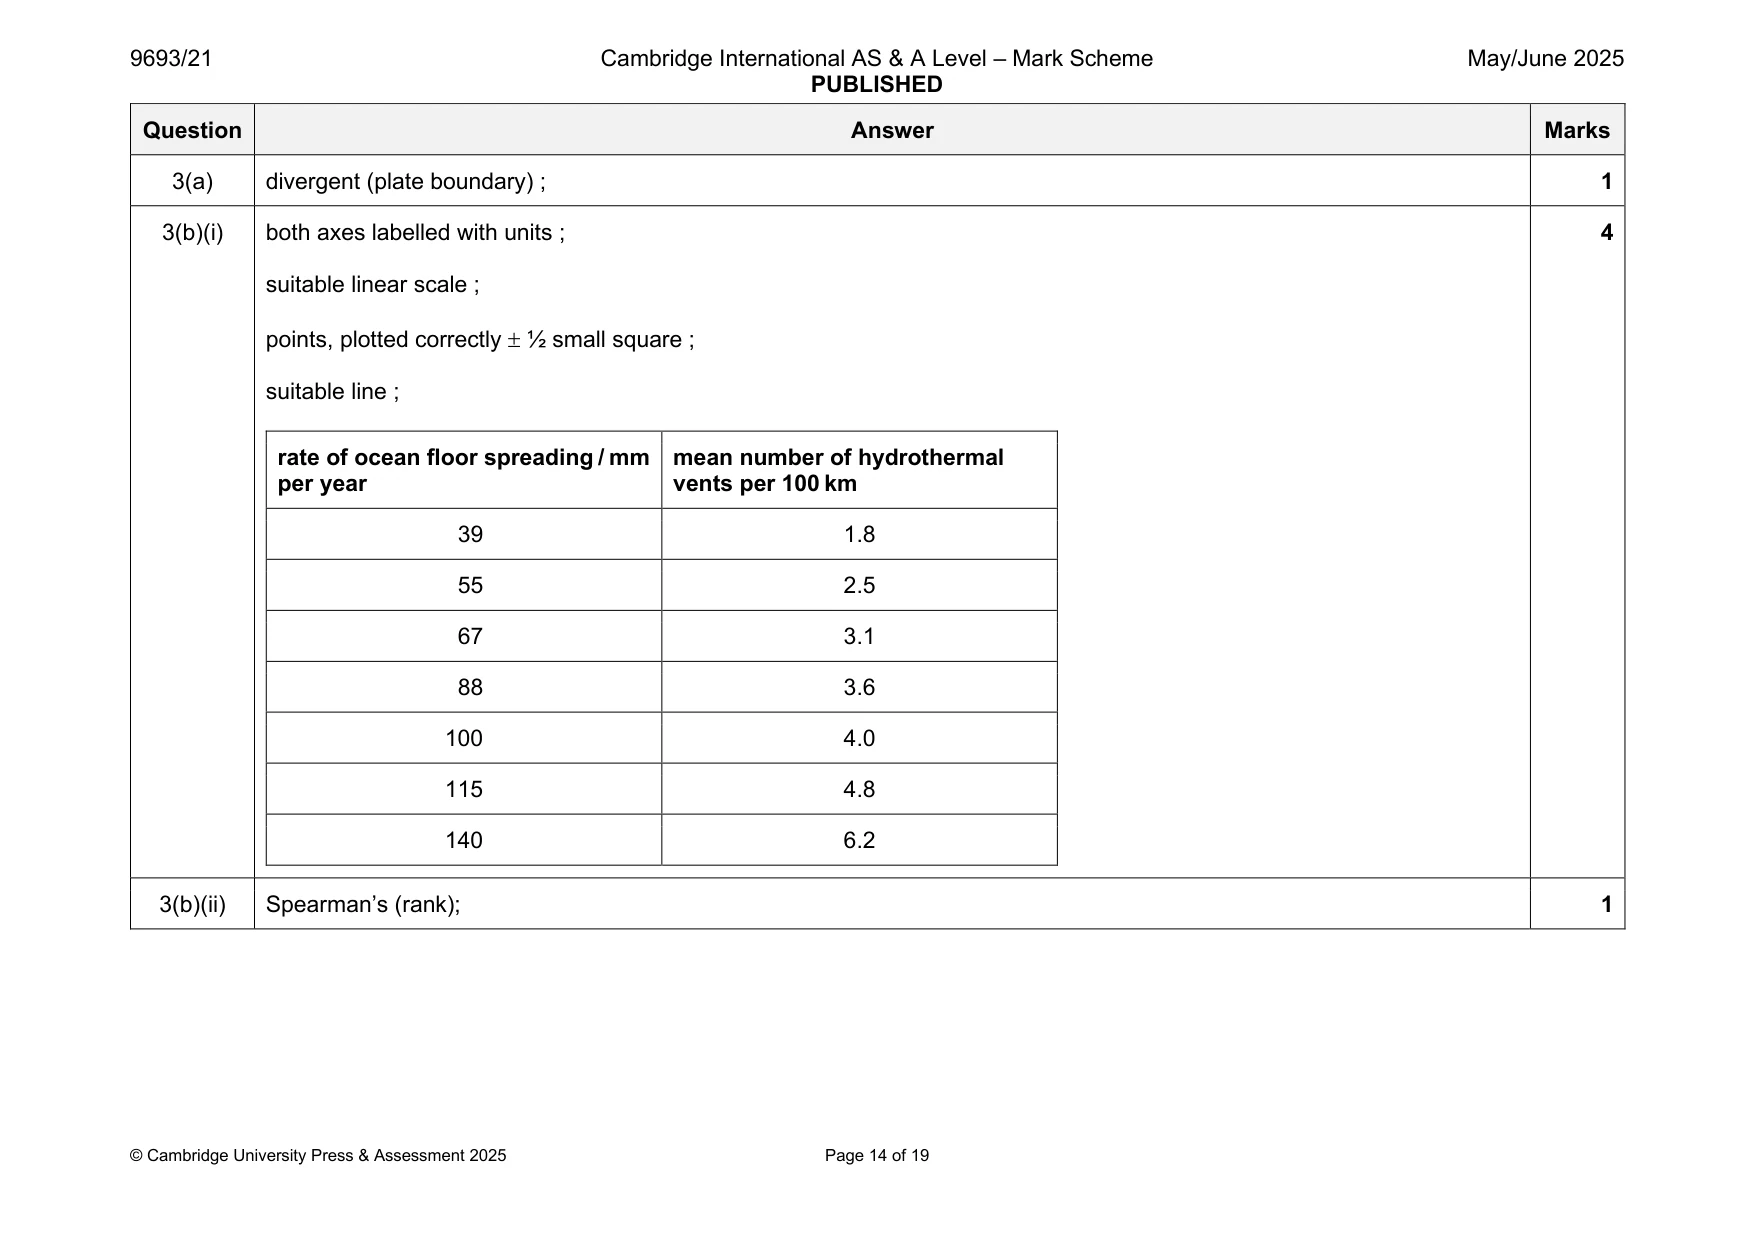
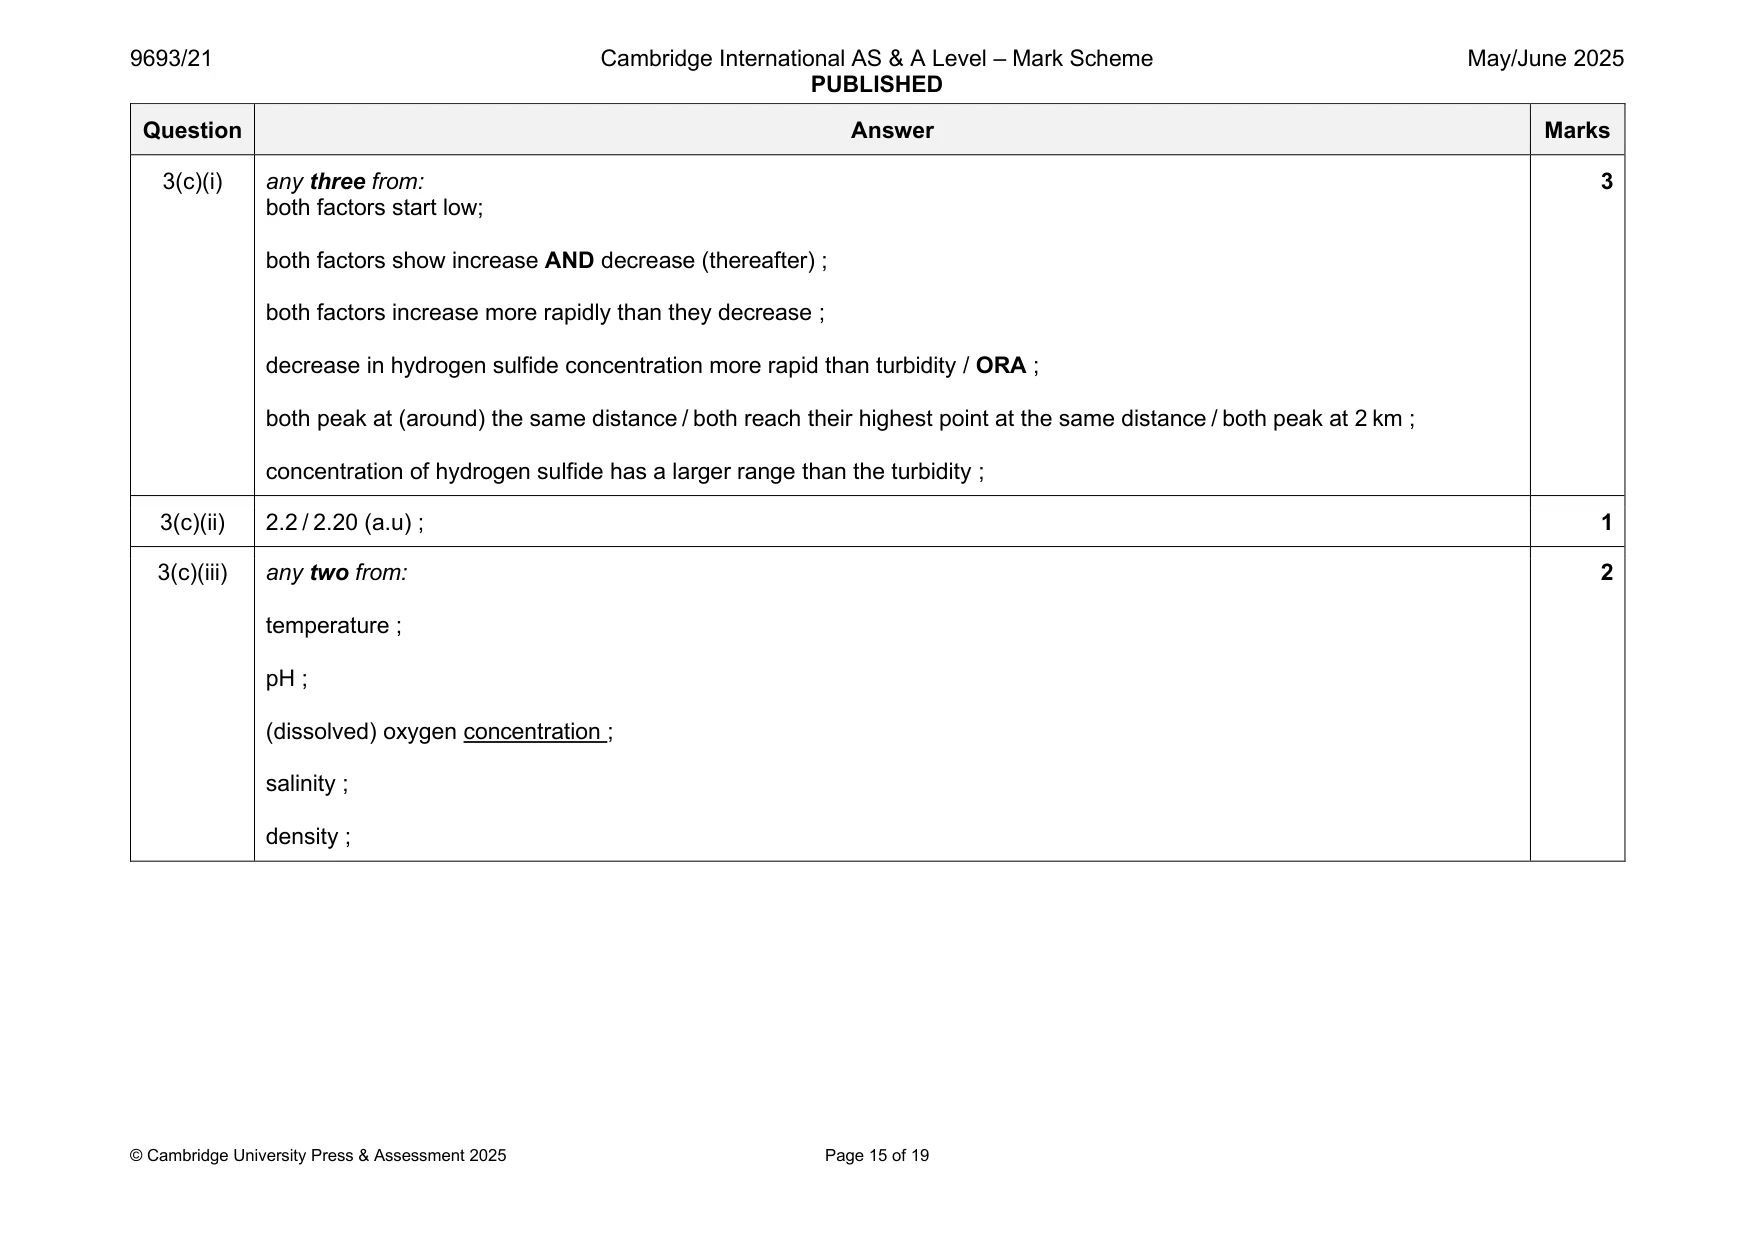
Mark scheme: 3(a) divergent (plate boundary) ; 1 3(b)(i) both axes labelled with units ; 4 suitable linear scale ; points, plotted correctly ½ small square ; suitable line ; rate of ocean floor spreading / mm mean number of hydrothermal per year vents per 100 km 39 1.8 55 2.5 67 3.1 88 3.6 100 4.0 115 4.8 140 6.2 3(b)(ii) Spearman’s (rank); 1 3(c)(i) any three from: 3 both factors start low; both factors show increase AND decrease (thereafter) ; both factors increase more rapidly than they decrease ; decrease in hydrogen sulfide concentration more rapid than turbidity / ORA ; both peak at (around) the same distance / both reach their highest point at the same distance / both peak at 2 km ; concentration of hydrogen sulfide has a larger range than the turbidity ; 3(c)(ii) 2.2 / 2.20 (a.u) ; 1 3(c)(iii) any two from: 2 temperature ; pH ; (dissolved) oxygen concentration ; salinity ; density ; 3(c)(iv) any three from: 3 organisms cannot tolerate extreme conditions in the plume / temperature of water is beyond that suitable for organisms to survive / ORA ; dissolved, minerals / ions AND affect / lower pH / more acidic, (of) water which organisms cannot tolerate ; temperature change AND affects solubility of gases so there is less O2 available (for organisms) ; temperature change AND could affect growth rates (of organisms) ; increased turbidity AND affects bioluminescent organisms ; increases biodiversity / productivity ; (availability of) hydrogen sulfide for, chemosynthetic organisms / Endoriftia* producers / chemosynthesis ; AVP ;
Q4 · A Southern flounder, a species of fish that lives and reproduces in estuaries
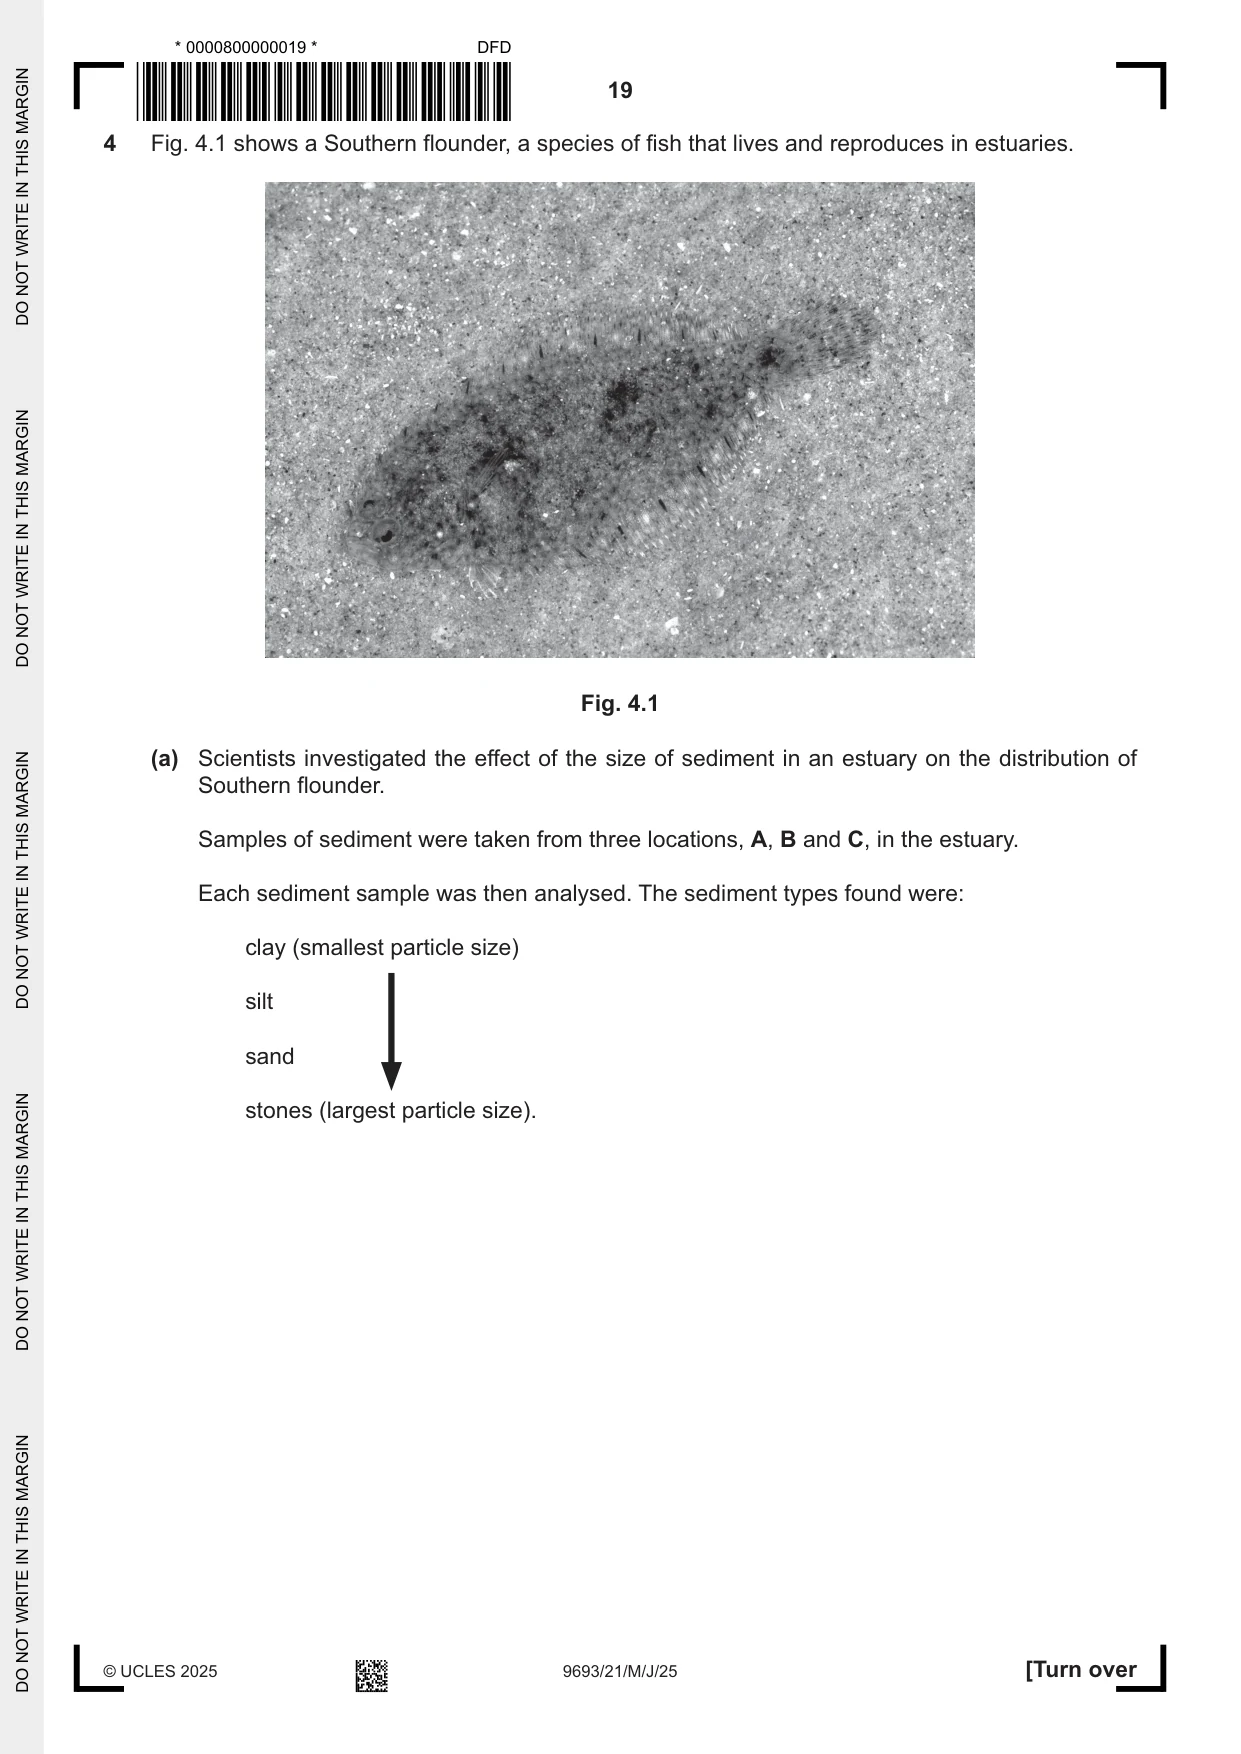
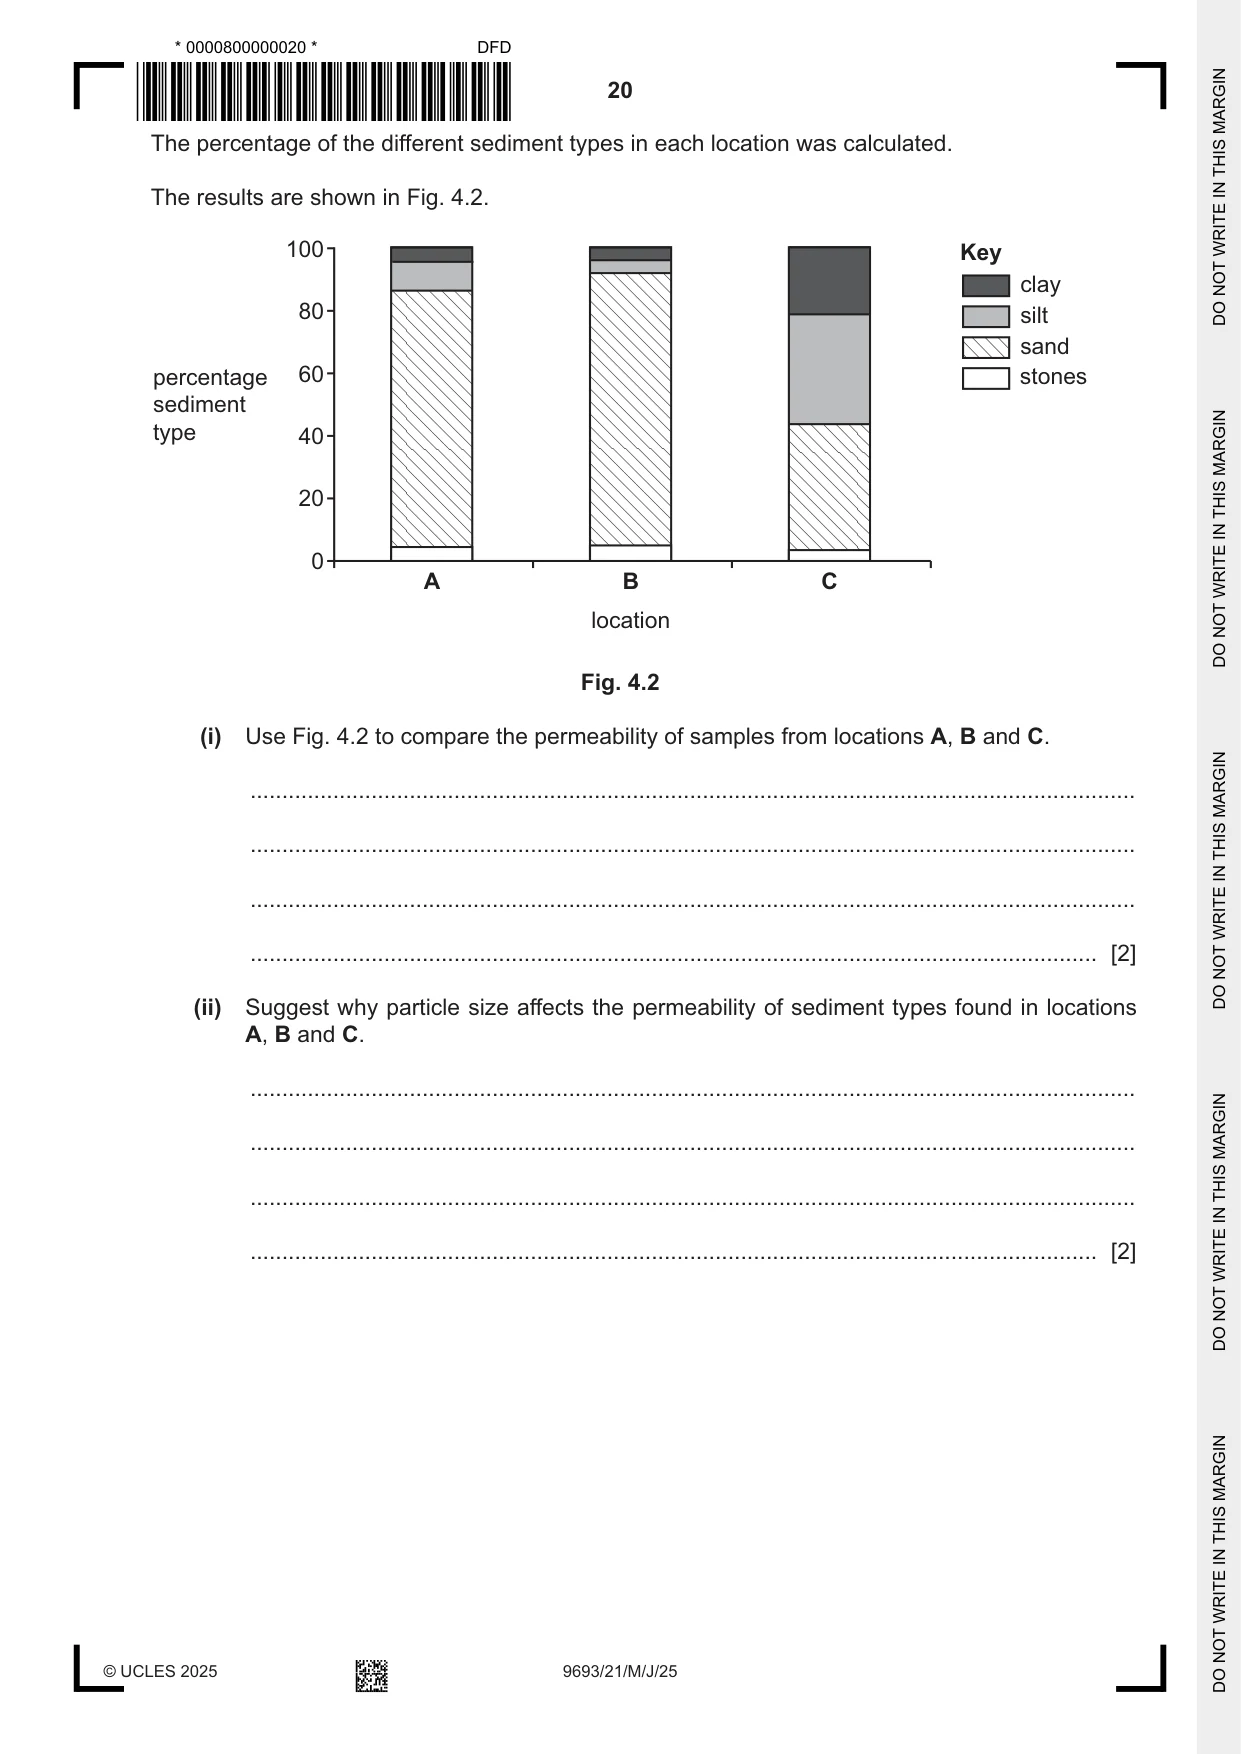
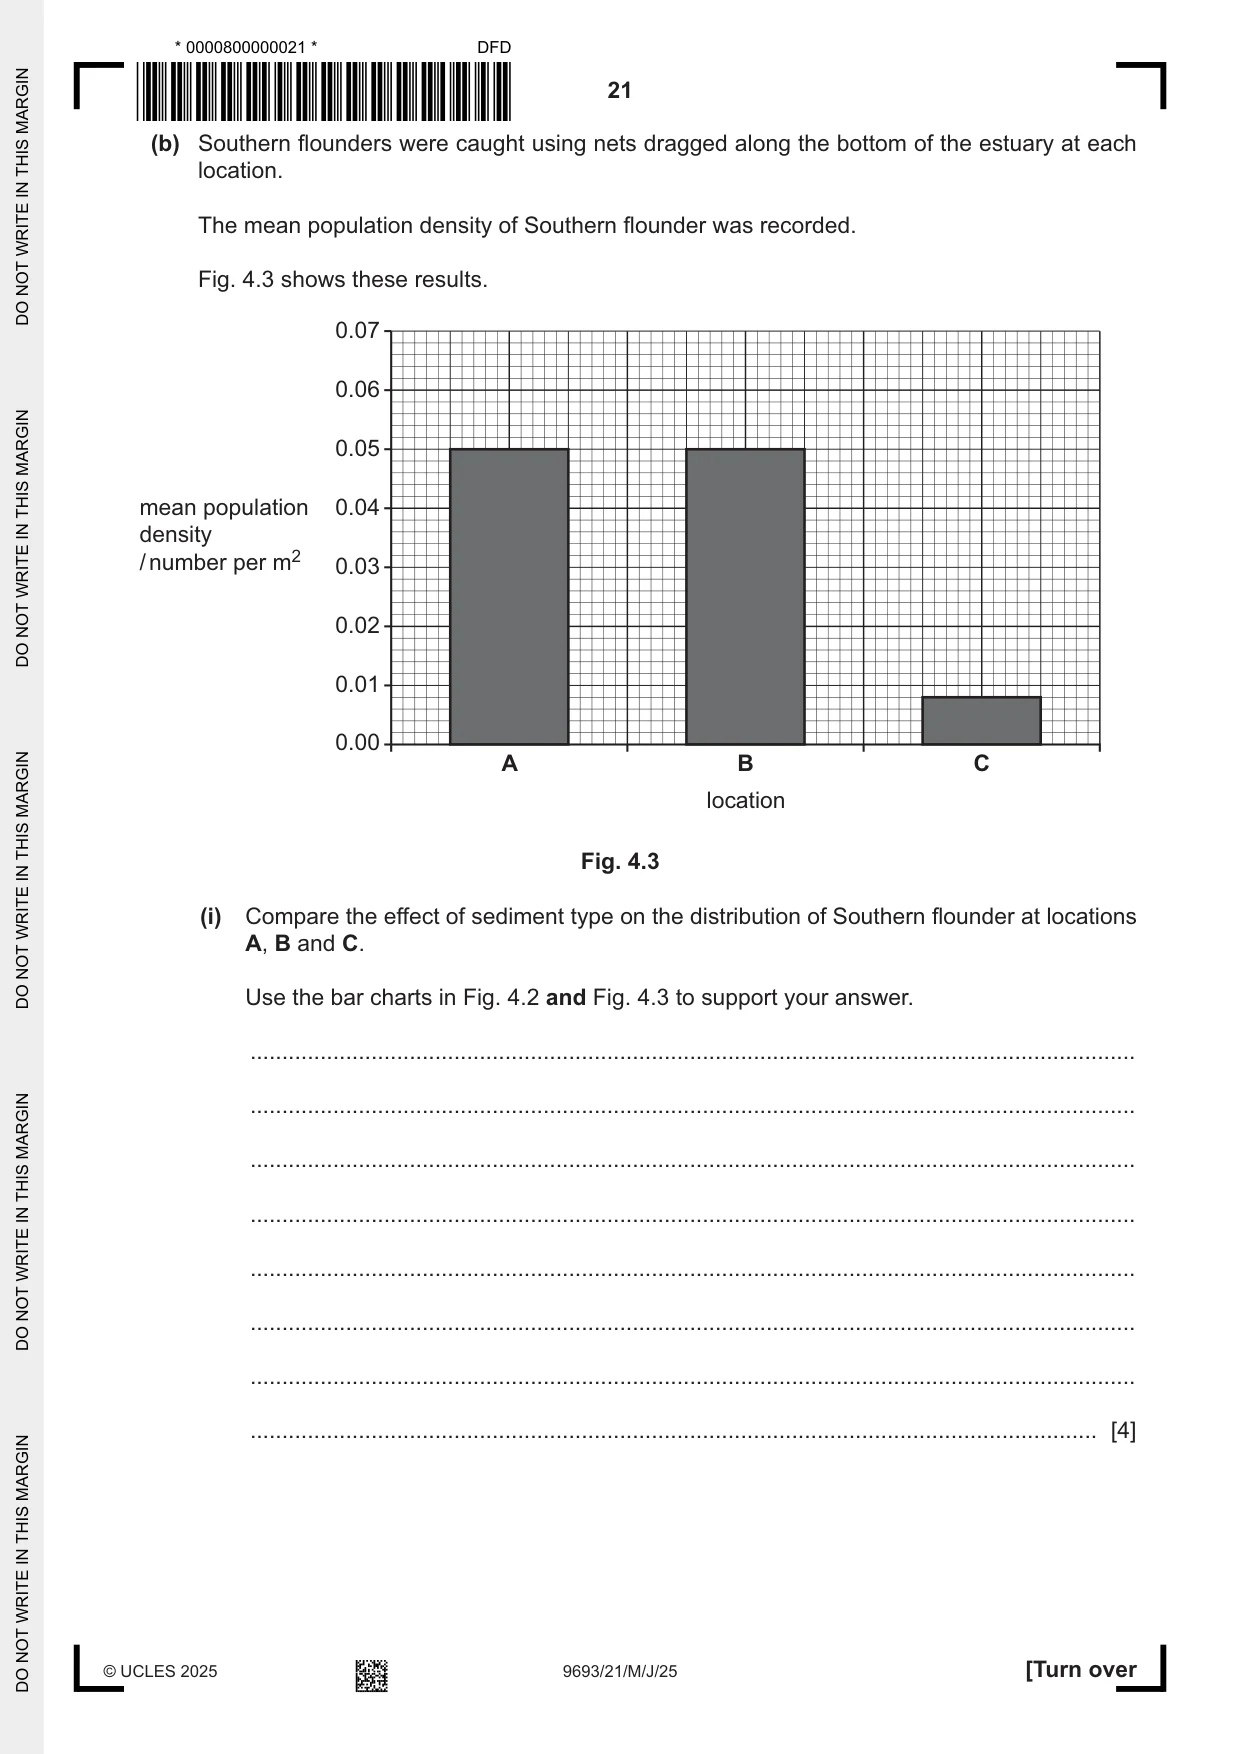
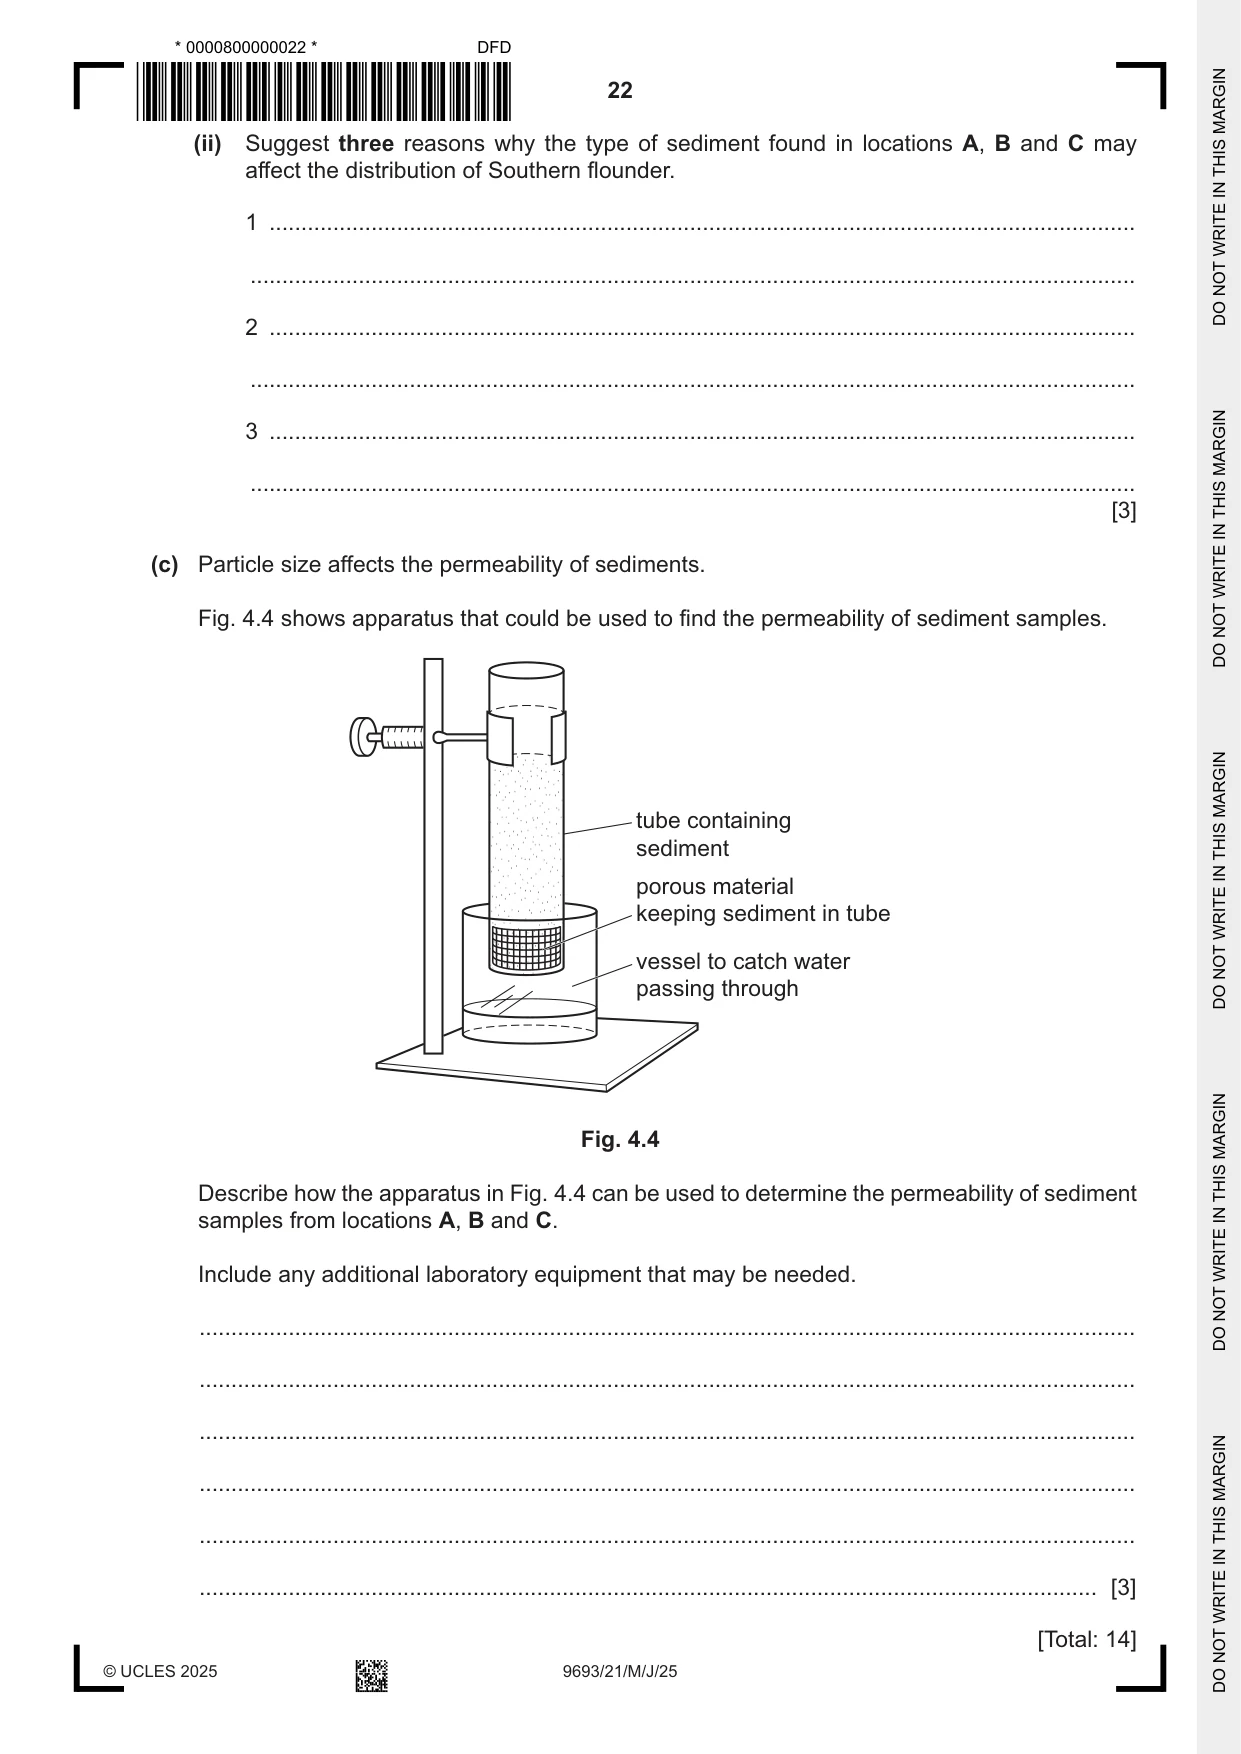
4 Fig. 4.1 shows a Southern flounder, a species of fish that lives and reproduces in estuaries. Fig. 4.1 (a) Scientists investigated the effect of the size of sediment in an estuary on the distribution of Southern flounder. Samples of sediment were taken from three locations, A, B and C, in the estuary. Each sediment sample was then analysed. The sediment types found were: clay (smallest particle size) silt sand stones (largest particle size). The percentage of the different sediment types in each location was calculated. The results are shown in Fig. 4.2. 100 Key clay 80 silt sand percentage 60 stones sediment type 40 20 0 A B C location Fig. 4.2 (i) Use Fig. 4.2 to compare the permeability of samples from locations A, B and C. ........................................................................................................................................... ........................................................................................................................................... ........................................................................................................................................... ..................................................................................................................................... [2] (ii) Suggest why particle size affects the permeability of sediment types found in locations A, B and C. ........................................................................................................................................... ........................................................................................................................................... ........................................................................................................................................... ..................................................................................................................................... [2] (b) Southern flounders were caught using nets dragged along the bottom of the estuary at each location. The mean population density of Southern flounder was recorded. Fig. 4.3 shows these results. 0.07 0.06 0.05 mean population 0.04 density / number per m2 0.03 0.02 0.01 0.00 A B C location Fig. 4.3 (i) Compare the effect of sediment type on the distribution of Southern flounder at locations A, B and C. Use the bar charts in Fig. 4.2 and Fig. 4.3 to support your answer. ........................................................................................................................................... ........................................................................................................................................... ........................................................................................................................................... ........................................................................................................................................... ........................................................................................................................................... ........................................................................................................................................... ........................................................................................................................................... ..................................................................................................................................... [4] (ii) Suggest three reasons why the type of sediment found in locations A, B and C may affect the distribution of Southern flounder. 1 ........................................................................................................................................ ........................................................................................................................................... 2 ........................................................................................................................................ ........................................................................................................................................... 3 ........................................................................................................................................ ........................................................................................................................................... [3] (c) Particle size affects the permeability of sediments. Fig. 4.4 shows apparatus that could be used to find the permeability of sediment samples. tube containing sediment porous material keeping sediment in tube vessel to catch water passing through Fig. 4.4 Describe how the apparatus in Fig. 4.4 can be used to determine the permeability of sediment samples from locations A, B and C. Include any additional laboratory equipment that may be needed. ................................................................................................................................................... ................................................................................................................................................... ................................................................................................................................................... ................................................................................................................................................... ................................................................................................................................................... ............................................................................................................................................. [3] [Total: 14]
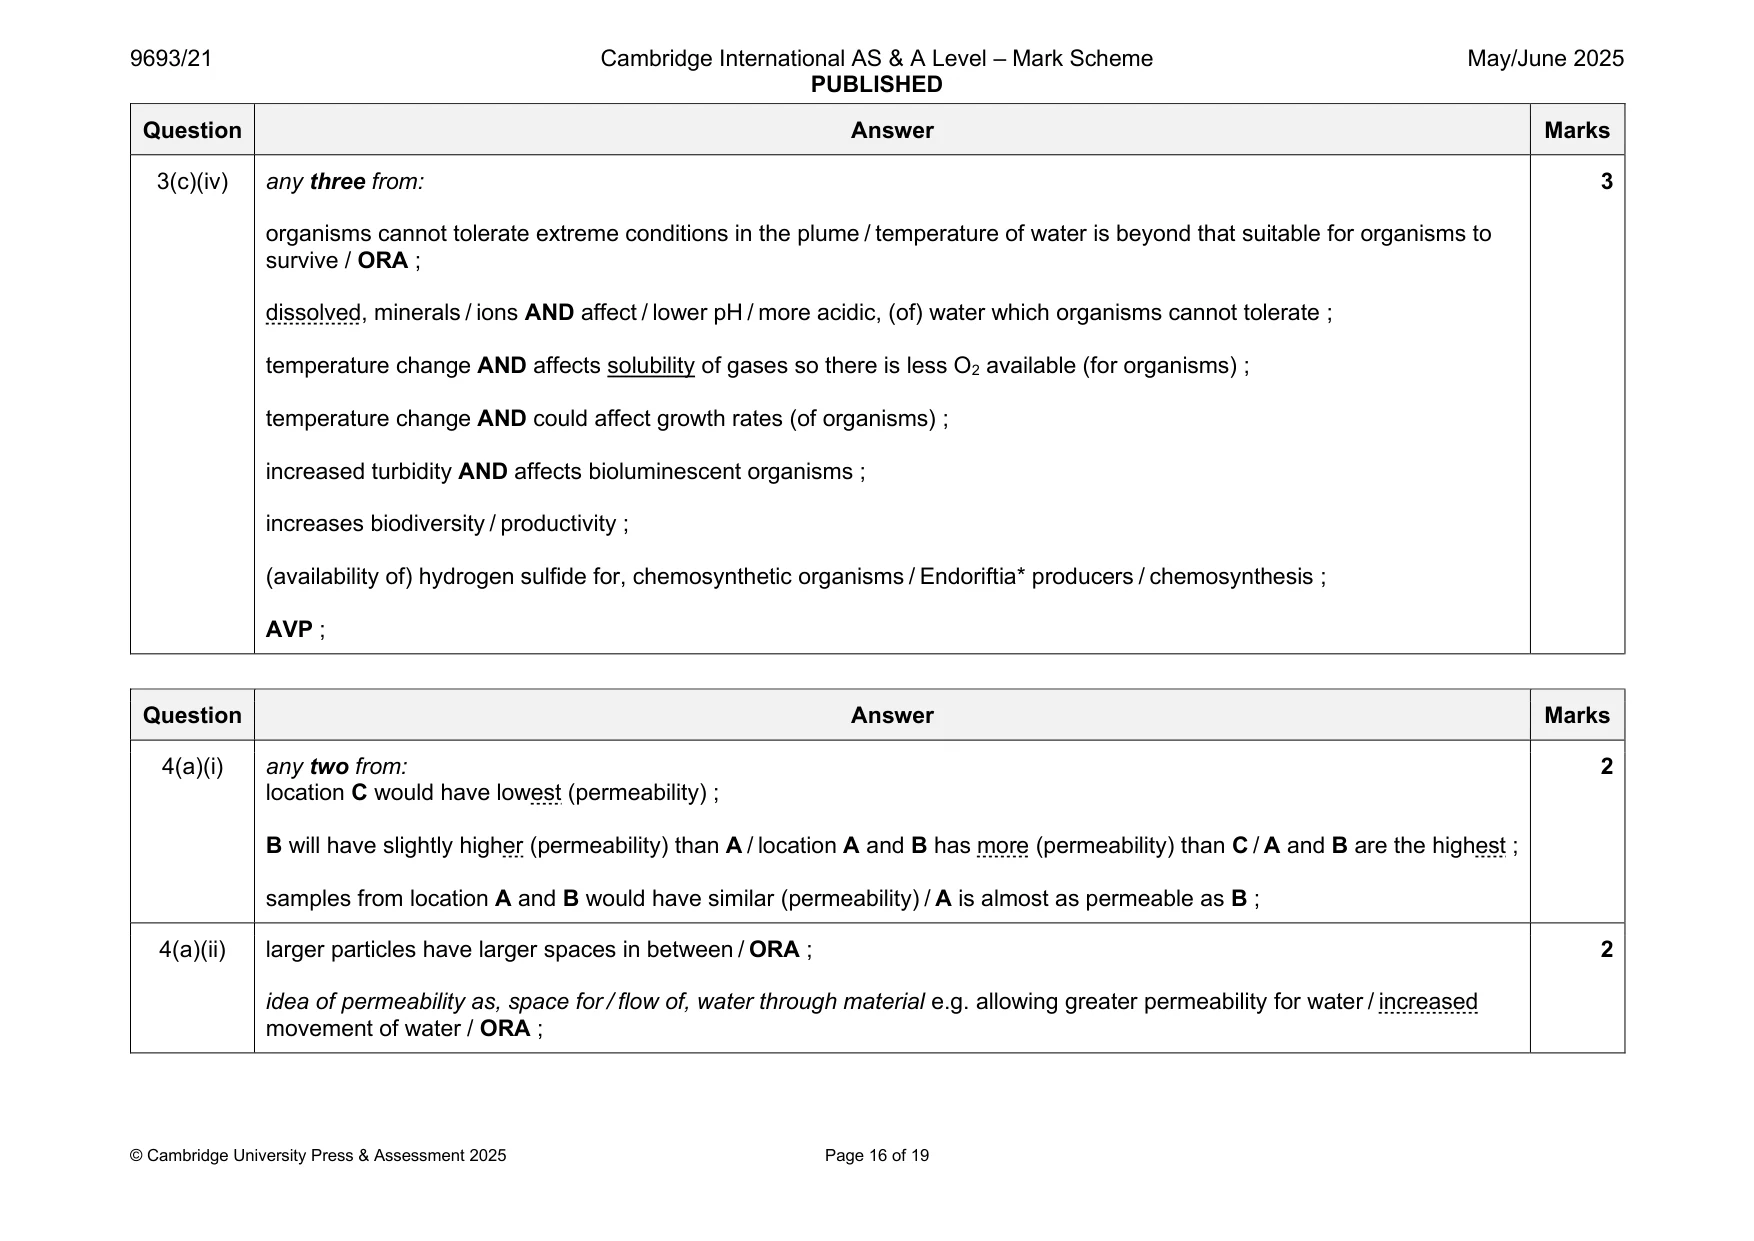
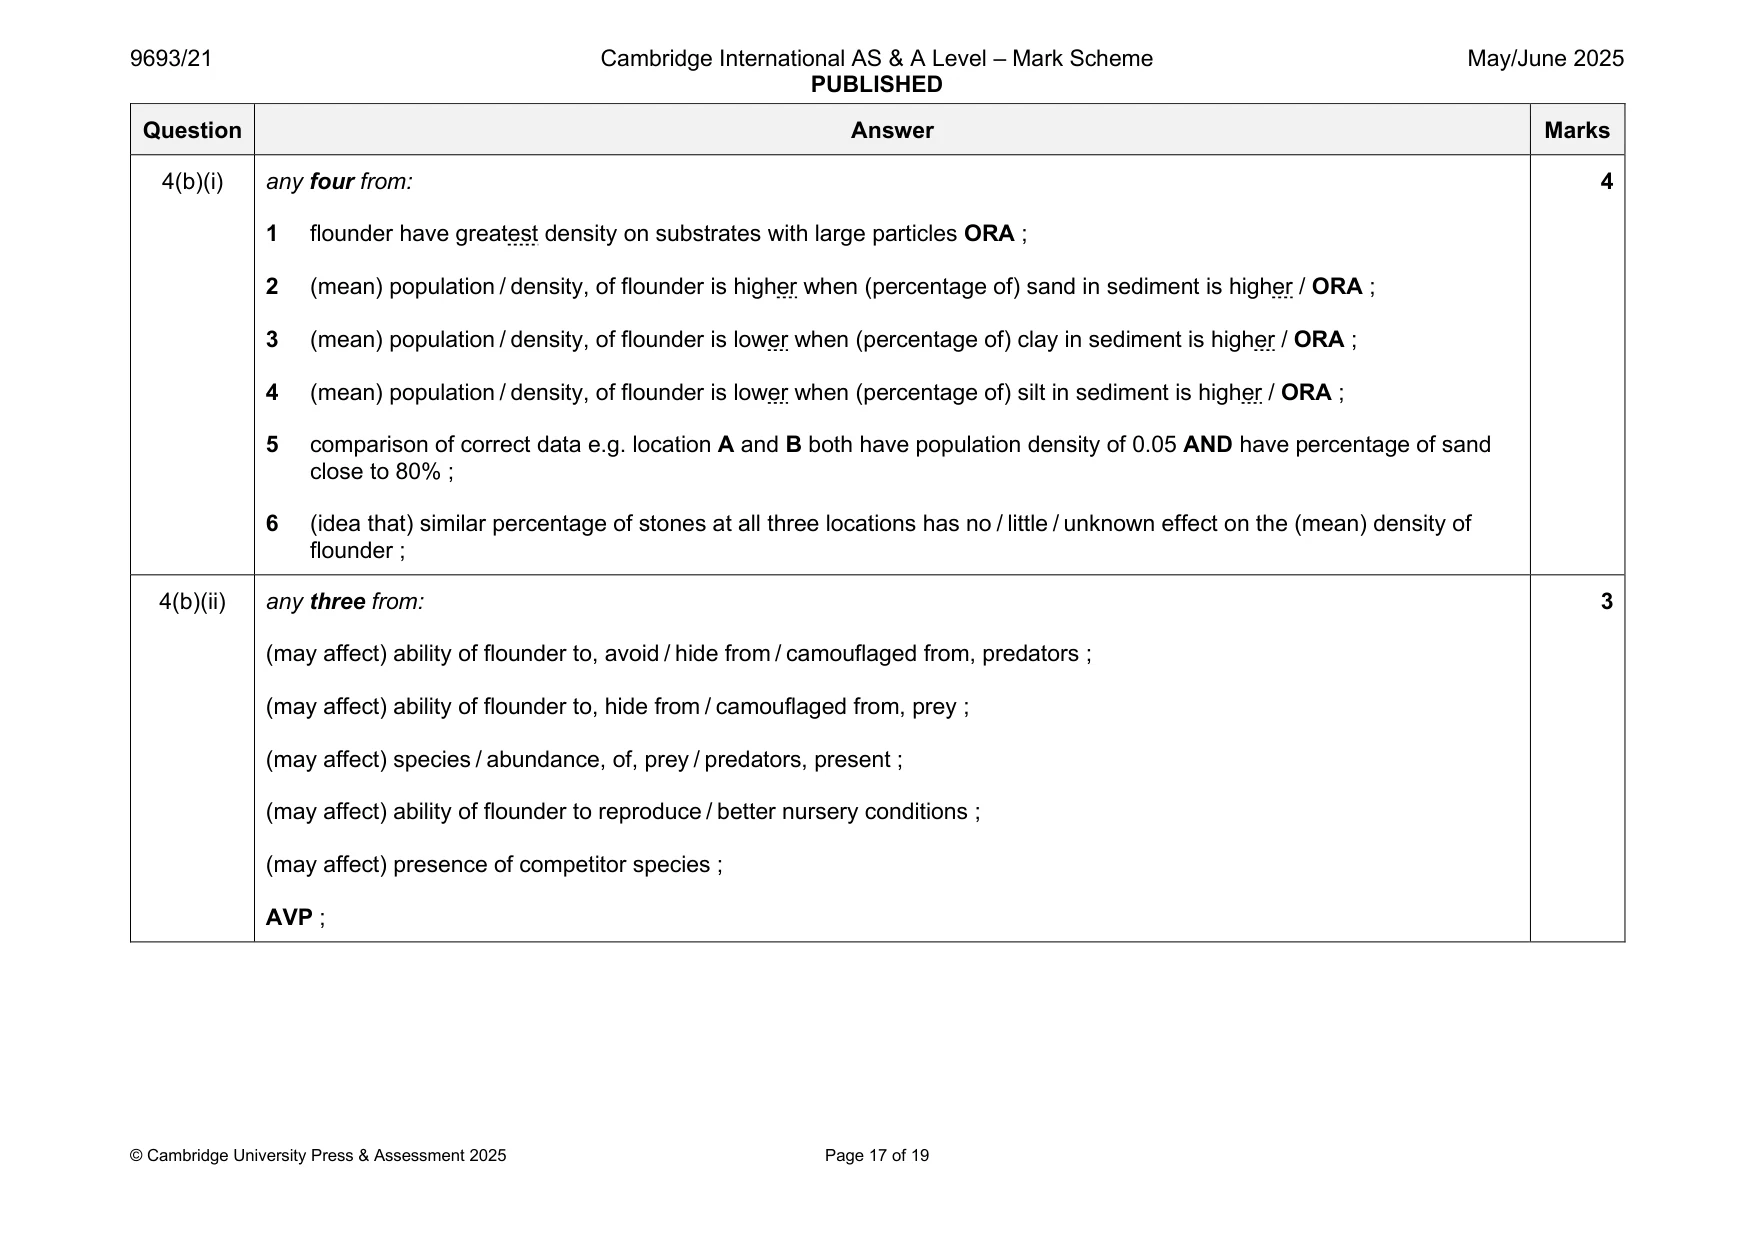
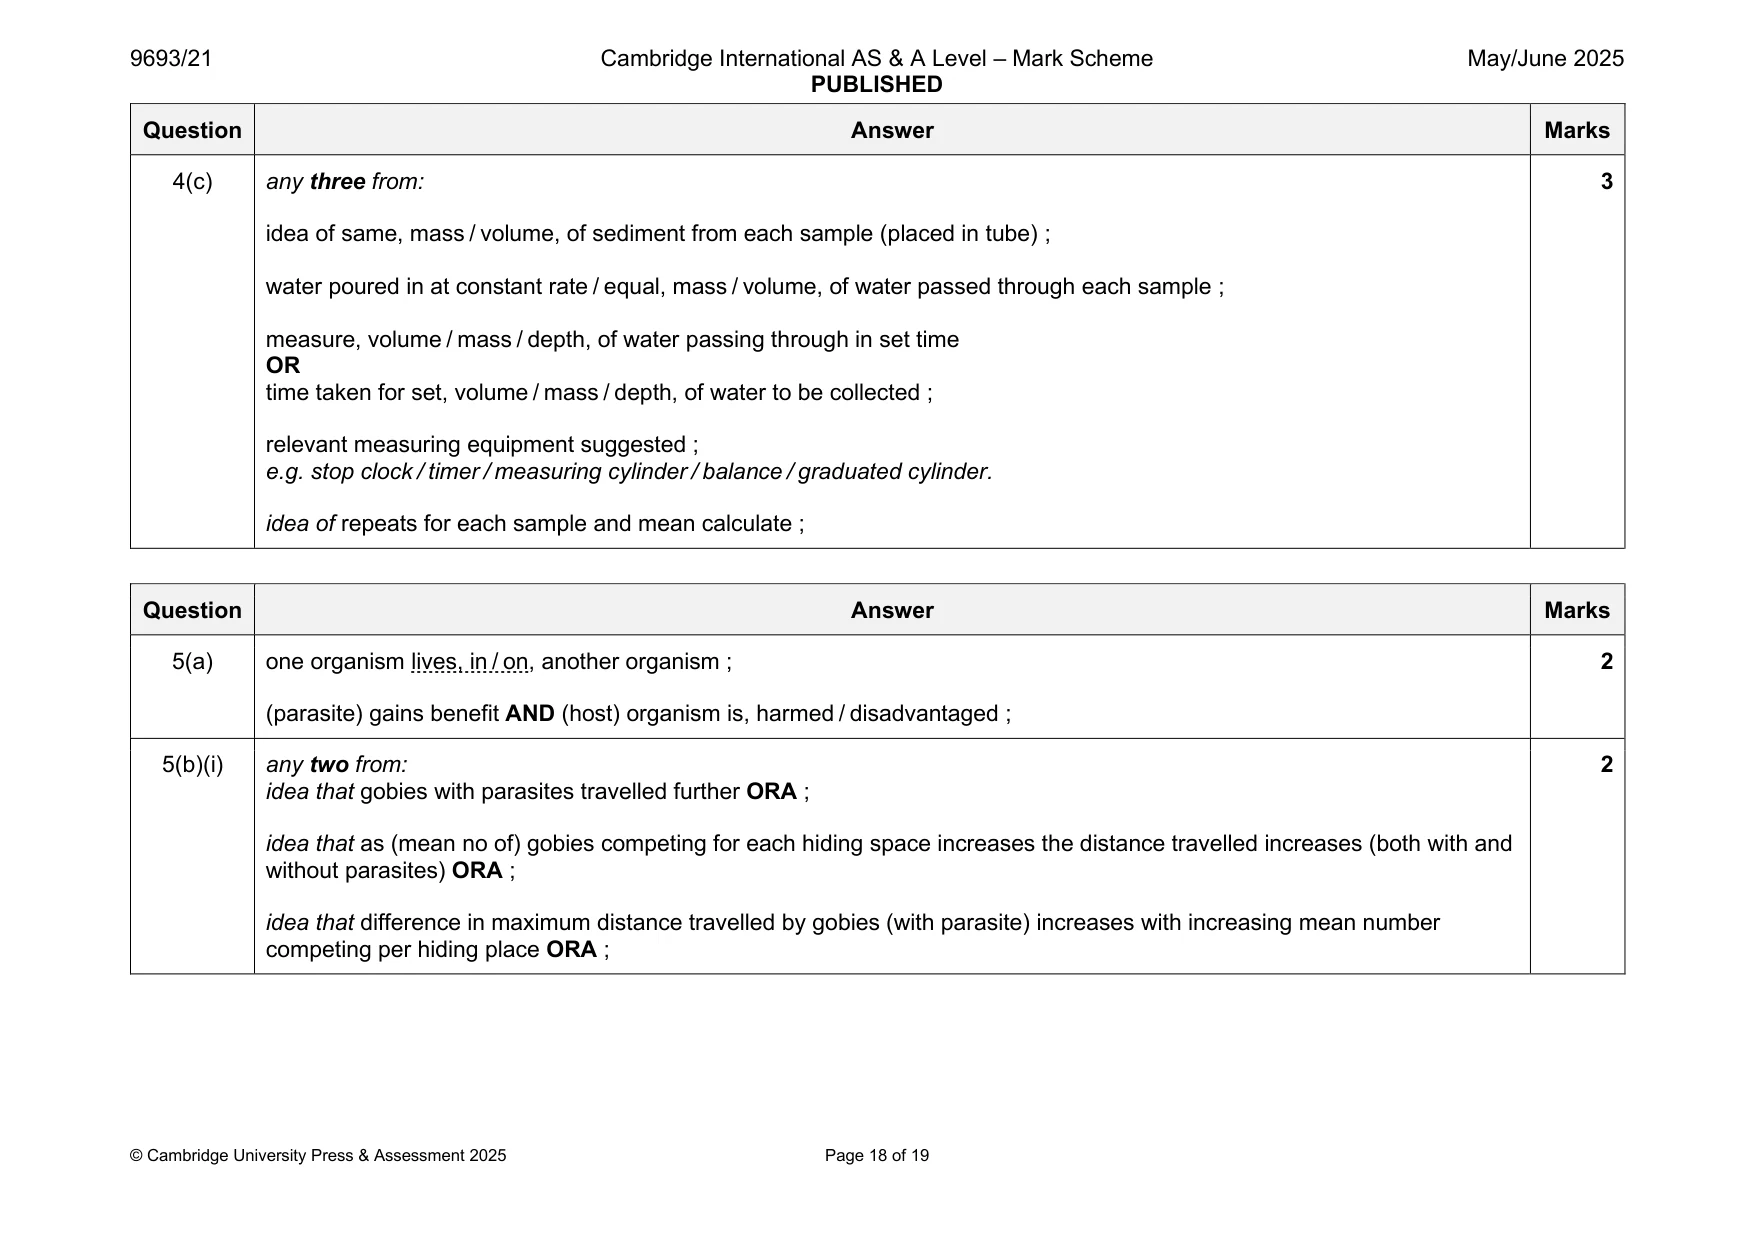
Mark scheme: 4(a)(i) any two from: 2 location C would have lowest (permeability) ; B will have slightly higher (permeability) than A / location A and B has more (permeability) than C / A and B are the highest ; samples from location A and B would have similar (permeability) / A is almost as permeable as B ; 4(a)(ii) larger particles have larger spaces in between / ORA ; 2 idea of permeability as, space for / flow of, water through material e.g. allowing greater permeability for water / increased movement of water / ORA ; 4(b)(i) any four from: 4 1 flounder have greatest density on substrates with large particles ORA ; 2 (mean) population / density, of flounder is higher when (percentage of) sand in sediment is higher / ORA ; 3 (mean) population / density, of flounder is lower when (percentage of) clay in sediment is higher / ORA ; 4 (mean) population / density, of flounder is lower when (percentage of) silt in sediment is higher / ORA ; 5 comparison of correct data e.g. location A and B both have population density of 0.05 AND have percentage of sand close to 80% ; 6 (idea that) similar percentage of stones at all three locations has no / little / unknown effect on the (mean) density of flounder ; 4(b)(ii) any three from: 3 (may affect) ability of flounder to, avoid / hide from / camouflaged from, predators ; (may affect) ability of flounder to, hide from / camouflaged from, prey ; (may affect) species / abundance, of, prey / predators, present ; (may affect) ability of flounder to reproduce / better nursery conditions ; (may affect) presence of competitor species ; AVP ; 4(c) any three from: 3 idea of same, mass / volume, of sediment from each sample (placed in tube) ; water poured in at constant rate / equal, mass / volume, of water passed through each sample ; measure, volume / mass / depth, of water passing through in set time OR time taken for set, volume / mass / depth, of water to be collected ; relevant measuring equipment suggested ; e.g. stop clock / timer / measuring cylinder / balance / graduated cylinder. idea of repeats for each sample and mean calculate ;
Q5 · Some copepods are parasites of marine fish
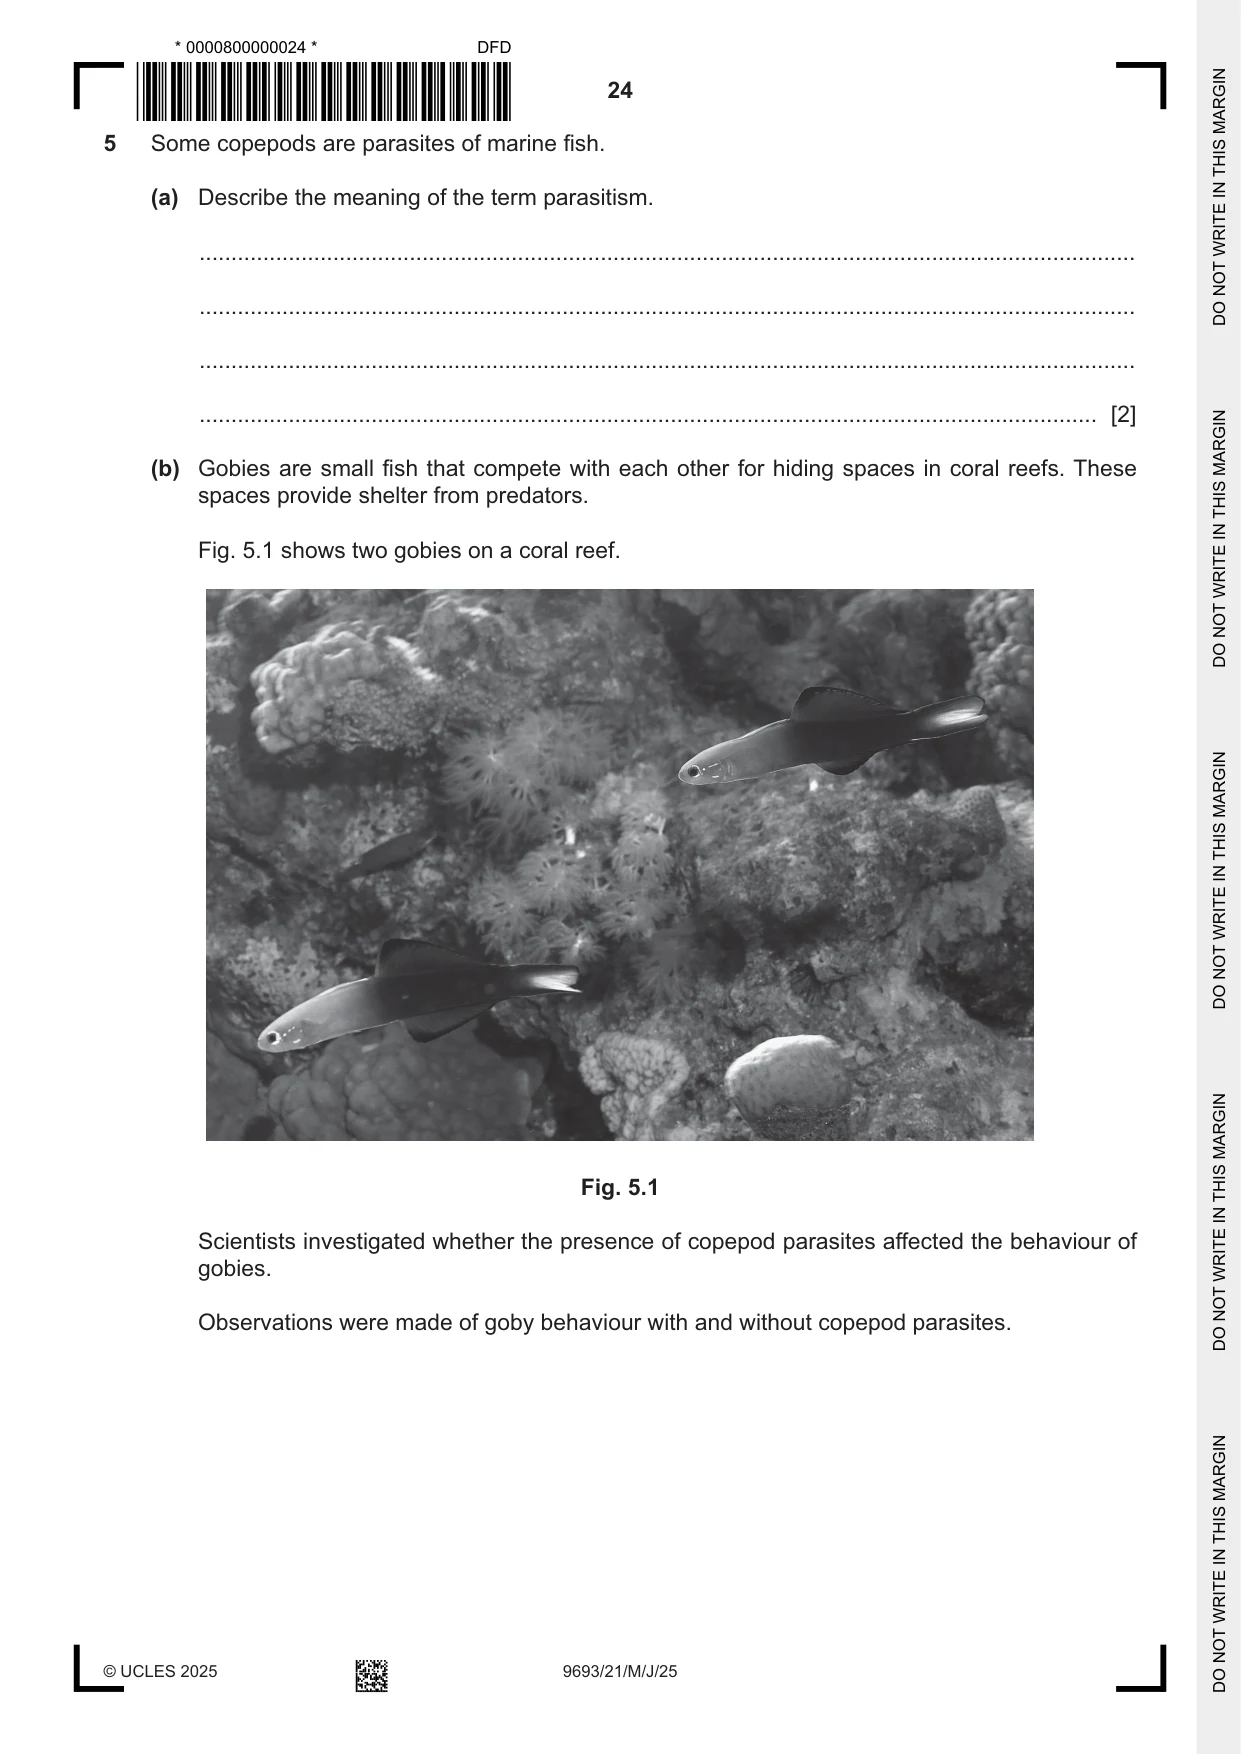
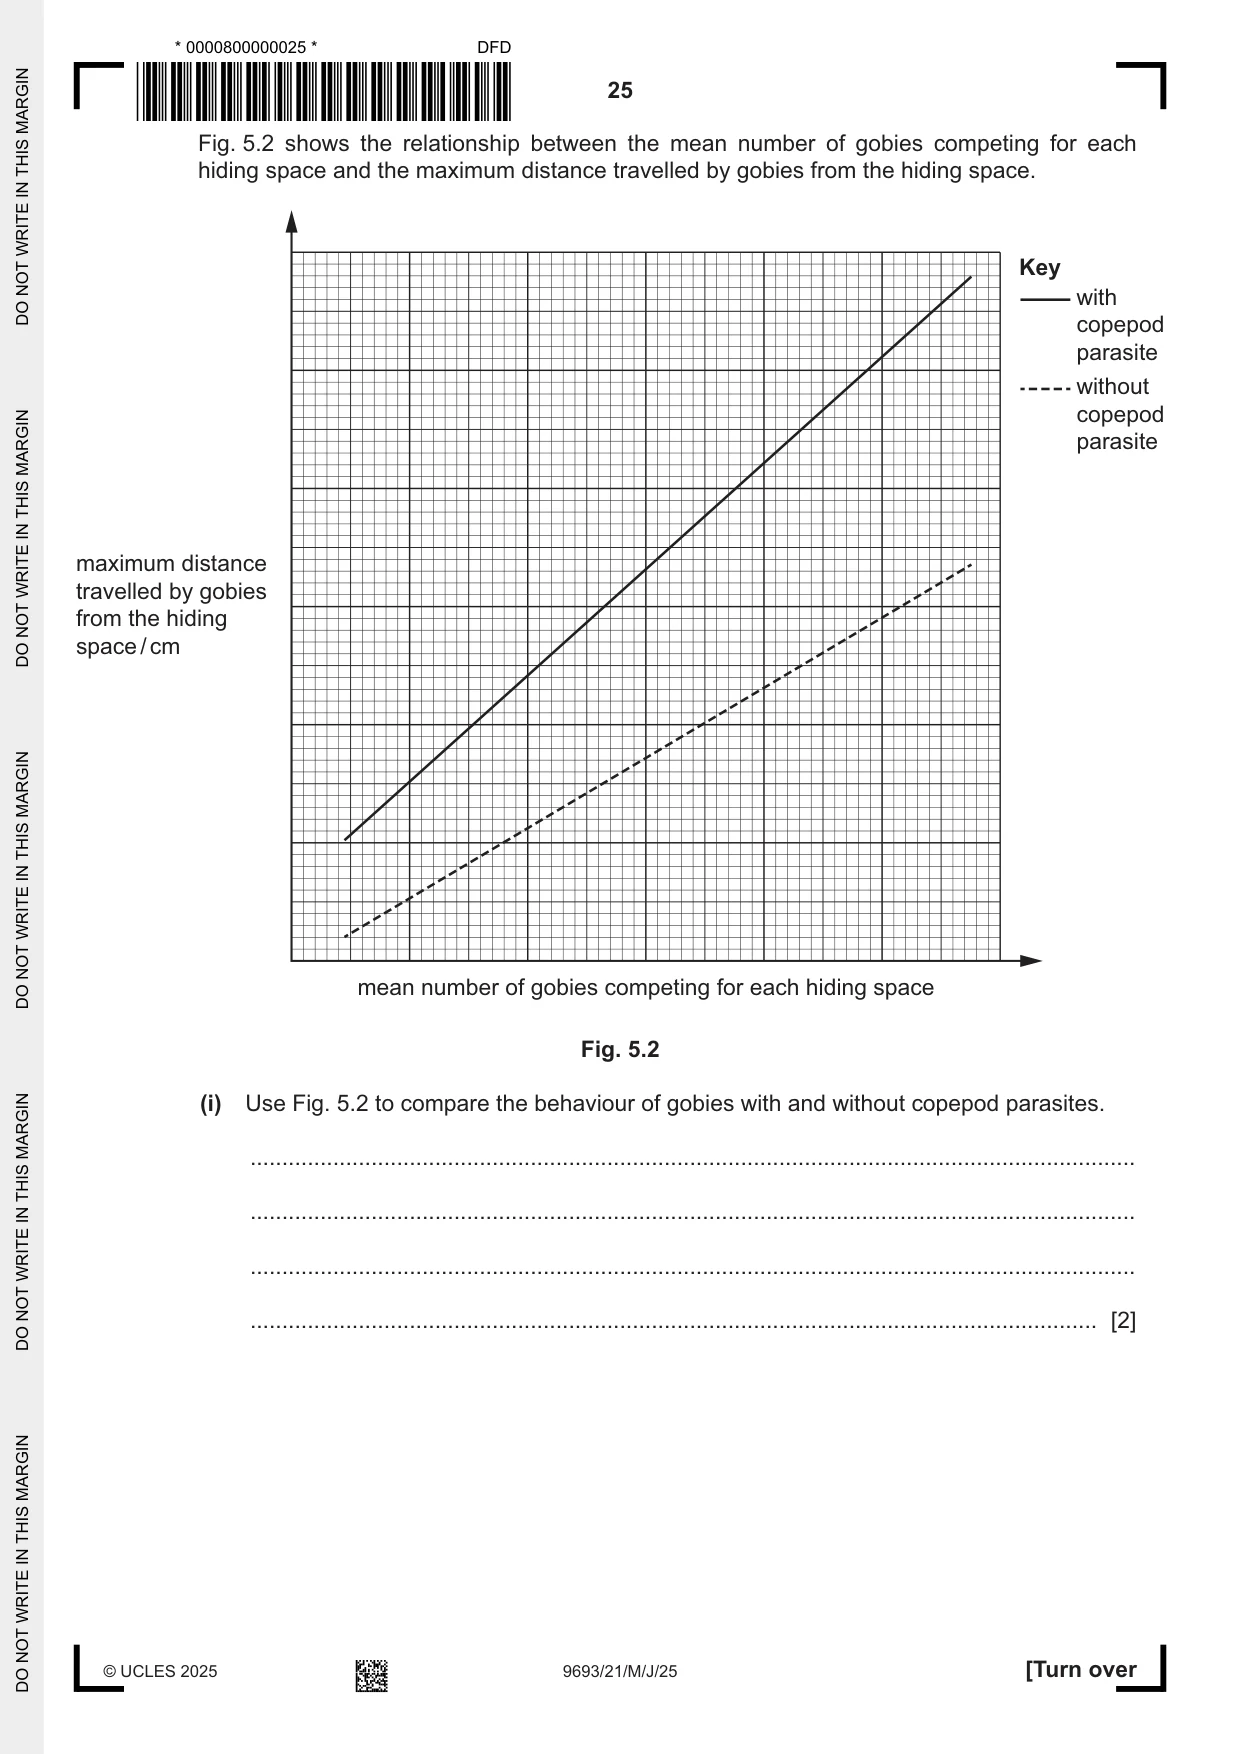
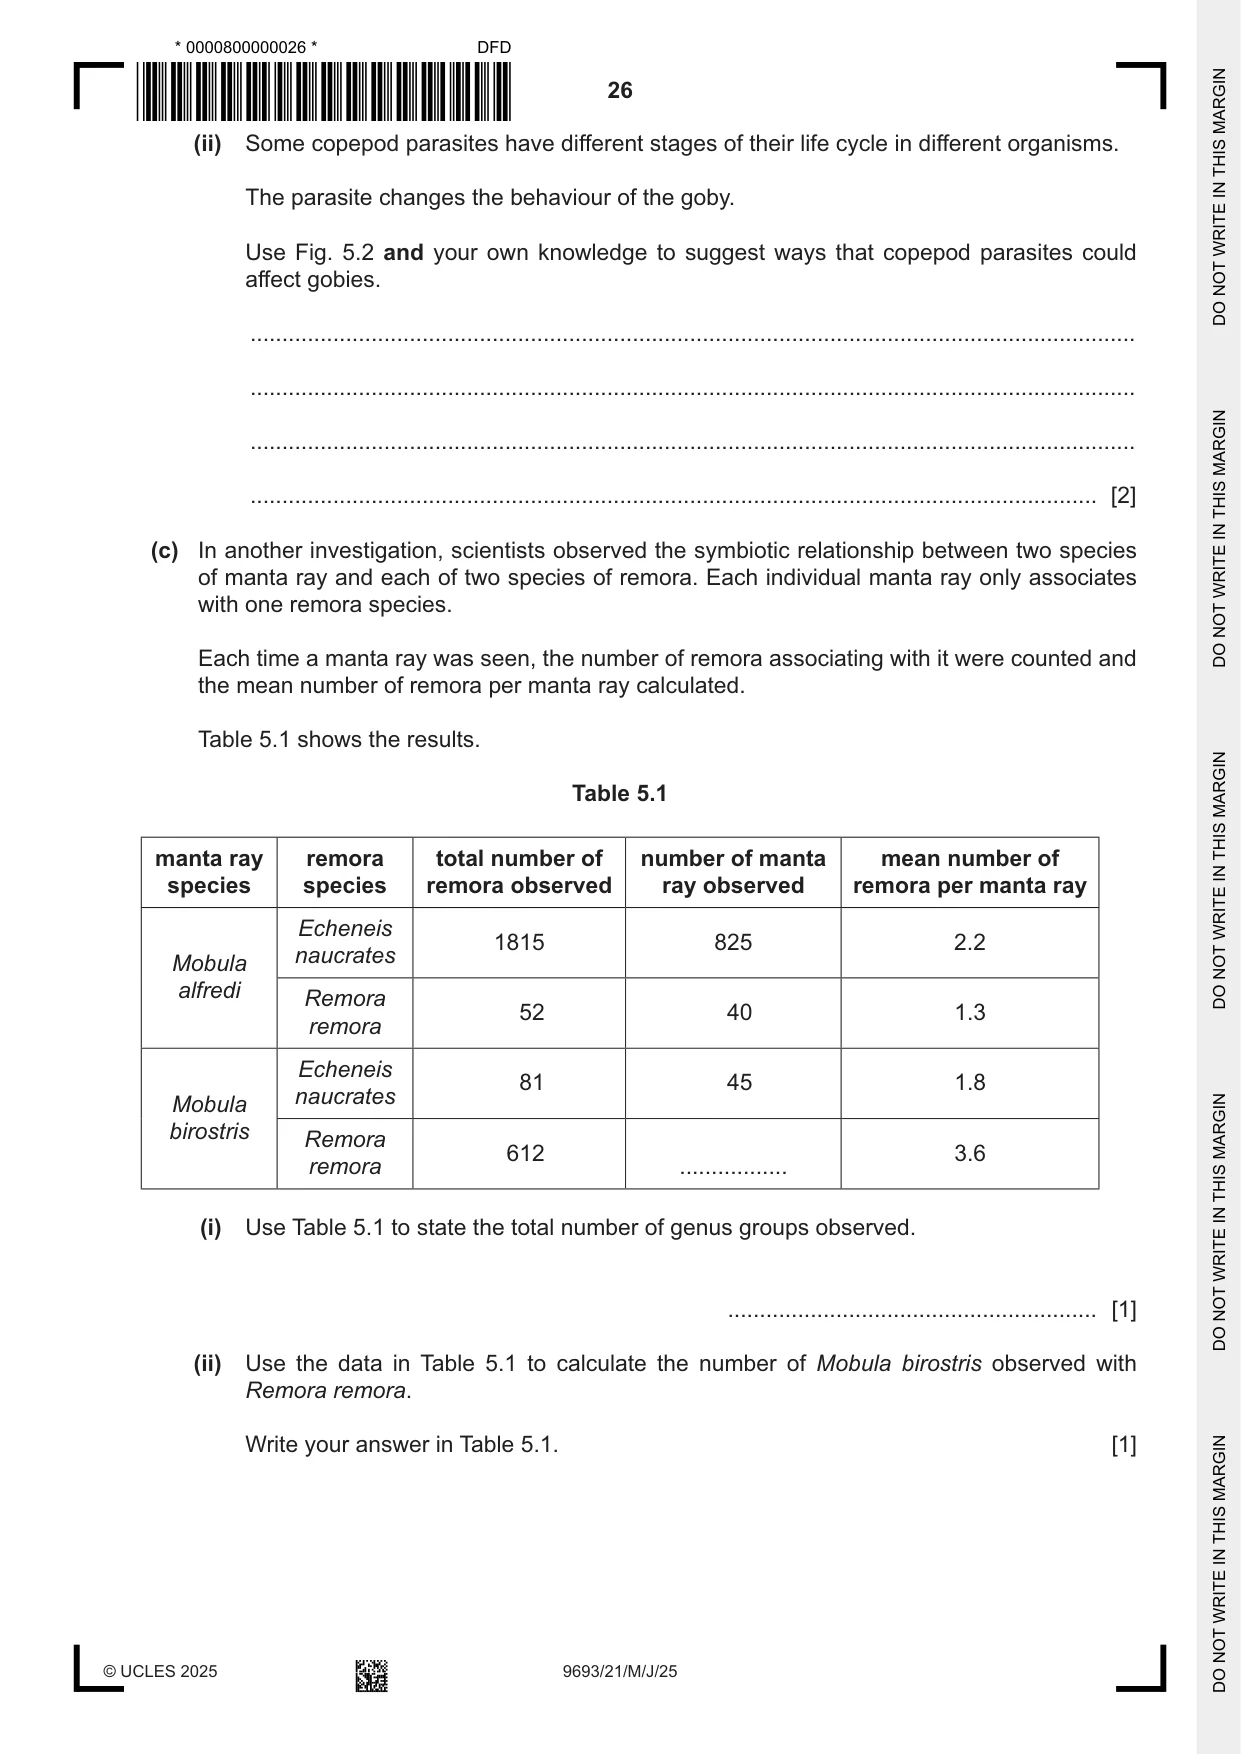
5 Some copepods are parasites of marine fish. (a) Describe the meaning of the term parasitism. ................................................................................................................................................... ................................................................................................................................................... ................................................................................................................................................... ............................................................................................................................................. [2] (b) Gobies are small fish that compete with each other for hiding spaces in coral reefs. These spaces provide shelter from predators. Fig. 5.1 shows two gobies on a coral reef. Fig. 5.1 Scientists investigated whether the presence of copepod parasites affected the behaviour of gobies. Observations were made of goby behaviour with and without copepod parasites. Fig. 5.2 shows the relationship between the mean number of gobies competing for each hiding space and the maximum distance travelled by gobies from the hiding space. Key with copepod parasite without copepod parasite maximum distance travelled by gobies from the hiding space / cm mean number of gobies competing for each hiding space Fig. 5.2 (i) Use Fig. 5.2 to compare the behaviour of gobies with and without copepod parasites. ........................................................................................................................................... ........................................................................................................................................... ........................................................................................................................................... ..................................................................................................................................... [2] (ii) Some copepod parasites have different stages of their life cycle in different organisms. The parasite changes the behaviour of the goby. Use Fig. 5.2 and your own knowledge to suggest ways that copepod parasites could affect gobies. ........................................................................................................................................... ........................................................................................................................................... ........................................................................................................................................... ..................................................................................................................................... [2] (c) In another investigation, scientists observed the symbiotic relationship between two species of manta ray and each of two species of remora. Each individual manta ray only associates with one remora species. Each time a manta ray was seen, the number of remora associating with it were counted and the mean number of remora per manta ray calculated. Table 5.1 shows the results. Table 5.1 manta ray remora total number of number of manta mean number of species species remora observed ray observed remora per manta ray Echeneis 1815 825 2.2 naucrates Mobula alfredi Remora 52 40 1.3 remora Echeneis 81 45 1.8 naucrates Mobula birostris Remora 612 3.6 remora ................. (i) Use Table 5.1 to state the total number of genus groups observed. .......................................................... [1] (ii) Use the data in Table 5.1 to calculate the number of Mobula birostris observed with Remora remora. Write your answer in Table 5.1. [1]
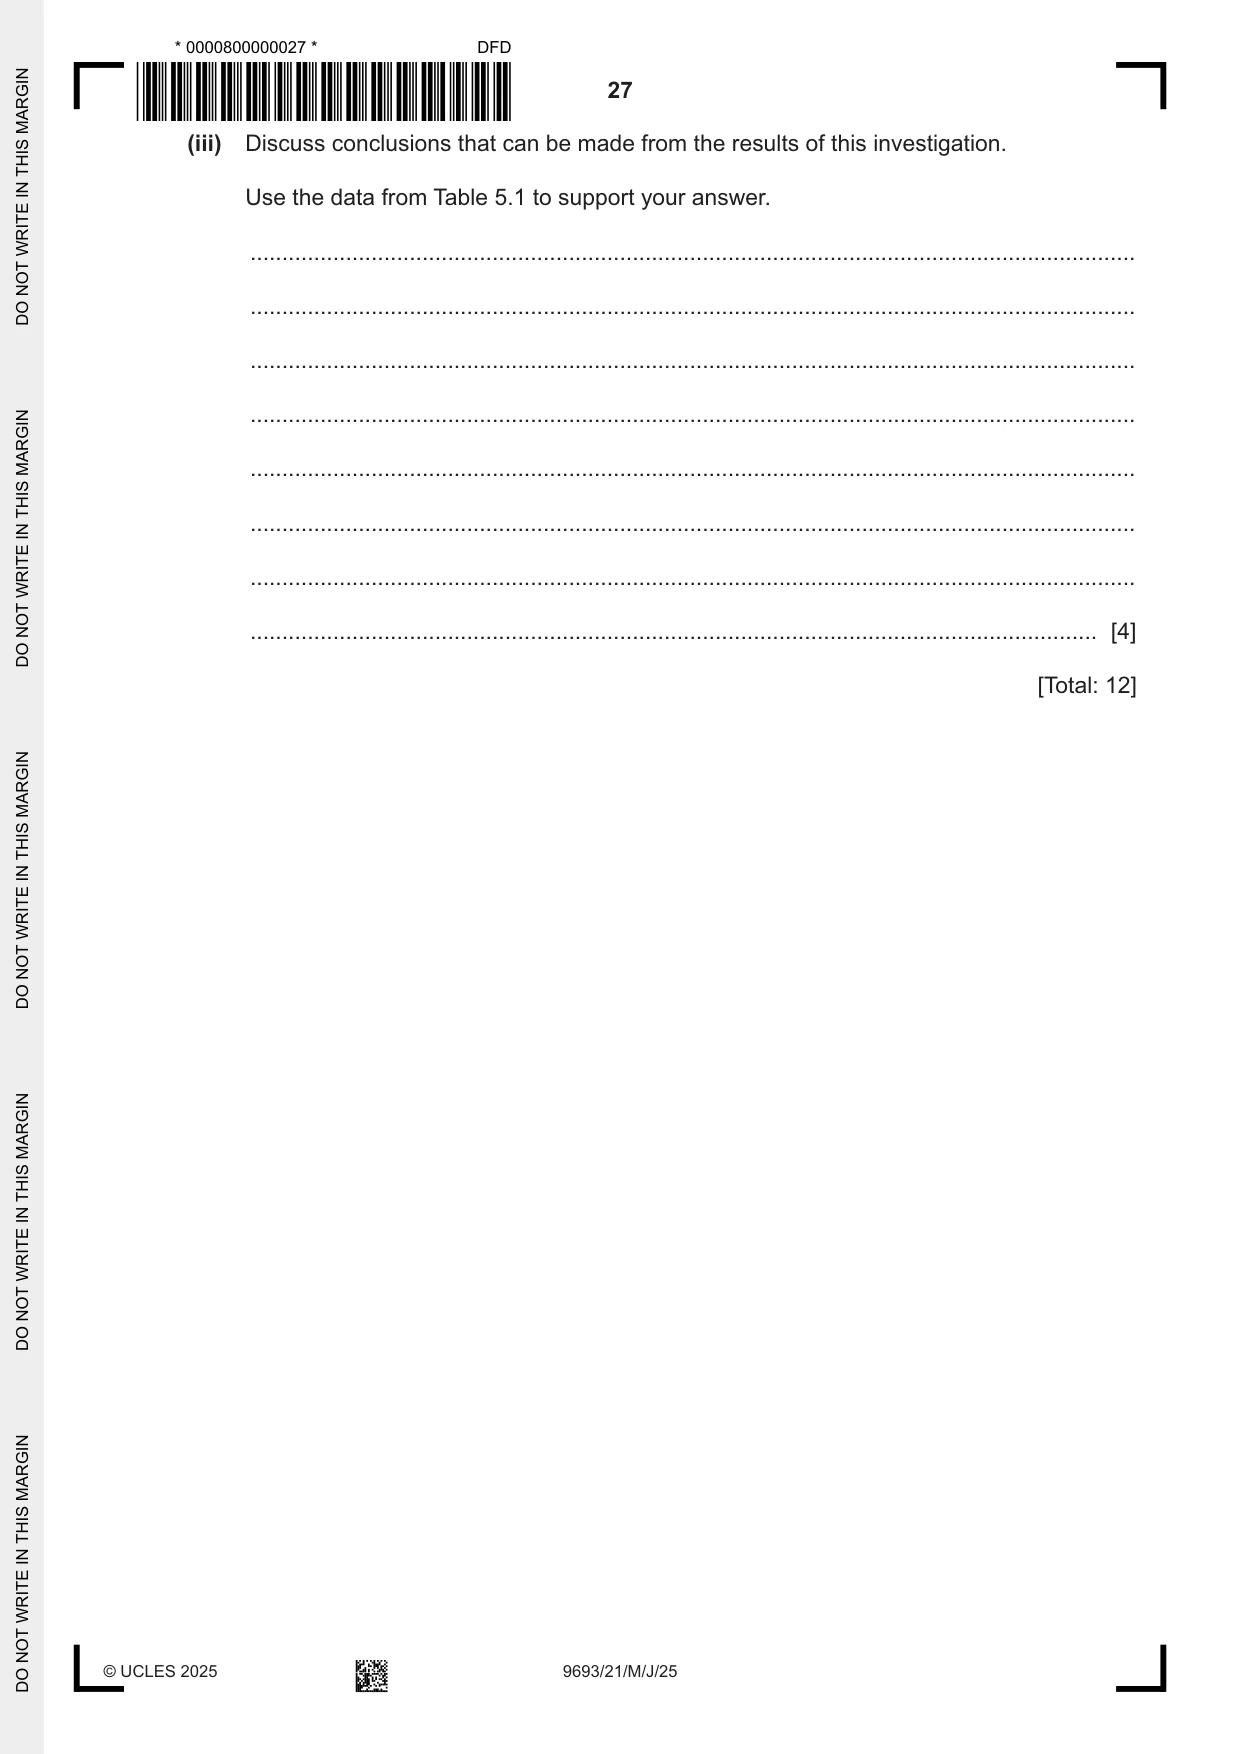
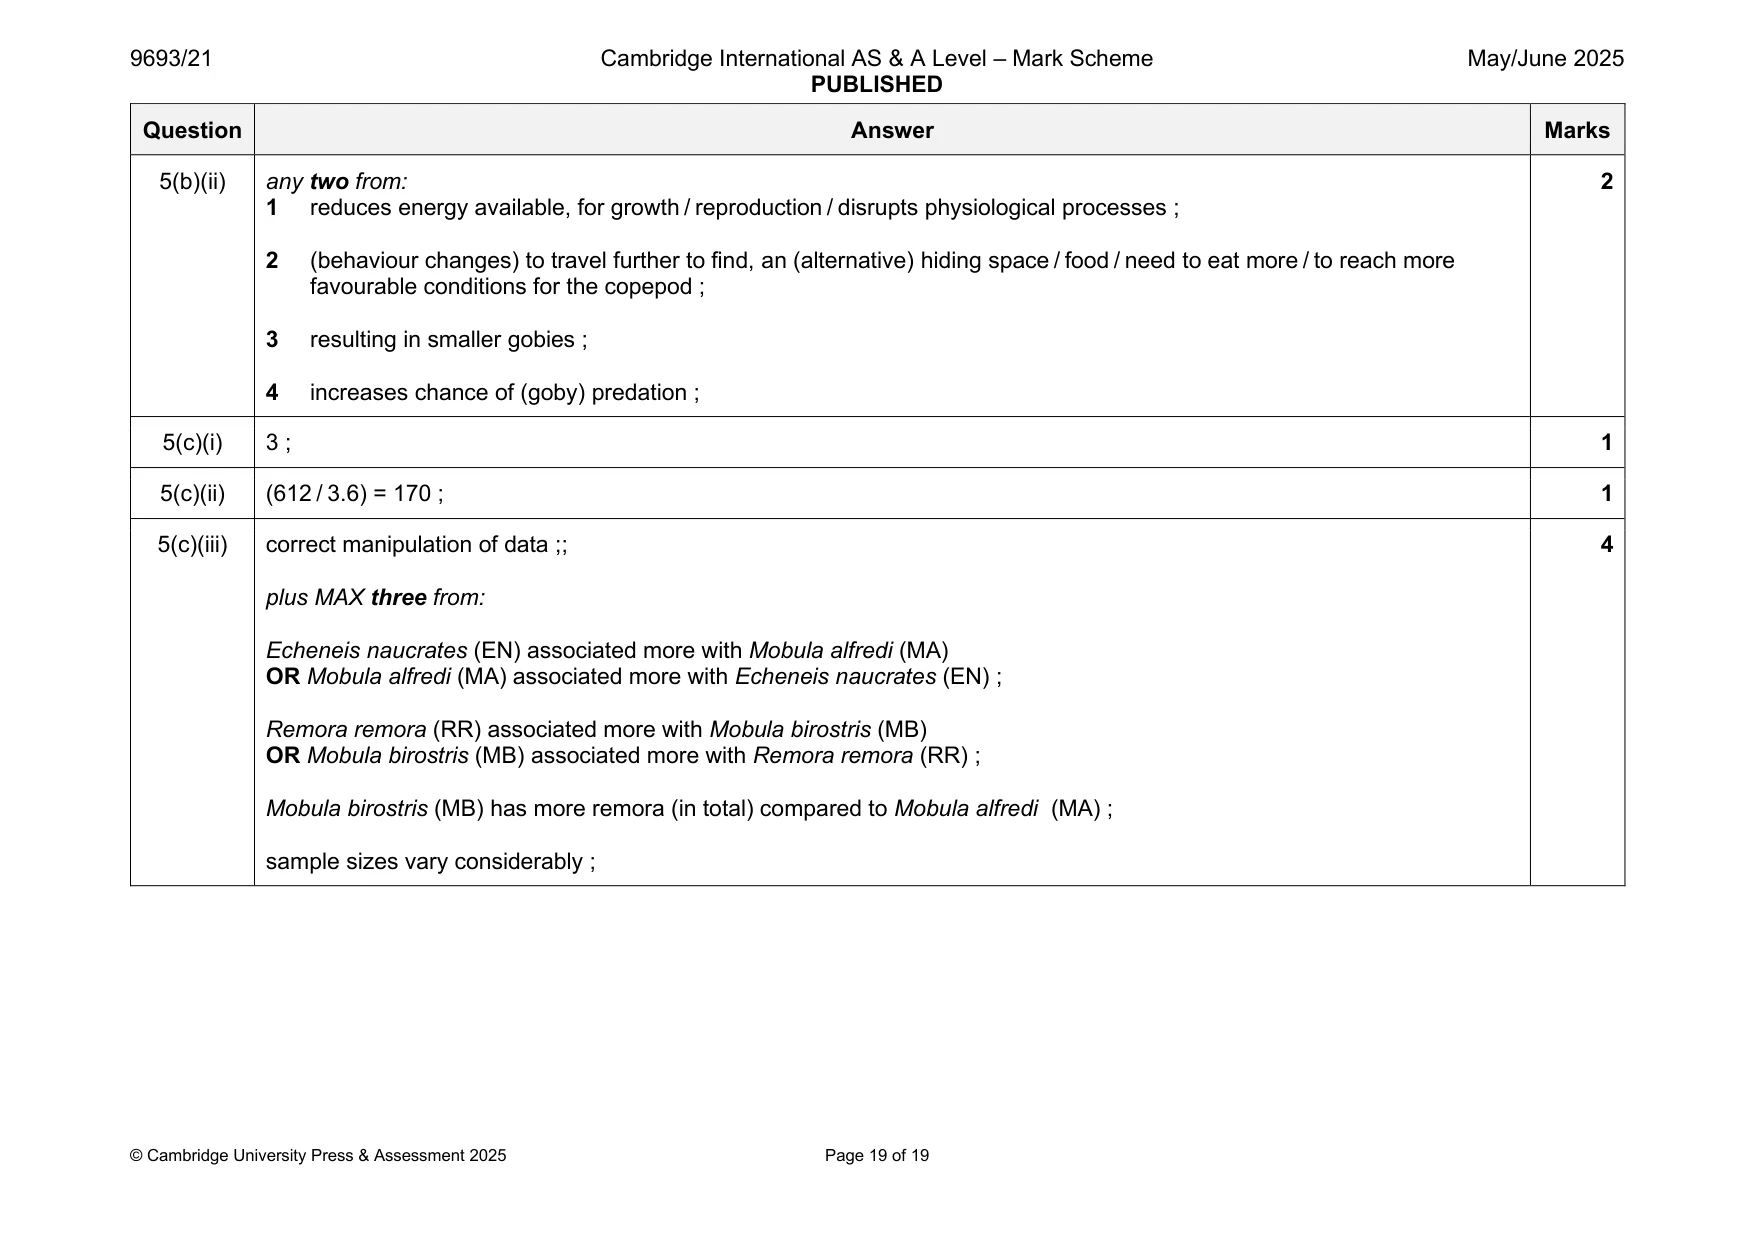
Mark scheme: 5(a) one organism lives, in / on, another organism ; 2 (parasite) gains benefit AND (host) organism is, harmed / disadvantaged ; 5(b)(i) any two from: 2 idea that gobies with parasites travelled further ORA ; idea that as (mean no of) gobies competing for each hiding space increases the distance travelled increases (both with and without parasites) ORA ; idea that difference in maximum distance travelled by gobies (with parasite) increases with increasing mean number competing per hiding place ORA ; 5(b)(ii) any two from: 2 1 reduces energy available, for growth / reproduction / disrupts physiological processes ; 2 (behaviour changes) to travel further to find, an (alternative) hiding space / food / need to eat more / to reach more favourable conditions for the copepod ; 3 resulting in smaller gobies ; 4 increases chance of (goby) predation ; 5(c)(i) 3 ; 1 5(c)(ii) (612 / 3.6) = 170 ; 1 5(c)(iii) correct manipulation of data ;; 4 plus MAX three from: Echeneis naucrates (EN) associated more with Mobula alfredi (MA) OR Mobula alfredi (MA) associated more with Echeneis naucrates (EN) ; Remora remora (RR) associated more with Mobula birostris (MB) OR Mobula birostris (MB) associated more with Remora remora (RR) ; Mobula birostris (MB) has more remora (in total) compared to Mobula alfredi (MA) ; sample sizes vary considerably ;
What was in this paper
The subtopics covered by these 5 questions, and how many questions each got. Open one in a new tab to see every Cambridge question on it.
What you needed in this session
Cambridge’s own grade thresholds for 2025 May/June, Paper 2 · Variant 1. A higher threshold means an easier paper — the bar moves with how the cohort did.