Cambridge A Level Marine Science 9693 — 2025 May/June Paper 2 · Variant 2
9693/22/M/J/25 · 4 questions · 75 marks · 105 min
The question paper and its mark scheme, free to read here and free to download. This is Cambridge’s own paper, exactly as it was sat.
Question paper20 pages




Mark scheme16 pages
Answers below. Sit the paper first if you are practising.
Questions as text
Q1 · Scientists in Australia monitored the population of the Green Turtle for five years
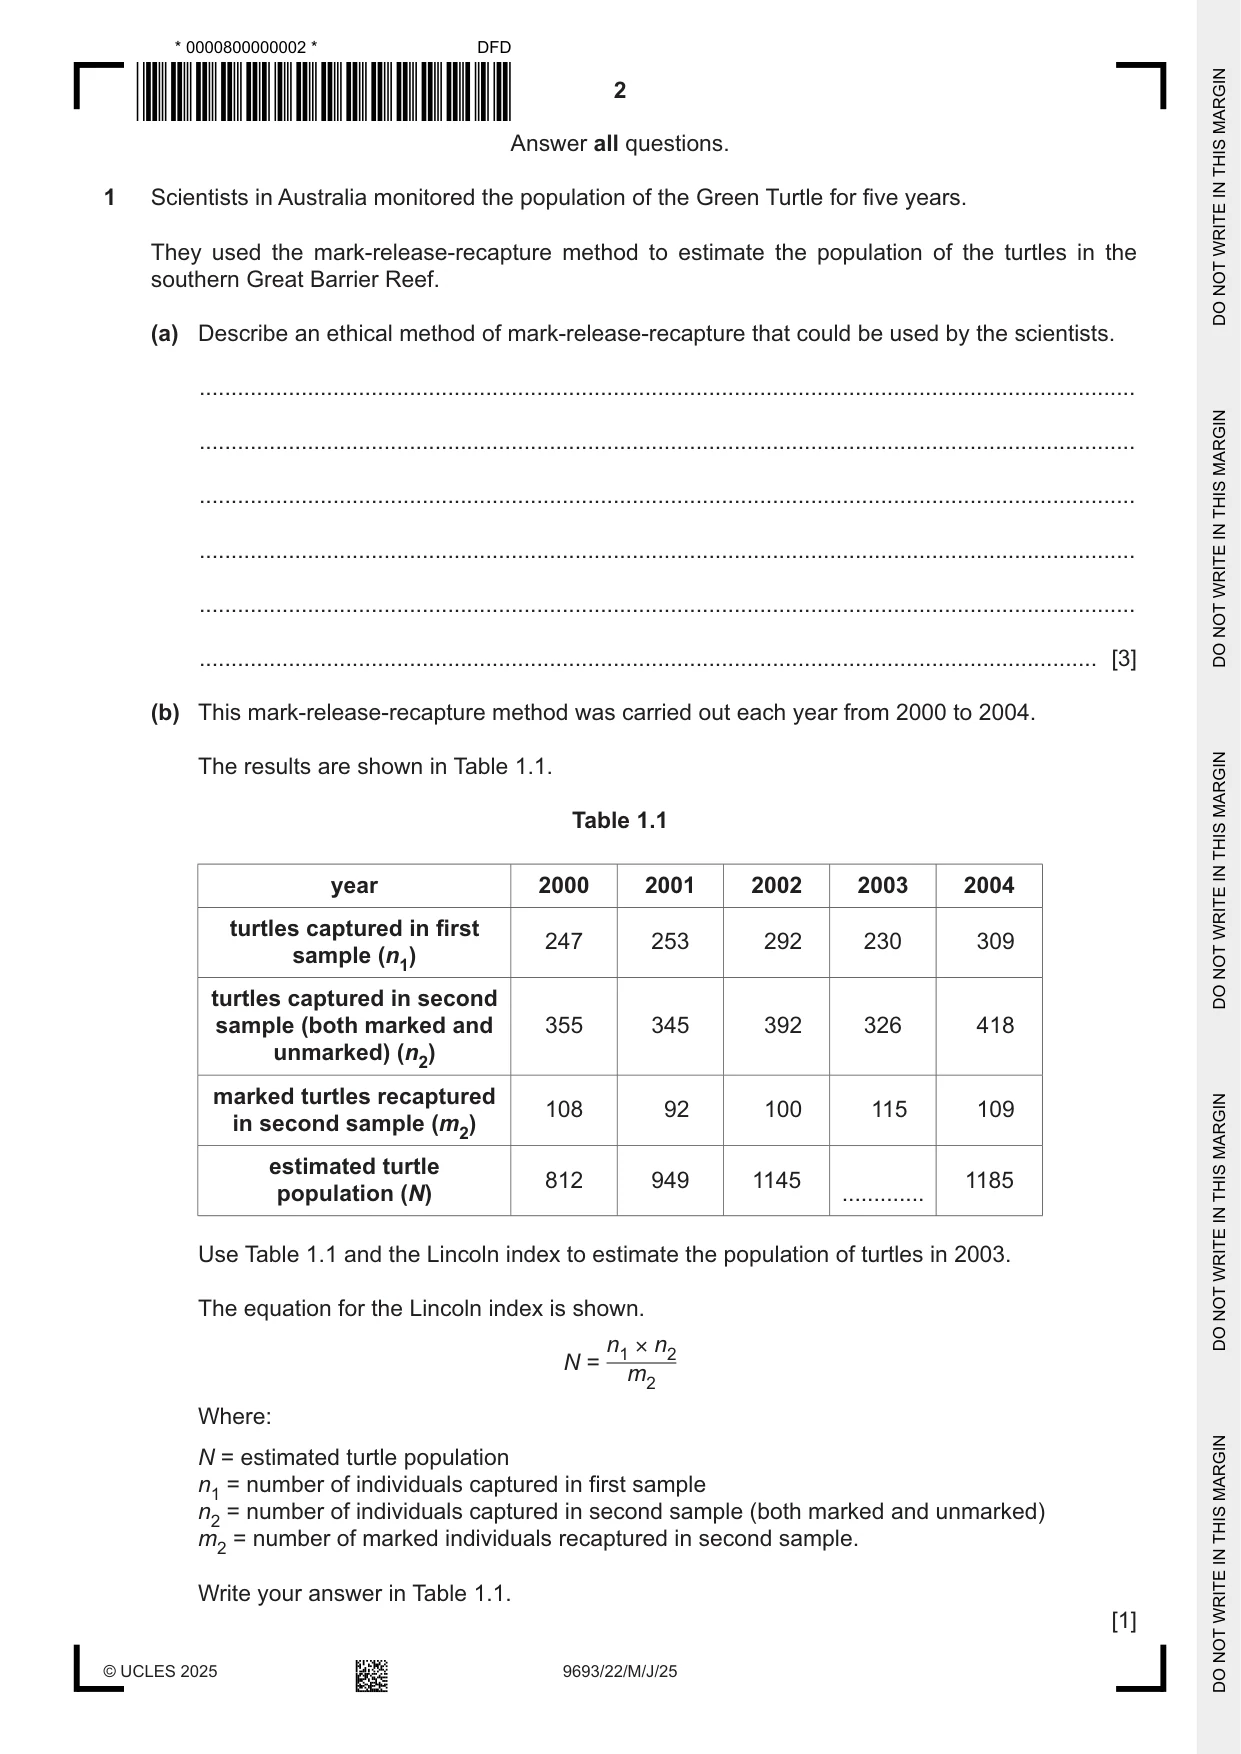
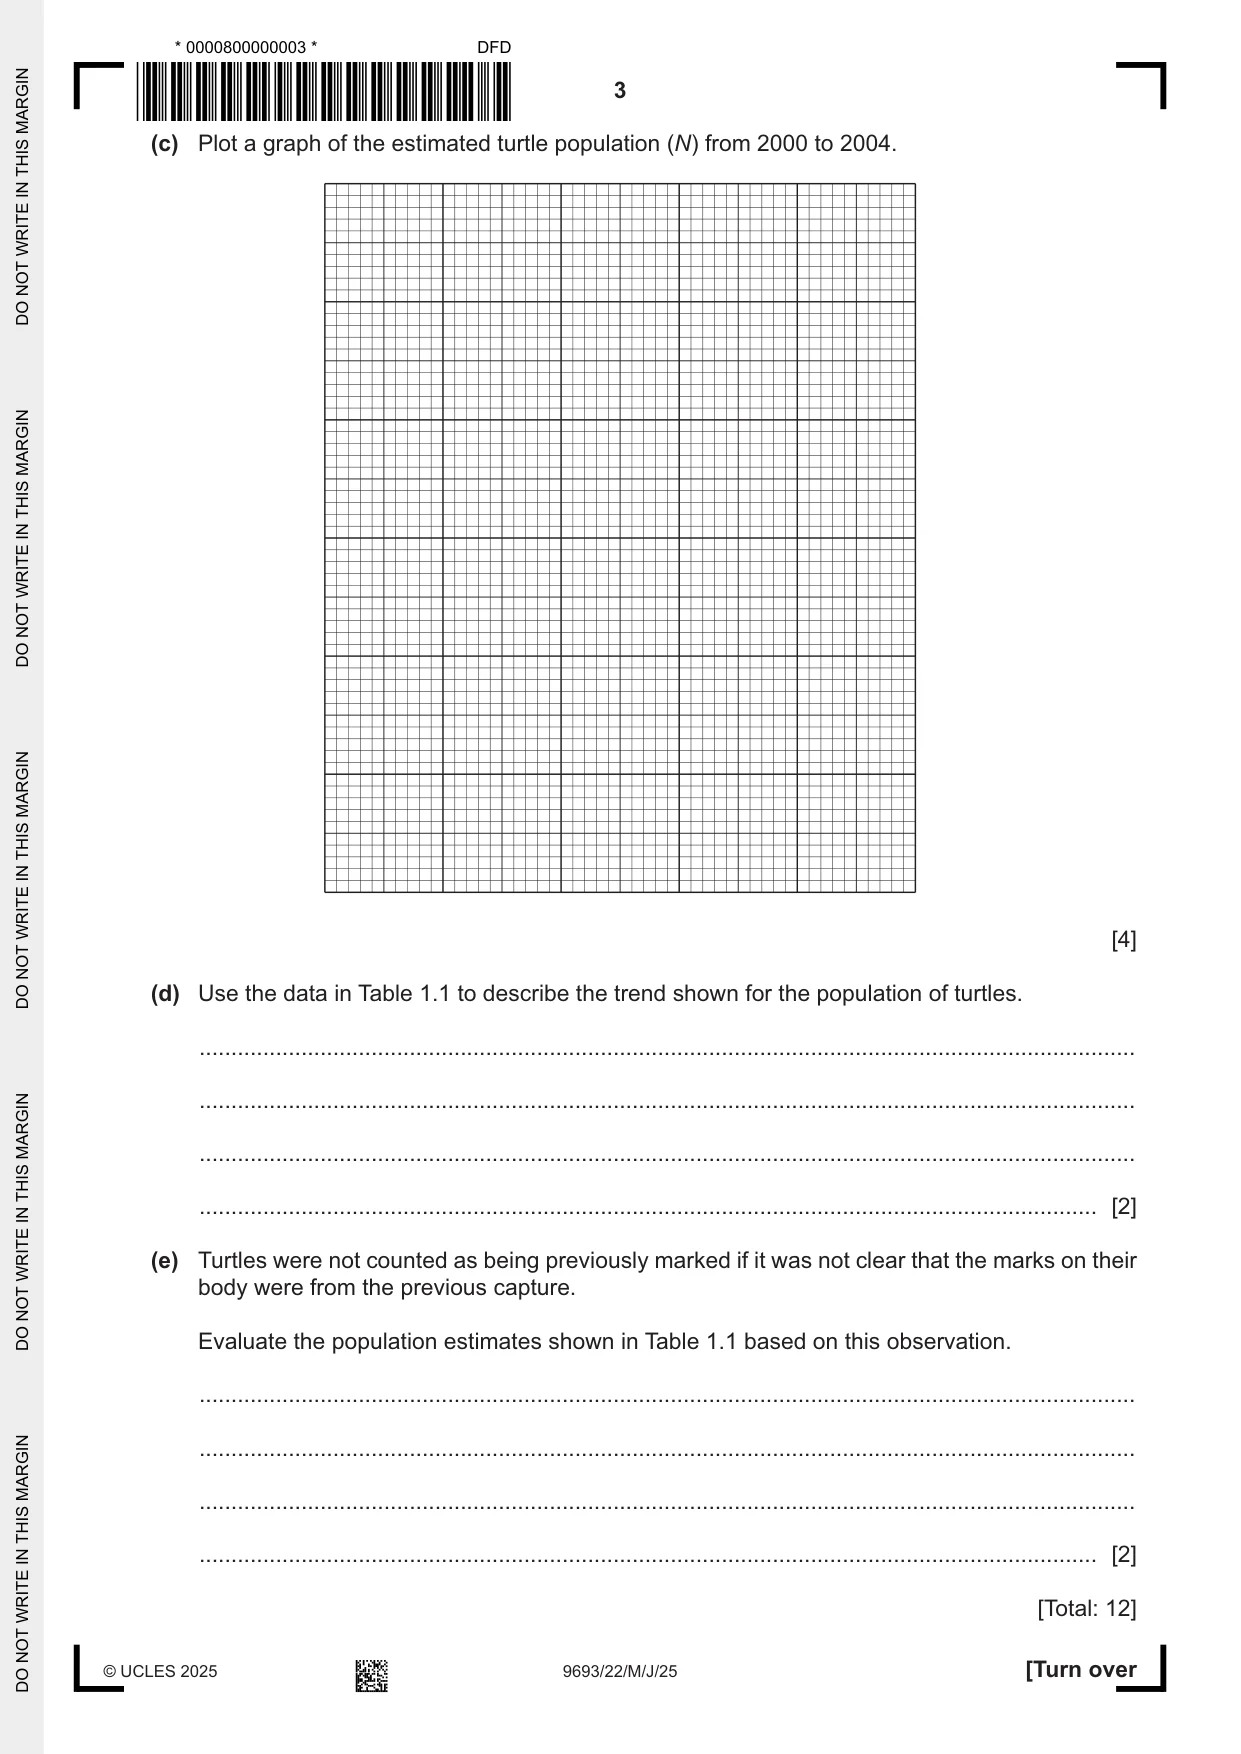
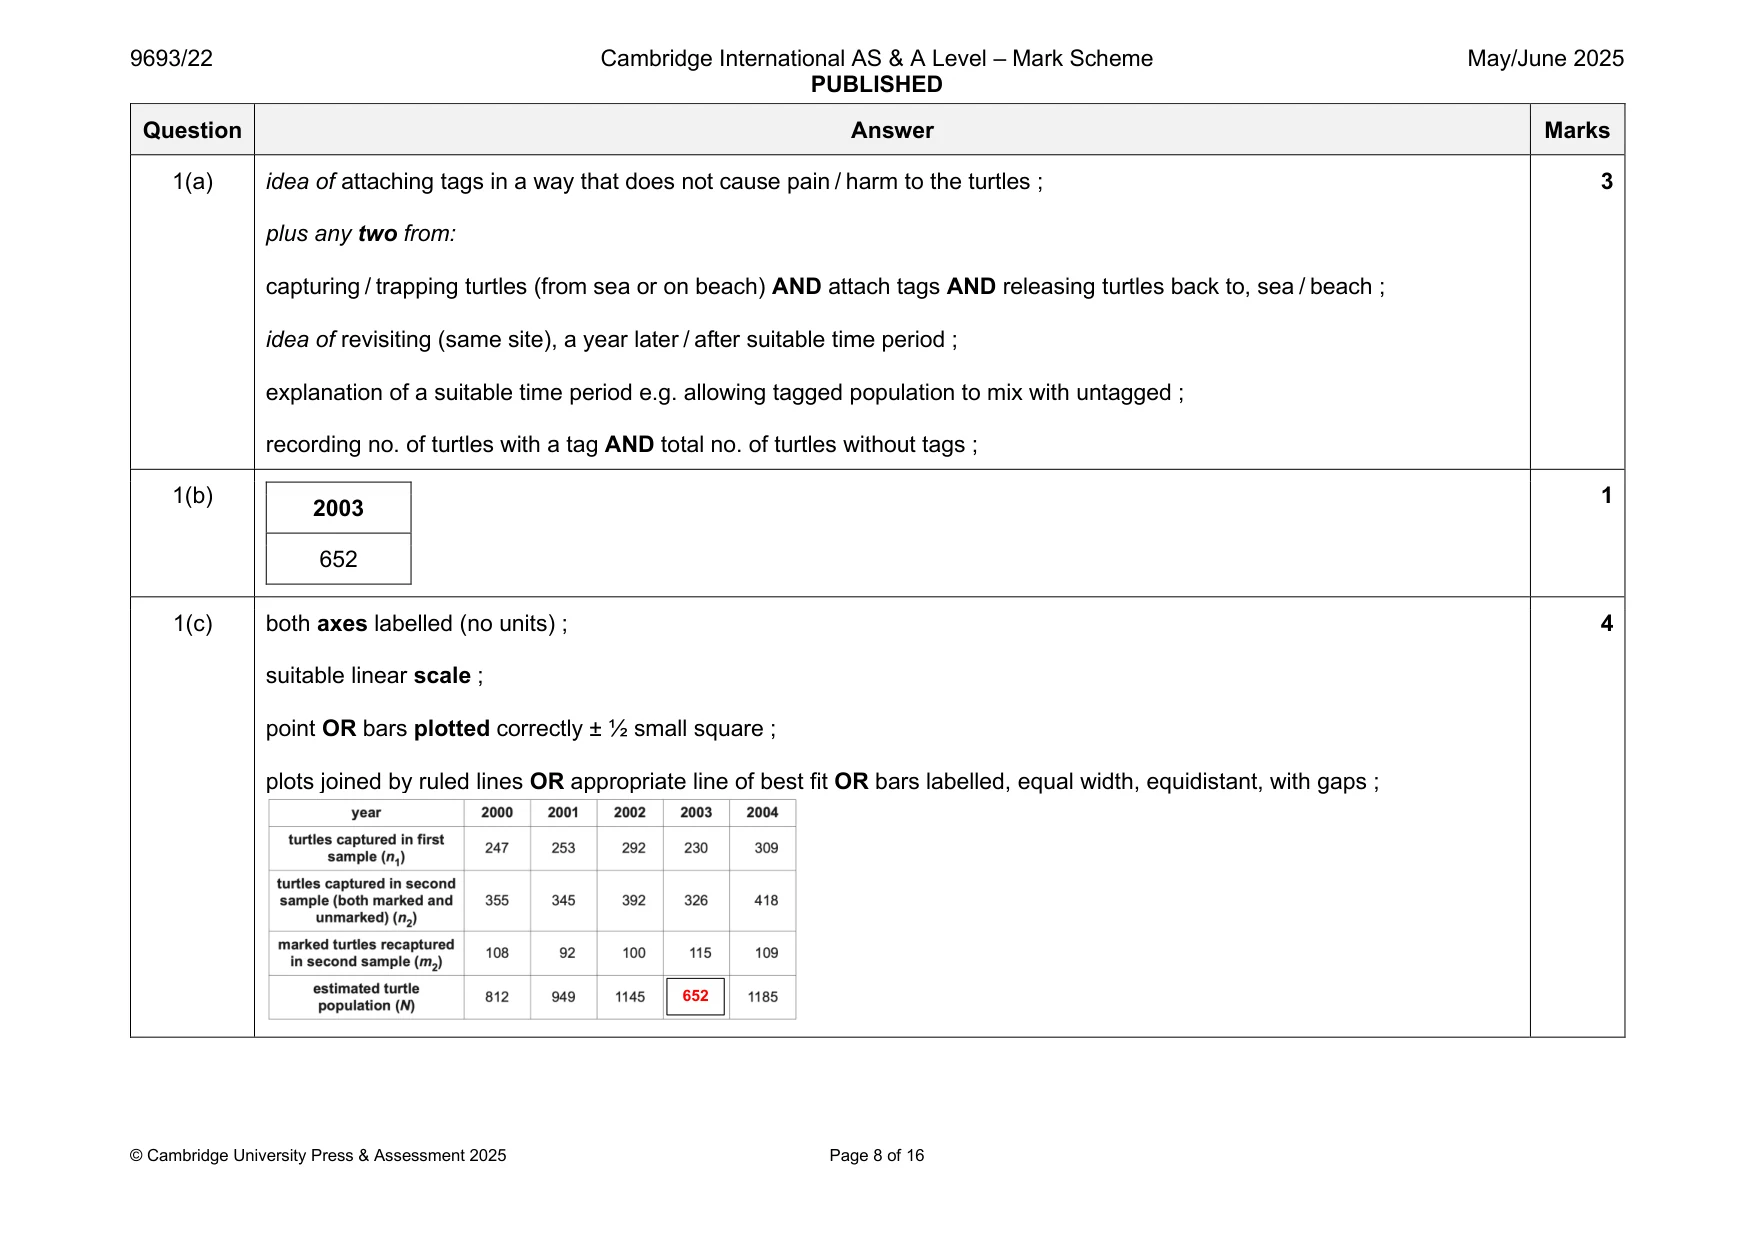
1 Scientists in Australia monitored the population of the Green Turtle for five years. They used the mark-release-recapture method to estimate the population of the turtles in the southern Great Barrier Reef. (a) Describe an ethical method of mark-release-recapture that could be used by the scientists. ................................................................................................................................................... ................................................................................................................................................... ................................................................................................................................................... ................................................................................................................................................... ................................................................................................................................................... ............................................................................................................................................. [3] (b) This mark-release-recapture method was carried out each year from 2000 to 2004. The results are shown in Table 1.1. Table 1.1 year 2000 2001 2002 2003 2004 turtles captured in first 247 253 292 230 309 sample (n1) turtles captured in second sample (both marked and 355 345 392 326 418 unmarked) (n2) marked turtles recaptured 108 92 100 115 109 in second sample (m2) estimated turtle 812 949 1145 1185 population (N) ............. Use Table 1.1 and the Lincoln index to estimate the population of turtles in 2003. The equation for the Lincoln index is shown. n1 × n2 N = m2 Where: N = estimated turtle population n1 = number of individuals captured in first sample n2 = number of individuals captured in second sample (both marked and unmarked) m2 = number of marked individuals recaptured in second sample. Write your answer in Table 1.1. [1] (c) Plot a graph of the estimated turtle population (N) from 2000 to 2004. [4] (d) Use the data in Table 1.1 to describe the trend shown for the population of turtles. ................................................................................................................................................... ................................................................................................................................................... ................................................................................................................................................... ............................................................................................................................................. [2] (e) Turtles were not counted as being previously marked if it was not clear that the marks on their body were from the previous capture. Evaluate the population estimates shown in Table 1.1 based on this observation. ................................................................................................................................................... ................................................................................................................................................... ................................................................................................................................................... ............................................................................................................................................. [2] [Total: 12]
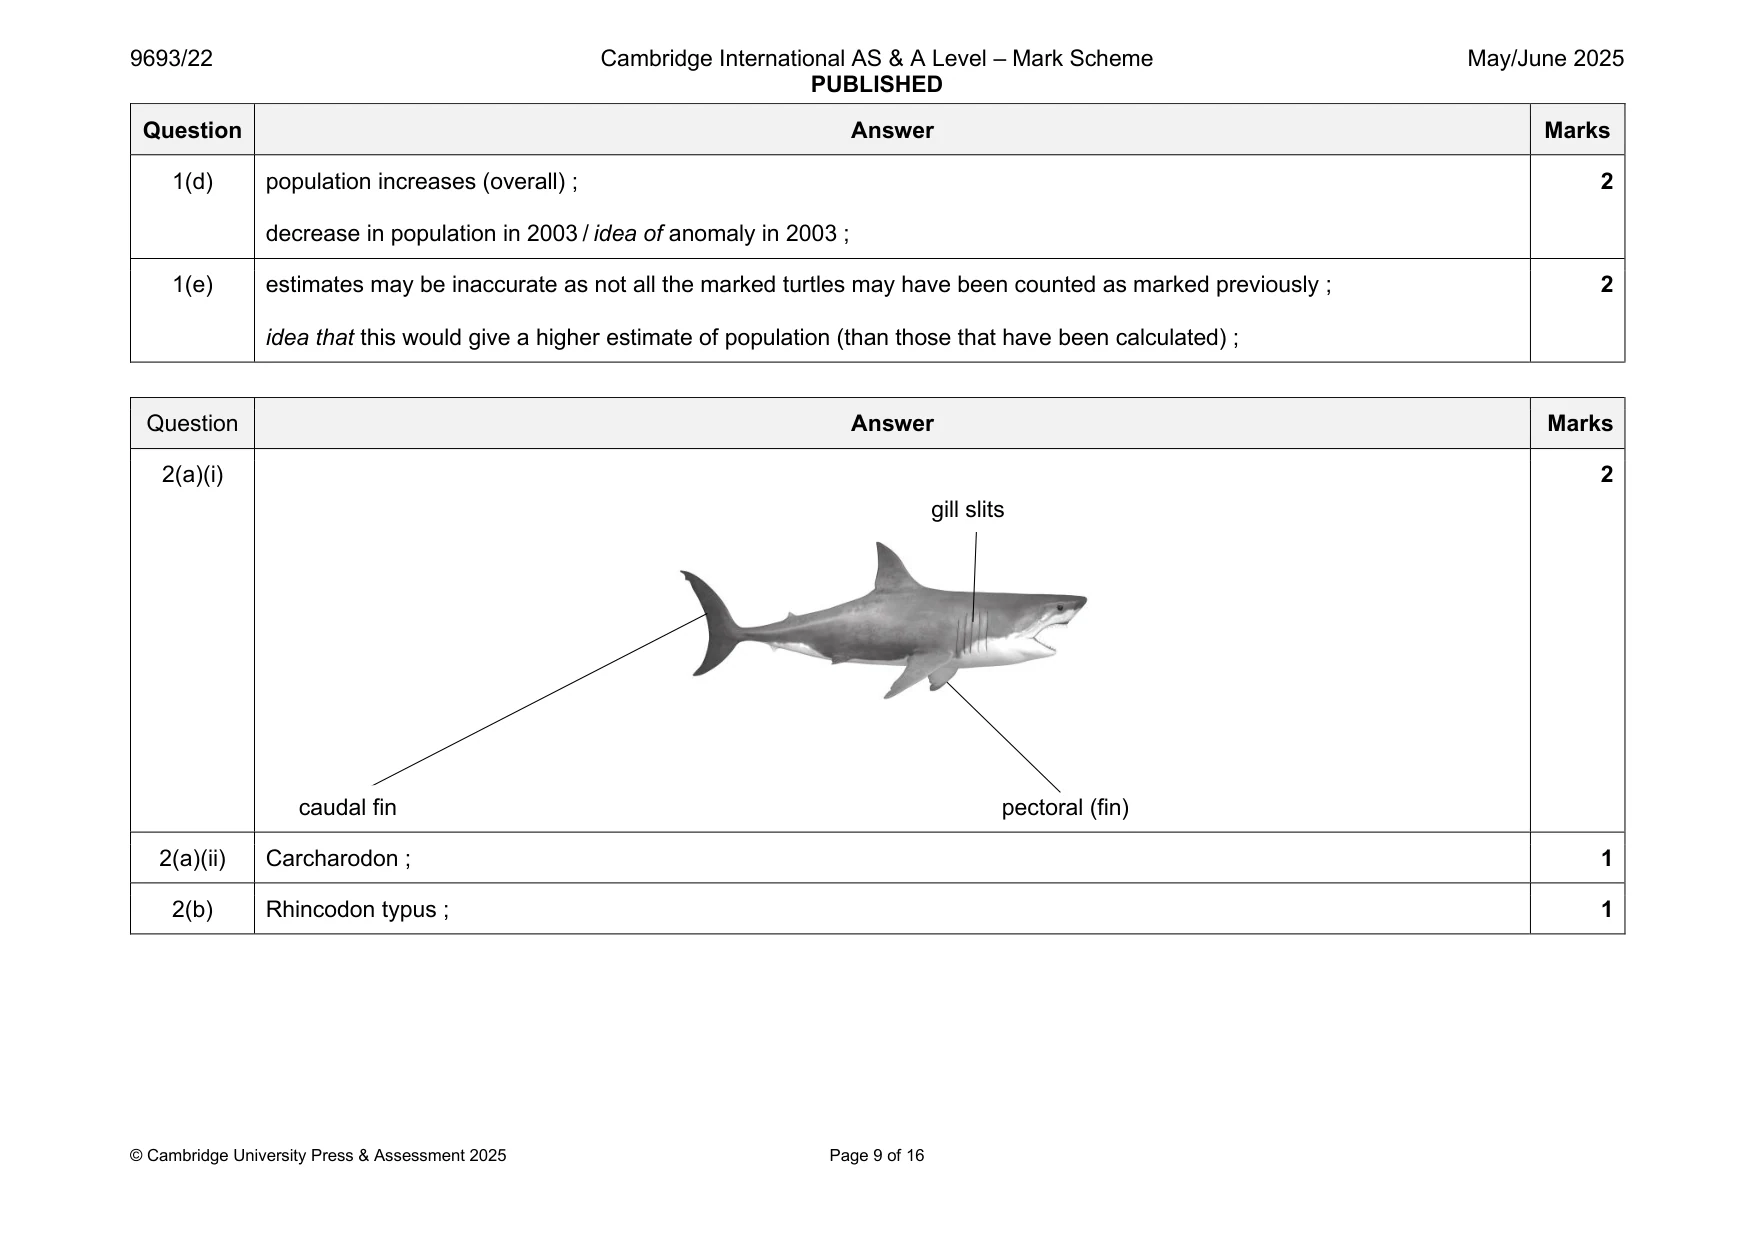
Mark scheme: Question Answer Marks 1(a) idea of attaching tags in a way that does not cause pain / harm to the turtles ; 3 plus any two from: capturing / trapping turtles (from sea or on beach) AND attach tags AND releasing turtles back to, sea / beach ; idea of revisiting (same site), a year later / after suitable time period ; explanation of a suitable time period e.g. allowing tagged population to mix with untagged ; recording no. of turtles with a tag AND total no. of turtles without tags ; 1(b) 1 2003 652 1(c) both axes labelled (no units) ; 4 suitable linear scale ; point OR bars plotted correctly ± ½ small square ; plots joined by ruled lines OR appropriate line of best fit OR bars labelled, equal width, equidistant, with gaps ; 652 1(d) population increases (overall) ; 2 decrease in population in 2003 / idea of anomaly in 2003 ; 1(e) estimates may be inaccurate as not all the marked turtles may have been counted as marked previously ; 2 idea that this would give a higher estimate of population (than those that have been calculated) ;
Q2 · A great white shark, Carcharodon carcharias
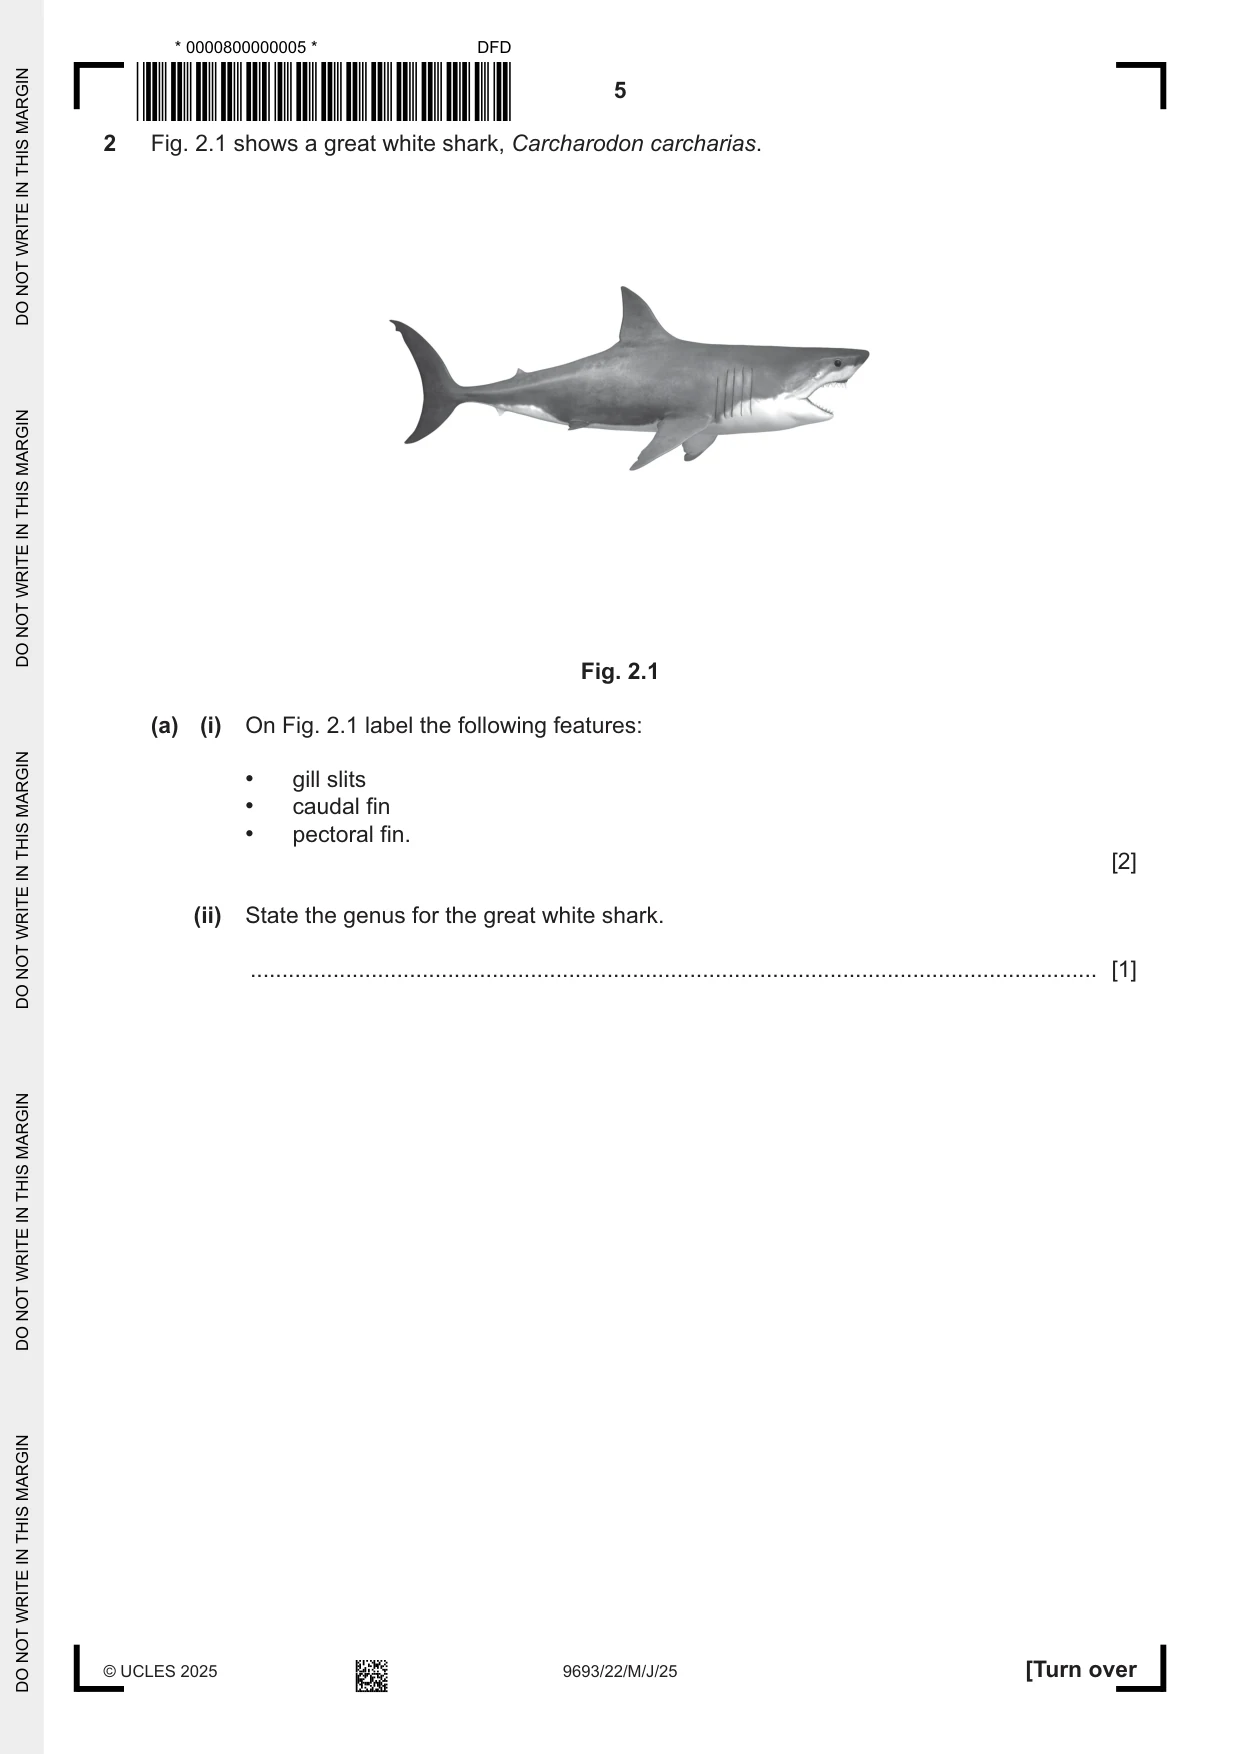
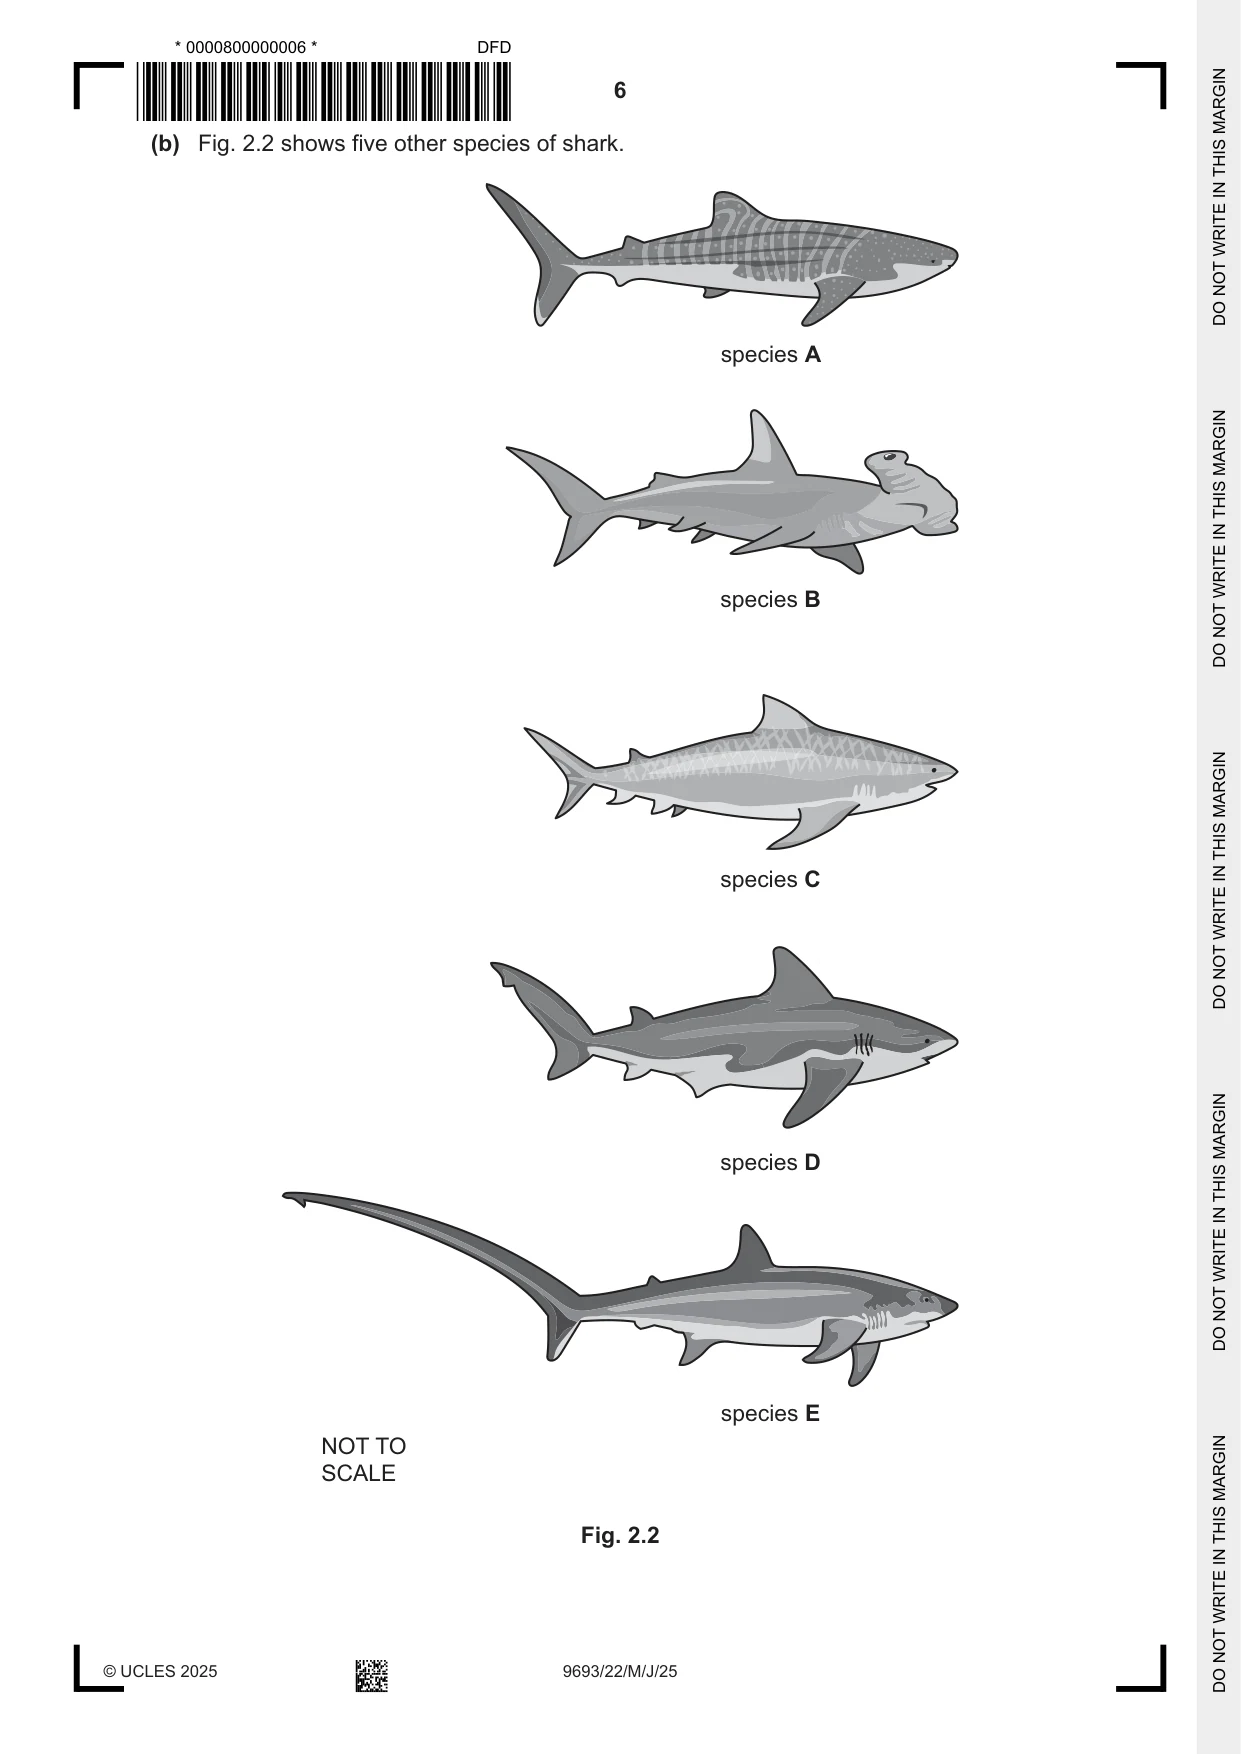
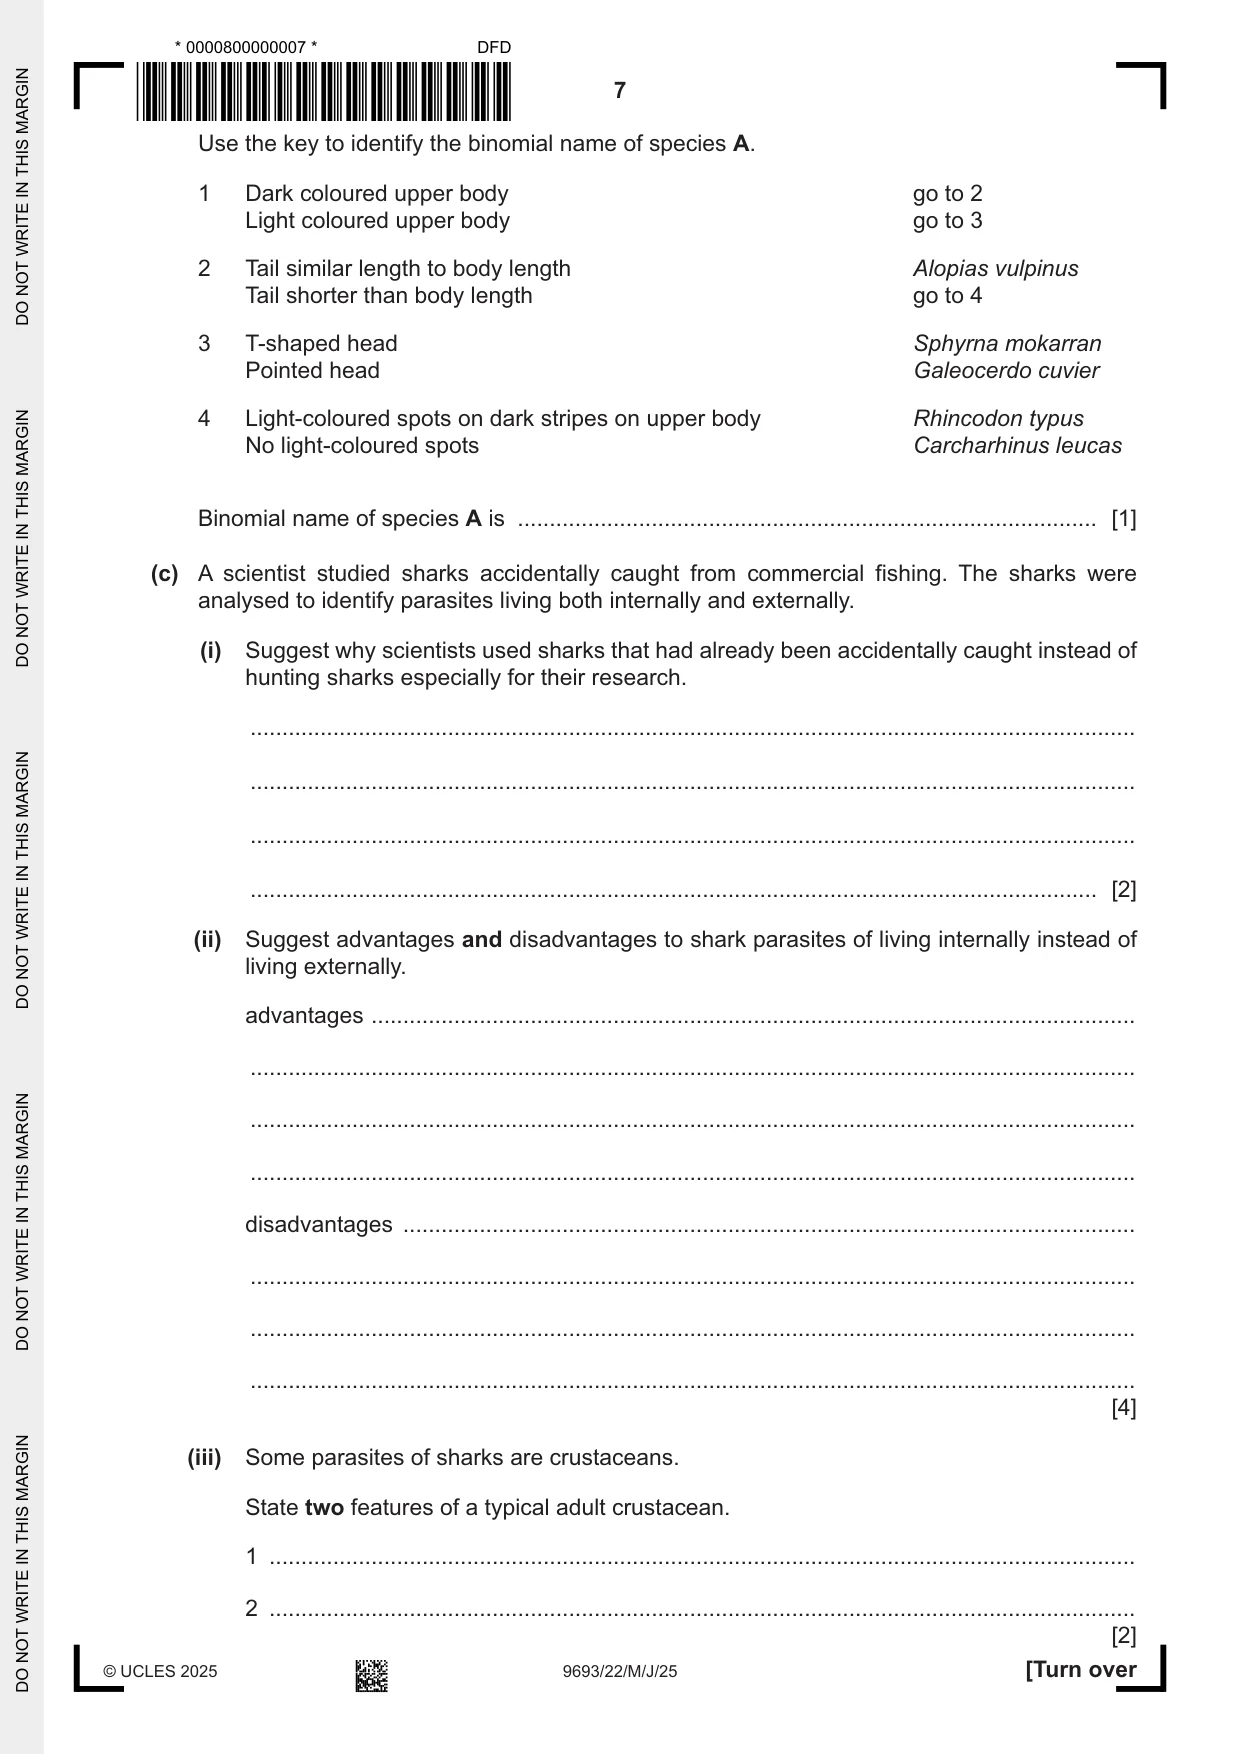
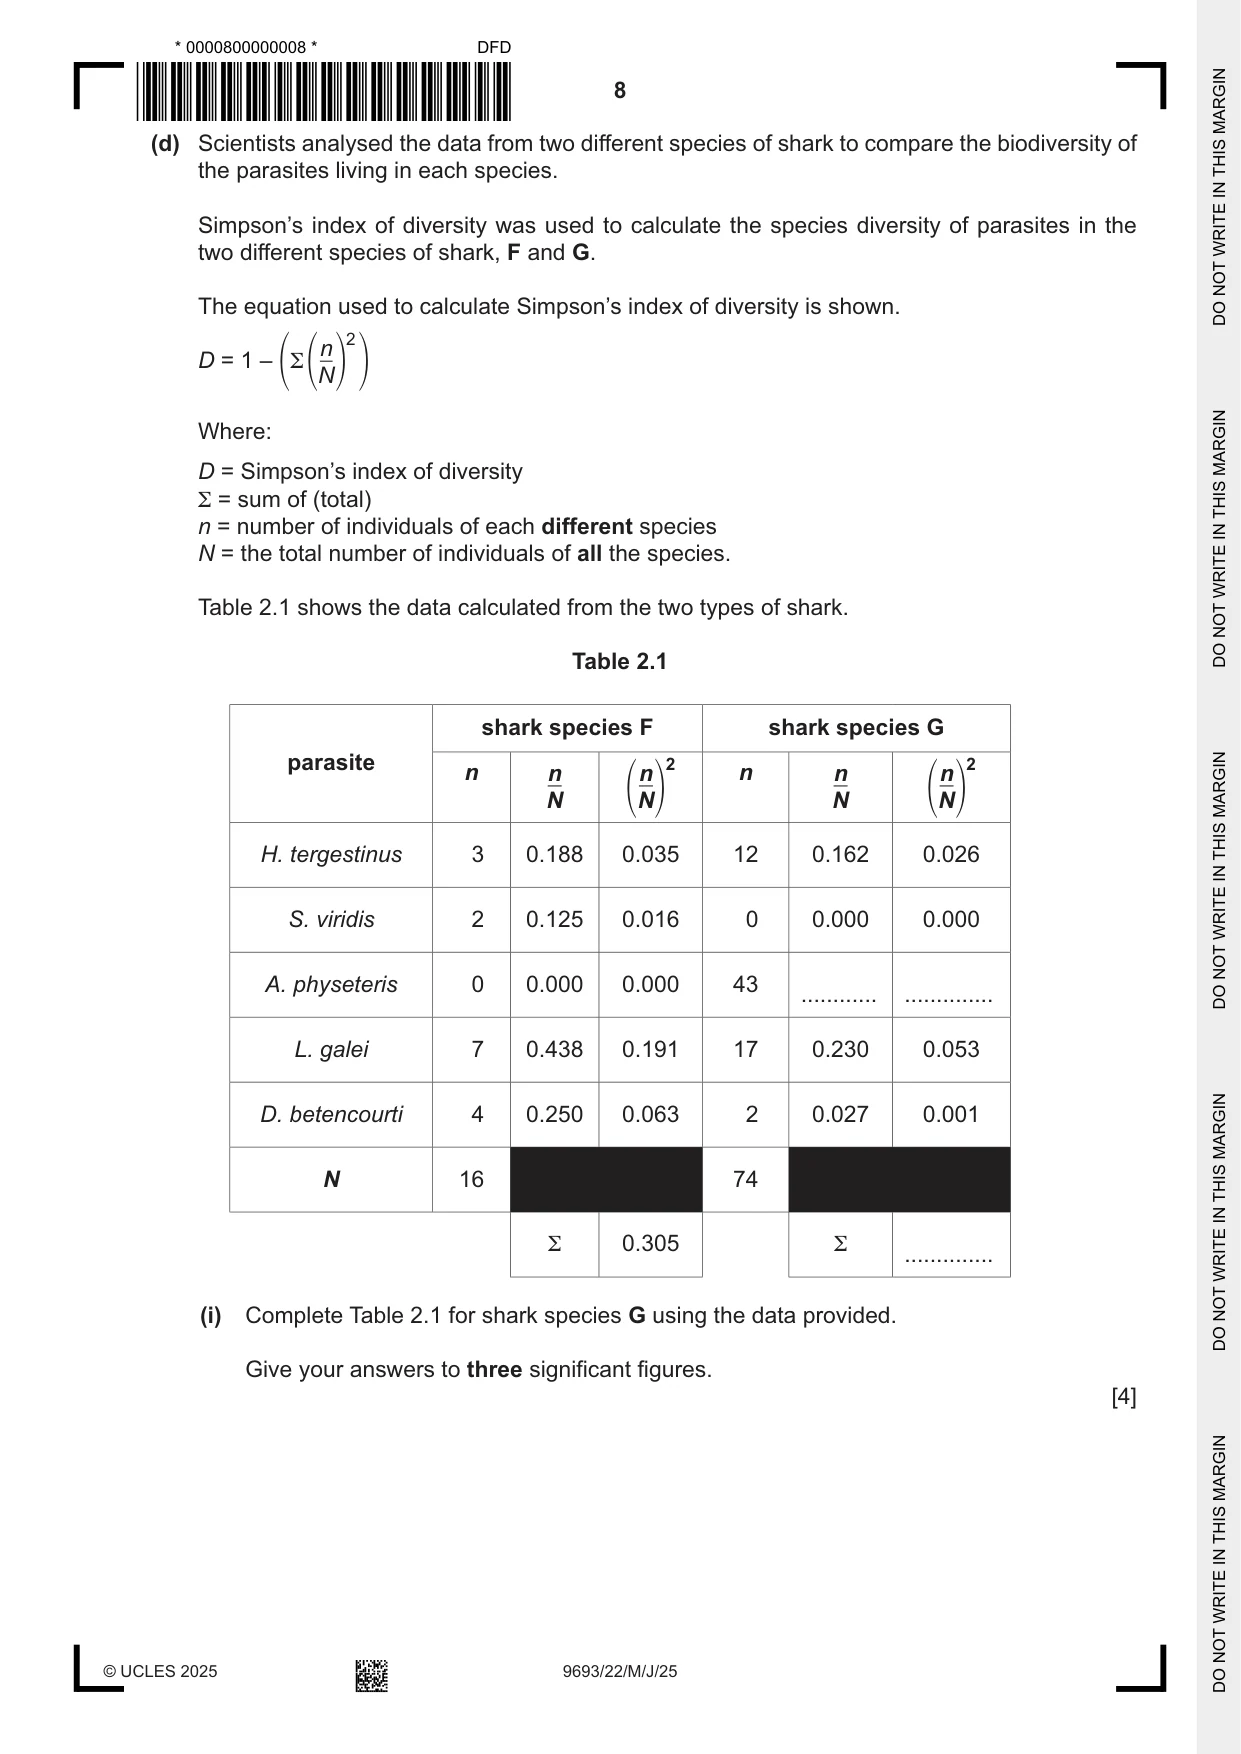
2 Fig. 2.1 shows a great white shark, Carcharodon carcharias. Fig. 2.1 (a) (i) On Fig. 2.1 label the following features: • gill slits • caudal fin • pectoral fin. [2] (ii) State the genus for the great white shark. ..................................................................................................................................... [1] (b) Fig. 2.2 shows five other species of shark. species A species B species C species D species E NOT TO SCALE Fig. 2.2 Use the key to identify the binomial name of species A. 1 Dark coloured upper body go to 2 Light coloured upper body go to 3 2 Tail similar length to body length Alopias vulpinus Tail shorter than body length go to 4 3 T-shaped head Sphyrna mokarran Pointed head Galeocerdo cuvier 4 Light-coloured spots on dark stripes on upper body Rhincodon typus No light-coloured spots Carcharhinus leucas Binomial name of species A is ........................................................................................... [1] (c) A scientist studied sharks accidentally caught from commercial fishing. The sharks were analysed to identify parasites living both internally and externally. (i) Suggest why scientists used sharks that had already been accidentally caught instead of hunting sharks especially for their research. ........................................................................................................................................... ........................................................................................................................................... ........................................................................................................................................... ..................................................................................................................................... [2] (ii) Suggest advantages and disadvantages to shark parasites of living internally instead of living externally. advantages ........................................................................................................................ ........................................................................................................................................... ........................................................................................................................................... ........................................................................................................................................... disadvantages ................................................................................................................... ........................................................................................................................................... ........................................................................................................................................... ........................................................................................................................................... [4] (iii) Some parasites of sharks are crustaceans. State two features of a typical adult crustacean. 1 ........................................................................................................................................ 2 ........................................................................................................................................ [2] (d) Scientists analysed the data from two different species of shark to compare the biodiversity of the parasites living in each species. Simpson’s index of diversity was used to calculate the species diversity of parasites in the two different species of shark, F and G. The equation used to calculate Simpson’s index of diversity is shown. n 2 D = 1 – 1Σ 1 N2 2 Where: D = Simpson’s index of diversity Σ = sum of (total) n = number of individuals of each different species N = the total number of individuals of all the species. Table 2.1 shows the data calculated from the two types of shark. Table 2.1 shark species F shark species G parasite 2 2 n n n n n n N 1 N2 N 1 N2 H. tergestinus 3 0.188 0.035 12 0.162 0.026 S. viridis 2 0.125 0.016 0 0.000 0.000 A. physeteris 0 0.000 0.000 43 ............ .............. L. galei 7 0.438 0.191 17 0.230 0.053 D. betencourti 4 0.250 0.063 2 0.027 0.001 N 16 74 Σ 0.305 Σ .............. (i) Complete Table 2.1 for shark species G using the data provided. Give your answers to three significant figures. [4] (ii) Calculate Simpson’s index of diversity for the parasites in shark species F and G. Space for working. shark species F: ............................................................... shark species G: ............................................................... [1] (iii) Use the Simpson’s index of diversity values you have calculated in 2(d)(ii) to compare the relative biodiversity of parasites in the two species of shark. ........................................................................................................................................... ..................................................................................................................................... [1] [Total: 18]
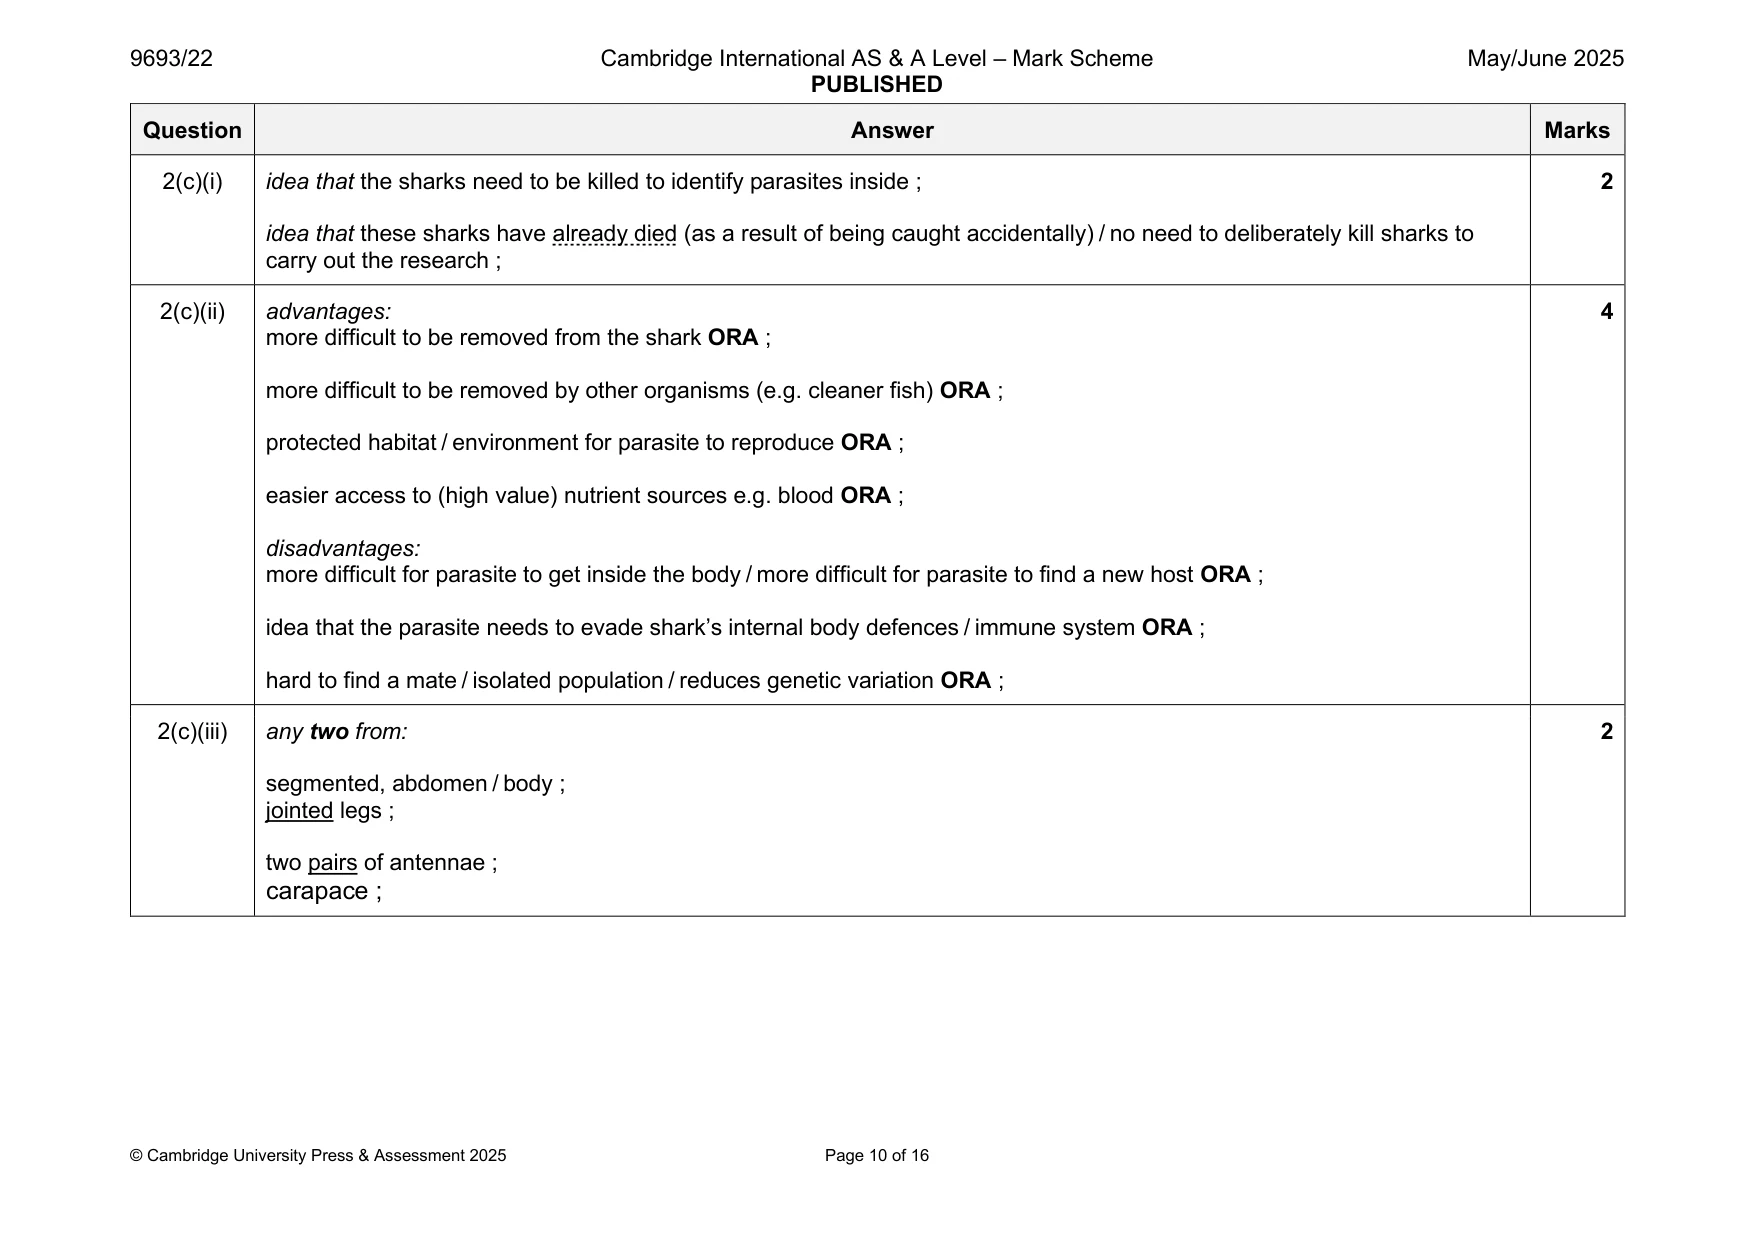
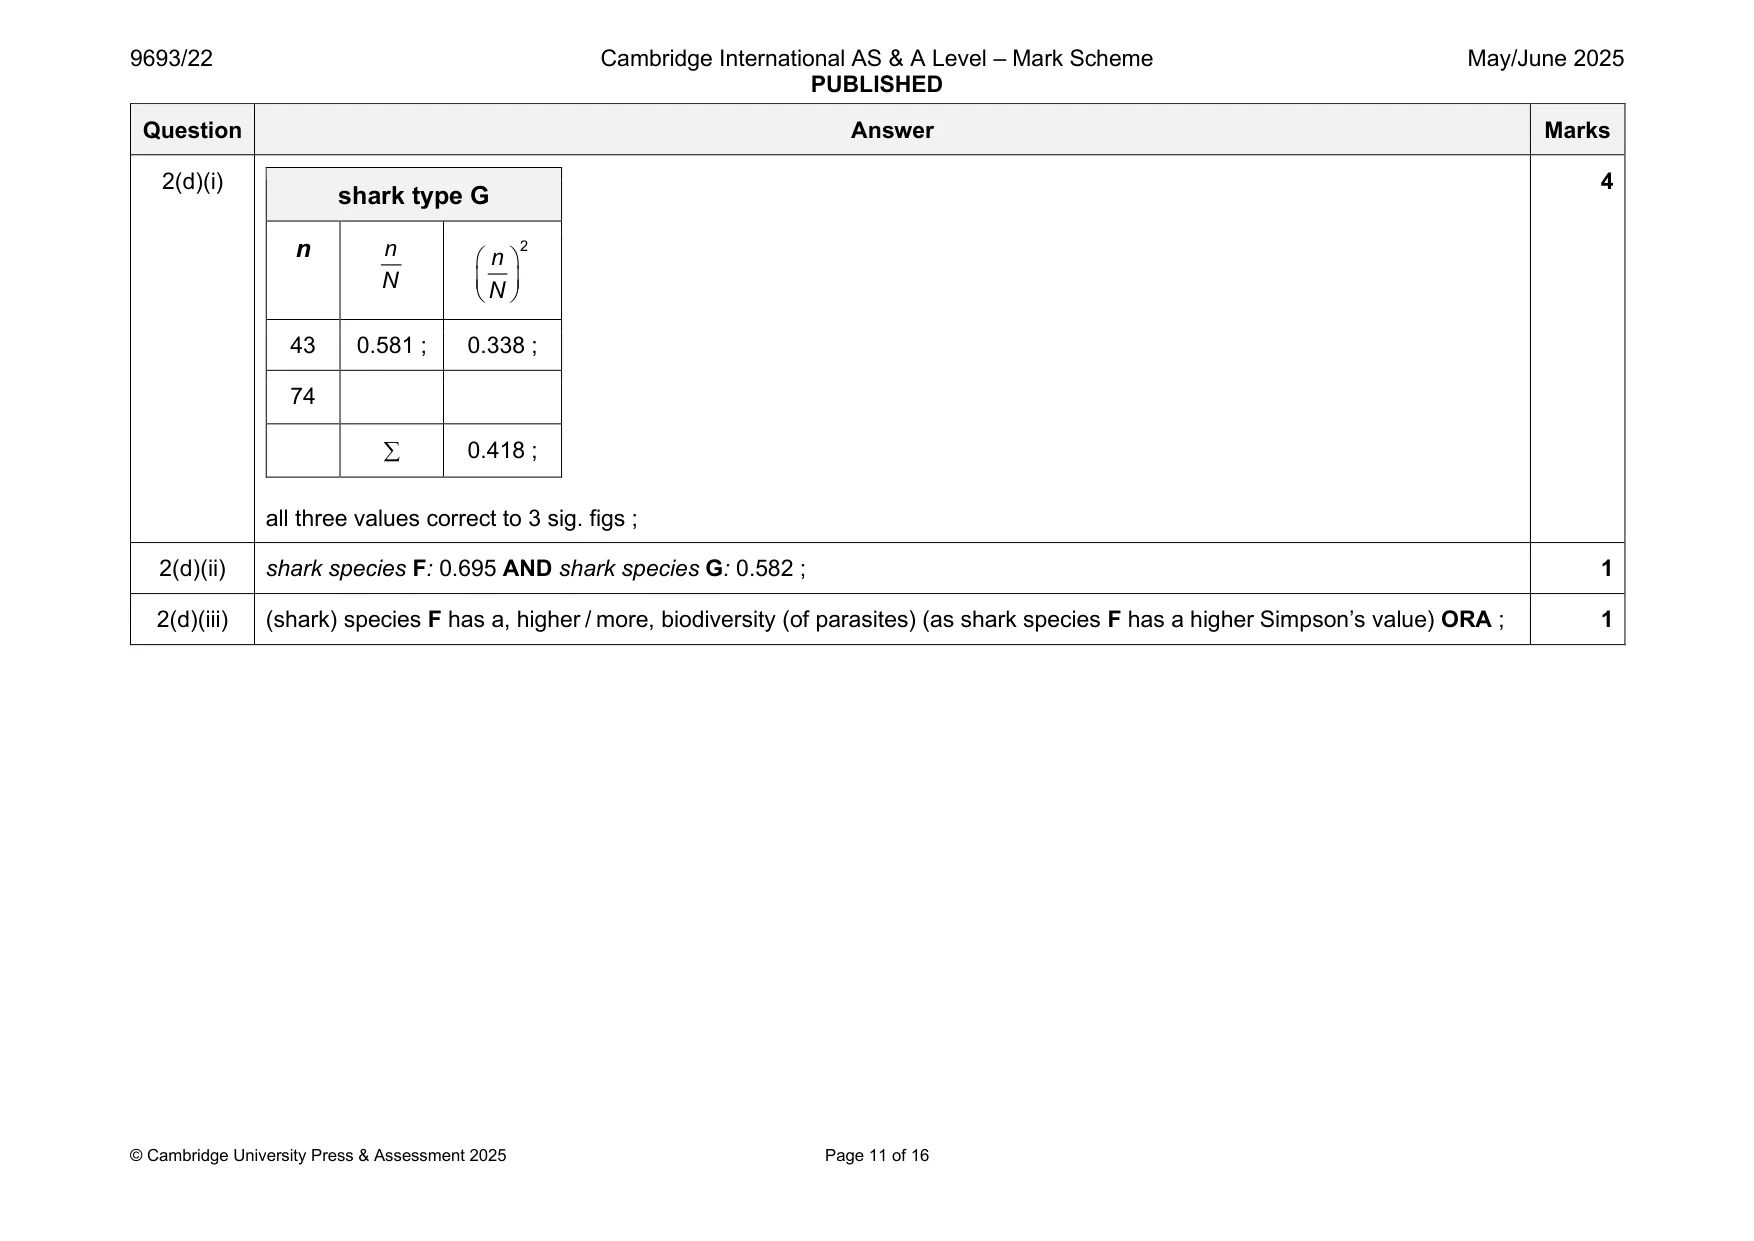
Mark scheme: 2(a)(i) 2 gill slits caudal fin pectoral (fin) 2(a)(ii) Carcharodon ; 1 2(b) Rhincodon typus ; 1 2(c)(i) idea that the sharks need to be killed to identify parasites inside ; 2 idea that these sharks have already died (as a result of being caught accidentally) / no need to deliberately kill sharks to carry out the research ; 2(c)(ii) advantages: 4 more difficult to be removed from the shark ORA ; more difficult to be removed by other organisms (e.g. cleaner fish) ORA ; protected habitat / environment for parasite to reproduce ORA ; easier access to (high value) nutrient sources e.g. blood ORA ; disadvantages: more difficult for parasite to get inside the body / more difficult for parasite to find a new host ORA ; idea that the parasite needs to evade shark’s internal body defences / immune system ORA ; hard to find a mate / isolated population / reduces genetic variation ORA ; 2(c)(iii) any two from: 2 segmented, abdomen / body ; jointed legs ; two pairs of antennae ; carapace ; 2(d)(i) 4 shark type G n n 2 n N N 43 0.581 ; 0.338 ; 74 0.418 ; all three values correct to 3 sig. figs ; 2(d)(ii) shark species F: 0.695 AND shark species G: 0.582 ; 1 2(d)(iii) (shark) species F has a, higher / more, biodiversity (of parasites) (as shark species F has a higher Simpson’s value) ORA ; 1
Q3 · State three conditions that affect the density of sea water
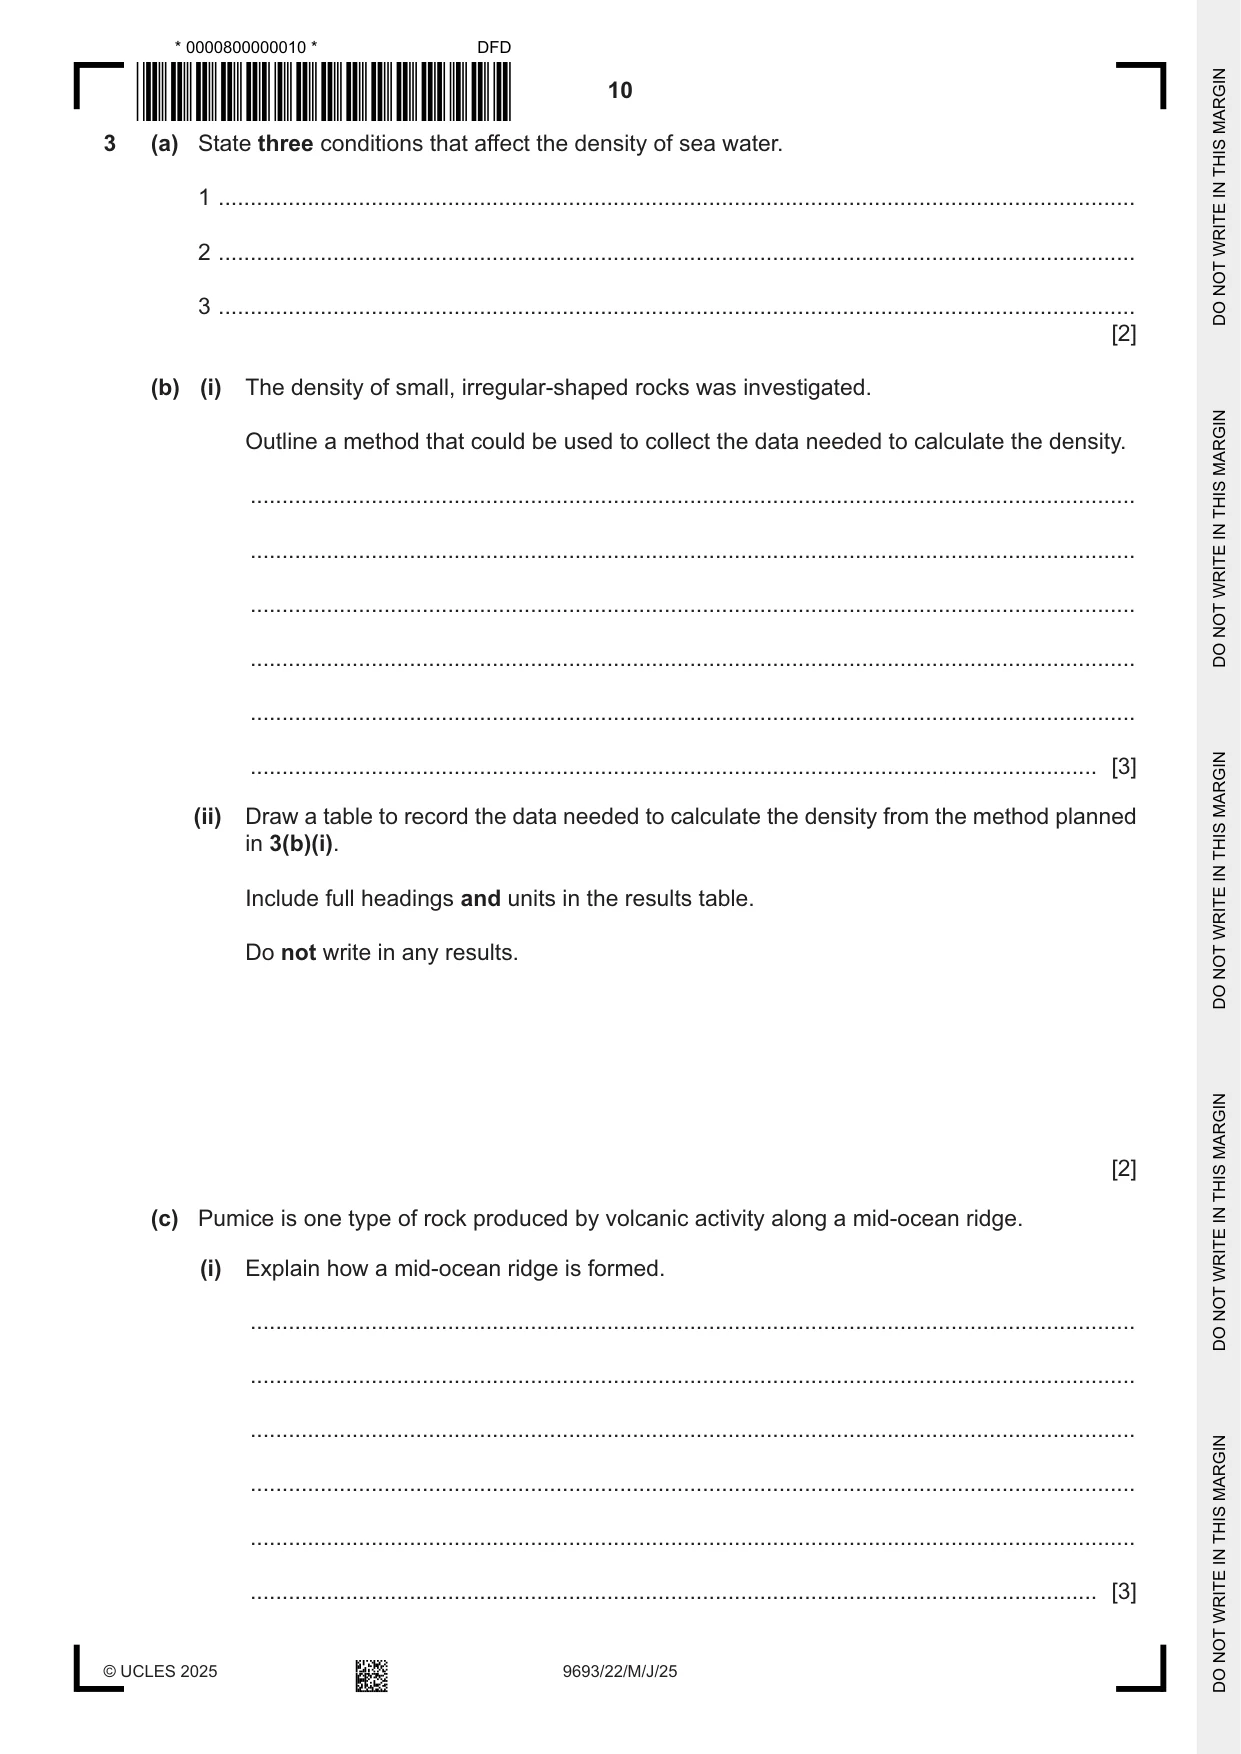
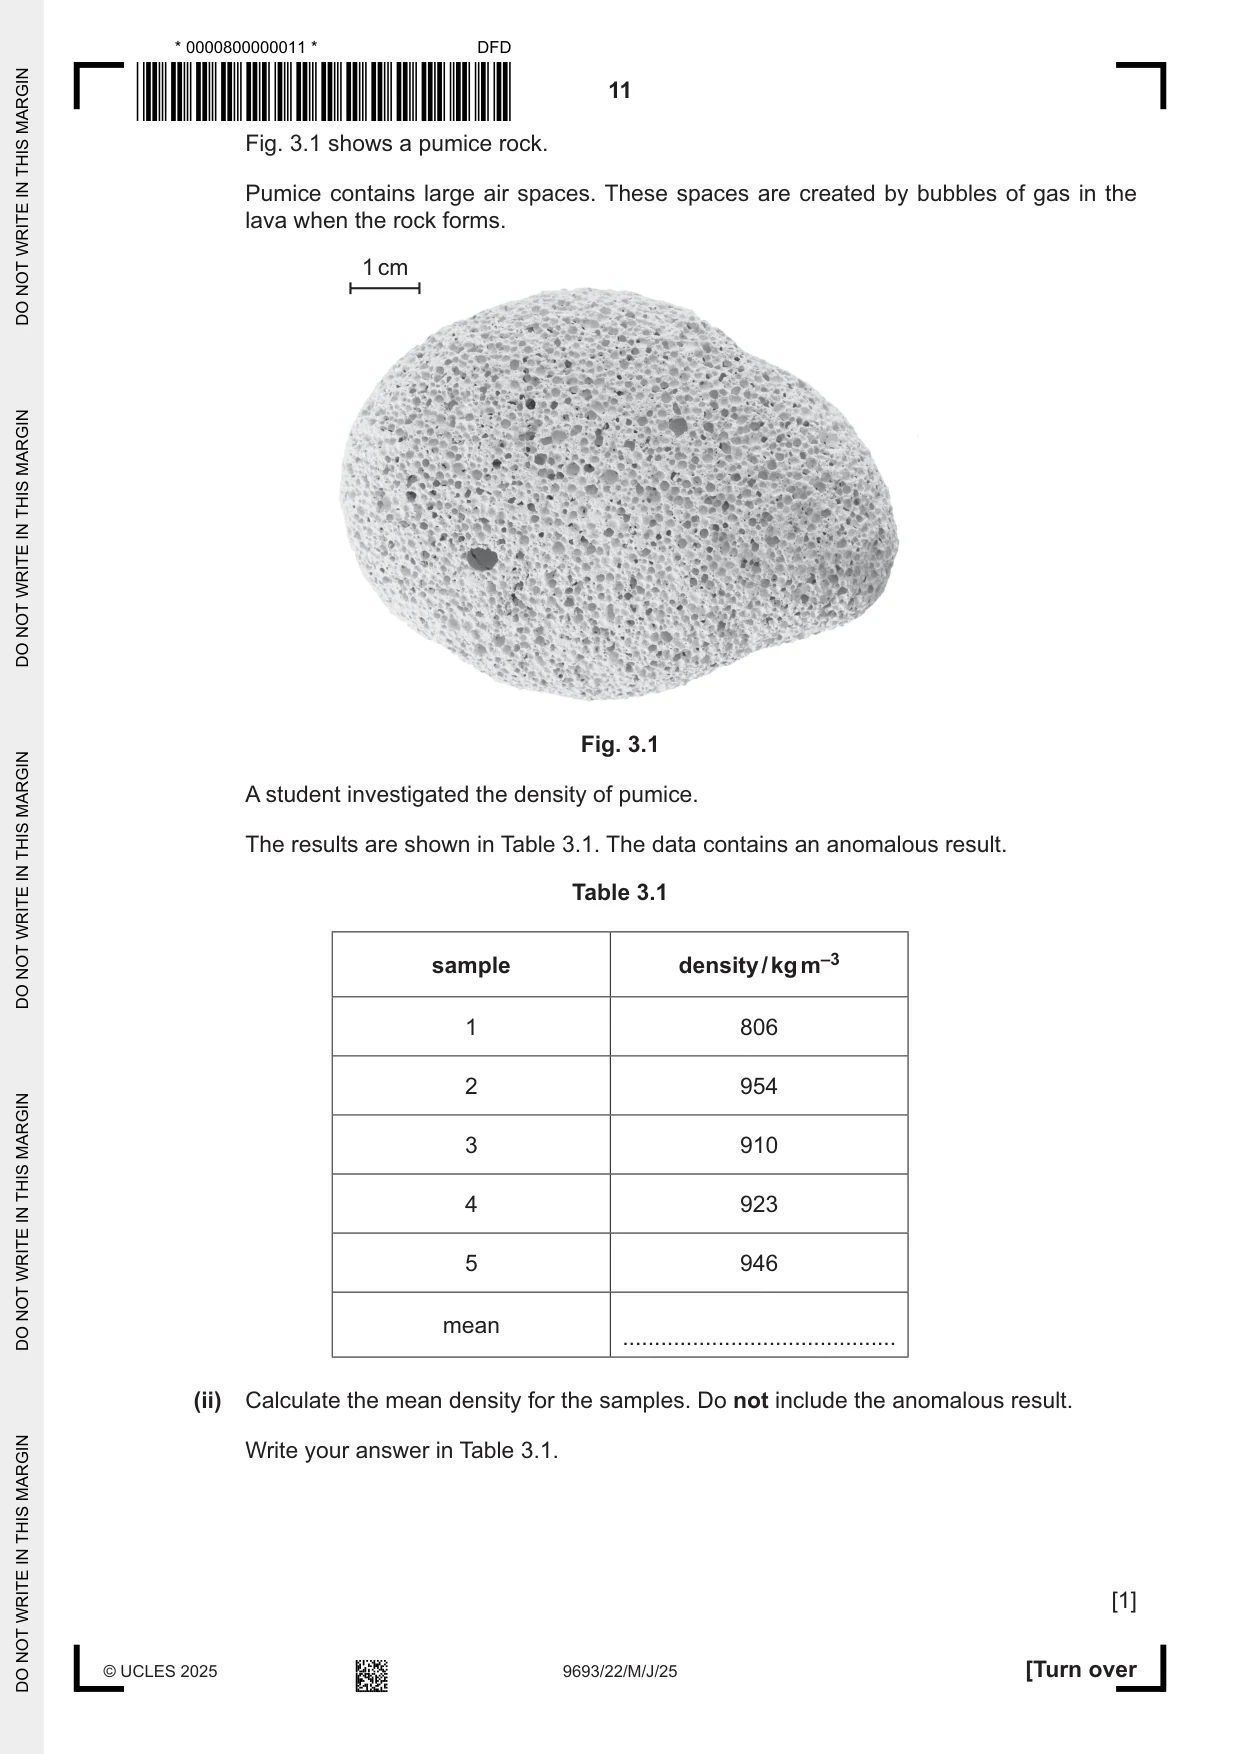
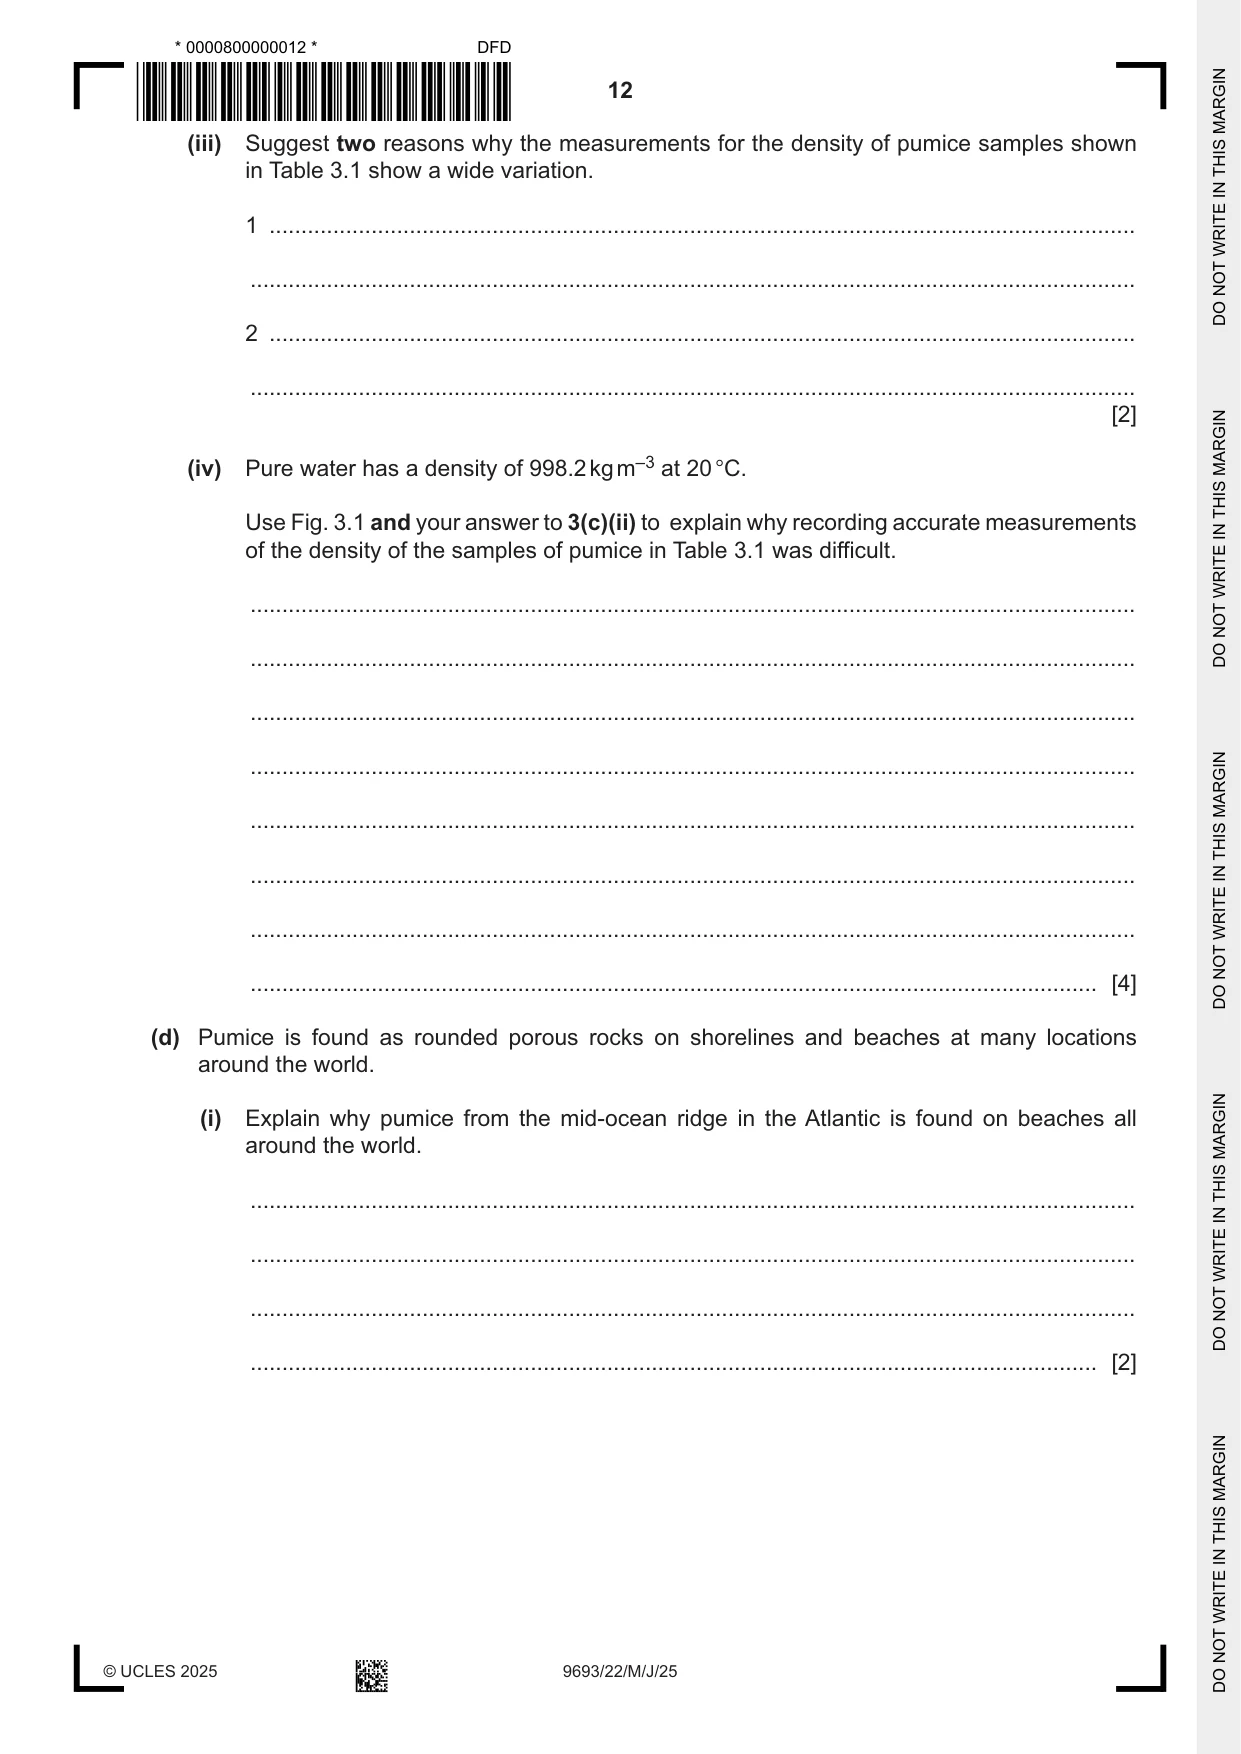
3 (a) State three conditions that affect the density of sea water. 1 ................................................................................................................................................ 2 ................................................................................................................................................ 3 ................................................................................................................................................ [2] (b) (i) The density of small, irregular-shaped rocks was investigated. Outline a method that could be used to collect the data needed to calculate the density. ........................................................................................................................................... ........................................................................................................................................... ........................................................................................................................................... ........................................................................................................................................... ........................................................................................................................................... ..................................................................................................................................... [3] (ii) Draw a table to record the data needed to calculate the density from the method planned in 3(b)(i). Include full headings and units in the results table. Do not write in any results. [2] (c) Pumice is one type of rock produced by volcanic activity along a mid-ocean ridge. (i) Explain how a mid-ocean ridge is formed. ........................................................................................................................................... ........................................................................................................................................... ........................................................................................................................................... ........................................................................................................................................... ........................................................................................................................................... ..................................................................................................................................... [3] Fig. 3.1 shows a pumice rock. Pumice contains large air spaces. These spaces are created by bubbles of gas in the lava when the rock forms. 1 cm Fig. 3.1 A student investigated the density of pumice. The results are shown in Table 3.1. The data contains an anomalous result. Table 3.1 sample density / kg m–3 1 806 2 954 3 910 4 923 5 946 mean ........................................... (ii) Calculate the mean density for the samples. Do not include the anomalous result. Write your answer in Table 3.1. [1] (iii) Suggest two reasons why the measurements for the density of pumice samples shown in Table 3.1 show a wide variation. 1 ........................................................................................................................................ ........................................................................................................................................... 2 ........................................................................................................................................ ........................................................................................................................................... [2] (iv) Pure water has a density of 998.2 kg m–3 at 20 °C. Use Fig. 3.1 and your answer to 3(c)(ii) to explain why recording accurate measurements of the density of the samples of pumice in Table 3.1 was difficult. ........................................................................................................................................... ........................................................................................................................................... ........................................................................................................................................... ........................................................................................................................................... ........................................................................................................................................... ........................................................................................................................................... ........................................................................................................................................... ..................................................................................................................................... [4] (d) Pumice is found as rounded porous rocks on shorelines and beaches at many locations around the world. (i) Explain why pumice from the mid-ocean ridge in the Atlantic is found on beaches all around the world. ........................................................................................................................................... ........................................................................................................................................... ........................................................................................................................................... ..................................................................................................................................... [2] (ii) Suggest why pumice rocks are rounded in shape and found on beaches. ........................................................................................................................................... ........................................................................................................................................... ........................................................................................................................................... ........................................................................................................................................... ........................................................................................................................................... ..................................................................................................................................... [3] [Total: 22]
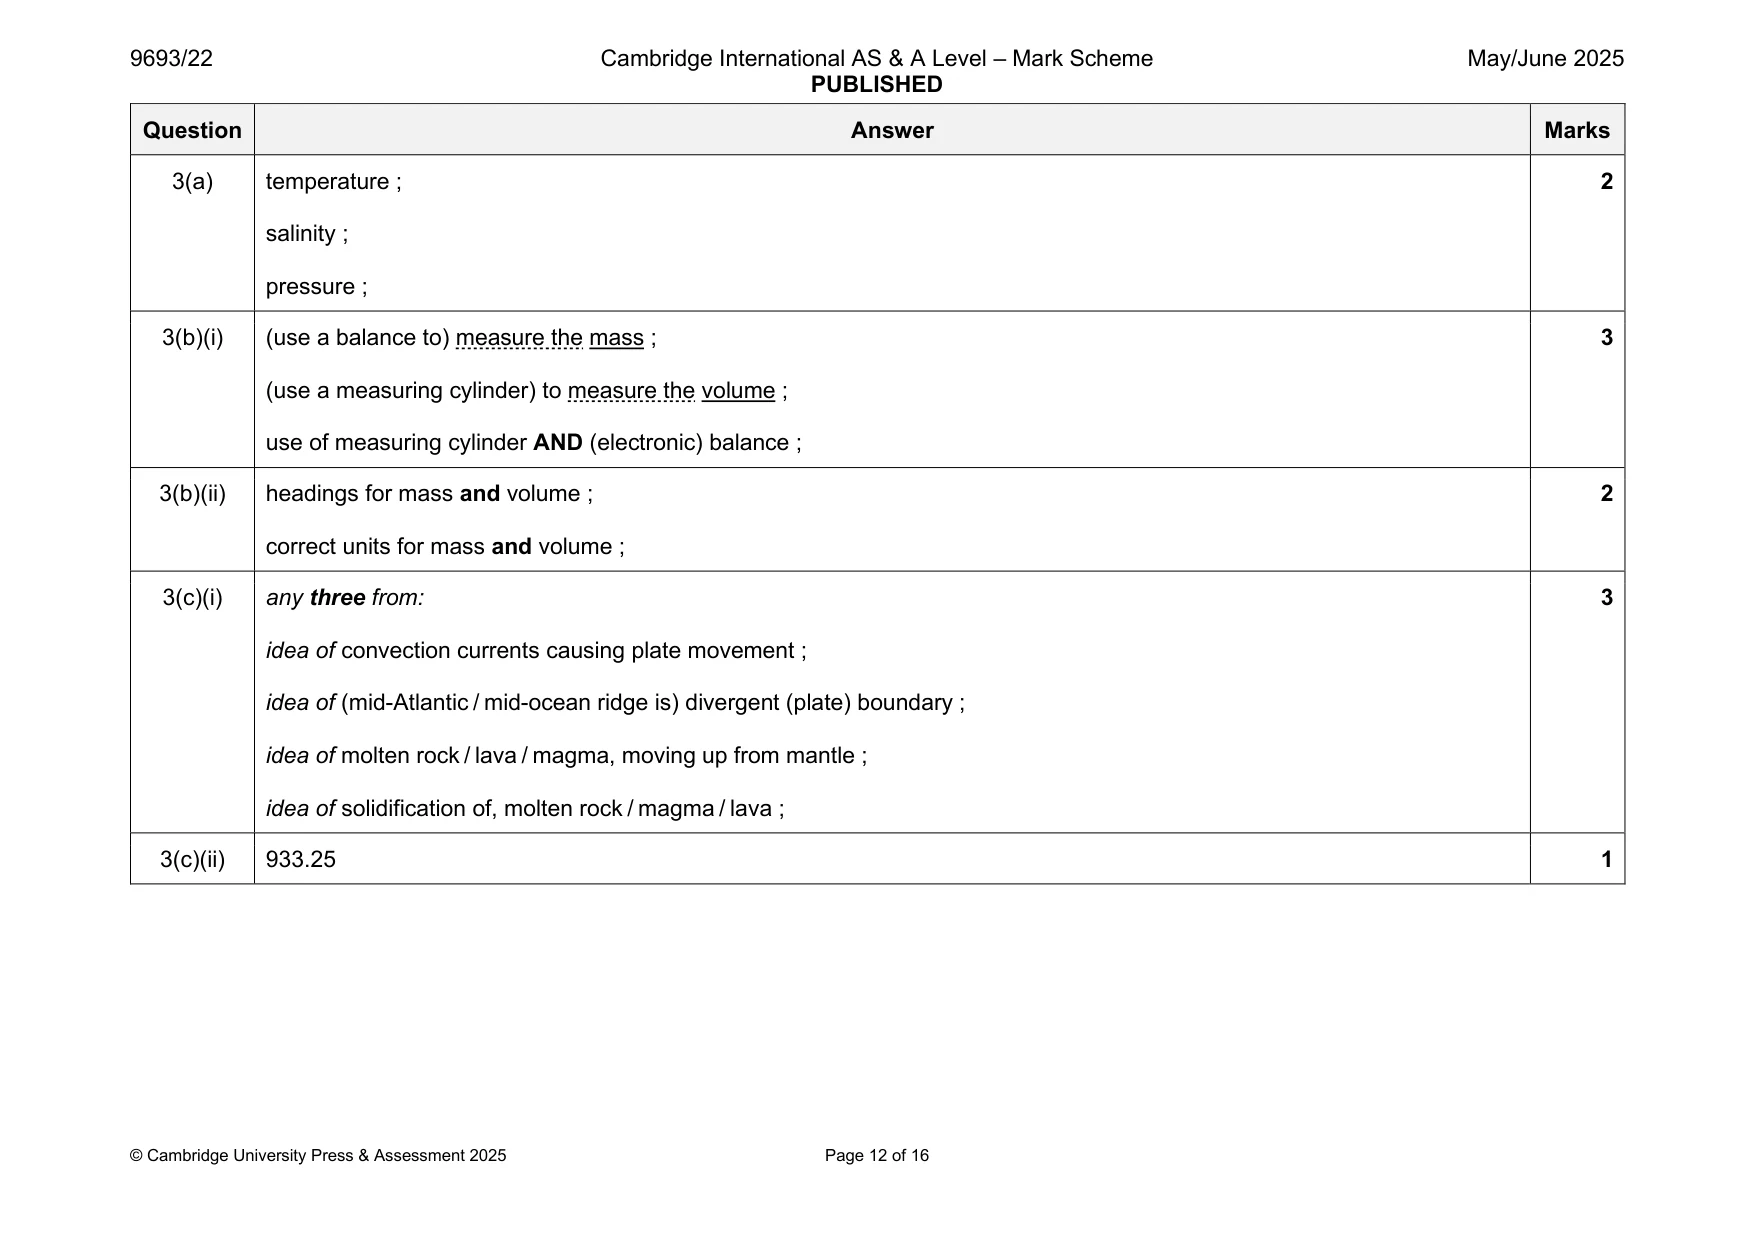
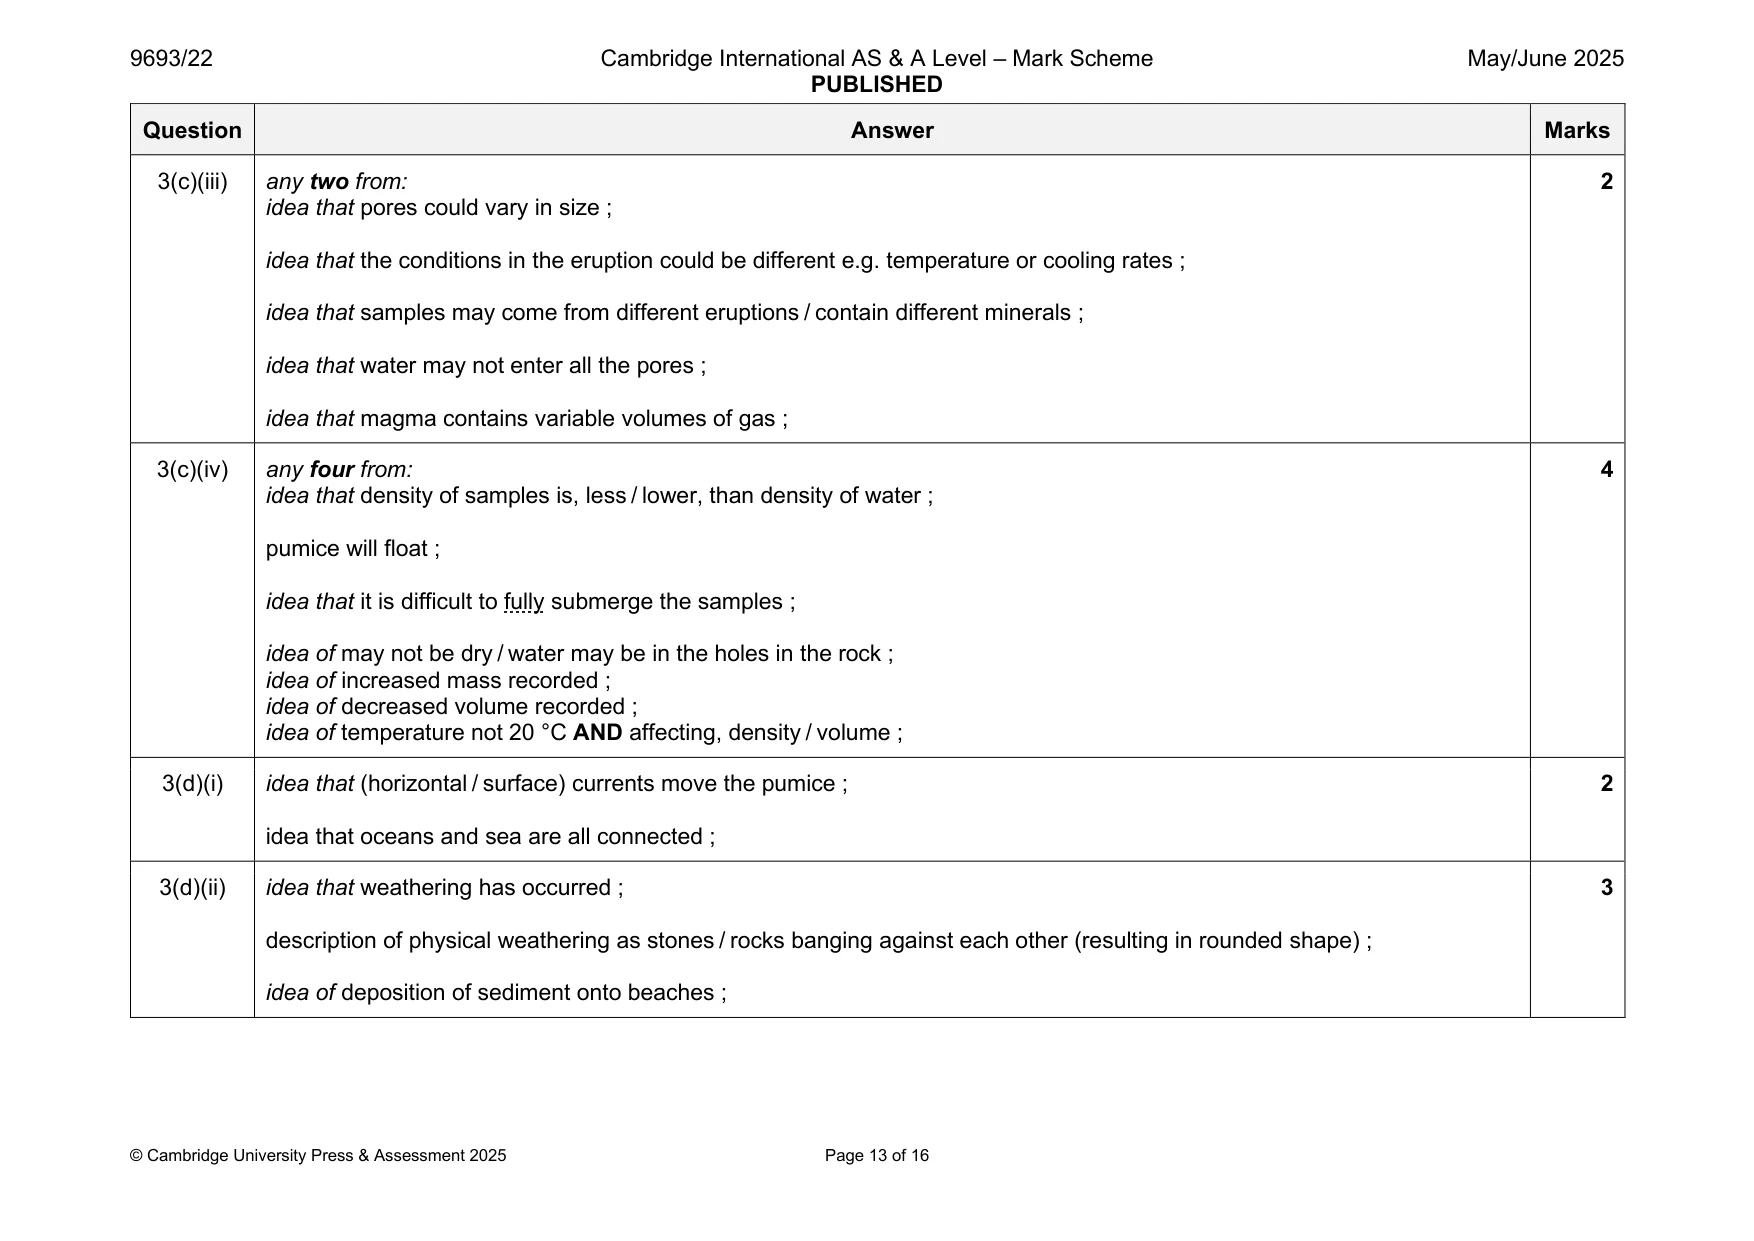
Mark scheme: 3(a) temperature ; 2 salinity ; pressure ; 3(b)(i) (use a balance to) measure the mass ; 3 (use a measuring cylinder) to measure the volume ; use of measuring cylinder AND (electronic) balance ; 3(b)(ii) headings for mass and volume ; 2 correct units for mass and volume ; 3(c)(i) any three from: 3 idea of convection currents causing plate movement ; idea of (mid-Atlantic / mid-ocean ridge is) divergent (plate) boundary ; idea of molten rock / lava / magma, moving up from mantle ; idea of solidification of, molten rock / magma / lava ; 3(c)(ii) 933.25 1 3(c)(iii) any two from: 2 idea that pores could vary in size ; idea that the conditions in the eruption could be different e.g. temperature or cooling rates ; idea that samples may come from different eruptions / contain different minerals ; idea that water may not enter all the pores ; idea that magma contains variable volumes of gas ; 3(c)(iv) any four from: 4 idea that density of samples is, less / lower, than density of water ; pumice will float ; idea that it is difficult to fully submerge the samples ; idea of may not be dry / water may be in the holes in the rock ; idea of increased mass recorded ; idea of decreased volume recorded ; idea of temperature not 20 °C AND affecting, density / volume ; 3(d)(i) idea that (horizontal / surface) currents move the pumice ; 2 idea that oceans and sea are all connected ; 3(d)(ii) idea that weathering has occurred ; 3 description of physical weathering as stones / rocks banging against each other (resulting in rounded shape) ; idea of deposition of sediment onto beaches ;
Question 4
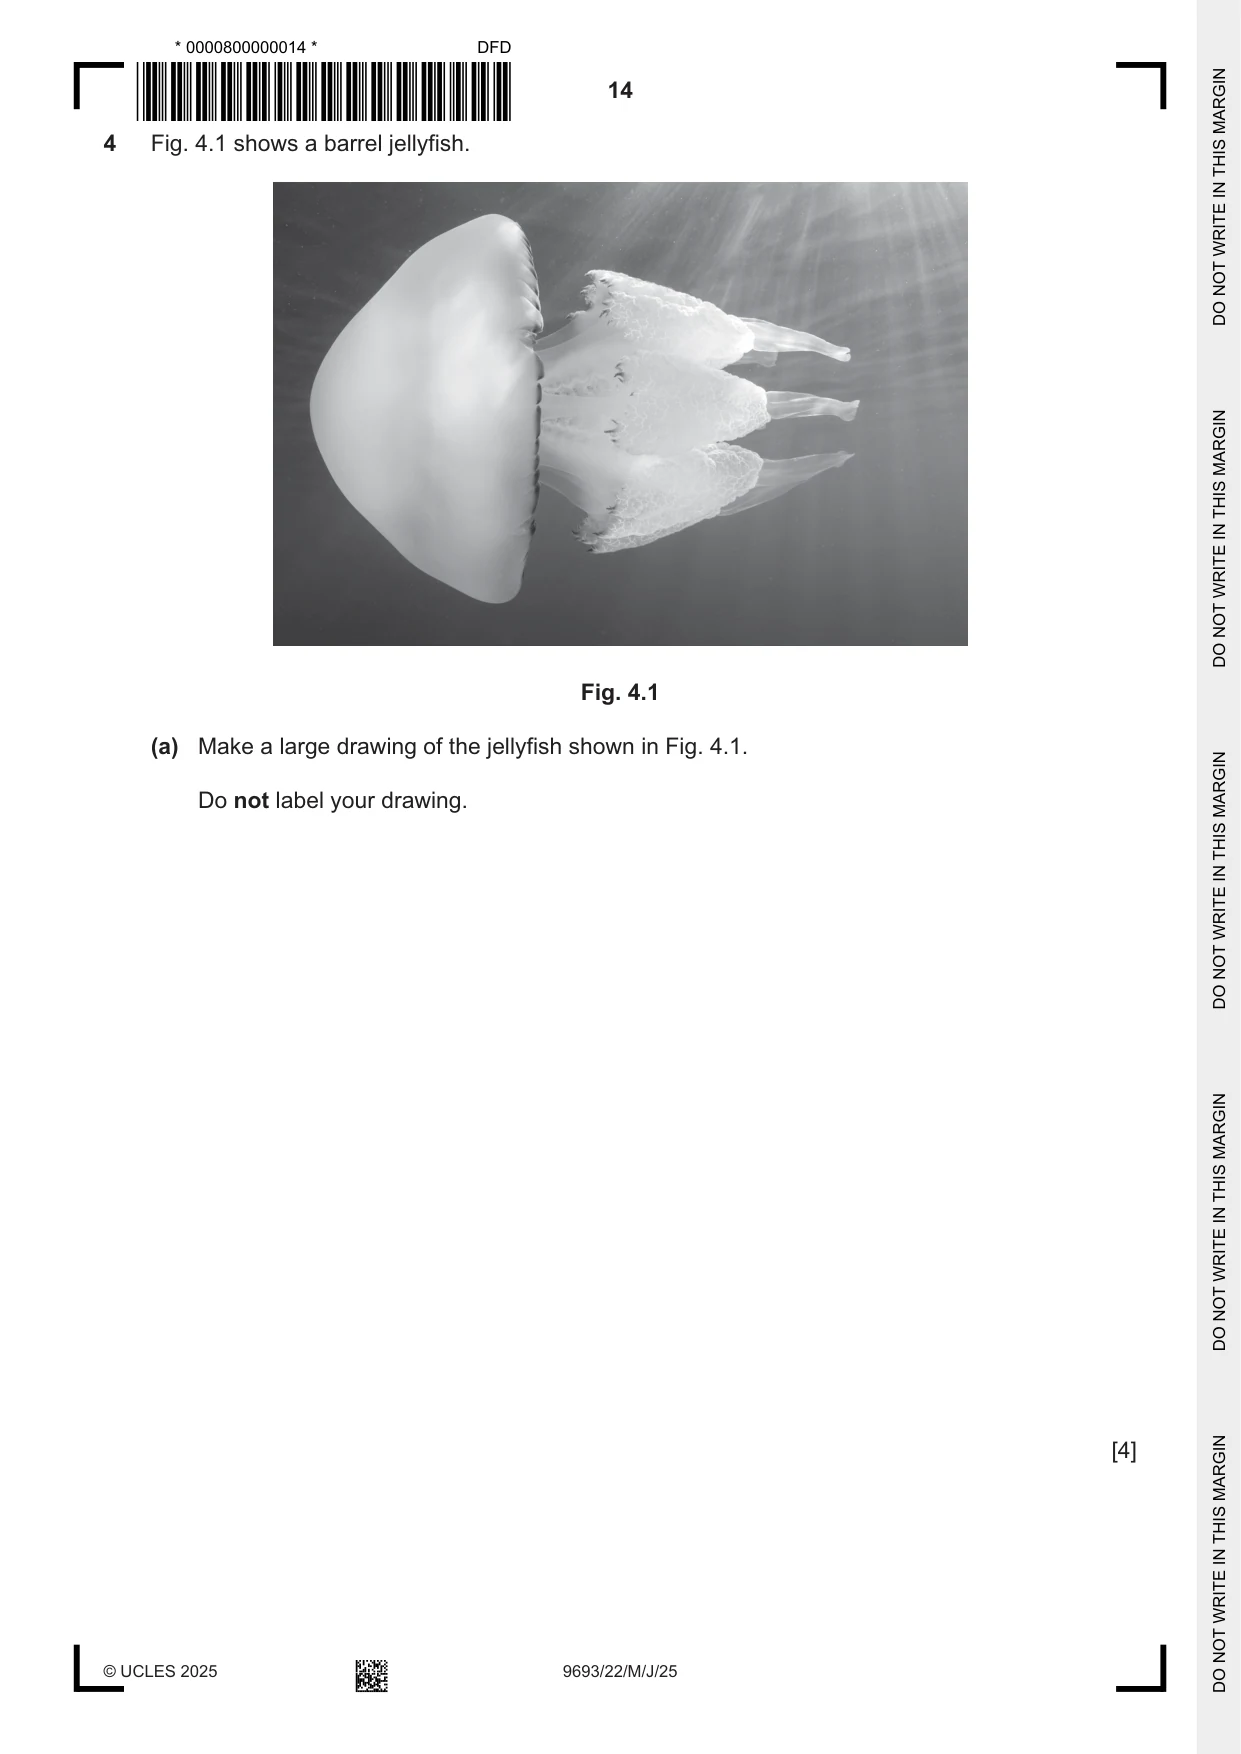
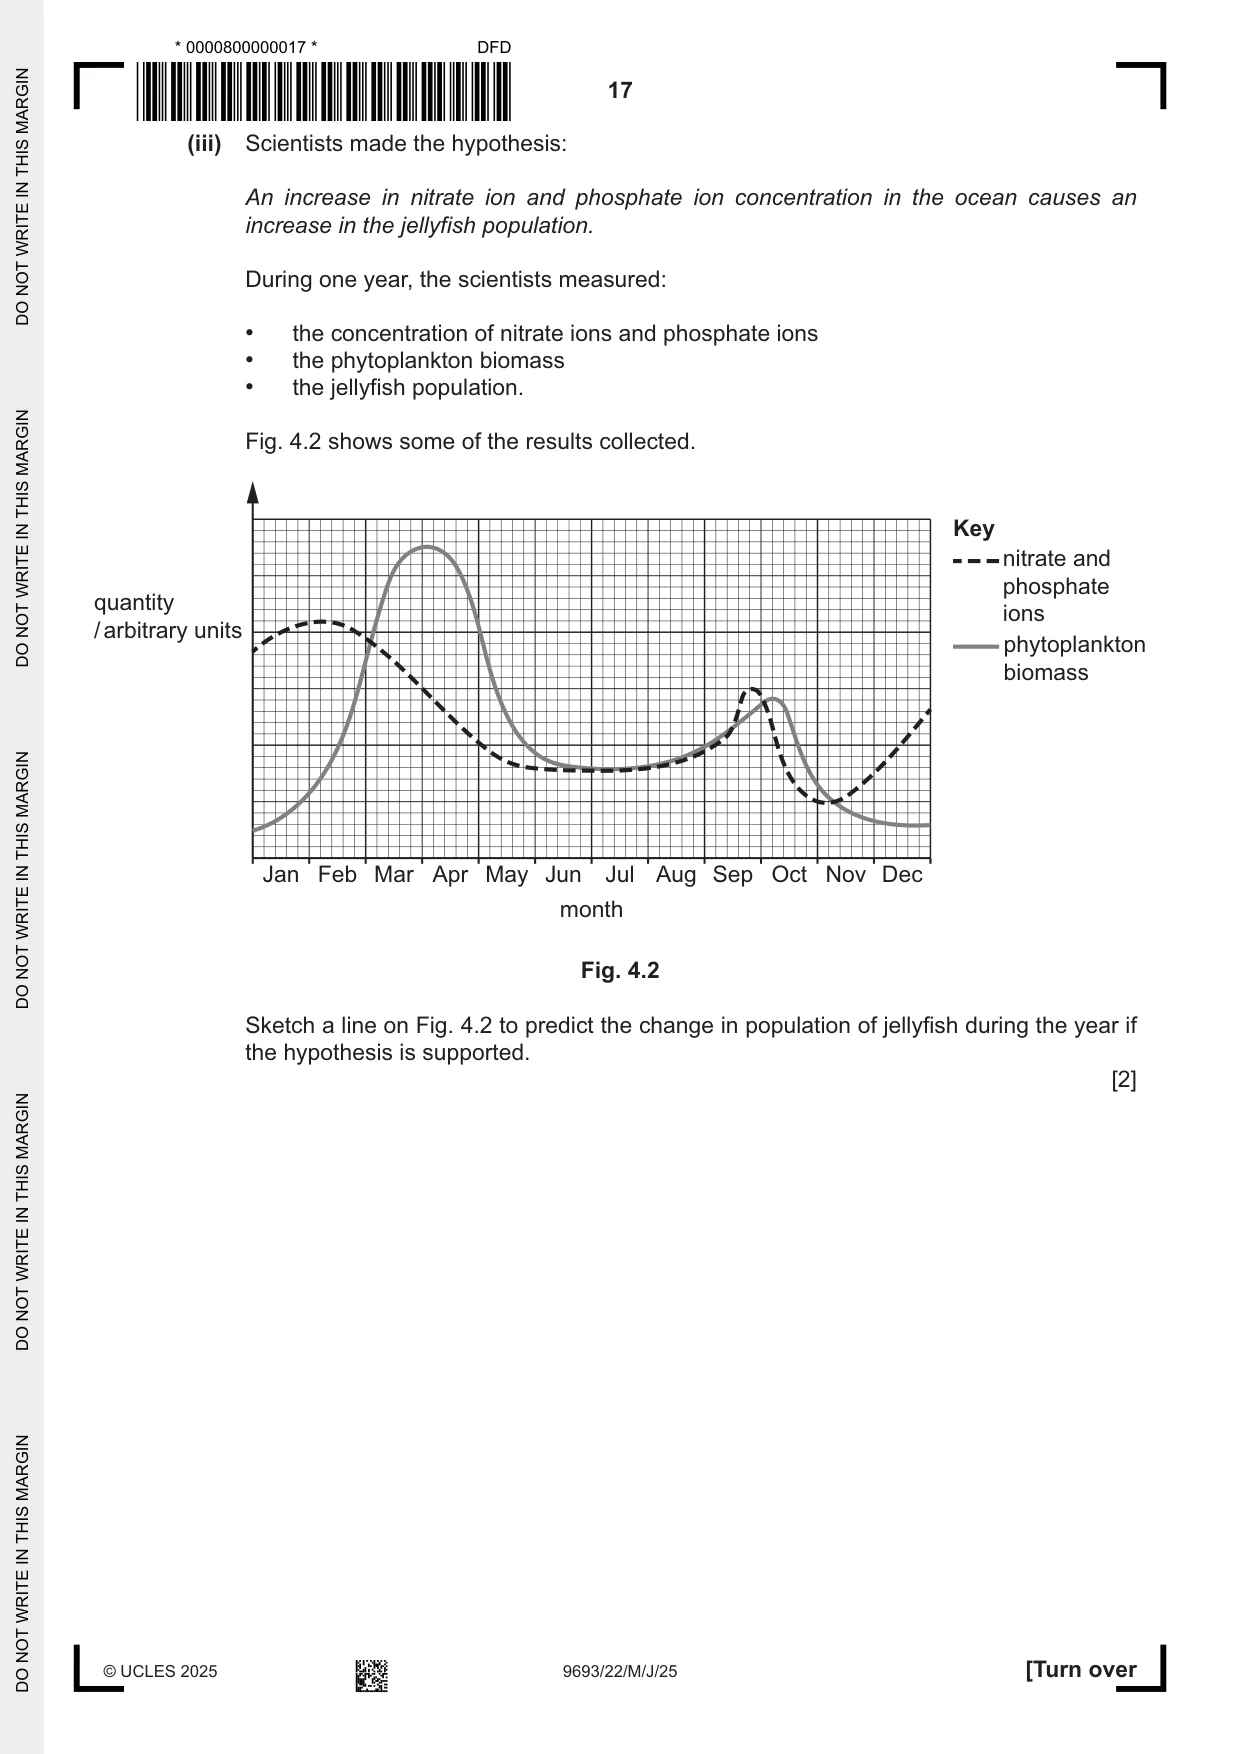
4 Fig. 4.1 shows a barrel jellyfish. Fig. 4.1 (a) Make a large drawing of the jellyfish shown in Fig. 4.1. Do not label your drawing. [4] (b) Citizen science projects encourage people to make observations in their environment and submit their observations to a research team. Scientists sometimes use citizen science projects to collect data from many people. Citizen science projects can be used to collect data on jellyfish washed up on beaches. (i) Suggest three advantages of collecting data from many people about jellyfish found on beaches instead of scientists collecting their own data. 1 ........................................................................................................................................ ........................................................................................................................................... 2 ........................................................................................................................................ ........................................................................................................................................... 3 ........................................................................................................................................ ........................................................................................................................................... [3] (ii) Suggest one disadvantage of collecting data from many people about jellyfish found on beaches instead of scientists collecting their own data. ........................................................................................................................................... ..................................................................................................................................... [1] (iii) Describe how the disadvantage you have given in 4(b)(ii) could be limited. ........................................................................................................................................... ..................................................................................................................................... [1] (iv) Jellyfish are in the phylum Cnidaria and have nematocysts. State the risk that jellyfish cause to people taking part in the study. ........................................................................................................................................... ..................................................................................................................................... [1] (v) Suggest two ways scientists can reduce the risk you have given in 4(b)(iv). 1 ........................................................................................................................................ ........................................................................................................................................... 2 ......................................................................................................................................... ........................................................................................................................................... [2] (c) Scientists investigated the relationship between nitrate ion (NO3–) and phosphate ion (PO43–) concentration in the ocean and the number of jellyfish found on beaches. (i) Explain why an increase in nitrate ion and phosphate ion concentration in the ocean can cause an increase in the jellyfish population. ........................................................................................................................................... ........................................................................................................................................... ........................................................................................................................................... ..................................................................................................................................... [2] (ii) State why the number of jellyfish found on beaches increases when the population of jellyfish increases. ........................................................................................................................................... ..................................................................................................................................... [1]
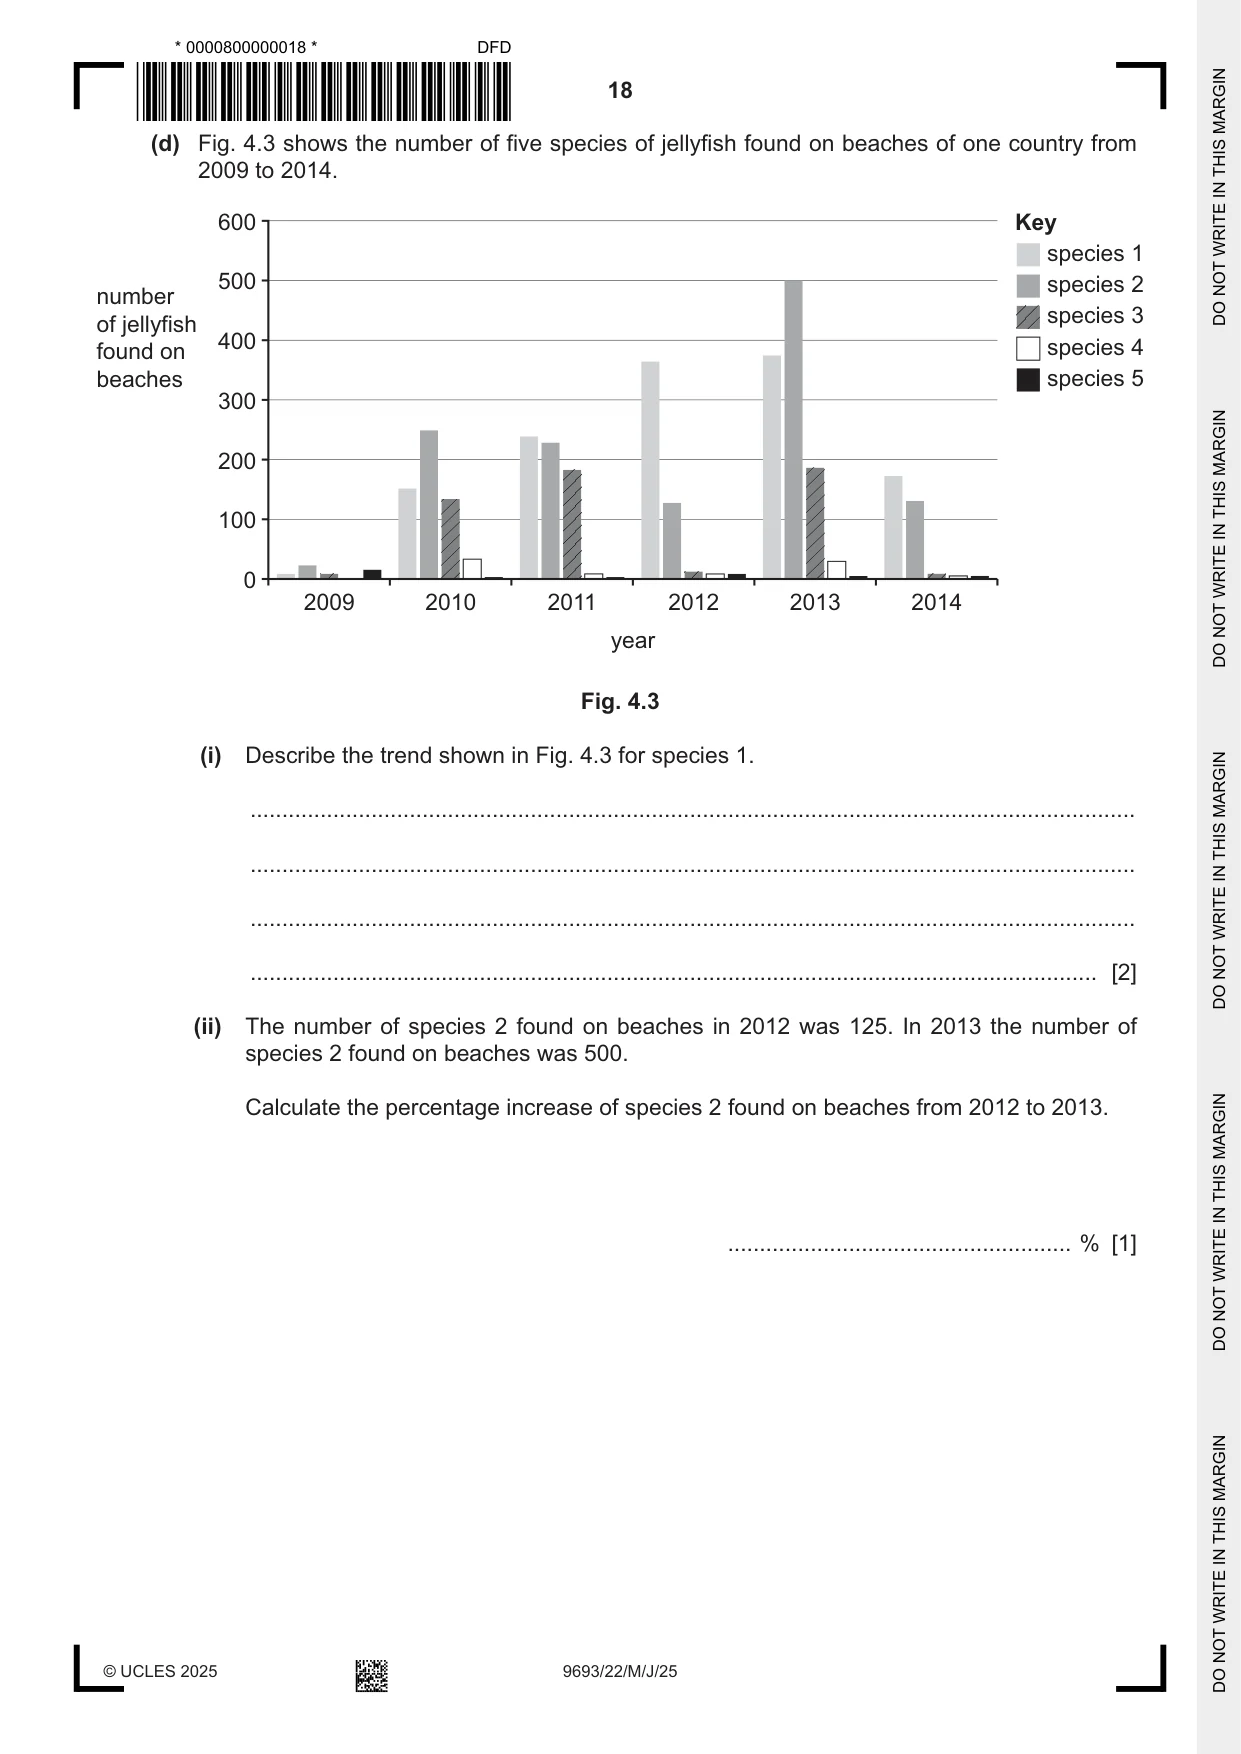
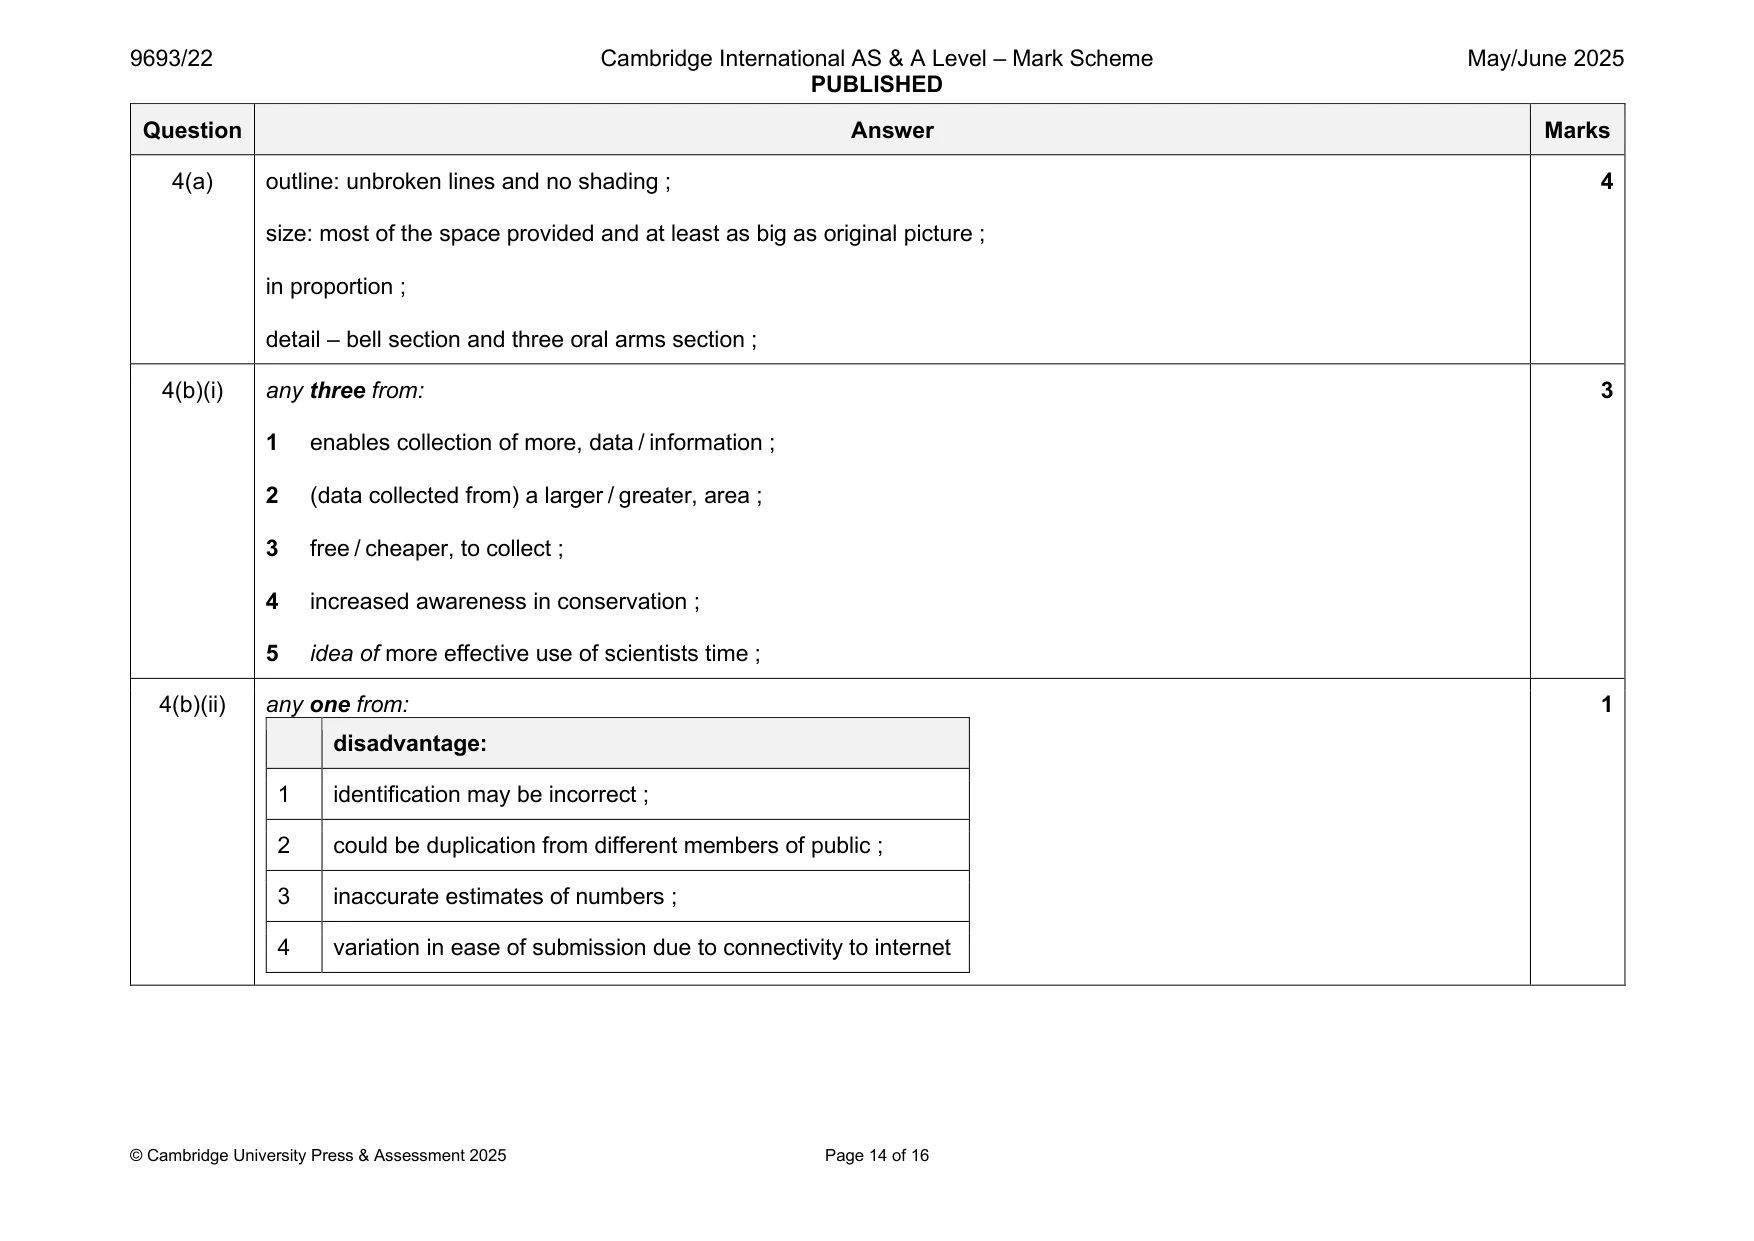
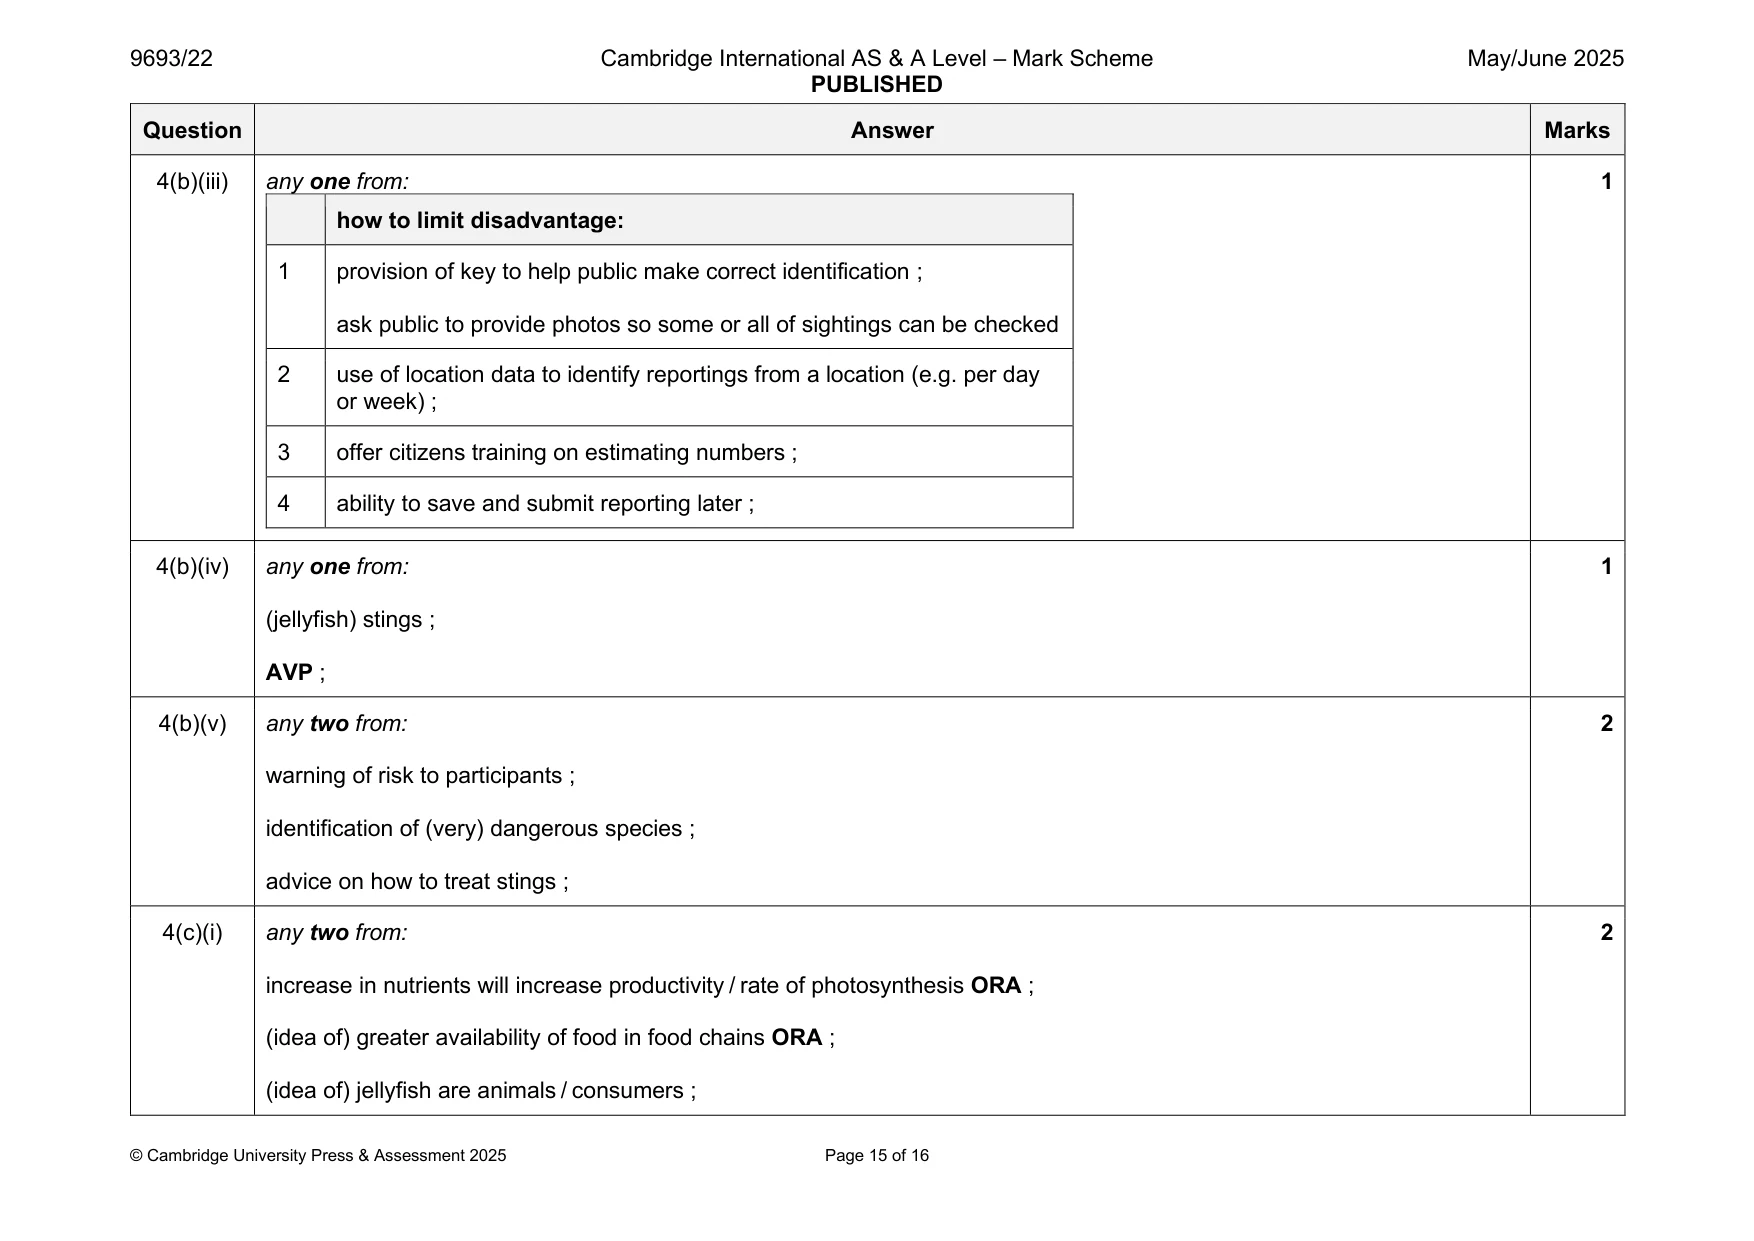
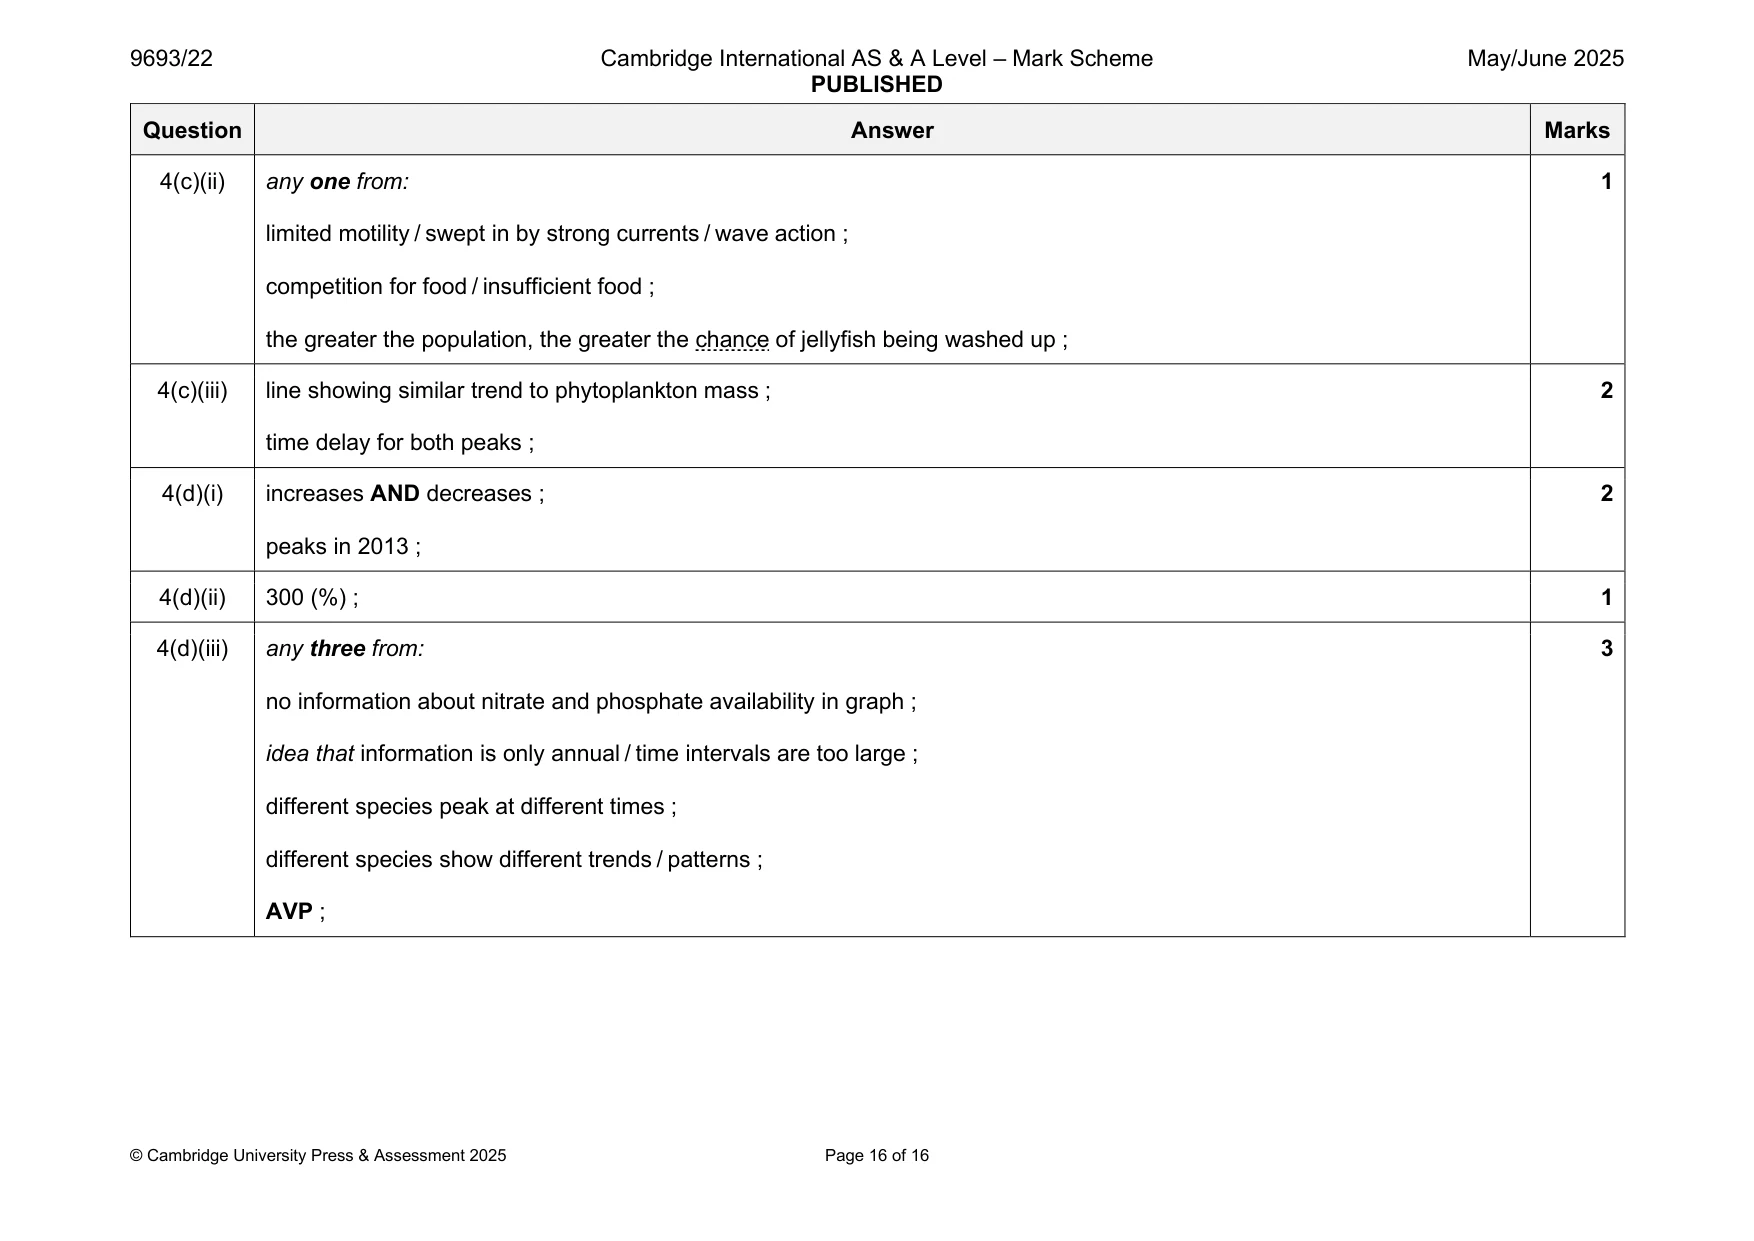
Mark scheme: 4(a) outline: unbroken lines and no shading ; 4 size: most of the space provided and at least as big as original picture ; in proportion ; detail – bell section and three oral arms section ; 4(b)(i) any three from: 3 1 enables collection of more, data / information ; 2 (data collected from) a larger / greater, area ; 3 free / cheaper, to collect ; 4 increased awareness in conservation ; 5 idea of more effective use of scientists time ; 4(b)(ii) any one from: 1 disadvantage: 1 identification may be incorrect ; 2 could be duplication from different members of public ; 3 inaccurate estimates of numbers ; 4 variation in ease of submission due to connectivity to internet 4(b)(iii) any one from: 1 how to limit disadvantage: 1 provision of key to help public make correct identification ; ask public to provide photos so some or all of sightings can be checked 2 use of location data to identify reportings from a location (e.g. per day or week) ; 3 offer citizens training on estimating numbers ; 4 ability to save and submit reporting later ; 4(b)(iv) any one from: 1 (jellyfish) stings ; AVP ; 4(b)(v) any two from: 2 warning of risk to participants ; identification of (very) dangerous species ; advice on how to treat stings ; 4(c)(i) any two from: 2 increase in nutrients will increase productivity / rate of photosynthesis ORA ; (idea of) greater availability of food in food chains ORA ; (idea of) jellyfish are animals / consumers ; 4(c)(ii) any one from: 1 limited motility / swept in by strong currents / wave action ; competition for food / insufficient food ; the greater the population, the greater the chance of jellyfish being washed up ; 4(c)(iii) line showing similar trend to phytoplankton mass ; 2 time delay for both peaks ; 4(d)(i) increases AND decreases ; 2 peaks in 2013 ; 4(d)(ii) 300 (%) ; 1 4(d)(iii) any three from: 3 no information about nitrate and phosphate availability in graph ; idea that information is only annual / time intervals are too large ; different species peak at different times ; different species show different trends / patterns ; AVP ;
What was in this paper
The subtopics covered by these 4 questions, and how many questions each got. Open one in a new tab to see every Cambridge question on it.
What you needed in this session
Cambridge’s own grade thresholds for 2025 May/June, Paper 2 · Variant 2. A higher threshold means an easier paper — the bar moves with how the cohort did.