Cambridge A Level Marine Science 9693 — 2023 May/June Paper 3 · Variant 1
9693/31/M/J/23 · 7 questions · 75 marks · ≈84 min
The question paper and its mark scheme, free to read here and free to download. This is Cambridge’s own paper, exactly as it was sat.
Question paper16 pages


Mark scheme13 pages
Answers below. Sit the paper first if you are practising.
Questions as text
Q1 · New River estuary in South Island, New Zealand, is a shallow tidal lagoon
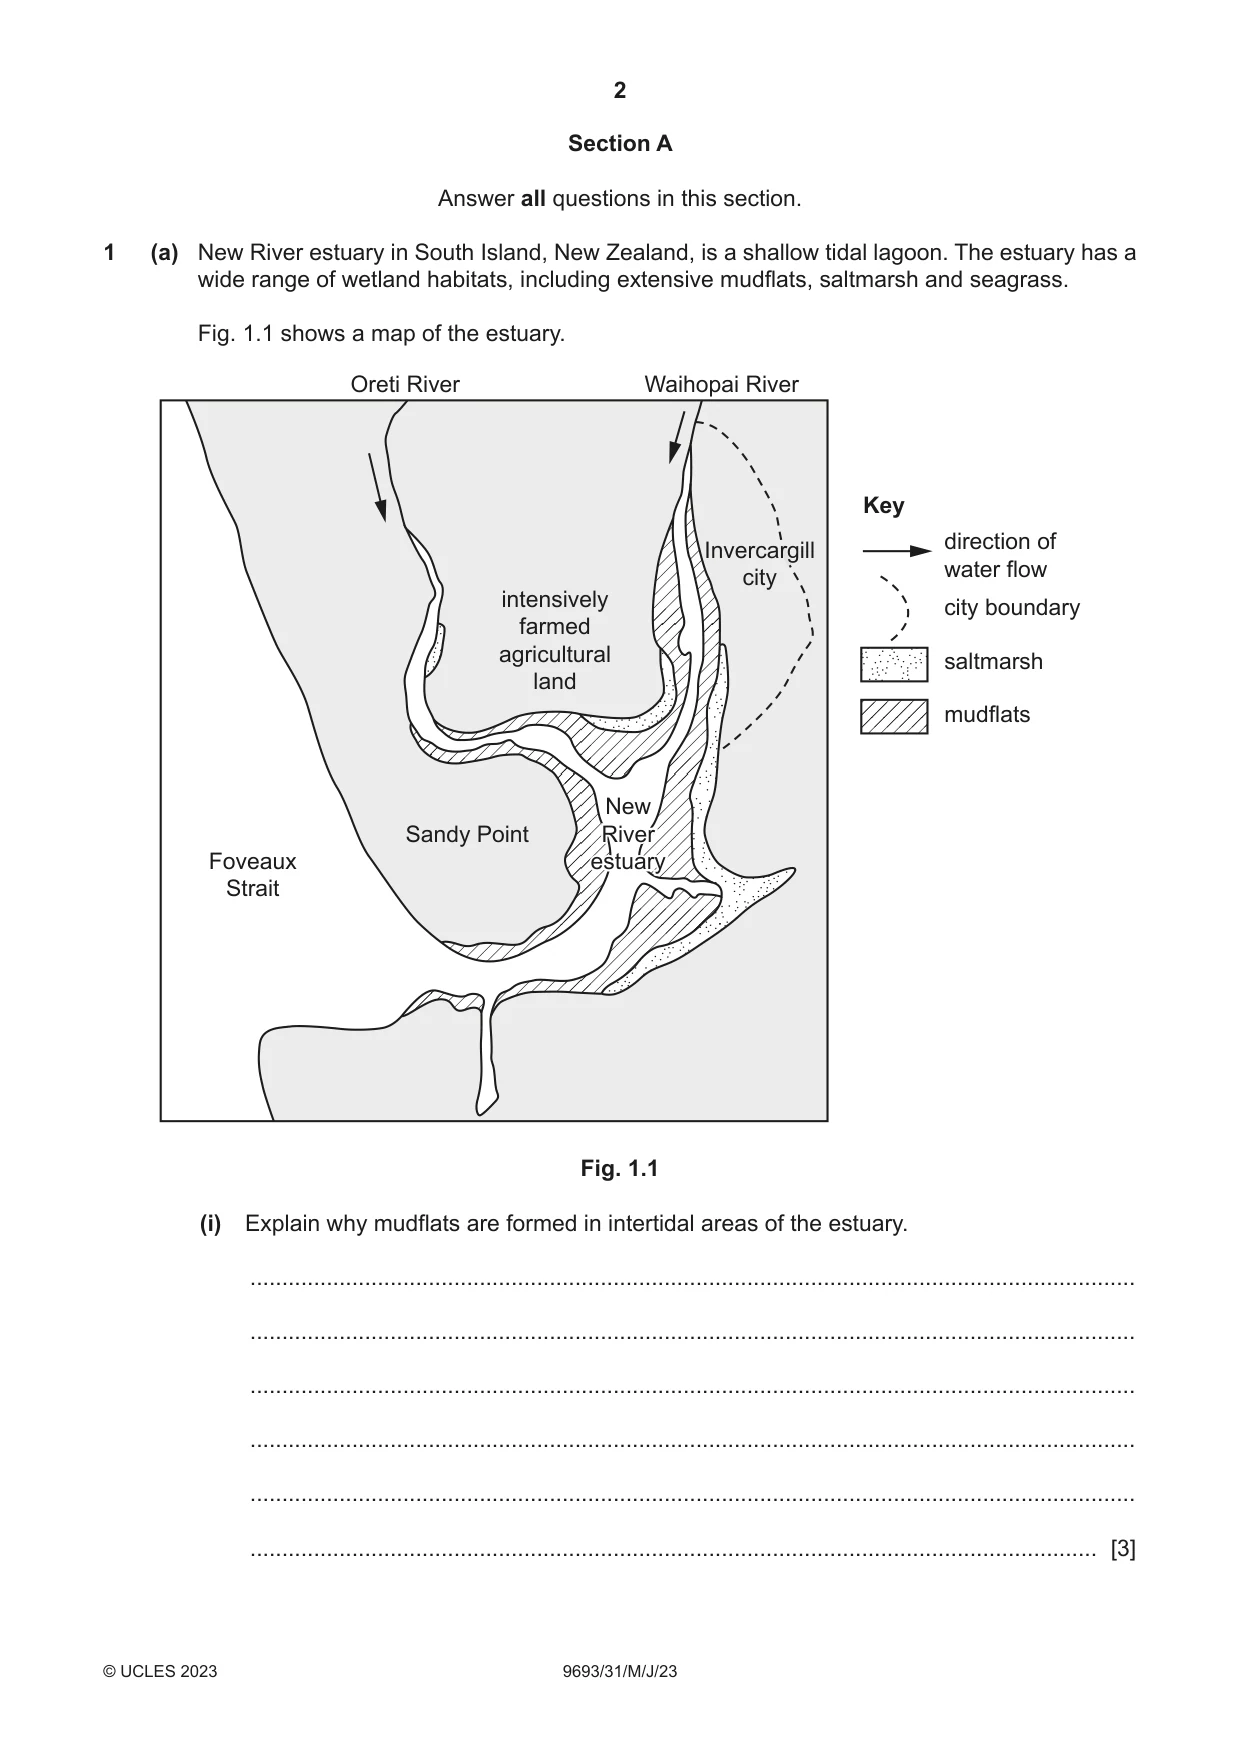
1 (a) New River estuary in South Island, New Zealand, is a shallow tidal lagoon. The estuary has a wide range of wetland habitats, including extensive mudflats, saltmarsh and seagrass. Fig. 1.1 shows a map of the estuary. Oreti River Waihopai River Key direction of Invercargill water flow city intensively city boundary farmed agricultural saltmarsh land mudflats NewNew Sandy Point RiverRiver Foveaux estuaryestuary Strait Fig. 1.1 (i) Explain why mudflats are formed in intertidal areas of the estuary. ........................................................................................................................................... ........................................................................................................................................... ........................................................................................................................................... ........................................................................................................................................... ........................................................................................................................................... ..................................................................................................................................... [3] (ii) Describe how seagrass and saltmarsh plants help reduce erosion of the surrounding land and reduce nutrient levels in the estuary. ........................................................................................................................................... ........................................................................................................................................... ........................................................................................................................................... ........................................................................................................................................... ........................................................................................................................................... ........................................................................................................................................... ........................................................................................................................................... ..................................................................................................................................... [4] (b) Land drainage and clearance over the last 20 years have reduced the area of wetland. The volume and speed of water entering the estuary as run-off has increased, bringing with it more nutrients and microorganisms, such as bacteria. (i) Use Fig. 1.1 to suggest two reasons why quantities of nutrients and microorganisms in run-off have increased over the last 20 years. 1 ........................................................................................................................................ ........................................................................................................................................... 2 ........................................................................................................................................ ........................................................................................................................................... [2] (ii) Excess nutrients have resulted in blooms of macroalgae, which form large mats covering the water surface. Explain how these mats reduce the numbers of seagrass and saltmarsh plants. ........................................................................................................................................... ........................................................................................................................................... ........................................................................................................................................... ..................................................................................................................................... [2] (c) Water monitoring since 2001 shows that the estuary suffers from increasing eutrophication. Eutrophication occurs when excess nutrients stimulate an overgrowth of producers, which usually results in oxygen depletion. In 2001, 1% of the area was highly eutrophic, increasing to 15% in 2019. (i) Suggest why an estuary is more likely to experience eutrophication than open seas. ........................................................................................................................................... ..................................................................................................................................... [1] (ii) In the eutrophic areas there is black mud a few centimetres below the surface, which contains very little or no oxygen. Only specialised bacteria survive in this mud. Describe the processes used by these bacteria to obtain and then release energy. ........................................................................................................................................... ........................................................................................................................................... ........................................................................................................................................... ........................................................................................................................................... ........................................................................................................................................... ..................................................................................................................................... [3] [Total: 15]
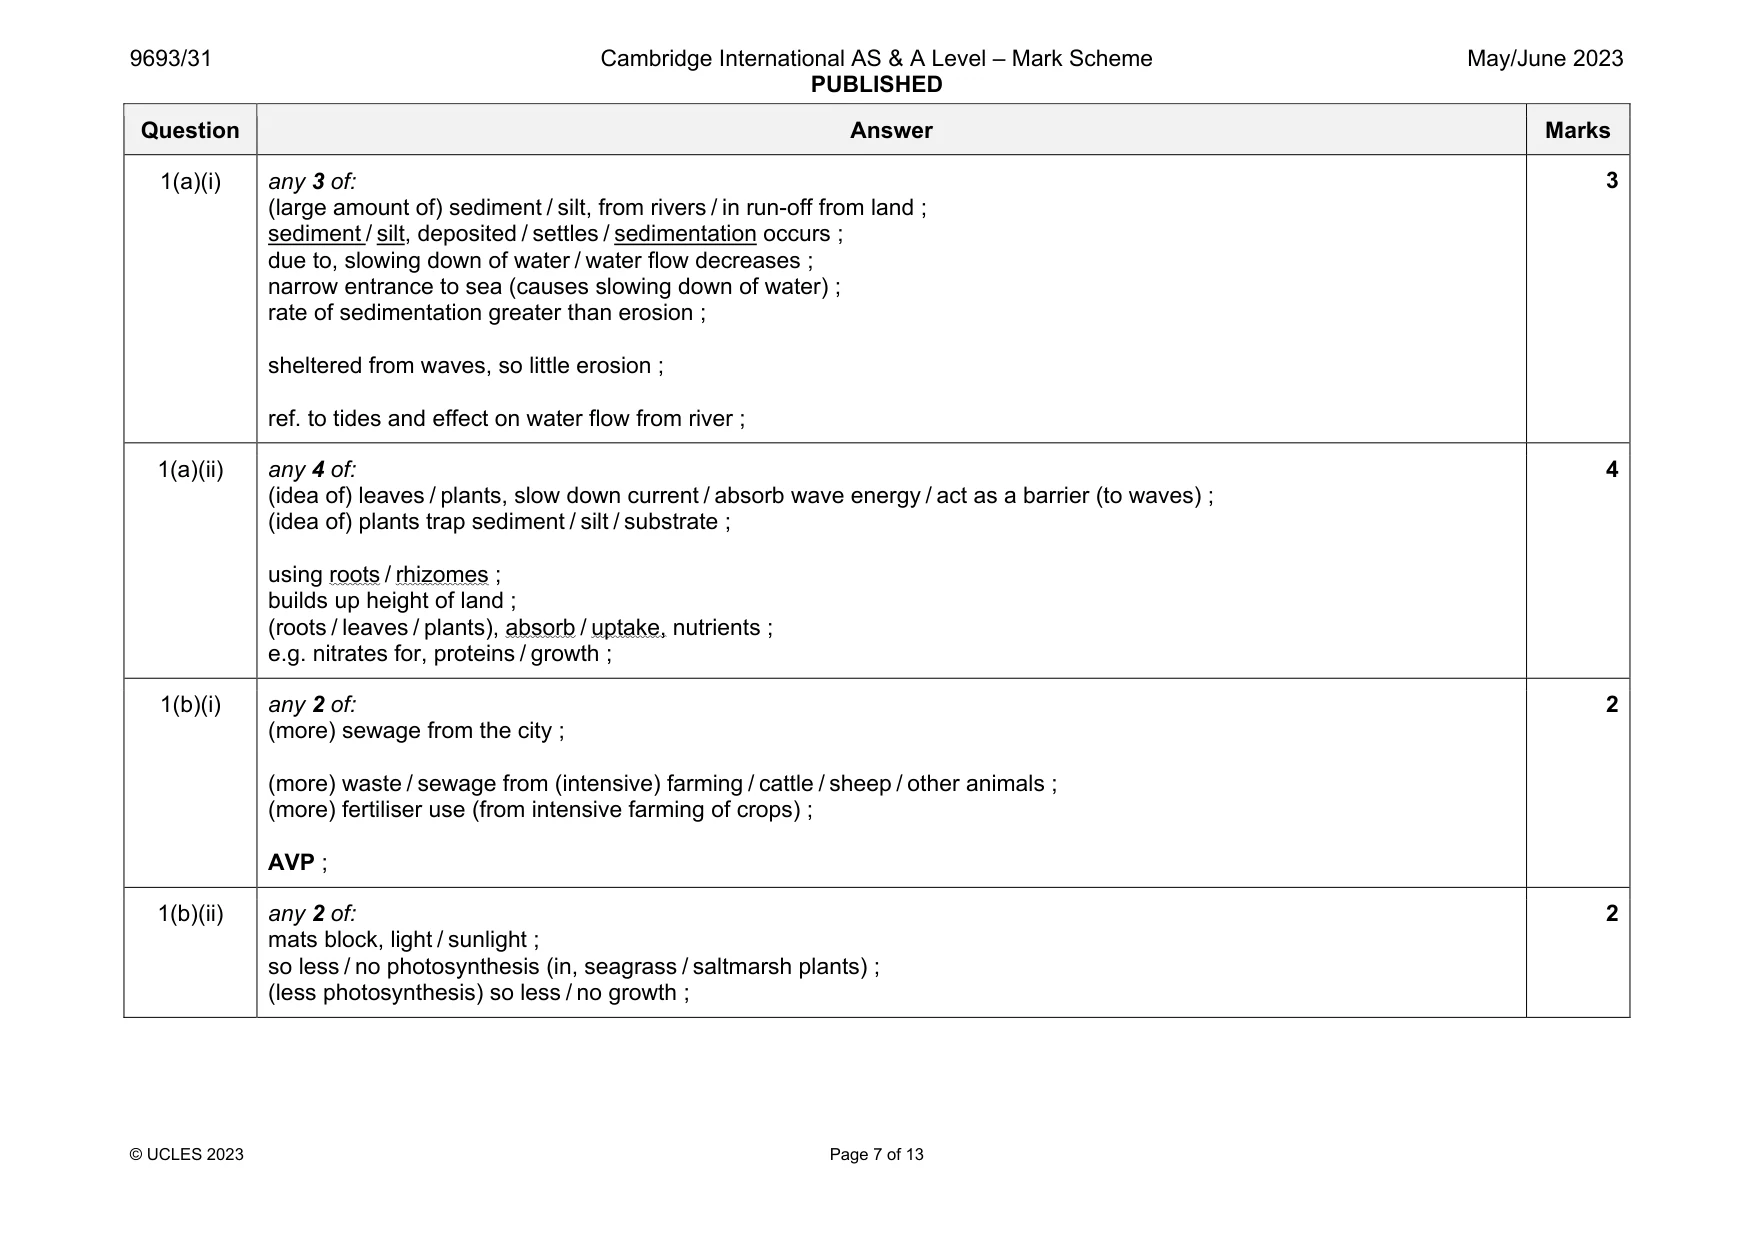
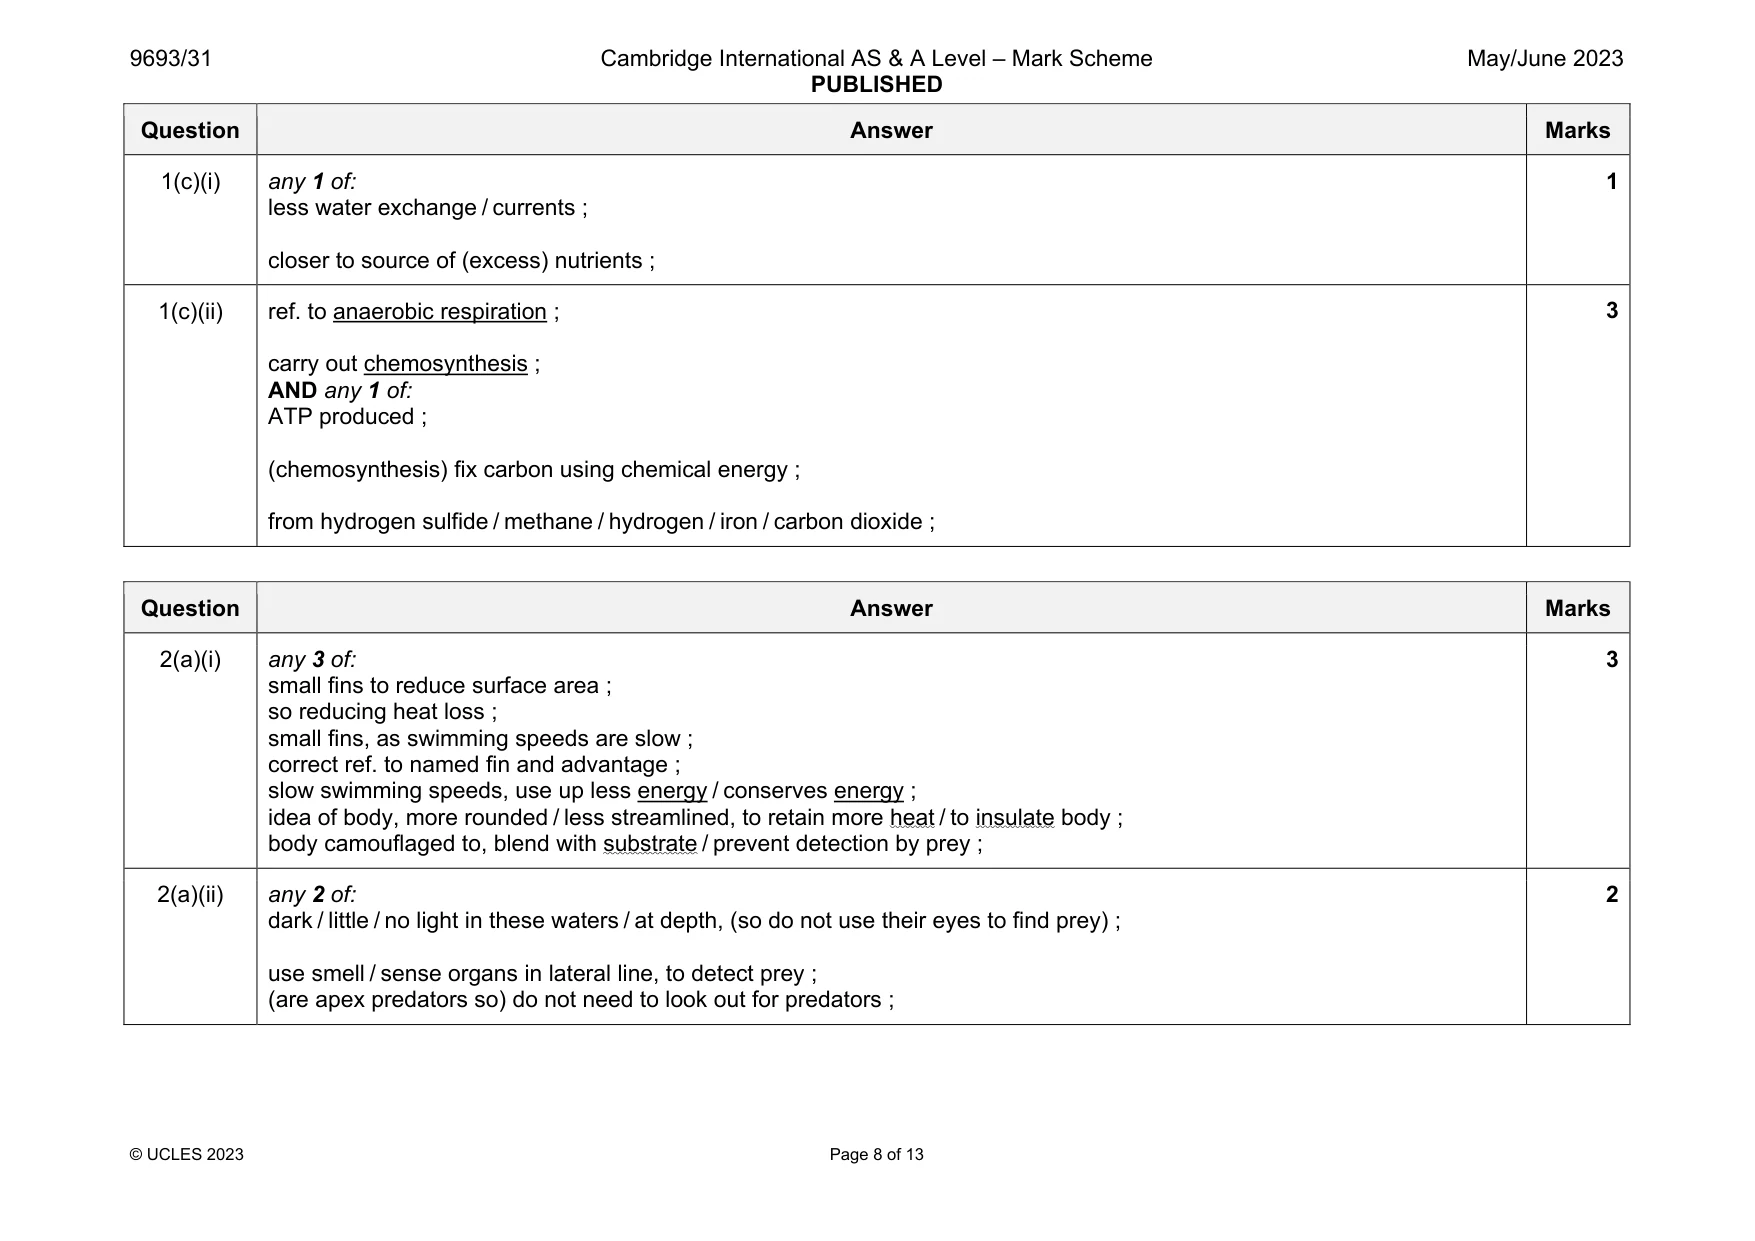
Mark scheme: 1(a)(i) any 3 of: (large amount of) sediment / silt, from rivers / in run-off from land ; sediment / silt, deposited / settles / sedimentation occurs ; due to, slowing down of water / water flow decreases ; narrow entrance to sea (causes slowing down of water) ; rate of sedimentation greater than erosion ; sheltered from waves, so little erosion ; ref. to tides and effect on water flow from river ; 1(a)(ii) any 4 of: (idea of) leaves / plants, slow down current / absorb wave energy / act as a barrier (to waves) ; (idea of) plants trap sediment / silt / substrate ; using roots / rhizomes ; builds up height of land ; (roots / leaves / plants), absorb / uptake, nutrients ; e.g. nitrates for, proteins / growth ; 4 1(b)(i) any 2 of: (more) sewage from the city ; (more) waste / sewage from (intensive) farming / cattle / sheep / other animals ; (more) fertiliser use (from intensive farming of crops) ; AVP ; 2 1(b)(ii) any 2 of: mats block, light / sunlight ; so less / no photosynthesis (in, seagrass / saltmarsh plants) ; (less photosynthesis) so less / no growth ; 2 Question Answer Marks 1(c)(i) any 1 of: less water exchange / currents ; closer to source of (excess) nutrients ; 1 1(c)(ii) ref. to anaerobic respiration ; carry out chemosynthesis ; AND any 1 of: ATP produced ; (chemosynthesis) fix carbon using chemical energy ; from hydrogen sulfide / methane / hydrogen / iron / carbon dioxide ; 3
Q2 · Greenland sharks can live for over 200 years and are found in the almost freezing waters…
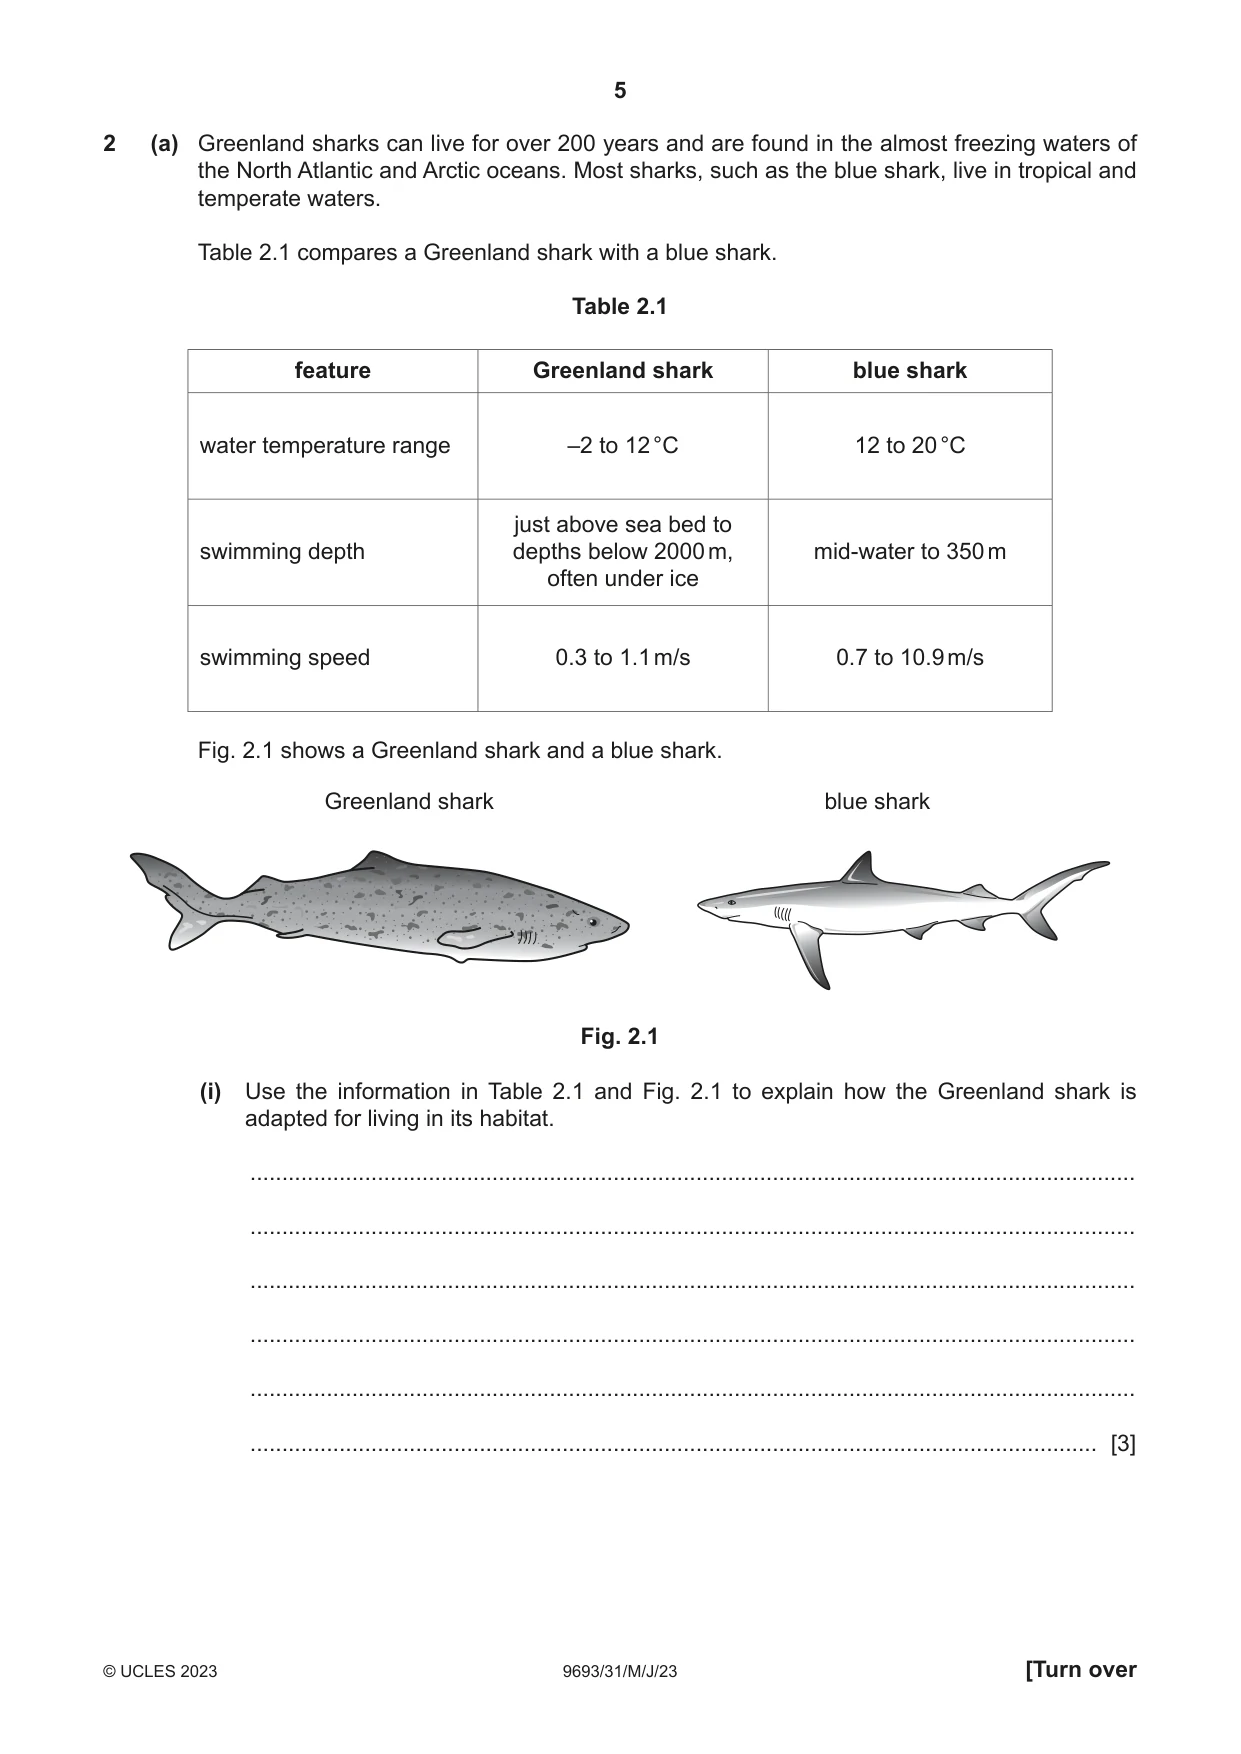
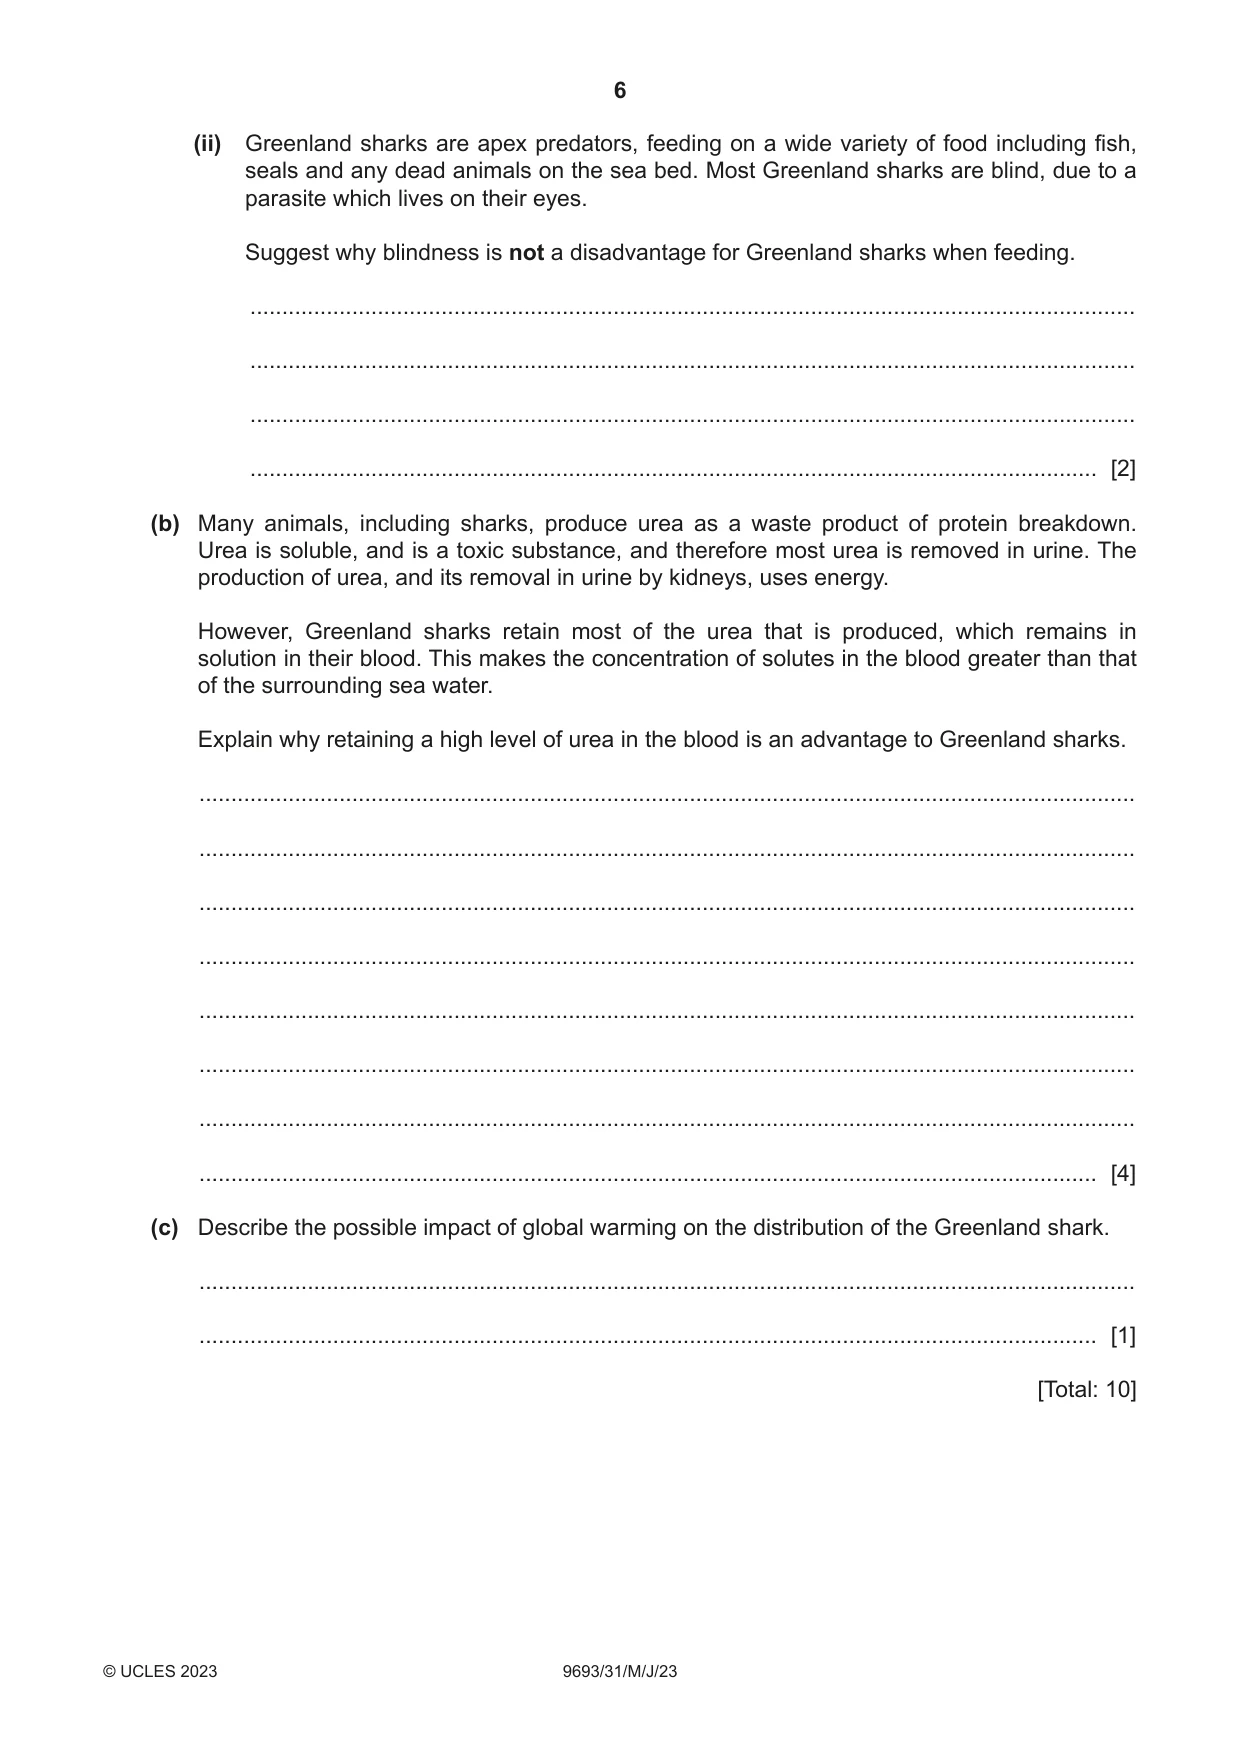
2 (a) Greenland sharks can live for over 200 years and are found in the almost freezing waters of the North Atlantic and Arctic oceans. Most sharks, such as the blue shark, live in tropical and temperate waters. Table 2.1 compares a Greenland shark with a blue shark. Table 2.1 feature Greenland shark blue shark water temperature range –2 to 12 °C 12 to 20 °C just above sea bed to swimming depth depths below 2000 m, mid-water to 350 m often under ice swimming speed 0.3 to 1.1 m/s 0.7 to 10.9 m/s Fig. 2.1 shows a Greenland shark and a blue shark. Greenland shark blue shark Fig. 2.1 (i) Use the information in Table 2.1 and Fig. 2.1 to explain how the Greenland shark is adapted for living in its habitat. ........................................................................................................................................... ........................................................................................................................................... ........................................................................................................................................... ........................................................................................................................................... ........................................................................................................................................... ..................................................................................................................................... [3] (ii) Greenland sharks are apex predators, feeding on a wide variety of food including fish, seals and any dead animals on the sea bed. Most Greenland sharks are blind, due to a parasite which lives on their eyes. Suggest why blindness is not a disadvantage for Greenland sharks when feeding. ........................................................................................................................................... ........................................................................................................................................... ........................................................................................................................................... ..................................................................................................................................... [2] (b) Many animals, including sharks, produce urea as a waste product of protein breakdown. Urea is soluble, and is a toxic substance, and therefore most urea is removed in urine. The production of urea, and its removal in urine by kidneys, uses energy. However, Greenland sharks retain most of the urea that is produced, which remains in solution in their blood. This makes the concentration of solutes in the blood greater than that of the surrounding sea water. Explain why retaining a high level of urea in the blood is an advantage to Greenland sharks. ................................................................................................................................................... ................................................................................................................................................... ................................................................................................................................................... ................................................................................................................................................... ................................................................................................................................................... ................................................................................................................................................... ................................................................................................................................................... ............................................................................................................................................. [4] (c) Describe the possible impact of global warming on the distribution of the Greenland shark. ................................................................................................................................................... ............................................................................................................................................. [1] [Total: 10]
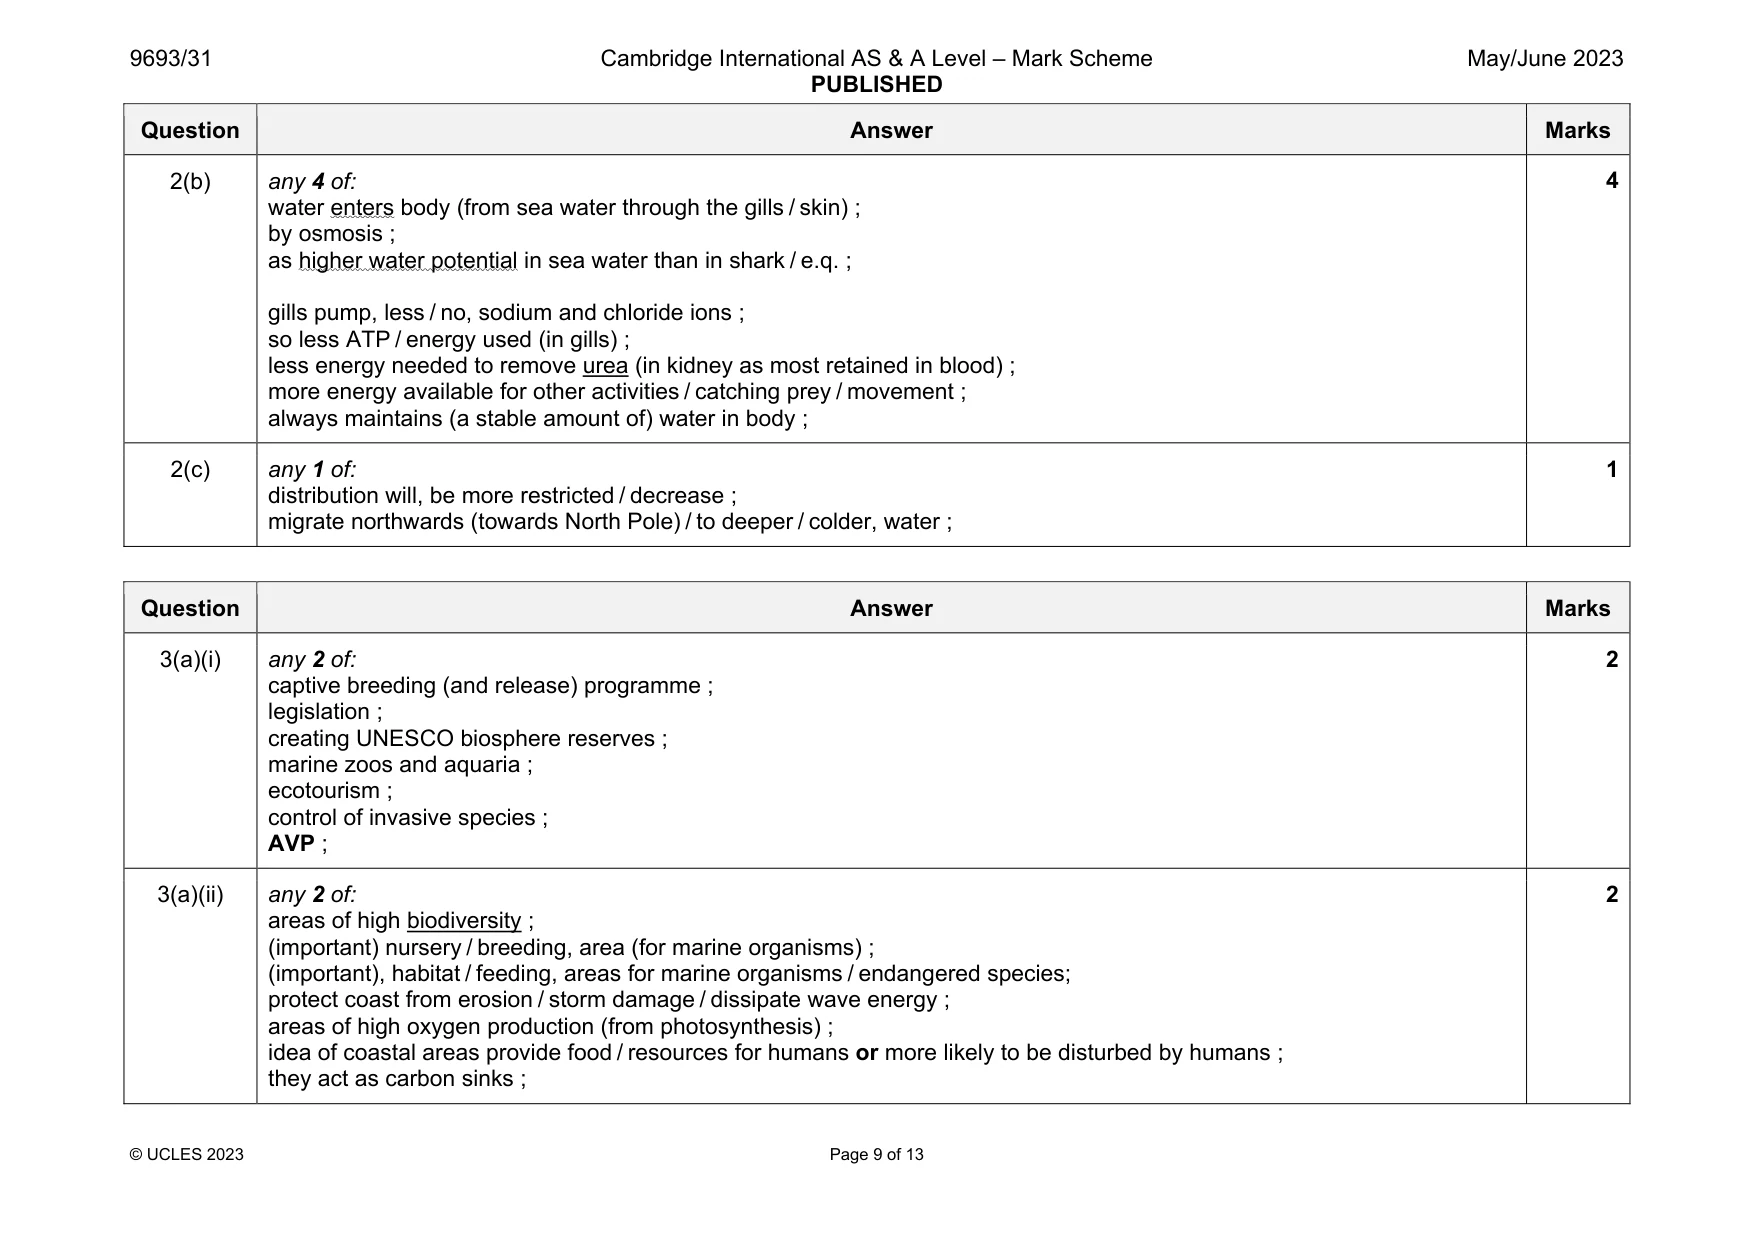
Mark scheme: 2(a)(i) any 3 of: small fins to reduce surface area ; so reducing heat loss ; small fins, as swimming speeds are slow ; correct ref. to named fin and advantage ; slow swimming speeds, use up less energy / conserves energy ; idea of body, more rounded / less streamlined, to retain more heat / to insulate body ; body camouflaged to, blend with substrate / prevent detection by prey ; 3 2(a)(ii) any 2 of: dark / little / no light in these waters / at depth, (so do not use their eyes to find prey) ; use smell / sense organs in lateral line, to detect prey ; (are apex predators so) do not need to look out for predators ; 2 Question Answer Marks 2(b) any 4 of: water enters body (from sea water through the gills / skin) ; by osmosis ; as higher water potential in sea water than in shark / e.q. ; gills pump, less / no, sodium and chloride ions ; so less ATP / energy used (in gills) ; less energy needed to remove urea (in kidney as most retained in blood) ; more energy available for other activities / catching prey / movement ; always maintains (a stable amount of) water in body ; 4 2(c) any 1 of: distribution will, be more restricted / decrease ; migrate northwards (towards North Pole) / to deeper / colder, water ; 1
Q3 · The United Nations achieved its aim of 10% of oceans on Earth becoming protected areas by…
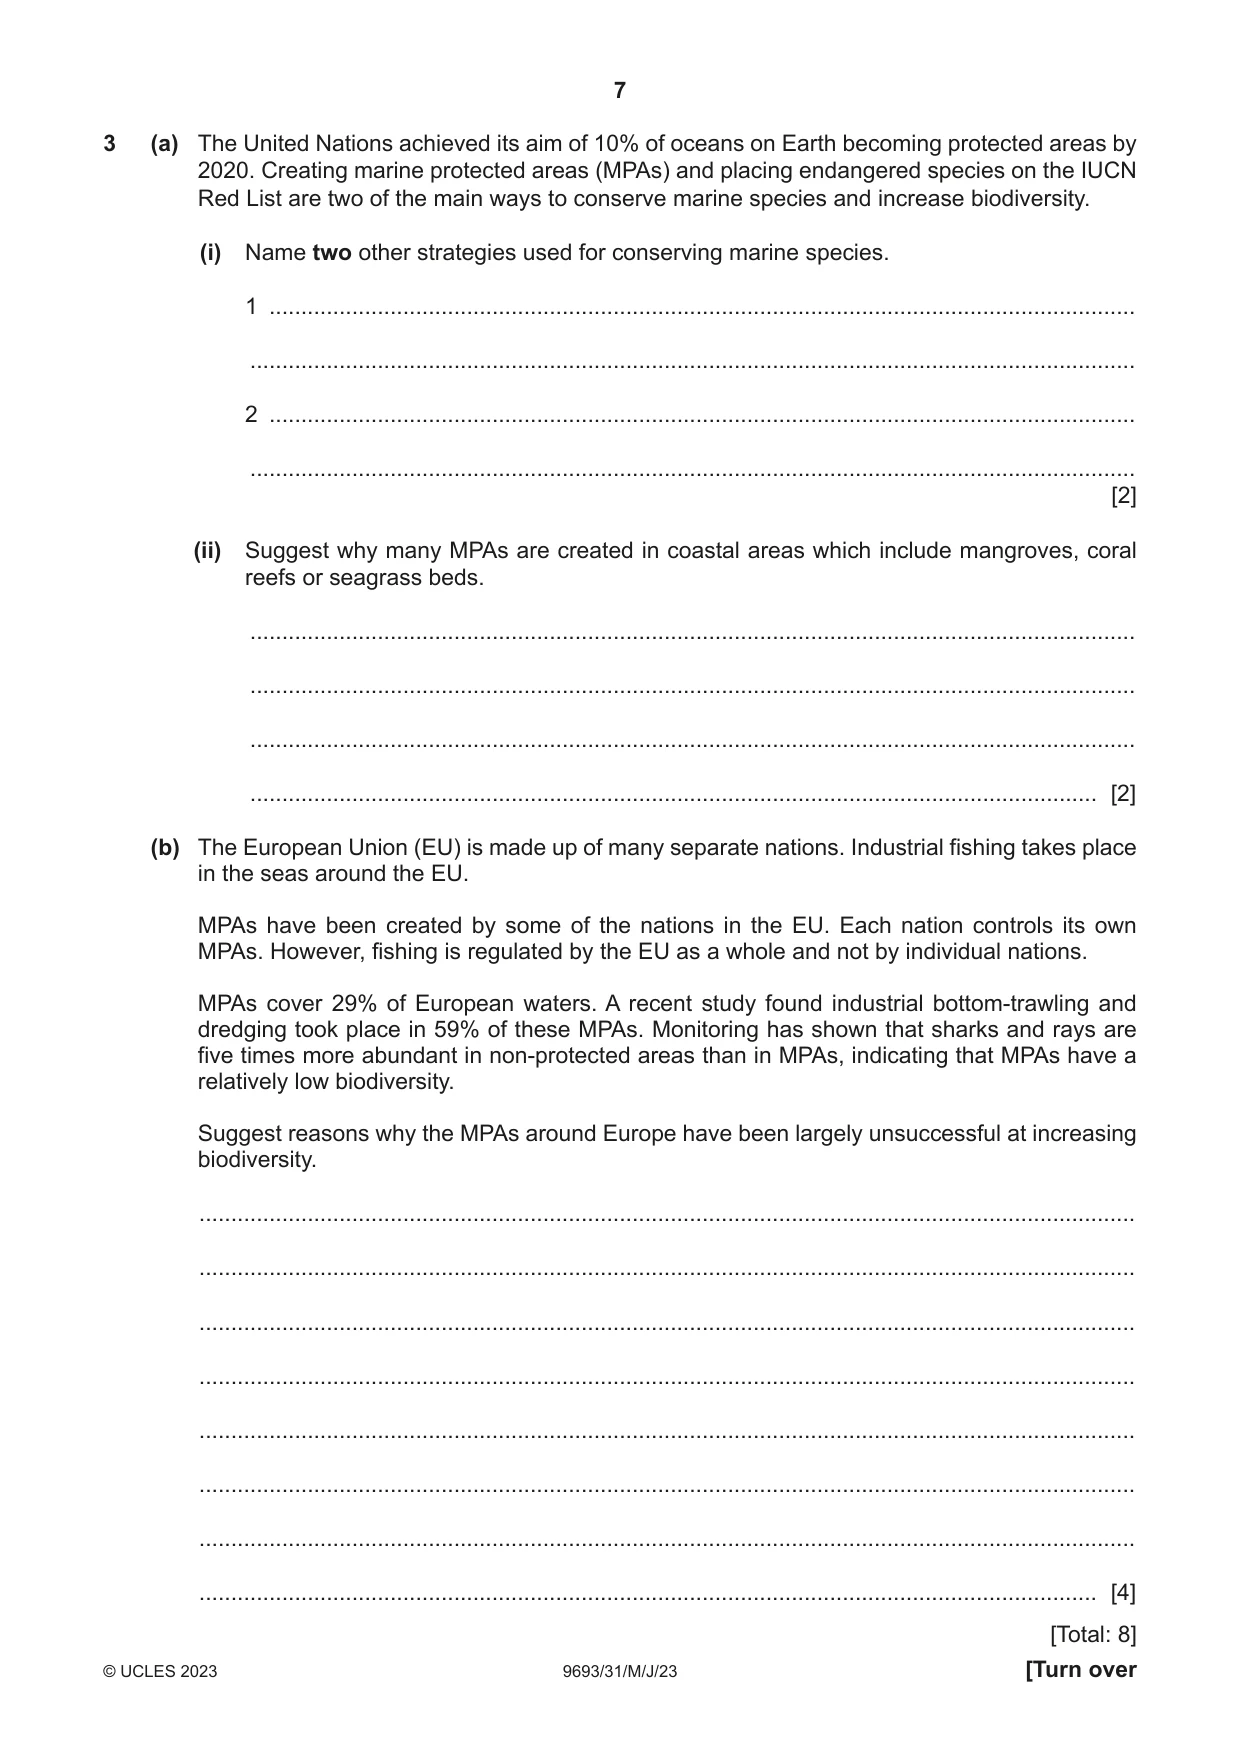
3 (a) The United Nations achieved its aim of 10% of oceans on Earth becoming protected areas by 2020. Creating marine protected areas (MPAs) and placing endangered species on the IUCN Red List are two of the main ways to conserve marine species and increase biodiversity. (i) Name two other strategies used for conserving marine species. 1 ........................................................................................................................................ ........................................................................................................................................... 2 ........................................................................................................................................ ........................................................................................................................................... [2] (ii) Suggest why many MPAs are created in coastal areas which include mangroves, coral reefs or seagrass beds. ........................................................................................................................................... ........................................................................................................................................... ........................................................................................................................................... ..................................................................................................................................... [2] (b) The European Union (EU) is made up of many separate nations. Industrial fishing takes place in the seas around the EU. MPAs have been created by some of the nations in the EU. Each nation controls its own MPAs. However, fishing is regulated by the EU as a whole and not by individual nations. MPAs cover 29% of European waters. A recent study found industrial bottom-trawling and dredging took place in 59% of these MPAs. Monitoring has shown that sharks and rays are five times more abundant in non-protected areas than in MPAs, indicating that MPAs have a relatively low biodiversity. Suggest reasons why the MPAs around Europe have been largely unsuccessful at increasing biodiversity. ................................................................................................................................................... ................................................................................................................................................... ................................................................................................................................................... ................................................................................................................................................... ................................................................................................................................................... ................................................................................................................................................... ................................................................................................................................................... ............................................................................................................................................. [4] [Total: 8]
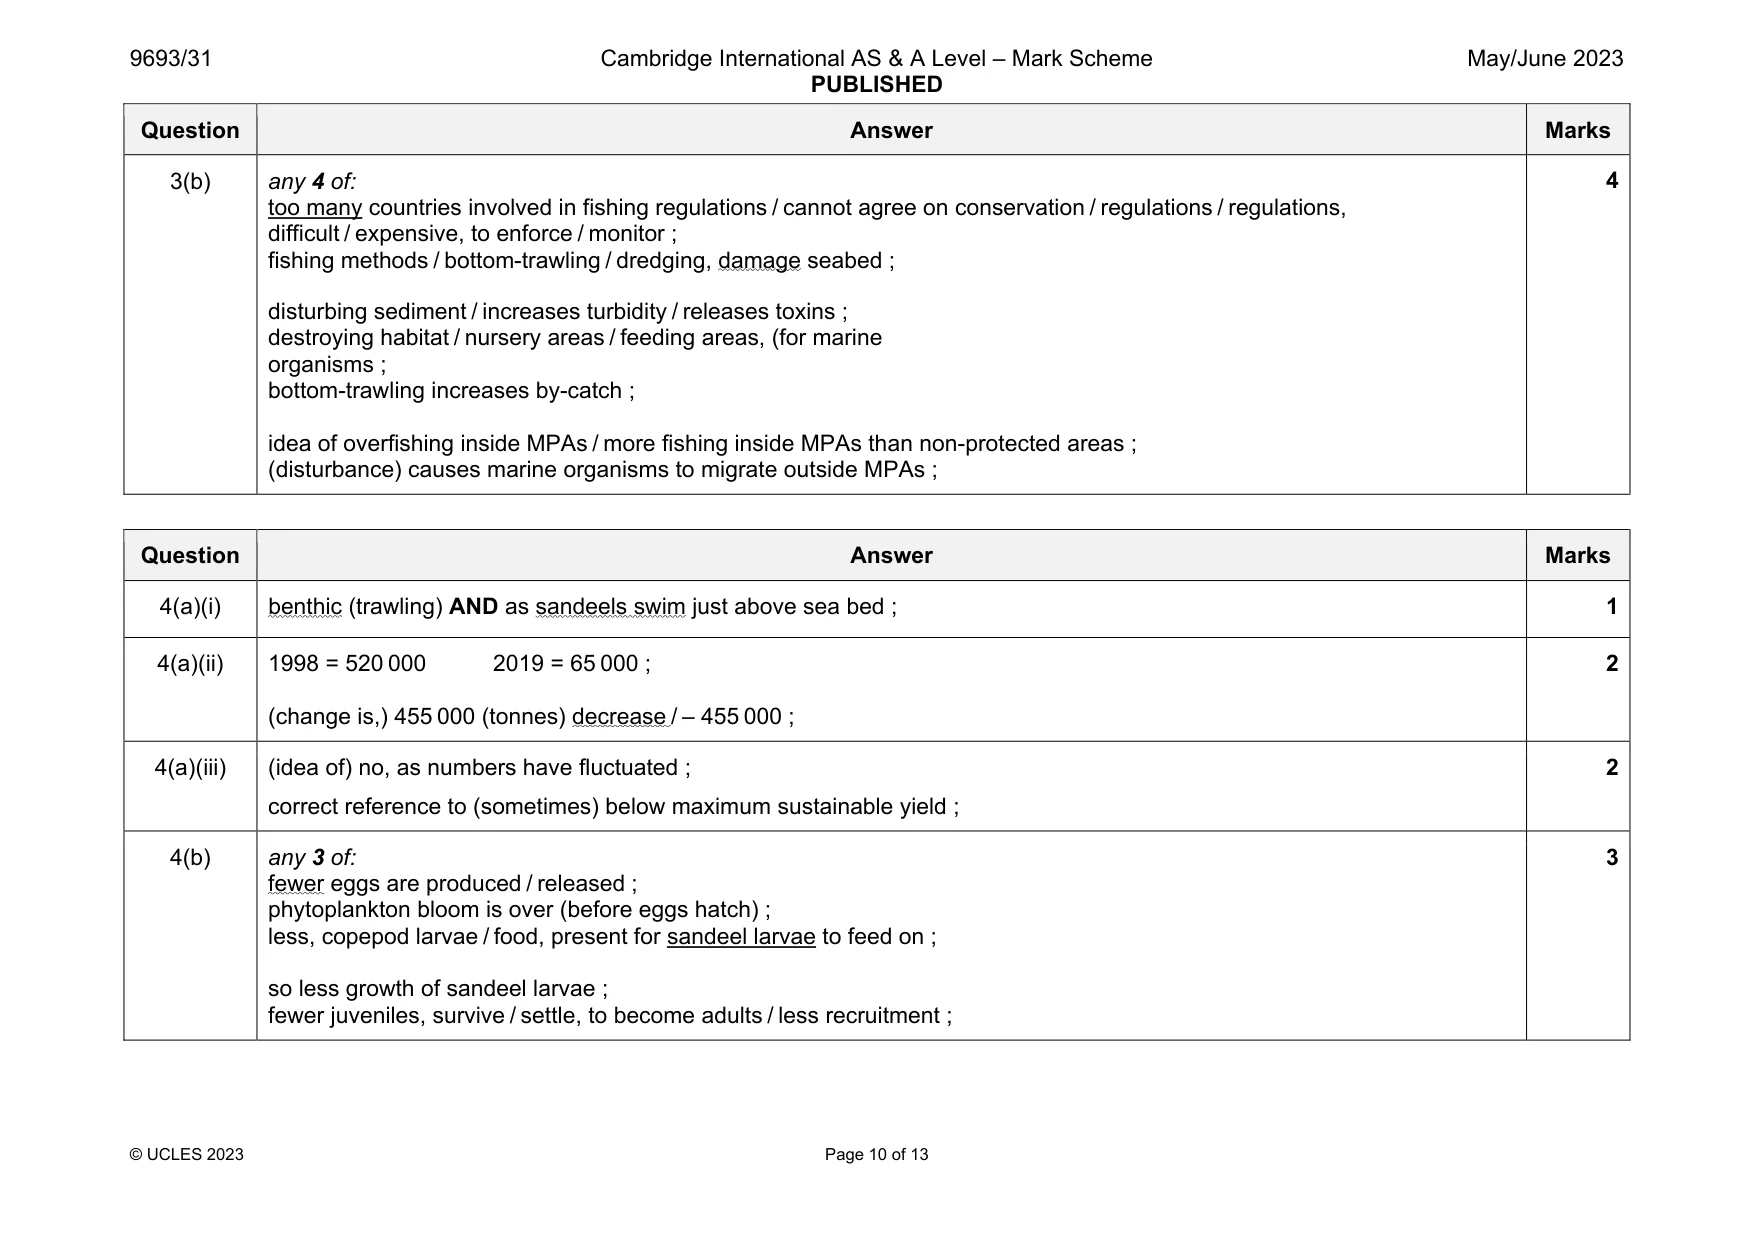
Mark scheme: 3(a)(i) any 2 of: captive breeding (and release) programme ; legislation ; creating UNESCO biosphere reserves ; marine zoos and aquaria ; ecotourism ; control of invasive species ; AVP ; 3(a)(ii) any 2 of: areas of high biodiversity ; (important) nursery / breeding, area (for marine organisms) ; (important), habitat / feeding, areas for marine organisms / endangered species; protect coast from erosion / storm damage / dissipate wave energy ; areas of high oxygen production (from photosynthesis) ; idea of coastal areas provide food / resources for humans or more likely to be disturbed by humans ; they act as carbon sinks ; 2 Question Answer Marks 3(b) any 4 of: too many countries involved in fishing regulations / cannot agree on conservation / regulations / regulations, difficult / expensive, to enforce / monitor ; fishing methods / bottom-trawling / dredging, damage seabed ; disturbing sediment / increases turbidity / releases toxins ; destroying habitat / nursery areas / feeding areas, (for marine organisms ; bottom-trawling increases by-catch ; idea of overfishing inside MPAs / more fishing inside MPAs than non-protected areas ; (disturbance) causes marine organisms to migrate outside MPAs ; 4
Q4 · Sandeels in the North Sea are an important food source for many predators including fish…
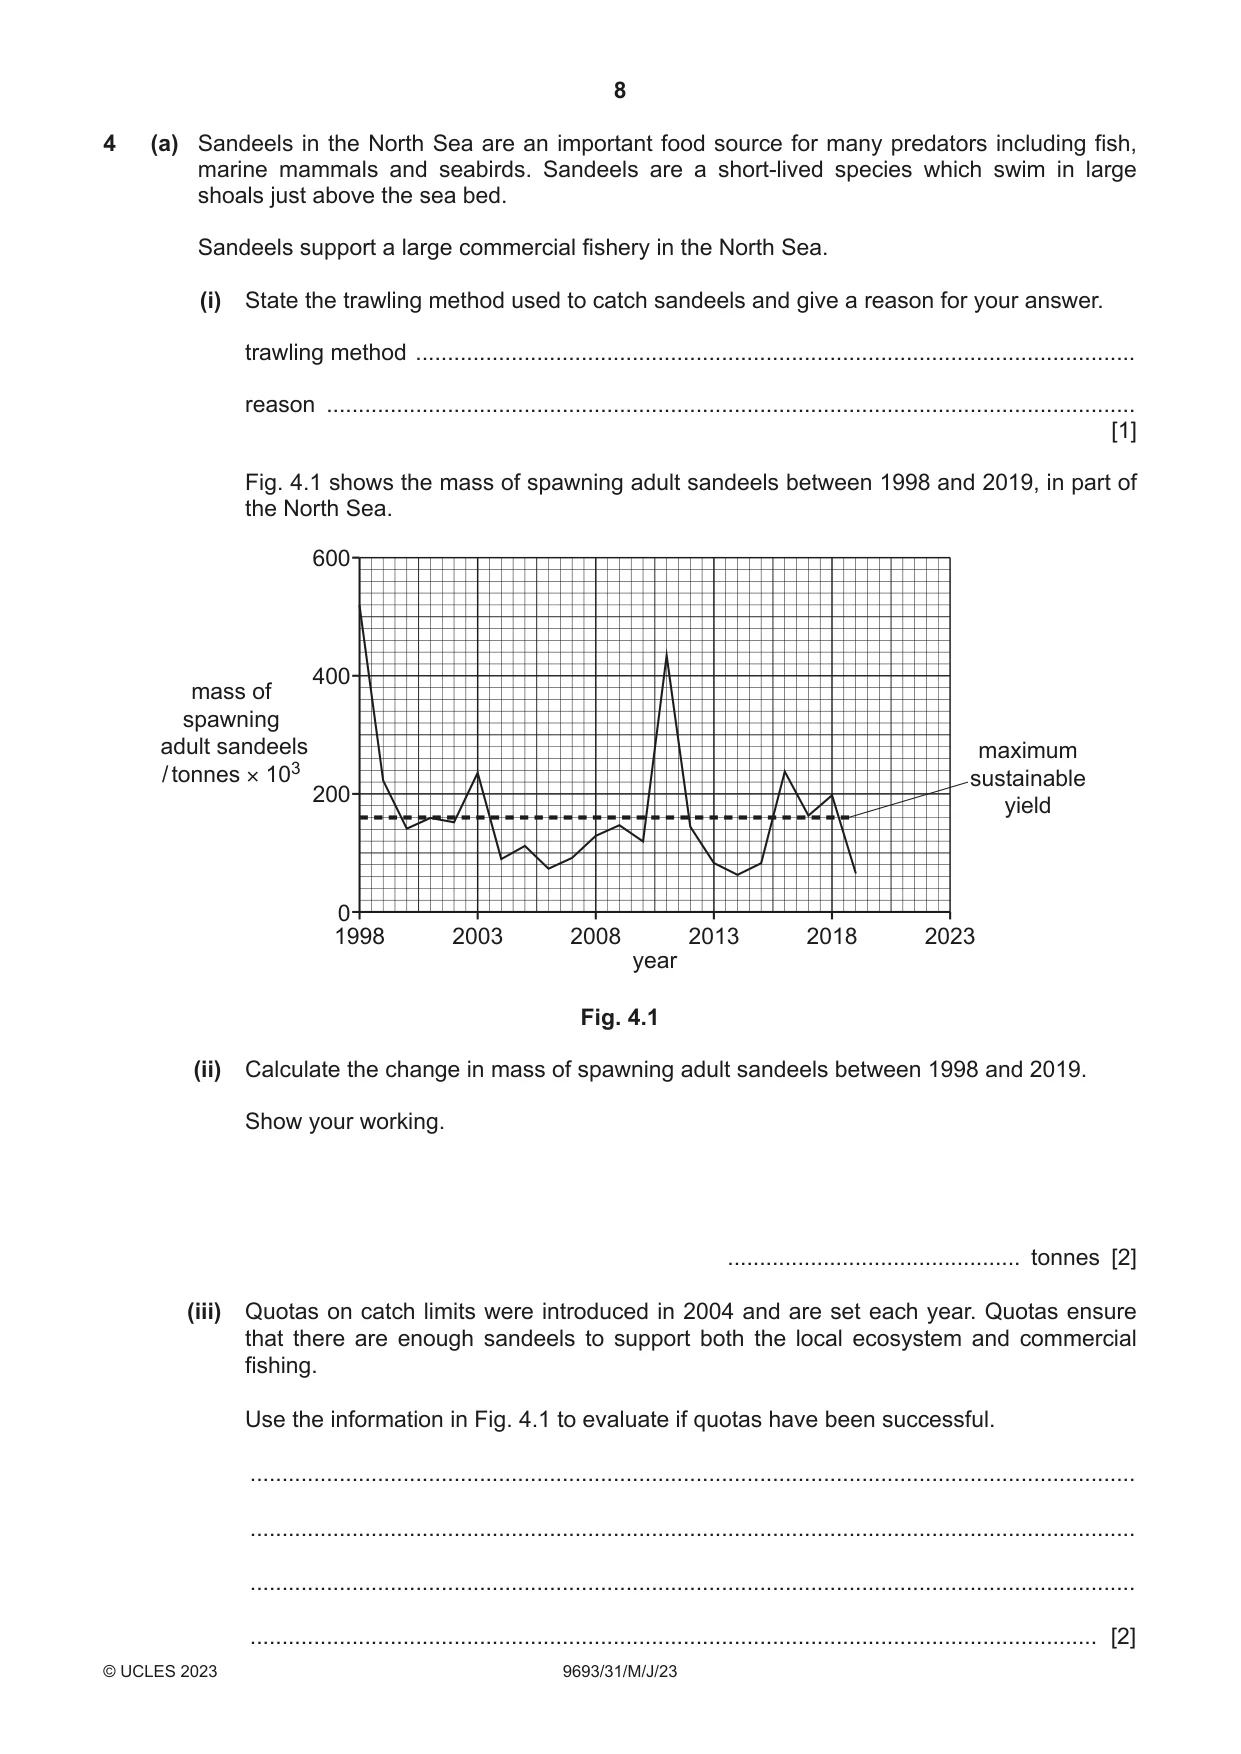
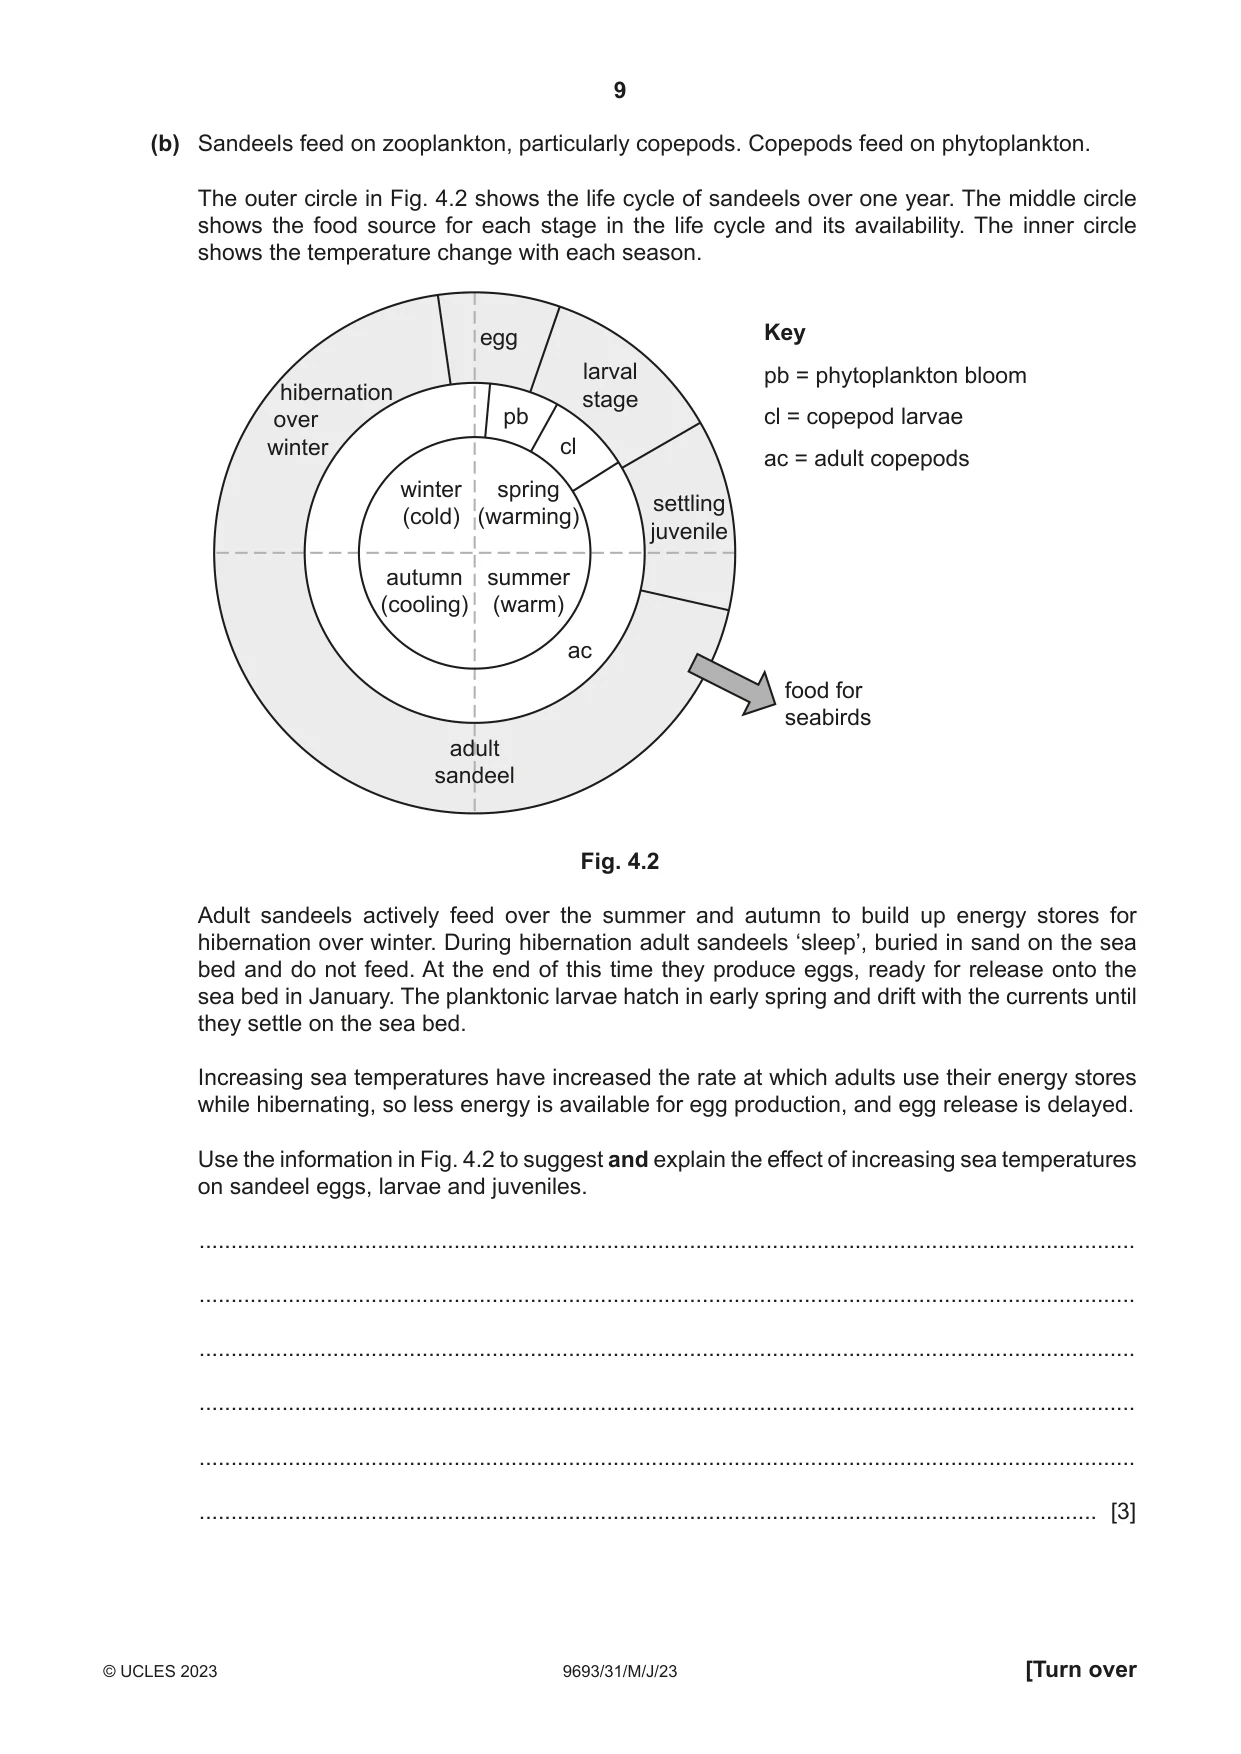
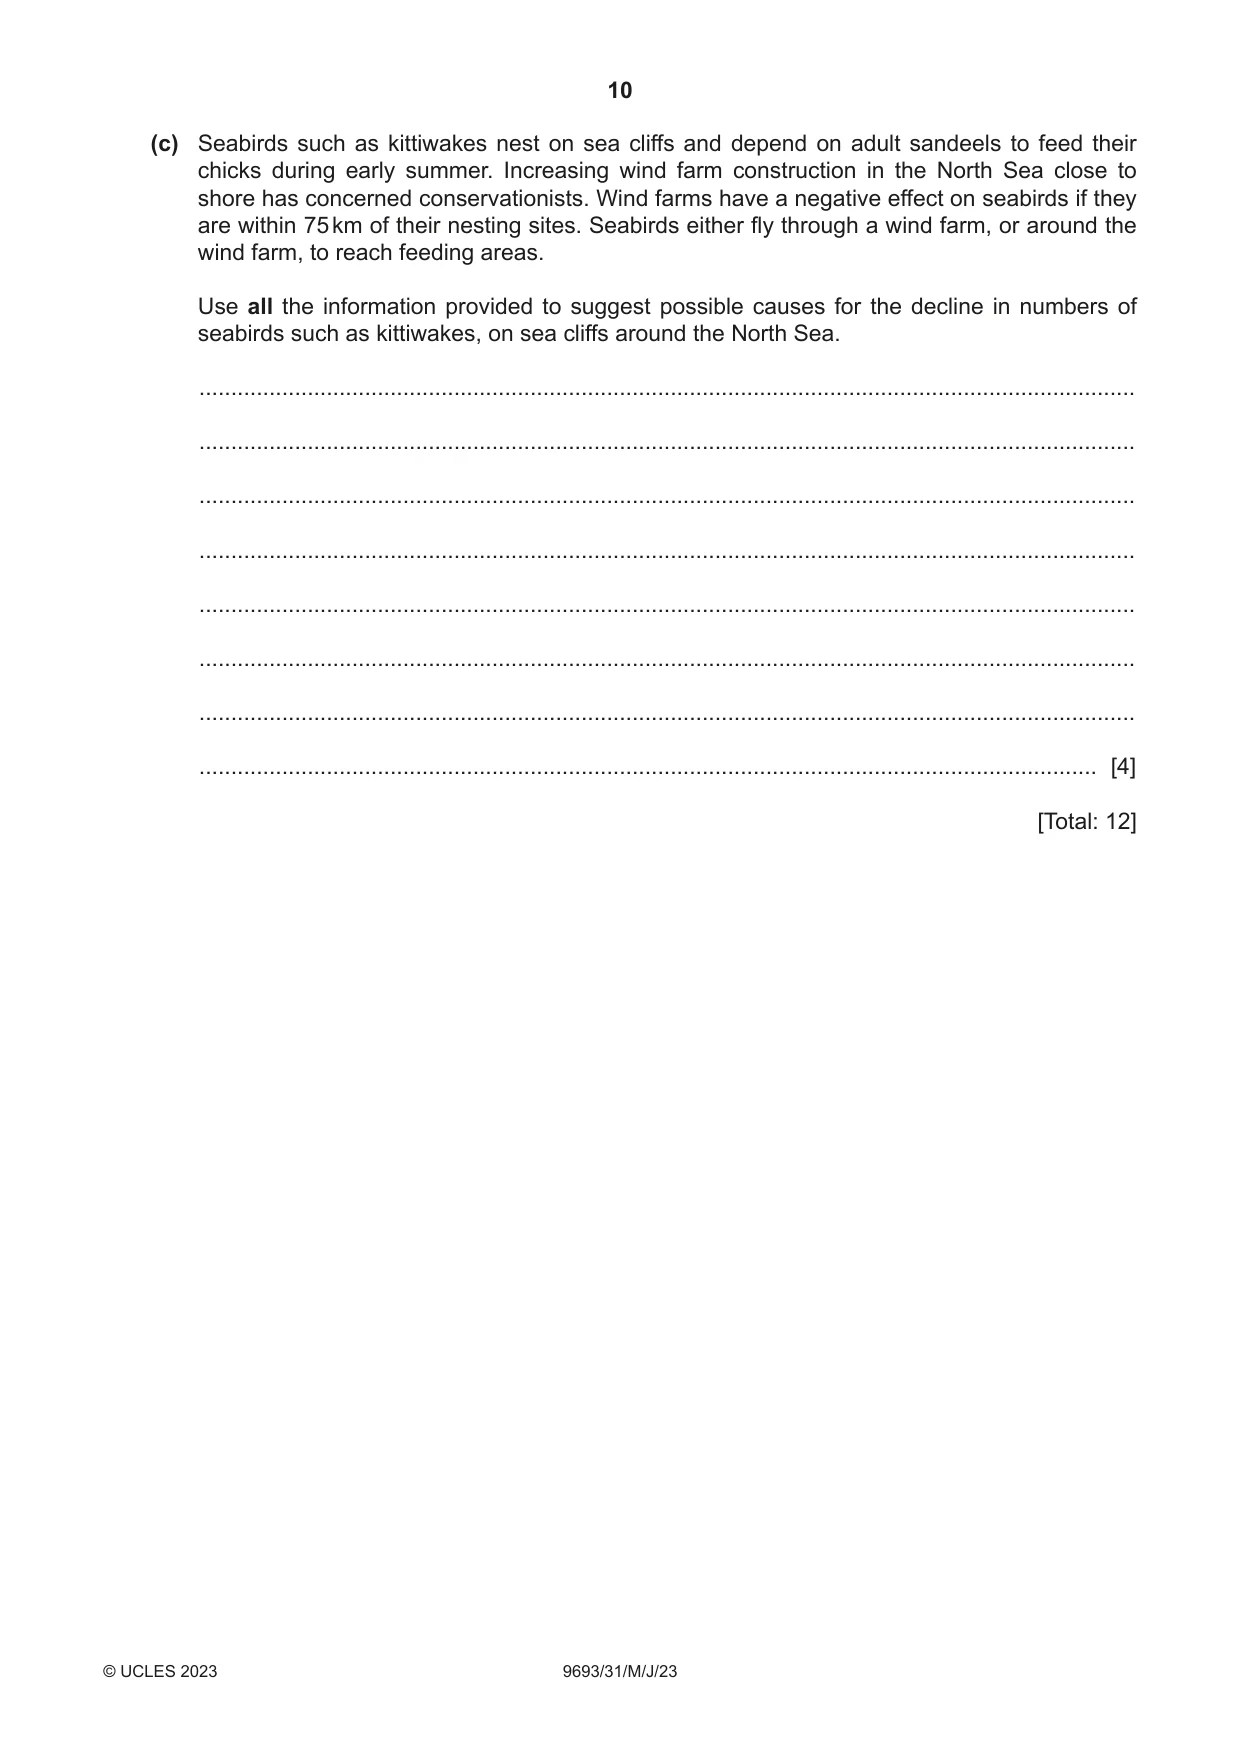
4 (a) Sandeels in the North Sea are an important food source for many predators including fish, marine mammals and seabirds. Sandeels are a short-lived species which swim in large shoals just above the sea bed. Sandeels support a large commercial fishery in the North Sea. (i) State the trawling method used to catch sandeels and give a reason for your answer. trawling method ................................................................................................................. reason ............................................................................................................................... [1] Fig. 4.1 shows the mass of spawning adult sandeels between 1998 and 2019, in part of the North Sea. 600 400 mass of spawning adult sandeels maximum / tonnes × 103 sustainable 200 yield 0 1998 2003 2008 2013 2018 2023 year Fig. 4.1 (ii) Calculate the change in mass of spawning adult sandeels between 1998 and 2019. Show your working. .............................................. tonnes [2] (iii) Quotas on catch limits were introduced in 2004 and are set each year. Quotas ensure that there are enough sandeels to support both the local ecosystem and commercial fishing. Use the information in Fig. 4.1 to evaluate if quotas have been successful. ........................................................................................................................................... ........................................................................................................................................... ........................................................................................................................................... ..................................................................................................................................... [2] (b) Sandeels feed on zooplankton, particularly copepods. Copepods feed on phytoplankton. The outer circle in Fig. 4.2 shows the life cycle of sandeels over one year. The middle circle shows the food source for each stage in the life cycle and its availability. The inner circle shows the temperature change with each season. egg Key larval pb = phytoplankton bloom hibernation stage over pb cl = copepod larvae winter cl ac = adult copepods winter spring settling (cold) (warming) juvenile autumn summer (cooling) (warm) ac food for seabirds adult sandeel Fig. 4.2 Adult sandeels actively feed over the summer and autumn to build up energy stores for hibernation over winter. During hibernation adult sandeels ‘sleep’, buried in sand on the sea bed and do not feed. At the end of this time they produce eggs, ready for release onto the sea bed in January. The planktonic larvae hatch in early spring and drift with the currents until they settle on the sea bed. Increasing sea temperatures have increased the rate at which adults use their energy stores while hibernating, so less energy is available for egg production, and egg release is delayed. Use the information in Fig. 4.2 to suggest and explain the effect of increasing sea temperatures on sandeel eggs, larvae and juveniles. ................................................................................................................................................... ................................................................................................................................................... ................................................................................................................................................... ................................................................................................................................................... ................................................................................................................................................... ............................................................................................................................................. [3] (c) Seabirds such as kittiwakes nest on sea cliffs and depend on adult sandeels to feed their chicks during early summer. Increasing wind farm construction in the North Sea close to shore has concerned conservationists. Wind farms have a negative effect on seabirds if they are within 75 km of their nesting sites. Seabirds either fly through a wind farm, or around the wind farm, to reach feeding areas. Use all the information provided to suggest possible causes for the decline in numbers of seabirds such as kittiwakes, on sea cliffs around the North Sea. ................................................................................................................................................... ................................................................................................................................................... ................................................................................................................................................... ................................................................................................................................................... ................................................................................................................................................... ................................................................................................................................................... ................................................................................................................................................... ............................................................................................................................................. [4] [Total: 12]
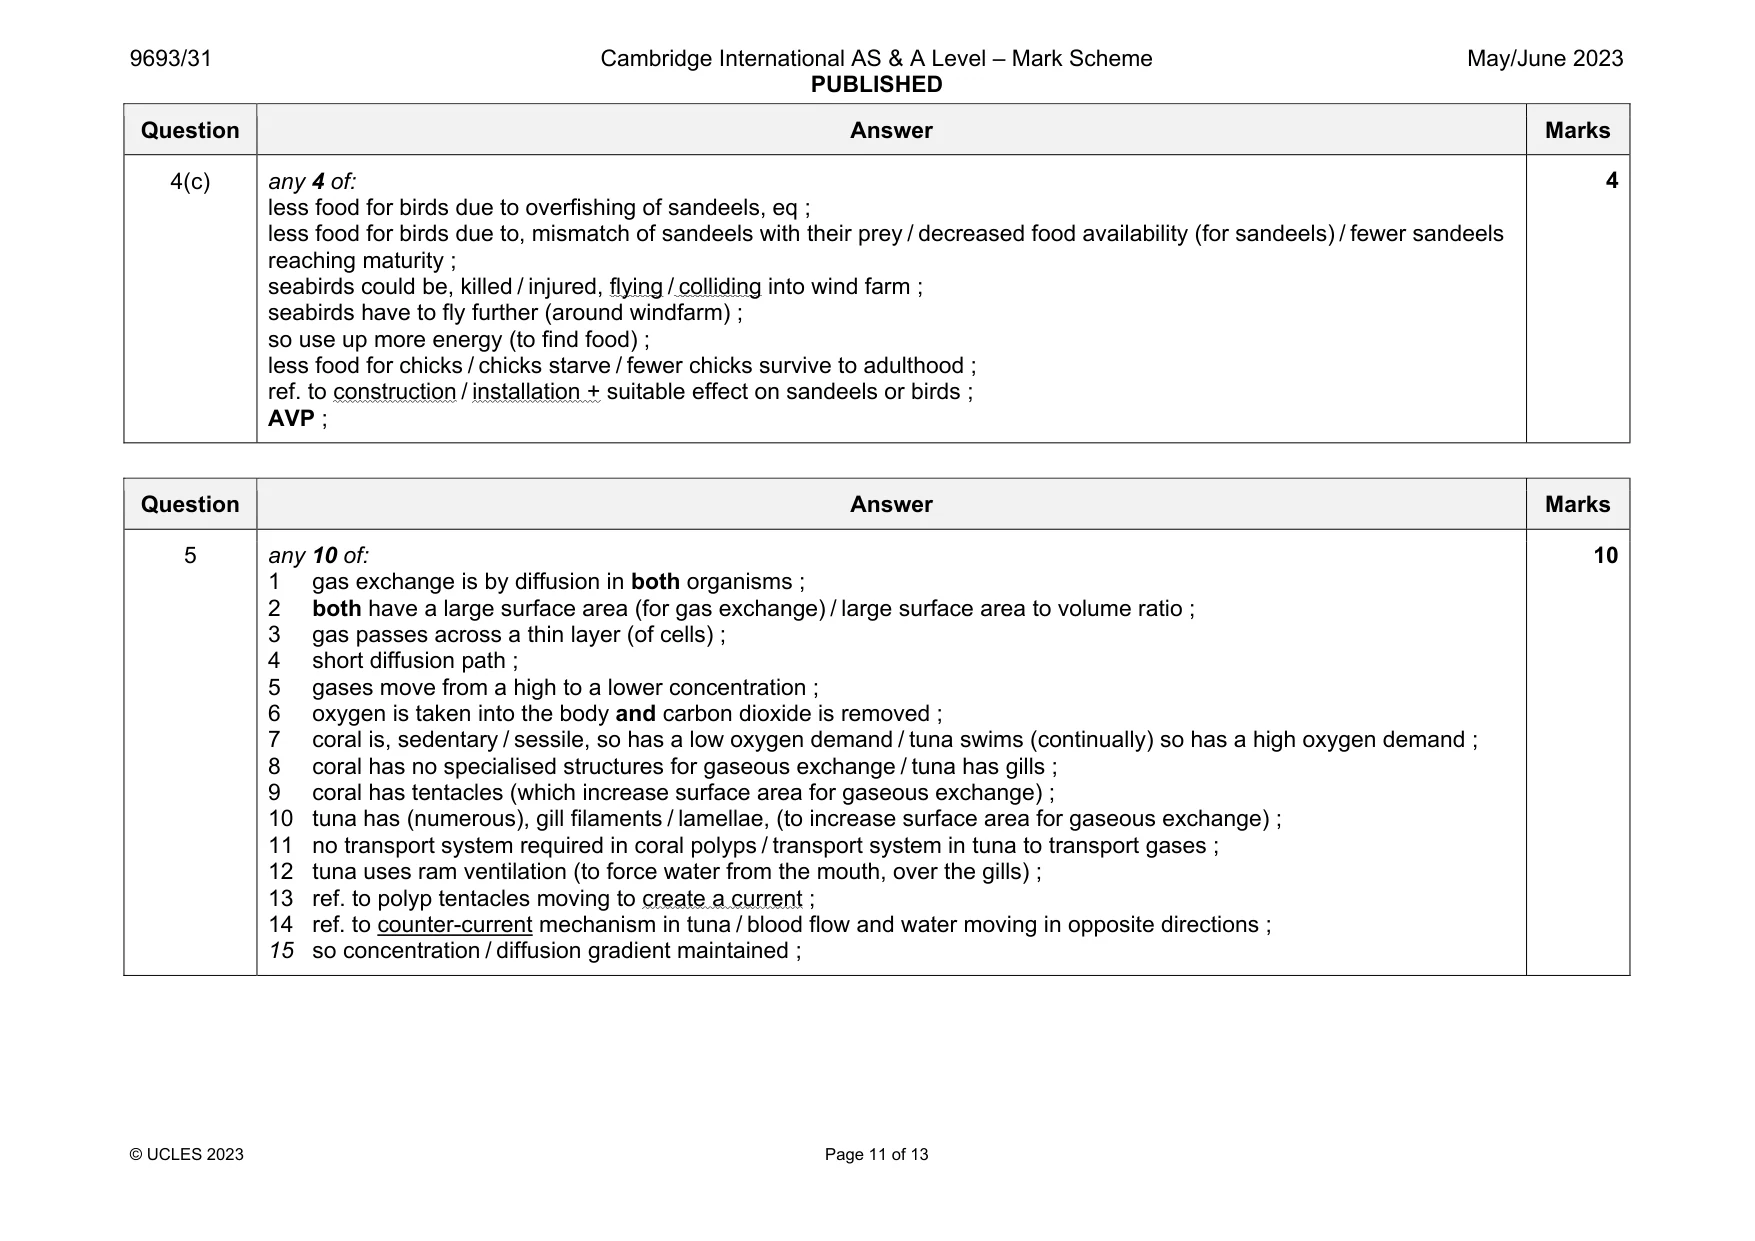
Mark scheme: 4(a)(i) benthic (trawling) AND as sandeels swim just above sea bed ; 1 4(a)(ii) 1998 = 520 000 2019 = 65 000 ; (change is,) 455 000 (tonnes) decrease / – 455 000 ; 2 4(a)(iii) (idea of) no, as numbers have fluctuated ; correct reference to (sometimes) below maximum sustainable yield ; 2 4(b) any 3 of: fewer eggs are produced / released ; phytoplankton bloom is over (before eggs hatch) ; less, copepod larvae / food, present for sandeel larvae to feed on ; so less growth of sandeel larvae ; fewer juveniles, survive / settle, to become adults / less recruitment ; 3 Question Answer Marks 4(c) any 4 of: less food for birds due to overfishing of sandeels, eq ; less food for birds due to, mismatch of sandeels with their prey / decreased food availability (for sandeels) / fewer sandeels reaching maturity ; seabirds could be, killed / injured, flying / colliding into wind farm ; seabirds have to fly further (around windfarm) ; so use up more energy (to find food) ; less food for chicks / chicks starve / fewer chicks survive to adulthood ; ref. to construction / installation + suitable effect on sandeels or birds ; AVP ; 4
Q5 · Compare gaseous exchange in coral polyps and in tuna
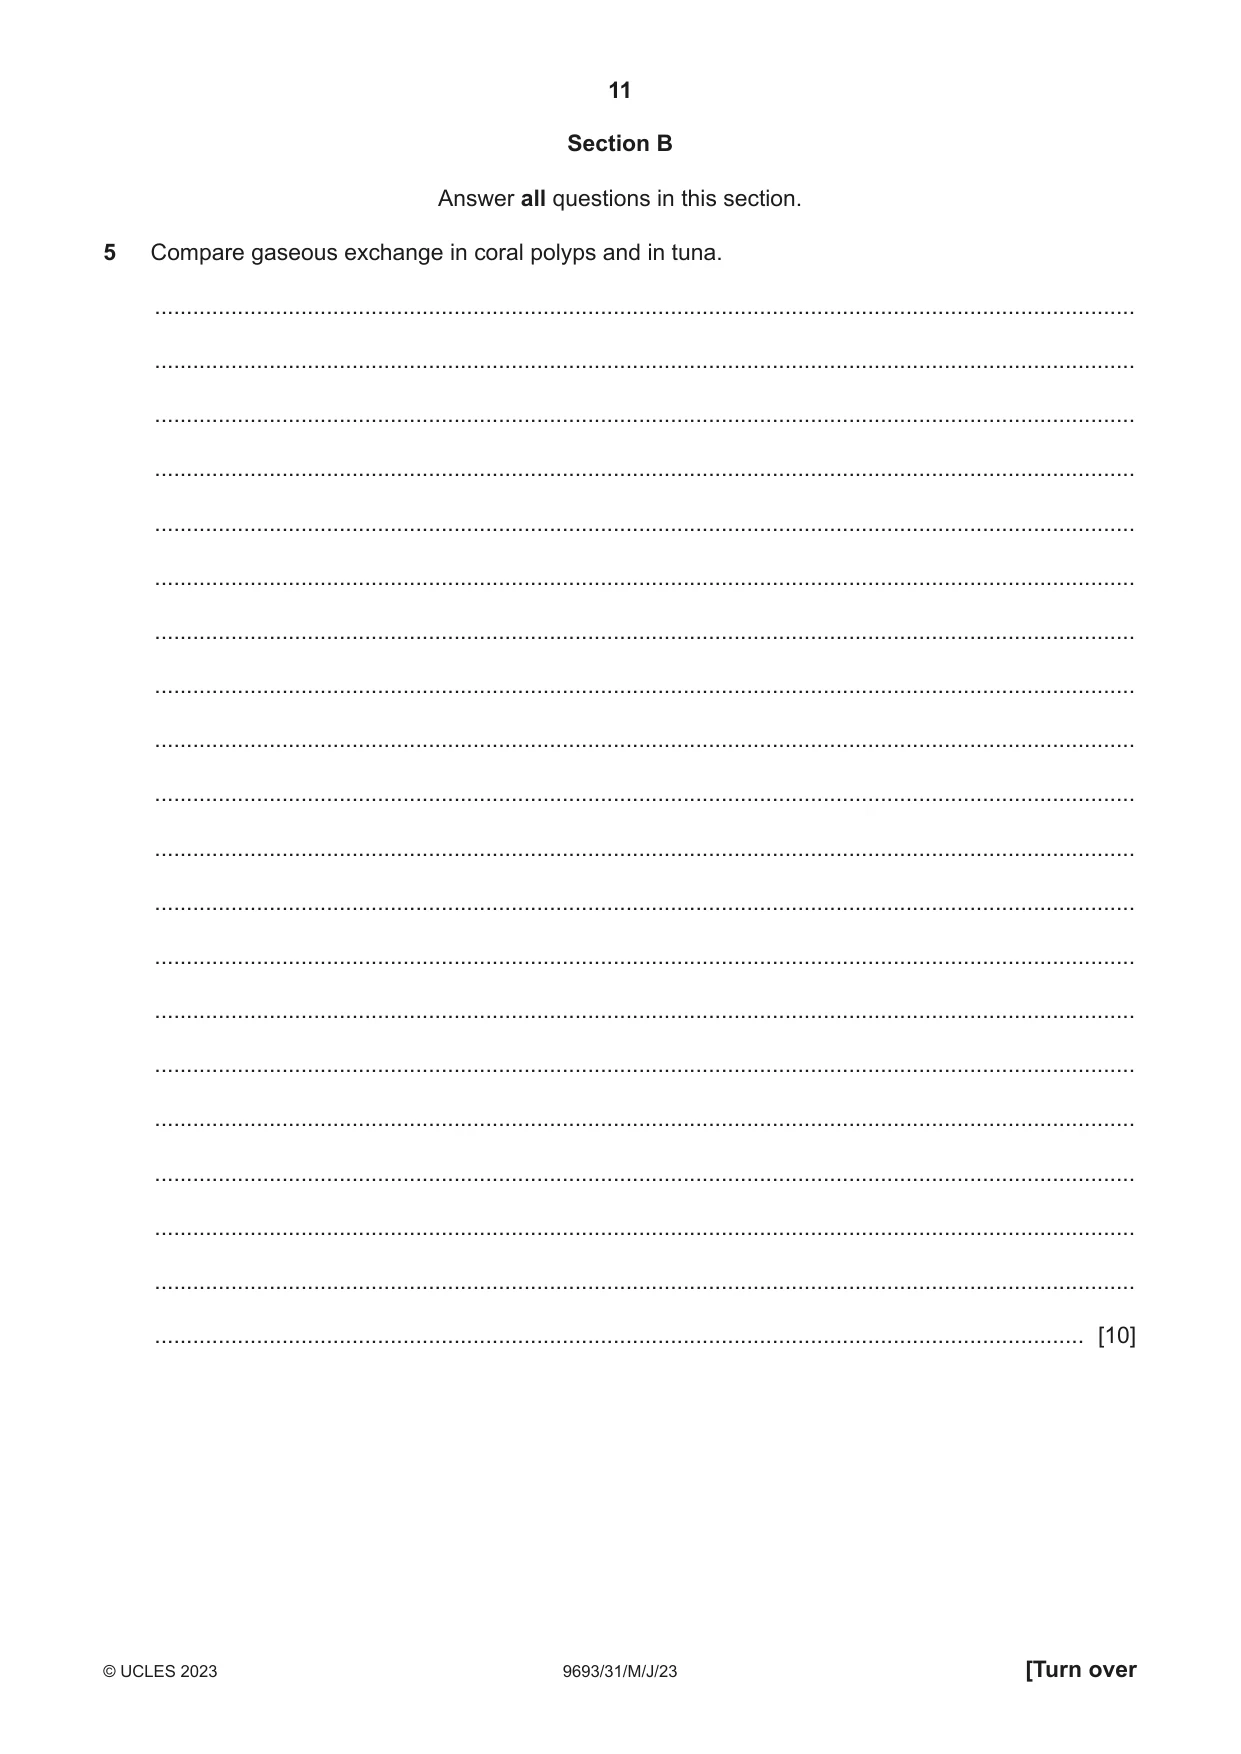
5 Compare gaseous exchange in coral polyps and in tuna. .......................................................................................................................................................... .......................................................................................................................................................... .......................................................................................................................................................... .......................................................................................................................................................... .......................................................................................................................................................... .......................................................................................................................................................... .......................................................................................................................................................... .......................................................................................................................................................... .......................................................................................................................................................... .......................................................................................................................................................... .......................................................................................................................................................... .......................................................................................................................................................... .......................................................................................................................................................... .......................................................................................................................................................... .......................................................................................................................................................... .......................................................................................................................................................... .......................................................................................................................................................... .......................................................................................................................................................... .......................................................................................................................................................... .................................................................................................................................................. [10]
Mark scheme: 5 any 10 of: 1 gas exchange is by diffusion in both organisms ; 2 both have a large surface area (for gas exchange) / large surface area to volume ratio ; 3 gas passes across a thin layer (of cells) ; 4 short diffusion path ; 5 gases move from a high to a lower concentration ; 6 oxygen is taken into the body and carbon dioxide is removed ; 7 coral is, sedentary / sessile, so has a low oxygen demand / tuna swims (continually) so has a high oxygen demand ; 8 coral has no specialised structures for gaseous exchange / tuna has gills ; 9 coral has tentacles (which increase surface area for gaseous exchange) ; 10 tuna has (numerous), gill filaments / lamellae, (to increase surface area for gaseous exchange) ; 11 no transport system required in coral polyps / transport system in tuna to transport gases ; 12 tuna uses ram ventilation (to force water from the mouth, over the gills) ; 13 ref. to polyp tentacles moving to create a current ; 14 ref. to counter-current mechanism in tuna / blood flow and water moving in opposite directions ; 15 so concentration / diffusion gradient maintained ;
Q6 · Describe how ocean currents form
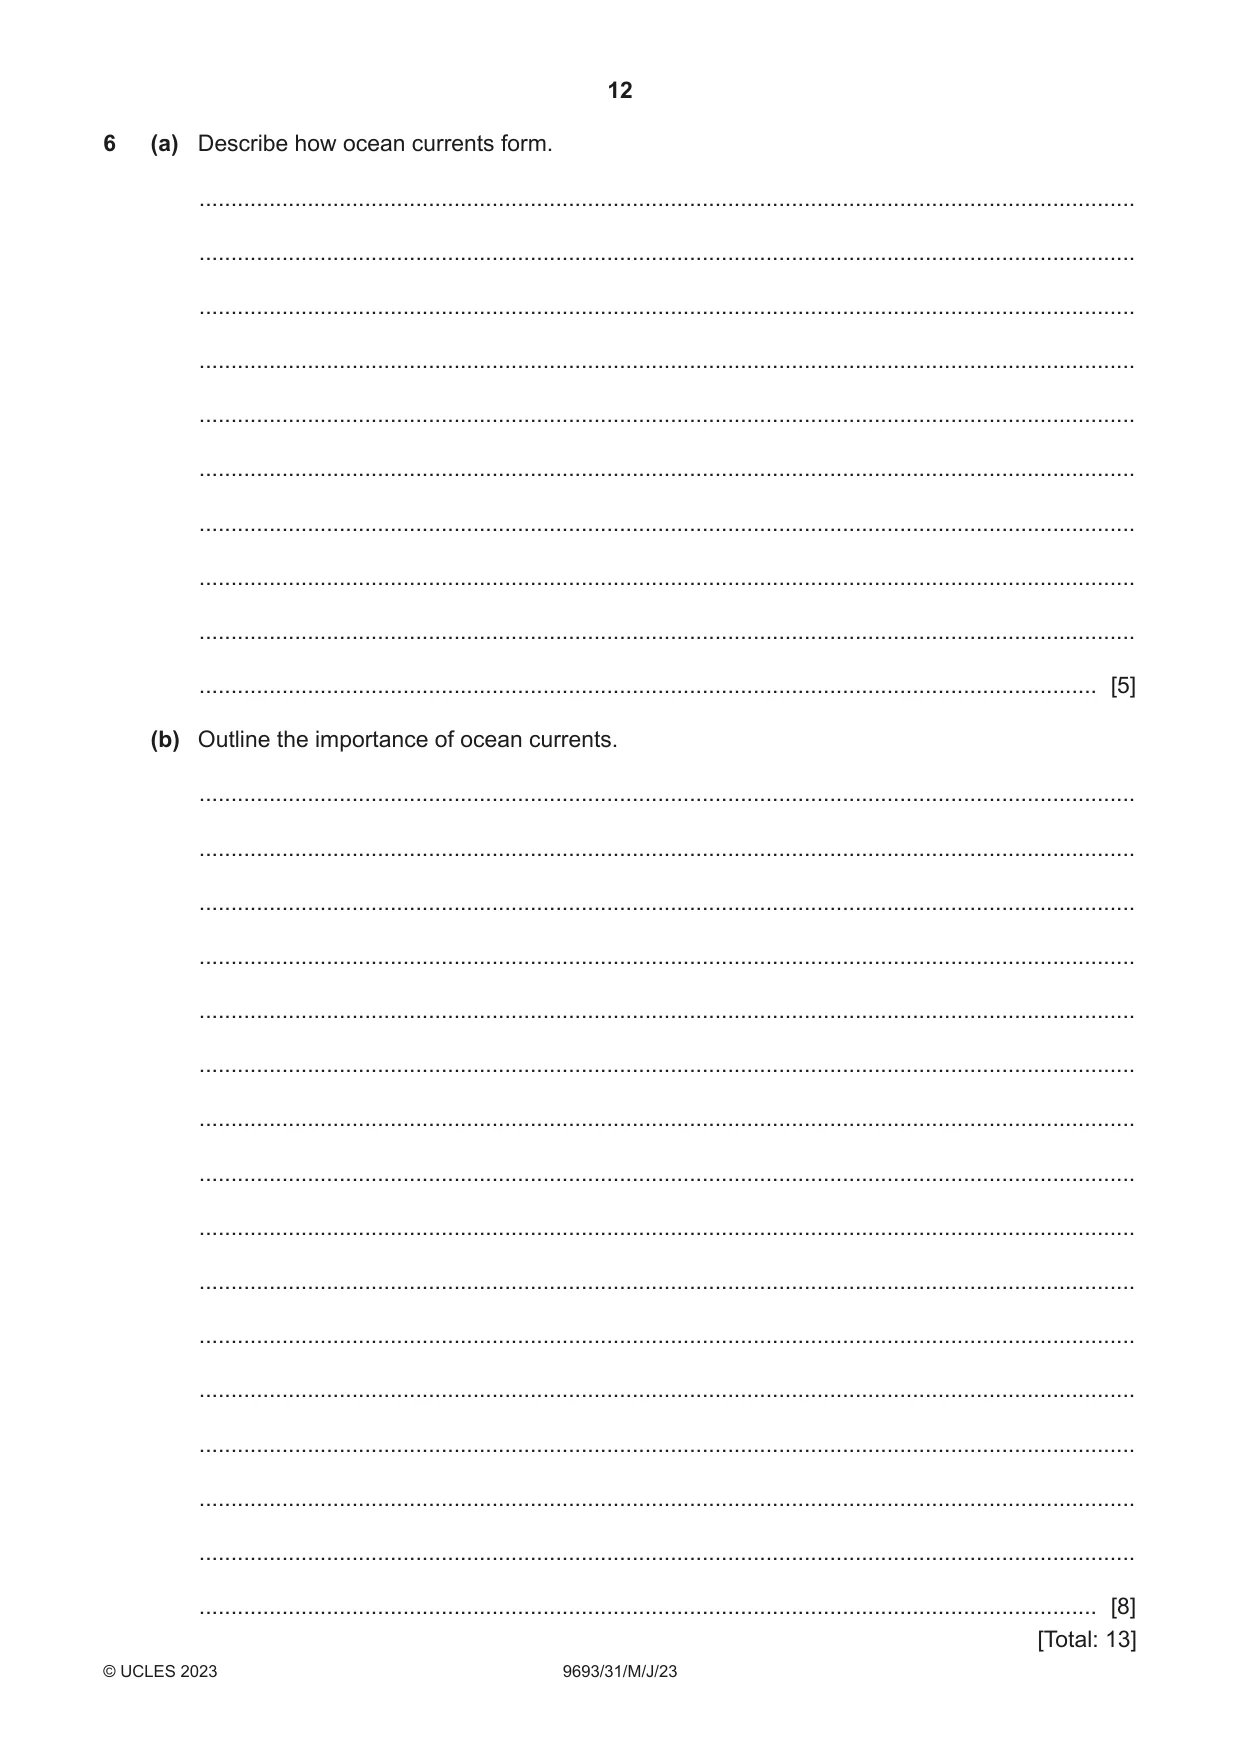
6 (a) Describe how ocean currents form. ................................................................................................................................................... ................................................................................................................................................... ................................................................................................................................................... ................................................................................................................................................... ................................................................................................................................................... ................................................................................................................................................... ................................................................................................................................................... ................................................................................................................................................... ................................................................................................................................................... ............................................................................................................................................. [5] (b) Outline the importance of ocean currents. ................................................................................................................................................... ................................................................................................................................................... ................................................................................................................................................... ................................................................................................................................................... ................................................................................................................................................... ................................................................................................................................................... ................................................................................................................................................... ................................................................................................................................................... ................................................................................................................................................... ................................................................................................................................................... ................................................................................................................................................... ................................................................................................................................................... ................................................................................................................................................... ................................................................................................................................................... ................................................................................................................................................... ............................................................................................................................................. [8] [Total: 13]
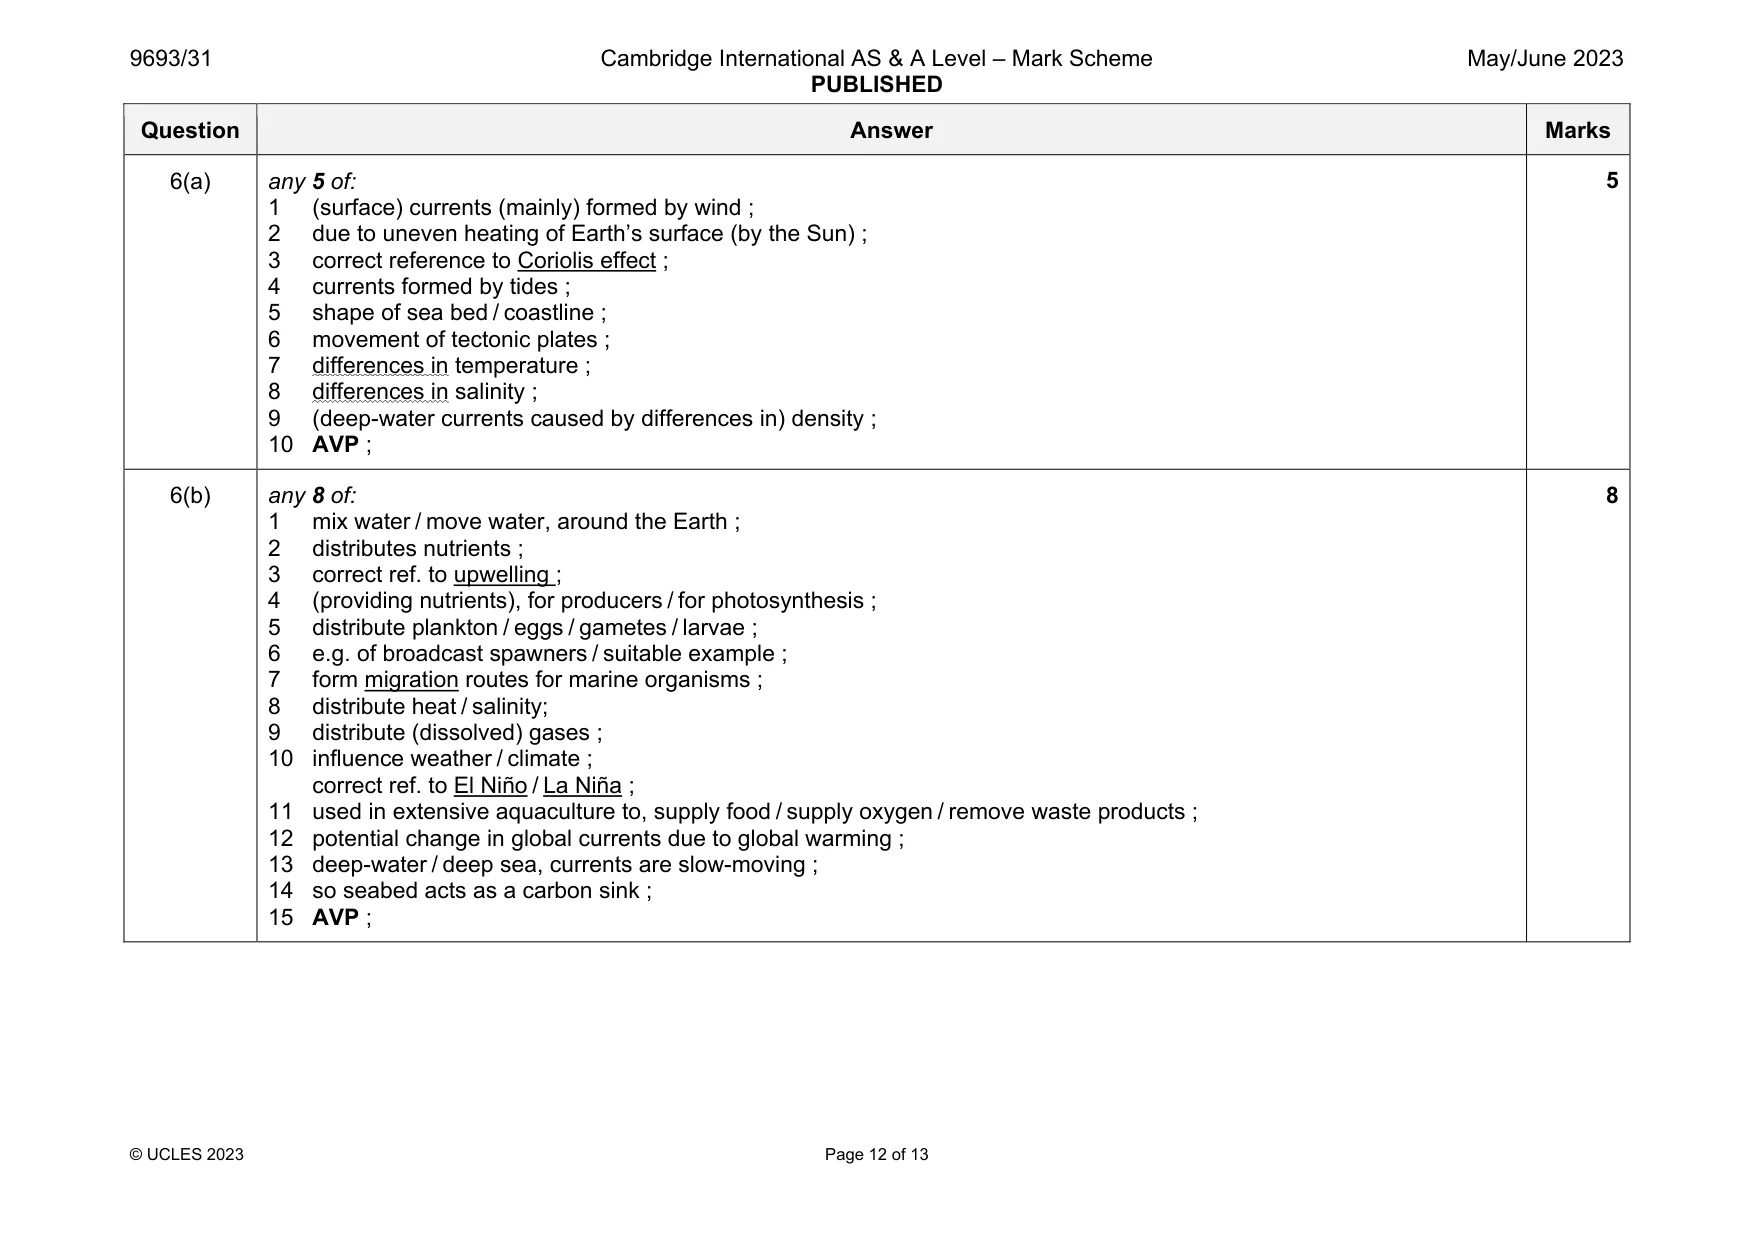
Mark scheme: 6(a) any 5 of: 1 (surface) currents (mainly) formed by wind ; 2 due to uneven heating of Earth’s surface (by the Sun) ; 3 correct reference to Coriolis effect ; 4 currents formed by tides ; 5 shape of sea bed / coastline ; 6 movement of tectonic plates ; 7 differences in temperature ; 8 differences in salinity ; 9 (deep-water currents caused by differences in) density ; 10 AVP ; 6(b) any 8 of: 1 mix water / move water, around the Earth ; 2 distributes nutrients ; 3 correct ref. to upwelling ; 4 (providing nutrients), for producers / for photosynthesis ; 5 distribute plankton / eggs / gametes / larvae ; 6 e.g. of broadcast spawners / suitable example ; 7 form migration routes for marine organisms ; 8 distribute heat / salinity; 9 distribute (dissolved) gases ; 10 influence weather / climate ; correct ref. to El Niño / La Niña ; 11 used in extensive aquaculture to, supply food / supply oxygen / remove waste products ; 12 potential change in global currents due to global warming ; 13 deep-water / deep sea, currents are slow-moving ; 14 so seabed acts as a carbon sink ; 15 AVP ; 8
Q7 · Describe how ions such as sodium pass through the cell membrane
7 Describe how ions such as sodium pass through the cell membrane. .......................................................................................................................................................... .......................................................................................................................................................... .......................................................................................................................................................... .......................................................................................................................................................... .......................................................................................................................................................... .......................................................................................................................................................... .......................................................................................................................................................... .......................................................................................................................................................... .......................................................................................................................................................... .......................................................................................................................................................... .......................................................................................................................................................... .......................................................................................................................................................... .......................................................................................................................................................... .................................................................................................................................................... [7]
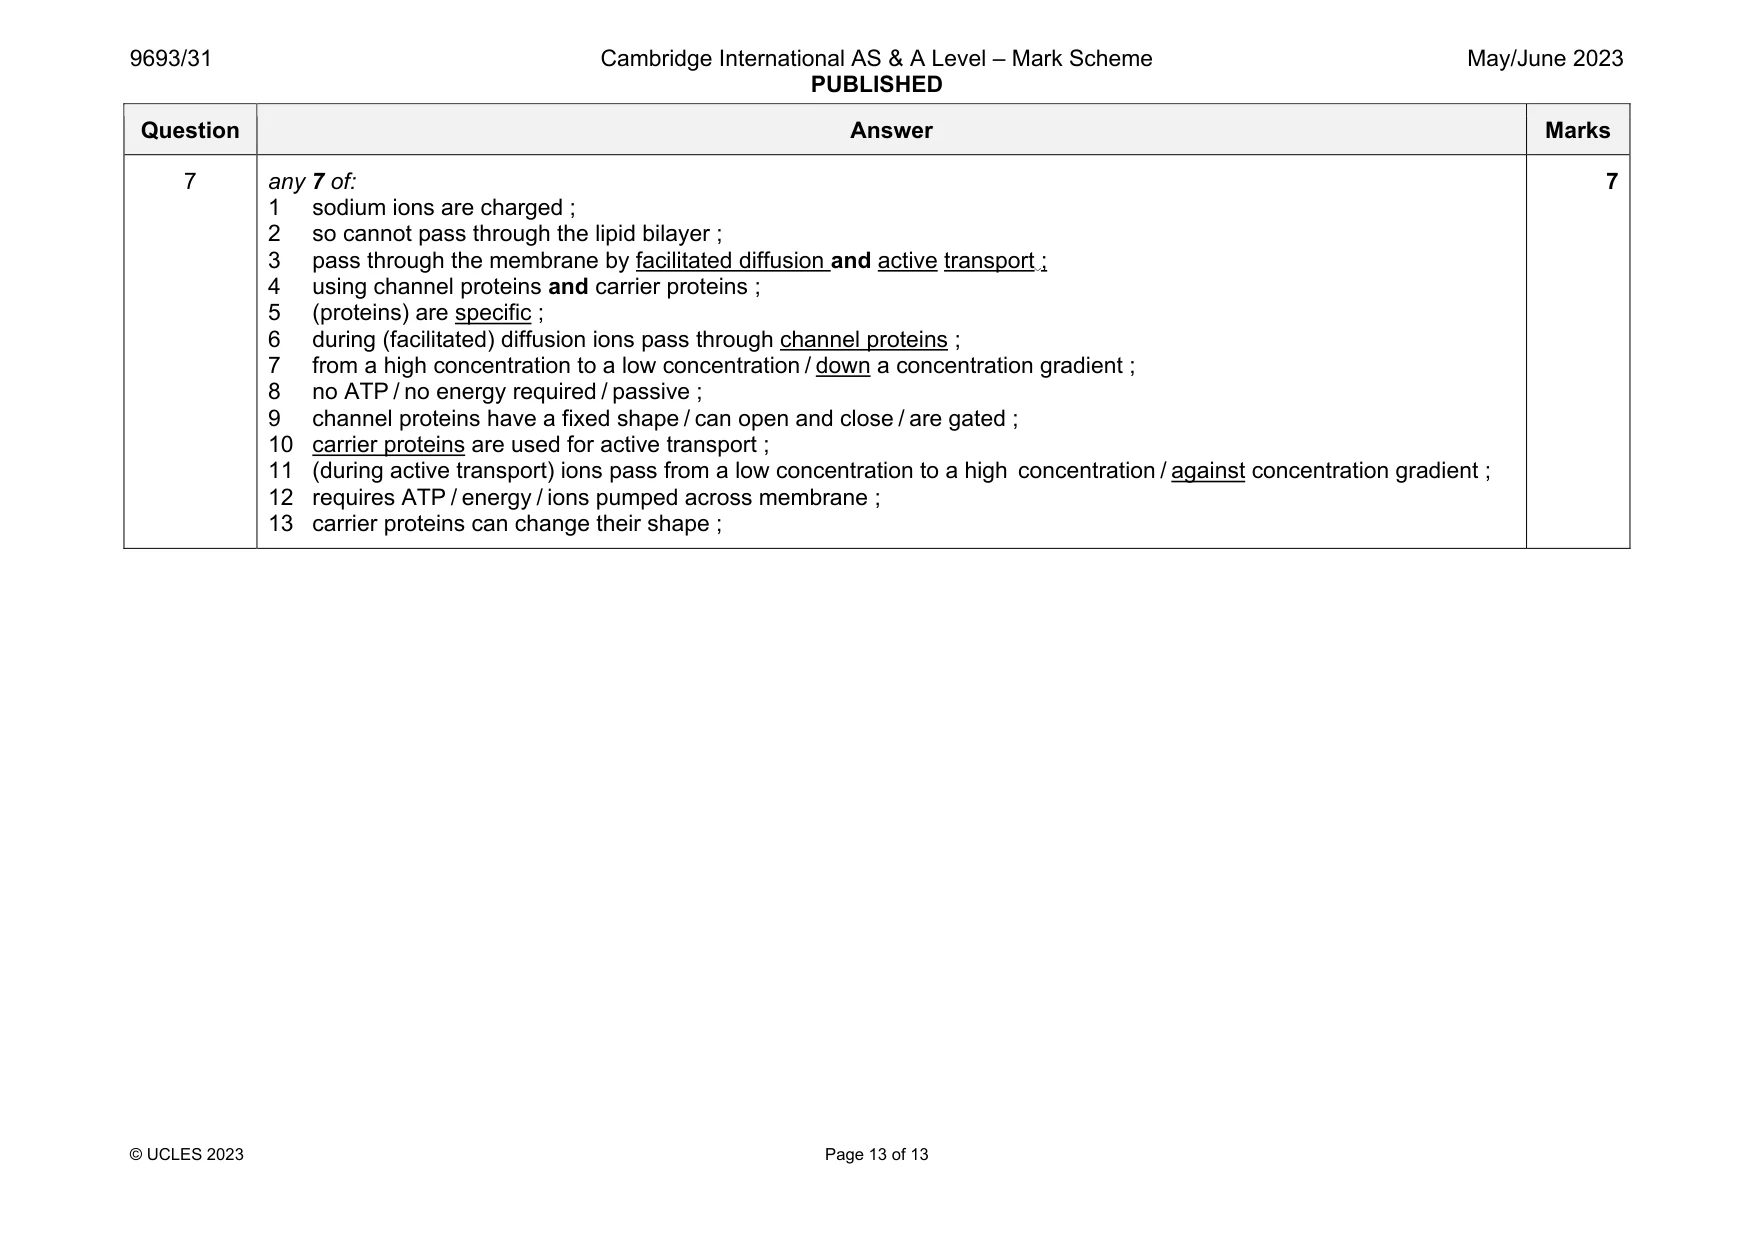
Mark scheme: 7 any 7 of: 1 sodium ions are charged ; 2 so cannot pass through the lipid bilayer ; 3 pass through the membrane by facilitated diffusion and active transport ; 4 using channel proteins and carrier proteins ; 5 (proteins) are specific ; 6 during (facilitated) diffusion ions pass through channel proteins ; 7 from a high concentration to a low concentration / down a concentration gradient ; 8 no ATP / no energy required / passive ; 9 channel proteins have a fixed shape / can open and close / are gated ; 10 carrier proteins are used for active transport ; 11 (during active transport) ions pass from a low concentration to a high concentration / against concentration gradient ; 12 requires ATP / energy / ions pumped across membrane ; 13 carrier proteins can change their shape ; 7
What was in this paper
The subtopics covered by these 7 questions, and how many questions each got. Open one in a new tab to see every Cambridge question on it.
What you needed in this session
Cambridge’s own grade thresholds for 2023 May/June, Paper 3 · Variant 1. A higher threshold means an easier paper — the bar moves with how the cohort did.