Cambridge A Level Marine Science 9693 — 2022 May/June Paper 3 · Variant 1
9693/31/M/J/22 · 7 questions · 75 marks · ≈84 min
The question paper and its mark scheme, free to read here and free to download. This is Cambridge’s own paper, exactly as it was sat.
Question paper16 pages

Mark scheme13 pages
Answers below. Sit the paper first if you are practising.
Questions as text
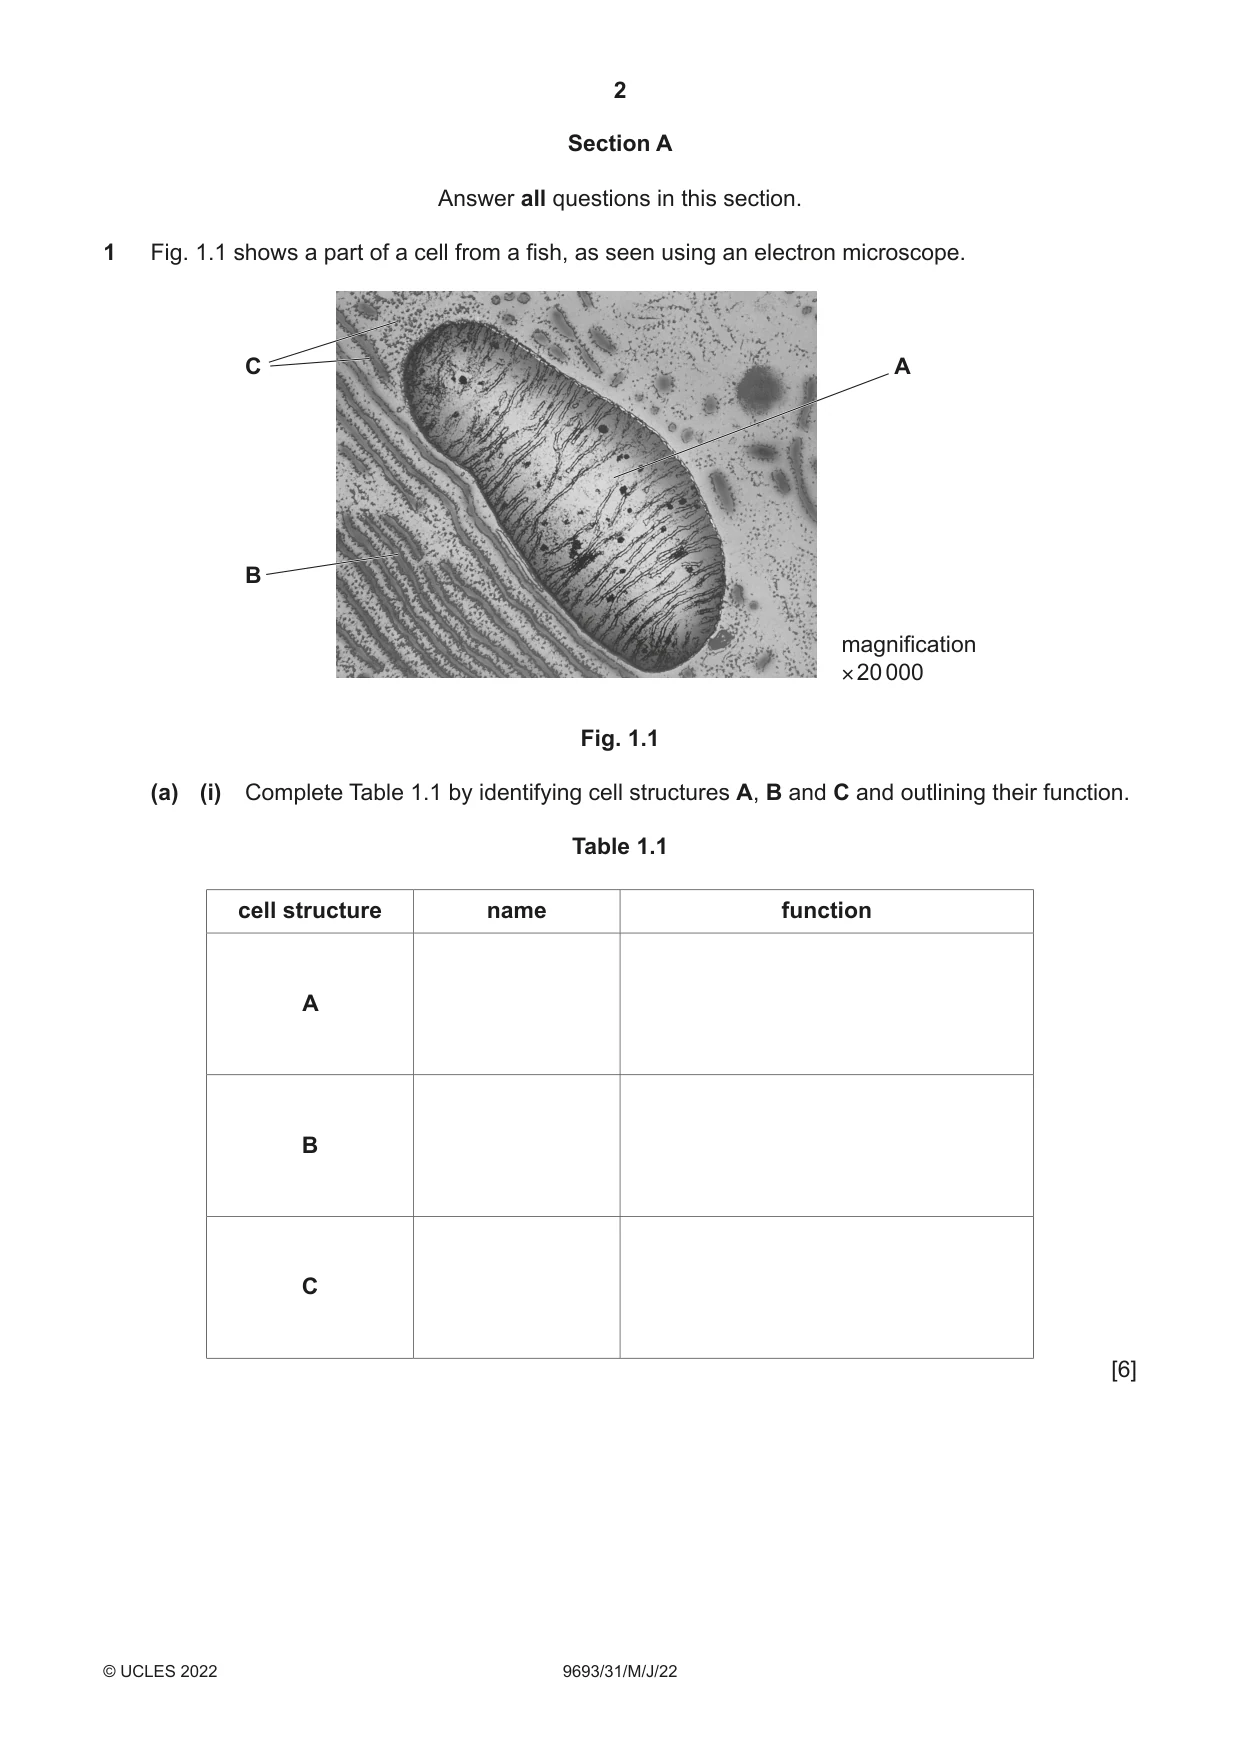
Q1 · A part of a cell from a fish, as seen using an electron microscope
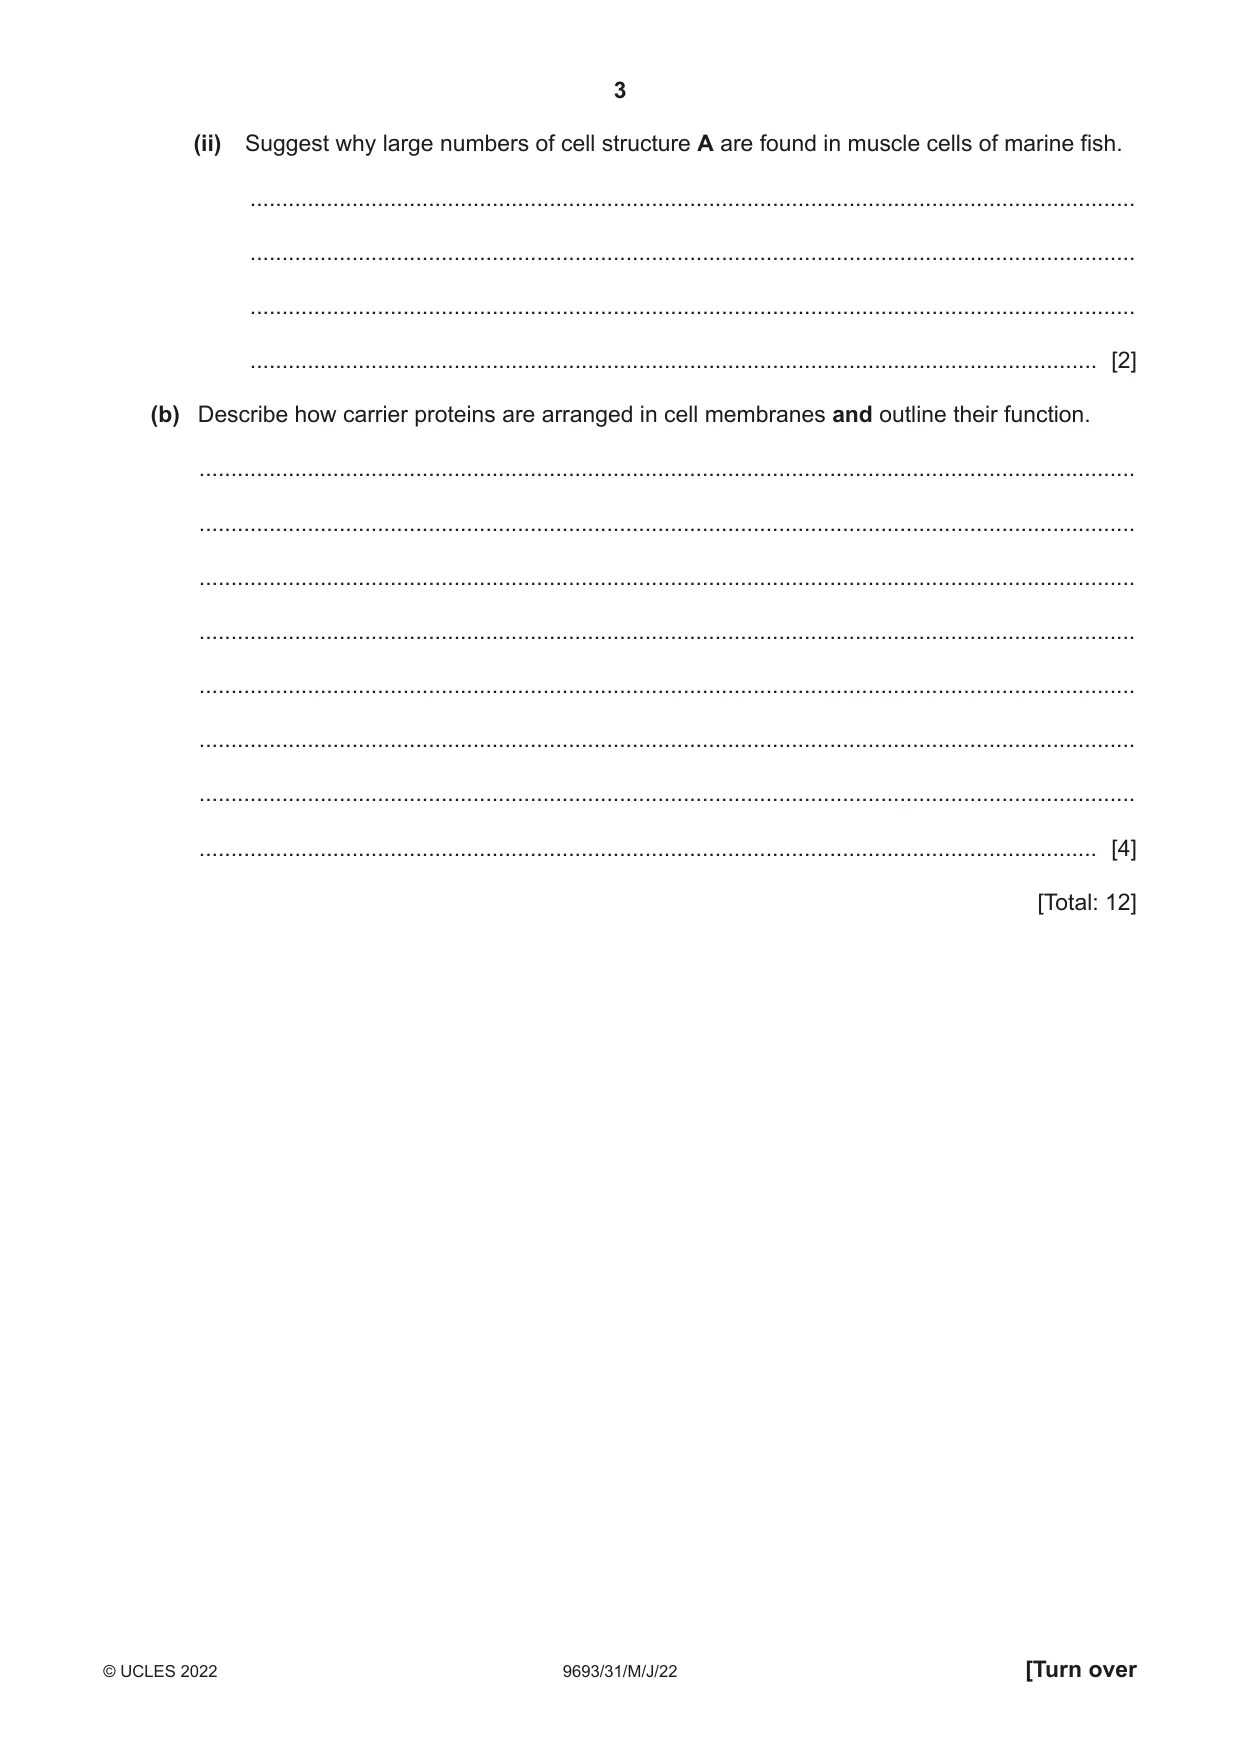
1 Fig. 1.1 shows a part of a cell from a fish, as seen using an electron microscope. C A B magnification × 20 000 Fig. 1.1 (a) (i) Complete Table 1.1 by identifying cell structures A, B and C and outlining their function. Table 1.1 cell structure name function A B C [6] (ii) Suggest why large numbers of cell structure A are found in muscle cells of marine fish. ........................................................................................................................................... ........................................................................................................................................... ........................................................................................................................................... ..................................................................................................................................... [2] (b) Describe how carrier proteins are arranged in cell membranes and outline their function. ................................................................................................................................................... ................................................................................................................................................... ................................................................................................................................................... ................................................................................................................................................... ................................................................................................................................................... ................................................................................................................................................... ................................................................................................................................................... ............................................................................................................................................. [4] [Total: 12]
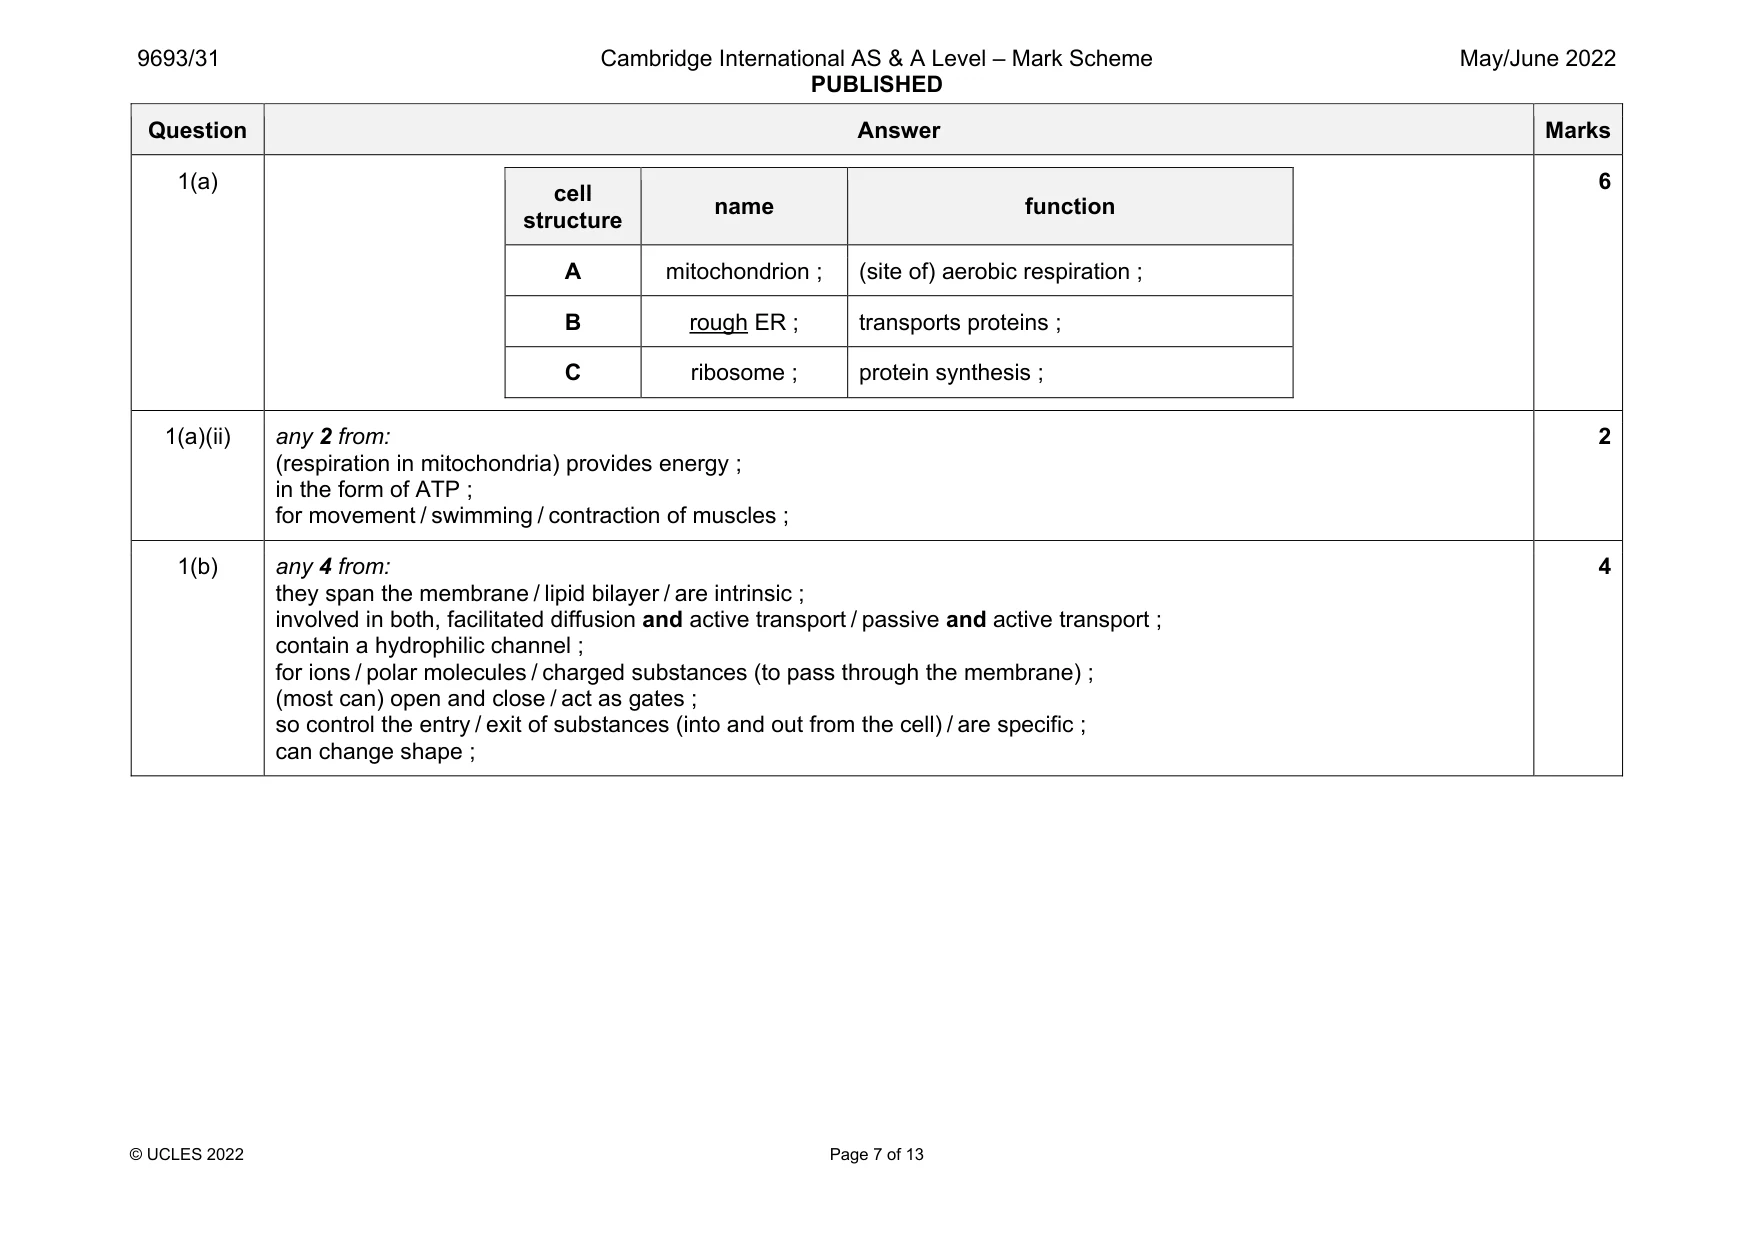
Mark scheme: 1(a) cell structure name function A mitochondrion ; (site of) aerobic respiration ; B rough ER ; transports proteins ; C ribosome ; protein synthesis ; 6 1(a)(ii) any 2 from: (respiration in mitochondria) provides energy ; in the form of ATP ; for movement / swimming / contraction of muscles ; 2 1(b) any 4 from: they span the membrane / lipid bilayer / are intrinsic ; involved in both, facilitated diffusion and active transport / passive and active transport ; contain a hydrophilic channel ; for ions / polar molecules / charged substances (to pass through the membrane) ; (most can) open and close / act as gates ; so control the entry / exit of substances (into and out from the cell) / are specific ; can change shape ; 4
Q2 · Almost all marine producers carry out photosynthesis
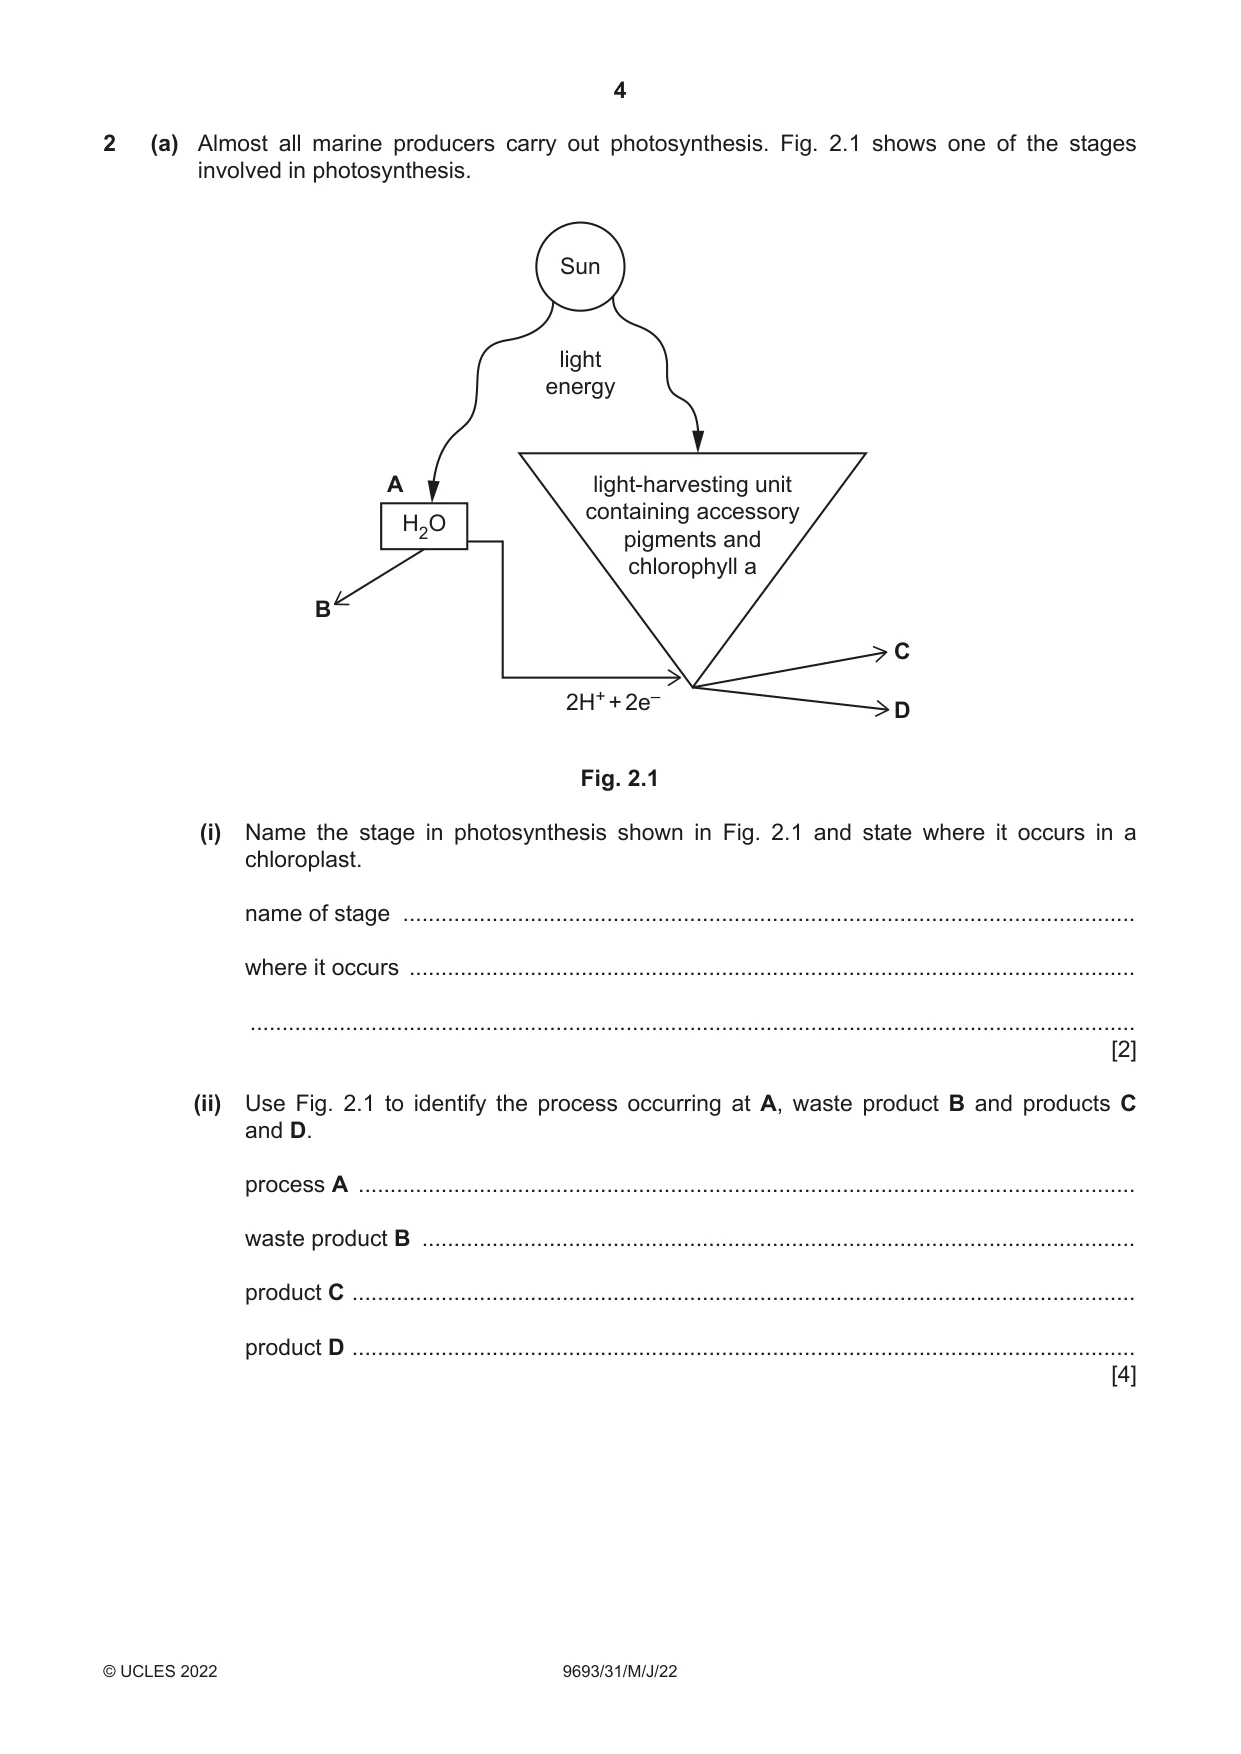
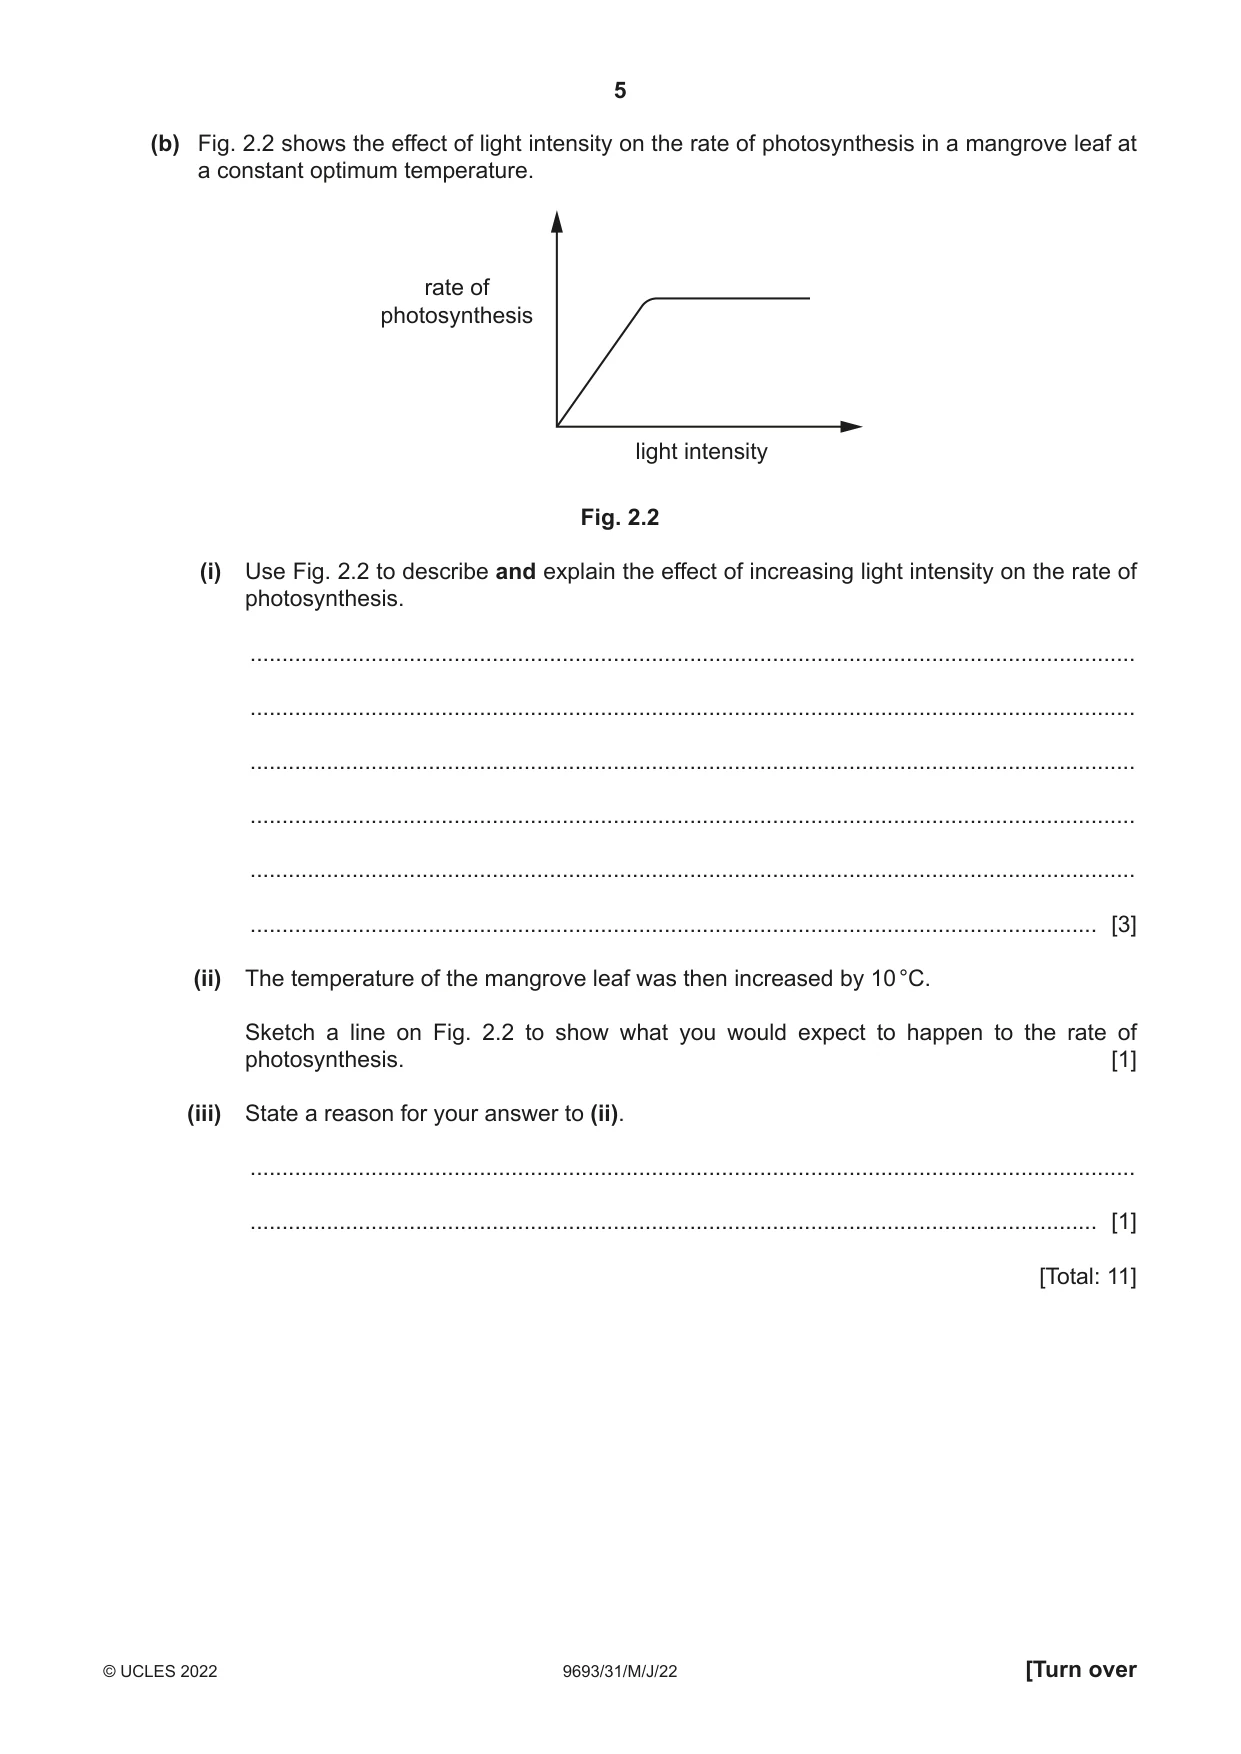
2 (a) Almost all marine producers carry out photosynthesis. Fig. 2.1 shows one of the stages involved in photosynthesis. Sun light energy A light-harvesting unit containing accessory H2O pigments and chlorophyll a B C 2H+ + 2e– D Fig. 2.1 (i) Name the stage in photosynthesis shown in Fig. 2.1 and state where it occurs in a chloroplast. name of stage ................................................................................................................... where it occurs .................................................................................................................. ........................................................................................................................................... [2] (ii) Use Fig. 2.1 to identify the process occurring at A, waste product B and products C and D. process A .......................................................................................................................... waste product B ................................................................................................................ product C ........................................................................................................................... product D ........................................................................................................................... [4] (b) Fig. 2.2 shows the effect of light intensity on the rate of photosynthesis in a mangrove leaf at a constant optimum temperature. rate of photosynthesis light intensity Fig. 2.2 (i) Use Fig. 2.2 to describe and explain the effect of increasing light intensity on the rate of photosynthesis. ........................................................................................................................................... ........................................................................................................................................... ........................................................................................................................................... ........................................................................................................................................... ........................................................................................................................................... ..................................................................................................................................... [3] (ii) The temperature of the mangrove leaf was then increased by 10 °C. Sketch a line on Fig. 2.2 to show what you would expect to happen to the rate of photosynthesis. [1] (iii) State a reason for your answer to (ii). ........................................................................................................................................... ..................................................................................................................................... [1] [Total: 11]
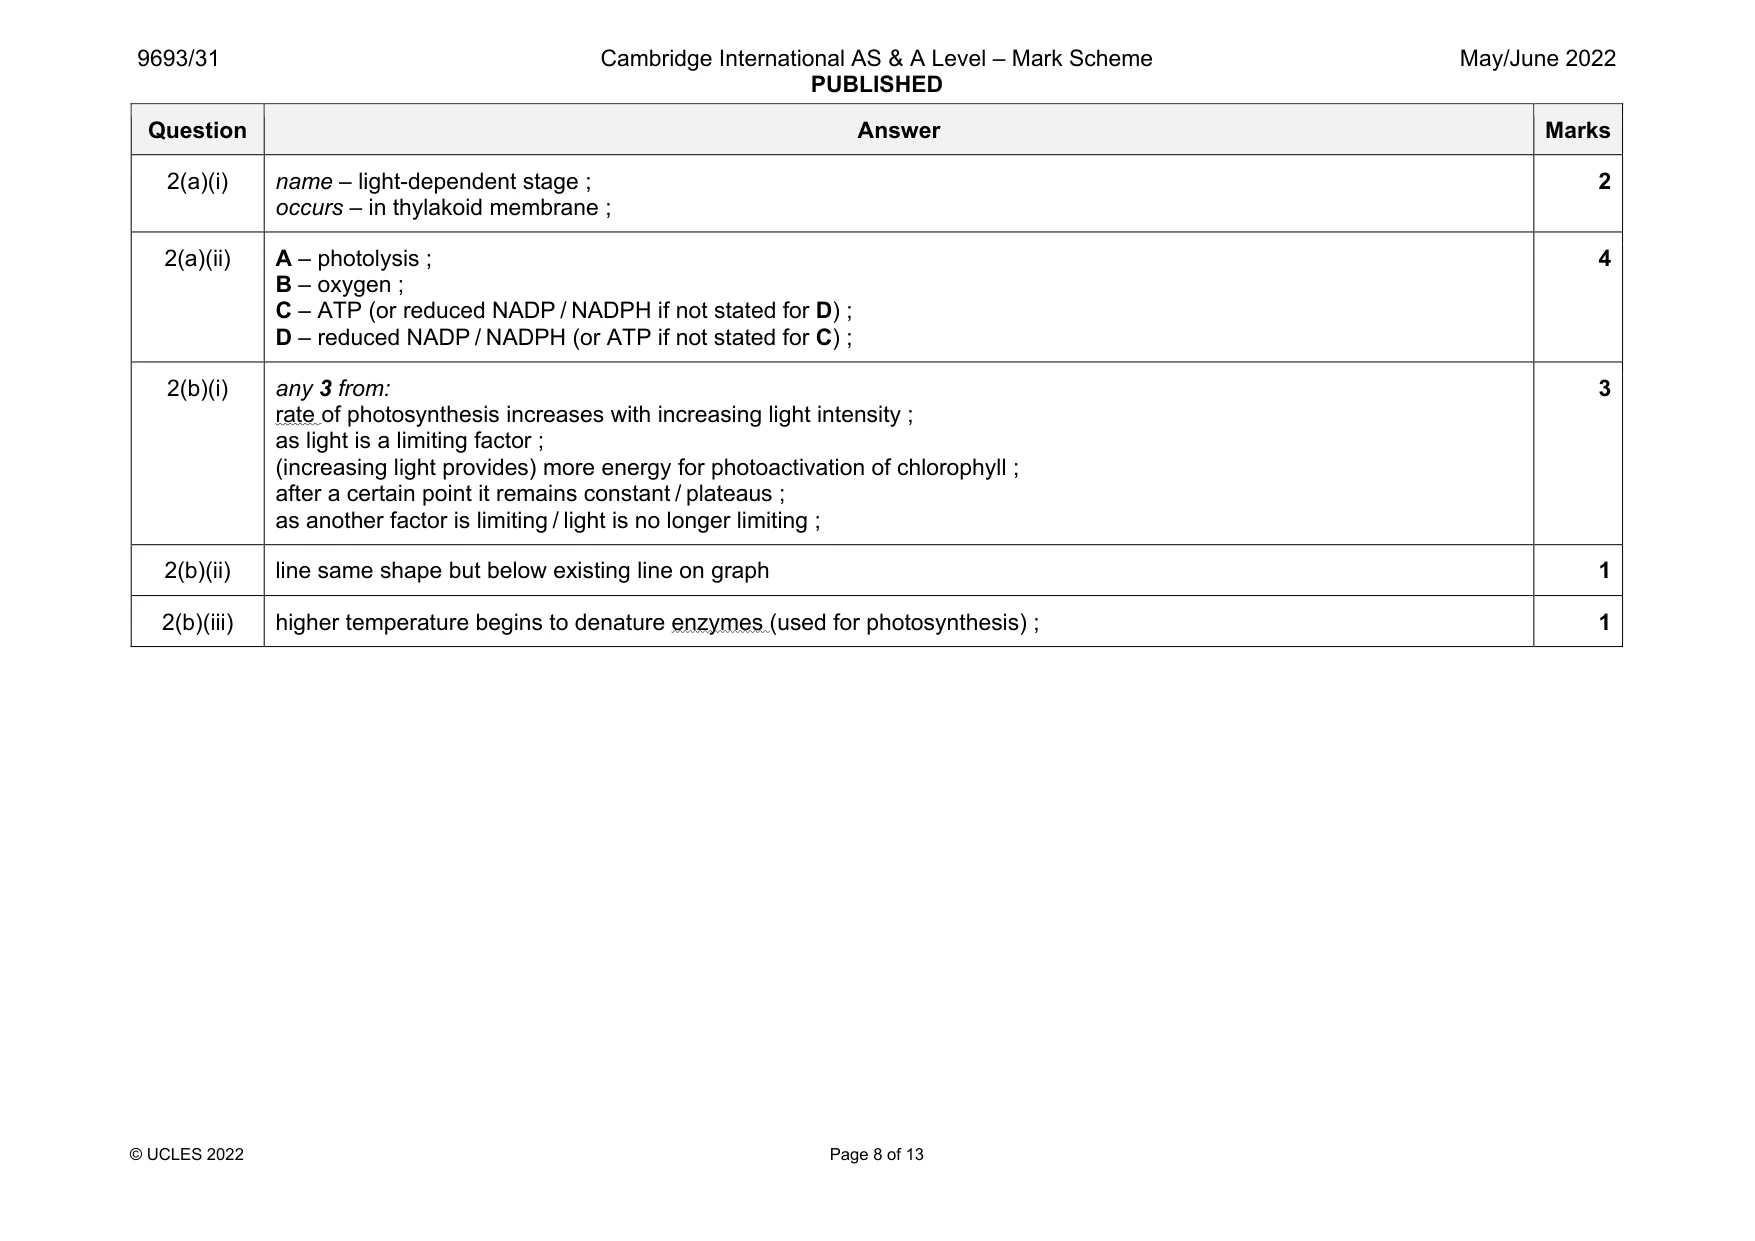
Mark scheme: 2(a)(i) name – light-dependent stage ; occurs – in thylakoid membrane ; 2 2(a)(ii) A – photolysis ; B – oxygen ; C – ATP (or reduced NADP / NADPH if not stated for D) ; D – reduced NADP / NADPH (or ATP if not stated for C) ; 4 2(b)(i) any 3 from: rate of photosynthesis increases with increasing light intensity ; as light is a limiting factor ; (increasing light provides) more energy for photoactivation of chlorophyll ; after a certain point it remains constant / plateaus ; as another factor is limiting / light is no longer limiting ; 3 2(b)(ii) line same shape but below existing line on graph 1 2(b)(iii) higher temperature begins to denature enzymes (used for photosynthesis) ; 1
Q3 · The seas around North West Africa are important fishing locations
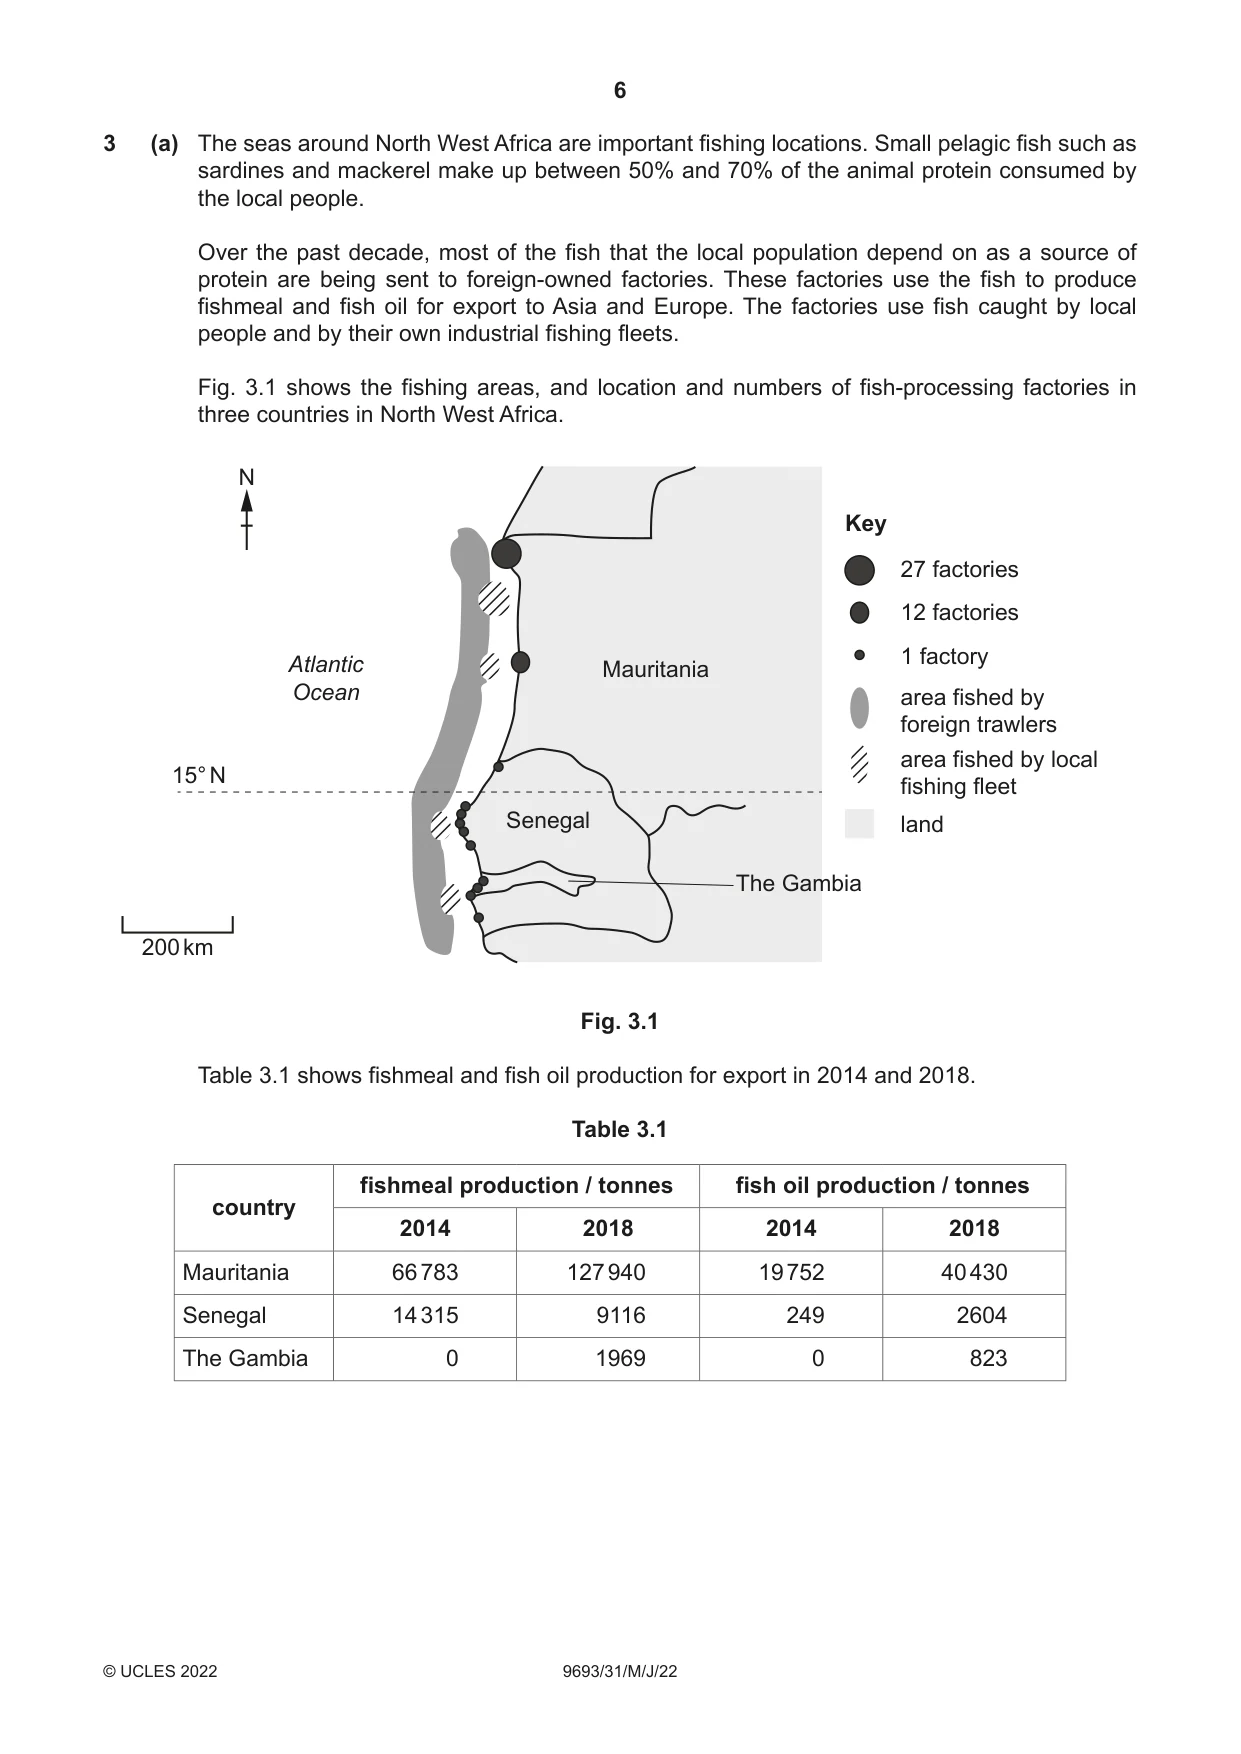
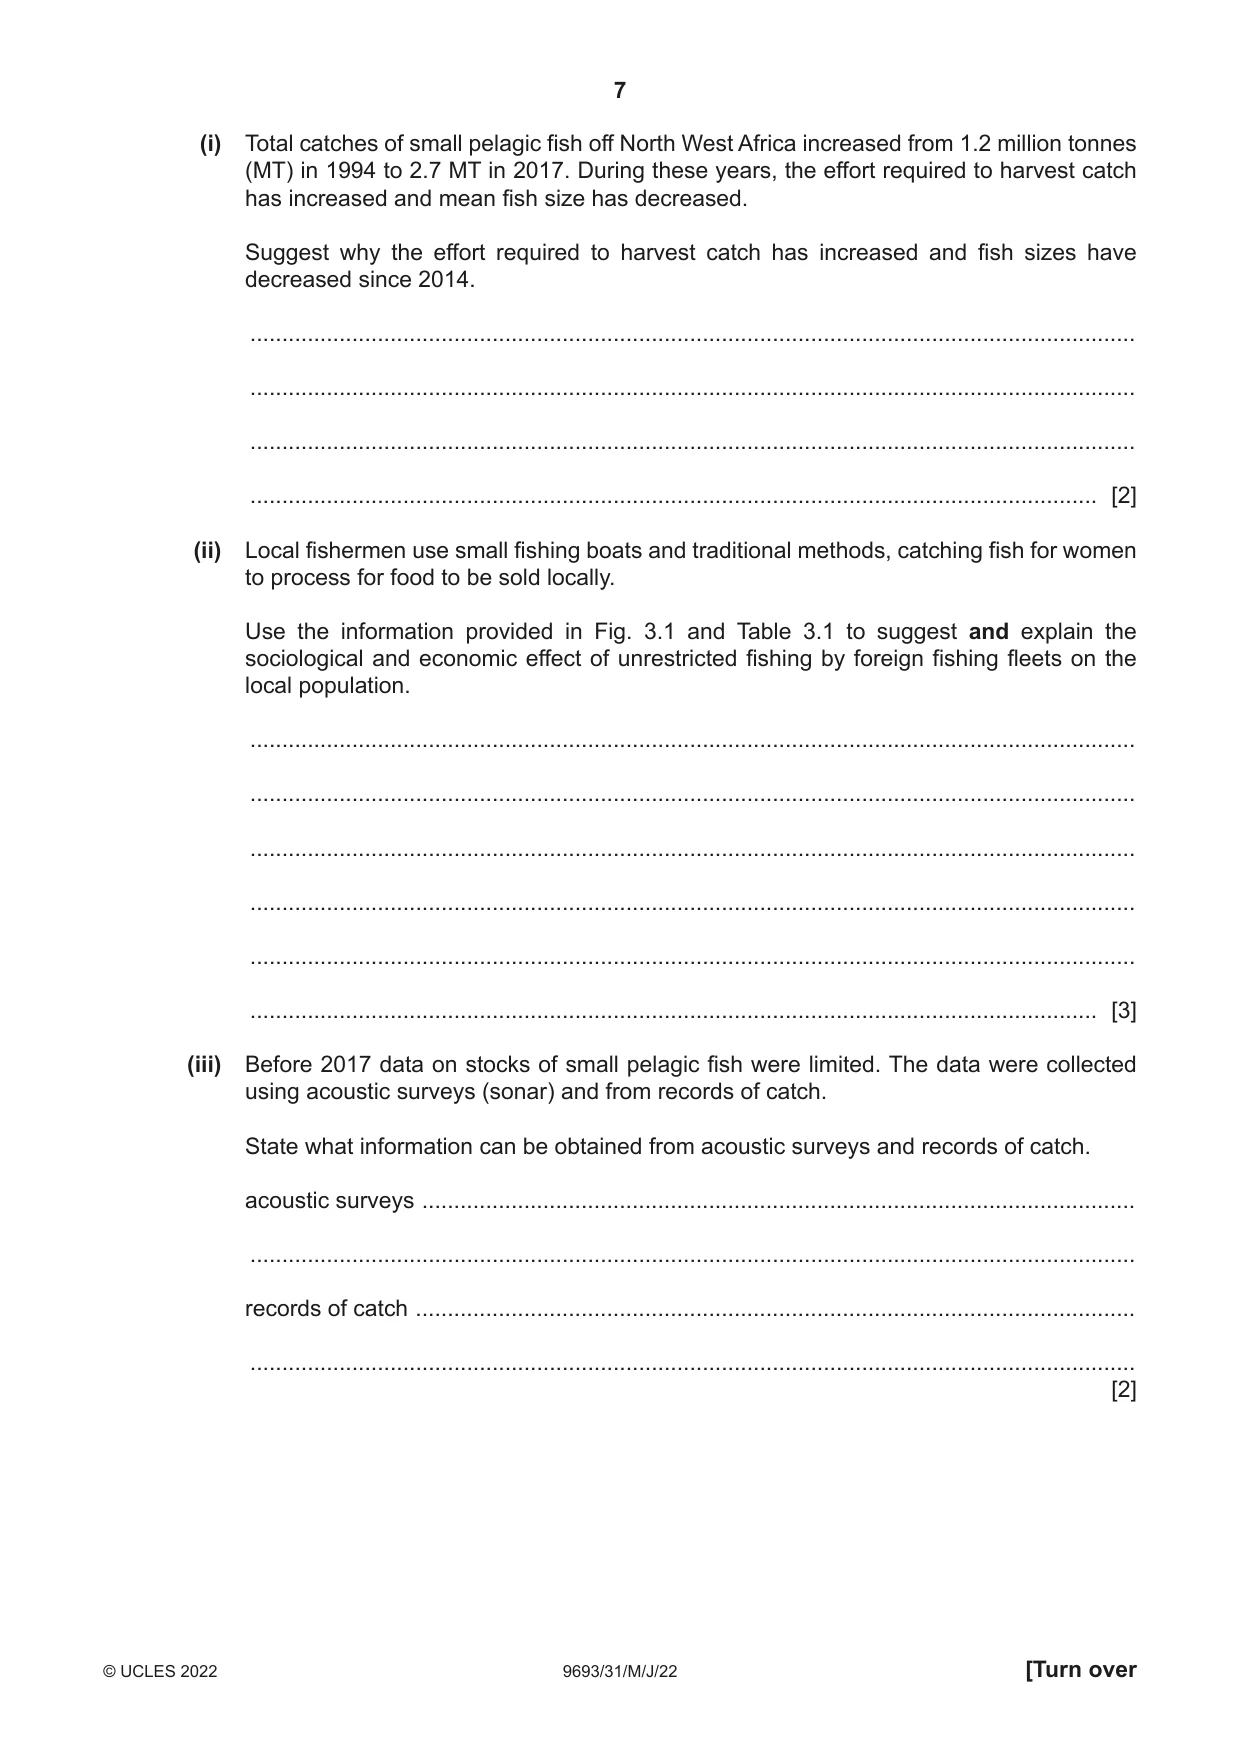
3 (a) The seas around North West Africa are important fishing locations. Small pelagic fish such as sardines and mackerel make up between 50% and 70% of the animal protein consumed by the local people. Over the past decade, most of the fish that the local population depend on as a source of protein are being sent to foreign-owned factories. These factories use the fish to produce fishmeal and fish oil for export to Asia and Europe. The factories use fish caught by local people and by their own industrial fishing fleets. Fig. 3.1 shows the fishing areas, and location and numbers of fish-processing factories in three countries in North West Africa. N Key 27 factories 12 factories 1 factory Atlantic Mauritania Ocean area fished by foreign trawlers area fished by local 15° N fishing fleet Senegal land The Gambia 200 km Fig. 3.1 Table 3.1 shows fishmeal and fish oil production for export in 2014 and 2018. Table 3.1 fishmeal production / tonnes fish oil production / tonnes country 2014 2018 2014 2018 Mauritania 66 783 127 940 19 752 40 430 Senegal 14 315 9116 249 2604 The Gambia 0 1969 0 823 (i) Total catches of small pelagic fish off North West Africa increased from 1.2 million tonnes (MT) in 1994 to 2.7 MT in 2017. During these years, the effort required to harvest catch has increased and mean fish size has decreased. Suggest why the effort required to harvest catch has increased and fish sizes have decreased since 2014. ........................................................................................................................................... ........................................................................................................................................... ........................................................................................................................................... ..................................................................................................................................... [2] (ii) Local fishermen use small fishing boats and traditional methods, catching fish for women to process for food to be sold locally. Use the information provided in Fig. 3.1 and Table 3.1 to suggest and explain the sociological and economic effect of unrestricted fishing by foreign fishing fleets on the local population. ........................................................................................................................................... ........................................................................................................................................... ........................................................................................................................................... ........................................................................................................................................... ........................................................................................................................................... ..................................................................................................................................... [3] (iii) Before 2017 data on stocks of small pelagic fish were limited. The data were collected using acoustic surveys (sonar) and from records of catch. State what information can be obtained from acoustic surveys and records of catch. acoustic surveys ................................................................................................................ ........................................................................................................................................... records of catch ................................................................................................................. ........................................................................................................................................... [2] (iv) Data from 2019 confirm that stocks of small pelagic fish have decreased significantly. Fishing restrictions are urgently required to improve stocks and one suggestion has been to ban all foreign-owned fishing fleets from fishing around the North West African coast. This would initially provide more fish for the local population and eventually result in a surplus of fish available for export. Suggest how consumer-orientated tools could be used to increase the sale of these surplus fish globally. ........................................................................................................................................... ........................................................................................................................................... ........................................................................................................................................... ........................................................................................................................................... ........................................................................................................................................... ..................................................................................................................................... [3] (b) A recent survey predicts that increasing water temperatures due to climate change will cause the small pelagic fish to migrate 1000 km further north. Suggest why the warmer water will be an unsuitable environment for the small pelagic fish. ................................................................................................................................................... ................................................................................................................................................... ................................................................................................................................................... ................................................................................................................................................... ................................................................................................................................................... ............................................................................................................................................. [3] [Total: 13]
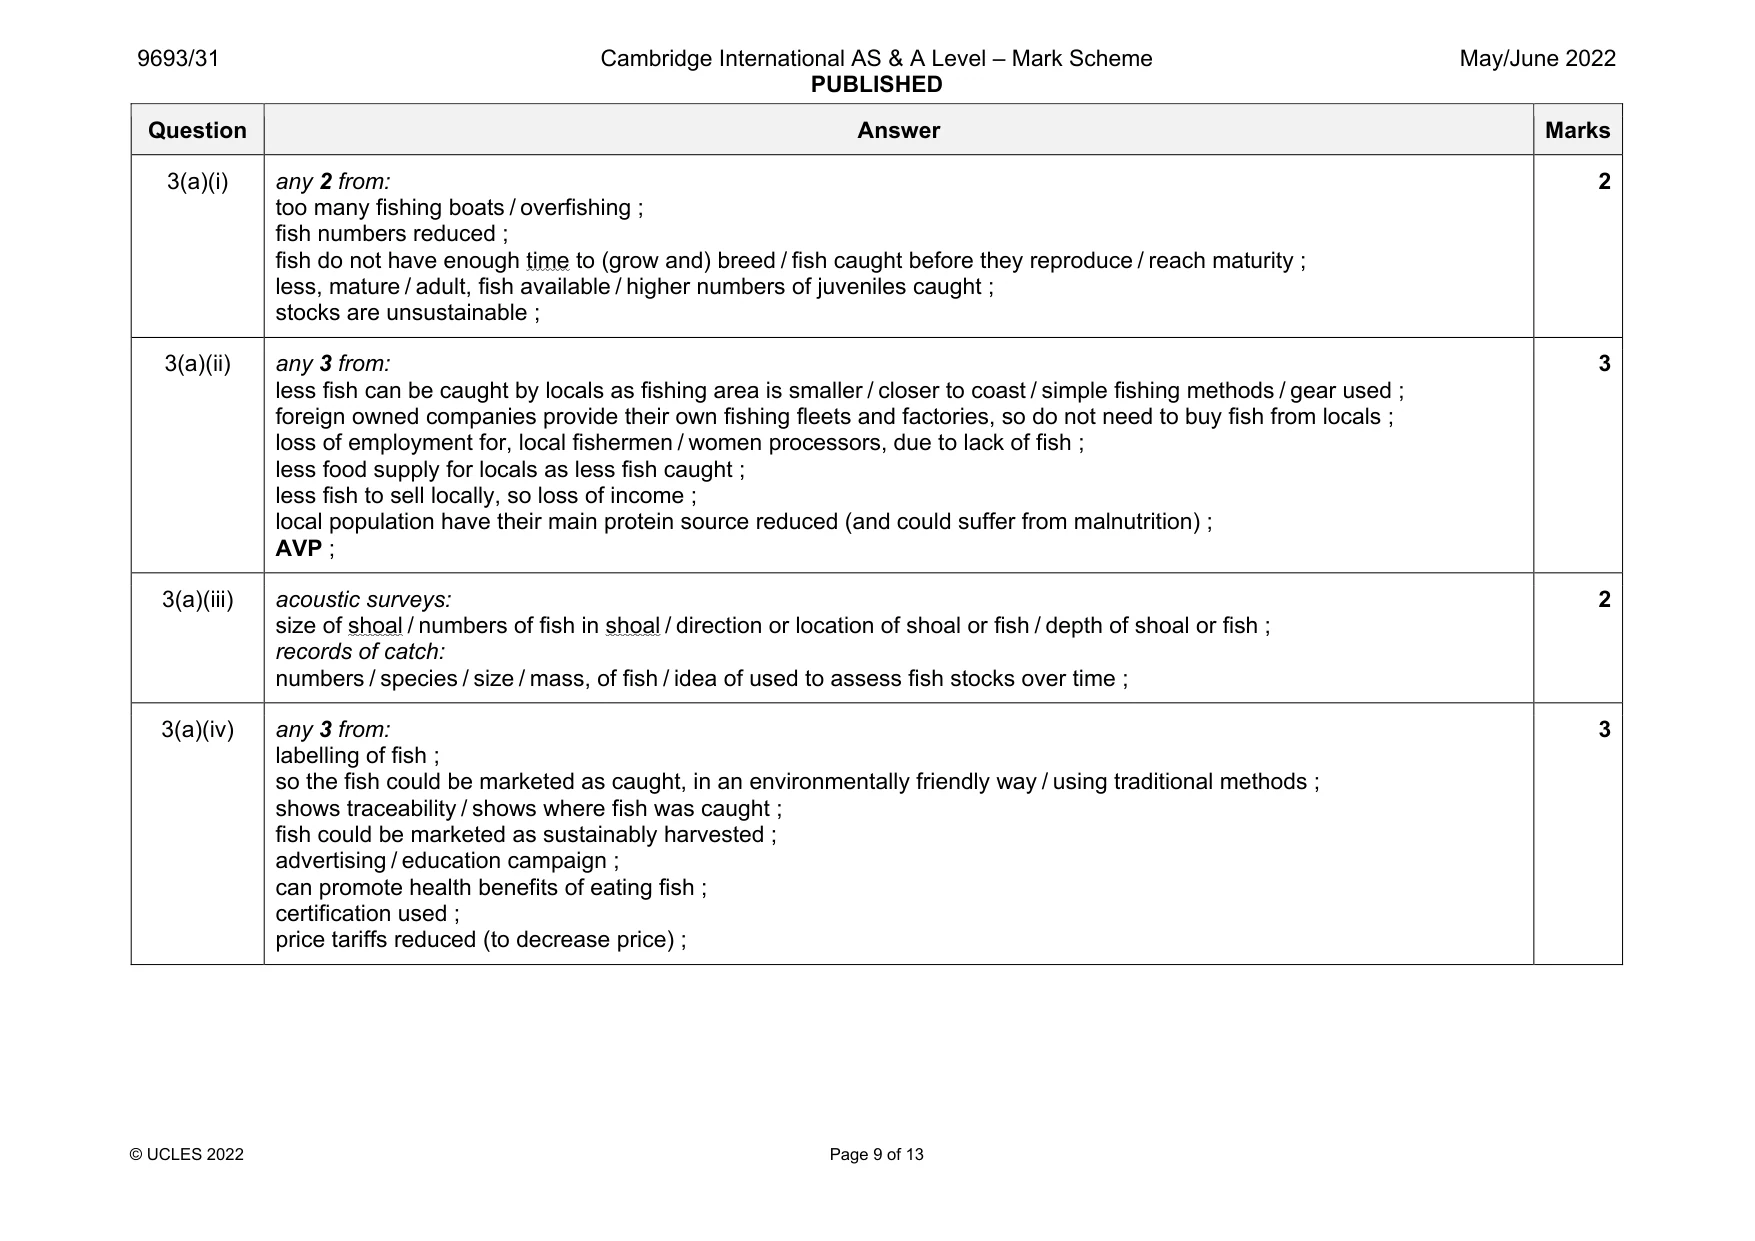
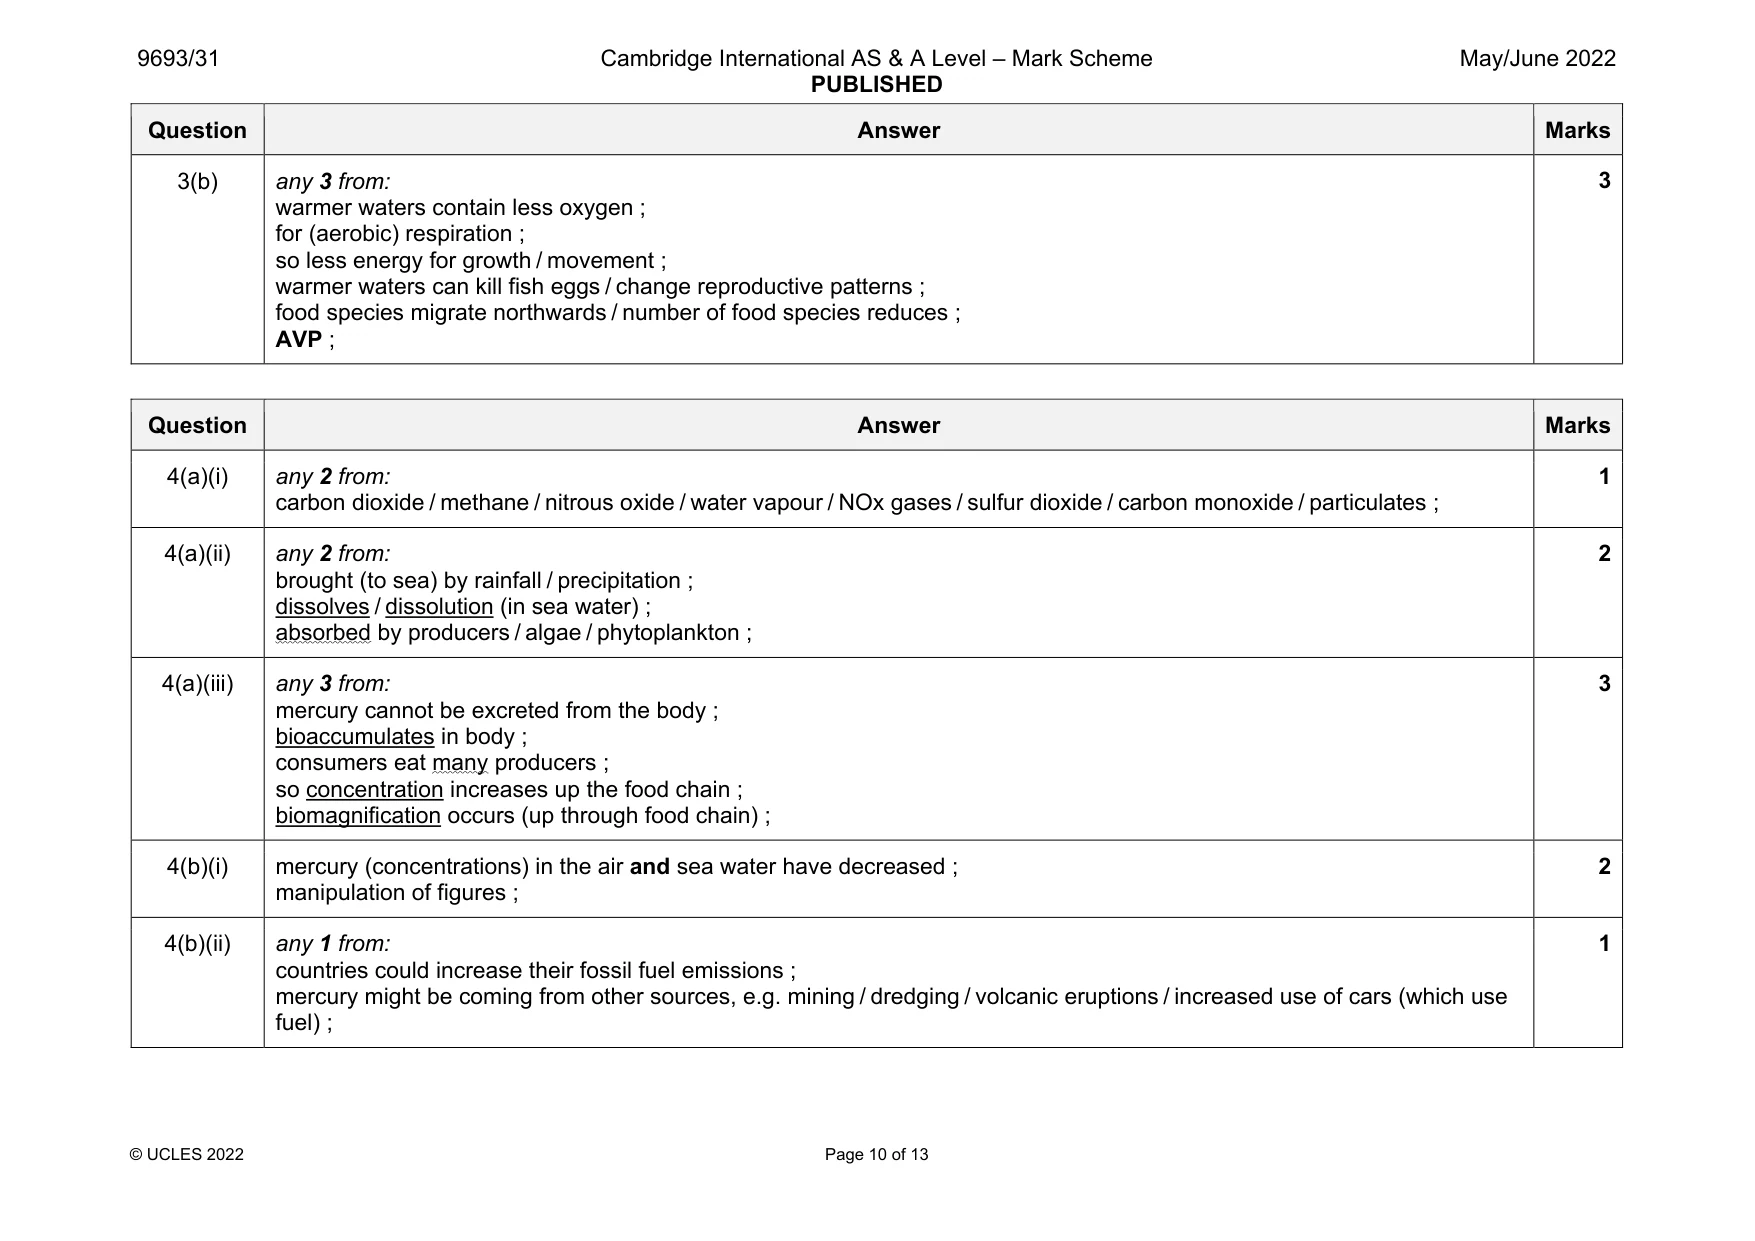
Mark scheme: 3(a)(i) any 2 from: too many fishing boats / overfishing ; fish numbers reduced ; fish do not have enough time to (grow and) breed / fish caught before they reproduce / reach maturity ; less, mature / adult, fish available / higher numbers of juveniles caught ; stocks are unsustainable ; 2 3(a)(ii) any 3 from: less fish can be caught by locals as fishing area is smaller / closer to coast / simple fishing methods / gear used ; foreign owned companies provide their own fishing fleets and factories, so do not need to buy fish from locals ; loss of employment for, local fishermen / women processors, due to lack of fish ; less food supply for locals as less fish caught ; less fish to sell locally, so loss of income ; local population have their main protein source reduced (and could suffer from malnutrition) ; AVP ; 3 3(a)(iii) acoustic surveys: size of shoal / numbers of fish in shoal / direction or location of shoal or fish / depth of shoal or fish ; records of catch: numbers / species / size / mass, of fish / idea of used to assess fish stocks over time ; 2 3(a)(iv) any 3 from: labelling of fish ; so the fish could be marketed as caught, in an environmentally friendly way / using traditional methods ; shows traceability / shows where fish was caught ; fish could be marketed as sustainably harvested ; advertising / education campaign ; can promote health benefits of eating fish ; certification used ; price tariffs reduced (to decrease price) ; 3 Question Answer Marks 3(b) any 3 from: warmer waters contain less oxygen ; for (aerobic) respiration ; so less energy for growth / movement ; warmer waters can kill fish eggs / change reproductive patterns ; food species migrate northwards / number of food species reduces ; AVP ; 3
Q4 · Combustion of fossil fuels, particularly coal, releases mercury and other substances into…
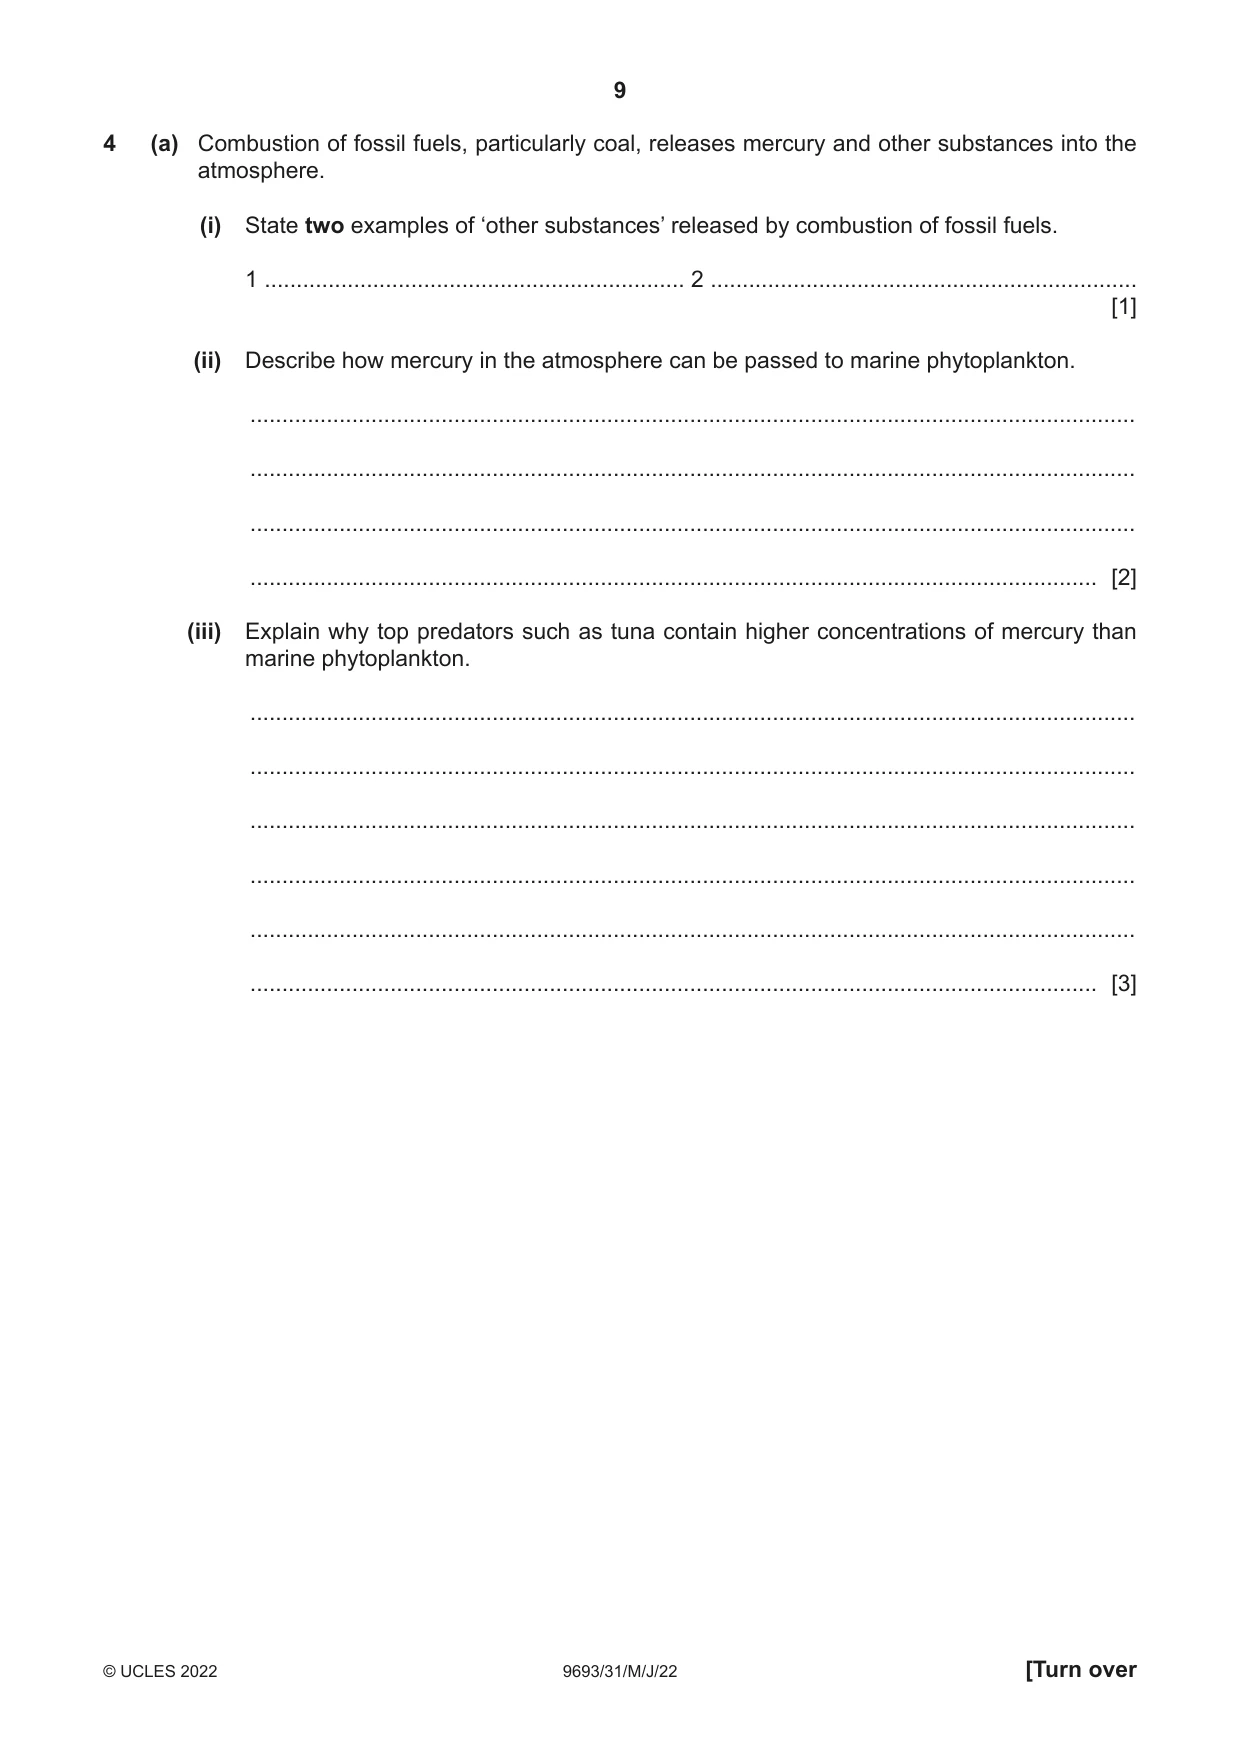
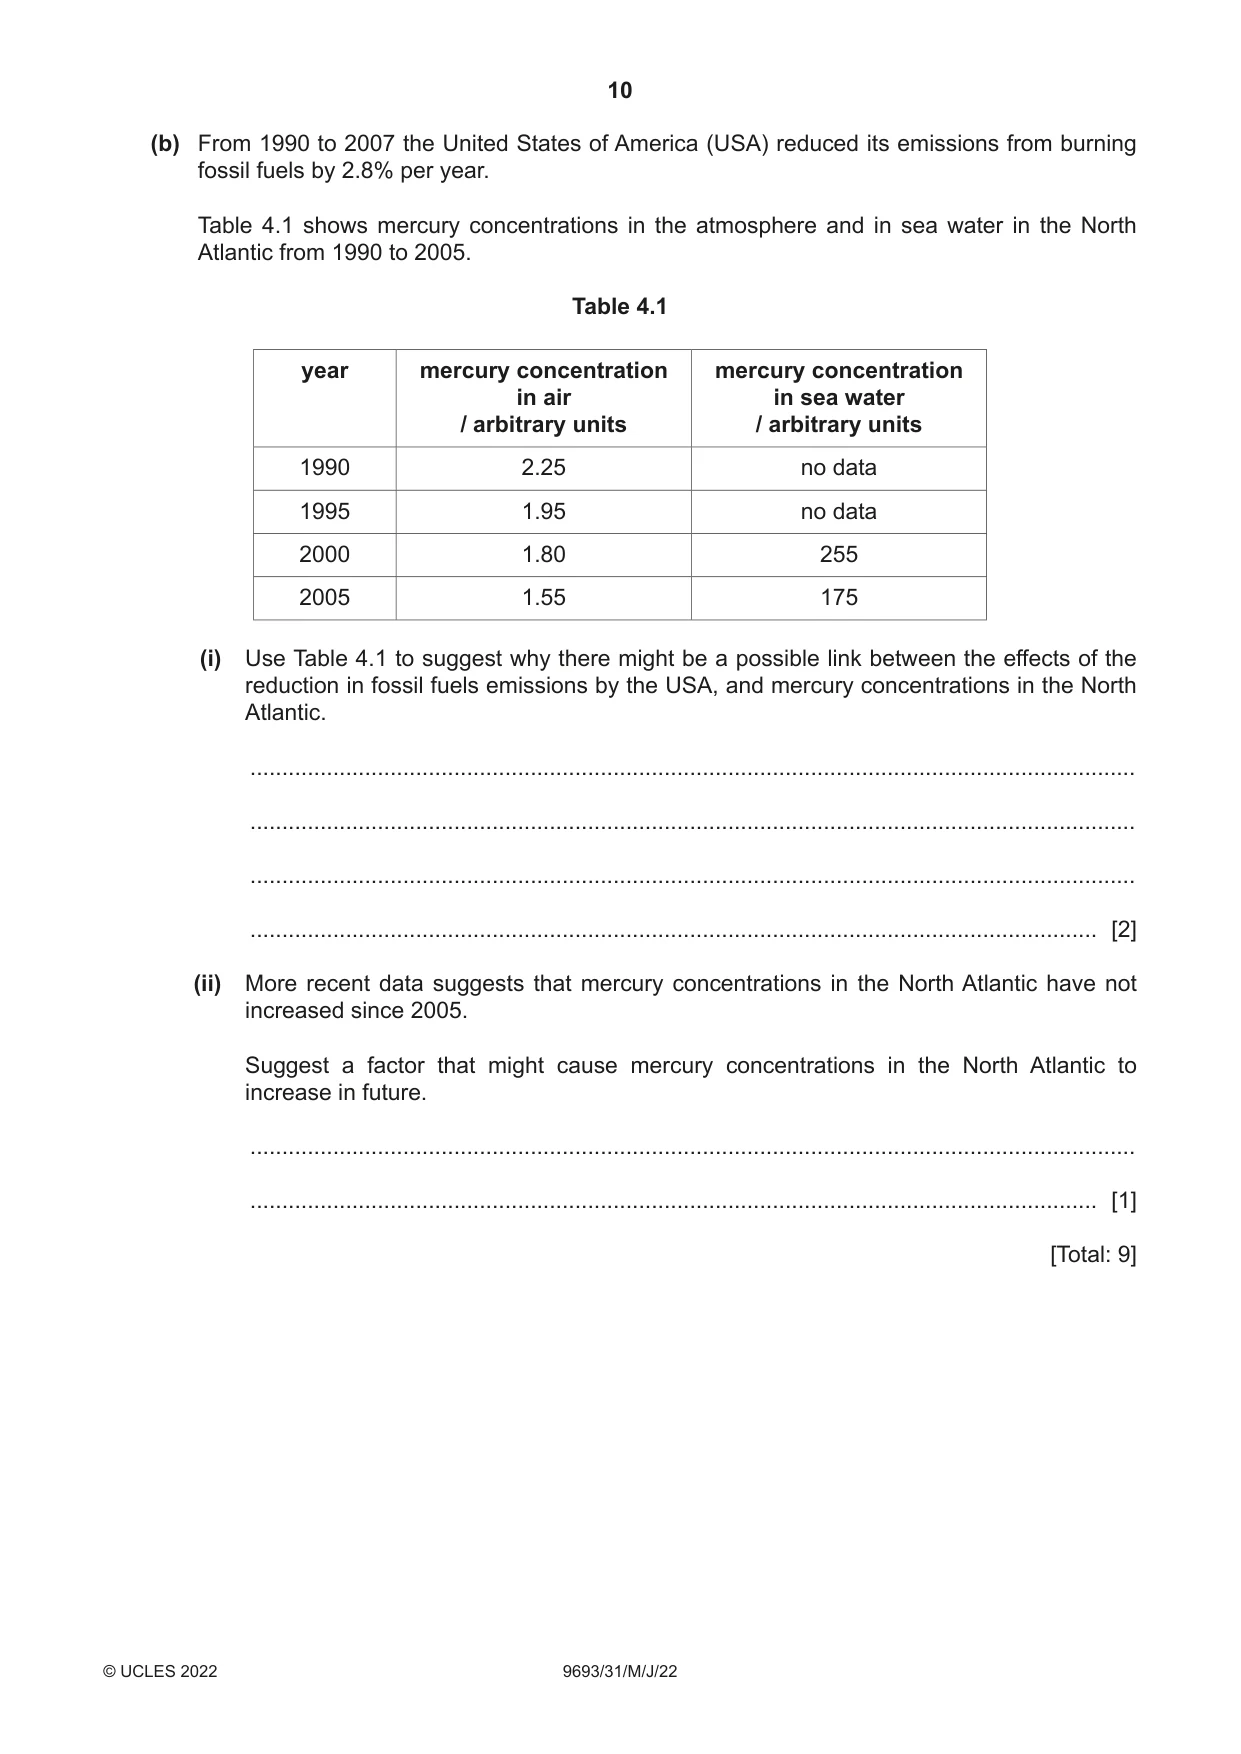
4 (a) Combustion of fossil fuels, particularly coal, releases mercury and other substances into the atmosphere. (i) State two examples of ‘other substances’ released by combustion of fossil fuels. 1 .................................................................. 2 ................................................................... [1] (ii) Describe how mercury in the atmosphere can be passed to marine phytoplankton. ........................................................................................................................................... ........................................................................................................................................... ........................................................................................................................................... ..................................................................................................................................... [2] (iii) Explain why top predators such as tuna contain higher concentrations of mercury than marine phytoplankton. ........................................................................................................................................... ........................................................................................................................................... ........................................................................................................................................... ........................................................................................................................................... ........................................................................................................................................... ..................................................................................................................................... [3] (b) From 1990 to 2007 the United States of America (USA) reduced its emissions from burning fossil fuels by 2.8% per year. Table 4.1 shows mercury concentrations in the atmosphere and in sea water in the North Atlantic from 1990 to 2005. Table 4.1 year mercury concentration mercury concentration in air in sea water / arbitrary units / arbitrary units 1990 2.25 no data 1995 1.95 no data 2000 1.80 255 2005 1.55 175 (i) Use Table 4.1 to suggest why there might be a possible link between the effects of the reduction in fossil fuels emissions by the USA, and mercury concentrations in the North Atlantic. ........................................................................................................................................... ........................................................................................................................................... ........................................................................................................................................... ..................................................................................................................................... [2] (ii) More recent data suggests that mercury concentrations in the North Atlantic have not increased since 2005. Suggest a factor that might cause mercury concentrations in the North Atlantic to increase in future. ........................................................................................................................................... ..................................................................................................................................... [1] [Total: 9]
Mark scheme: 4(a)(i) any 2 from: carbon dioxide / methane / nitrous oxide / water vapour / NOx gases / sulfur dioxide / carbon monoxide / particulates ; 1 4(a)(ii) any 2 from: brought (to sea) by rainfall / precipitation ; dissolves / dissolution (in sea water) ; absorbed by producers / algae / phytoplankton ; 2 4(a)(iii) any 3 from: mercury cannot be excreted from the body ; bioaccumulates in body ; consumers eat many producers ; so concentration increases up the food chain ; biomagnification occurs (up through food chain) ; 3 4(b)(i) mercury (concentrations) in the air and sea water have decreased ; manipulation of figures ; 2 4(b)(ii) any 1 from: countries could increase their fossil fuel emissions ; mercury might be coming from other sources, e.g. mining / dredging / volcanic eruptions / increased use of cars (which use fuel) ; 1
Q5 · Salmon farmers usually transfer smolt (juvenile fish) from land-based hatcheries to sea…
5 Salmon farmers usually transfer smolt (juvenile fish) from land-based hatcheries to sea cages to grow them to adult size in shallow inshore waters. Now, several aquaculture businesses are growing the smolt to adult size in land-based buildings using recirculation systems, instead of transferring the smolt to sea cages. Discuss the benefits and challenges of growing smolt to adult size in land-based buildings instead of in sea cages. .......................................................................................................................................................... .......................................................................................................................................................... .......................................................................................................................................................... .......................................................................................................................................................... .......................................................................................................................................................... .......................................................................................................................................................... .......................................................................................................................................................... .......................................................................................................................................................... .......................................................................................................................................................... .......................................................................................................................................................... .......................................................................................................................................................... .......................................................................................................................................................... .......................................................................................................................................................... .......................................................................................................................................................... .......................................................................................................................................................... .......................................................................................................................................................... .......................................................................................................................................................... .......................................................................................................................................................... .......................................................................................................................................................... .................................................................................................................................................. [10]
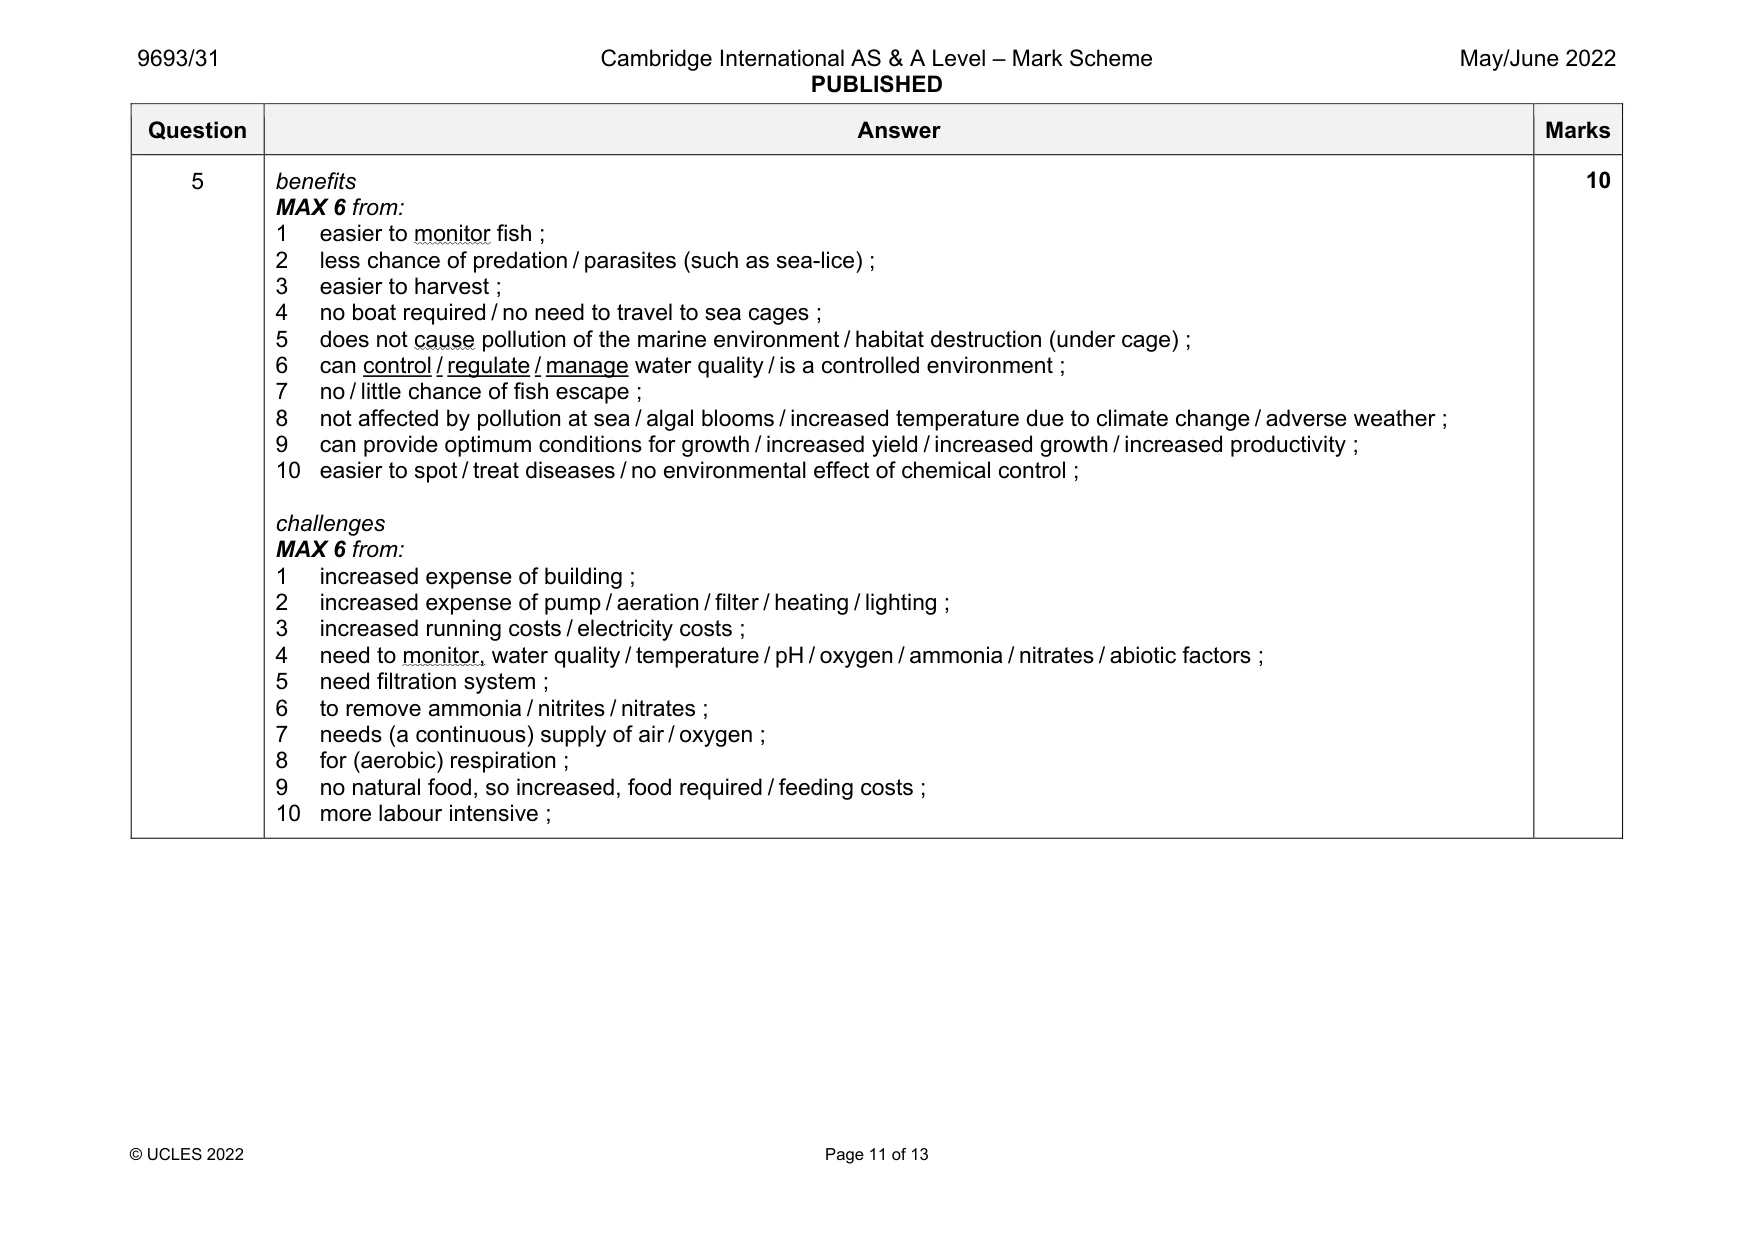
Mark scheme: 5 benefits MAX 6 from: 1 easier to monitor fish ; 2 less chance of predation / parasites (such as sea-lice) ; 3 easier to harvest ; 4 no boat required / no need to travel to sea cages ; 5 does not cause pollution of the marine environment / habitat destruction (under cage) ; 6 can control / regulate / manage water quality / is a controlled environment ; 7 no / little chance of fish escape ; 8 not affected by pollution at sea / algal blooms / increased temperature due to climate change / adverse weather ; 9 can provide optimum conditions for growth / increased yield / increased growth / increased productivity ; 10 easier to spot / treat diseases / no environmental effect of chemical control ; challenges MAX 6 from: 1 increased expense of building ; 2 increased expense of pump / aeration / filter / heating / lighting ; 3 increased running costs / electricity costs ; 4 need to monitor, water quality / temperature / pH / oxygen / ammonia / nitrates / abiotic factors ; 5 need filtration system ; 6 to remove ammonia / nitrites / nitrates ; 7 needs (a continuous) supply of air / oxygen ; 8 for (aerobic) respiration ; 9 no natural food, so increased, food required / feeding costs ; 10 more labour intensive ;
Q6 · Describe the possible impacts of melting ice sheets on the marine environment
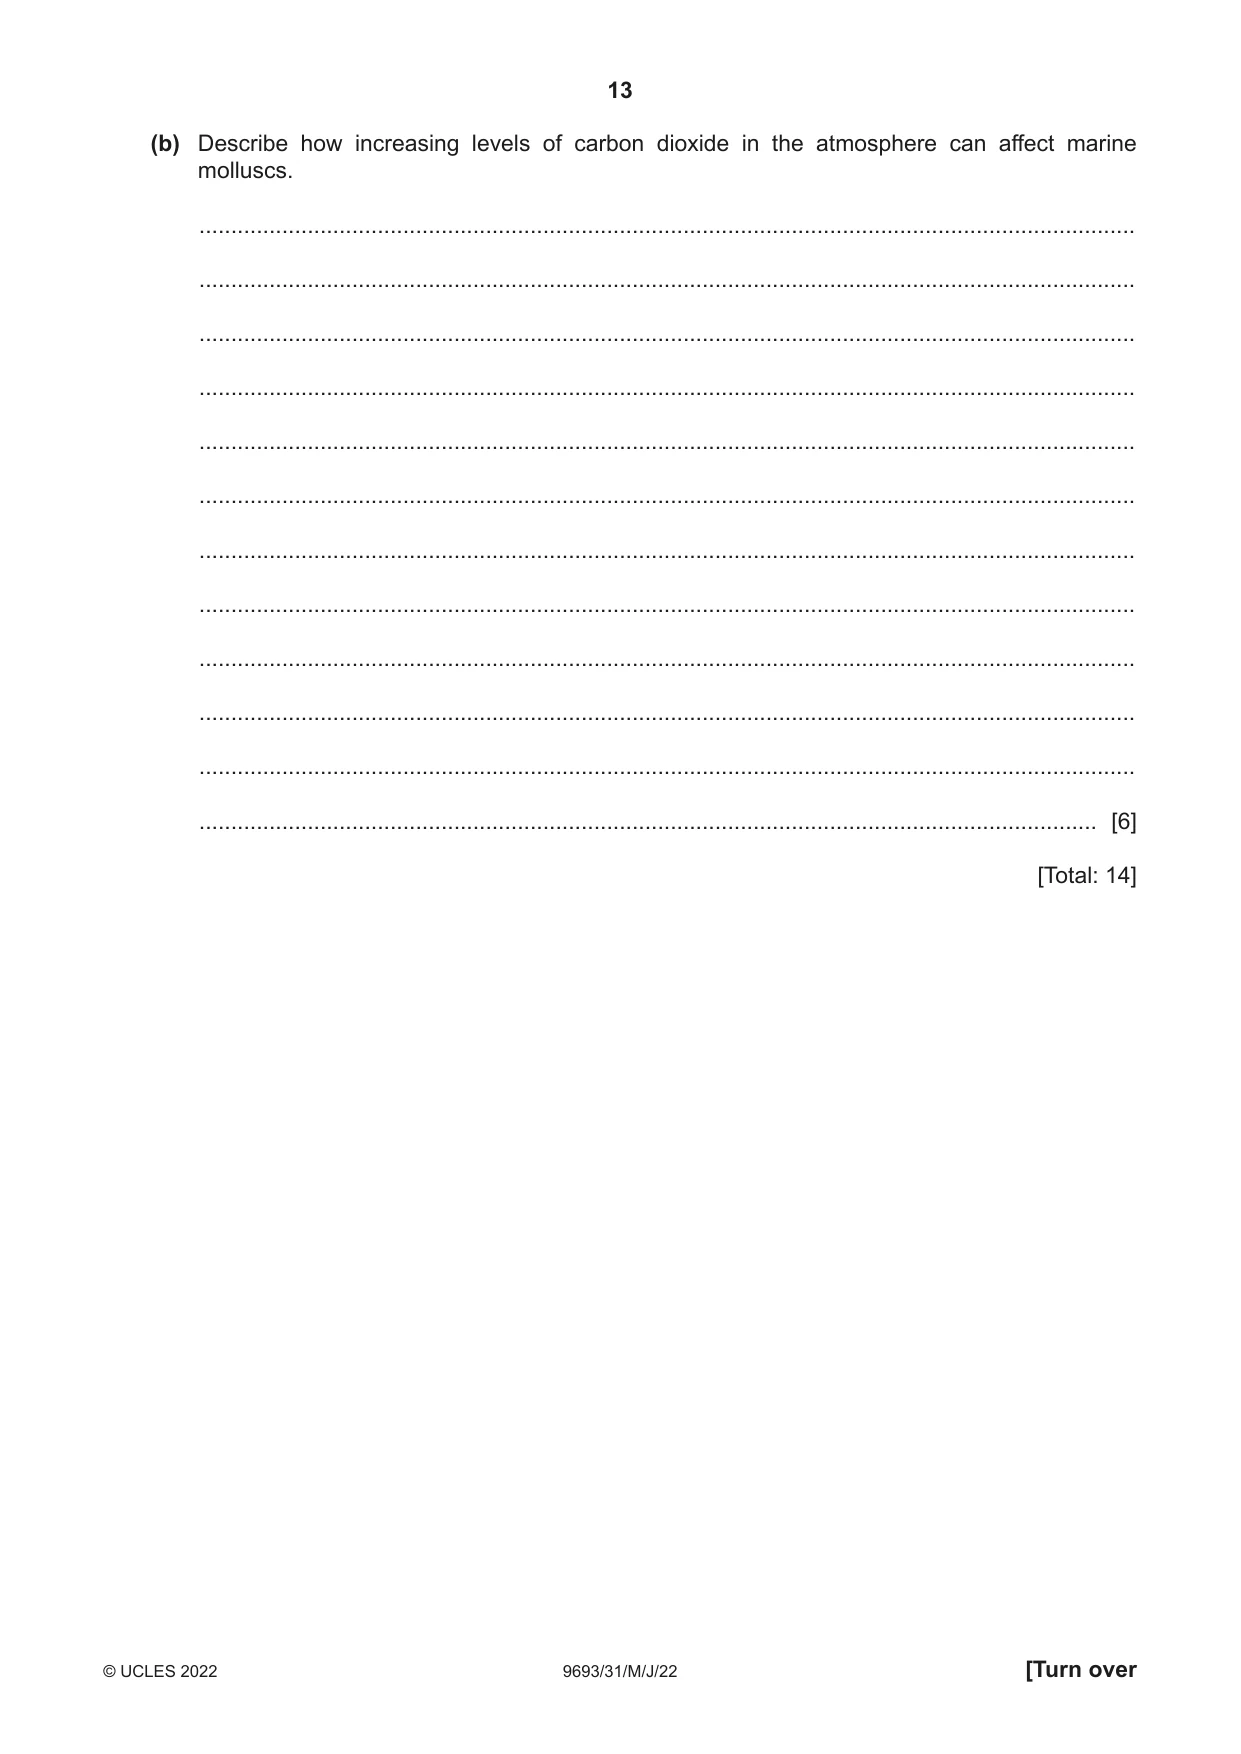
6 (a) Describe the possible impacts of melting ice sheets on the marine environment. ................................................................................................................................................... ................................................................................................................................................... ................................................................................................................................................... ................................................................................................................................................... ................................................................................................................................................... ................................................................................................................................................... ................................................................................................................................................... ................................................................................................................................................... ................................................................................................................................................... ................................................................................................................................................... ................................................................................................................................................... ................................................................................................................................................... ................................................................................................................................................... ................................................................................................................................................... ................................................................................................................................................... ............................................................................................................................................. [8] (b) Describe how increasing levels of carbon dioxide in the atmosphere can affect marine molluscs. ................................................................................................................................................... ................................................................................................................................................... ................................................................................................................................................... ................................................................................................................................................... ................................................................................................................................................... ................................................................................................................................................... ................................................................................................................................................... ................................................................................................................................................... ................................................................................................................................................... ................................................................................................................................................... ................................................................................................................................................... ............................................................................................................................................. [6] [Total: 14]
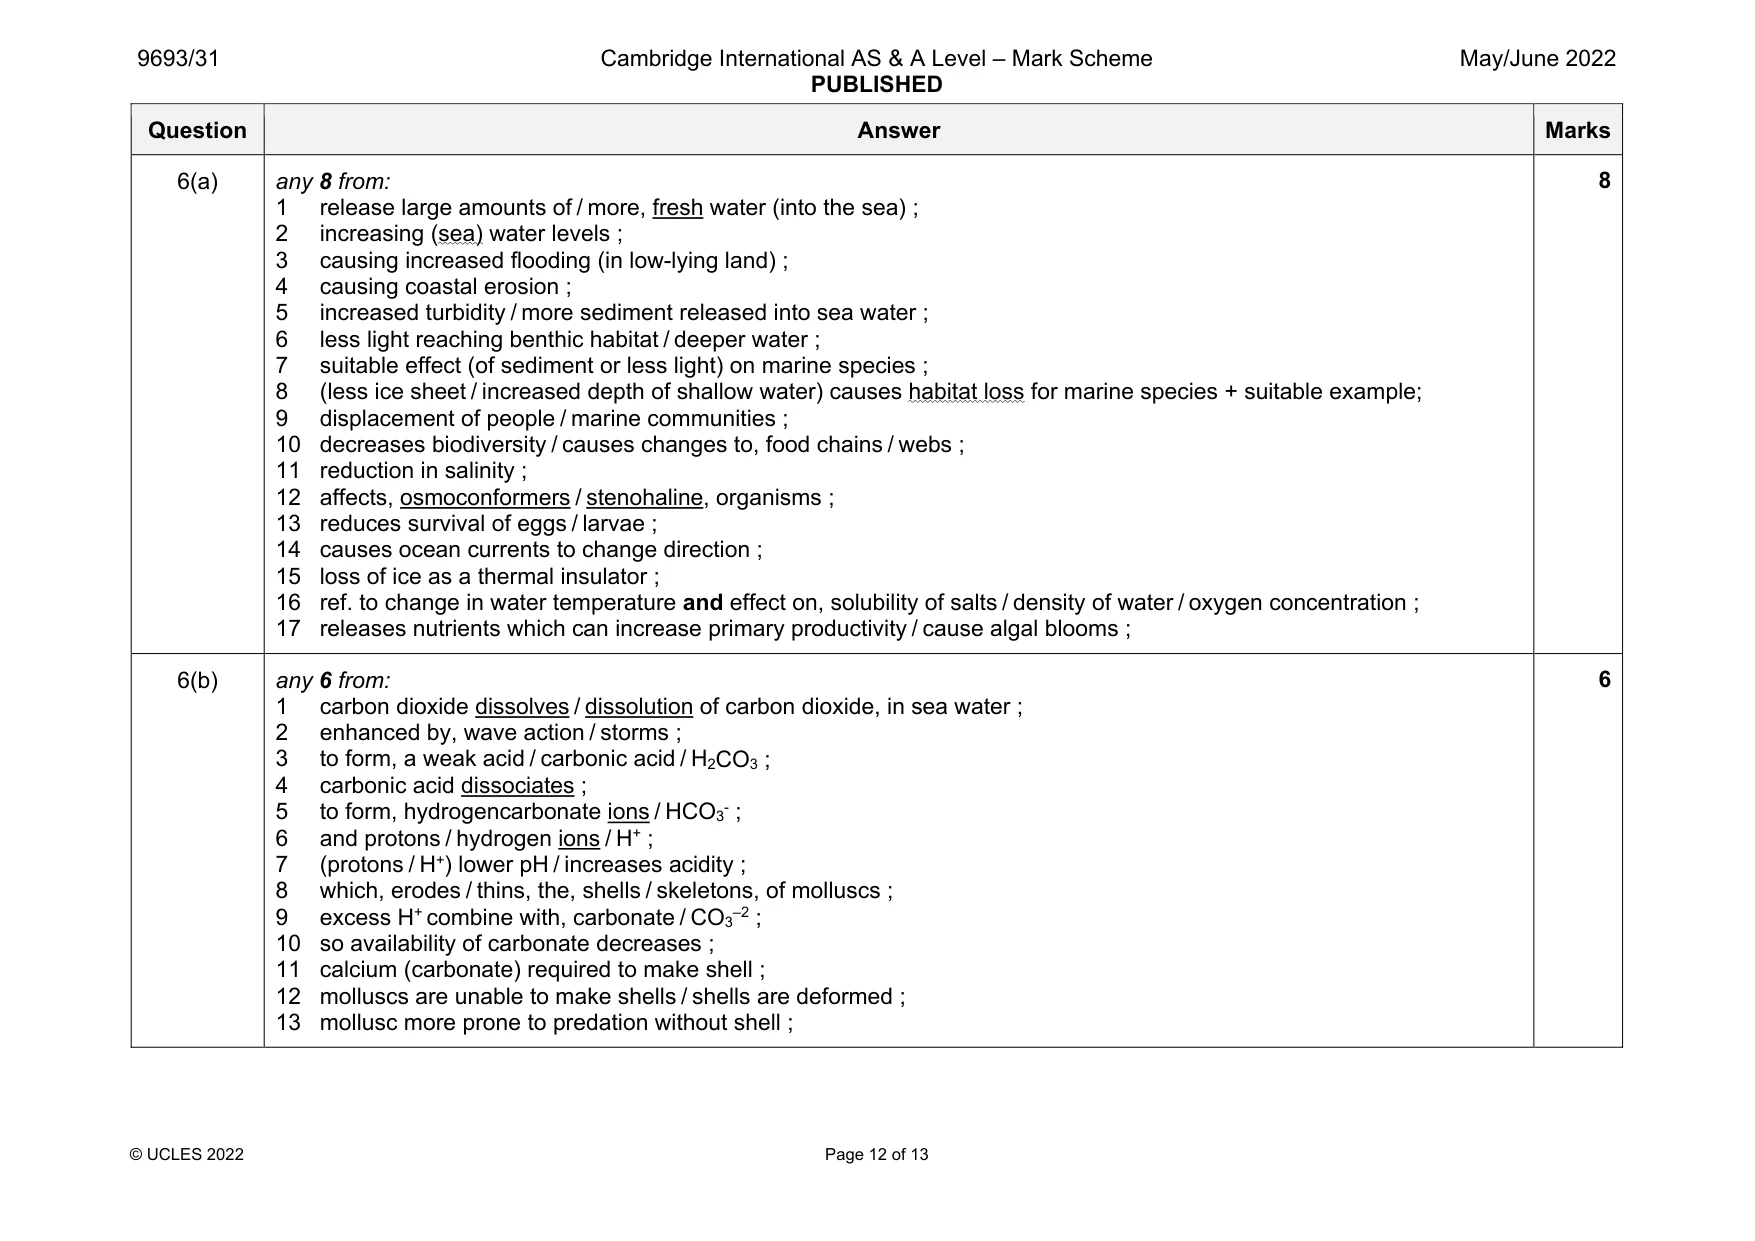
Mark scheme: 6(a) any 8 from: 1 release large amounts of / more, fresh water (into the sea) ; 2 increasing (sea) water levels ; 3 causing increased flooding (in low-lying land) ; 4 causing coastal erosion ; 5 increased turbidity / more sediment released into sea water ; 6 less light reaching benthic habitat / deeper water ; 7 suitable effect (of sediment or less light) on marine species ; 8 (less ice sheet / increased depth of shallow water) causes habitat loss for marine species + suitable example; 9 displacement of people / marine communities ; 10 decreases biodiversity / causes changes to, food chains / webs ; 11 reduction in salinity ; 12 affects, osmoconformers / stenohaline, organisms ; 13 reduces survival of eggs / larvae ; 14 causes ocean currents to change direction ; 15 loss of ice as a thermal insulator ; 16 ref. to change in water temperature and effect on, solubility of salts / density of water / oxygen concentration ; 17 releases nutrients which can increase primary productivity / cause algal blooms ; 6(b) any 6 from: 1 carbon dioxide dissolves / dissolution of carbon dioxide, in sea water ; 2 enhanced by, wave action / storms ; 3 to form, a weak acid / carbonic acid / H2CO3 ; 4 carbonic acid dissociates ; 5 to form, hydrogencarbonate ions / HCO3- ; 6 and protons / hydrogen ions / H+ ; 7 (protons / H+) lower pH / increases acidity ; 8 which, erodes / thins, the, shells / skeletons, of molluscs ; 9 excess H+ combine with, carbonate / CO3–2 ; 10 so availability of carbonate decreases ; 11 calcium (carbonate) required to make shell ; 12 molluscs are unable to make shells / shells are deformed ; 13 mollusc more prone to predation without shell ; 6
Q7 · Discuss the role of marine zoos and aquaria in the conservation of marine species
7 Discuss the role of marine zoos and aquaria in the conservation of marine species. .......................................................................................................................................................... .......................................................................................................................................................... .......................................................................................................................................................... .......................................................................................................................................................... .......................................................................................................................................................... .......................................................................................................................................................... .......................................................................................................................................................... .......................................................................................................................................................... .......................................................................................................................................................... .......................................................................................................................................................... .......................................................................................................................................................... .................................................................................................................................................... [6]
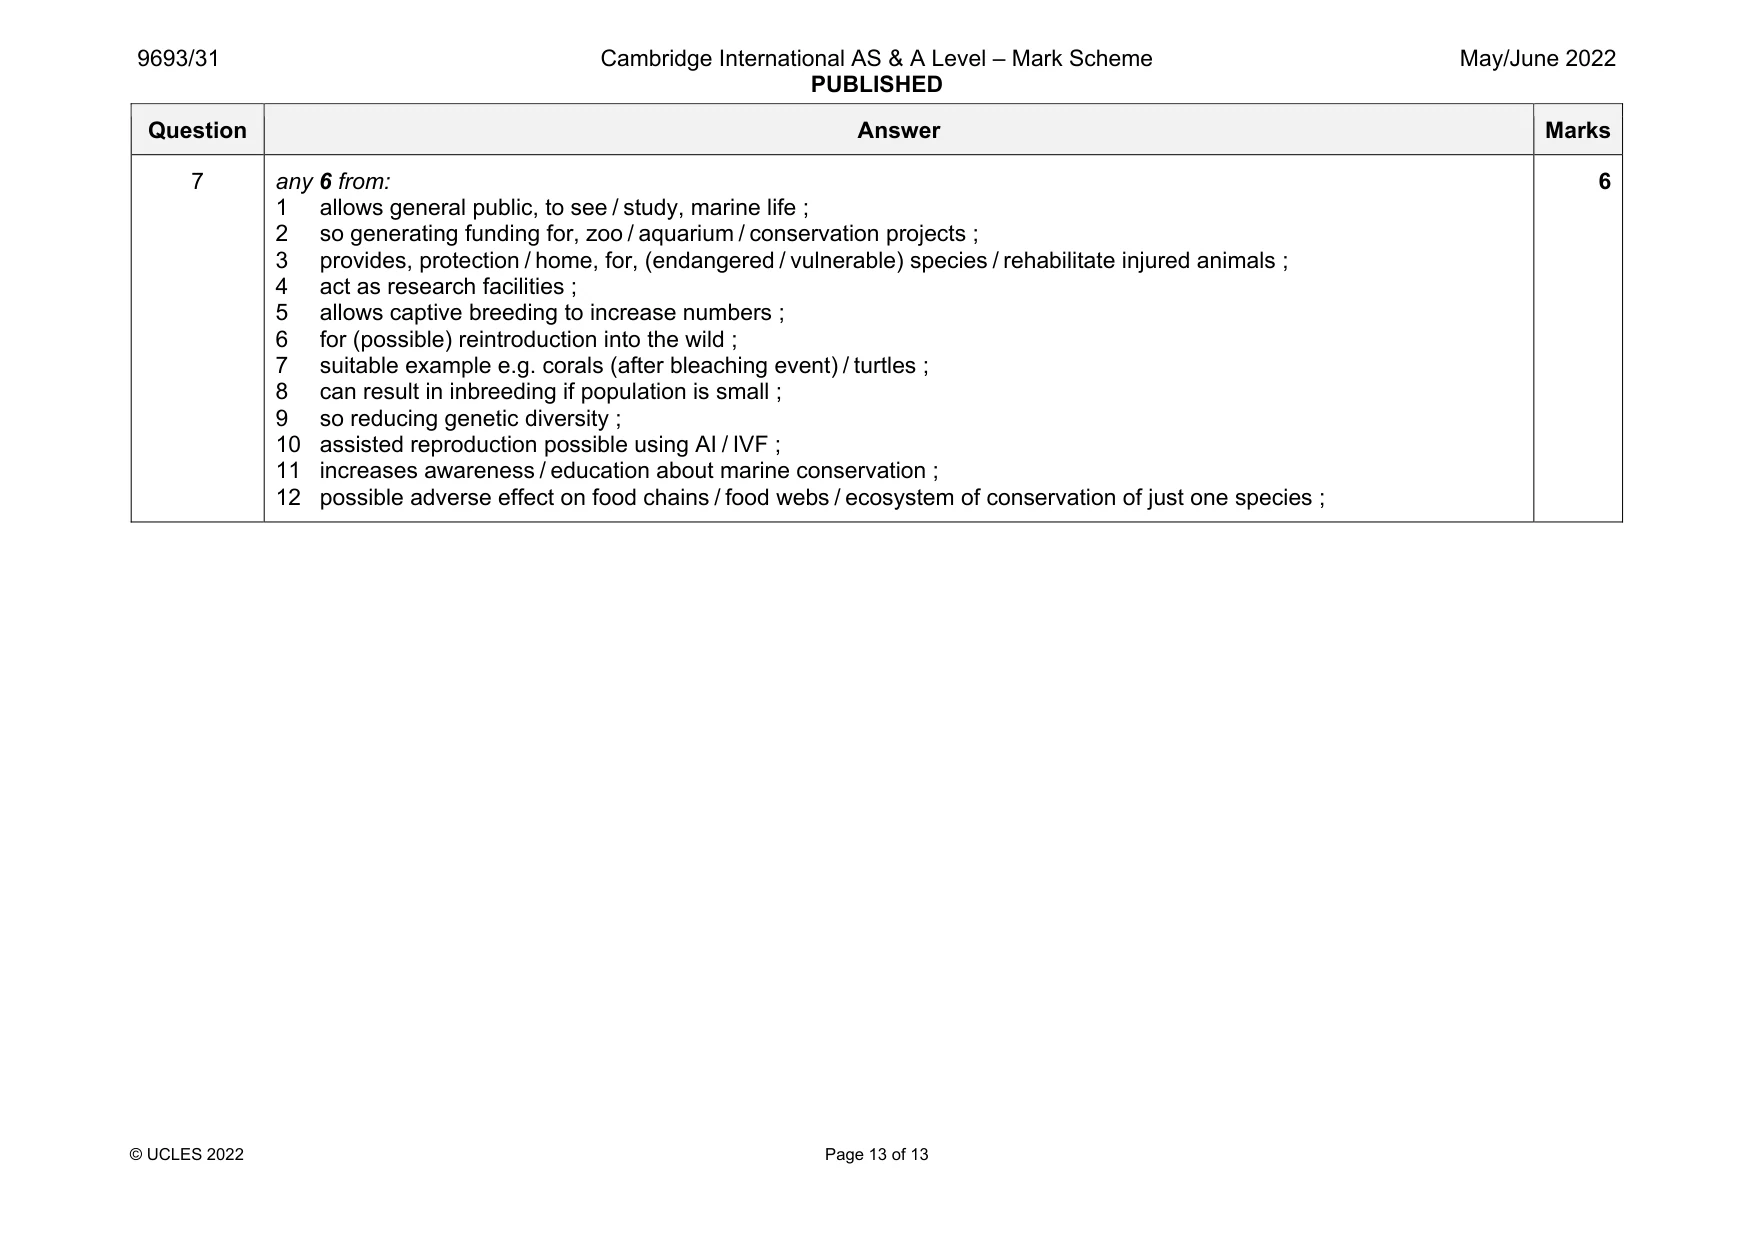
Mark scheme: 7 any 6 from: 1 allows general public, to see / study, marine life ; 2 so generating funding for, zoo / aquarium / conservation projects ; 3 provides, protection / home, for, (endangered / vulnerable) species / rehabilitate injured animals ; 4 act as research facilities ; 5 allows captive breeding to increase numbers ; 6 for (possible) reintroduction into the wild ; 7 suitable example e.g. corals (after bleaching event) / turtles ; 8 can result in inbreeding if population is small ; 9 so reducing genetic diversity ; 10 assisted reproduction possible using AI / IVF ; 11 increases awareness / education about marine conservation ; 12 possible adverse effect on food chains / food webs / ecosystem of conservation of just one species ; 6
What was in this paper
The subtopics covered by these 7 questions, and how many questions each got. Open one in a new tab to see every Cambridge question on it.
What you needed in this session
Cambridge’s own grade thresholds for 2022 May/June, Paper 3 · Variant 1. A higher threshold means an easier paper — the bar moves with how the cohort did.