Cambridge A Level Marine Science 9693 — 2023 May/June Paper 2 · Variant 3
9693/23/M/J/23 · 5 questions · 75 marks · ≈84 min
The question paper and its mark scheme, free to read here and free to download. This is Cambridge’s own paper, exactly as it was sat.
Question paper28 pages








Mark scheme14 pages
Answers below. Sit the paper first if you are practising.
Questions as text
Q1 · The shell of a common dogwhelk, Nucella lapillus, which is adapted to live on rocky shores
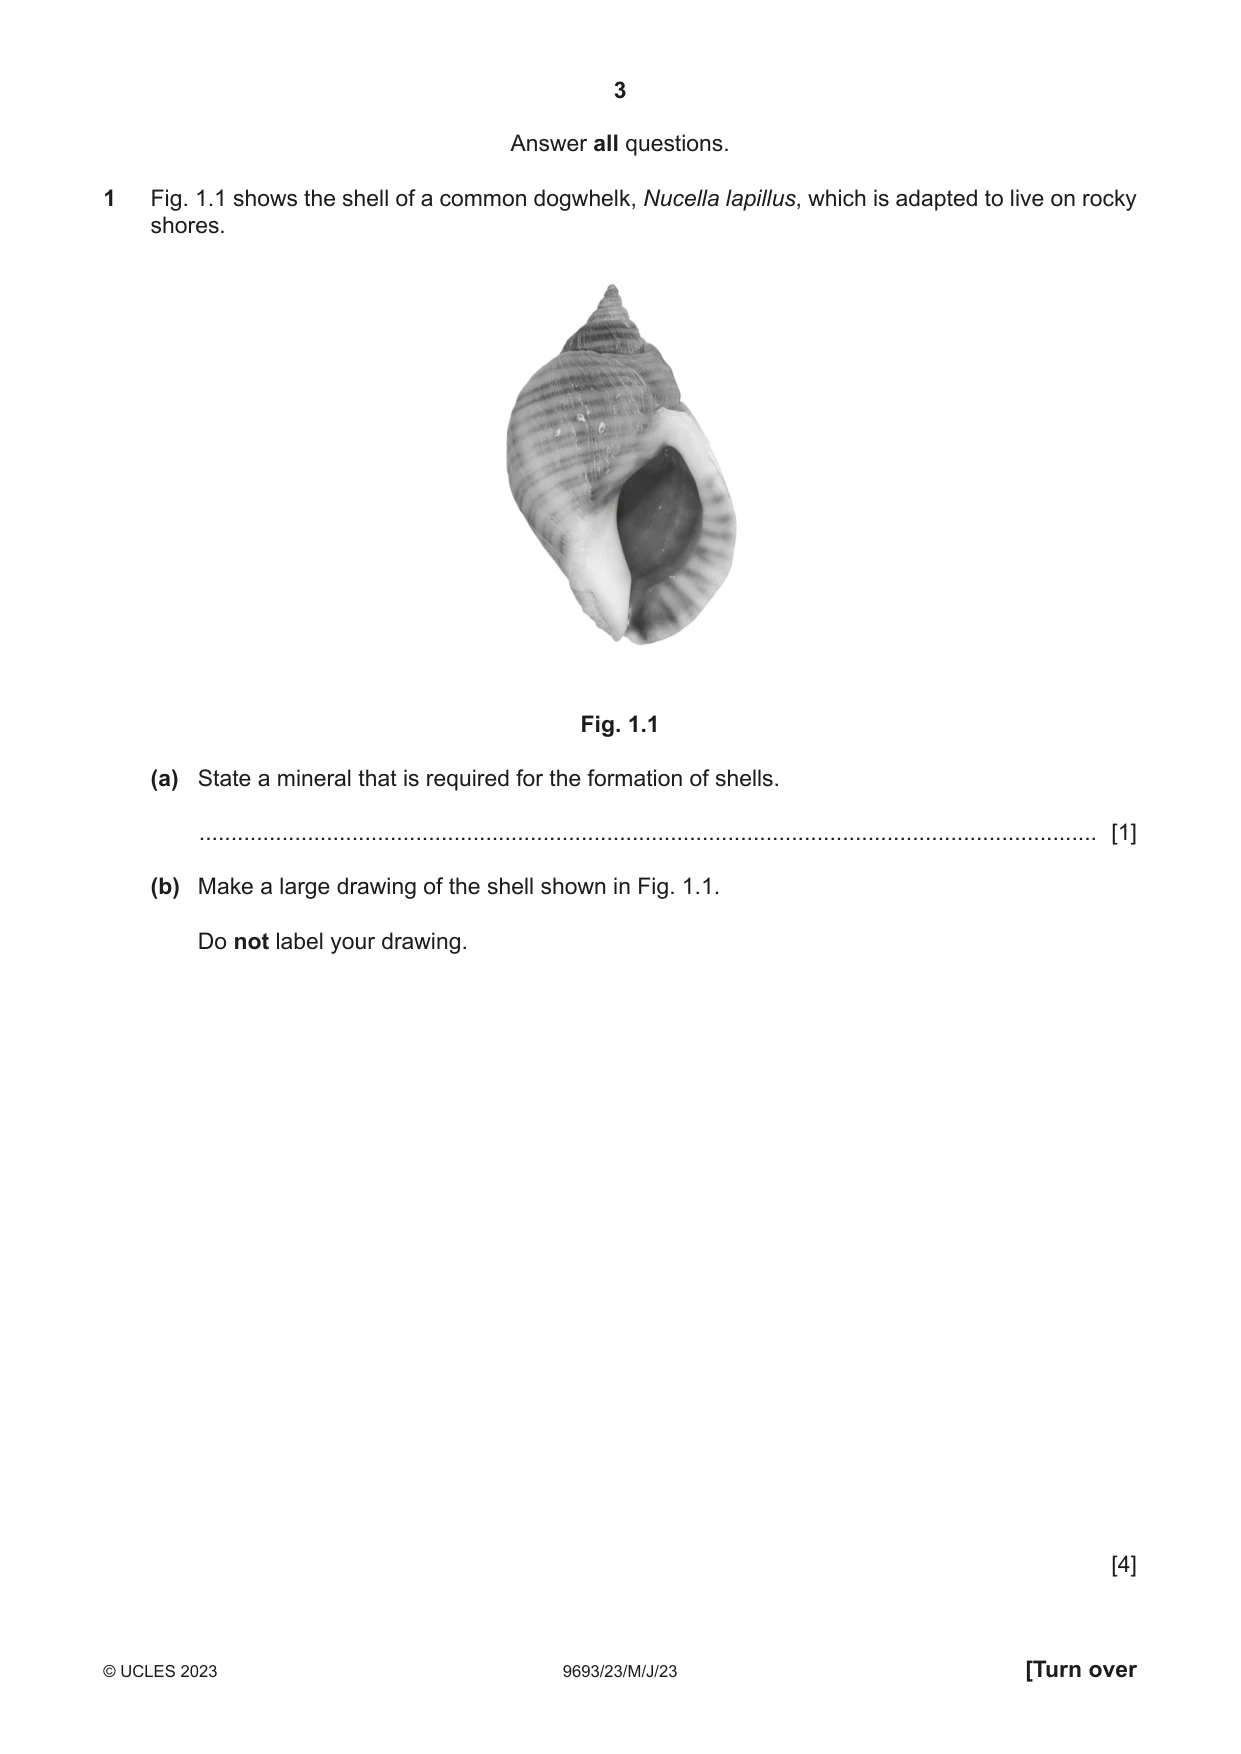
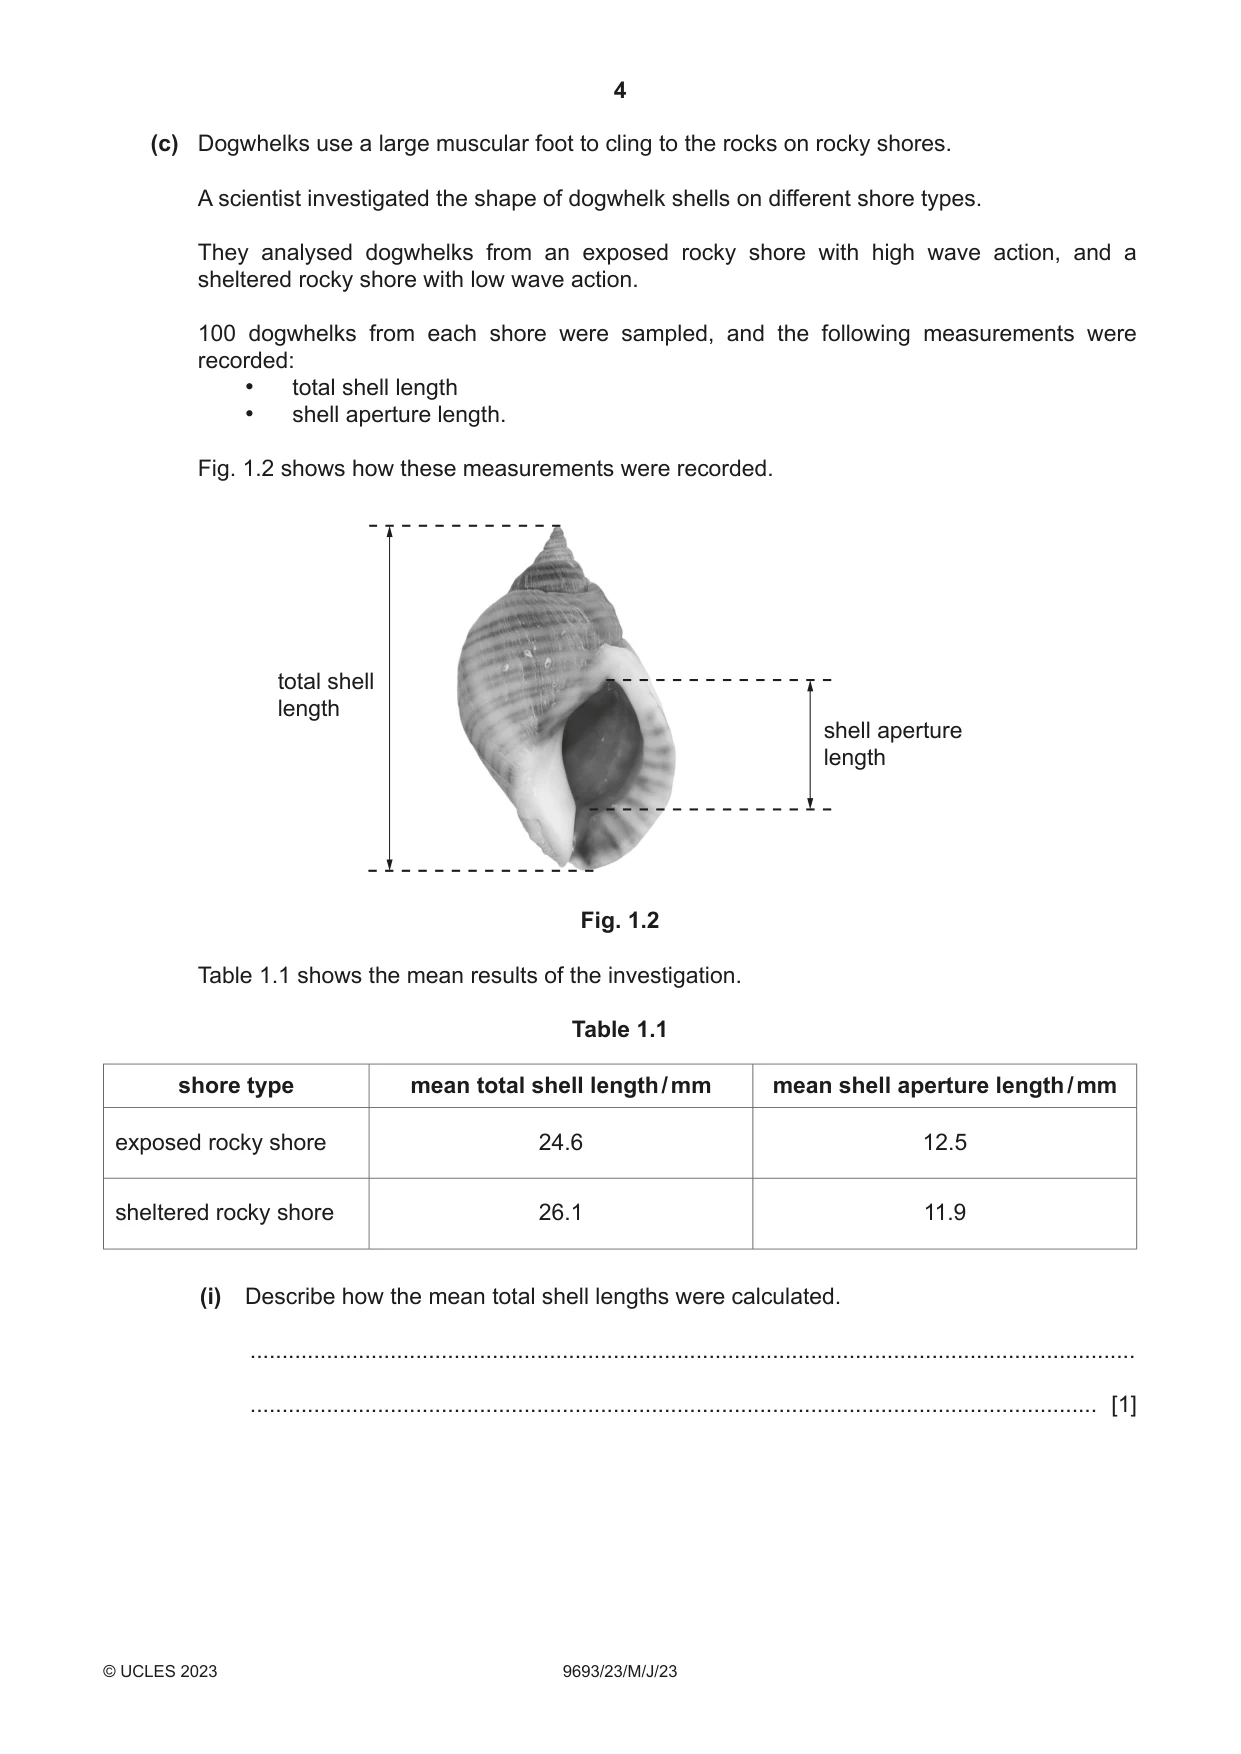
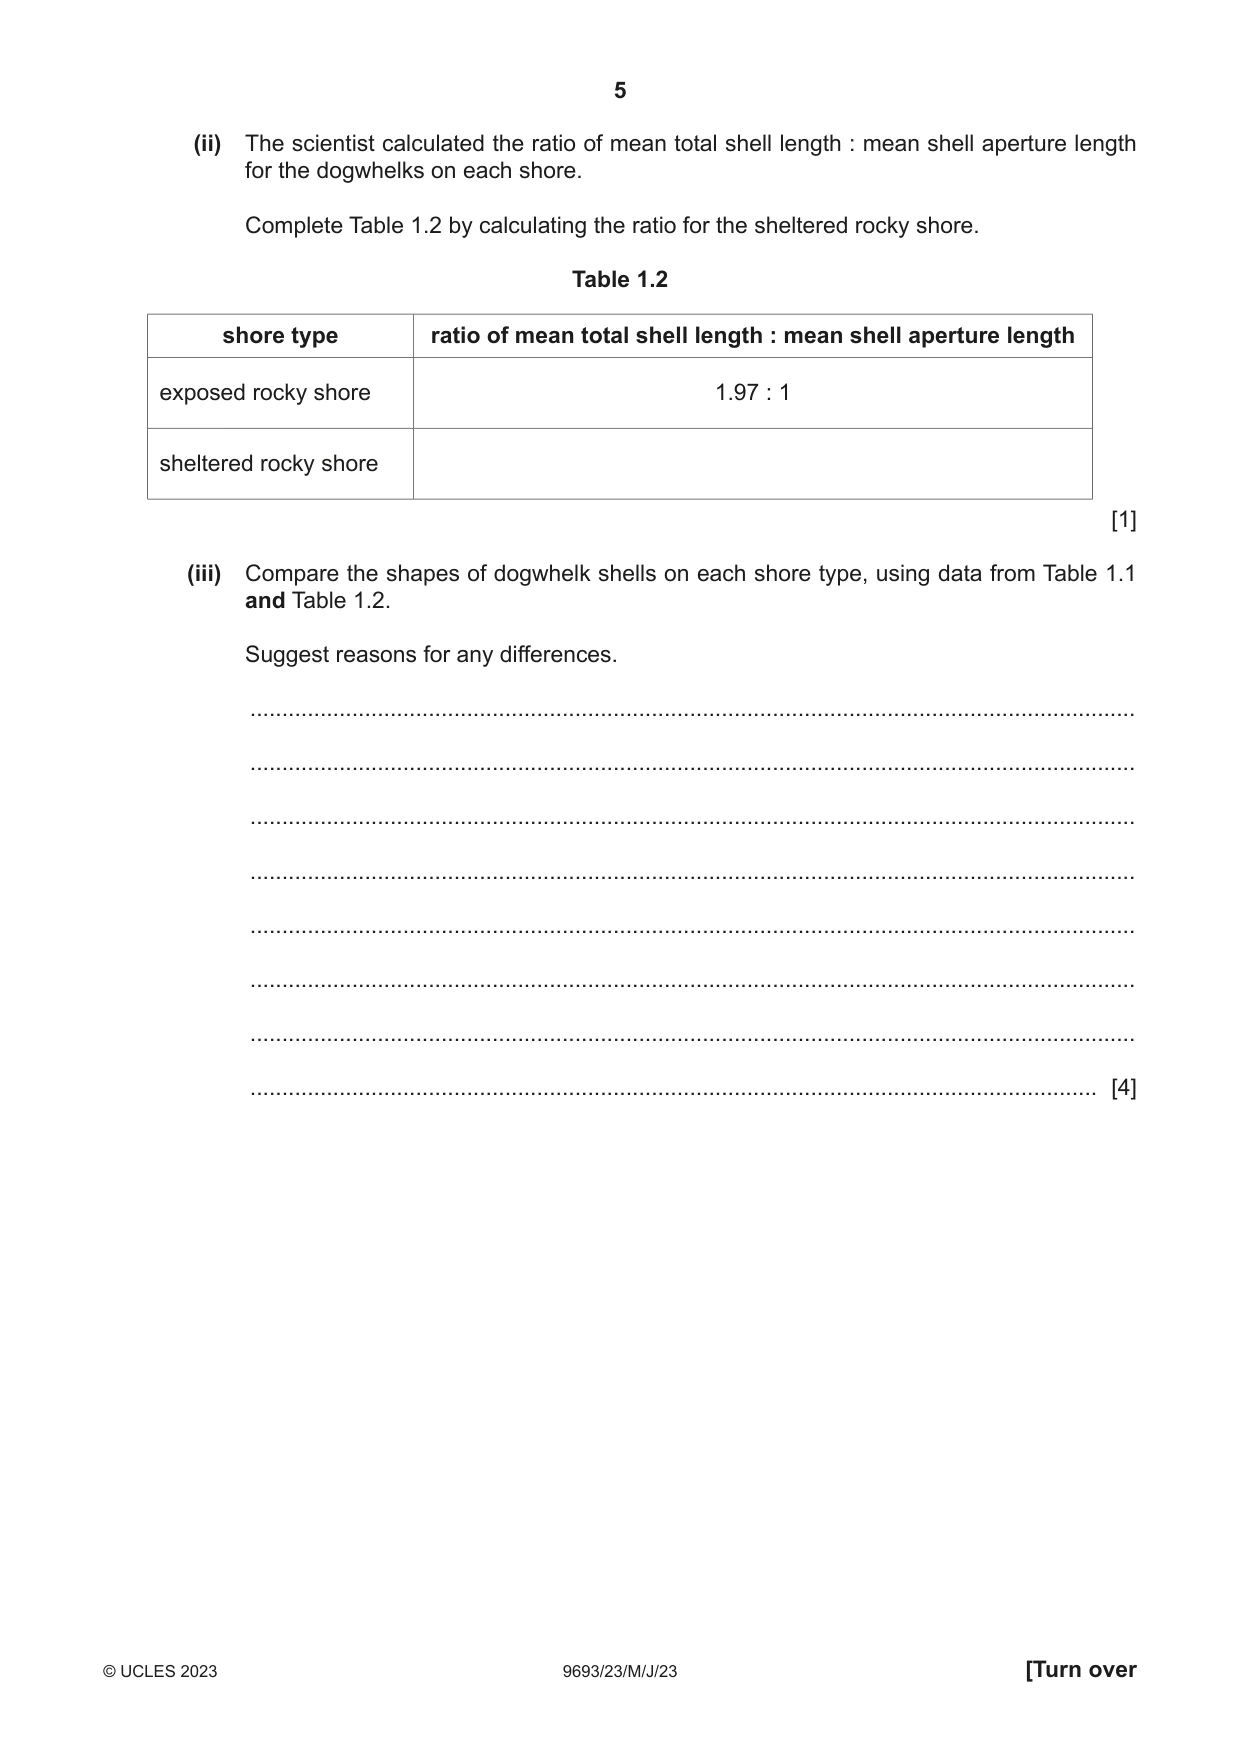
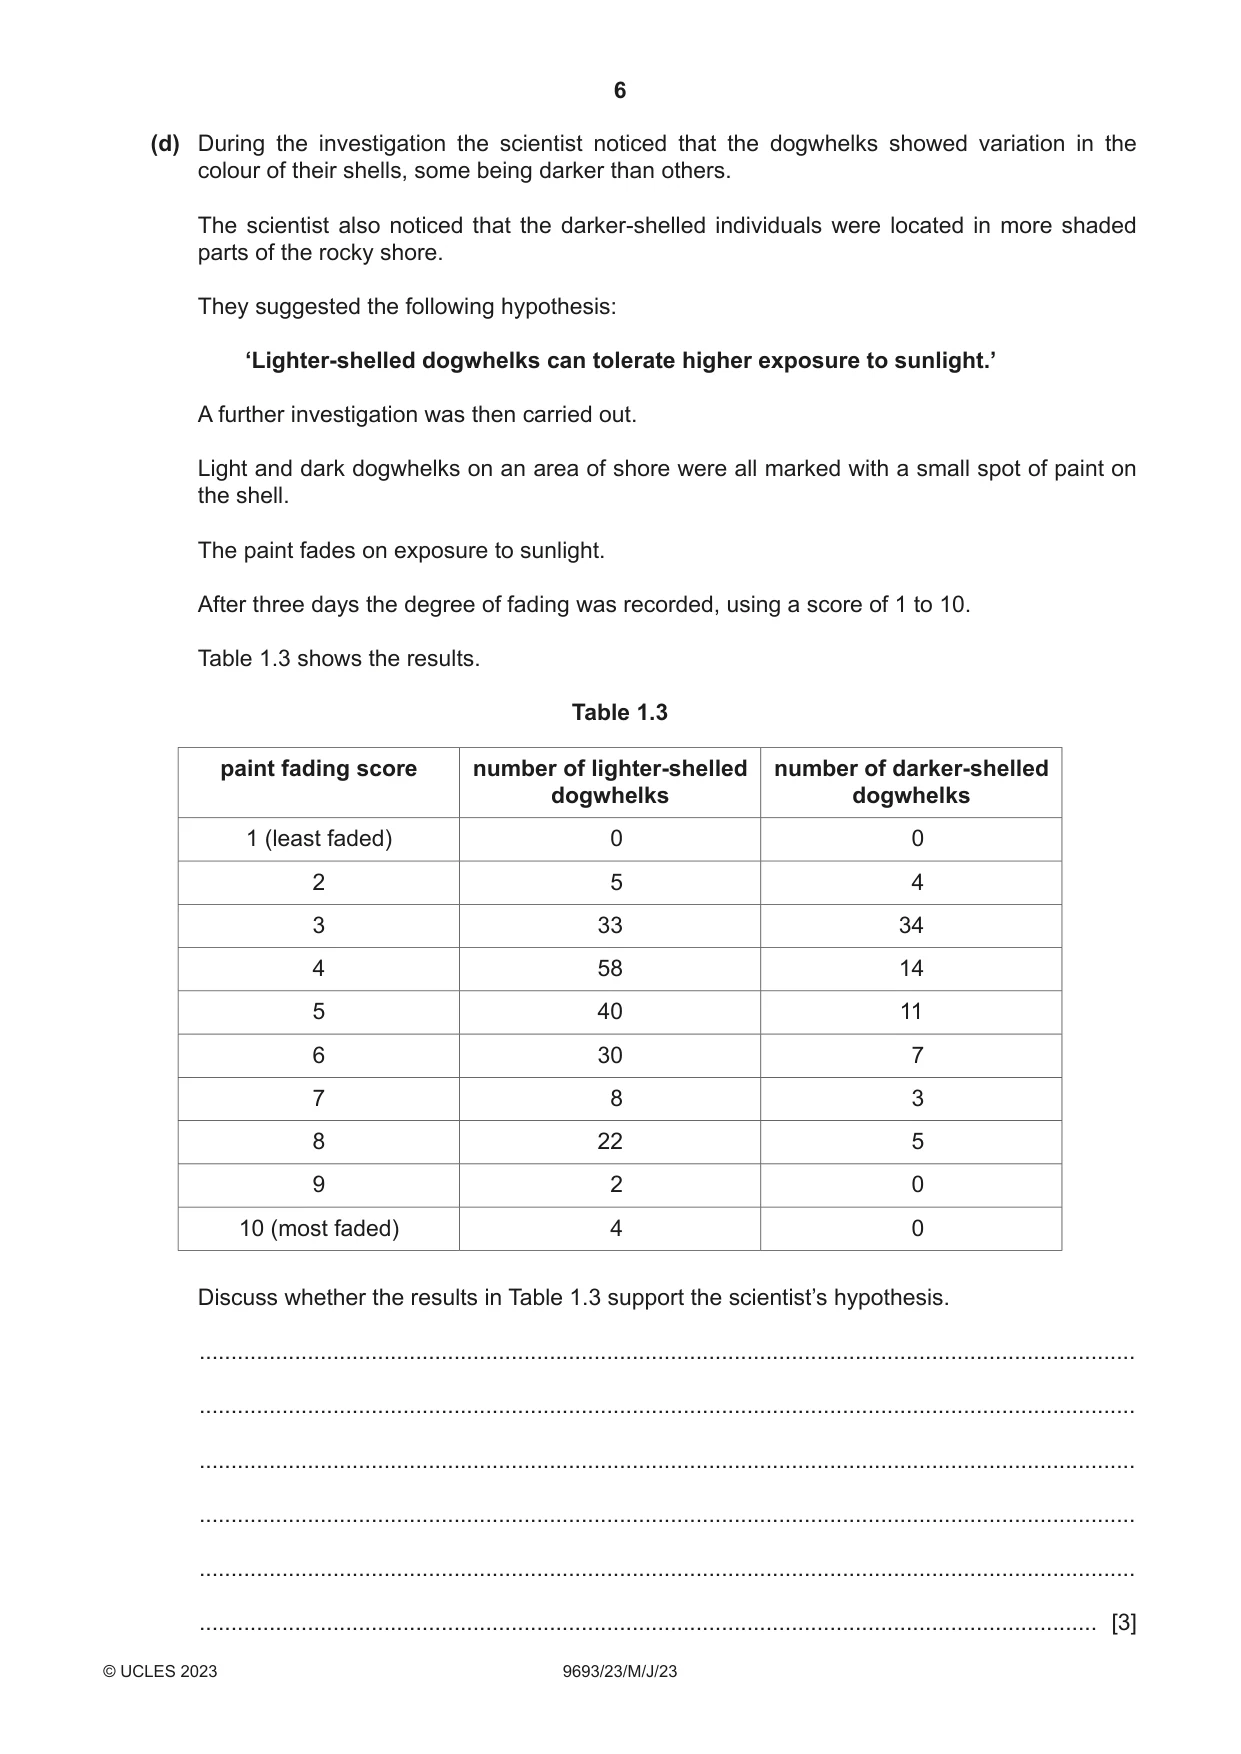
1 Fig. 1.1 shows the shell of a common dogwhelk, Nucella lapillus, which is adapted to live on rocky shores. Fig. 1.1 (a) State a mineral that is required for the formation of shells. ............................................................................................................................................. [1] (b) Make a large drawing of the shell shown in Fig. 1.1. Do not label your drawing. [4] (c) Dogwhelks use a large muscular foot to cling to the rocks on rocky shores. A scientist investigated the shape of dogwhelk shells on different shore types. They analysed dogwhelks from an exposed rocky shore with high wave action, and a sheltered rocky shore with low wave action. 100 dogwhelks from each shore were sampled, and the following measurements were recorded: • total shell length • shell aperture length. Fig. 1.2 shows how these measurements were recorded. total shell length shell aperture length Fig. 1.2 Table 1.1 shows the mean results of the investigation. Table 1.1 shore type mean total shell length / mm mean shell aperture length / mm exposed rocky shore 24.6 12.5 sheltered rocky shore 26.1 11.9 (i) Describe how the mean total shell lengths were calculated. ........................................................................................................................................... ..................................................................................................................................... [1] (ii) The scientist calculated the ratio of mean total shell length : mean shell aperture length for the dogwhelks on each shore. Complete Table 1.2 by calculating the ratio for the sheltered rocky shore. Table 1.2 shore type ratio of mean total shell length : mean shell aperture length exposed rocky shore 1.97 : 1 sheltered rocky shore [1] (iii) Compare the shapes of dogwhelk shells on each shore type, using data from Table 1.1 and Table 1.2. Suggest reasons for any differences. ........................................................................................................................................... ........................................................................................................................................... ........................................................................................................................................... ........................................................................................................................................... ........................................................................................................................................... ........................................................................................................................................... ........................................................................................................................................... ..................................................................................................................................... [4] (d) During the investigation the scientist noticed that the dogwhelks showed variation in the colour of their shells, some being darker than others. The scientist also noticed that the darker‑shelled individuals were located in more shaded parts of the rocky shore. They suggested the following hypothesis: ‘Lighter-shelled dogwhelks can tolerate higher exposure to sunlight.’ A further investigation was then carried out. Light and dark dogwhelks on an area of shore were all marked with a small spot of paint on the shell. The paint fades on exposure to sunlight. After three days the degree of fading was recorded, using a score of 1 to 10. Table 1.3 shows the results. Table 1.3 paint fading score number of lighter-shelled number of darker-shelled dogwhelks dogwhelks 1 (least faded) 0 0 2 5 4 3 33 34 4 58 14 5 40 11 6 30 7 7 8 3 8 22 5 9 2 0 10 (most faded) 4 0 Discuss whether the results in Table 1.3 support the scientist’s hypothesis. ................................................................................................................................................... ................................................................................................................................................... ................................................................................................................................................... ................................................................................................................................................... ................................................................................................................................................... ............................................................................................................................................. [3] (e) Suggest one way the scientist ensured their methods were ethical. ................................................................................................................................................... ............................................................................................................................................. [1] [Total: 15]
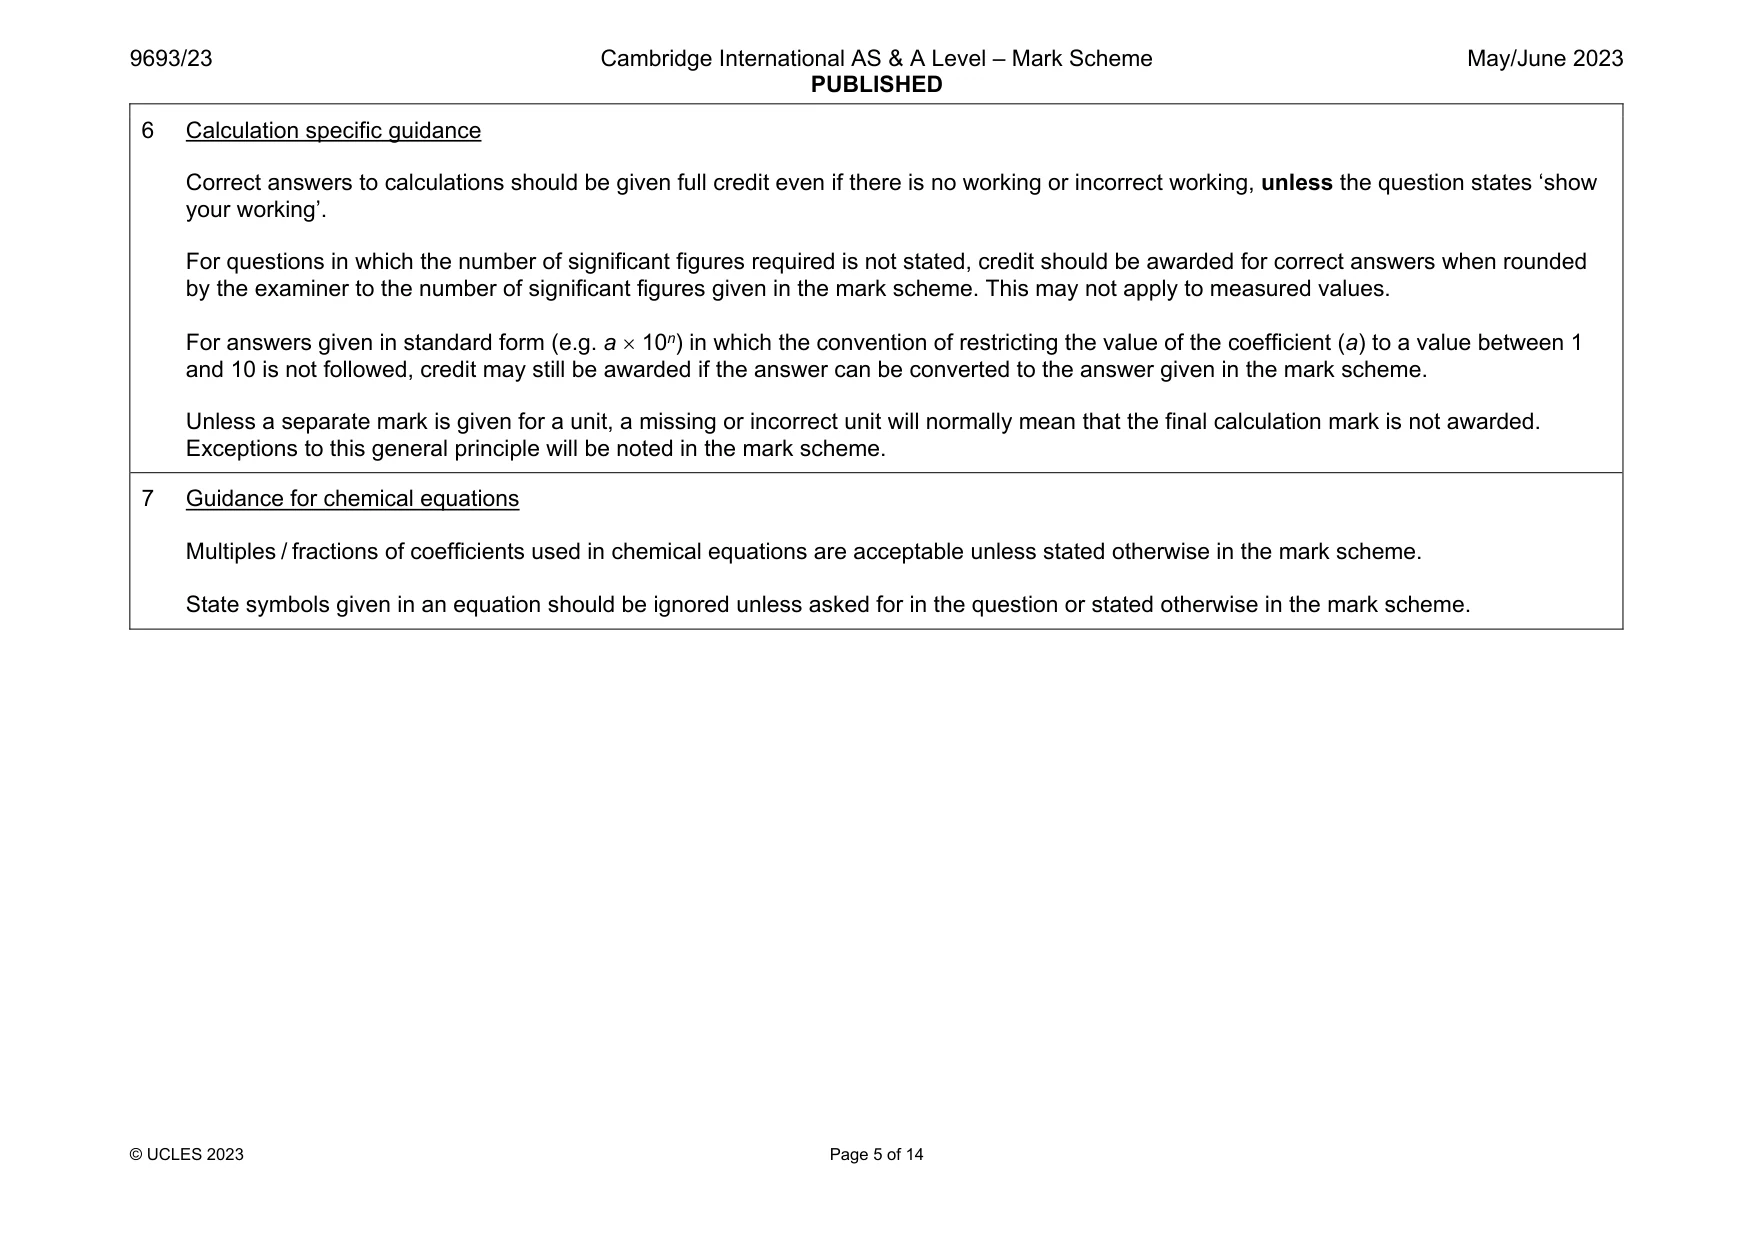
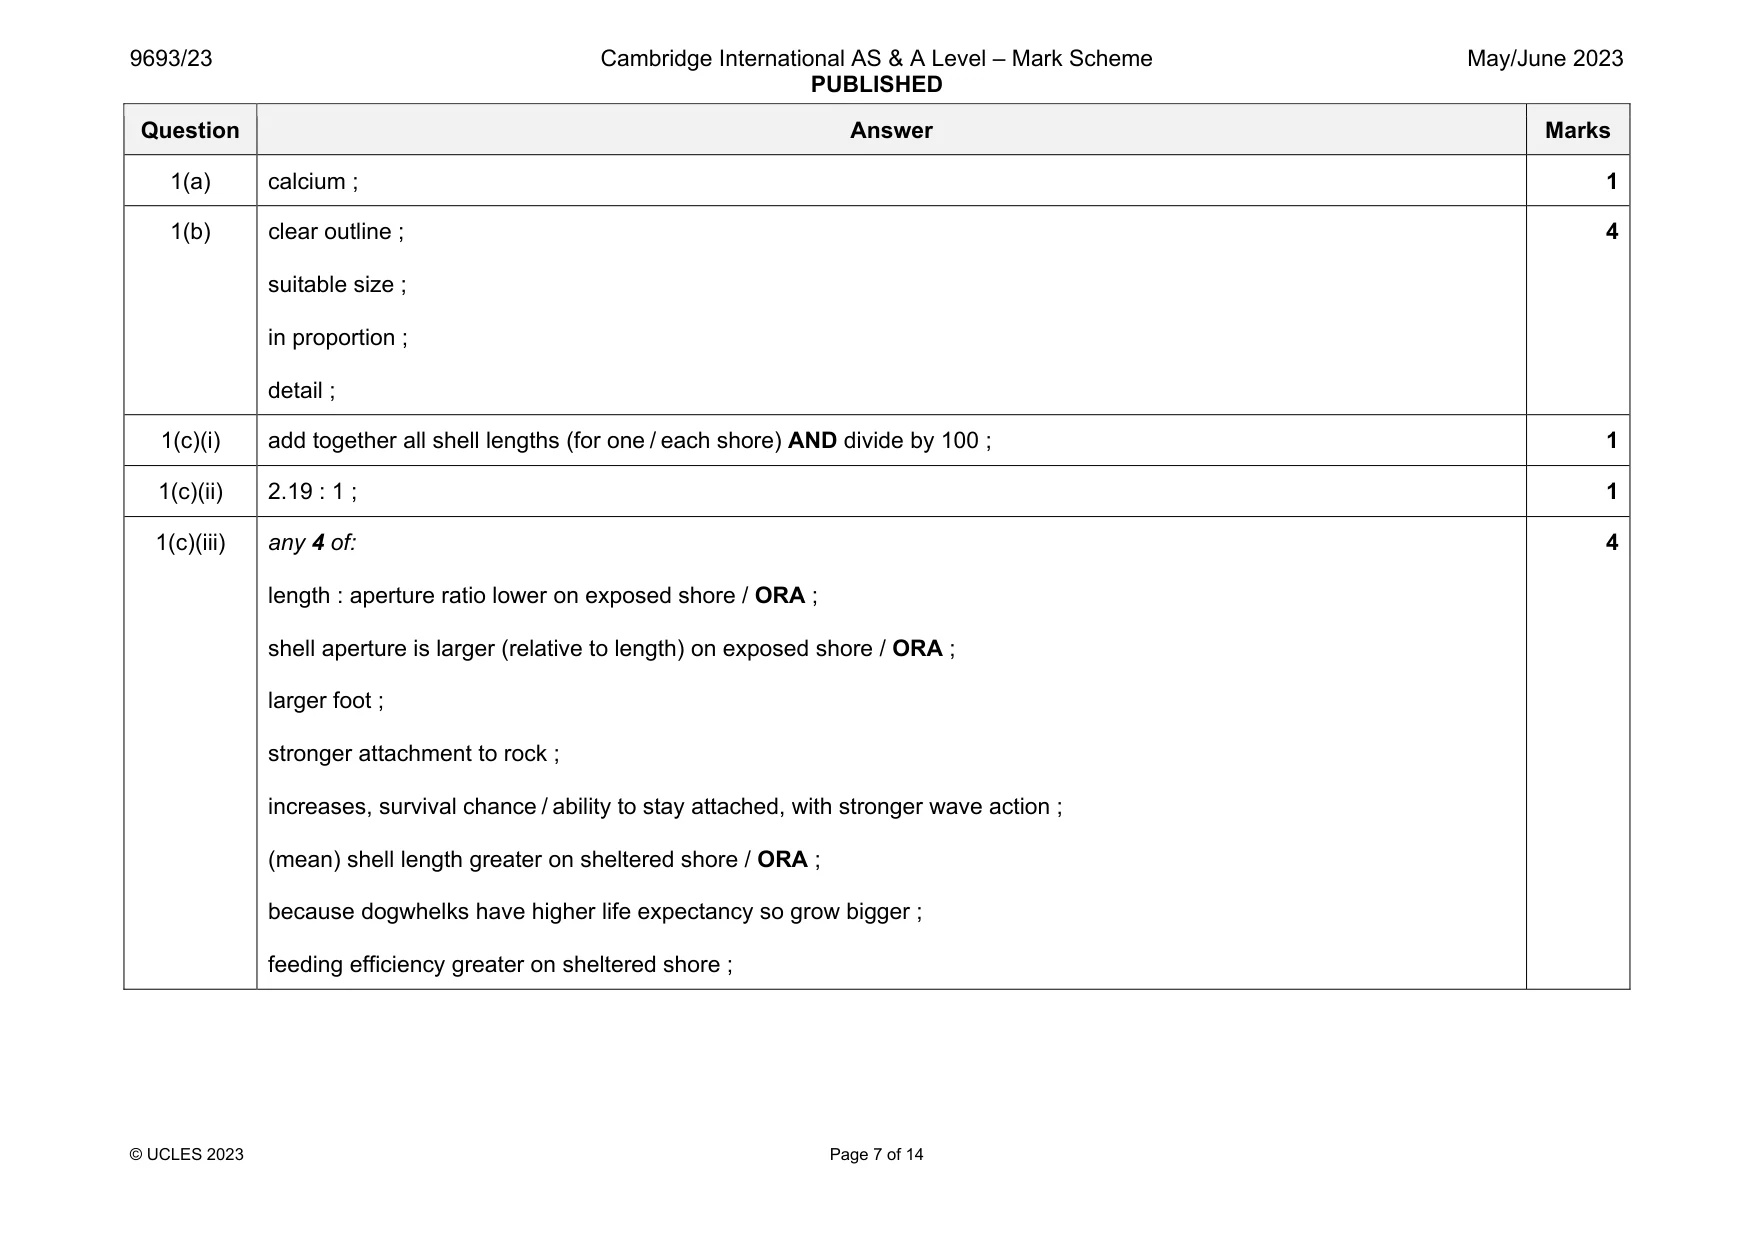
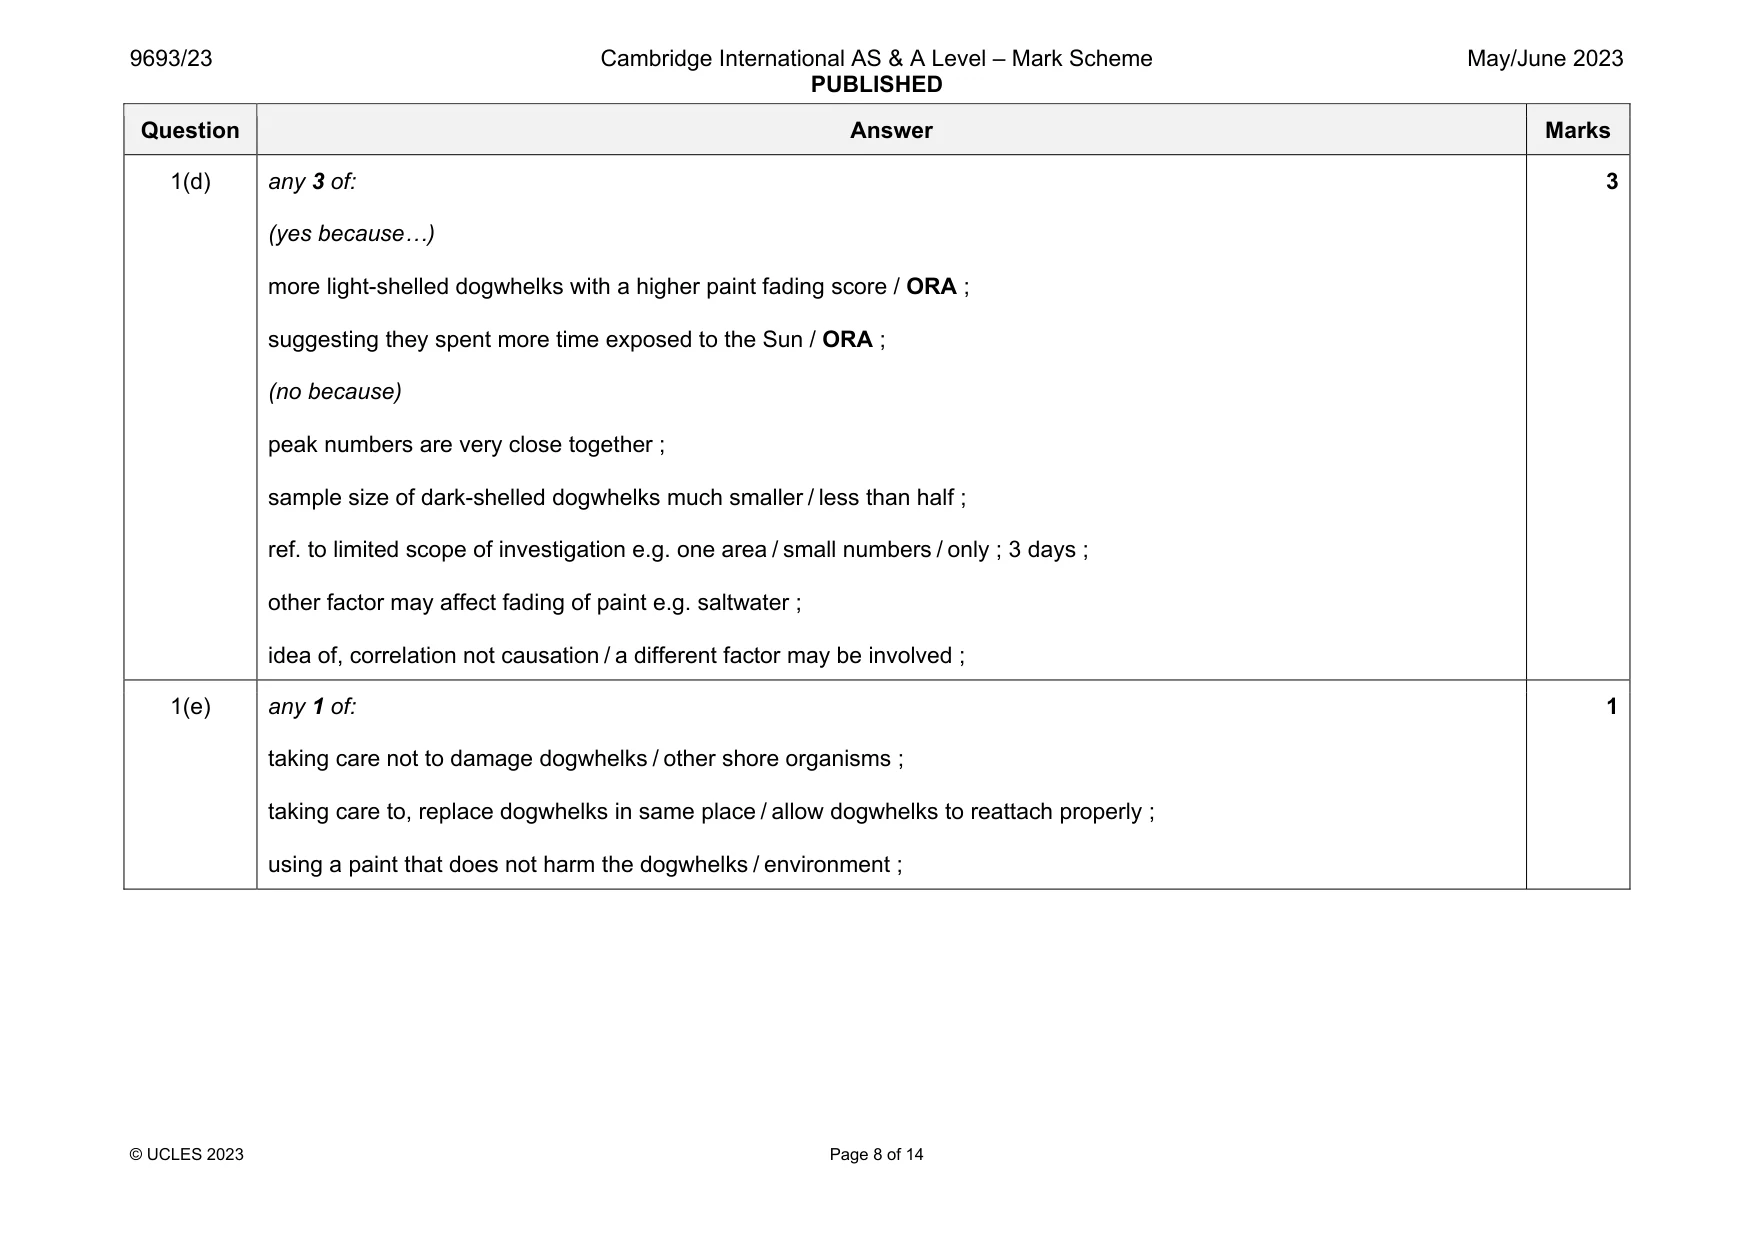
Mark scheme: 1(a) calcium ; 1 1(b) clear outline ; suitable size ; in proportion ; detail ; 4 1(c)(i) add together all shell lengths (for one / each shore) AND divide by 100 ; 1 1(c)(ii) 2.19 : 1 ; 1 1(c)(iii) any 4 of: length : aperture ratio lower on exposed shore / ORA ; shell aperture is larger (relative to length) on exposed shore / ORA ; larger foot ; stronger attachment to rock ; increases, survival chance / ability to stay attached, with stronger wave action ; (mean) shell length greater on sheltered shore / ORA ; because dogwhelks have higher life expectancy so grow bigger ; feeding efficiency greater on sheltered shore ; 4 Question Answer Marks 1(d) any 3 of: (yes because…) more light-shelled dogwhelks with a higher paint fading score / ORA ; suggesting they spent more time exposed to the Sun / ORA ; (no because) peak numbers are very close together ; sample size of dark-shelled dogwhelks much smaller / less than half ; ref. to limited scope of investigation e.g. one area / small numbers / only ; 3 days ; other factor may affect fading of paint e.g. saltwater ; idea of, correlation not causation / a different factor may be involved ; 3 1(e) any 1 of: taking care not to damage dogwhelks / other shore organisms ; taking care to, replace dogwhelks in same place / allow dogwhelks to reattach properly ; using a paint that does not harm the dogwhelks / environment ; 1
Q2 · Apparatus used to investigate the rate of photosynthesis in the laboratory
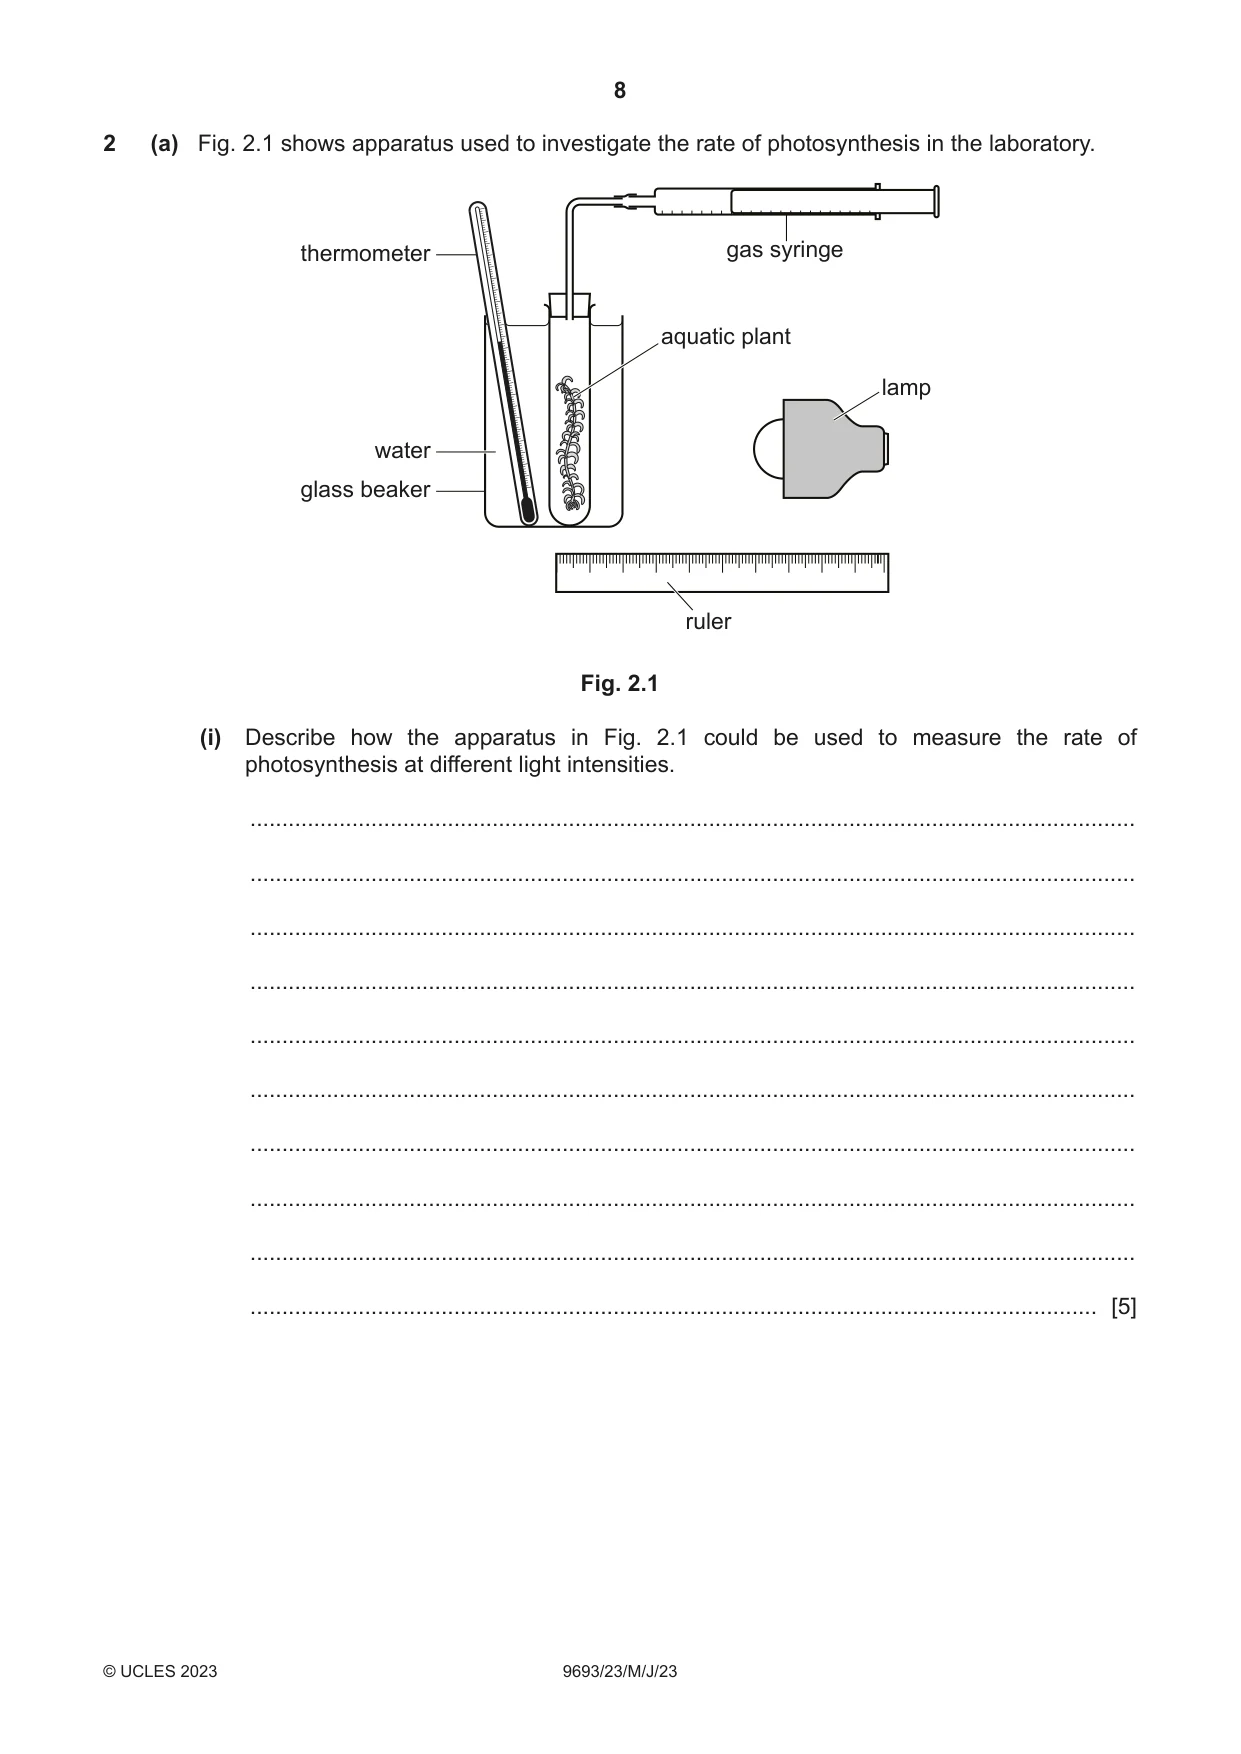
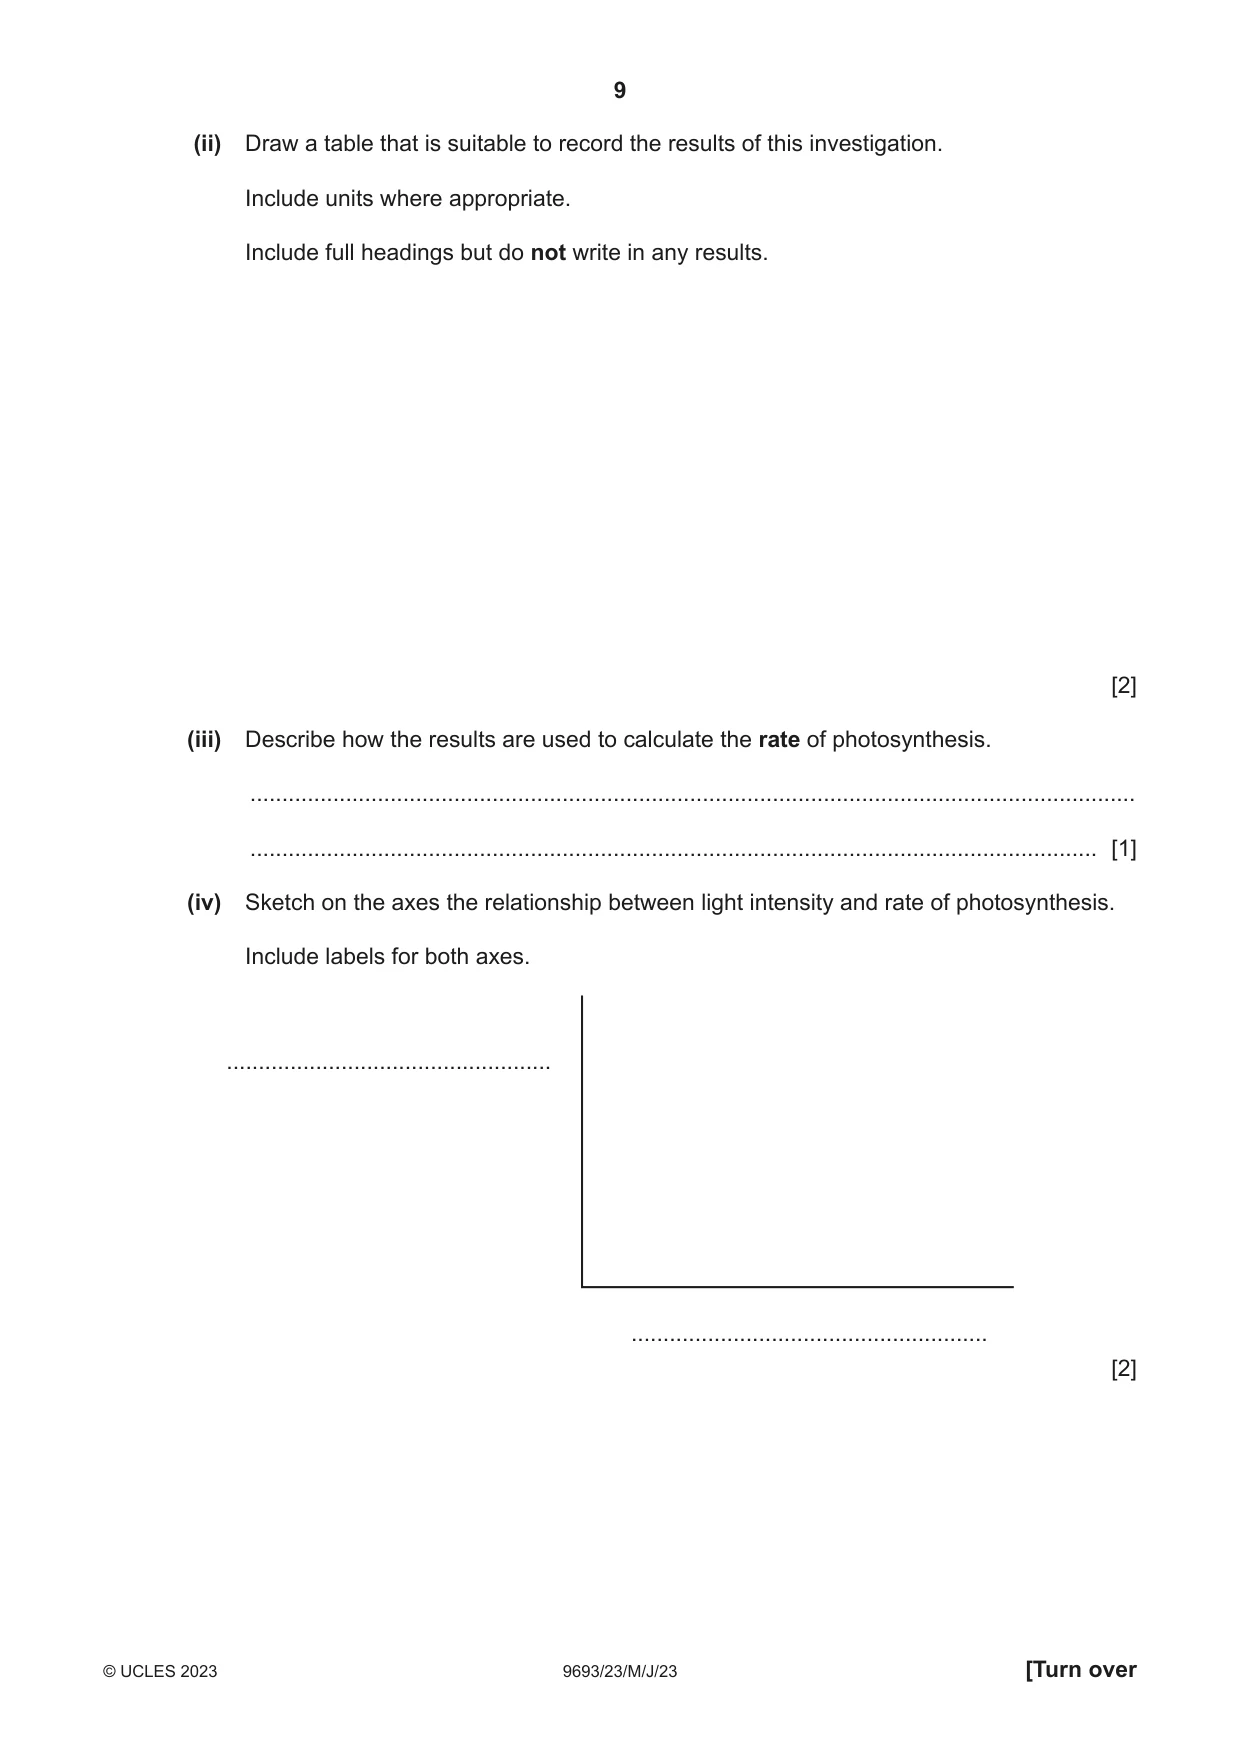
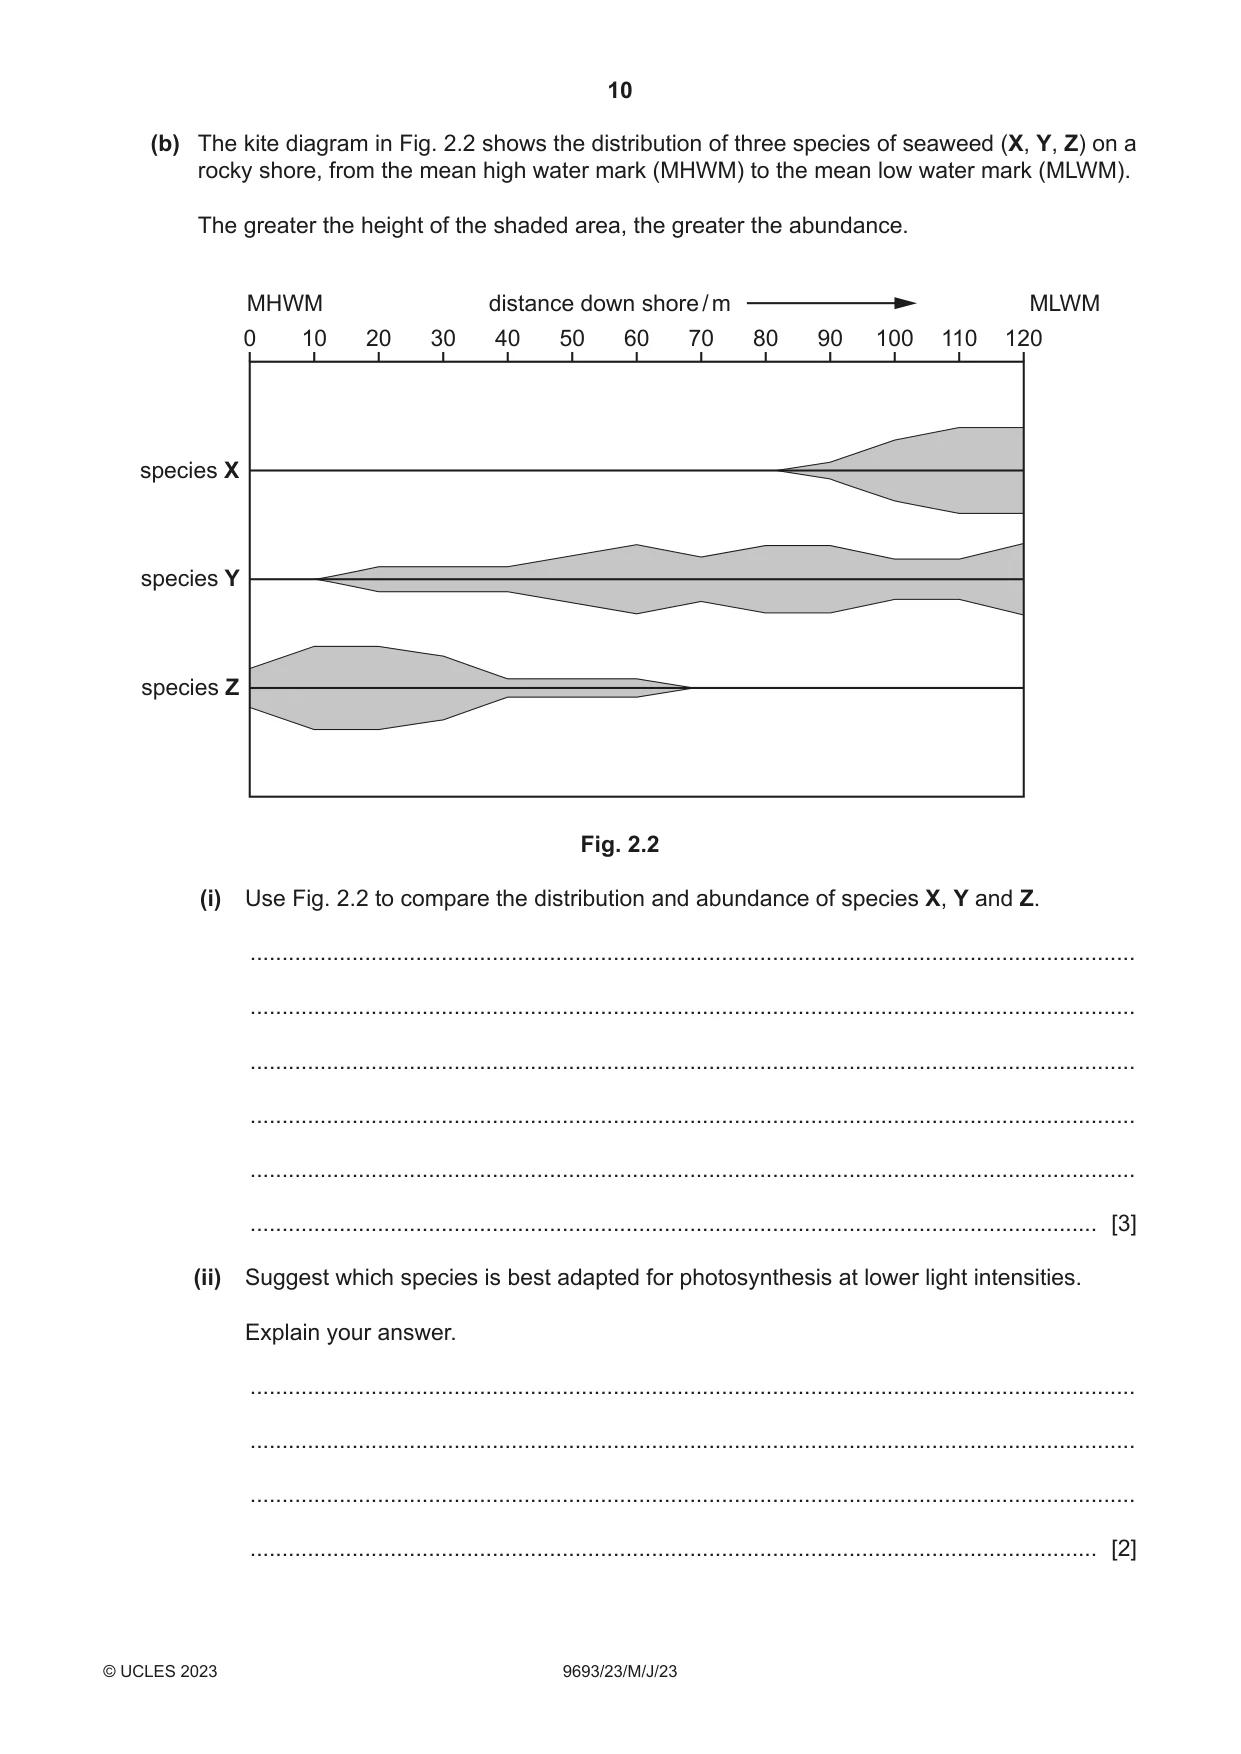
2 (a) Fig. 2.1 shows apparatus used to investigate the rate of photosynthesis in the laboratory. thermometer gas syringe aquatic plant lamp water glass beaker ruler Fig. 2.1 (i) Describe how the apparatus in Fig. 2.1 could be used to measure the rate of photosynthesis at different light intensities. ........................................................................................................................................... ........................................................................................................................................... ........................................................................................................................................... ........................................................................................................................................... ........................................................................................................................................... ........................................................................................................................................... ........................................................................................................................................... ........................................................................................................................................... ........................................................................................................................................... ..................................................................................................................................... [5] (ii) Draw a table that is suitable to record the results of this investigation. Include units where appropriate. Include full headings but do not write in any results. [2] (iii) Describe how the results are used to calculate the rate of photosynthesis. ........................................................................................................................................... ..................................................................................................................................... [1] (iv) Sketch on the axes the relationship between light intensity and rate of photosynthesis. Include labels for both axes. ................................................... ........................................................ [2] (b) The kite diagram in Fig. 2.2 shows the distribution of three species of seaweed (X, Y, Z) on a rocky shore, from the mean high water mark (MHWM) to the mean low water mark (MLWM). The greater the height of the shaded area, the greater the abundance. MHWM distance down shore / m MLWM 0 10 20 30 40 50 60 70 80 90 100 110 120 species X species Y species Z Fig. 2.2 (i) Use Fig. 2.2 to compare the distribution and abundance of species X, Y and Z. ........................................................................................................................................... ........................................................................................................................................... ........................................................................................................................................... ........................................................................................................................................... ........................................................................................................................................... ..................................................................................................................................... [3] (ii) Suggest which species is best adapted for photosynthesis at lower light intensities. Explain your answer. ........................................................................................................................................... ........................................................................................................................................... ........................................................................................................................................... ..................................................................................................................................... [2] (iii) Suggest how species Z may be adapted to survive at the mean high water mark. Explain your answer. ........................................................................................................................................... ........................................................................................................................................... ........................................................................................................................................... ..................................................................................................................................... [2] [Total: 17]
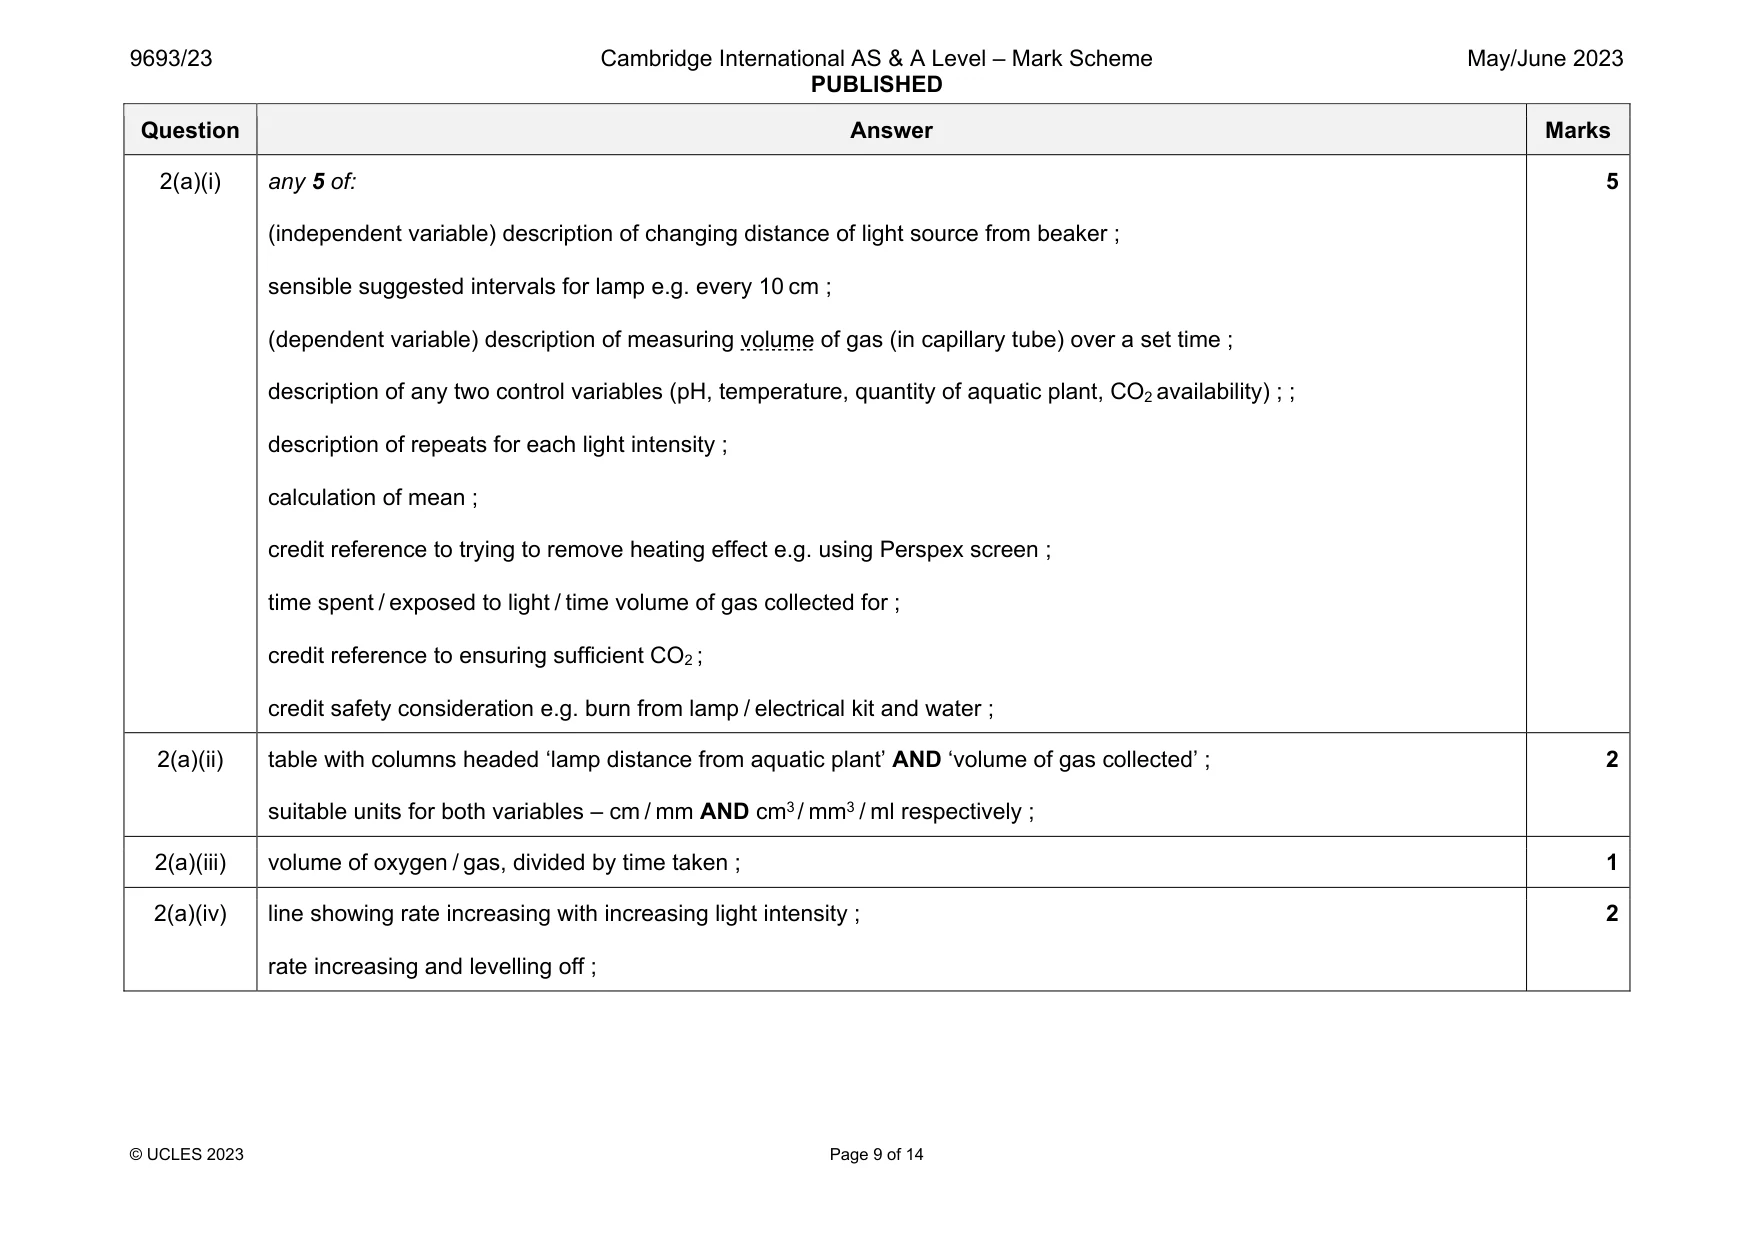
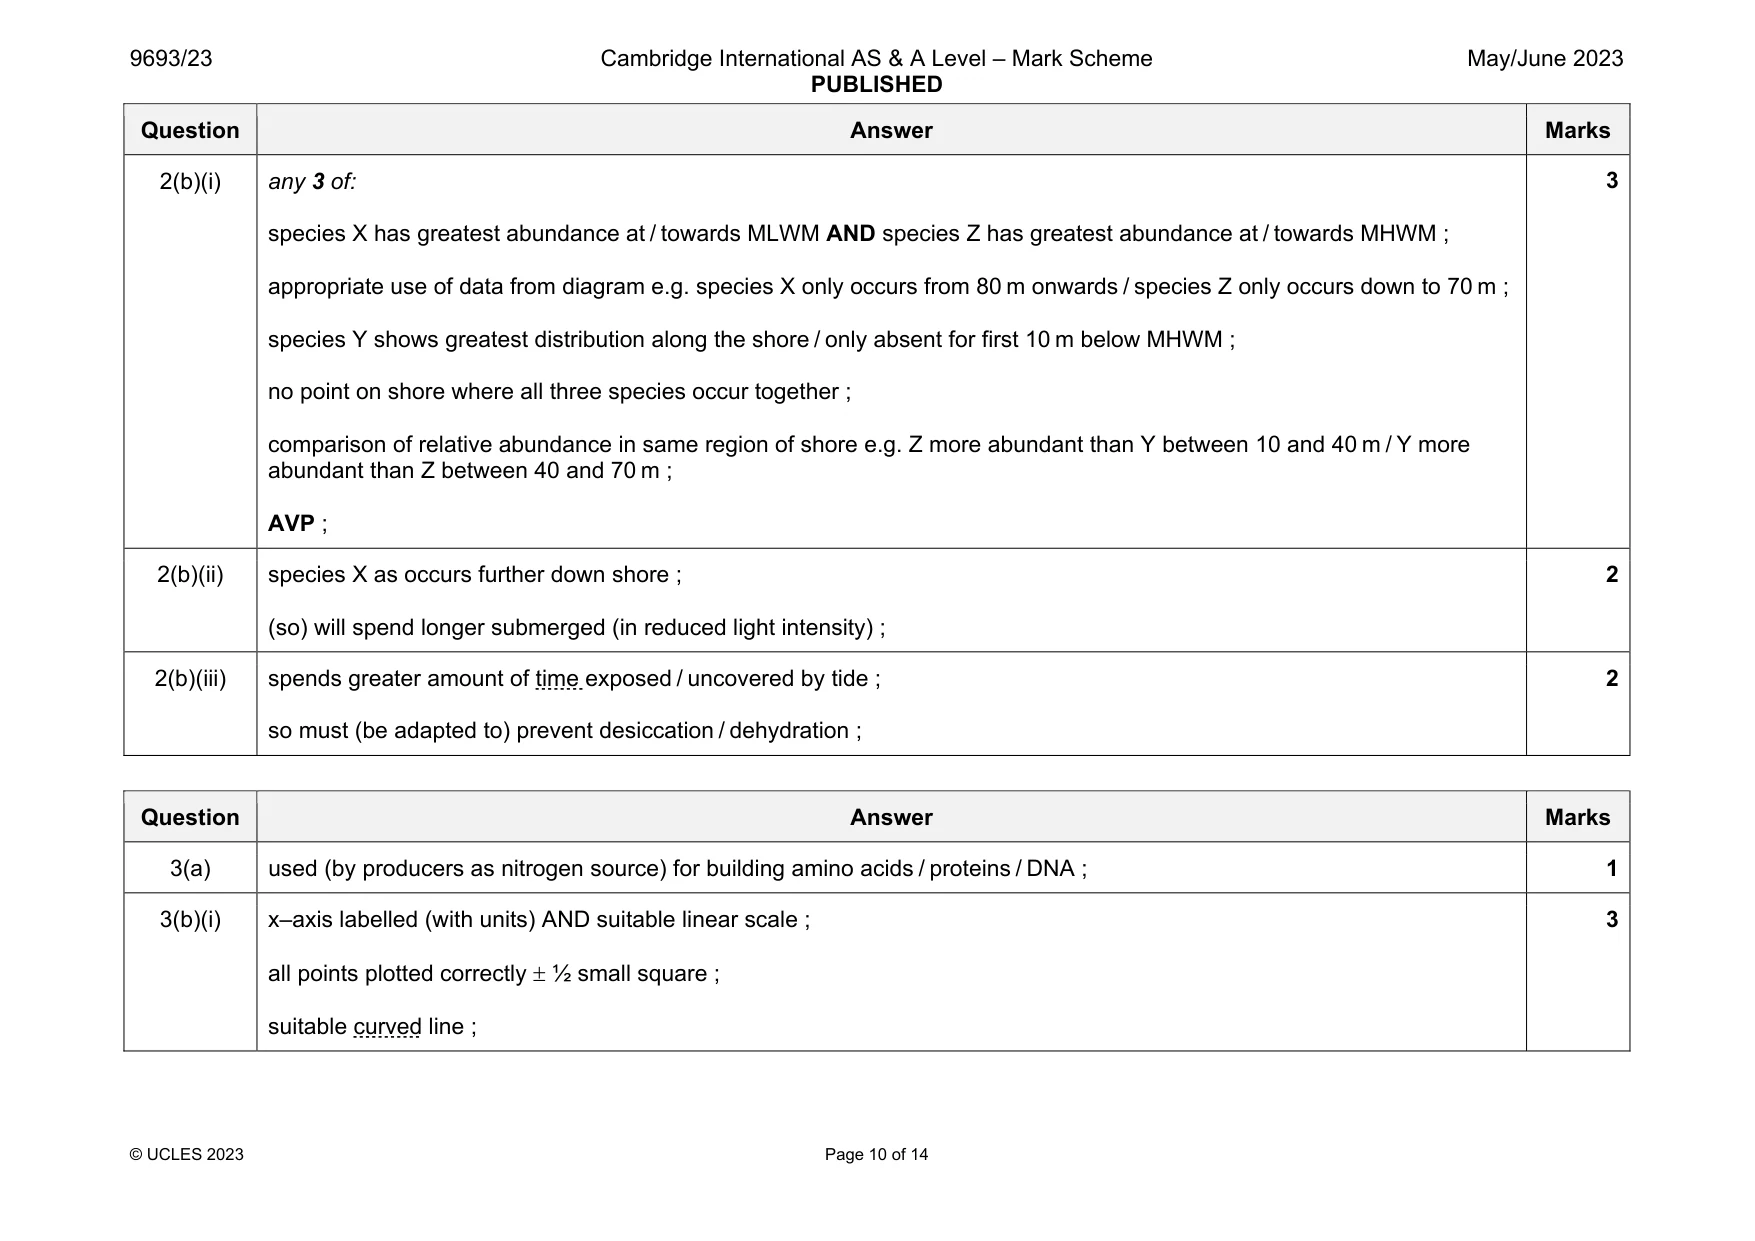
Mark scheme: 2(a)(i) any 5 of: (independent variable) description of changing distance of light source from beaker ; sensible suggested intervals for lamp e.g. every 10 cm ; (dependent variable) description of measuring volume of gas (in capillary tube) over a set time ; description of any two control variables (pH, temperature, quantity of aquatic plant, CO2 availability) ; ; description of repeats for each light intensity ; calculation of mean ; credit reference to trying to remove heating effect e.g. using Perspex screen ; time spent / exposed to light / time volume of gas collected for ; credit reference to ensuring sufficient CO2 ; credit safety consideration e.g. burn from lamp / electrical kit and water ; 5 2(a)(ii) table with columns headed ‘lamp distance from aquatic plant’ AND ‘volume of gas collected’ ; suitable units for both variables – cm / mm AND cm3 / mm3 / ml respectively ; 2 2(a)(iii) volume of oxygen / gas, divided by time taken ; 1 2(a)(iv) line showing rate increasing with increasing light intensity ; rate increasing and levelling off ; 2 Question Answer Marks 2(b)(i) any 3 of: species X has greatest abundance at / towards MLWM AND species Z has greatest abundance at / towards MHWM ; appropriate use of data from diagram e.g. species X only occurs from 80 m onwards / species Z only occurs down to 70 m ; species Y shows greatest distribution along the shore / only absent for first 10 m below MHWM ; no point on shore where all three species occur together ; comparison of relative abundance in same region of shore e.g. Z more abundant than Y between 10 and 40 m / Y more abundant than Z between 40 and 70 m ; AVP ; 3 2(b)(ii) species X as occurs further down shore ; (so) will spend longer submerged (in reduced light intensity) ; 2 2(b)(iii) spends greater amount of time exposed / uncovered by tide ; so must (be adapted to) prevent desiccation / dehydration ; 2
Q3 · Nitrates are an important source of nitrogen
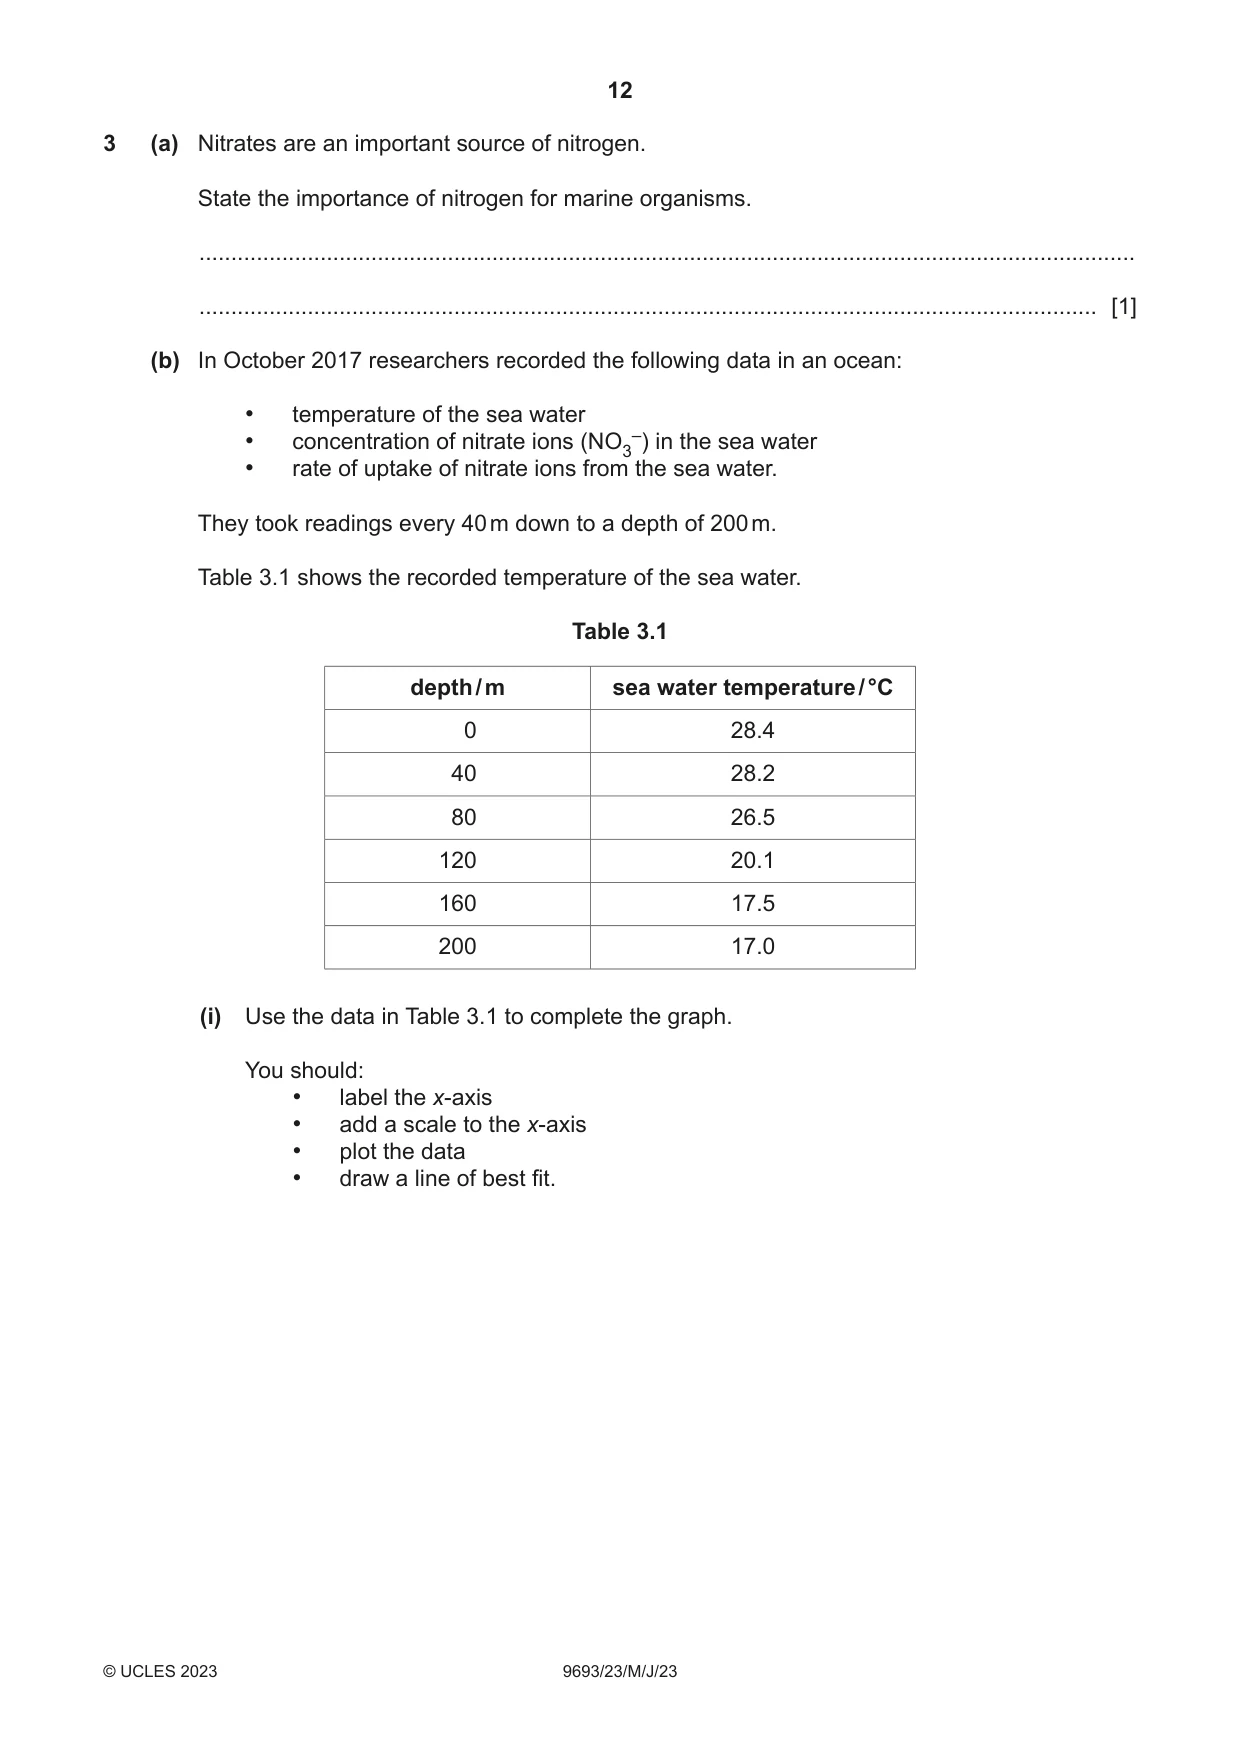
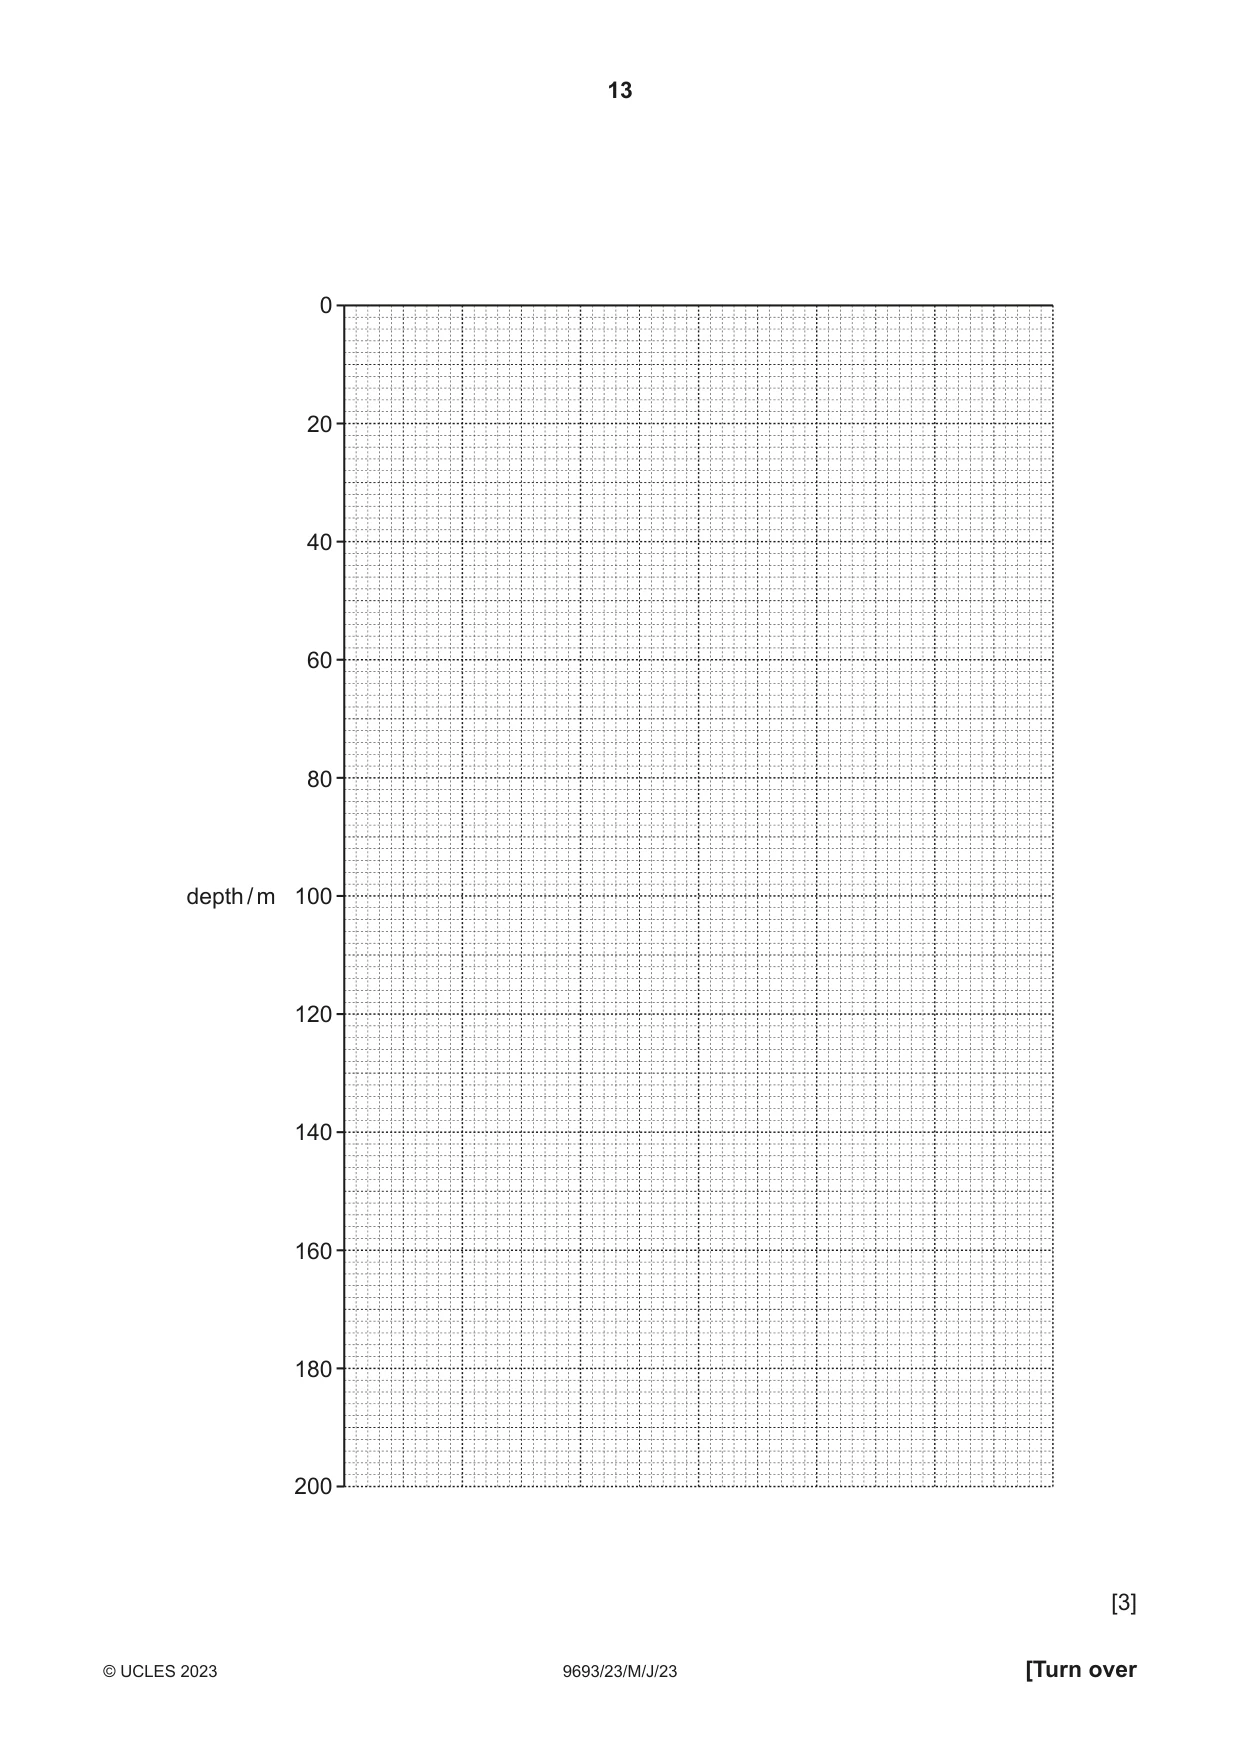
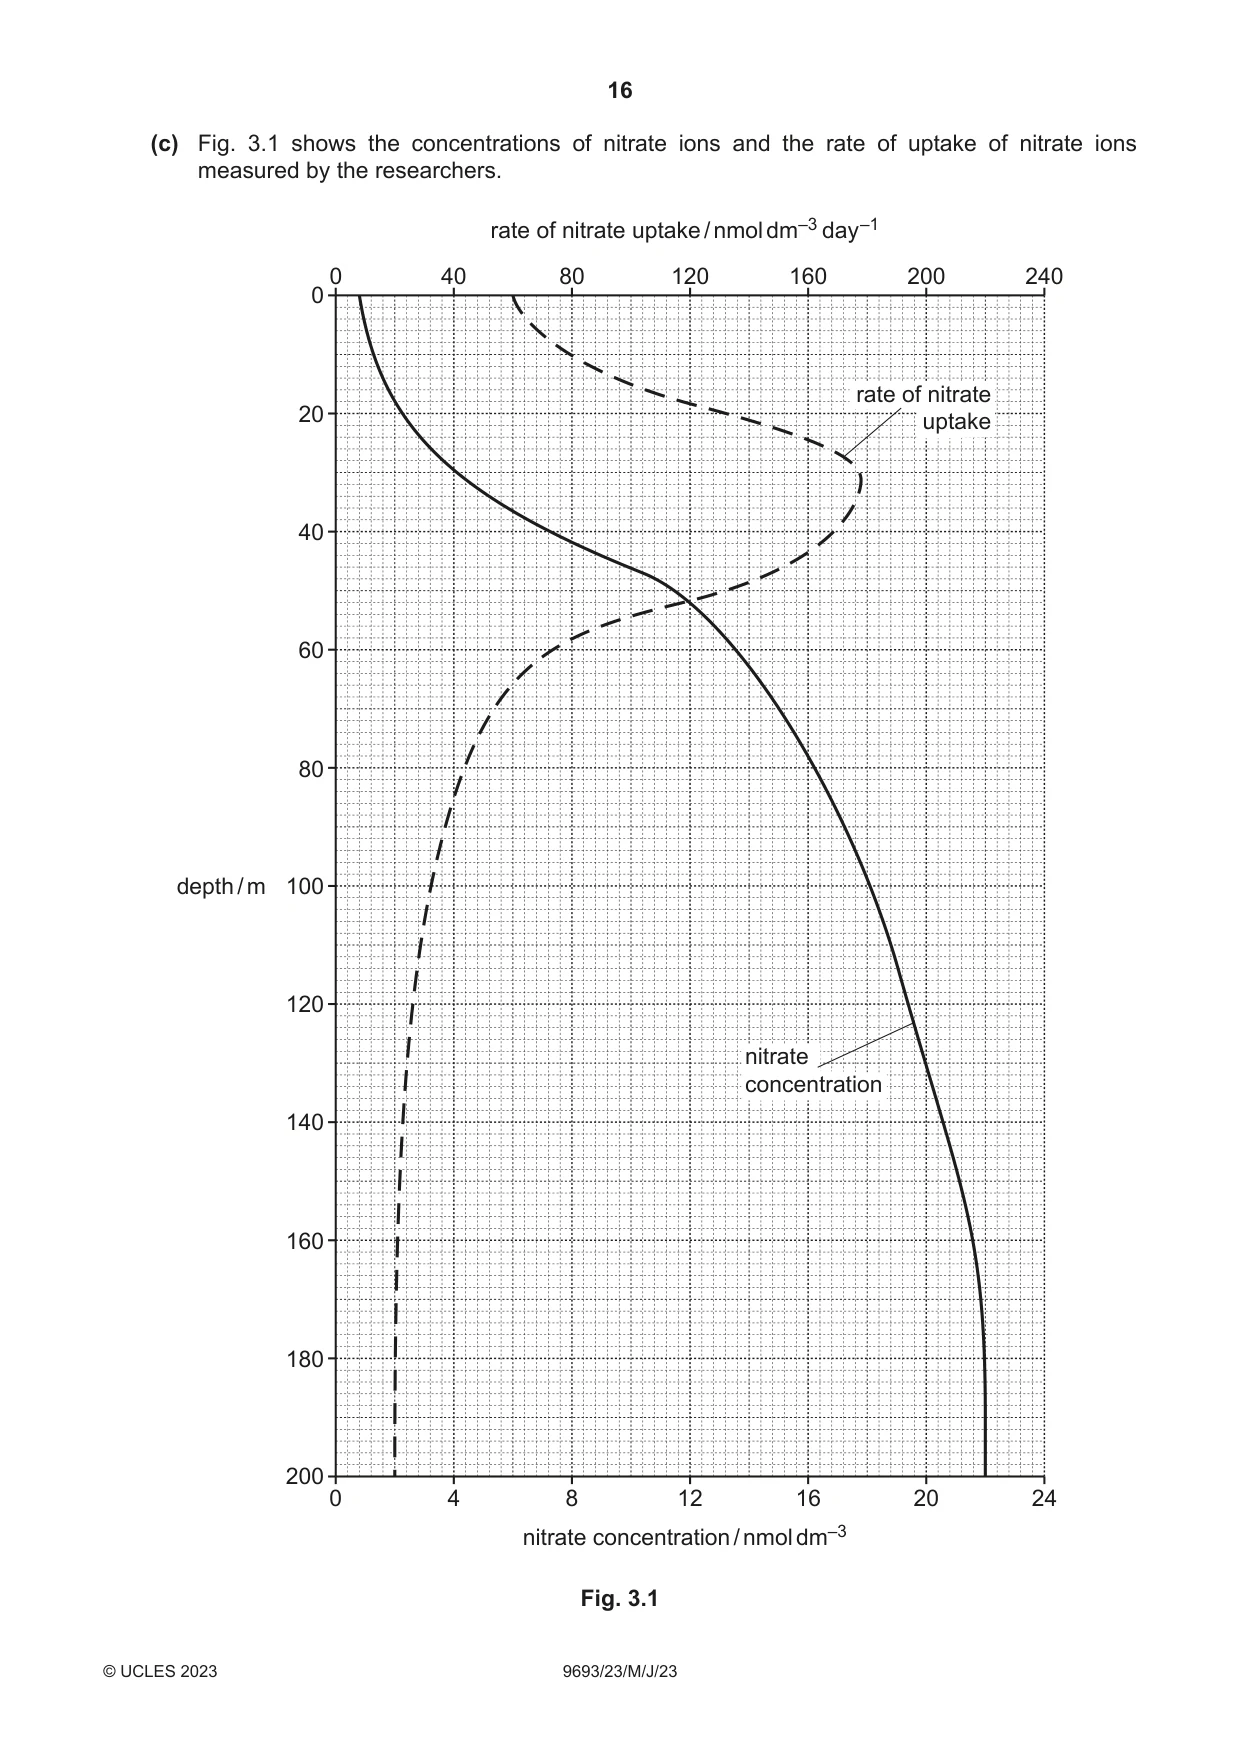
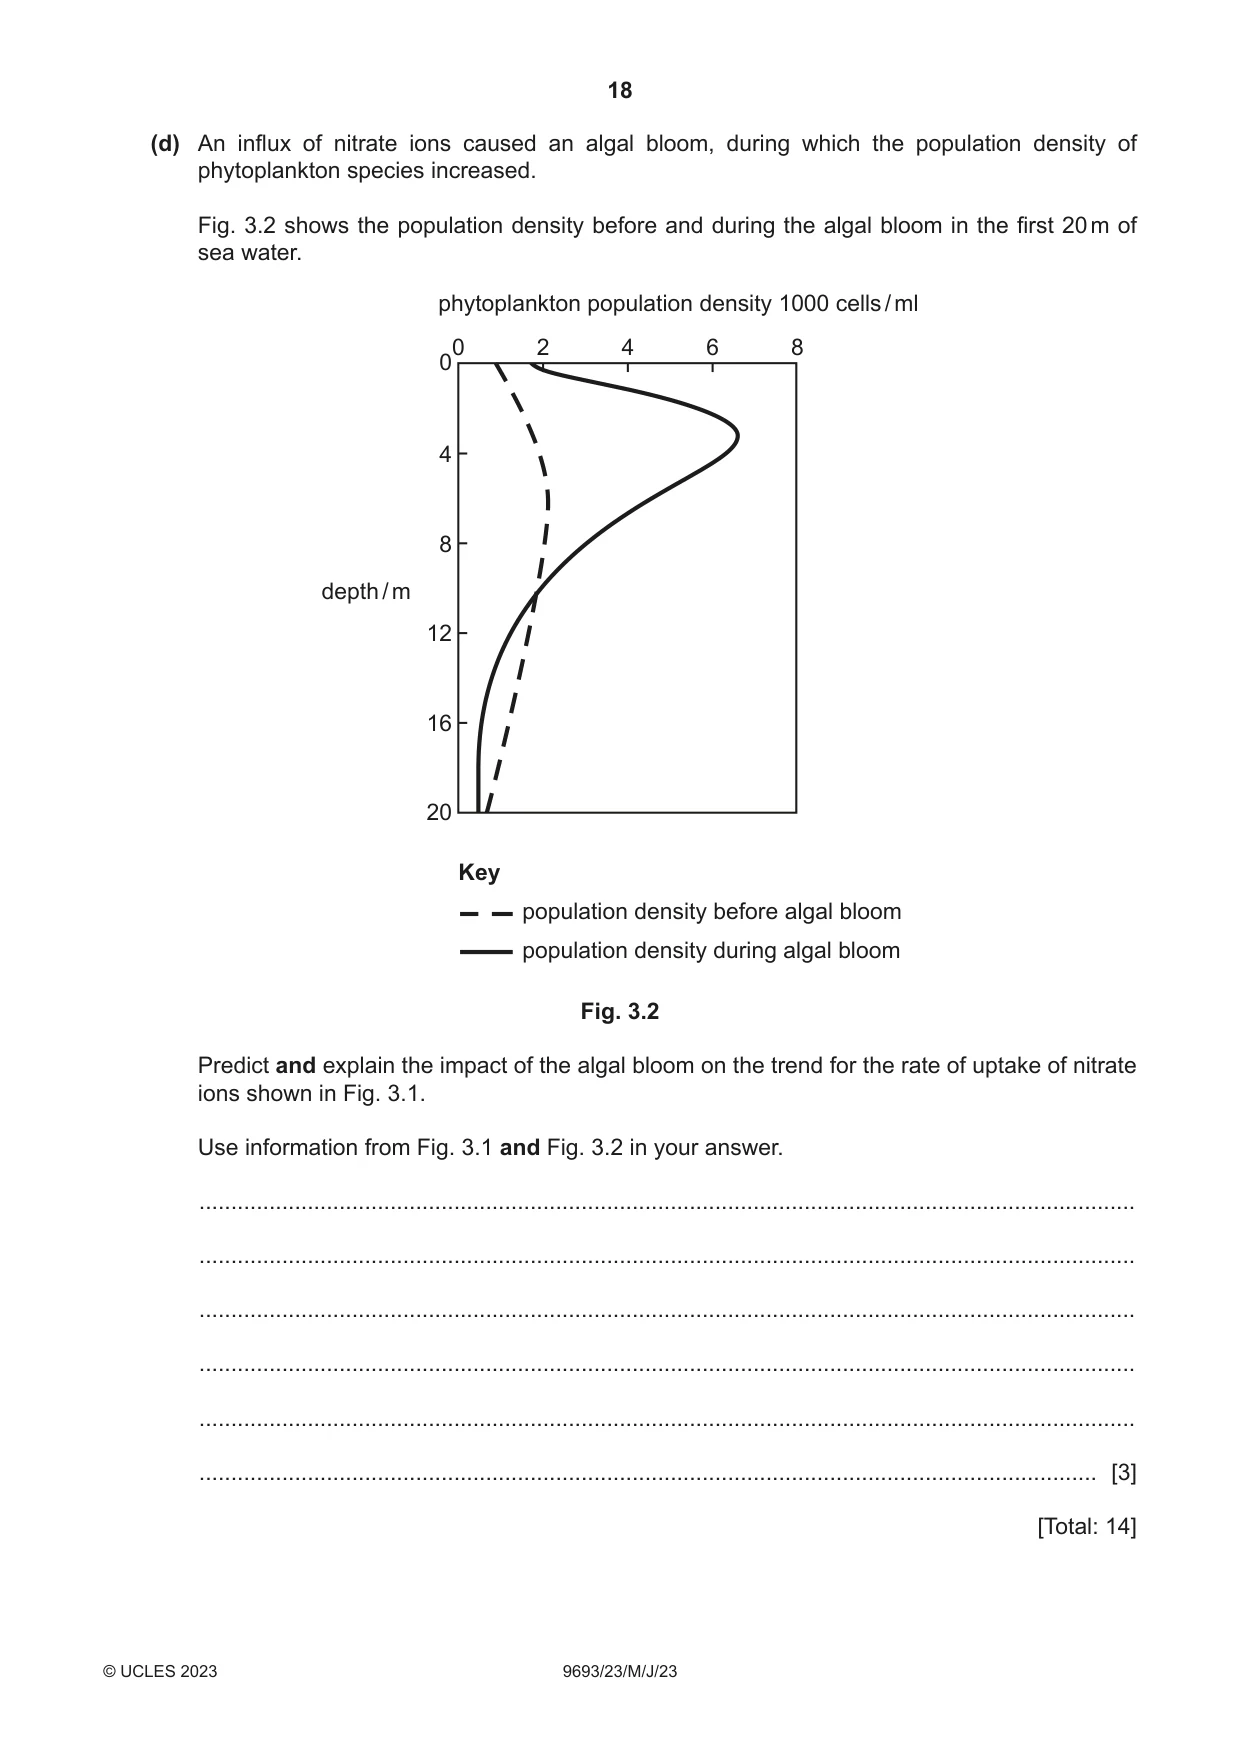
3 (a) Nitrates are an important source of nitrogen. State the importance of nitrogen for marine organisms. ................................................................................................................................................... ............................................................................................................................................. [1] (b) In October 2017 researchers recorded the following data in an ocean: • temperature of the sea water • concentration of nitrate ions (NO3–) in the sea water • rate of uptake of nitrate ions from the sea water. They took readings every 40 m down to a depth of 200 m. Table 3.1 shows the recorded temperature of the sea water. Table 3.1 depth / m sea water temperature / °C 0 28.4 40 28.2 80 26.5 120 20.1 160 17.5 200 17.0 (i) Use the data in Table 3.1 to complete the graph. You should: • label the x‑axis • add a scale to the x‑axis • plot the data • draw a line of best fit. (ii) Suggest the range of depths where the thermocline is found. Explain your answer. ........................................................................................................................................... ........................................................................................................................................... ........................................................................................................................................... ..................................................................................................................................... [2] (iii) Suggest a reason why the position of the thermocline may change. ........................................................................................................................................... ..................................................................................................................................... [1] (i) Use your graph in (b)(i) and Fig. 3.1 to determine the temperature of the sea water at the maximum rate of nitrate ion uptake. ..................................................... °C [1] (ii) Describe and suggest reasons for the changes in nitrate ion uptake shown in Fig. 3.1. ........................................................................................................................................... ........................................................................................................................................... ........................................................................................................................................... ........................................................................................................................................... ........................................................................................................................................... ..................................................................................................................................... [3] (d) An influx of nitrate ions caused an algal bloom, during which the population density of phytoplankton species increased. Fig. 3.2 shows the population density before and during the algal bloom in the first 20 m of sea water. phytoplankton population density 1000 cells / ml 00 2 4 6 8 4 8 depth / m 12 16 20 Key population density before algal bloom population density during algal bloom Fig. 3.2 Predict and explain the impact of the algal bloom on the trend for the rate of uptake of nitrate ions shown in Fig. 3.1. Use information from Fig. 3.1 and Fig. 3.2 in your answer. ................................................................................................................................................... ................................................................................................................................................... ................................................................................................................................................... ................................................................................................................................................... ................................................................................................................................................... ............................................................................................................................................. [3] [Total: 14]
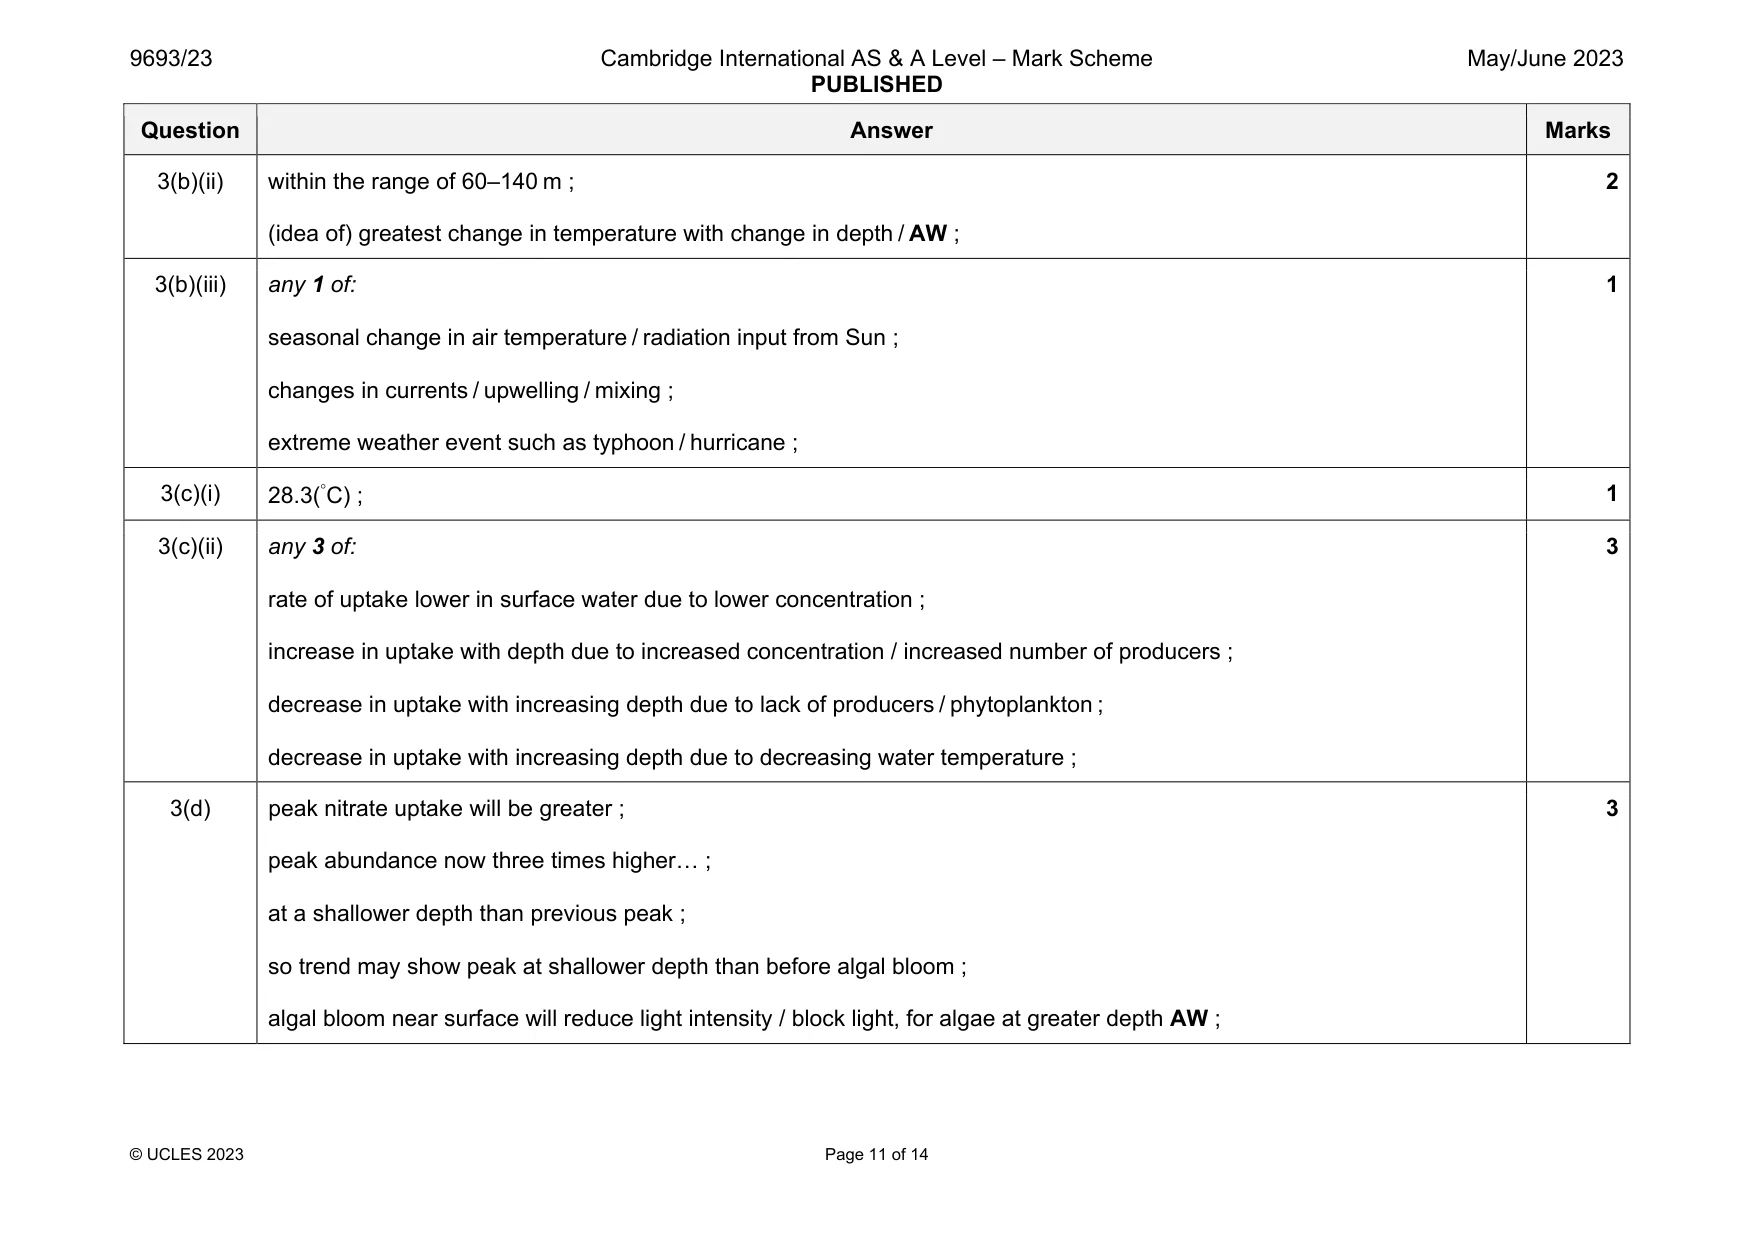
Mark scheme: 3(a) used (by producers as nitrogen source) for building amino acids / proteins / DNA ; 1 3(b)(i) x–axis labelled (with units) AND suitable linear scale ; all points plotted correctly ½ small square ; suitable curved line ; 3 Question Answer Marks 3(b)(ii) within the range of 60–140 m ; (idea of) greatest change in temperature with change in depth / AW ; 2 3(b)(iii) any 1 of: seasonal change in air temperature / radiation input from Sun ; changes in currents / upwelling / mixing ; extreme weather event such as typhoon / hurricane ; 1 3(c)(i) 28.3(C) ; 1 3(c)(ii) any 3 of: rate of uptake lower in surface water due to lower concentration ; increase in uptake with depth due to increased concentration / increased number of producers ; decrease in uptake with increasing depth due to lack of producers / phytoplankton ; decrease in uptake with increasing depth due to decreasing water temperature ; 3 3(d) peak nitrate uptake will be greater ; peak abundance now three times higher… ; at a shallower depth than previous peak ; so trend may show peak at shallower depth than before algal bloom ; algal bloom near surface will reduce light intensity / block light, for algae at greater depth AW ; 3
Q4 · A boxer crab with two anemones attached to its front claws
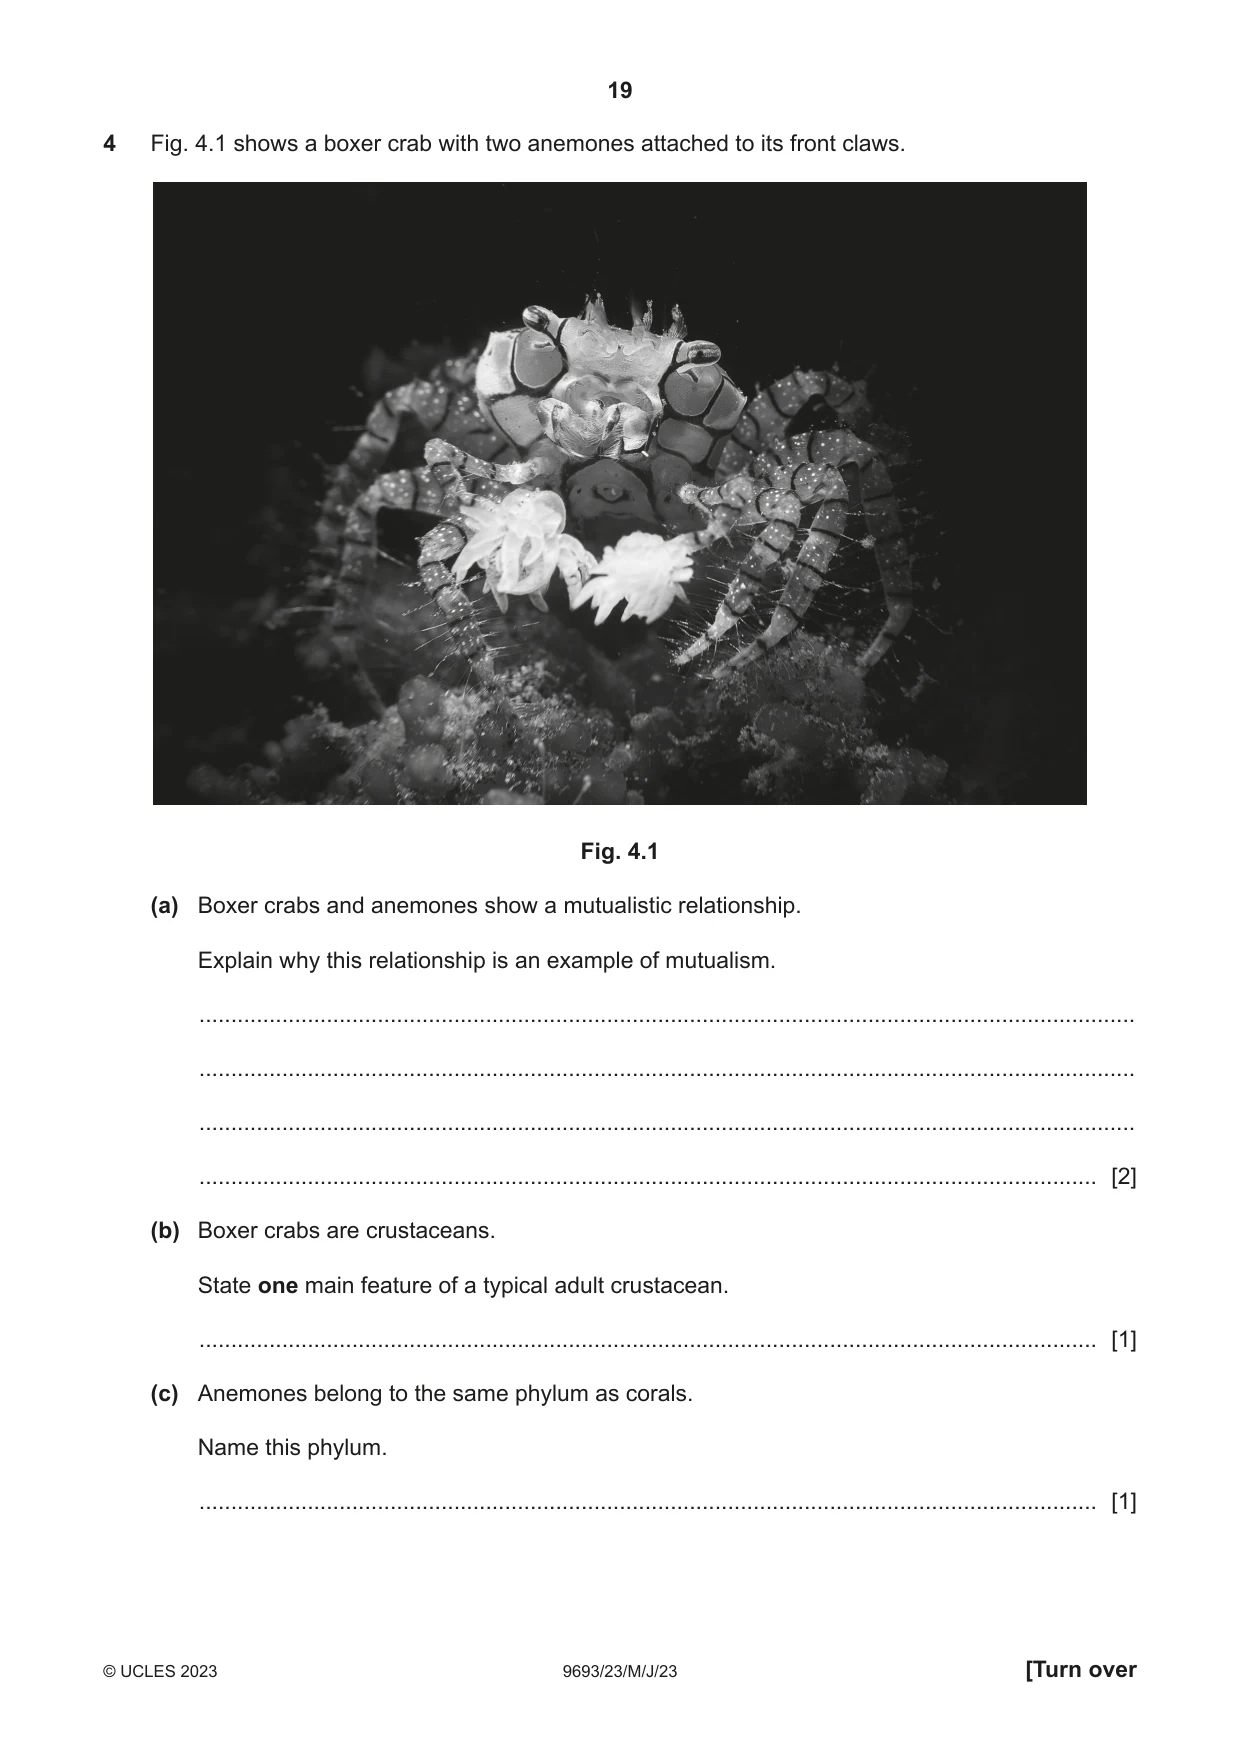
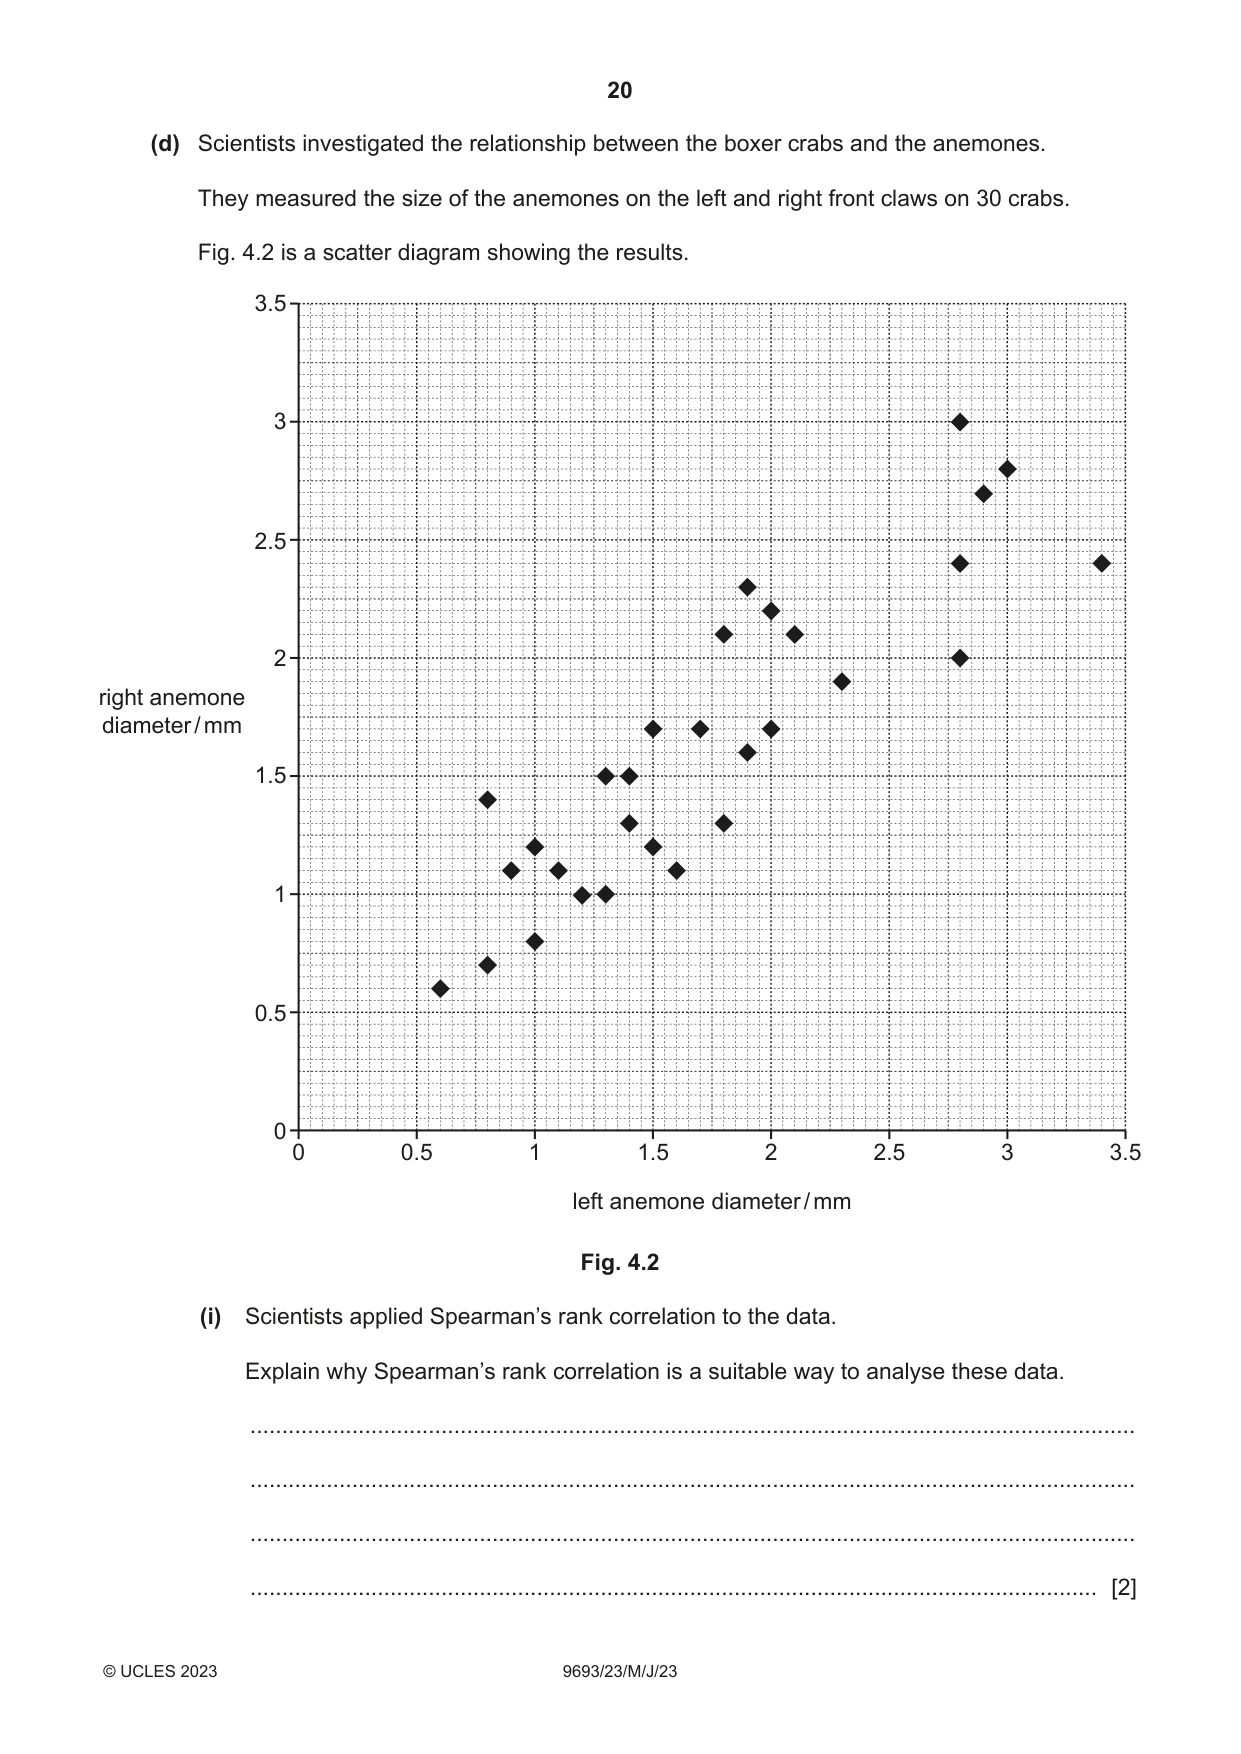
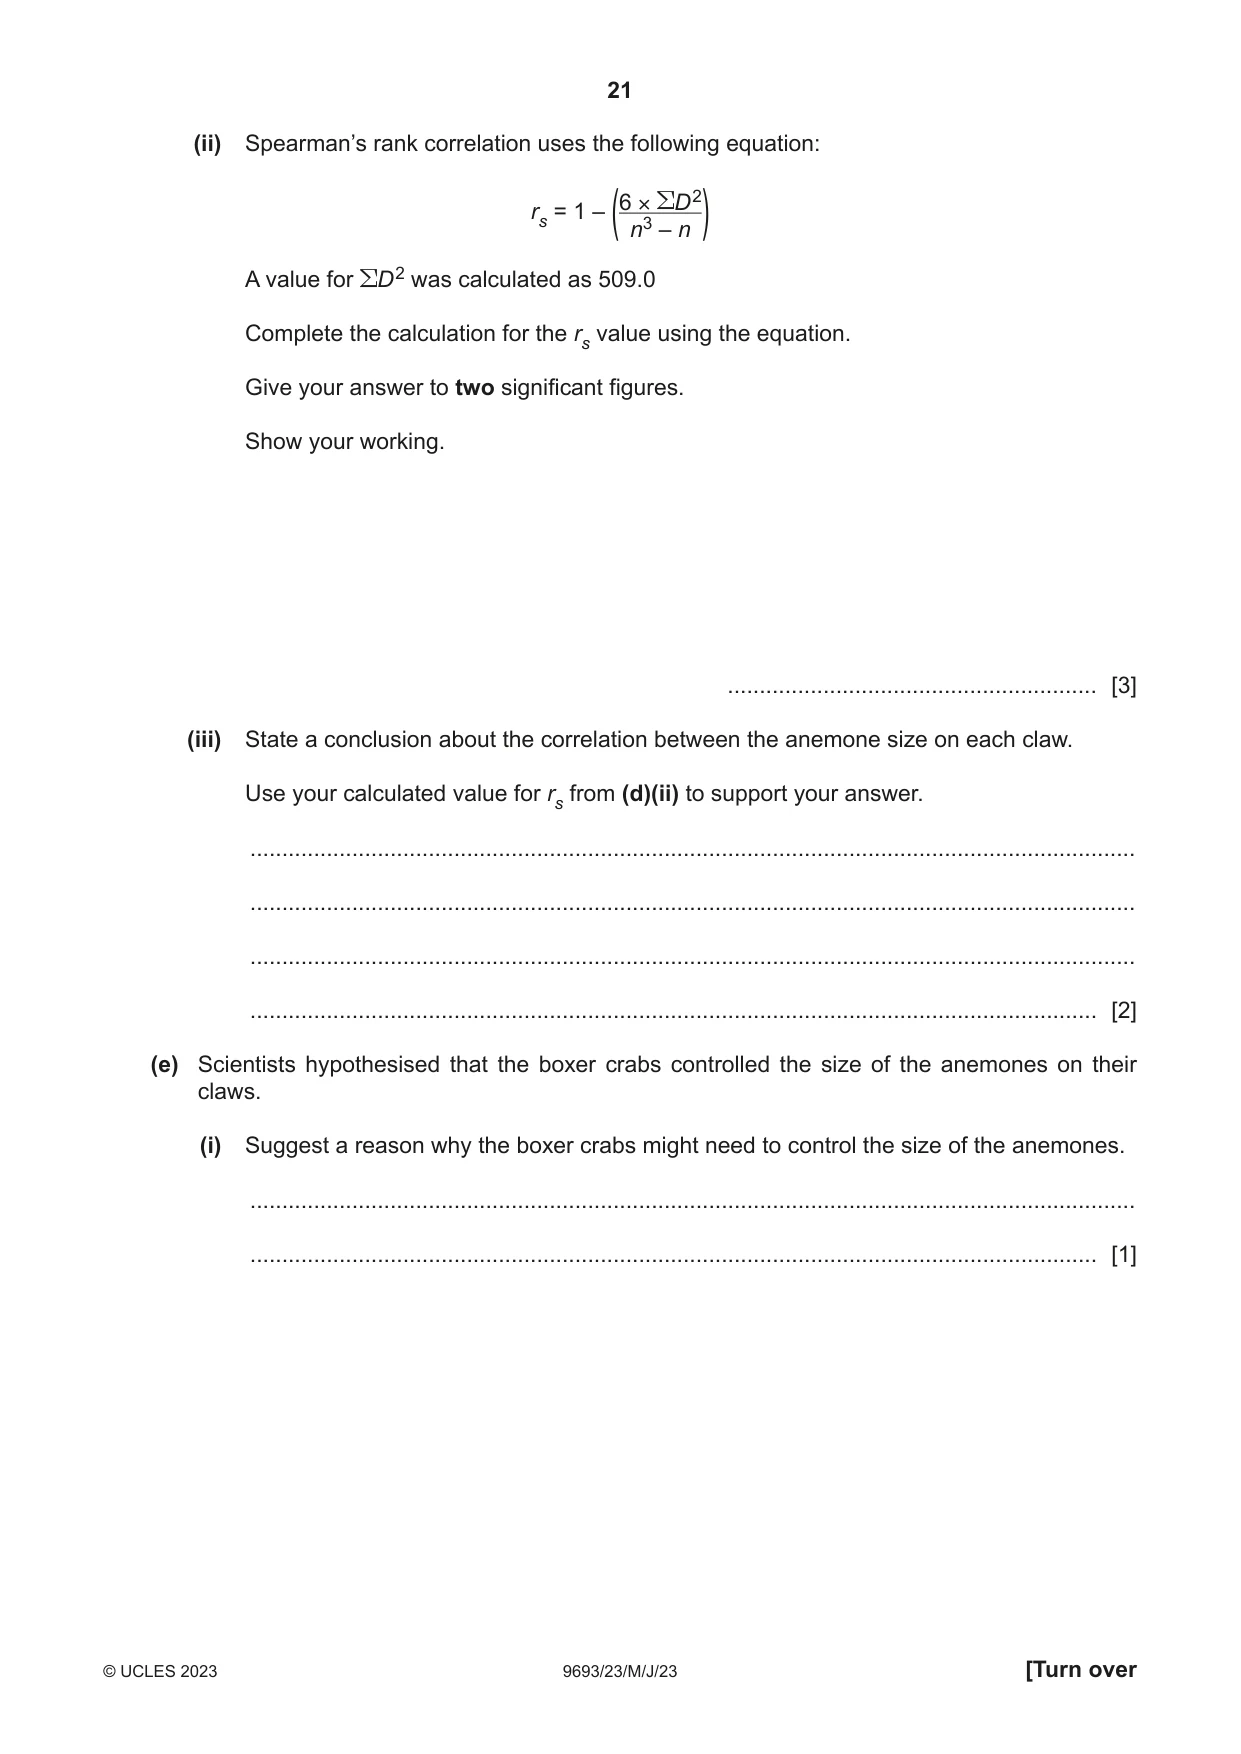
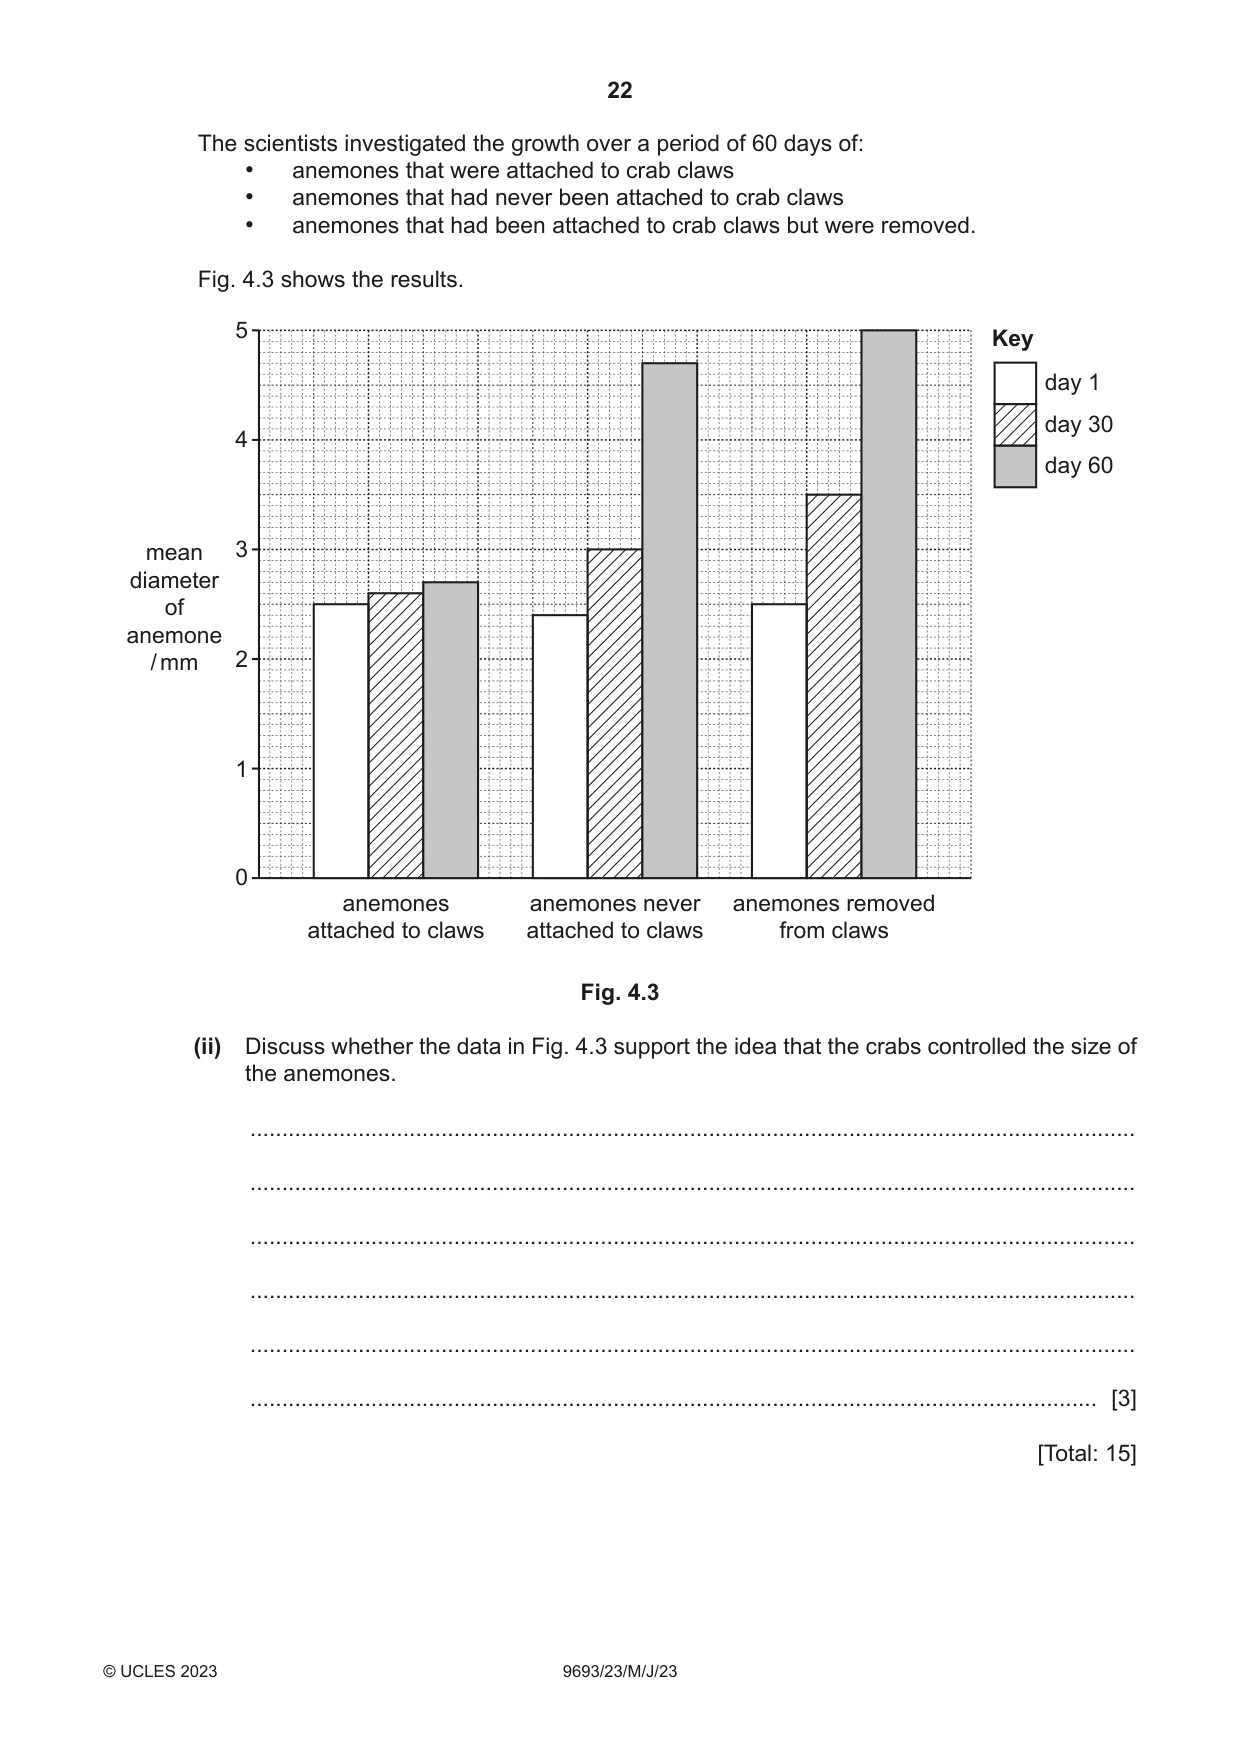
4 Fig. 4.1 shows a boxer crab with two anemones attached to its front claws. Fig. 4.1 (a) Boxer crabs and anemones show a mutualistic relationship. Explain why this relationship is an example of mutualism. ................................................................................................................................................... ................................................................................................................................................... ................................................................................................................................................... ............................................................................................................................................. [2] (b) Boxer crabs are crustaceans. State one main feature of a typical adult crustacean. ............................................................................................................................................. [1] (c) Anemones belong to the same phylum as corals. Name this phylum. ............................................................................................................................................. [1] (d) Scientists investigated the relationship between the boxer crabs and the anemones. They measured the size of the anemones on the left and right front claws on 30 crabs. Fig. 4.2 is a scatter diagram showing the results. 3.5 3 2.5 2 right anemone diameter / mm 1.5 1 0.5 0 0 0.5 1 1.5 2 2.5 3 3.5 left anemone diameter / mm Fig. 4.2 (i) Scientists applied Spearman’s rank correlation to the data. Explain why Spearman’s rank correlation is a suitable way to analyse these data. ........................................................................................................................................... ........................................................................................................................................... ........................................................................................................................................... ..................................................................................................................................... [2] (ii) Spearman’s rank correlation uses the following equation: 6 × !D 2 rs = 1 – ( n3 – n ) A value for !D 2 was calculated as 509.0 Complete the calculation for the rs value using the equation. Give your answer to two significant figures. Show your working. .......................................................... [3] (iii) State a conclusion about the correlation between the anemone size on each claw. Use your calculated value for rs from (d)(ii) to support your answer. ........................................................................................................................................... ........................................................................................................................................... ........................................................................................................................................... ..................................................................................................................................... [2] (e) Scientists hypothesised that the boxer crabs controlled the size of the anemones on their claws. (i) Suggest a reason why the boxer crabs might need to control the size of the anemones. ........................................................................................................................................... ..................................................................................................................................... [1] The scientists investigated the growth over a period of 60 days of: • anemones that were attached to crab claws • anemones that had never been attached to crab claws • anemones that had been attached to crab claws but were removed. Fig. 4.3 shows the results. 5 Key day 1 day 30 4 day 60 mean 3 diameter of anemone / mm 2 1 0 anemones anemones never anemones removed attached to claws attached to claws from claws Fig. 4.3 (ii) Discuss whether the data in Fig. 4.3 support the idea that the crabs controlled the size of the anemones. ........................................................................................................................................... ........................................................................................................................................... ........................................................................................................................................... ........................................................................................................................................... ........................................................................................................................................... ..................................................................................................................................... [3] [Total: 15]
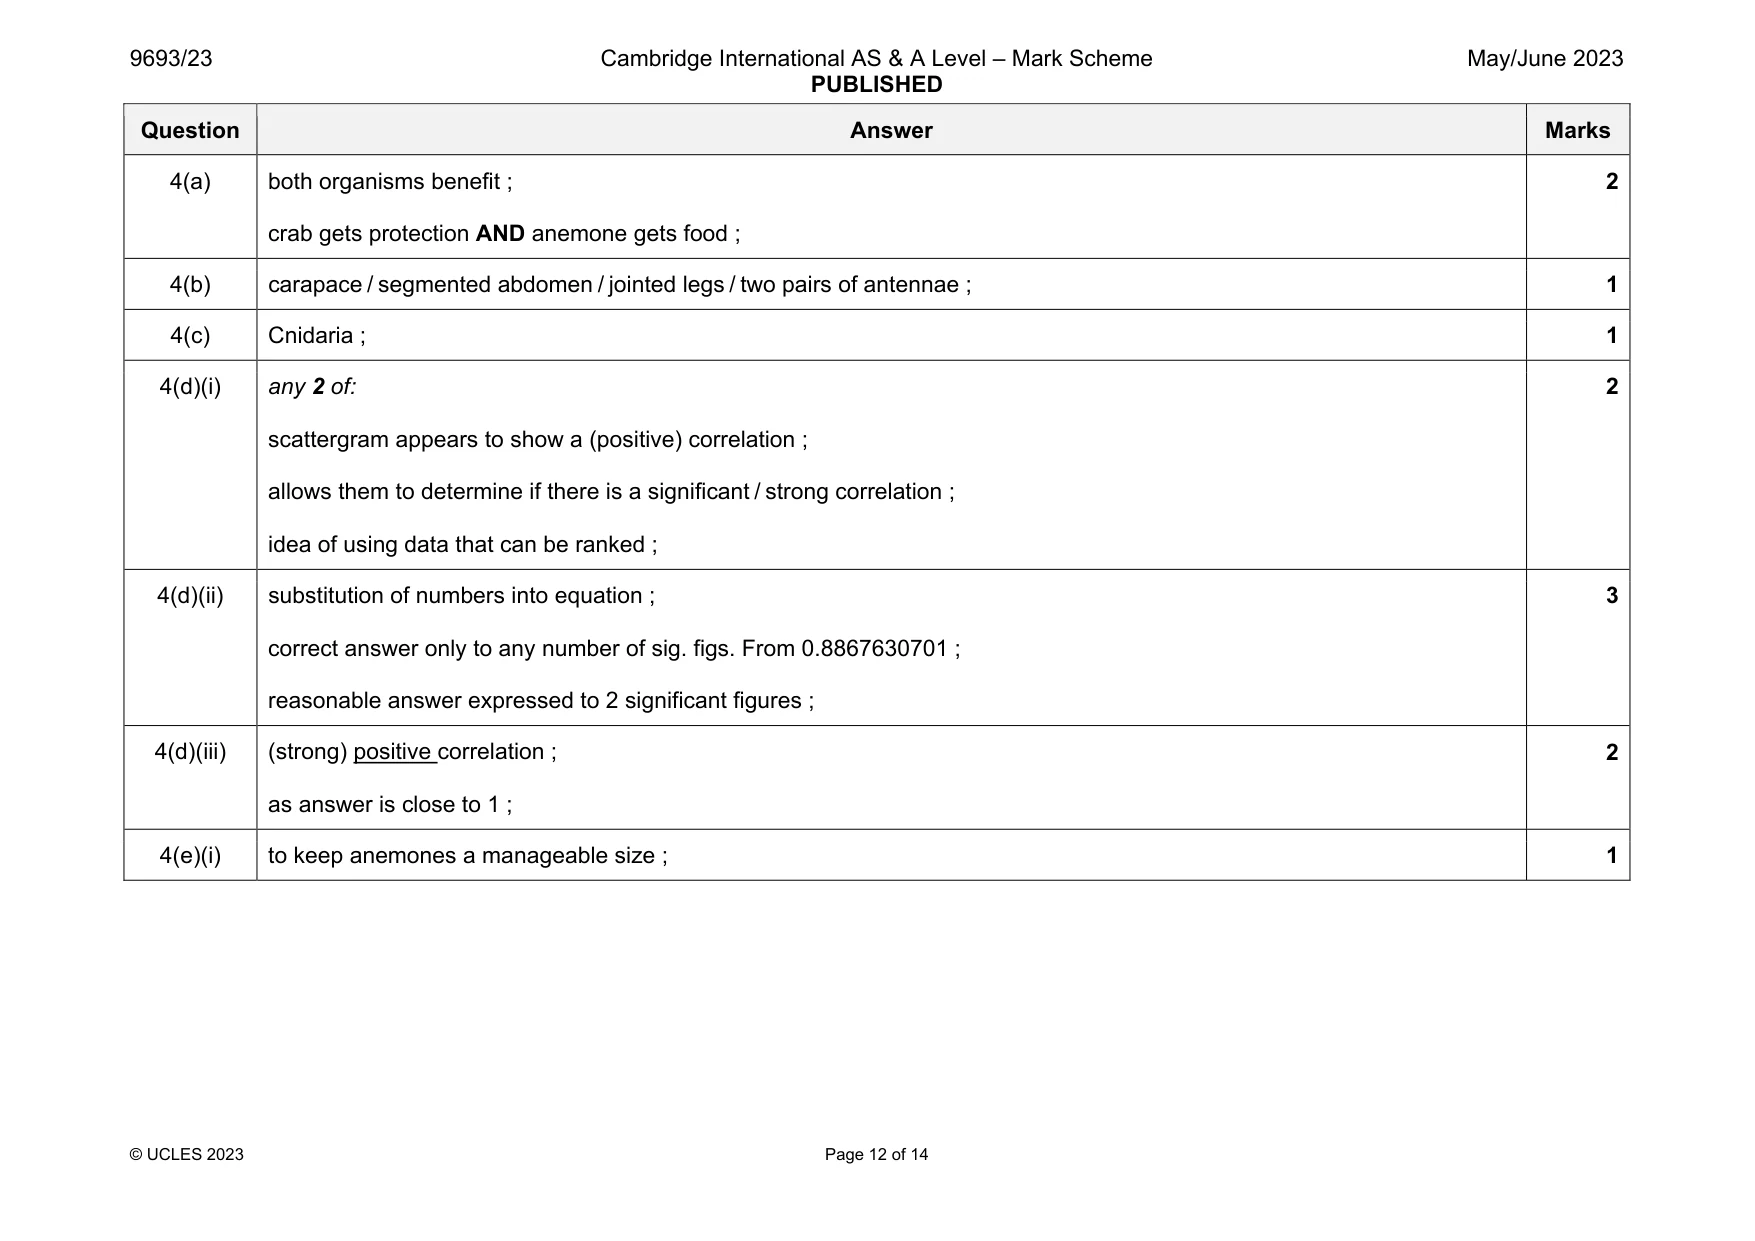
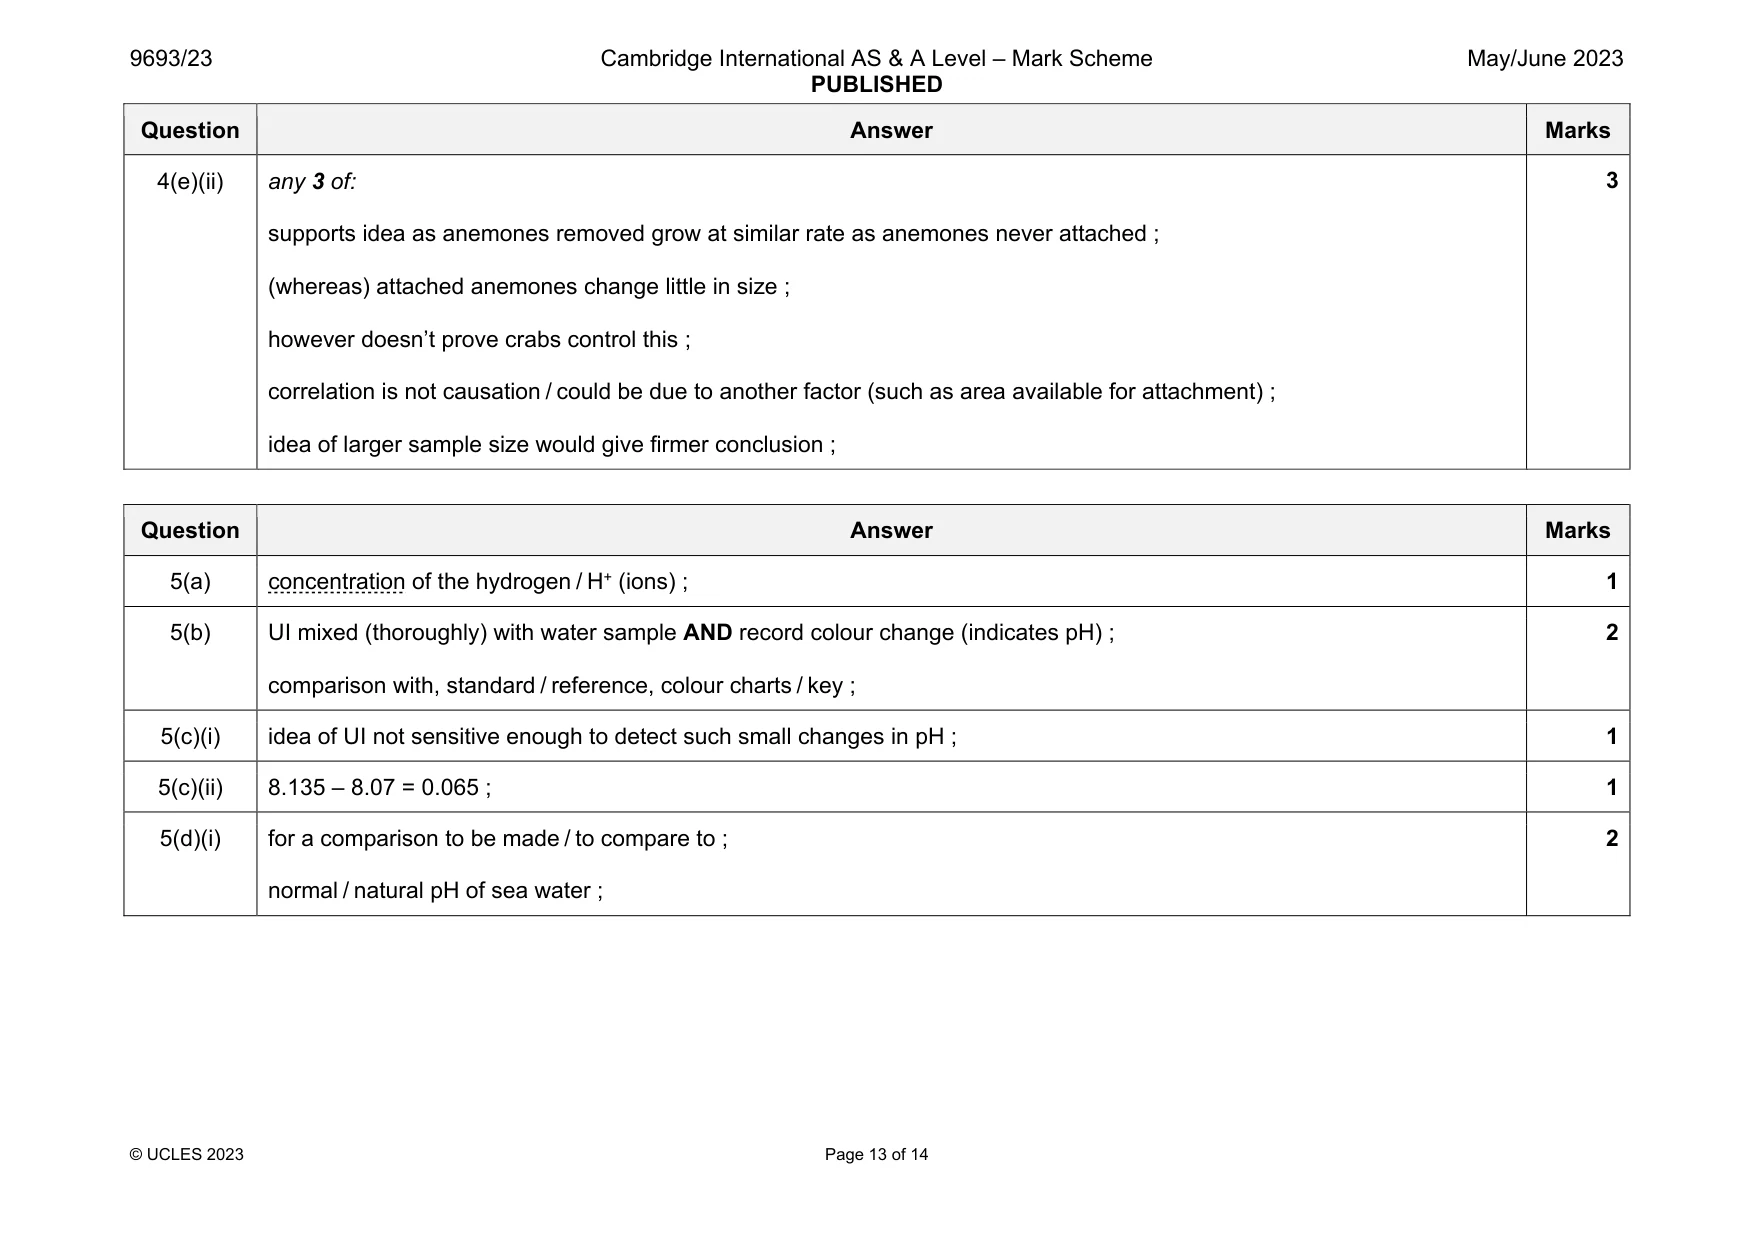
Mark scheme: 4(a) both organisms benefit ; crab gets protection AND anemone gets food ; 2 4(b) carapace / segmented abdomen / jointed legs / two pairs of antennae ; 1 4(c) Cnidaria ; 1 4(d)(i) any 2 of: scattergram appears to show a (positive) correlation ; allows them to determine if there is a significant / strong correlation ; idea of using data that can be ranked ; 2 4(d)(ii) substitution of numbers into equation ; correct answer only to any number of sig. figs. From 0.8867630701 ; reasonable answer expressed to 2 significant figures ; 3 4(d)(iii) (strong) positive correlation ; as answer is close to 1 ; 2 4(e)(i) to keep anemones a manageable size ; 1 Question Answer Marks 4(e)(ii) any 3 of: supports idea as anemones removed grow at similar rate as anemones never attached ; (whereas) attached anemones change little in size ; however doesn’t prove crabs control this ; correlation is not causation / could be due to another factor (such as area available for attachment) ; idea of larger sample size would give firmer conclusion ; 3
Q5 · PH is an important abiotic factor in marine ecosystems
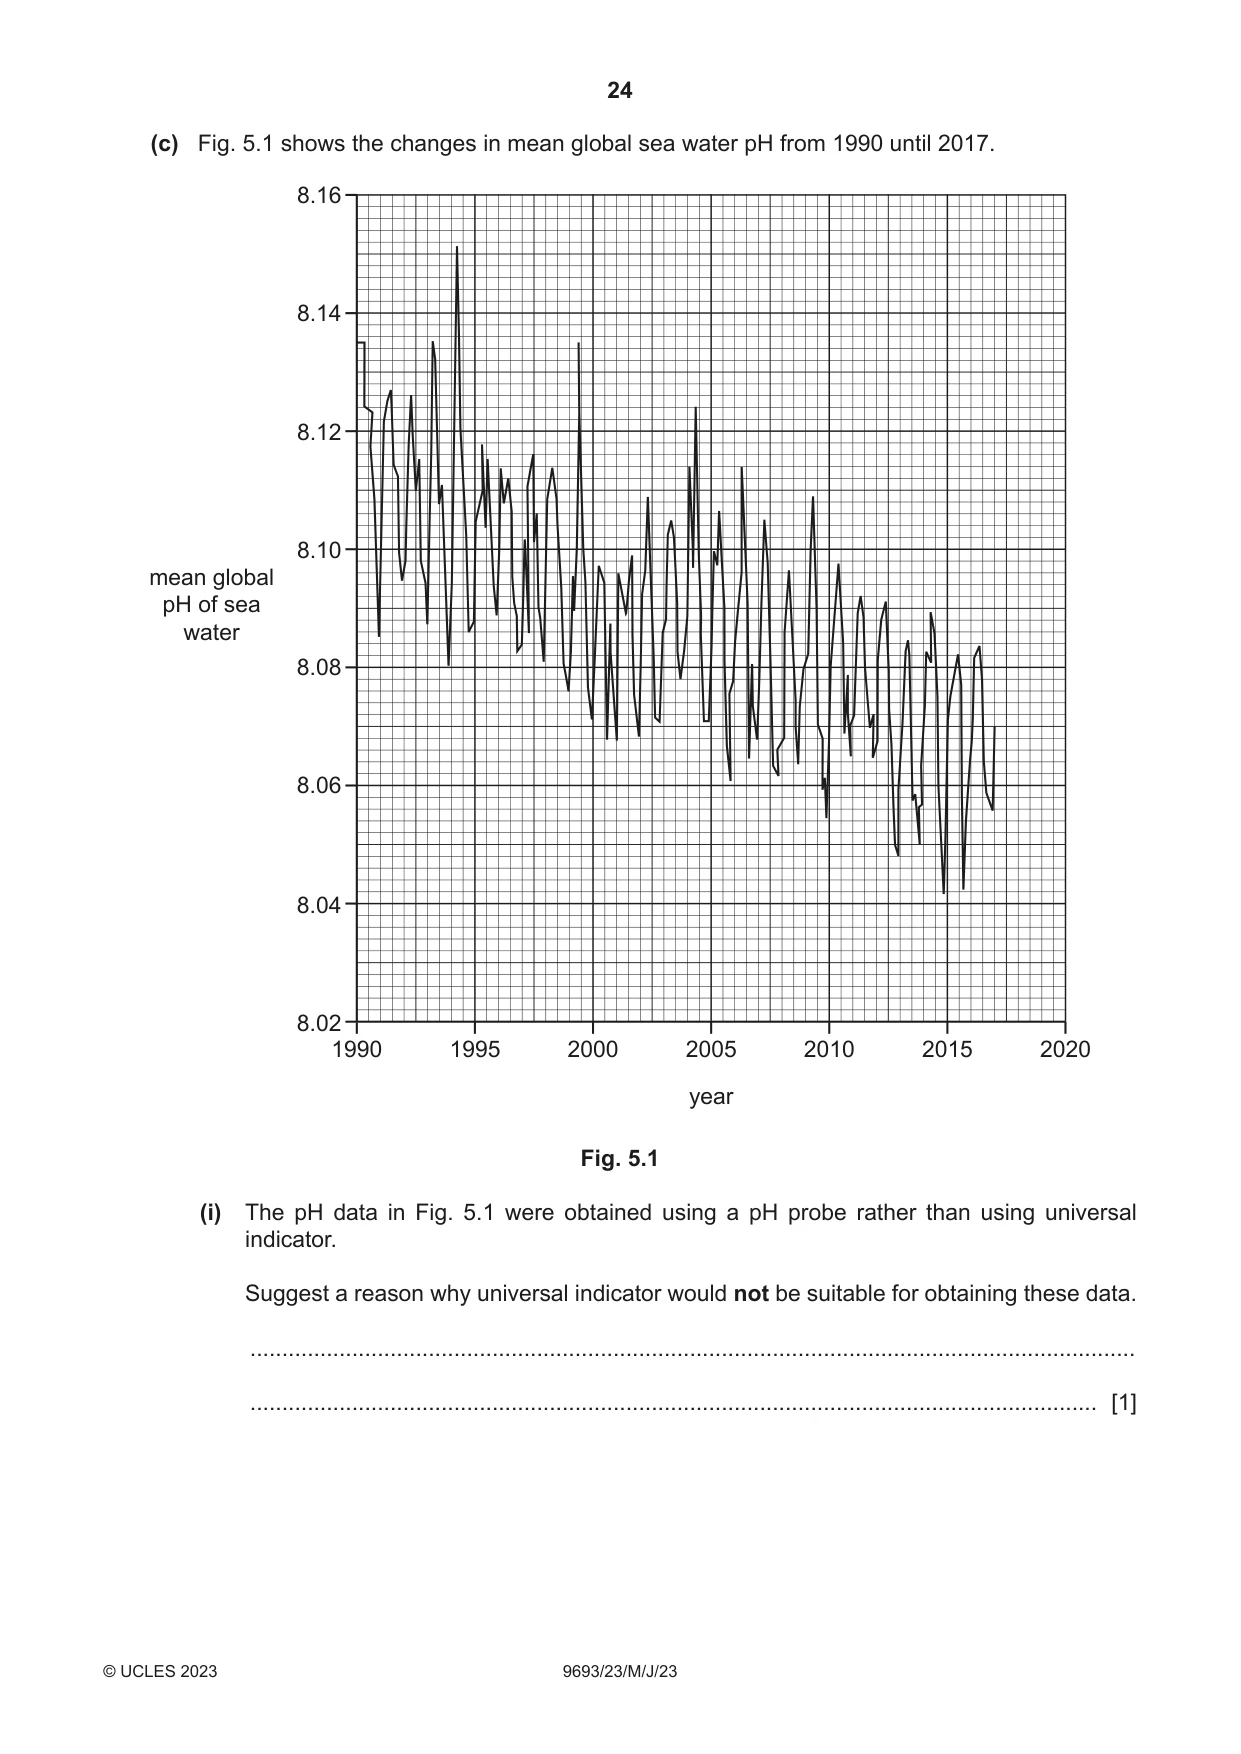
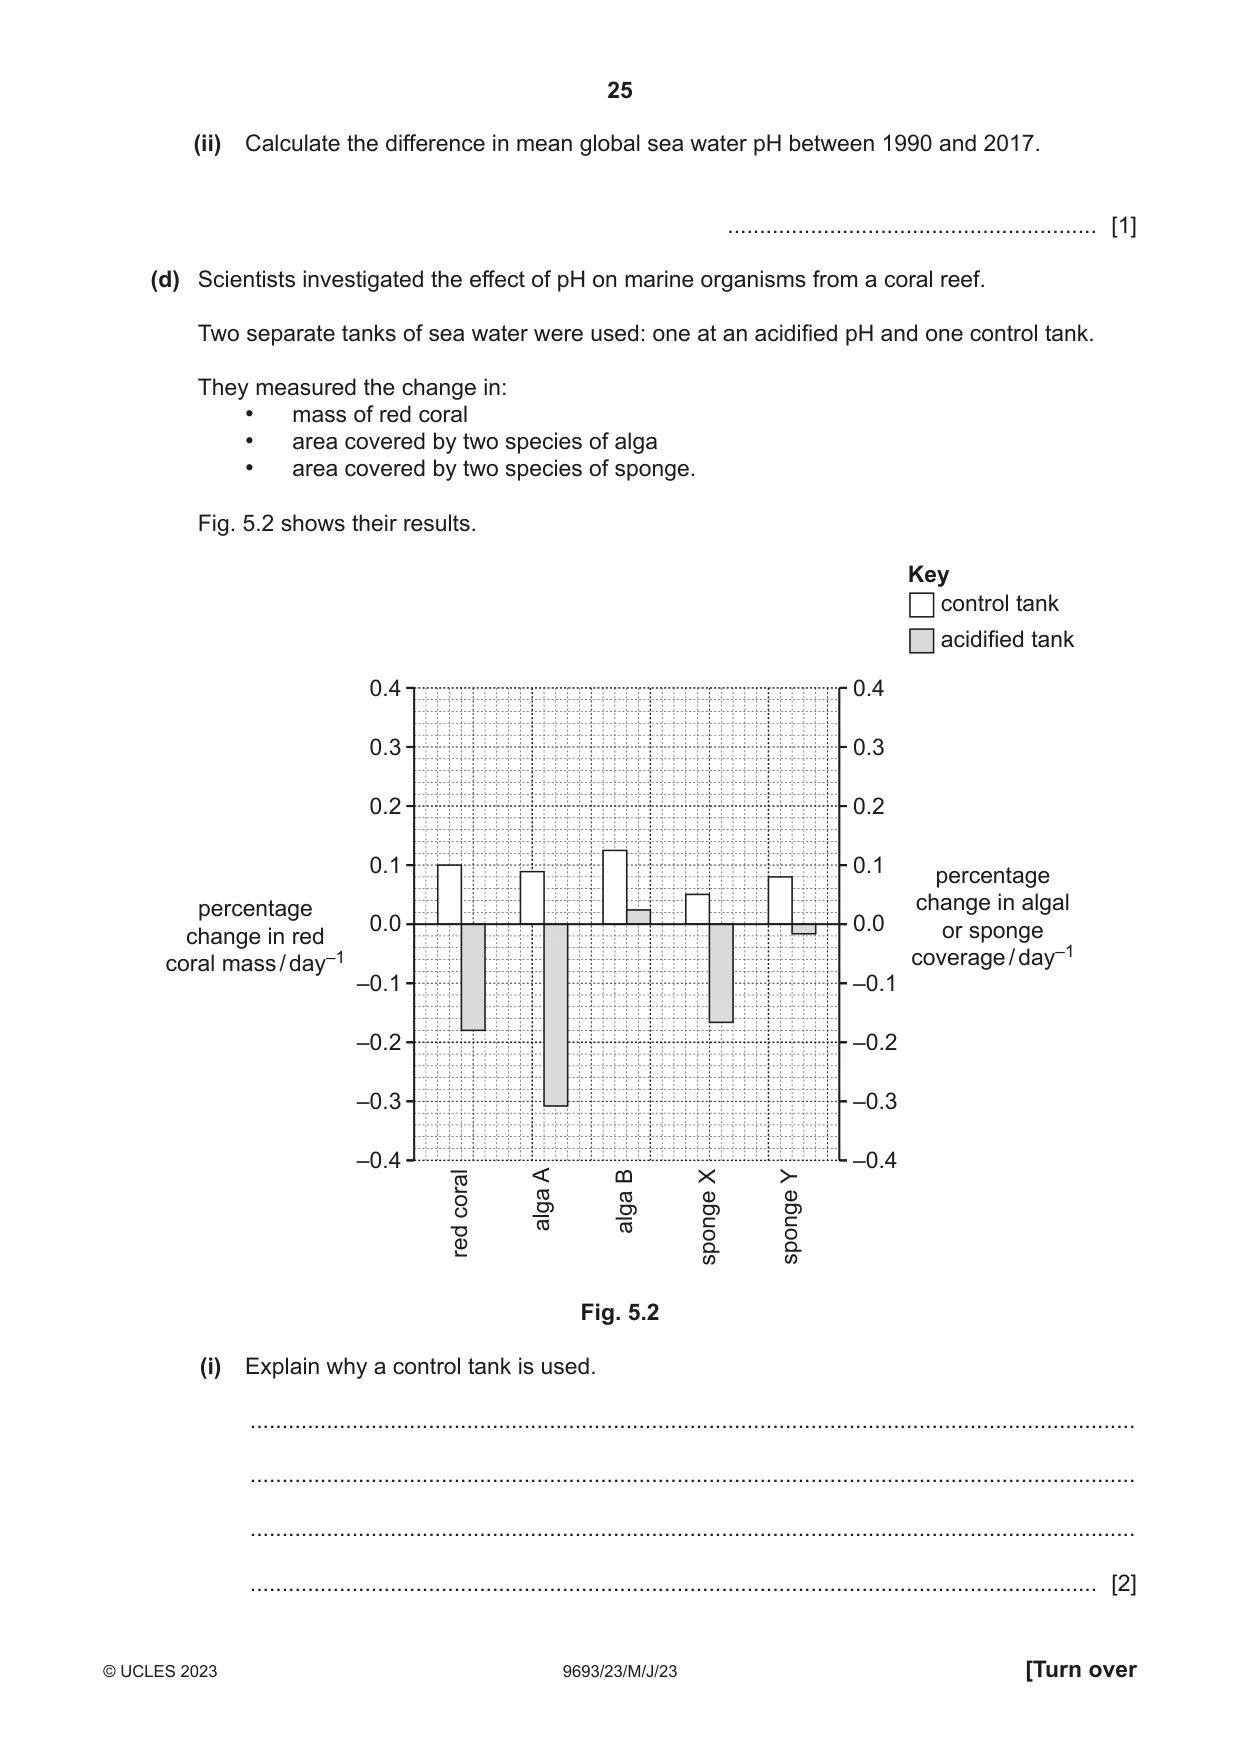
5 pH is an important abiotic factor in marine ecosystems. (a) Describe in terms of ions what the pH of a solution measures. ............................................................................................................................................. [1] (b) Describe how Universal Indicator can be used to determine the pH of sea water samples. ................................................................................................................................................... ................................................................................................................................................... ................................................................................................................................................... ............................................................................................................................................. [2] (c) Fig. 5.1 shows the changes in mean global sea water pH from 1990 until 2017. 8.16 8.14 8.12 8.10 mean global pH of sea water 8.08 8.06 8.04 8.02 1990 1995 2000 2005 2010 2015 2020 year Fig. 5.1 (i) The pH data in Fig. 5.1 were obtained using a pH probe rather than using universal indicator. Suggest a reason why universal indicator would not be suitable for obtaining these data. ........................................................................................................................................... ..................................................................................................................................... [1] (ii) Calculate the difference in mean global sea water pH between 1990 and 2017. .......................................................... [1] (d) Scientists investigated the effect of pH on marine organisms from a coral reef. Two separate tanks of sea water were used: one at an acidified pH and one control tank. They measured the change in: • mass of red coral • area covered by two species of alga • area covered by two species of sponge. Fig. 5.2 shows their results. Key control tank acidified tank 0.4 0.4 0.3 0.3 0.2 0.2 0.1 0.1 percentage percentage change in algal 0.0 0.0 change in red or sponge coral mass / day–1 coverage / day–1 –0.1 –0.1 –0.2 –0.2 –0.3 –0.3 –0.4 –0.4 coral A B X Y alga alga red sponge sponge Fig. 5.2 (i) Explain why a control tank is used. ........................................................................................................................................... ........................................................................................................................................... ........................................................................................................................................... ..................................................................................................................................... [2]
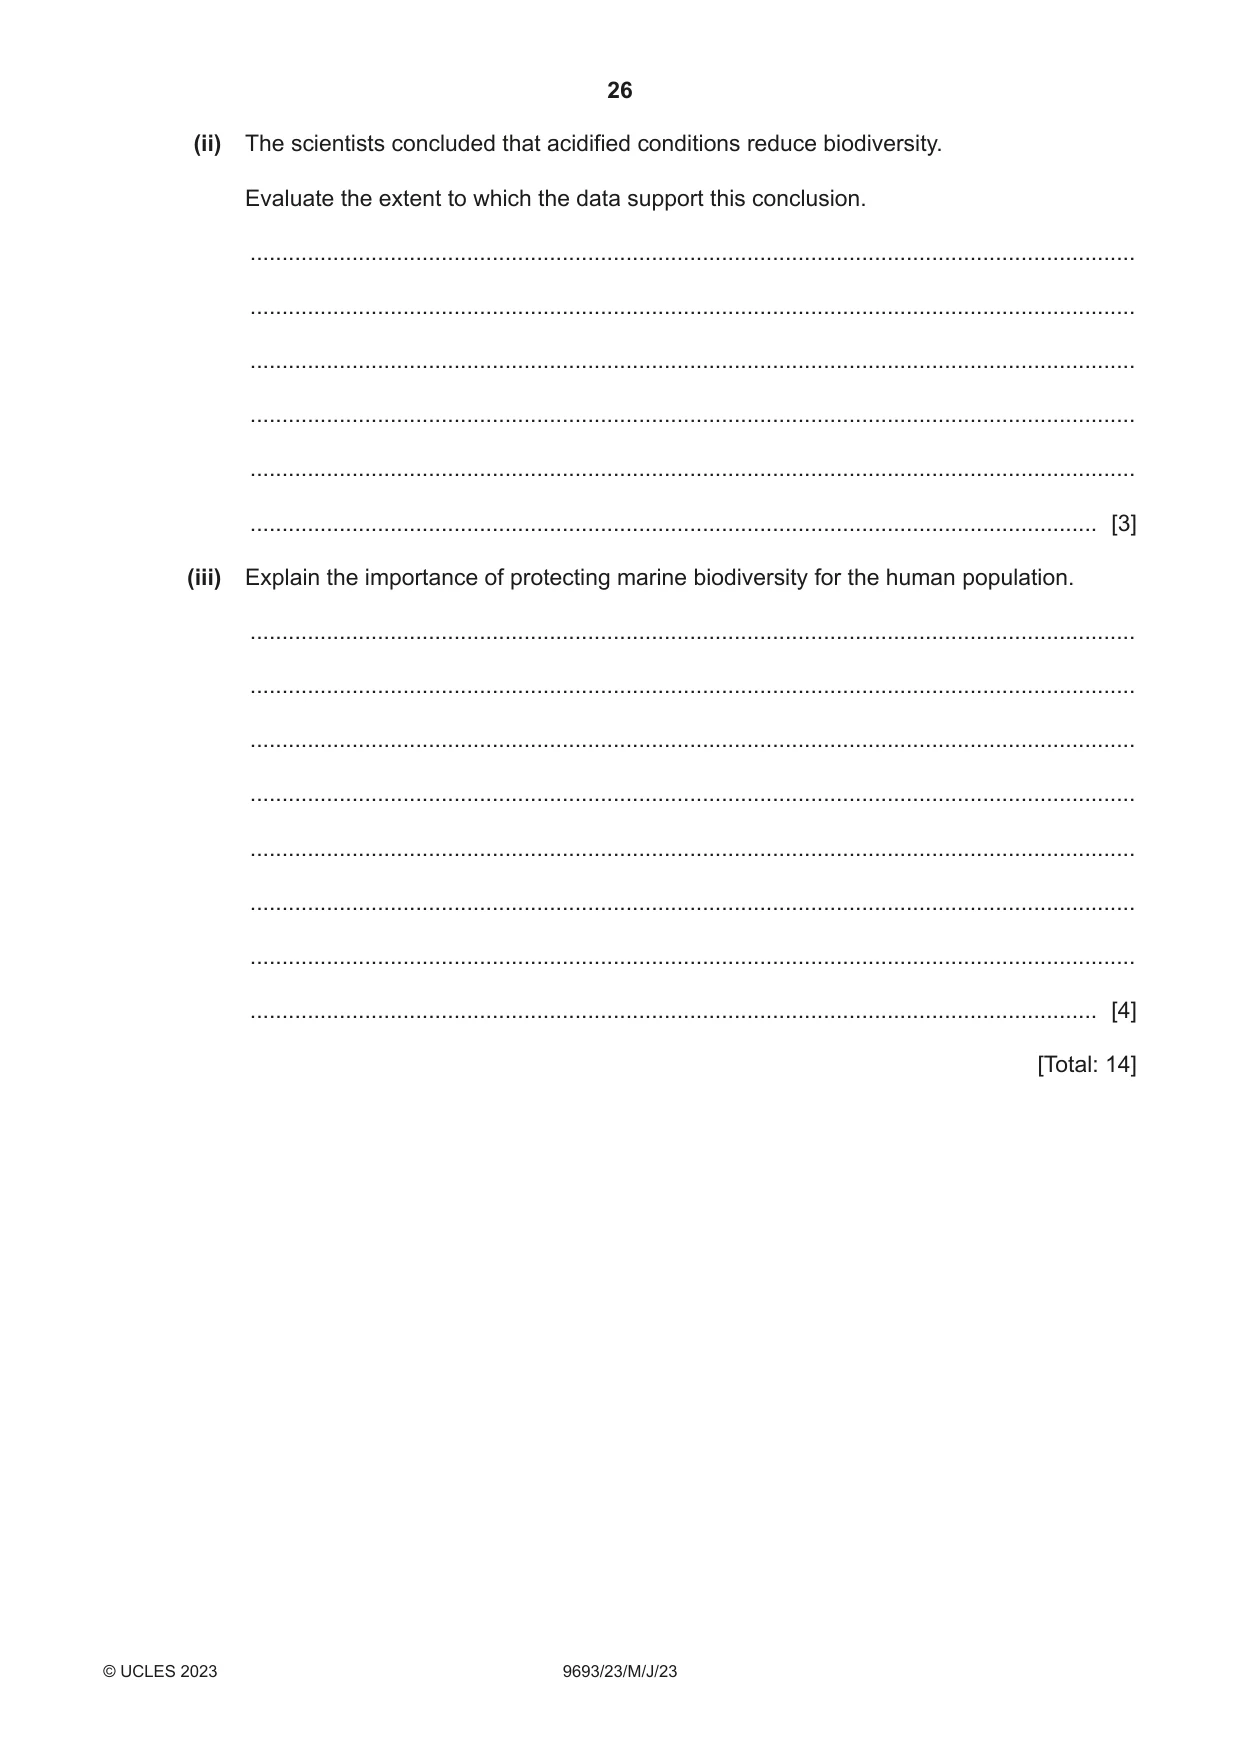
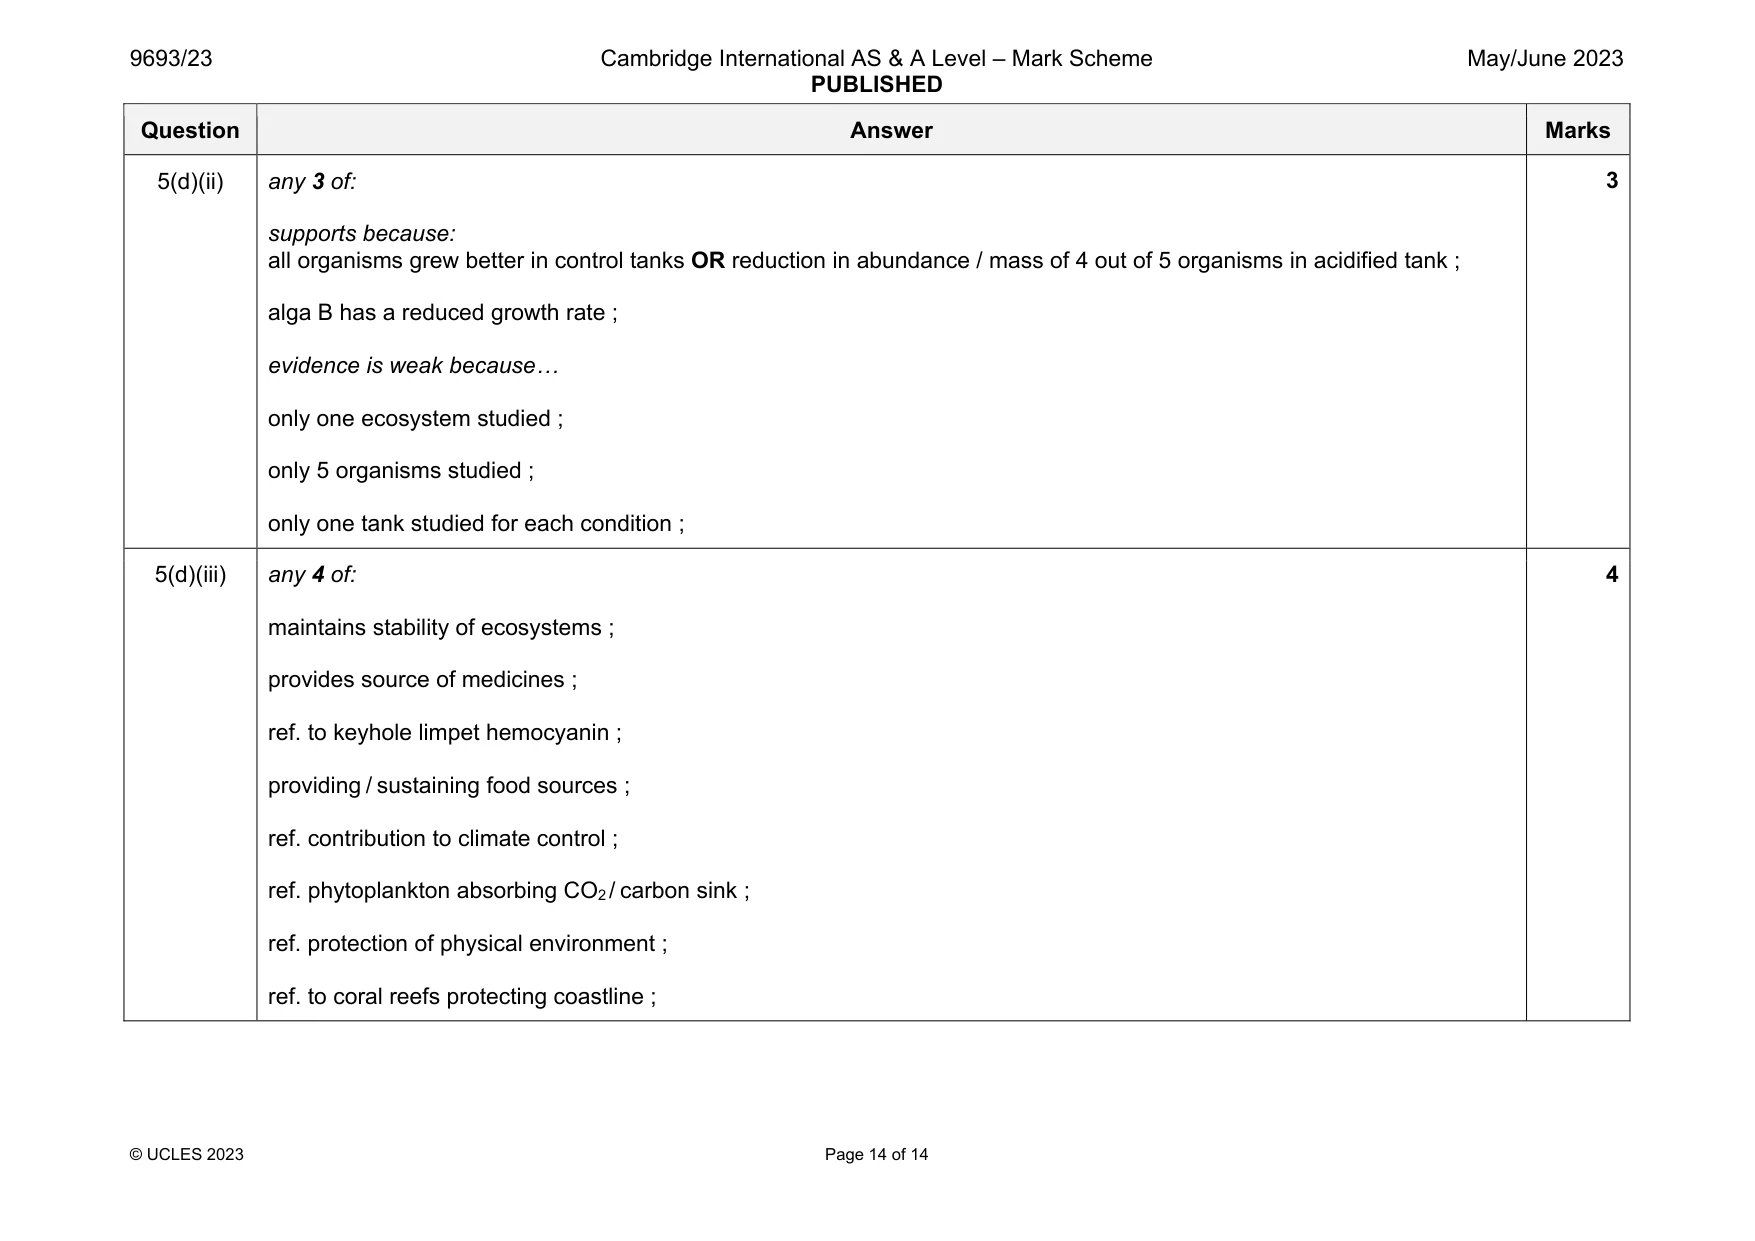
Mark scheme: 5(a) concentration of the hydrogen / H+ (ions) ; 1 5(b) UI mixed (thoroughly) with water sample AND record colour change (indicates pH) ; comparison with, standard / reference, colour charts / key ; 2 5(c)(i) idea of UI not sensitive enough to detect such small changes in pH ; 1 5(c)(ii) 8.135 – 8.07 = 0.065 ; 1 5(d)(i) for a comparison to be made / to compare to ; normal / natural pH of sea water ; 2 Question Answer Marks 5(d)(ii) any 3 of: supports because: all organisms grew better in control tanks OR reduction in abundance / mass of 4 out of 5 organisms in acidified tank ; alga B has a reduced growth rate ; evidence is weak because… only one ecosystem studied ; only 5 organisms studied ; only one tank studied for each condition ; 3 5(d)(iii) any 4 of: maintains stability of ecosystems ; provides source of medicines ; ref. to keyhole limpet hemocyanin ; providing / sustaining food sources ; ref. contribution to climate control ; ref. phytoplankton absorbing CO2 / carbon sink ; ref. protection of physical environment ; ref. to coral reefs protecting coastline ; 4
What was in this paper
The subtopics covered by these 5 questions, and how many questions each got. Open one in a new tab to see every Cambridge question on it.
What you needed in this session
Cambridge’s own grade thresholds for 2023 May/June, Paper 2 · Variant 3. A higher threshold means an easier paper — the bar moves with how the cohort did.