Cambridge A Level Marine Science 9693 — 2021 May/June Paper 2 · Variant 1
9693/21/M/J/21 · 4 questions · 50 marks · ≈56 min
The question paper and its mark scheme, free to read here and free to download. This is Cambridge’s own paper, exactly as it was sat.
Question paper12 pages
Mark scheme11 pages
Answers below. Sit the paper first if you are practising.
Questions as text
Q1 · Cleaner fish feed on parasites attached to other fish
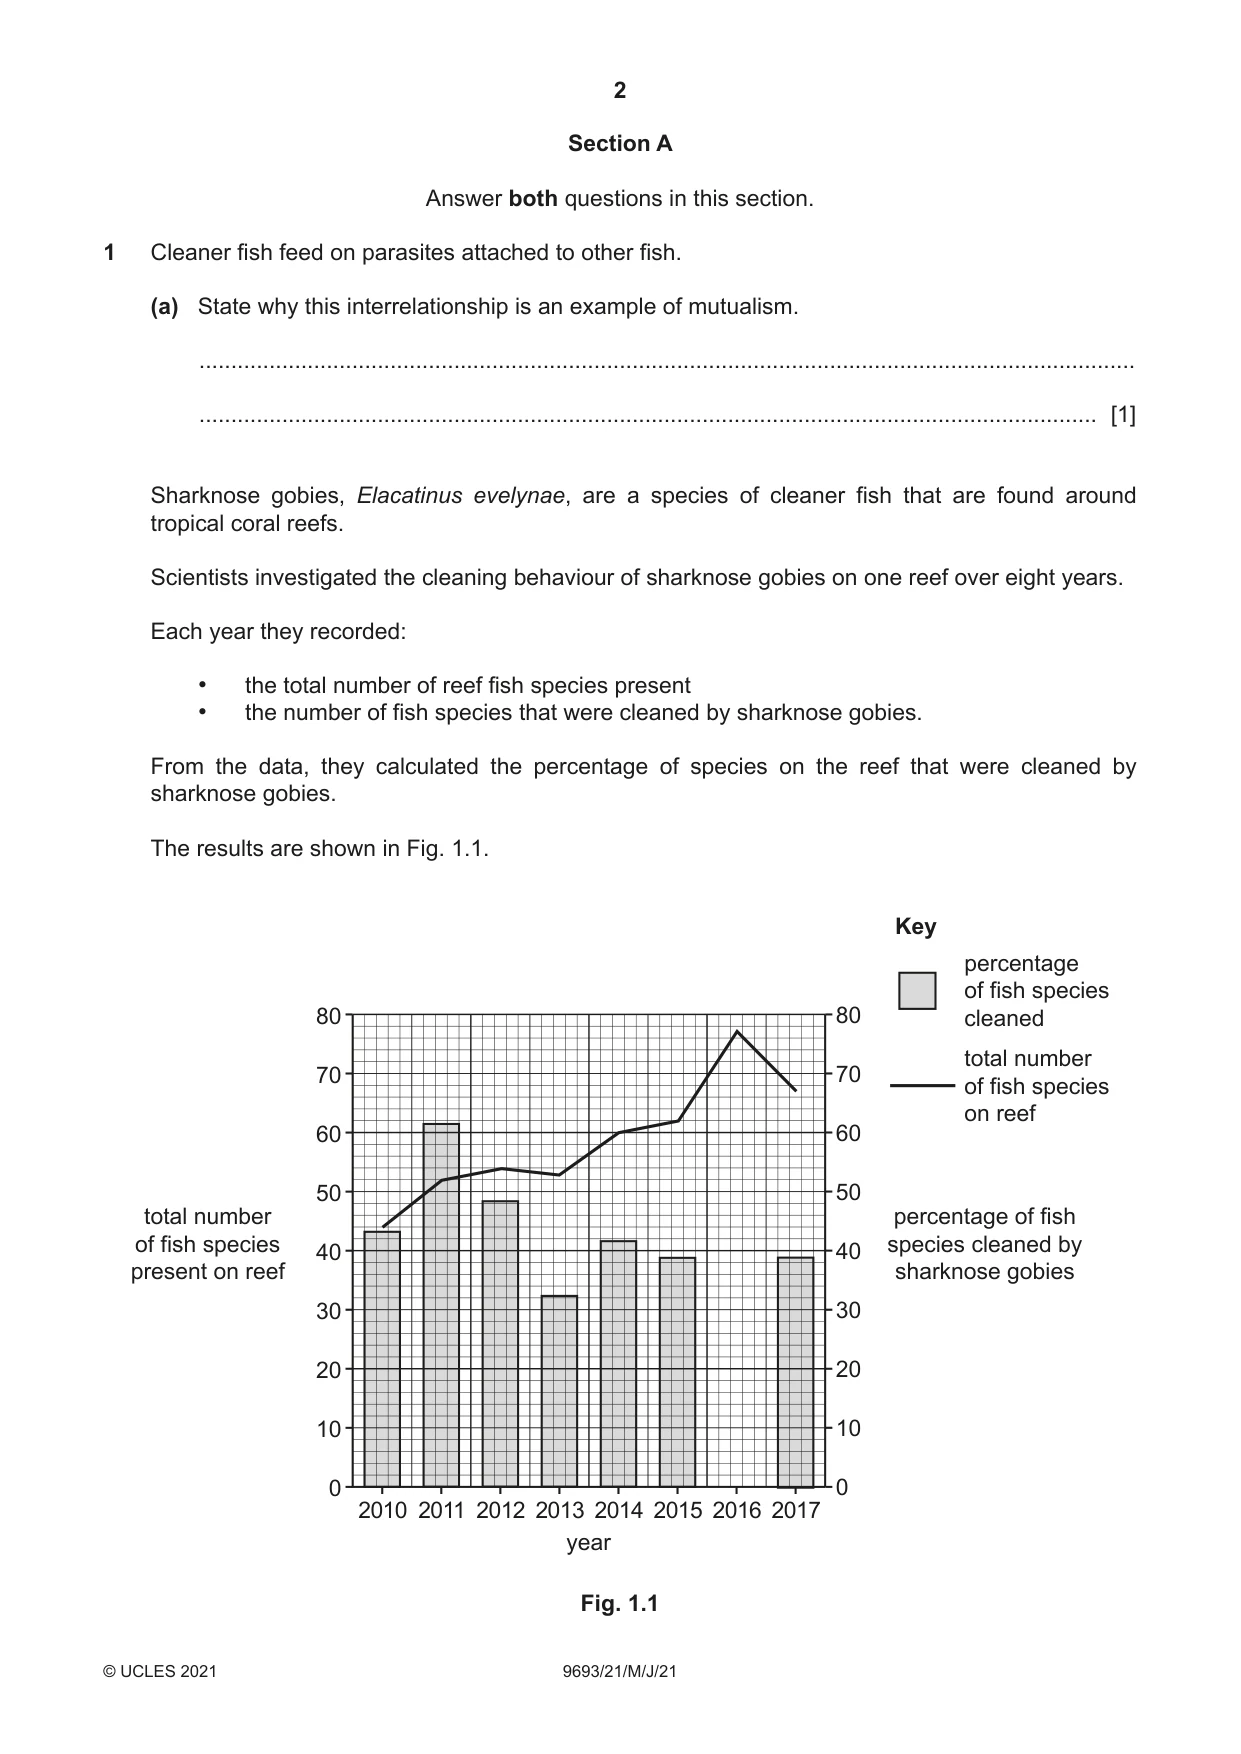
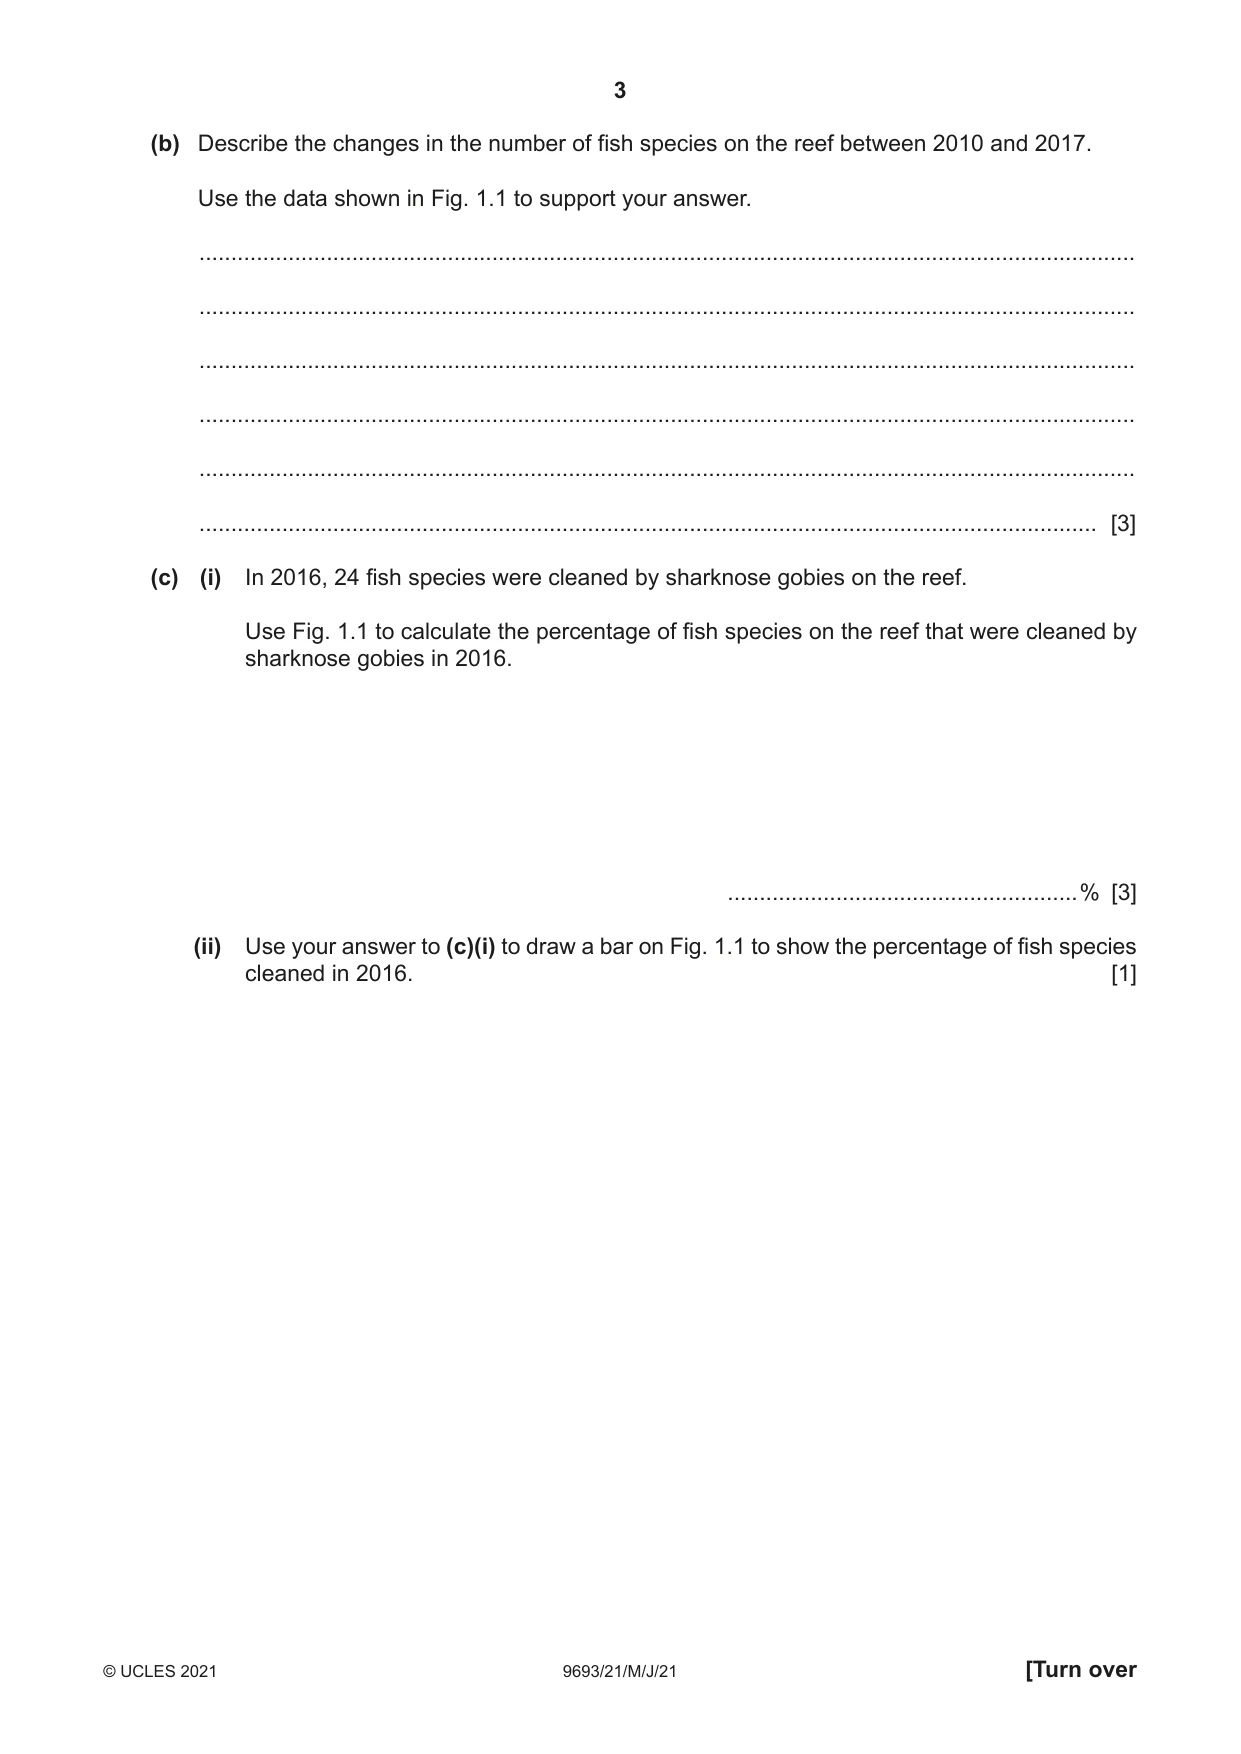
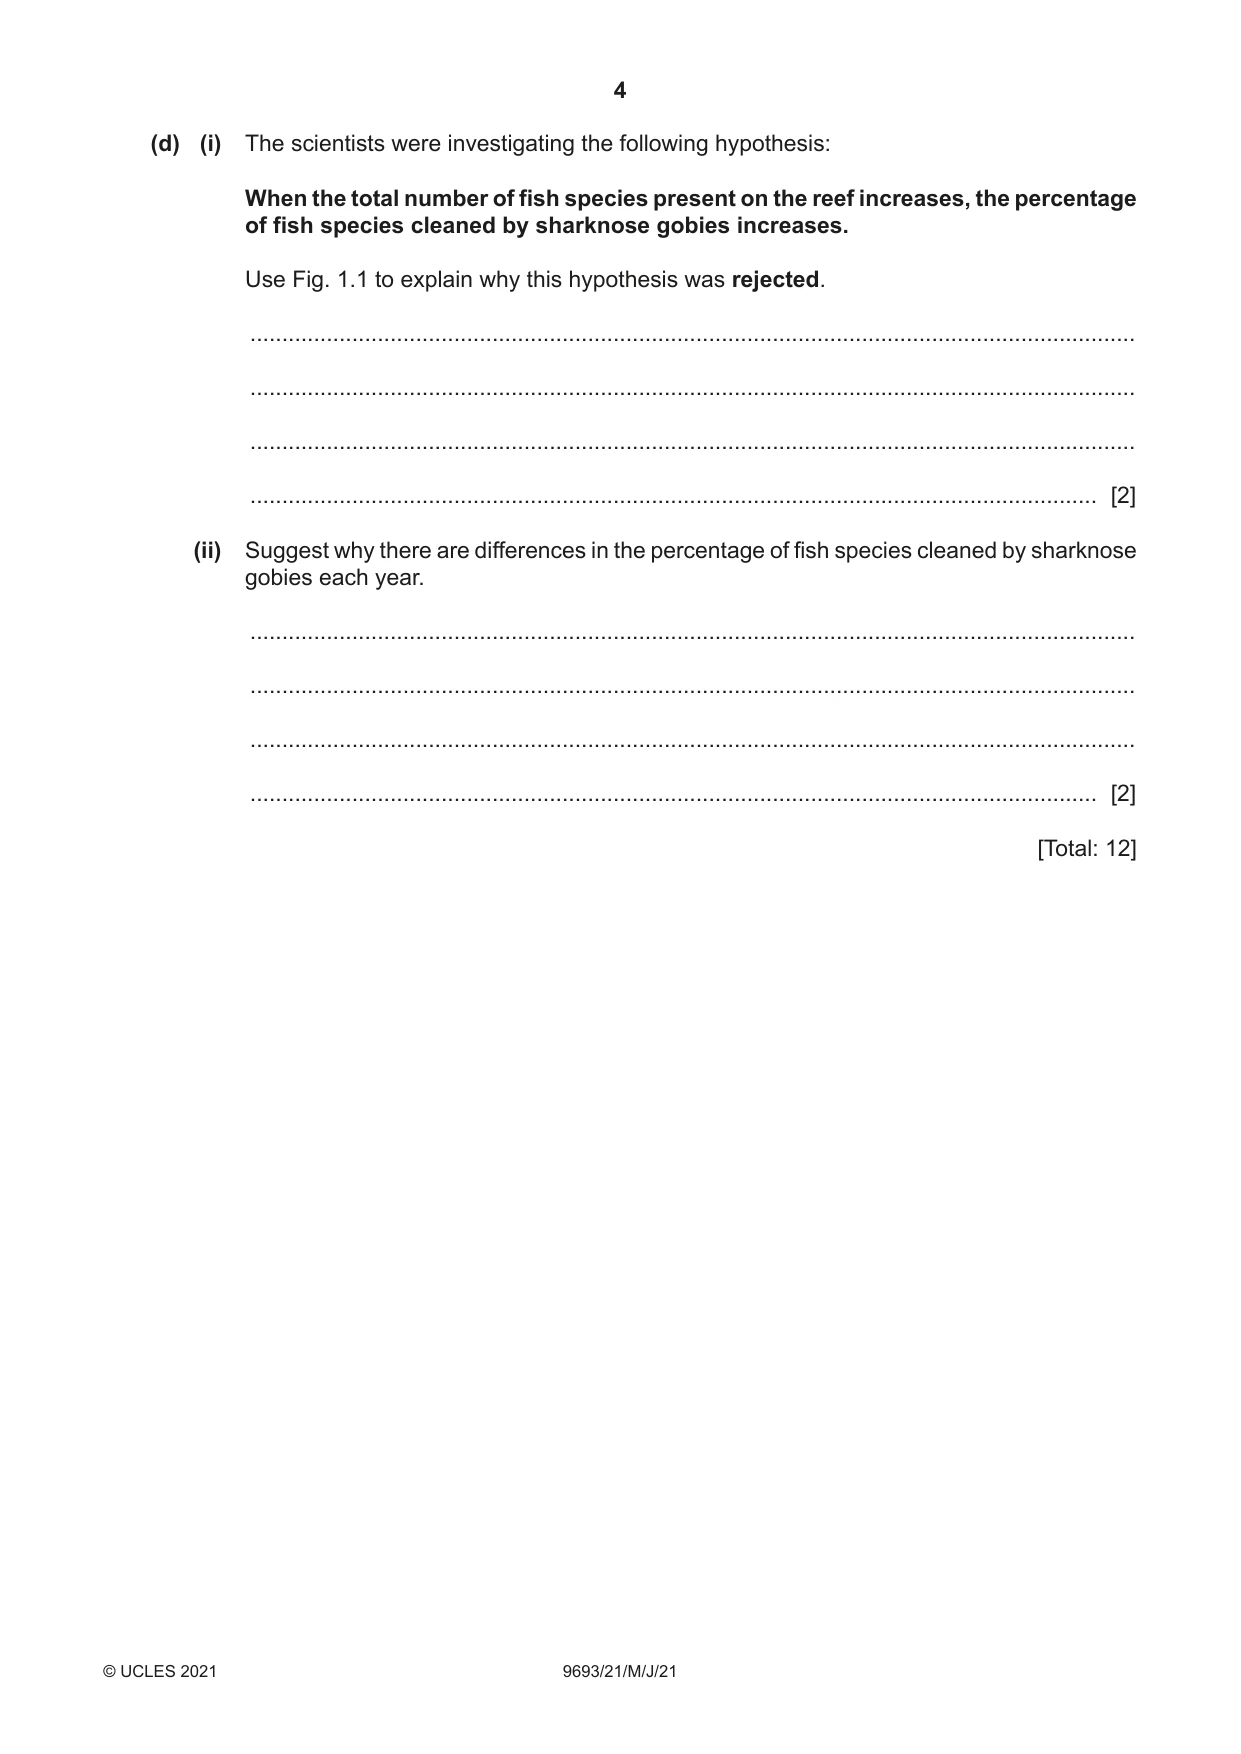
1 Cleaner fish feed on parasites attached to other fish. (a) State why this interrelationship is an example of mutualism. ................................................................................................................................................... ............................................................................................................................................. [1] Sharknose gobies, Elacatinus evelynae, are a species of cleaner fish that are found around tropical coral reefs. Scientists investigated the cleaning behaviour of sharknose gobies on one reef over eight years. Each year they recorded: • the total number of reef fish species present • the number of fish species that were cleaned by sharknose gobies. From the data, they calculated the percentage of species on the reef that were cleaned by sharknose gobies. The results are shown in Fig. 1.1. Key percentage of fish species 80 80 cleaned total number 70 70 of fish species on reef 60 60 50 50 total number percentage of fish of fish species species cleaned by 40 40 present on reef sharknose gobies 30 30 20 20 10 10 0 0 2010 2011 2012 2013 2014 2015 2016 2017 year Fig. 1.1 (b) Describe the changes in the number of fish species on the reef between 2010 and 2017. Use the data shown in Fig. 1.1 to support your answer. ................................................................................................................................................... ................................................................................................................................................... ................................................................................................................................................... ................................................................................................................................................... ................................................................................................................................................... ............................................................................................................................................. [3] (c) (i) In 2016, 24 fish species were cleaned by sharknose gobies on the reef. Use Fig. 1.1 to calculate the percentage of fish species on the reef that were cleaned by sharknose gobies in 2016. .......................................................% [3] (ii) Use your answer to (c)(i) to draw a bar on Fig. 1.1 to show the percentage of fish species cleaned in 2016. [1] (d) (i) The scientists were investigating the following hypothesis: When the total number of fish species present on the reef increases, the percentage of fish species cleaned by sharknose gobies increases. Use Fig. 1.1 to explain why this hypothesis was rejected. ........................................................................................................................................... ........................................................................................................................................... ........................................................................................................................................... ..................................................................................................................................... [2] (ii) Suggest why there are differences in the percentage of fish species cleaned by sharknose gobies each year. ........................................................................................................................................... ........................................................................................................................................... ........................................................................................................................................... ..................................................................................................................................... [2] [Total: 12]
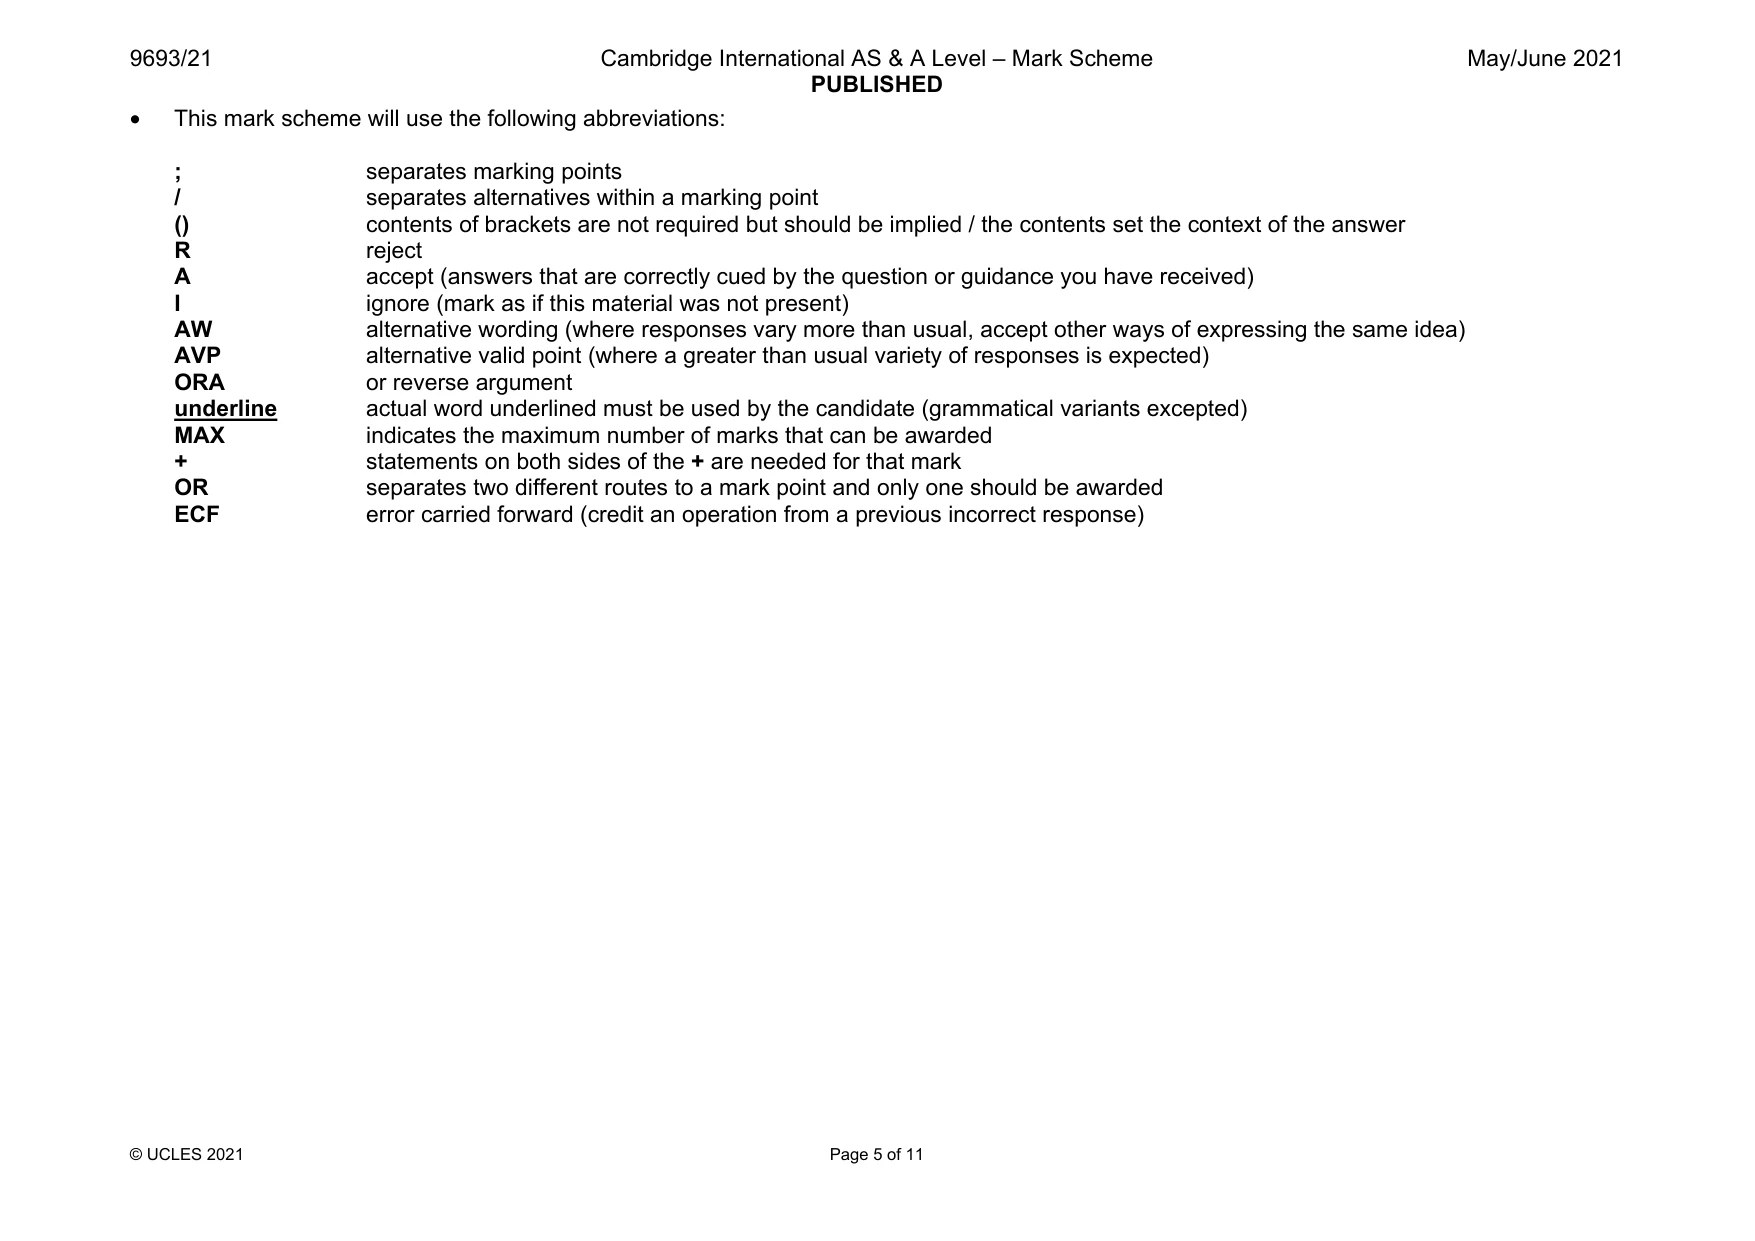
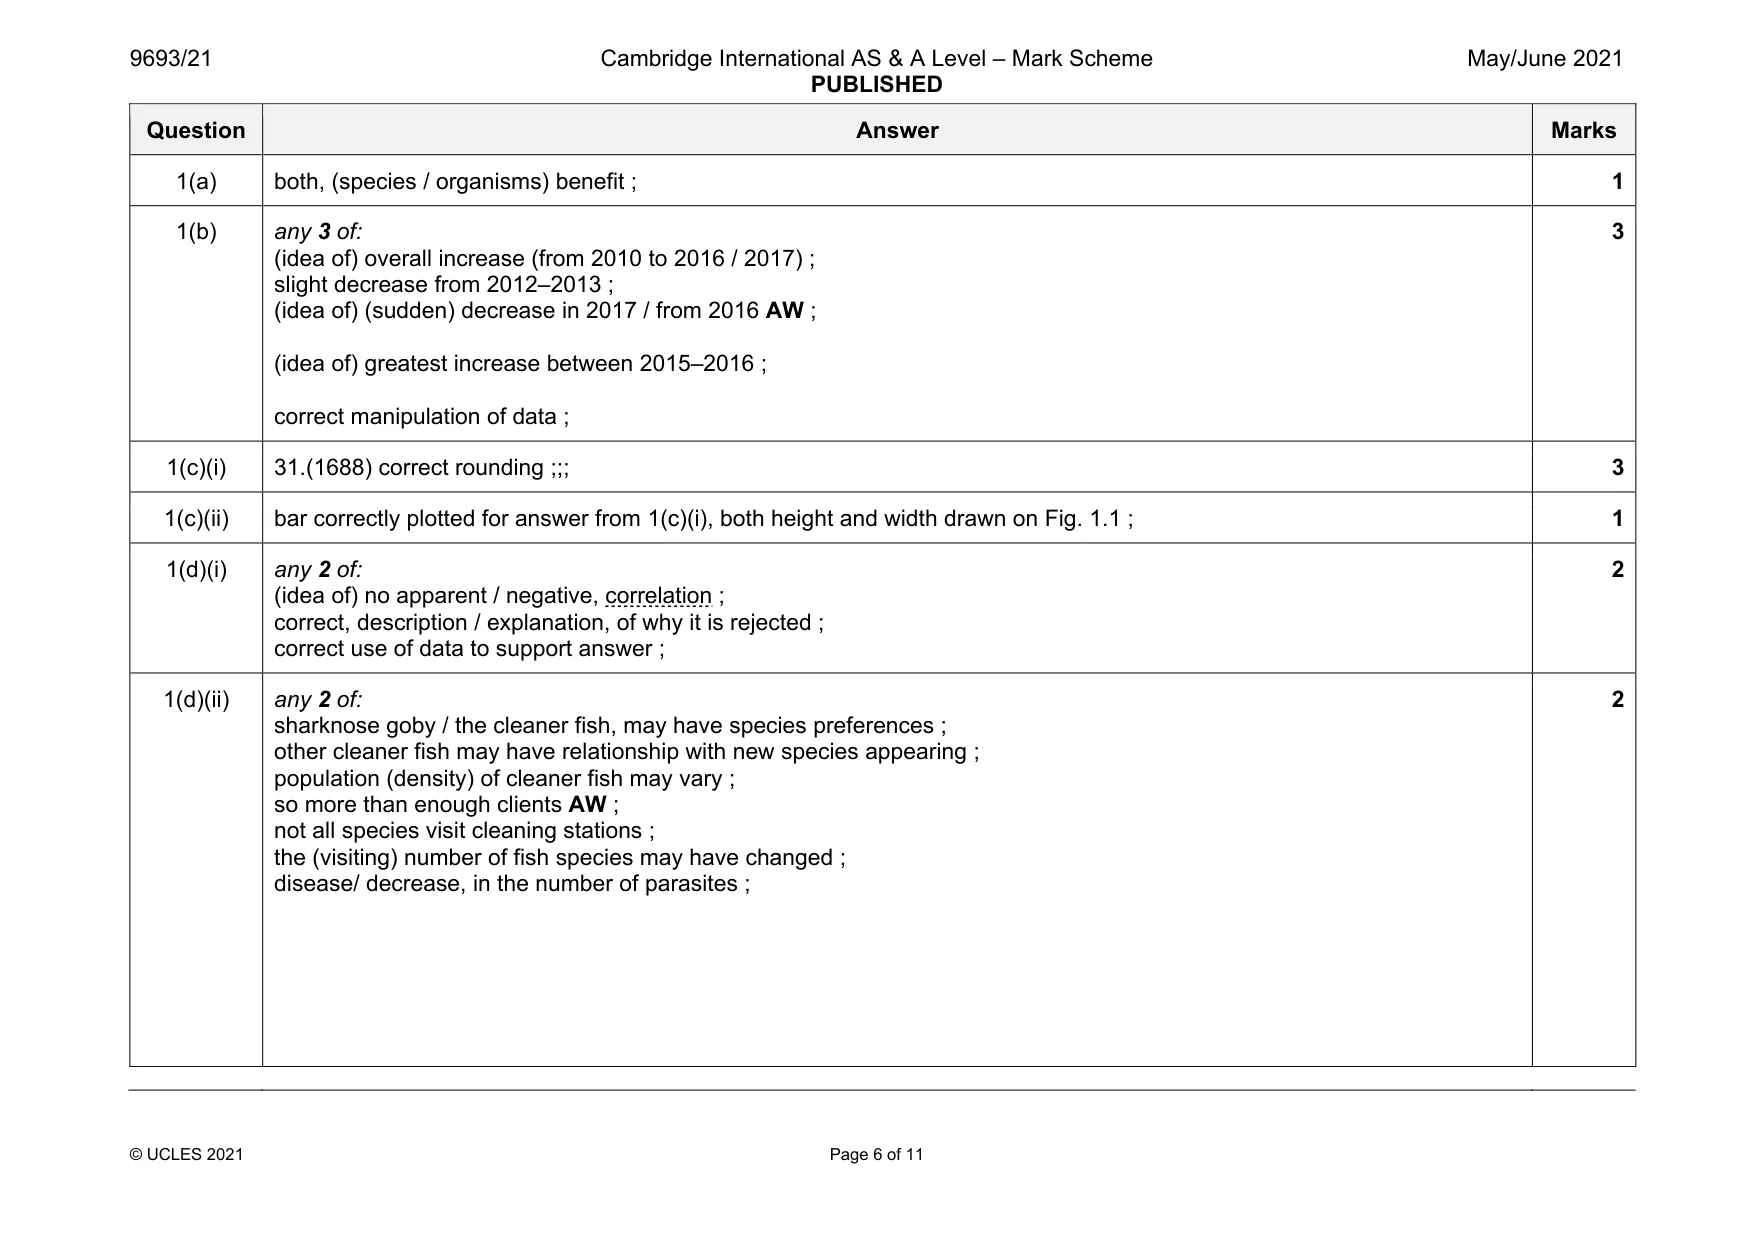
Mark scheme: 1(a) both, (species / organisms) benefit ; 1 1(b) any 3 of: (idea of) overall increase (from 2010 to 2016 / 2017) ; slight decrease from 2012–2013 ; (idea of) (sudden) decrease in 2017 / from 2016 AW ; (idea of) greatest increase between 2015–2016 ; correct manipulation of data ; 3 1(c)(i) 31.(1688) correct rounding ;;; 3 1(c)(ii) bar correctly plotted for answer from 1(c)(i), both height and width drawn on Fig. 1.1 ; 1 1(d)(i) any 2 of: (idea of) no apparent / negative, correlation ; correct, description / explanation, of why it is rejected ; correct use of data to support answer ; 2 1(d)(ii) any 2 of: sharknose goby / the cleaner fish, may have species preferences ; other cleaner fish may have relationship with new species appearing ; population (density) of cleaner fish may vary ; so more than enough clients AW ; not all species visit cleaning stations ; the (visiting) number of fish species may have changed ; disease/ decrease, in the number of parasites ; 2
Q2 · A Galapagos penguin, Spheniscus mendiculus, diving for fish
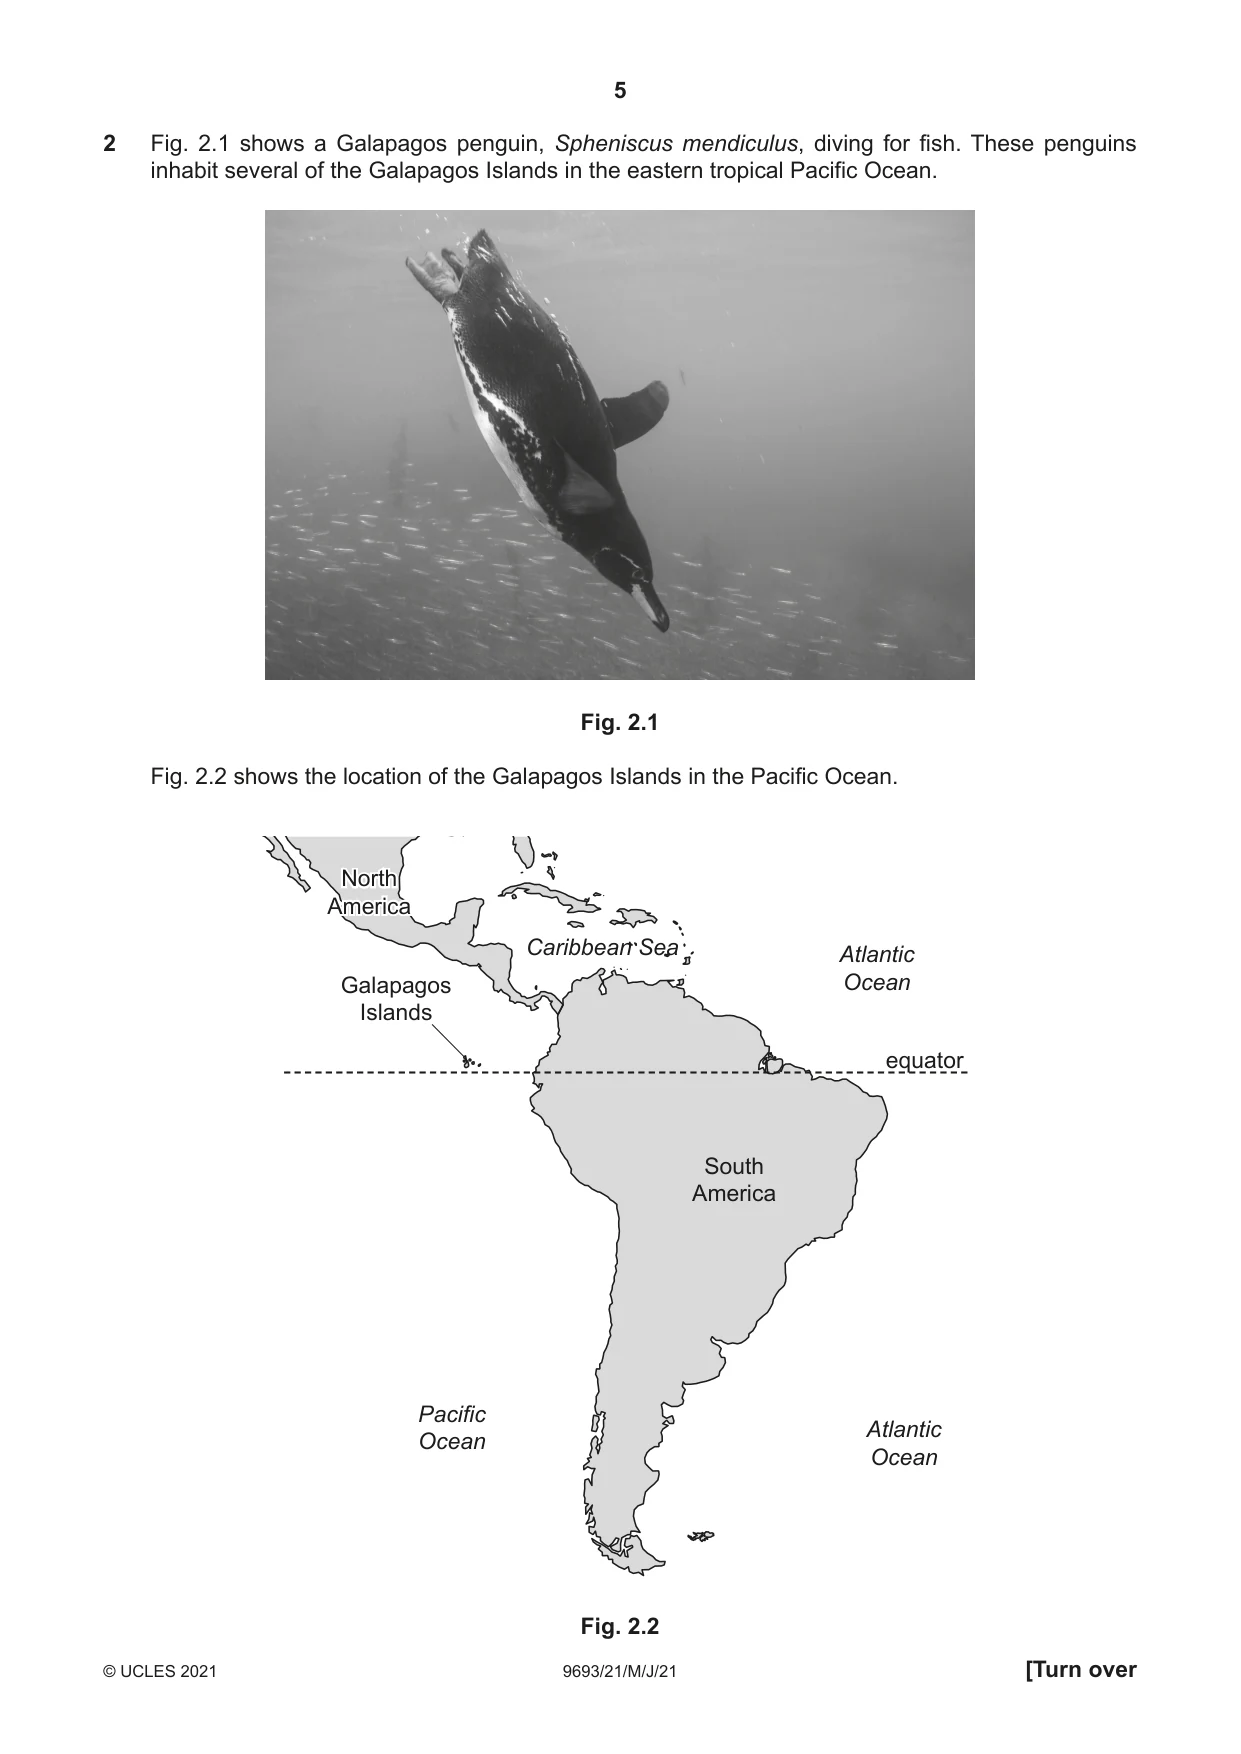
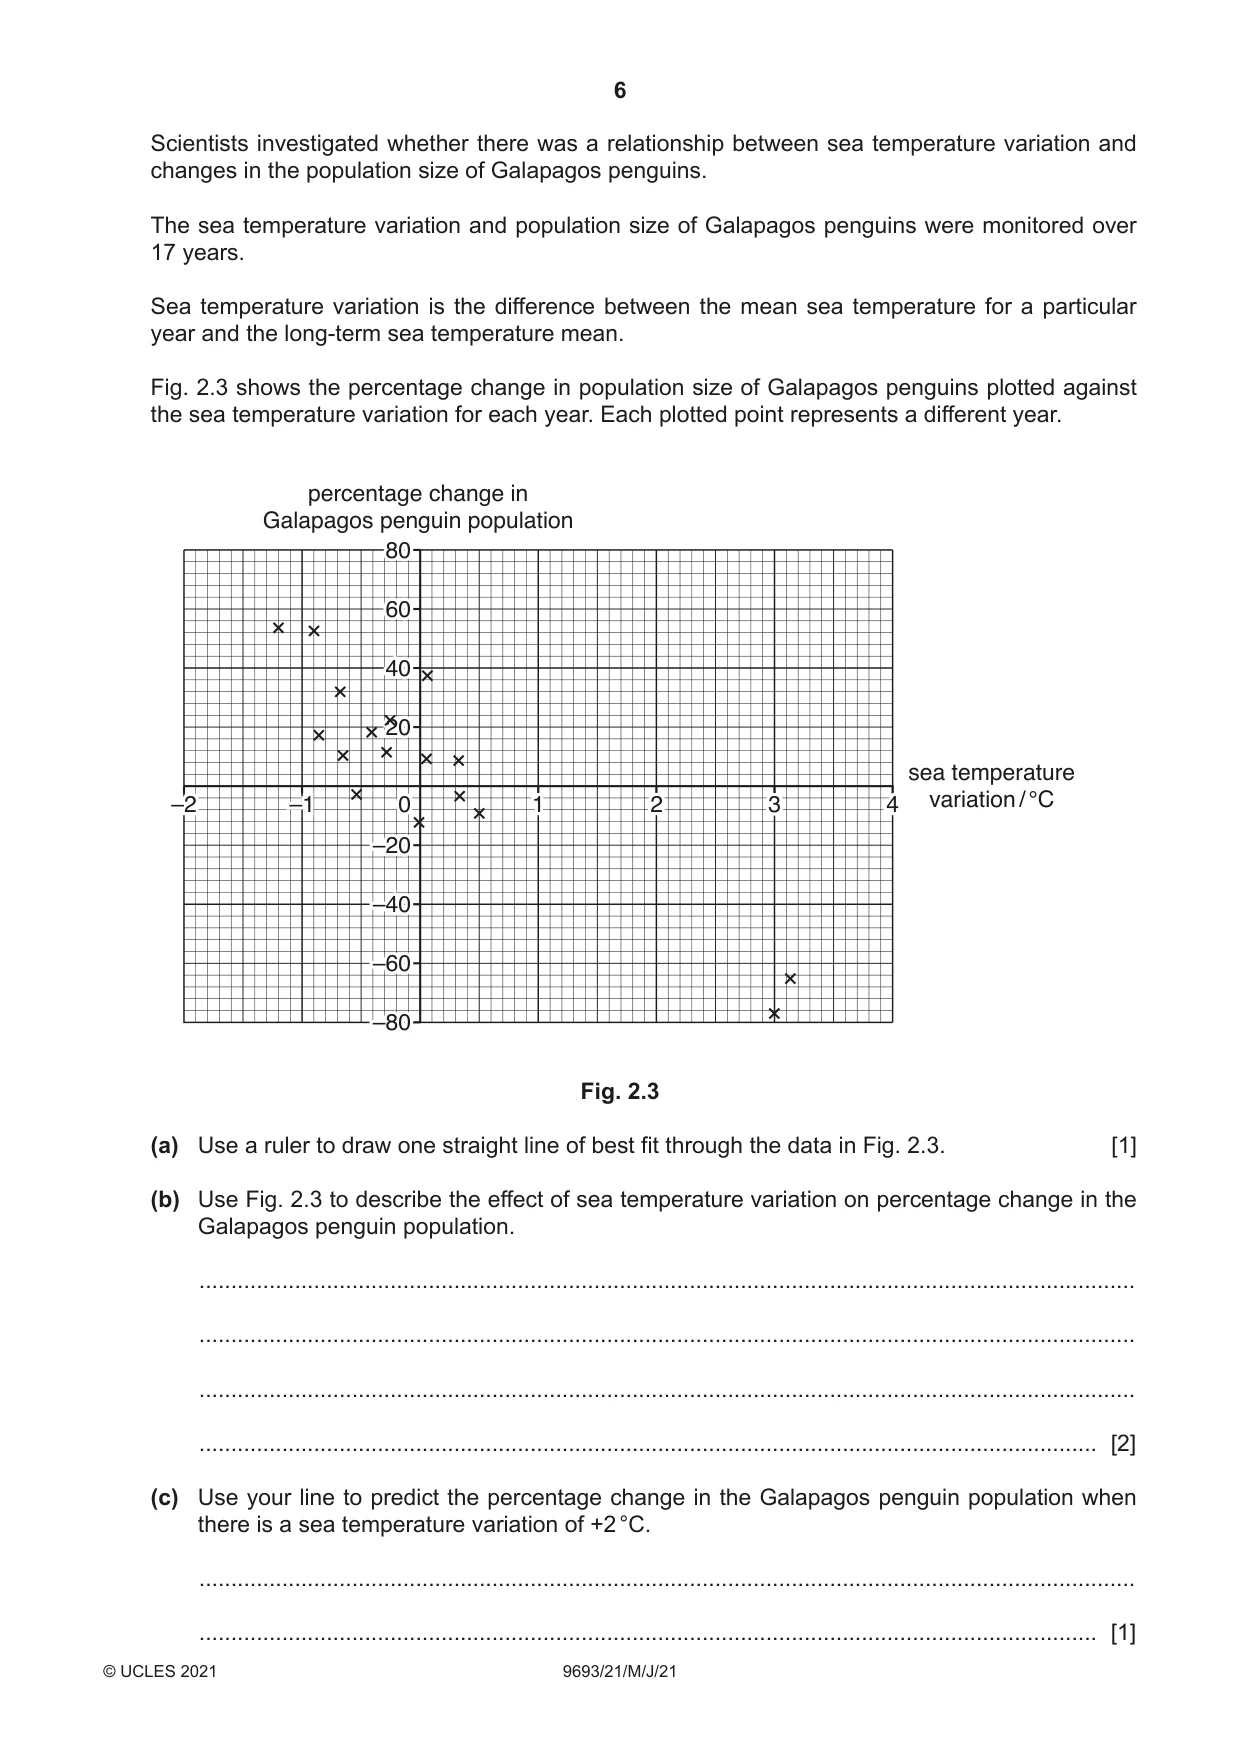
2 Fig. 2.1 shows a Galapagos penguin, Spheniscus mendiculus, diving for fish. These penguins inhabit several of the Galapagos Islands in the eastern tropical Pacific Ocean. Fig. 2.1 Fig. 2.2 shows the location of the Galapagos Islands in the Pacific Ocean. NorthNorth AmericaAmerica CaribbeanCaribbean SeaSea Atlantic Galapagos Ocean Islands equator South America Pacific Atlantic Ocean Ocean Fig. 2.2 Scientists investigated whether there was a relationship between sea temperature variation and changes in the population size of Galapagos penguins. The sea temperature variation and population size of Galapagos penguins were monitored over 17 years. Sea temperature variation is the difference between the mean sea temperature for a particular year and the long-term sea temperature mean. Fig. 2.3 shows the percentage change in population size of Galapagos penguins plotted against the sea temperature variation for each year. Each plotted point represents a different year. percentage change in Galapagos penguin population 8080 6060 4040 2020 sea temperature –2–2 –1–1 0 11 22 33 44 variation / °C –20–20 –40–40 –60–60 –80–80 Fig. 2.3 (a) Use a ruler to draw one straight line of best fit through the data in Fig. 2.3. [1] (b) Use Fig. 2.3 to describe the effect of sea temperature variation on percentage change in the Galapagos penguin population. ................................................................................................................................................... ................................................................................................................................................... ................................................................................................................................................... ............................................................................................................................................. [2] (c) Use your line to predict the percentage change in the Galapagos penguin population when there is a sea temperature variation of +2 °C. ................................................................................................................................................... ............................................................................................................................................. [1] (d) When the sea temperature variation was +2 °C or higher, an El Niño event had occurred. Explain why this caused the percentage change in Galapagos penguin population observed. ................................................................................................................................................... ................................................................................................................................................... ................................................................................................................................................... ................................................................................................................................................... ................................................................................................................................................... ................................................................................................................................................... ................................................................................................................................................... ............................................................................................................................................. [4] [Total: 8]
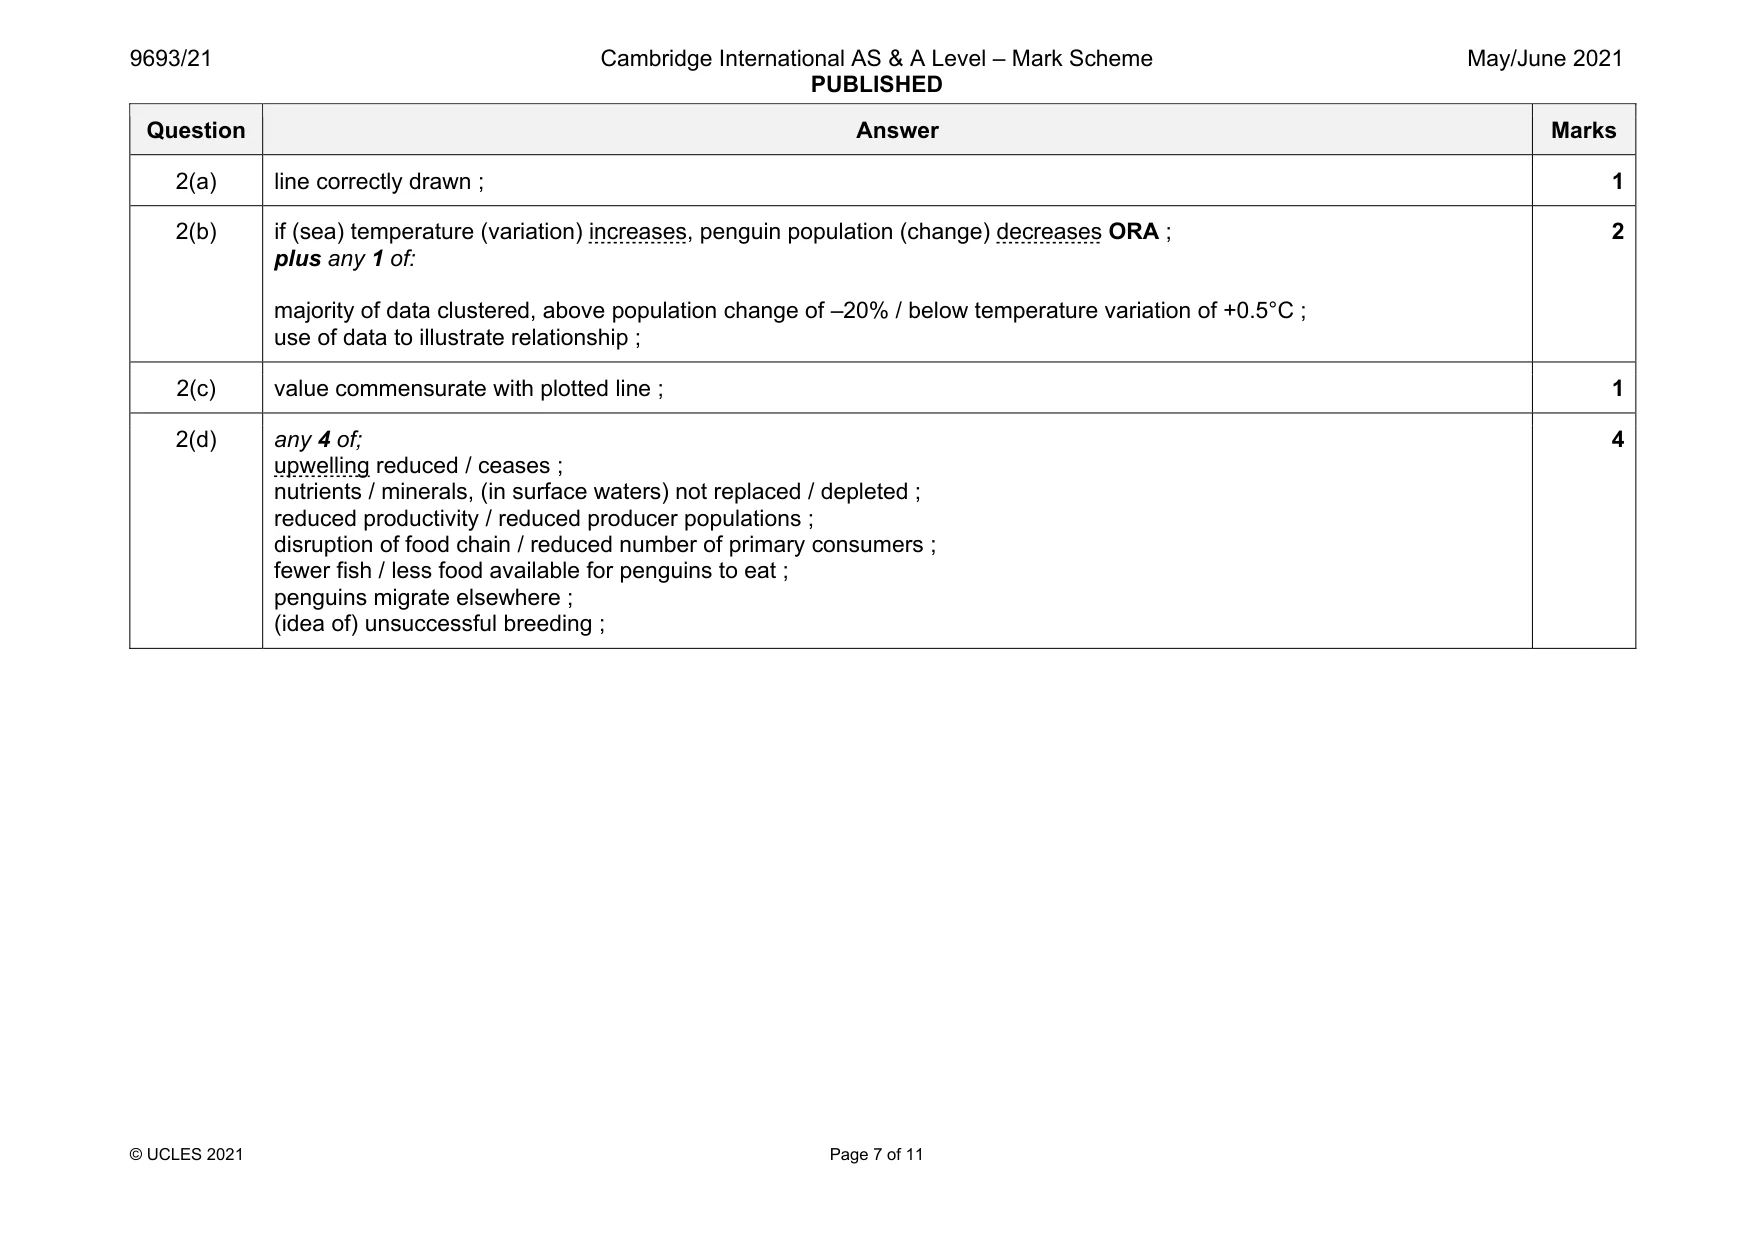
Mark scheme: 2(a) line correctly drawn ; 1 2(b) if (sea) temperature (variation) increases, penguin population (change) decreases ORA ; plus any 1 of: majority of data clustered, above population change of –20% / below temperature variation of +0.5°C ; use of data to illustrate relationship ; 2 2(c) value commensurate with plotted line ; 1 2(d) any 4 of; upwelling reduced / ceases ; nutrients / minerals, (in surface waters) not replaced / depleted ; reduced productivity / reduced producer populations ; disruption of food chain / reduced number of primary consumers ; fewer fish / less food available for penguins to eat ; penguins migrate elsewhere ; (idea of) unsuccessful breeding ; 4
Q3 · Explain why hydrothermal vents are described as extreme environments
3 (a) (i) Explain why hydrothermal vents are described as extreme environments. ........................................................................................................................................... ........................................................................................................................................... ........................................................................................................................................... ........................................................................................................................................... ........................................................................................................................................... ..................................................................................................................................... [3] (ii) Explain the meaning of the term succession. Use examples from hydrothermal vent communities in your answer. ........................................................................................................................................... ........................................................................................................................................... ........................................................................................................................................... ........................................................................................................................................... ........................................................................................................................................... ........................................................................................................................................... ........................................................................................................................................... ........................................................................................................................................... ........................................................................................................................................... ..................................................................................................................................... [5] (b) Describe the theory of plate tectonics. Include evidence that supports the theory. ................................................................................................................................................... ................................................................................................................................................... ................................................................................................................................................... ................................................................................................................................................... ................................................................................................................................................... ................................................................................................................................................... ................................................................................................................................................... ................................................................................................................................................... ................................................................................................................................................... ................................................................................................................................................... ................................................................................................................................................... ................................................................................................................................................... ................................................................................................................................................... ............................................................................................................................................. [7] [Total: 15]
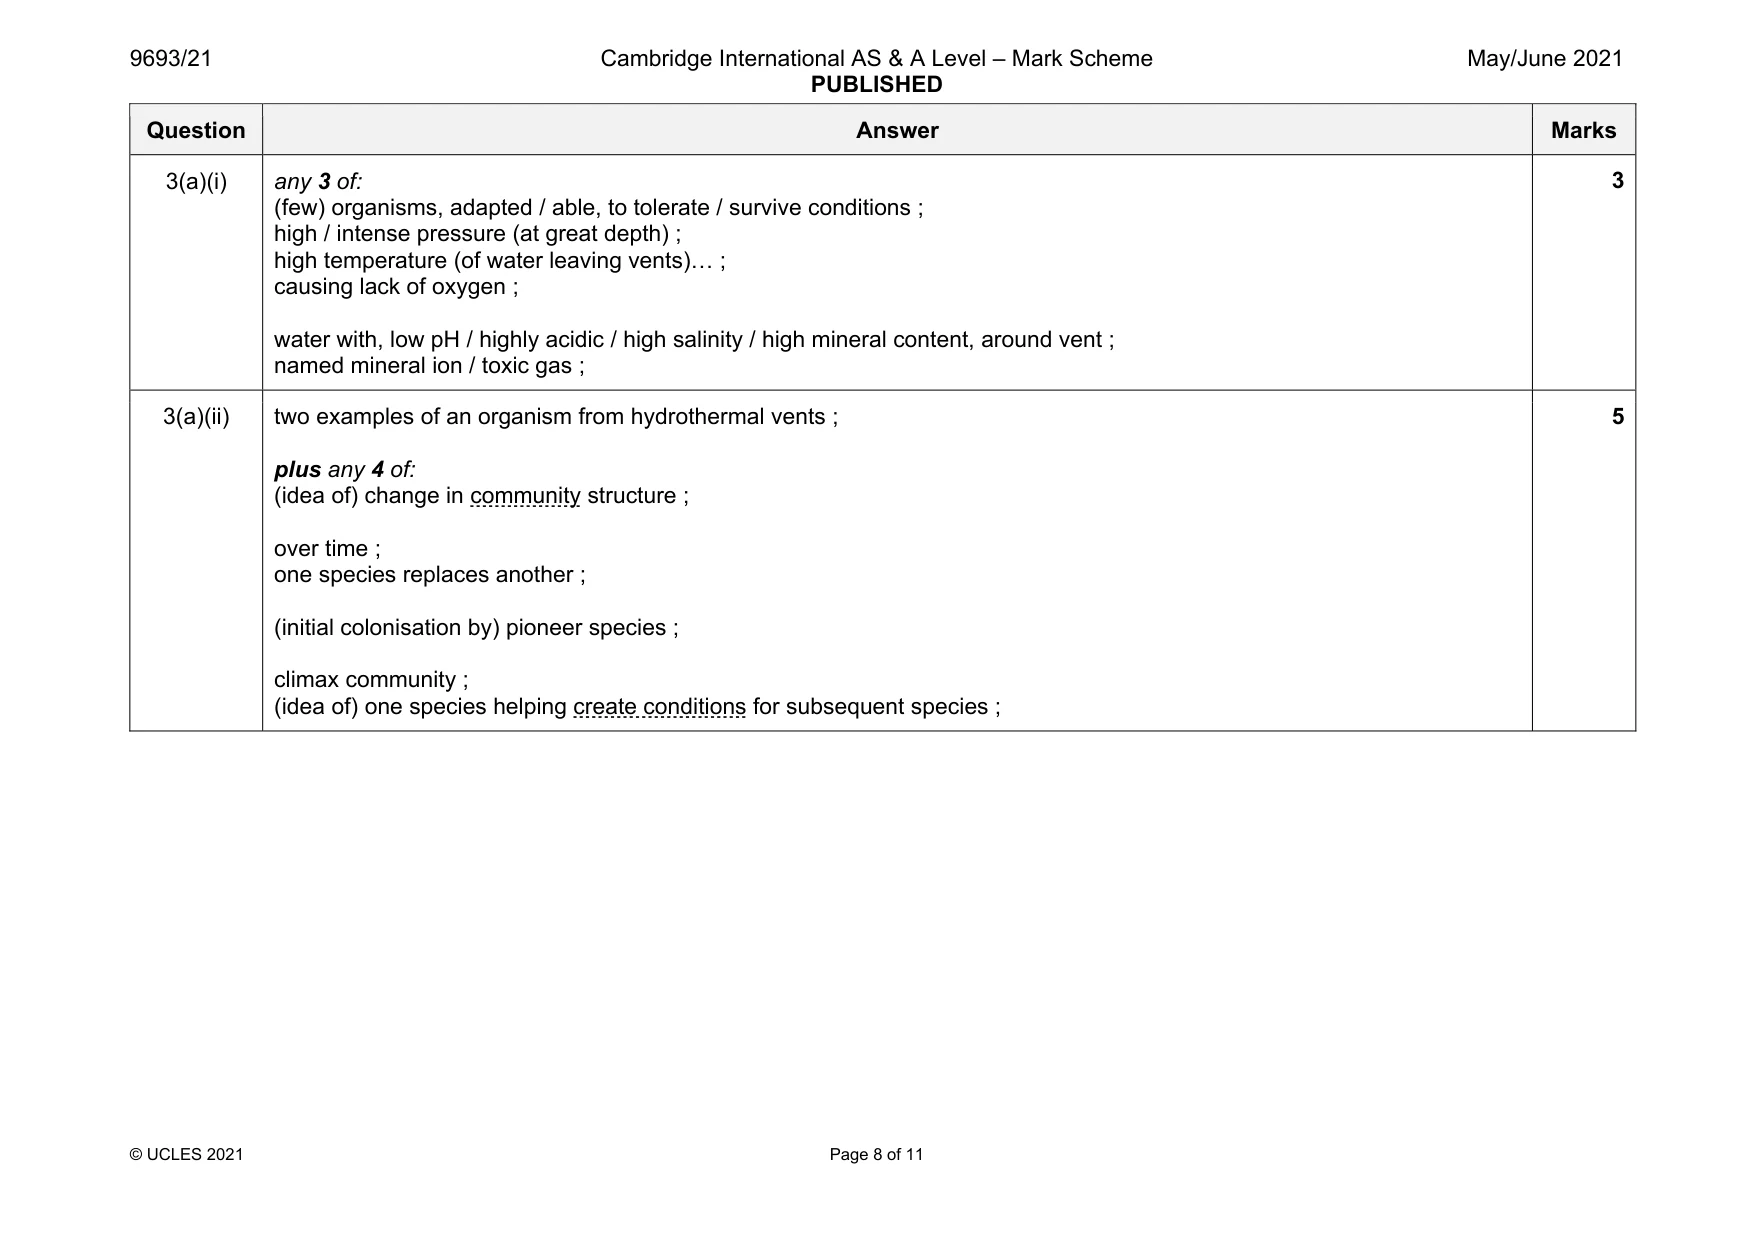
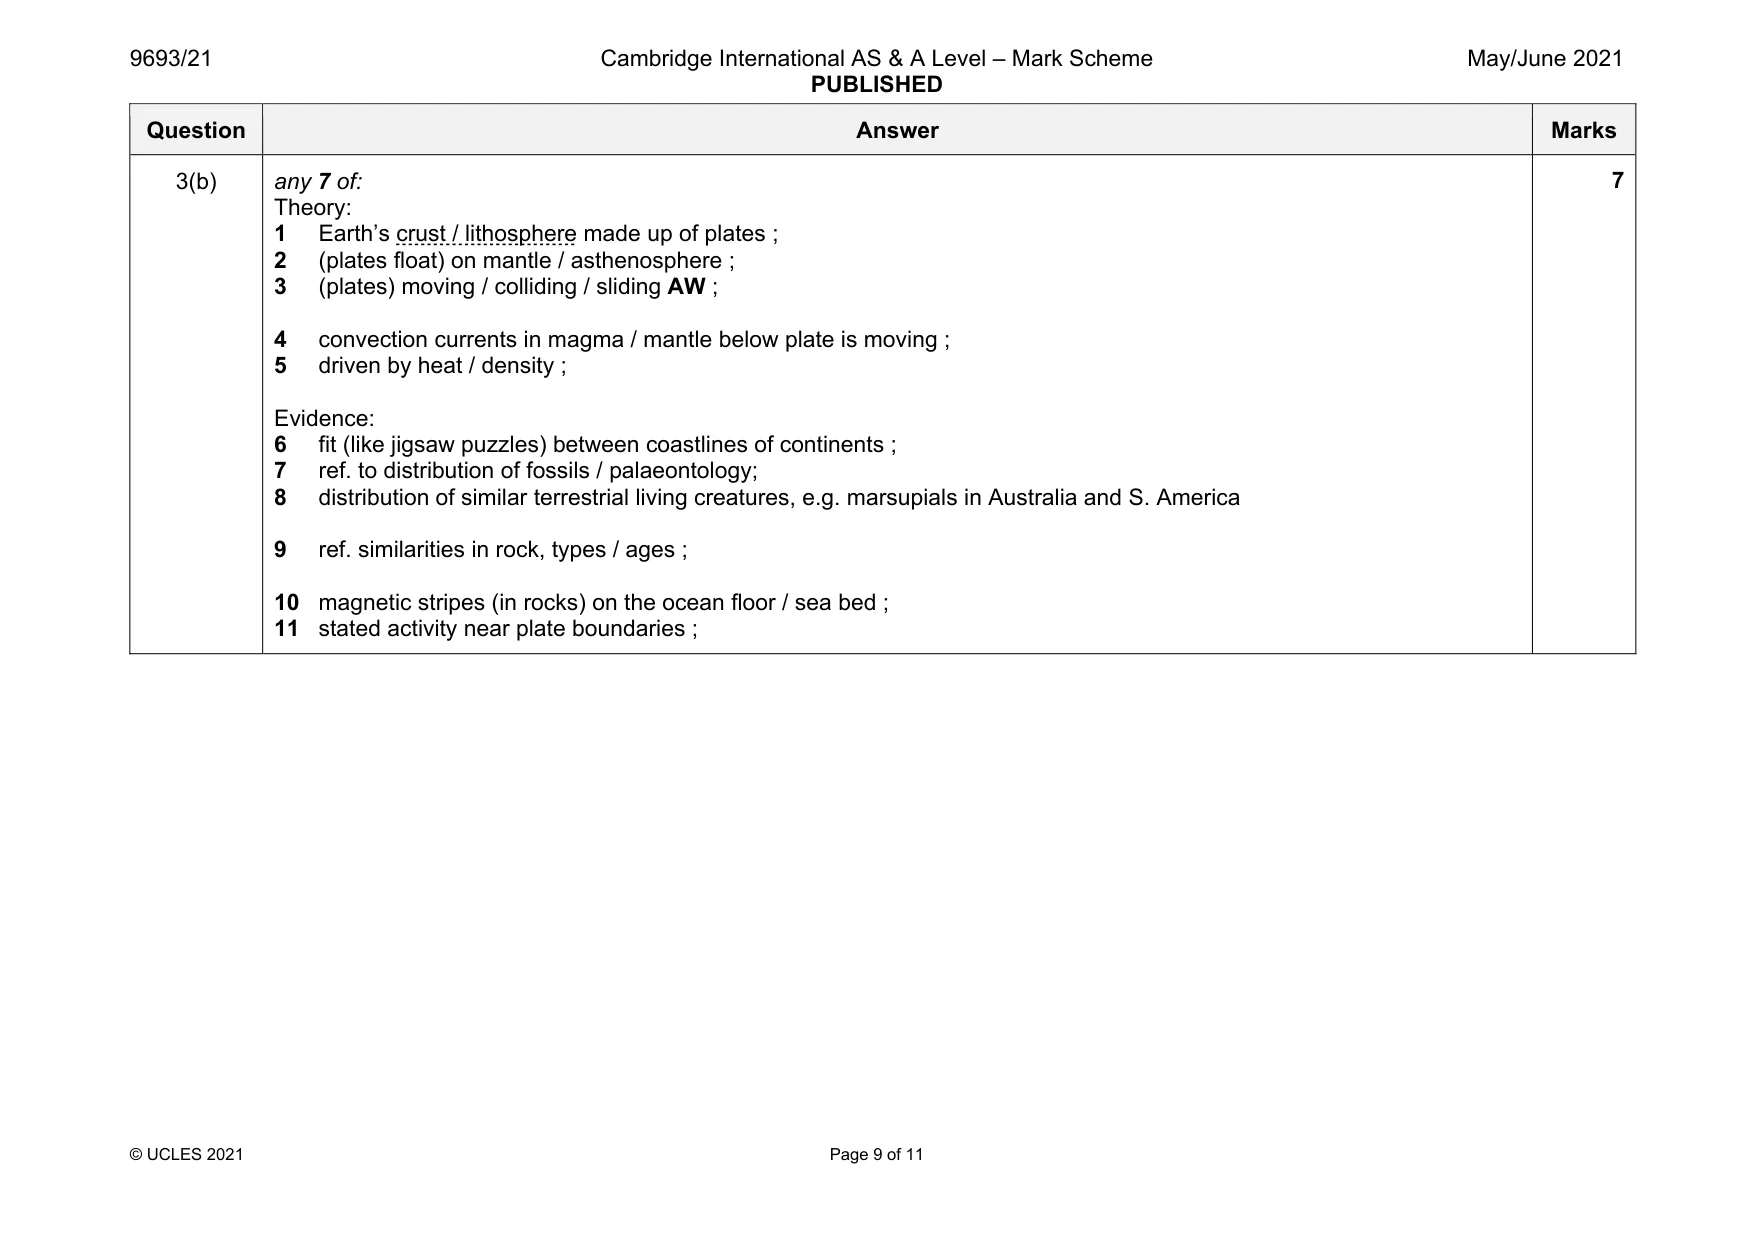
Mark scheme: 3(a)(i) any 3 of: (few) organisms, adapted / able, to tolerate / survive conditions ; high / intense pressure (at great depth) ; high temperature (of water leaving vents)… ; causing lack of oxygen ; water with, low pH / highly acidic / high salinity / high mineral content, around vent ; named mineral ion / toxic gas ; 3(a)(ii) two examples of an organism from hydrothermal vents ; plus any 4 of: (idea of) change in community structure ; over time ; one species replaces another ; (initial colonisation by) pioneer species ; climax community ; (idea of) one species helping create conditions for subsequent species ; 5 Question Answer Marks 3(b) any 7 of: Theory: 1 Earth’s crust / lithosphere made up of plates ; 2 (plates float) on mantle / asthenosphere ; 3 (plates) moving / colliding / sliding AW ; 4 convection currents in magma / mantle below plate is moving ; 5 driven by heat / density ; Evidence: 6 fit (like jigsaw puzzles) between coastlines of continents ; 7 ref. to distribution of fossils / palaeontology; 8 distribution of similar terrestrial living creatures, e.g. marsupials in Australia and S. America 9 ref. similarities in rock, types / ages ; 10 magnetic stripes (in rocks) on the ocean floor / sea bed ; 11 stated activity near plate boundaries ; 7
Q4 · Mangrove ecosystems are a feature of tropical river deltas
4 Mangrove ecosystems are a feature of tropical river deltas. (a) Describe the importance of mangroves for the morphology of deltas. ................................................................................................................................................... ................................................................................................................................................... ................................................................................................................................................... ................................................................................................................................................... ................................................................................................................................................... ................................................................................................................................................... ................................................................................................................................................... ............................................................................................................................................. [4] (b) After long periods of rain, the volume of water passing through a delta increases. (i) Suggest impacts of this increase on the environmental conditions for organisms living in the delta. ........................................................................................................................................... ........................................................................................................................................... ........................................................................................................................................... ........................................................................................................................................... ........................................................................................................................................... ........................................................................................................................................... ........................................................................................................................................... ........................................................................................................................................... ........................................................................................................................................... ..................................................................................................................................... [5] (ii) Suggest why an increased volume of river water entering the ocean may decrease coral reef productivity. ........................................................................................................................................... ........................................................................................................................................... ........................................................................................................................................... ........................................................................................................................................... ........................................................................................................................................... ........................................................................................................................................... ........................................................................................................................................... ........................................................................................................................................... ........................................................................................................................................... ........................................................................................................................................... ........................................................................................................................................... ..................................................................................................................................... [6] [Total: 15]
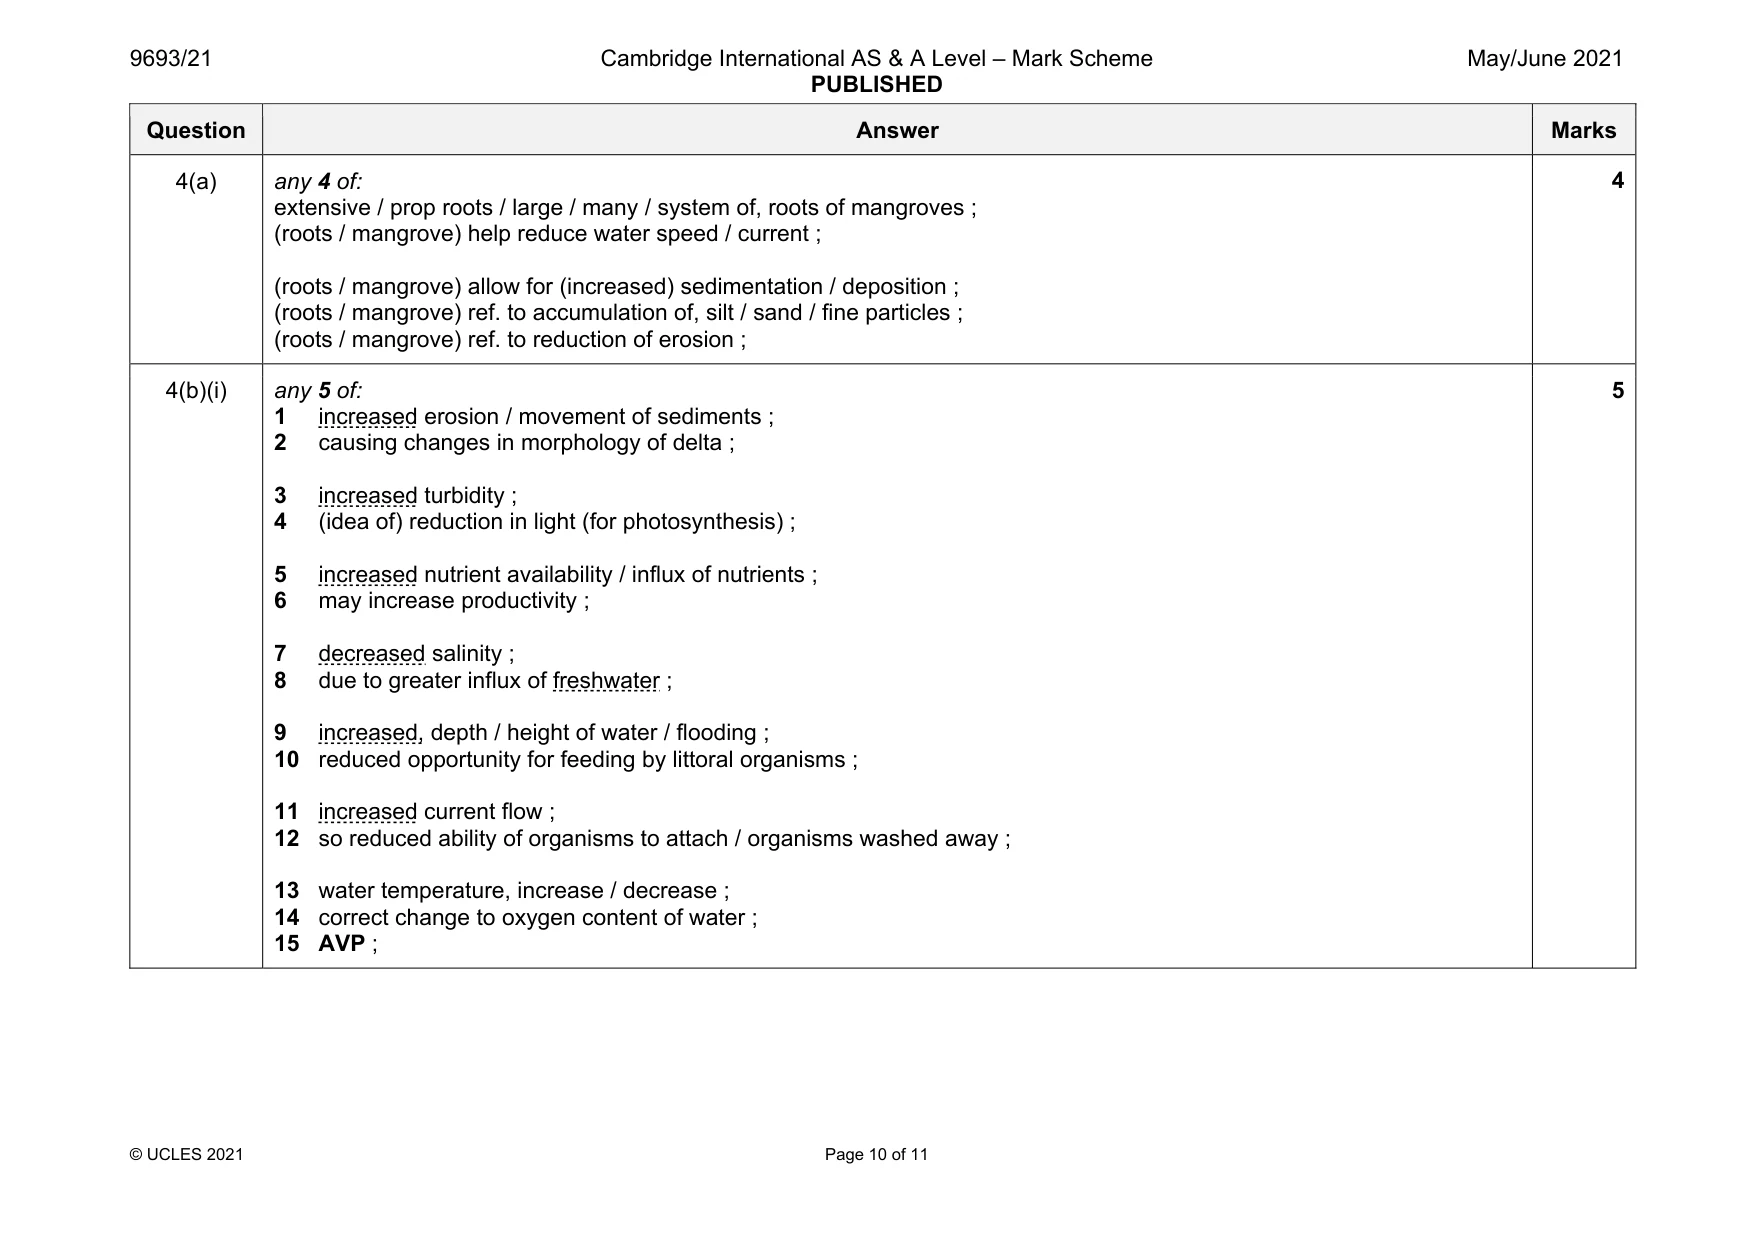
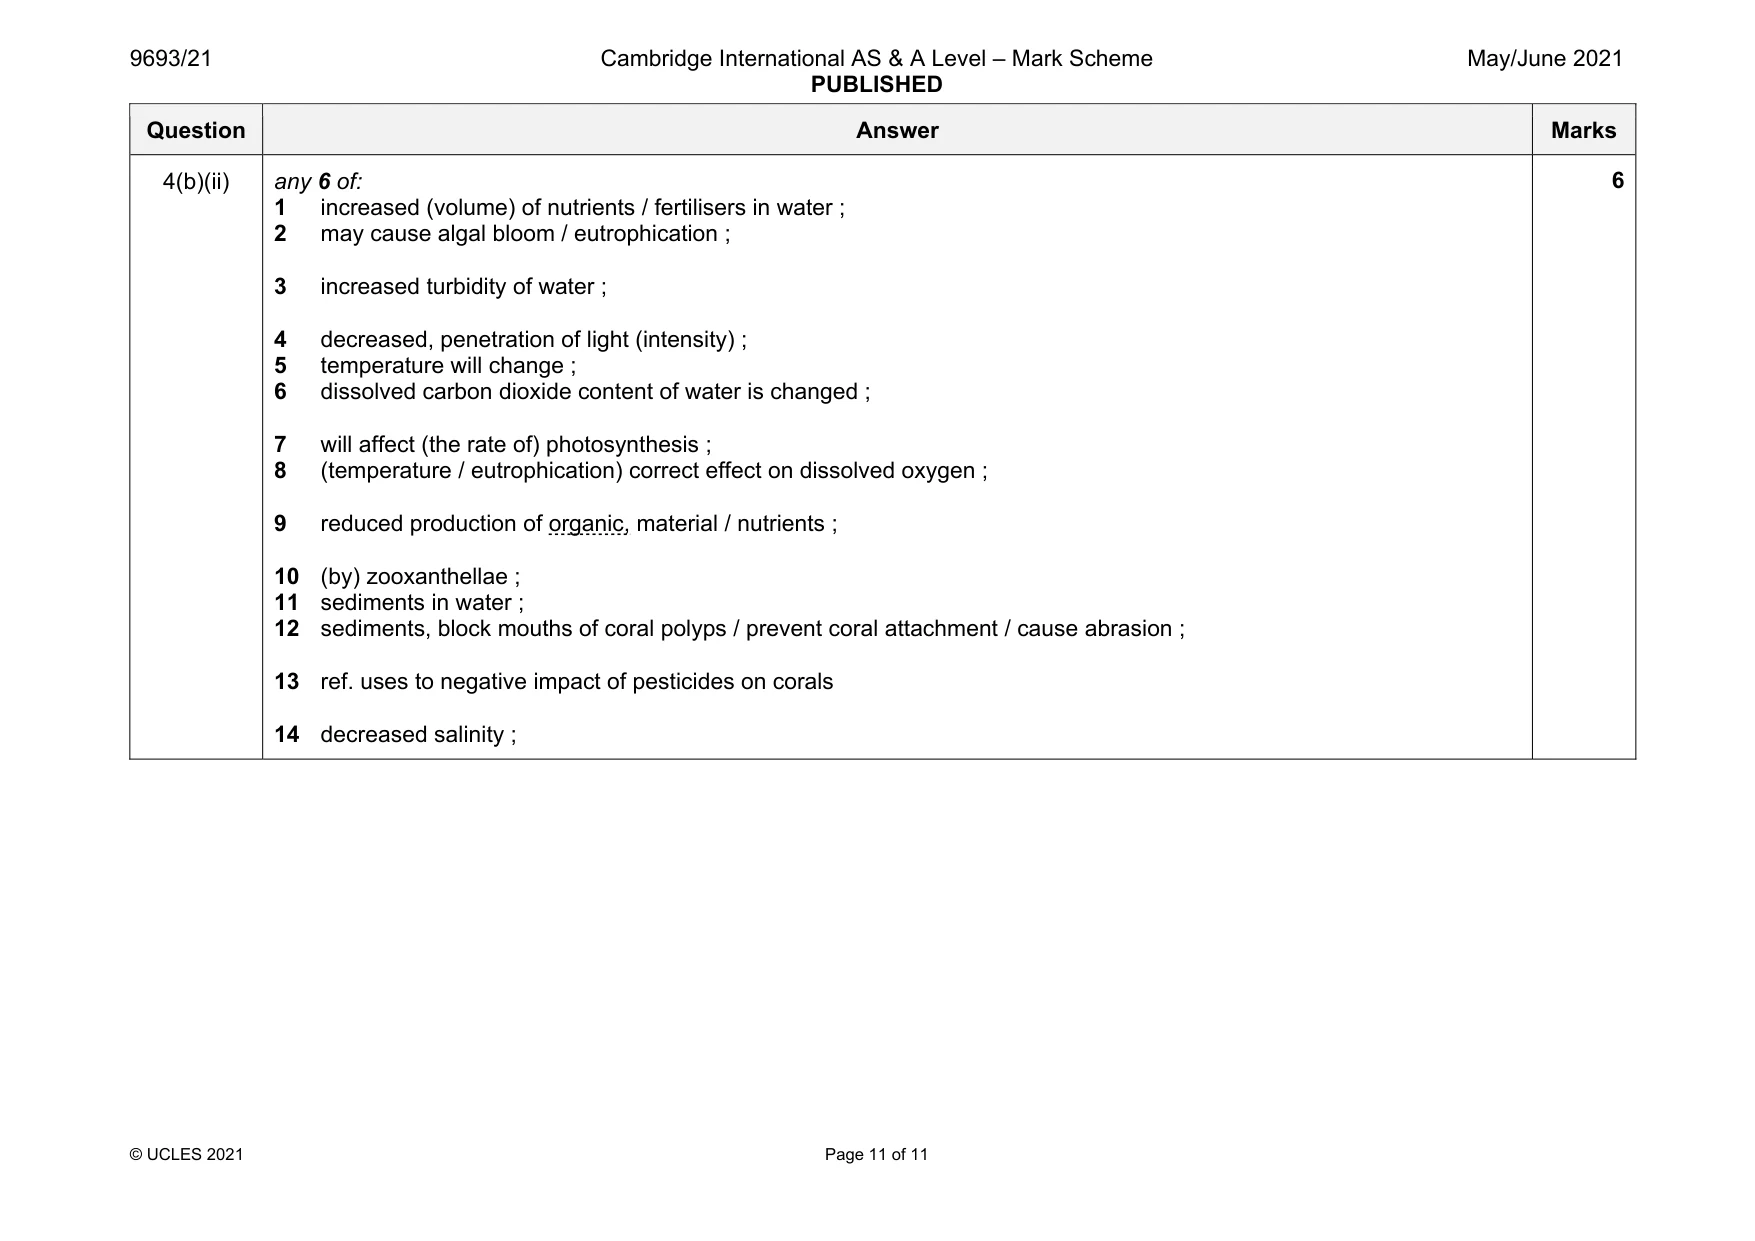
Mark scheme: 4(a) any 4 of: extensive / prop roots / large / many / system of, roots of mangroves ; (roots / mangrove) help reduce water speed / current ; (roots / mangrove) allow for (increased) sedimentation / deposition ; (roots / mangrove) ref. to accumulation of, silt / sand / fine particles ; (roots / mangrove) ref. to reduction of erosion ; 4(b)(i) any 5 of: 1 increased erosion / movement of sediments ; 2 causing changes in morphology of delta ; 3 increased turbidity ; 4 (idea of) reduction in light (for photosynthesis) ; 5 increased nutrient availability / influx of nutrients ; 6 may increase productivity ; 7 decreased salinity ; 8 due to greater influx of freshwater ; 9 increased, depth / height of water / flooding ; 10 reduced opportunity for feeding by littoral organisms ; 11 increased current flow ; 12 so reduced ability of organisms to attach / organisms washed away ; 13 water temperature, increase / decrease ; 14 correct change to oxygen content of water ; 15 AVP ; 5 Question Answer Marks 4(b)(ii) any 6 of: 1 increased (volume) of nutrients / fertilisers in water ; 2 may cause algal bloom / eutrophication ; 3 increased turbidity of water ; 4 decreased, penetration of light (intensity) ; 5 temperature will change ; 6 dissolved carbon dioxide content of water is changed ; 7 will affect (the rate of) photosynthesis ; 8 (temperature / eutrophication) correct effect on dissolved oxygen ; 9 reduced production of organic, material / nutrients ; 10 (by) zooxanthellae ; 11 sediments in water ; 12 sediments, block mouths of coral polyps / prevent coral attachment / cause abrasion ; 13 ref. uses to negative impact of pesticides on corals 14 decreased salinity ; 6
What was in this paper
The subtopics covered by these 4 questions, and how many questions each got. Open one in a new tab to see every Cambridge question on it.
What you needed in this session
Cambridge’s own grade thresholds for 2021 May/June, Paper 2 · Variant 1. A higher threshold means an easier paper — the bar moves with how the cohort did.