Cambridge A Level Geography 9696 — 2025 Oct/Nov Paper 3 · Variant 2
9696/32/O/N/25 · 11 questions · 60 marks · ≈68 min
The question paper and its mark scheme, free to read here and free to download. This is Cambridge’s own paper, exactly as it was sat.
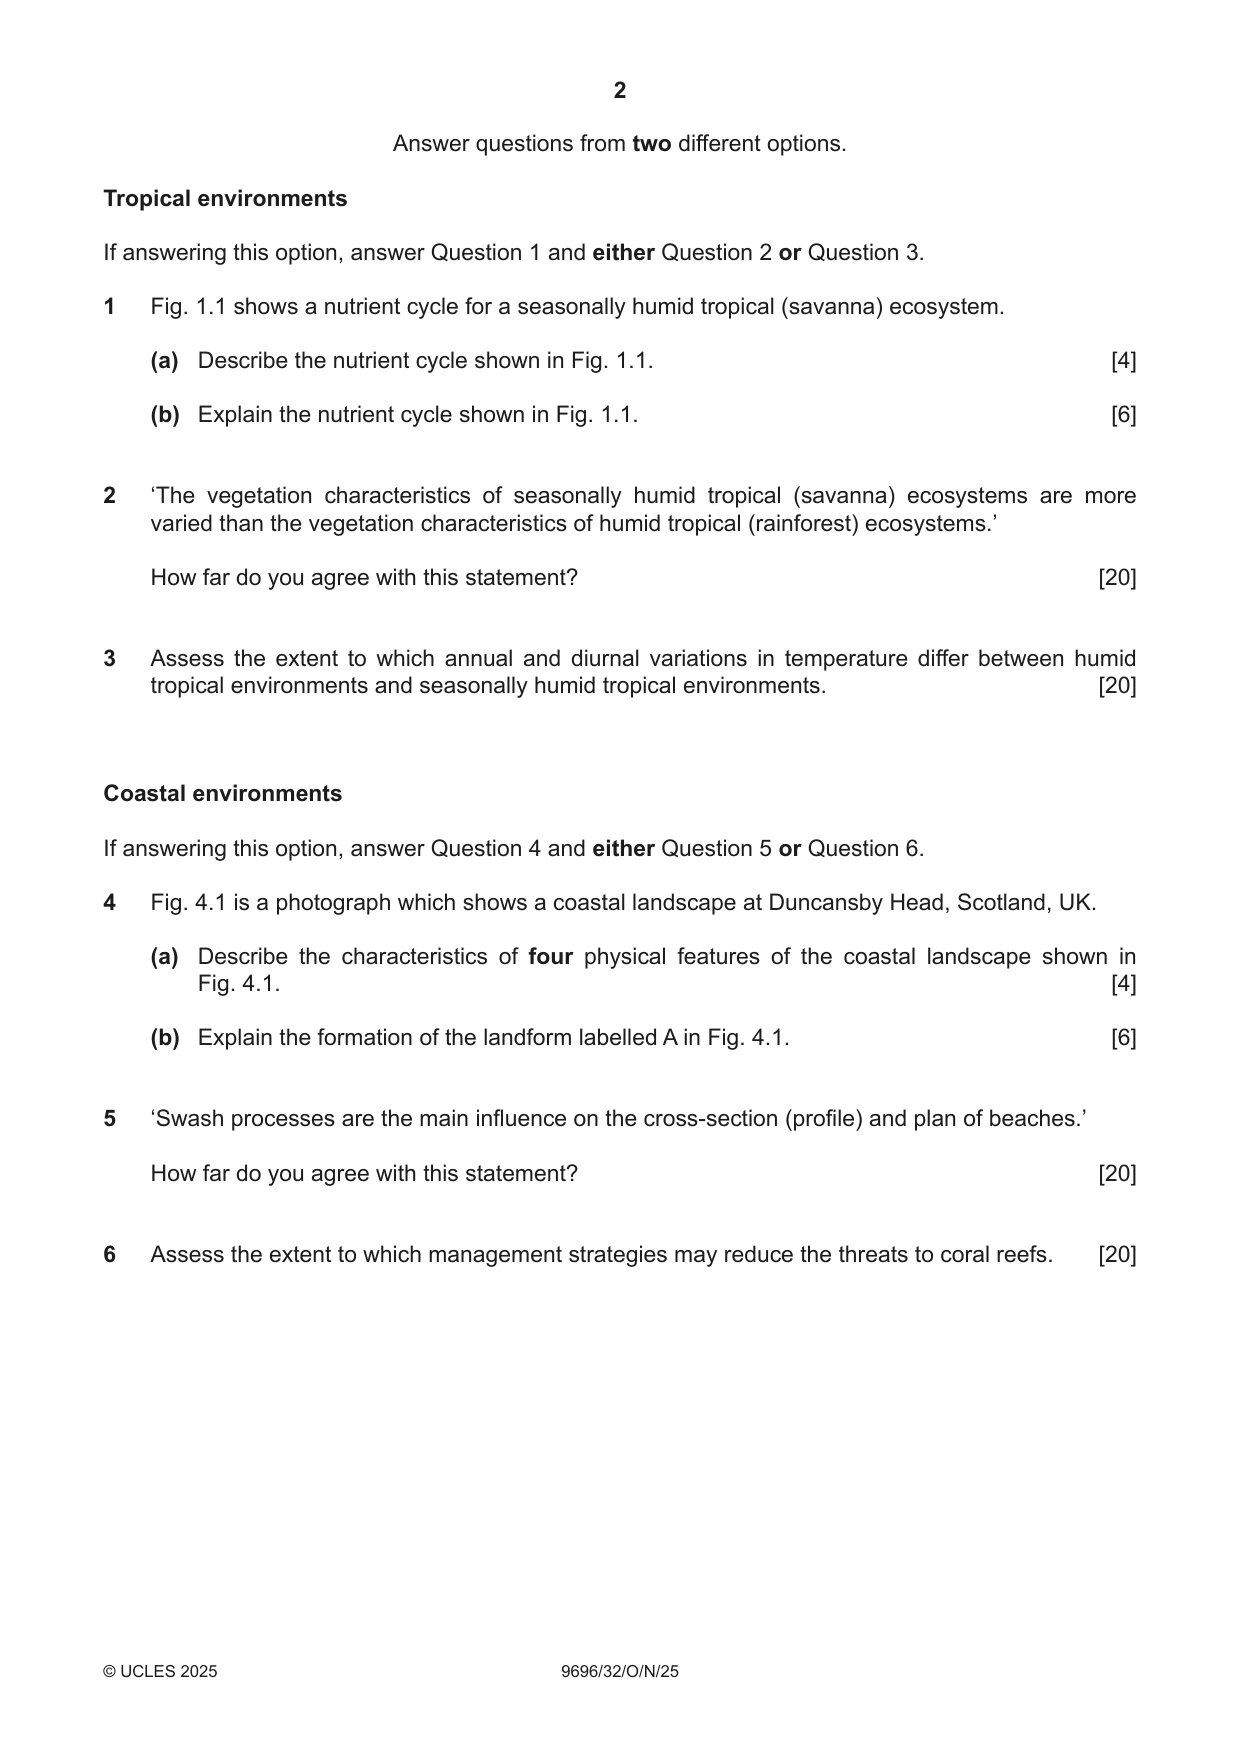
Question paper4 pages

Mark scheme27 pages
Answers below. Sit the paper first if you are practising.














Questions as text
Q1 · A nutrient cycle for a seasonally humid tropical (savanna) ecosystem
1 Fig. 1.1 shows a nutrient cycle for a seasonally humid tropical (savanna) ecosystem. (a) Describe the nutrient cycle shown in Fig. 1.1. [4] (b) Explain the nutrient cycle shown in Fig. 1.1. [6]
Mark scheme: Question Answer Marks 1(a) Fig. 1.1 shows a nutrient cycle for a seasonally humid tropical (savanna) 4 ecosystem. Describe the nutrient cycle shown in Fig. 1.1. The main points are: • Biomass and soil are the largest stores/equal • Litter is the smallest store • Flows of nutrients between soil and biomass, biomass to litter, litter to soil are equal/and the largest • Weathering is a slightly bigger input than precipitation • Leaching from soil store is smallest movement of nutrients • Runoff output is greater than leaching output • Inputs (weathering and precipitation) roughly balance outputs (runoff and leaching) • Biomass has one input and output the others have two 1 mark for each descriptive point. 1(b) Explain the nutrient cycle shown in Fig. 1.1. 6 The following points, illustrating the relationship between climates, soils and vegetation could be part of the explanation. The main part of the explanation will refer to the seasonality of rainfall and the periods when vegetation growth is limited. Explanation could include: • The store of nutrients is low because of the short growing season with a relatively low rainfall • The soil store contains a lot of nutrients because the grasses die down at the start of the dry season and the trees lose their leaves, so decay then transfers nutrients into the soil • The litter store is low because of fire and possibly human action • There is limited weathering of bedrock and few nutrients provided to the soil. The weathered material is naturally low in nutrients • There is a variable soil cover and therefore more potential runoff removing nutrients from the surface soil layer in the rainy season • Human activity e.g. deforestation and agriculture cause a loss of nutrients from the soil with possibly soil erosion • The input from precipitation is relatively low because rainfall amounts are quite low (500–1000 mm p.a.) and rain only falls for half of the year • Leaching is small because of low rainfall and high evaporation rates in the dry season, drawing water back up to the ground surface Award marks based on the quality of explanation and breadth of the response using the marking levels below. Maximum Level 2 if no reference to savanna conditions. Level 3 (5–6) Response clearly explains the nutrient cycle shown in Fig. 1.1 with reference to savanna characteristics. Response is well founded in detailed knowledge and strong conceptual understanding of the topic. Examples used are appropriate and integrated effectively into the response. Level 2 (3–4) Response explains the nutrient cycle shown in Fig. 1.1. Response develops on a largely secure base of knowledge and understanding. Examples may lack detail or development. Level 1 (1–2) Response explains the nutrient cycle shown in Fig. 1.1. Knowledge is basic and understanding may be inaccurate. Examples are in name only or lacking entirely. Level 0 (0) No creditable response.
Q2 · ‘The vegetation characteristics of seasonally humid tropical (savanna) ecosystems are…
2 ‘The vegetation characteristics of seasonally humid tropical (savanna) ecosystems are more varied than the vegetation characteristics of humid tropical (rainforest) ecosystems.’ How far do you agree with this statement? [20]
Mark scheme: 2 ‘The vegetation characteristics of seasonally humid tropical (savanna) 20 ecosystems are more varied than the vegetation characteristics of humid tropical (rainforest) ecosystems.’ How far do you agree with this statement? Candidates are likely to argue that humid tropical (rainforest) ecosystem vegetation is more diverse. However, it could be argued that the vegetation of seasonally humid tropical (savanna) ecosystems is the more varied of the two ecosystems due to variation across latitude, with changes in rainfall and length of the wet season. The question is about vegetation characteristics rather than plant communities. Candidates may discuss some of the following vegetation characteristics: • Species type • Adaptations • Density • Diversity • Height • Structure Savanna vegetation is a mosaic involving grasses, trees and shrubs. As a result of decreasing rainfall amounts from the border of the tropical rainforest ecosystem there is a gradation in vegetation from savanna woodland (with trees and shrubs forming a light canopy), through tree savanna, shrub savanna to grass savanna. Characteristics are related to the length of the dry season and the need to adapt to varying periods of drought. The humid tropical rainforest ecosystem is probably the most diverse of any ecosystem because of high temperatures and year-round rainfall producing great biodiversity. However, the vegetation might be thought to be relatively consistent. The trees are tall and fast growing and there are three main vegetation types: emergents, a closed tree canopy layer and a limited understory because of a lack of sunlight. This structure occurs relatively consistently in the tropical rainforest ecosystem. The only significant variation occurs along watercourses and with altitude. Candidates may conclude that it depends on scale: over a wide area the savanna is more varied, but on a smaller scale species diversity of the rainforest makes it the more varied ecosystem. Award marks based on the quality of the response using the marking levels below. Level 4 (16–20) Response thoroughly discusses the extent to which the vegetation characteristics of seasonally humid tropical (savanna) ecosystems are more varied than the vegetation characteristics of humid tropical (rainforest) ecosystems. An effective and sustained evaluation with a sound conclusion. Response is well founded in detailed exemplar knowledge and strong conceptual understanding of the topic. Examples used are appropriate and integrated effectively into the response. 2 Level 3 (11–15) Response discusses the extent to which the vegetation characteristics of seasonally humid tropical (savanna) ecosystems are more varied than the vegetation characteristics of humid tropical (rainforest) ecosystems. Response is broadly evaluative in character, comprising some explanatory or narrative content and a conclusion. Response develops on a largely secure base of knowledge and understanding with the use of example(s). Level 2 (6–10) Response demonstrates some knowledge and understanding of the extent to which the vegetation characteristics of seasonally humid tropical (savanna) ecosystems are more varied than the vegetation characteristics of humid tropical (rainforest) ecosystems. Response is mainly descriptive or explanatory in approach and contains a brief or thinly supported evaluation. Responses without the use of example(s) to support the response will not get above the middle of Level 2 (8 marks). Level 1 (1–5) Response makes a few general points about the vegetation characteristics of the two ecosystems. A descriptive response comprising a few simple points. Knowledge is basic and understanding may be poor and lack relevance to the question set. Level 0 (0) No creditable response.
Q3 · Assess the extent to which annual and diurnal variations in temperature differ between…
3 Assess the extent to which annual and diurnal variations in temperature differ between humid tropical environments and seasonally humid tropical environments. [20] Coastal environments If answering this option, answer Question 4 and either Question 5 or Question 6.
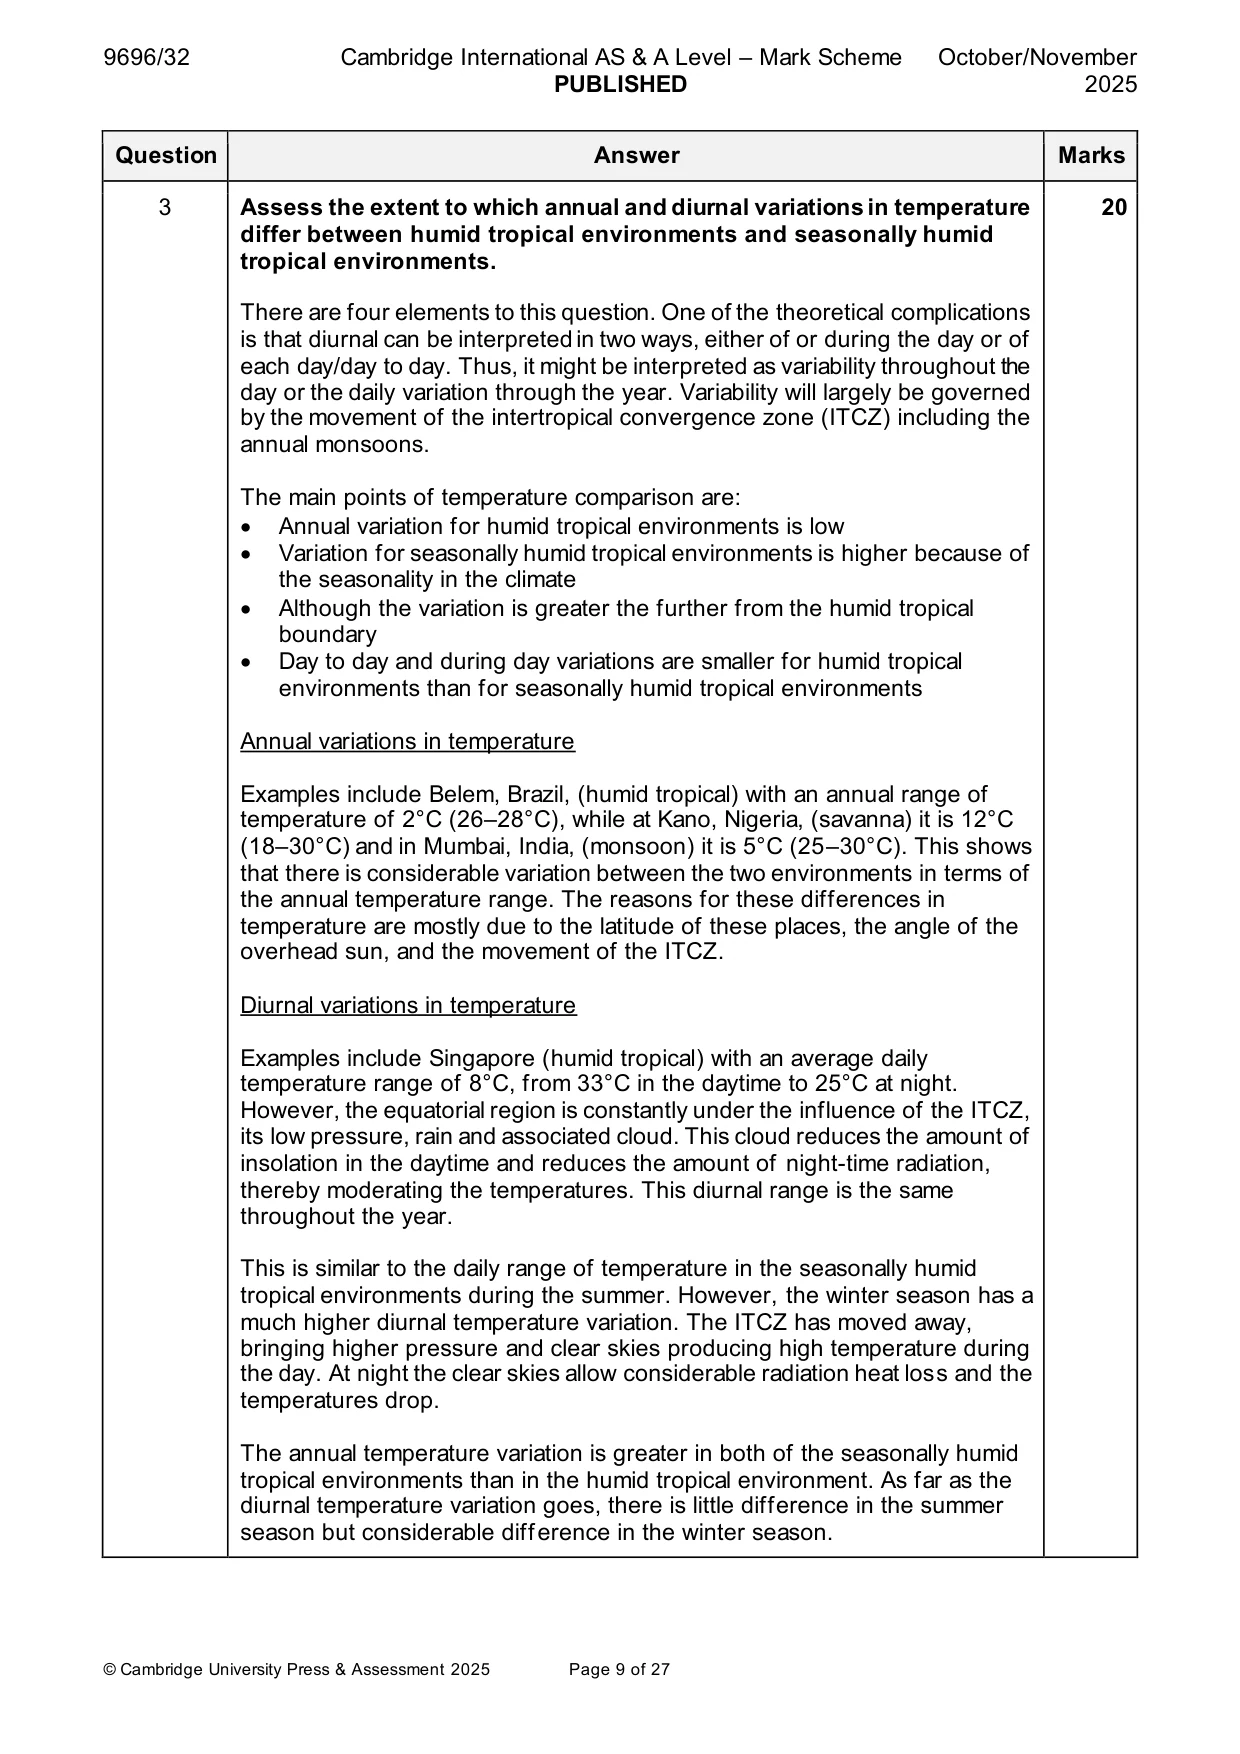
Mark scheme: 3 Assess the extent to which annual and diurnal variations in temperature 20 differ between humid tropical environments and seasonally humid tropical environments. There are four elements to this question. One of the theoretical complications is that diurnal can be interpreted in two ways, either of or during the day or of each day/day to day. Thus, it might be interpreted as variability throughout the day or the daily variation through the year. Variability will largely be governed by the movement of the intertropical convergence zone (ITCZ) including the annual monsoons. The main points of temperature comparison are: • Annual variation for humid tropical environments is low • Variation for seasonally humid tropical environments is higher because of the seasonality in the climate • Although the variation is greater the further from the humid tropical boundary • Day to day and during day variations are smaller for humid tropical environments than for seasonally humid tropical environments Annual variations in temperature Examples include Belem, Brazil, (humid tropical) with an annual range of temperature of 2°C (26–28°C), while at Kano, Nigeria, (savanna) it is 12°C (18–30°C) and in Mumbai, India, (monsoon) it is 5°C (25–30°C). This shows that there is considerable variation between the two environments in terms of the annual temperature range. The reasons for these differences in temperature are mostly due to the latitude of these places, the angle of the overhead sun, and the movement of the ITCZ. Diurnal variations in temperature Examples include Singapore (humid tropical) with an average daily temperature range of 8°C, from 33°C in the daytime to 25°C at night. However, the equatorial region is constantly under the influence of the ITCZ, its low pressure, rain and associated cloud. This cloud reduces the amount of insolation in the daytime and reduces the amount of night-time radiation, thereby moderating the temperatures. This diurnal range is the same throughout the year. This is similar to the daily range of temperature in the seasonally humid tropical environments during the summer. However, the winter season has a much higher diurnal temperature variation. The ITCZ has moved away, bringing higher pressure and clear skies producing high temperature during the day. At night the clear skies allow considerable radiation heat loss and the temperatures drop. The annual temperature variation is greater in both of the seasonally humid tropical environments than in the humid tropical environment. As far as the diurnal temperature variation goes, there is little difference in the summer season but considerable difference in the winter season. 3 Award marks based on the quality of the response using the marking levels below. Level 4 (16–20) Response thoroughly discusses the extent to which annual and diurnal variations in temperature differ between humid tropical environments and seasonally humid tropical environments. An effective and sustained evaluation with a sound conclusion. Response is well founded in detailed exemplar knowledge and strong conceptual understanding of the topic. Examples used are appropriate and integrated effectively into the response. Level 3 (11–15) Response discusses the extent to which annual and diurnal variations in temperature differ between humid tropical environments and seasonally humid tropical environments. Response is broadly evaluative in character, comprising some explanatory or narrative content and a conclusion. Response develops on a largely secure base of knowledge and understanding with the use of example(s). Level 2 (6–10) Response demonstrates some knowledge and understanding of the extent to which annual and diurnal variations in temperature differ between humid tropical environments and seasonally humid tropical environments. Response is mainly descriptive or explanatory in approach and contains a brief or thinly supported evaluation. Responses without the use of example(s) to support the response will not get above the middle of Level 2 (8 marks). Level 1 (1–5) Response makes a few general points about how annual and diurnal variations in temperature differ between the two environments. A descriptive response comprising a few simple points. Knowledge is basic and understanding may be poor and lack relevance to the question set. Level 0 (0) No creditable response. Coastal environments If answering this option, answer Question 4 and either Question 5 or Question 6.
Q4 · A photograph which shows a coastal landscape at Duncansby Head, Scotland, UK
4 Fig. 4.1 is a photograph which shows a coastal landscape at Duncansby Head, Scotland, UK. (a) Describe the characteristics of four physical features of the coastal landscape shown in Fig. 4.1. [4] (b) Explain the formation of the landform labelled A in Fig. 4.1. [6]
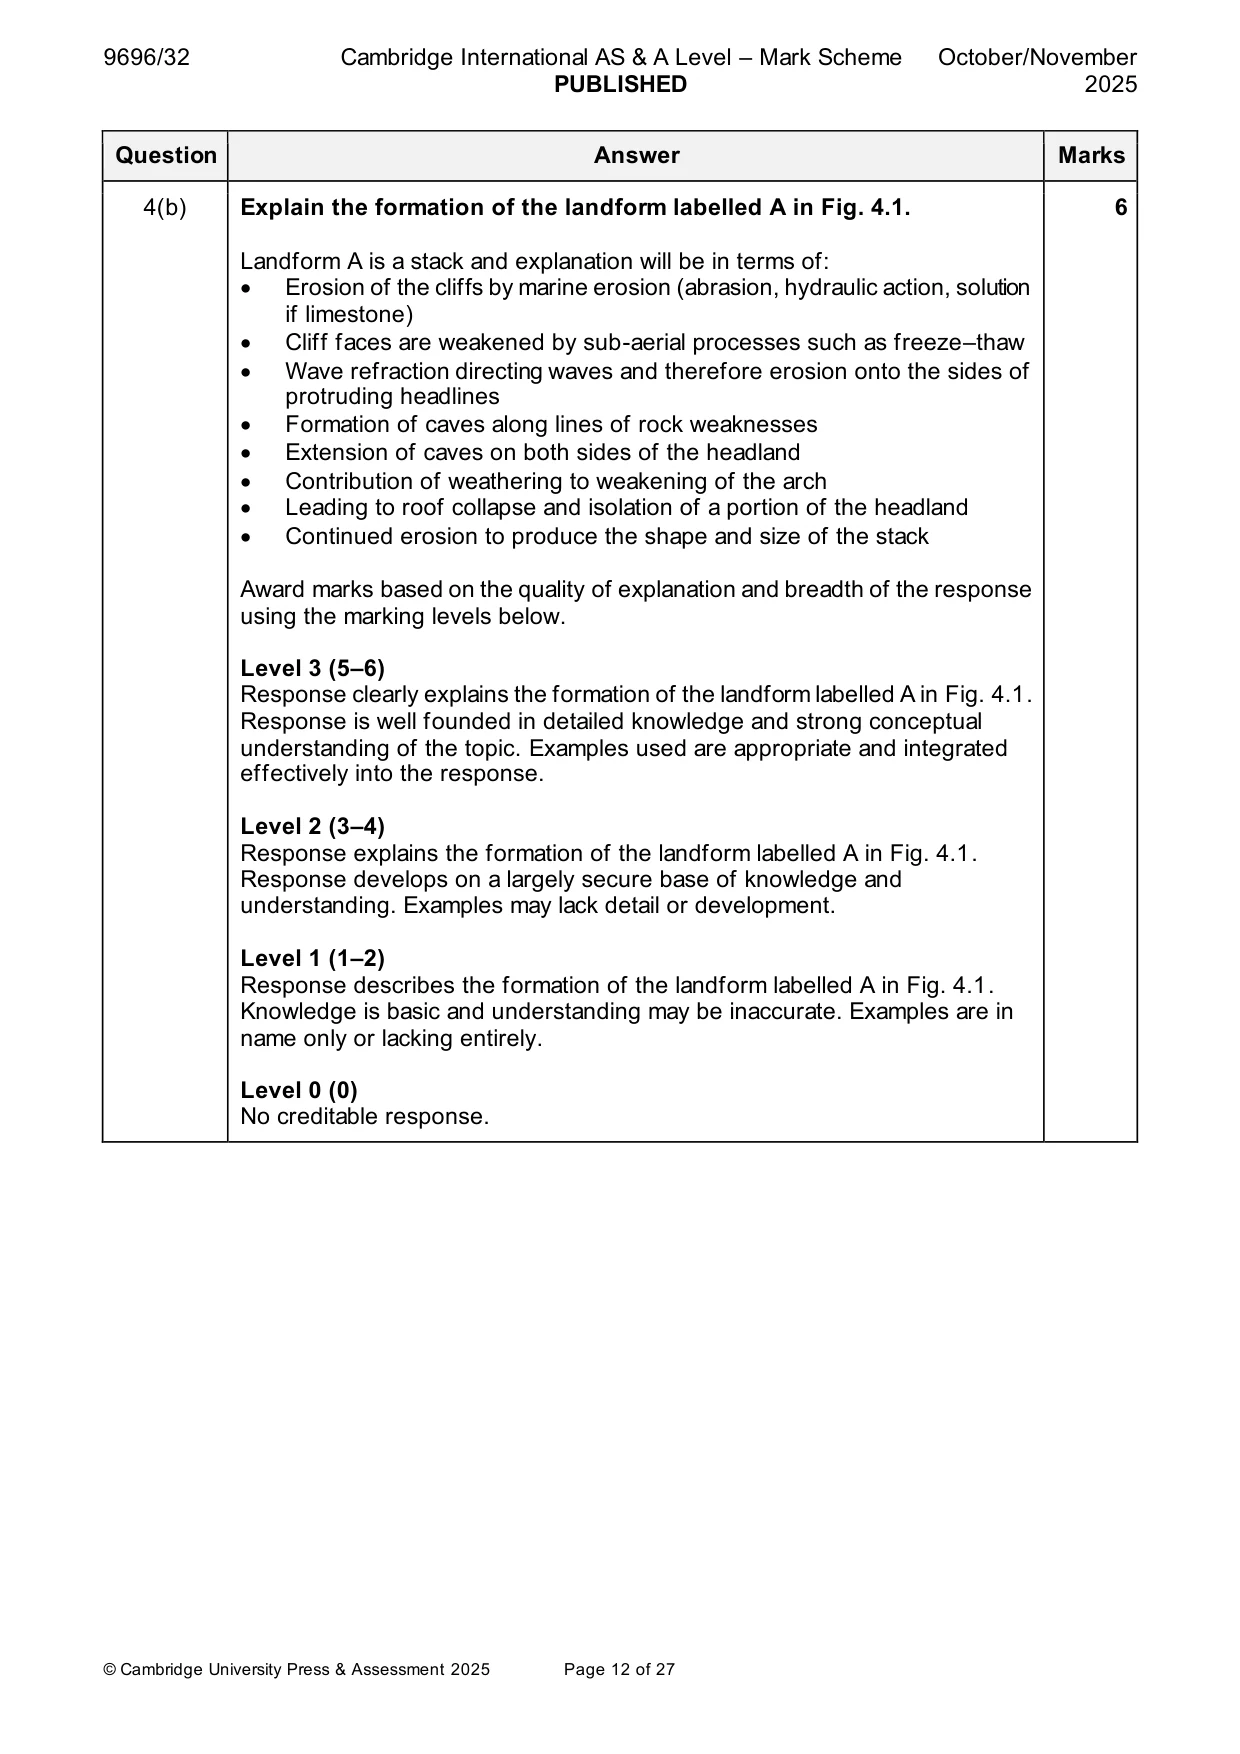
Mark scheme: 4(a) Fig. 4.1 is a photograph which shows a coastal landscape at Duncansby 4 Head, Scotland, UK. Describe the characteristics of four physical features of the coastal landscape shown in Fig. 4.1. The main characteristics of the physical features include: • Flat topped surface to the land • Irregular coastline e.g. bays/coves • Headlands with appropriate description • Stacks (isolated pinnacles) of different sizes and shapes/detached from the headlands • Steep cliffs/bare rock • Some cliffs are vegetated • Cliffs show rock structure • Bevelled/sloping cliffs • Evidence of mass movement on the cliffs • Wave-cut (shore) platforms consisting of flat/bedded/rugged rocks • Some small rocky islands • Rocky beach The emphasis must be on description. No marks for simply an identification. 1 mark for each descriptive point. 4(b) Explain the formation of the landform labelled A in Fig. 4.1. 6 Landform A is a stack and explanation will be in terms of: • Erosion of the cliffs by marine erosion (abrasion, hydraulic action, solution if limestone) • Cliff faces are weakened by sub-aerial processes such as freeze–thaw • Wave refraction directing waves and therefore erosion onto the sides of protruding headlines • Formation of caves along lines of rock weaknesses • Extension of caves on both sides of the headland • Contribution of weathering to weakening of the arch • Leading to roof collapse and isolation of a portion of the headland • Continued erosion to produce the shape and size of the stack Award marks based on the quality of explanation and breadth of the response using the marking levels below. Level 3 (5–6) Response clearly explains the formation of the landform labelled A in Fig. 4.1. Response is well founded in detailed knowledge and strong conceptual understanding of the topic. Examples used are appropriate and integrated effectively into the response. Level 2 (3–4) Response explains the formation of the landform labelled A in Fig. 4.1. Response develops on a largely secure base of knowledge and understanding. Examples may lack detail or development. Level 1 (1–2) Response describes the formation of the landform labelled A in Fig. 4.1. Knowledge is basic and understanding may be inaccurate. Examples are in name only or lacking entirely. Level 0 (0) No creditable response.
Q5 · ‘Swash processes are the main influence on the cross-section (profile) and plan of…
5 ‘Swash processes are the main influence on the cross-section (profile) and plan of beaches.’ How far do you agree with this statement? [20]
Mark scheme: 5 ‘Swash processes are the main influence on the cross-section (profile) 20 and plan of beaches.’ How far do you agree with this statement? The cross-section (profile) of beaches is the result of the interaction of swash processes and backwash processes. Steep beaches occur where the swash processes bringing material onto the beach are stronger than the backwash processes removing material. Gentle beaches occur where backwash processes are greater than swash processes. However, the profile is also the result of the nature of the beach material being moved. Pebble beaches tend to be steeper than sand beaches. The plan form of beaches is largely conditioned by longshore drift where swash and backwash processes combine to move material along the beach. Other influences might include: • Wave refraction • Characteristics of the waves • Characteristics of beach material • Wind processes • Shape of the coastline • Human activity e.g. hard engineering (groynes), soft engineering (beach nourishment) • Seasonal variations – destructive waves may be more common in winter Possible conclusion that swash influences beach profiles where constructive waves are dominant and where part of longshore drift. However, backwash affects other situations. Wind is possibly the main influence as it forms the waves. Award marks based on the quality of the response using the marking levels below. Level 4 (16–20) Response thoroughly discusses the extent to which swash processes are the main influence on the cross-section (profile) and plan of beaches. An effective and sustained evaluation with a sound conclusion. Response is well founded in detailed exemplar knowledge and strong conceptual understanding of the topic. Examples used are appropriate and integrated effectively into the response. Level 3 (11–15) Response discusses the extent to which swash processes are the main influence on the cross-section (profile) and plan of beaches. Response is broadly evaluative in character, comprising some explanatory or narrative content and a conclusion. Response develops on a largely secure base of knowledge and understanding with the use of example(s). 5 Level 2 (6–10) Response demonstrates some knowledge and understanding of the extent to which swash processes are the main influence on the cross-section (profile) and plan of beaches. Response is mainly descriptive or explanatory in approach and contains a brief or thinly supported evaluation. Responses without the use of example(s) to support the response will not get above the middle of Level 2 (8 marks). Level 1 (1–5) Response makes a few general points about how swash processes may influence the cross-section (profile) or the plan form of beaches. A descriptive response comprising a few simple points. Knowledge is basic and understanding may be poor and lack relevance to the question set. Level 0 (0) No creditable response.
Q6 · Hazardous environments If answering this option, answer Question 7 and either Question 8…
Hazardous environments If answering this option, answer Question 7 and either Question 8 or Question 9.
Mark scheme: 6 Assess the extent to which management strategies may reduce the 20 threats to coral reefs. The main threats to coral reefs are: • Warming sea temperatures • Acidification • Rising sea level • Pollution • Physical damage, storms blasting, anchors, etc. • Fishing • Sedimentation • Tourism activities and coastal development Management strategies will be devised to mitigate whichever of these threats are prevalent. Most management strategies attempt to manage local, human induced damage to the corals. The worldwide threats need global cooperation e.g. for climate change. One example of this form of management is on the St Lucia coast, at Soufrière. This is summarised below. Several marine protected areas have been established by law. These include the Pointe Sable Environment Protection Area (PSEPA) in the south of St Lucia and the Soufrière Marine Management Area (SMMA) in the west of the island. In the SMMA, marine spatial planning is used to determine where activities such as fishing or recreational diving can take place. Marine areas are divided into zones such as yachting areas, fishing priority areas, recreational areas and marine reserves. Marine reserves have been established to protect certain areas where coral reefs exist. No fishing is allowed in these reserves. However, recreational diving may be allowed. There are other examples of a similar nature that might be used to answer the question but they tend to be relatively similar. Blast-fishing is often outlawed but still happens as sustainable fishing techniques (e.g. line fishing) reduce supply and maritime areas are difficult to police. Phosphate runoff is a small-scale threat but treated sewage discharge from hotels is still a problem. Evaluation may consider the time needed and/or scale of management schemes required e.g. in 2011 it was estimated that 10% of the world’s coral reefs had been damaged beyond repair and 75% of the remaining reefs were under threat. The fact that this has become worse since then suggests that most of the strategies to reduce the threats to coral reefs are ineffective. Human-induced climate change is the biggest threat and this is unlikely to be managed effectively. Threats from tourism have been managed more successfully but these management schemes are relatively small-scale, so their impact is limited. 6 Award marks based on the quality of the response using the marking levels below. Level 4 (16–20) Response thoroughly discusses the extent to which management strategies may reduce the threats to coral reefs. An effective and sustained evaluation with a sound conclusion. Response is well founded in detailed exemplar knowledge and strong conceptual understanding of the topic. Examples used are appropriate and integrated effectively into the response. Level 3 (11–15) Response discusses the extent to which management strategies may reduce the threats to coral reefs. Response is broadly evaluative in character, comprising some explanatory or narrative content and a conclusion. Response develops on a largely secure base of knowledge and understanding with the use of example(s). Level 2 (6–10) Response demonstrates some knowledge and understanding of the extent to which management strategies may reduce the threats to coral reefs. Response is mainly descriptive or explanatory in approach and contains a brief or thinly supported evaluation. Responses without the use of example(s) to support the response will not get above the middle of Level 2 (8 marks). Level 1 (1–5) Response makes a few general points about how management strategies may reduce the threats to coral reefs. A descriptive response comprising a few simple points. Knowledge is basic and understanding may be poor and lack relevance to the question set. Level 0 (0) No creditable response. Hazardous environments If answering this option, answer Question 7 and either Question 8 or Question 9.
Q7 · The total duration of earth tremors at Popocatépetl volcano, Mexico, August–December 2021
7 Fig. 7.1 shows the total duration of earth tremors at Popocatépetl volcano, Mexico, August–December 2021. (a) Describe the pattern of earth tremors shown in Fig. 7.1. [4] (b) Explain two ways volcanic eruptions may be predicted. [6]
Mark scheme: 7(a) Fig. 7.1 shows the total duration of earth tremors at Popocatépetl 4 volcano, Mexico, August–December 2021. Describe the pattern of earth tremors shown in Fig. 7.1. The main points are: • There is a highly variable/fluctuating pattern • Identifying highest/lowest • There is an overall declining trend in maximum numbers and duration from August to December • There is a large drop after the peak in mid-September • A gentler drop with fluctuations from the end of September to December • There are two major peaks: in the middle of August and September separated by a brief period of few durations of tremors • The August peak of tremors (1200 mins/day) is greater than the September peak (1000 mins/day) • There are smaller durations of tremors from 1 October onwards but with some minor peaks in October and November • Only very small durations of tremors in early December • No tremors throughout most of December 1 mark for each descriptive point. Reserve 1 mark for use of data. 7(b) Explain two ways volcanic eruptions may be predicted. 6 There are many ways that volcanic eruptions may be predicted. The main ones are: • Monitoring emanations of gases from the volcano especially sulfur dioxide • Bulging of the flanks of the volcanoes – use of remote sensing, volcanic dome may be observed in satellite imaging • Increase in temperature of groundwater and water emanating from springs – geochemical change, samples and remote spectroscopy • Changes in magnetic susceptibility • Detection of tremors/earthquakes related to the volcano • Remote sensing satellites/infra-red thermal imaging can identify surface temperature changes Award marks based on the quality of explanation and breadth of the response using the marking levels below. Level 3 (5–6) Response clearly explains two ways volcanic eruptions may be predicted. Response is well founded in detailed knowledge and strong conceptual understanding of the topic. Examples used are appropriate and integrated effectively into the response. Level 2 (3–4) Response explains two ways or clearly explains one way volcanic eruptions may be predicted. Response develops on a largely secure base of knowledge and understanding. Examples may lack detail or development. Level 1 (1–2) Response explains one or two ways volcanic eruptions may be predicted. Knowledge is basic and understanding may be inaccurate. Examples are in name only or lacking entirely. Level 0 (0) No creditable response.
Q8 · ‘Tsunamis are the greatest hazard associated with earthquakes.’ How far do you agree with…
8 ‘Tsunamis are the greatest hazard associated with earthquakes.’ How far do you agree with this statement? [20]
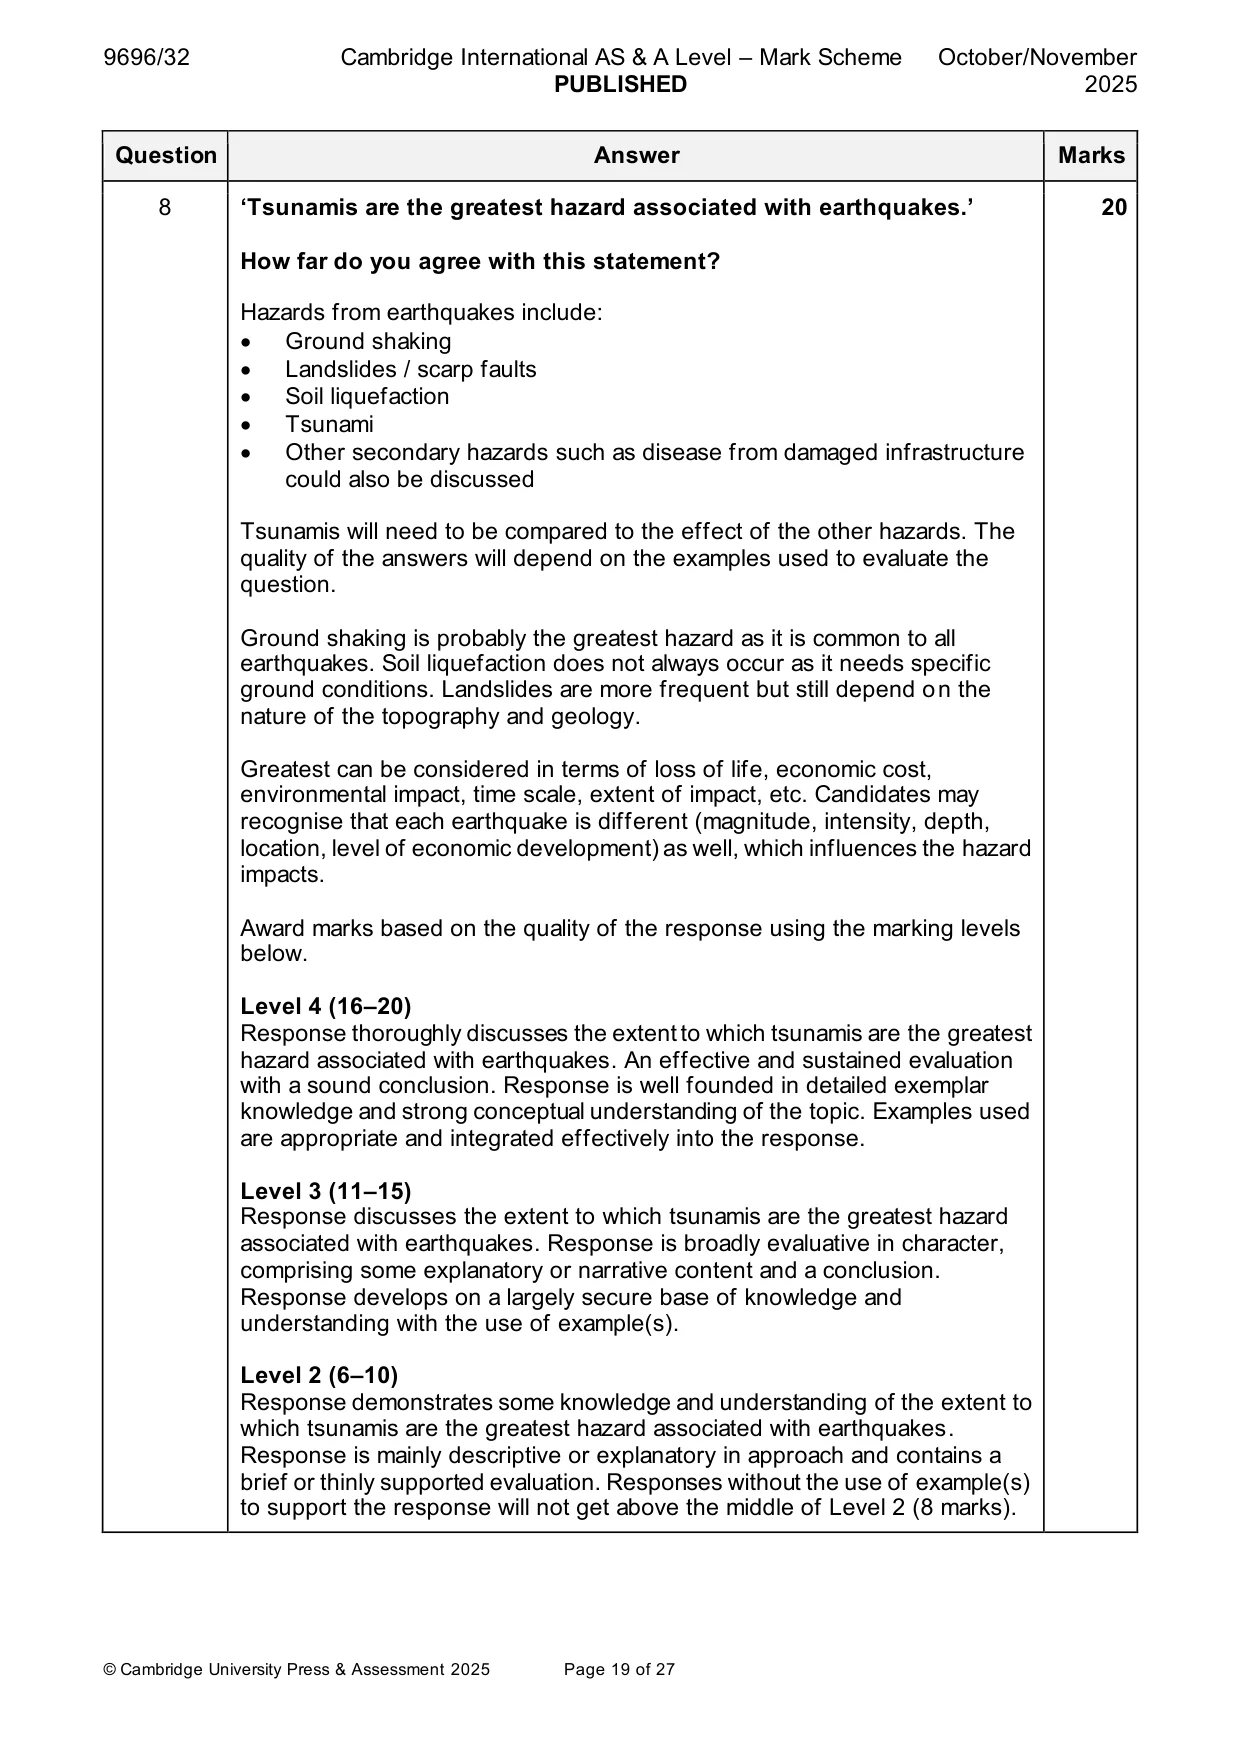
Mark scheme: 8 ‘Tsunamis are the greatest hazard associated with earthquakes.’ 20 How far do you agree with this statement? Hazards from earthquakes include: • Ground shaking • Landslides / scarp faults • Soil liquefaction • Tsunami • Other secondary hazards such as disease from damaged infrastructure could also be discussed Tsunamis will need to be compared to the effect of the other hazards. The quality of the answers will depend on the examples used to evaluate the question. Ground shaking is probably the greatest hazard as it is common to all earthquakes. Soil liquefaction does not always occur as it needs specific ground conditions. Landslides are more frequent but still depend on the nature of the topography and geology. Greatest can be considered in terms of loss of life, economic cost, environmental impact, time scale, extent of impact, etc. Candidates may recognise that each earthquake is different (magnitude, intensity, depth, location, level of economic development) as well, which influences the hazard impacts. Award marks based on the quality of the response using the marking levels below. Level 4 (16–20) Response thoroughly discusses the extent to which tsunamis are the greatest hazard associated with earthquakes. An effective and sustained evaluation with a sound conclusion. Response is well founded in detailed exemplar knowledge and strong conceptual understanding of the topic. Examples used are appropriate and integrated effectively into the response. Level 3 (11–15) Response discusses the extent to which tsunamis are the greatest hazard associated with earthquakes. Response is broadly evaluative in character, comprising some explanatory or narrative content and a conclusion. Response develops on a largely secure base of knowledge and understanding with the use of example(s). Level 2 (6–10) Response demonstrates some knowledge and understanding of the extent to which tsunamis are the greatest hazard associated with earthquakes. Response is mainly descriptive or explanatory in approach and contains a brief or thinly supported evaluation. Responses without the use of example(s) to support the response will not get above the middle of Level 2 (8 marks). 8 Level 1 (1–5) Response makes a few general points about tsunamis and other hazards associated with earthquakes. A descriptive response comprising a few simple points. Knowledge is basic and understanding may be poor and lack relevance to the question set. Level 0 (0) No creditable response.
Q9 · With reference to a case study of a hazardous environment, evaluate the attempted or…
9 With reference to a case study of a hazardous environment, evaluate the attempted or possible solutions to the problems of sustainable management. [20] Hot arid and semi-arid environments If answering this option, answer Question 10 and either Question 11 or Question 12.
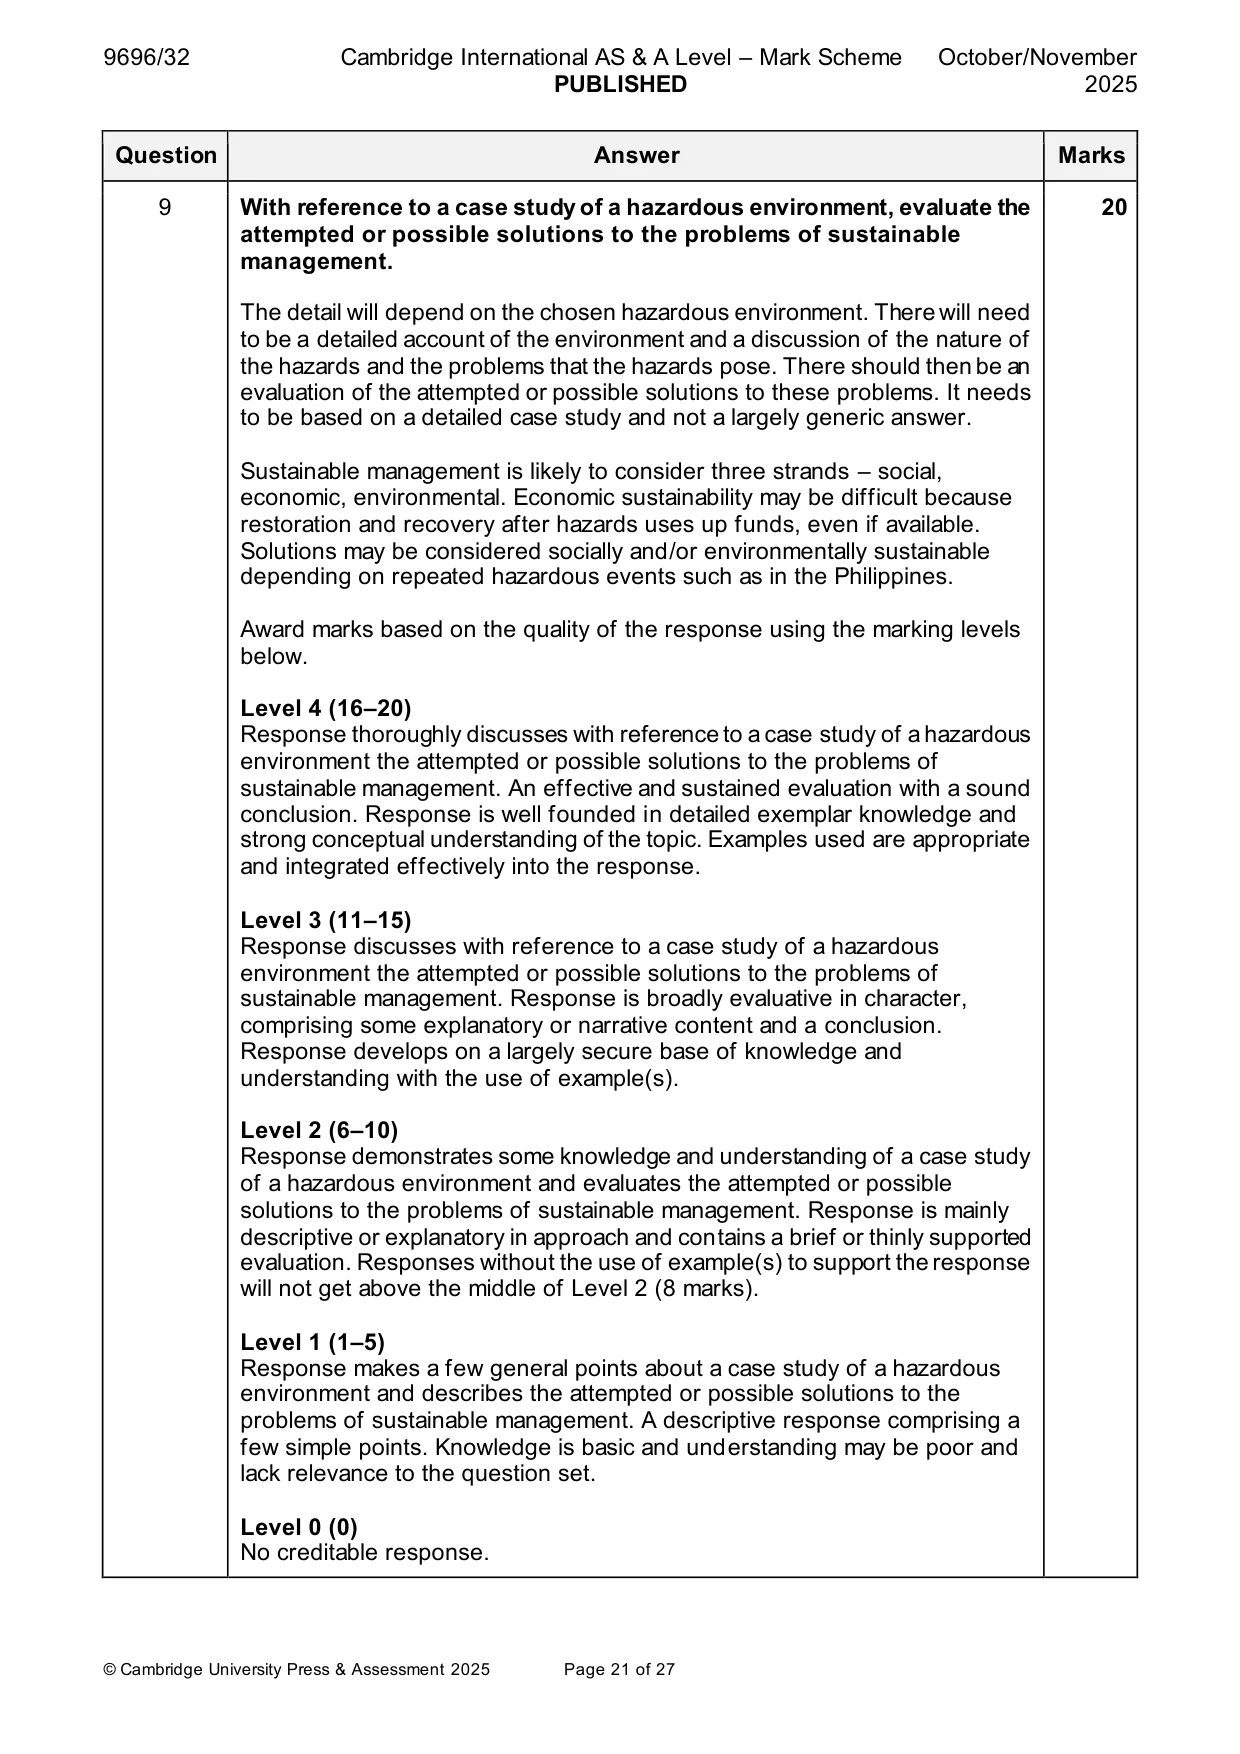
Mark scheme: 9 With reference to a case study of a hazardous environment, evaluate the 20 attempted or possible solutions to the problems of sustainable management. The detail will depend on the chosen hazardous environment. There will need to be a detailed account of the environment and a discussion of the nature of the hazards and the problems that the hazards pose. There should then be an evaluation of the attempted or possible solutions to these problems. It needs to be based on a detailed case study and not a largely generic answer. Sustainable management is likely to consider three strands – social, economic, environmental. Economic sustainability may be difficult because restoration and recovery after hazards uses up funds, even if available. Solutions may be considered socially and/or environmentally sustainable depending on repeated hazardous events such as in the Philippines. Award marks based on the quality of the response using the marking levels below. Level 4 (16–20) Response thoroughly discusses with reference to a case study of a hazardous environment the attempted or possible solutions to the problems of sustainable management. An effective and sustained evaluation with a sound conclusion. Response is well founded in detailed exemplar knowledge and strong conceptual understanding of the topic. Examples used are appropriate and integrated effectively into the response. Level 3 (11–15) Response discusses with reference to a case study of a hazardous environment the attempted or possible solutions to the problems of sustainable management. Response is broadly evaluative in character, comprising some explanatory or narrative content and a conclusion. Response develops on a largely secure base of knowledge and understanding with the use of example(s). Level 2 (6–10) Response demonstrates some knowledge and understanding of a case study of a hazardous environment and evaluates the attempted or possible solutions to the problems of sustainable management. Response is mainly descriptive or explanatory in approach and contains a brief or thinly supported evaluation. Responses without the use of example(s) to support the response will not get above the middle of Level 2 (8 marks). Level 1 (1–5) Response makes a few general points about a case study of a hazardous environment and describes the attempted or possible solutions to the problems of sustainable management. A descriptive response comprising a few simple points. Knowledge is basic and understanding may be poor and lack relevance to the question set. Level 0 (0) No creditable response. Hot arid and semi-arid environments If answering this option, answer Question 10 and either Question 11 or Question 12.
Q10 · Annual precipitation anomalies for the semi-arid region of the Sahel, Africa, 1915–2015
10 Fig. 10.1 shows annual precipitation anomalies for the semi-arid region of the Sahel, Africa, 1915–2015. (a) Describe the pattern of annual precipitation anomalies shown in Fig. 10.1. [4] (b) Explain how a lack of precipitation might lead to desertification. [6]
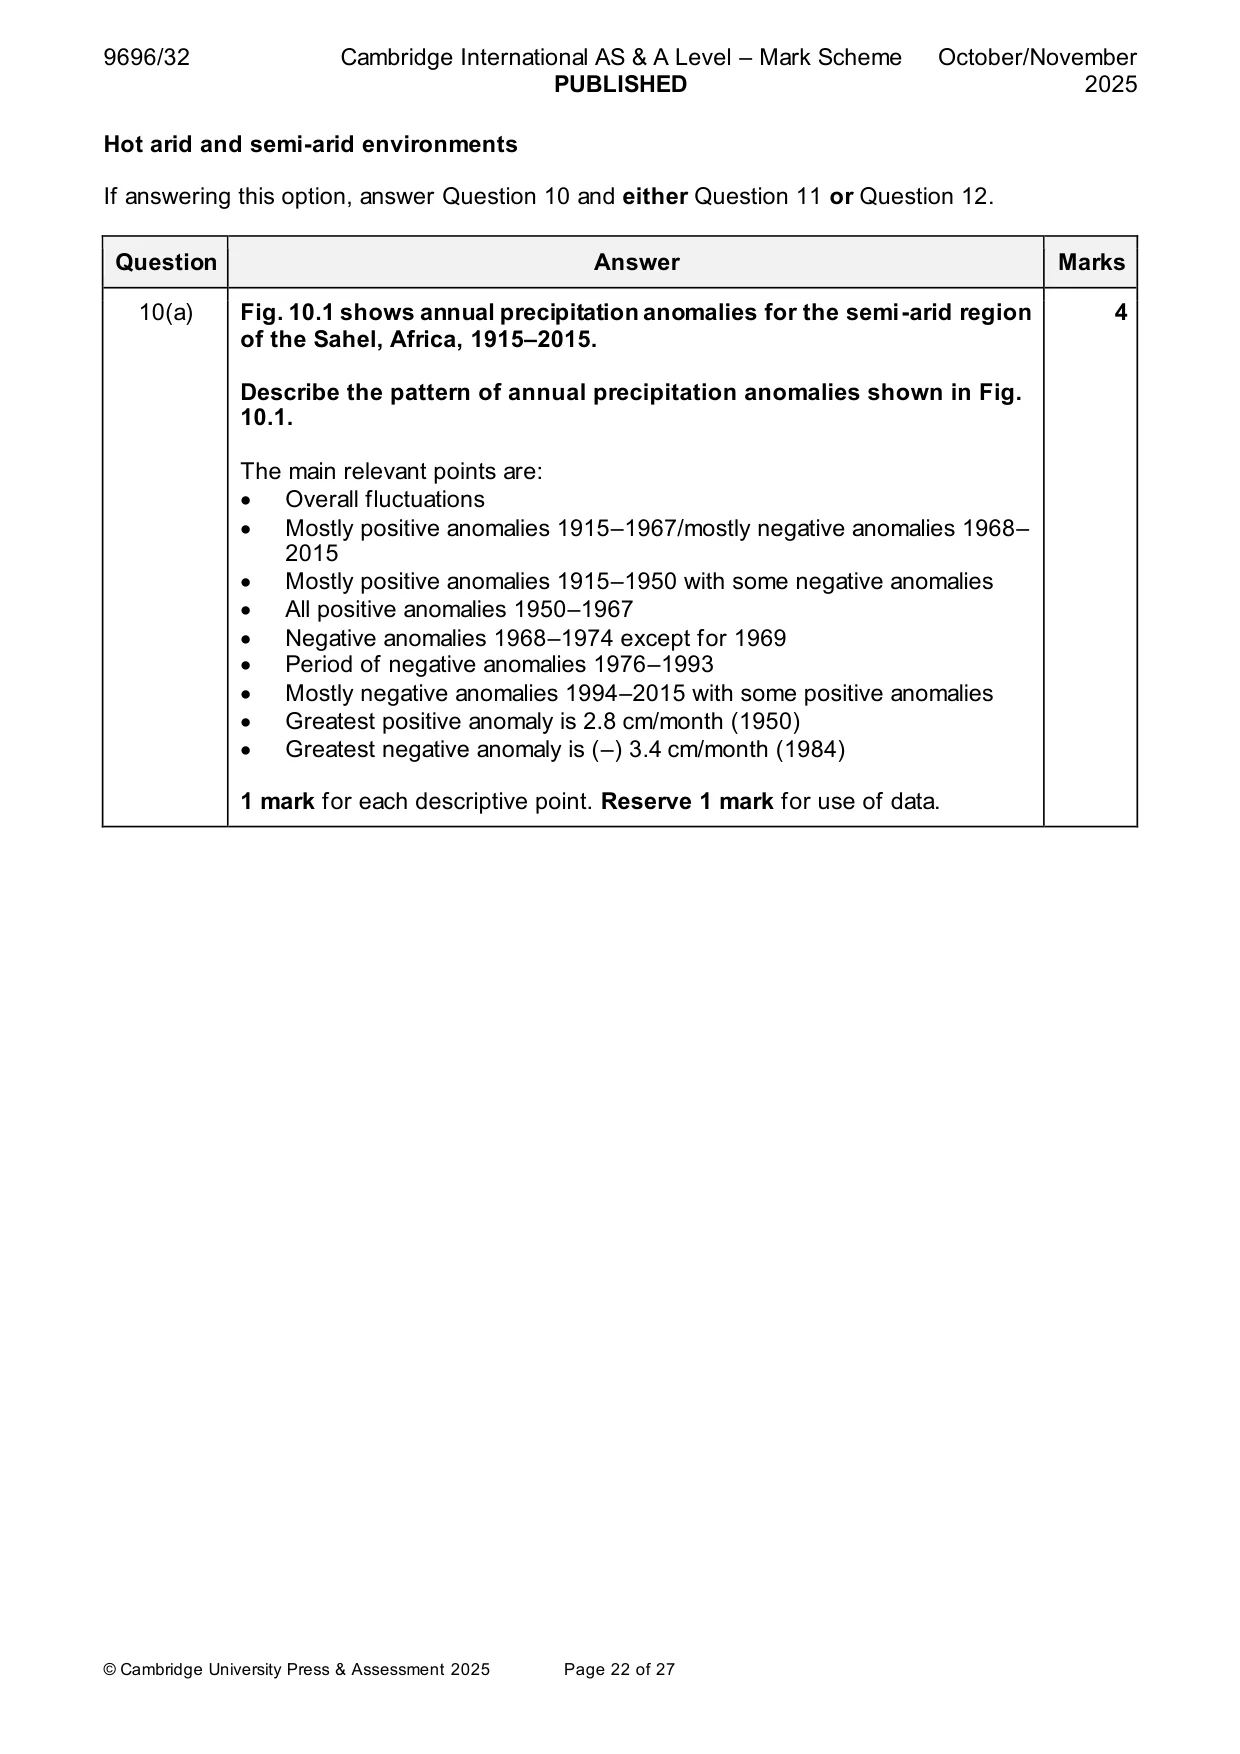
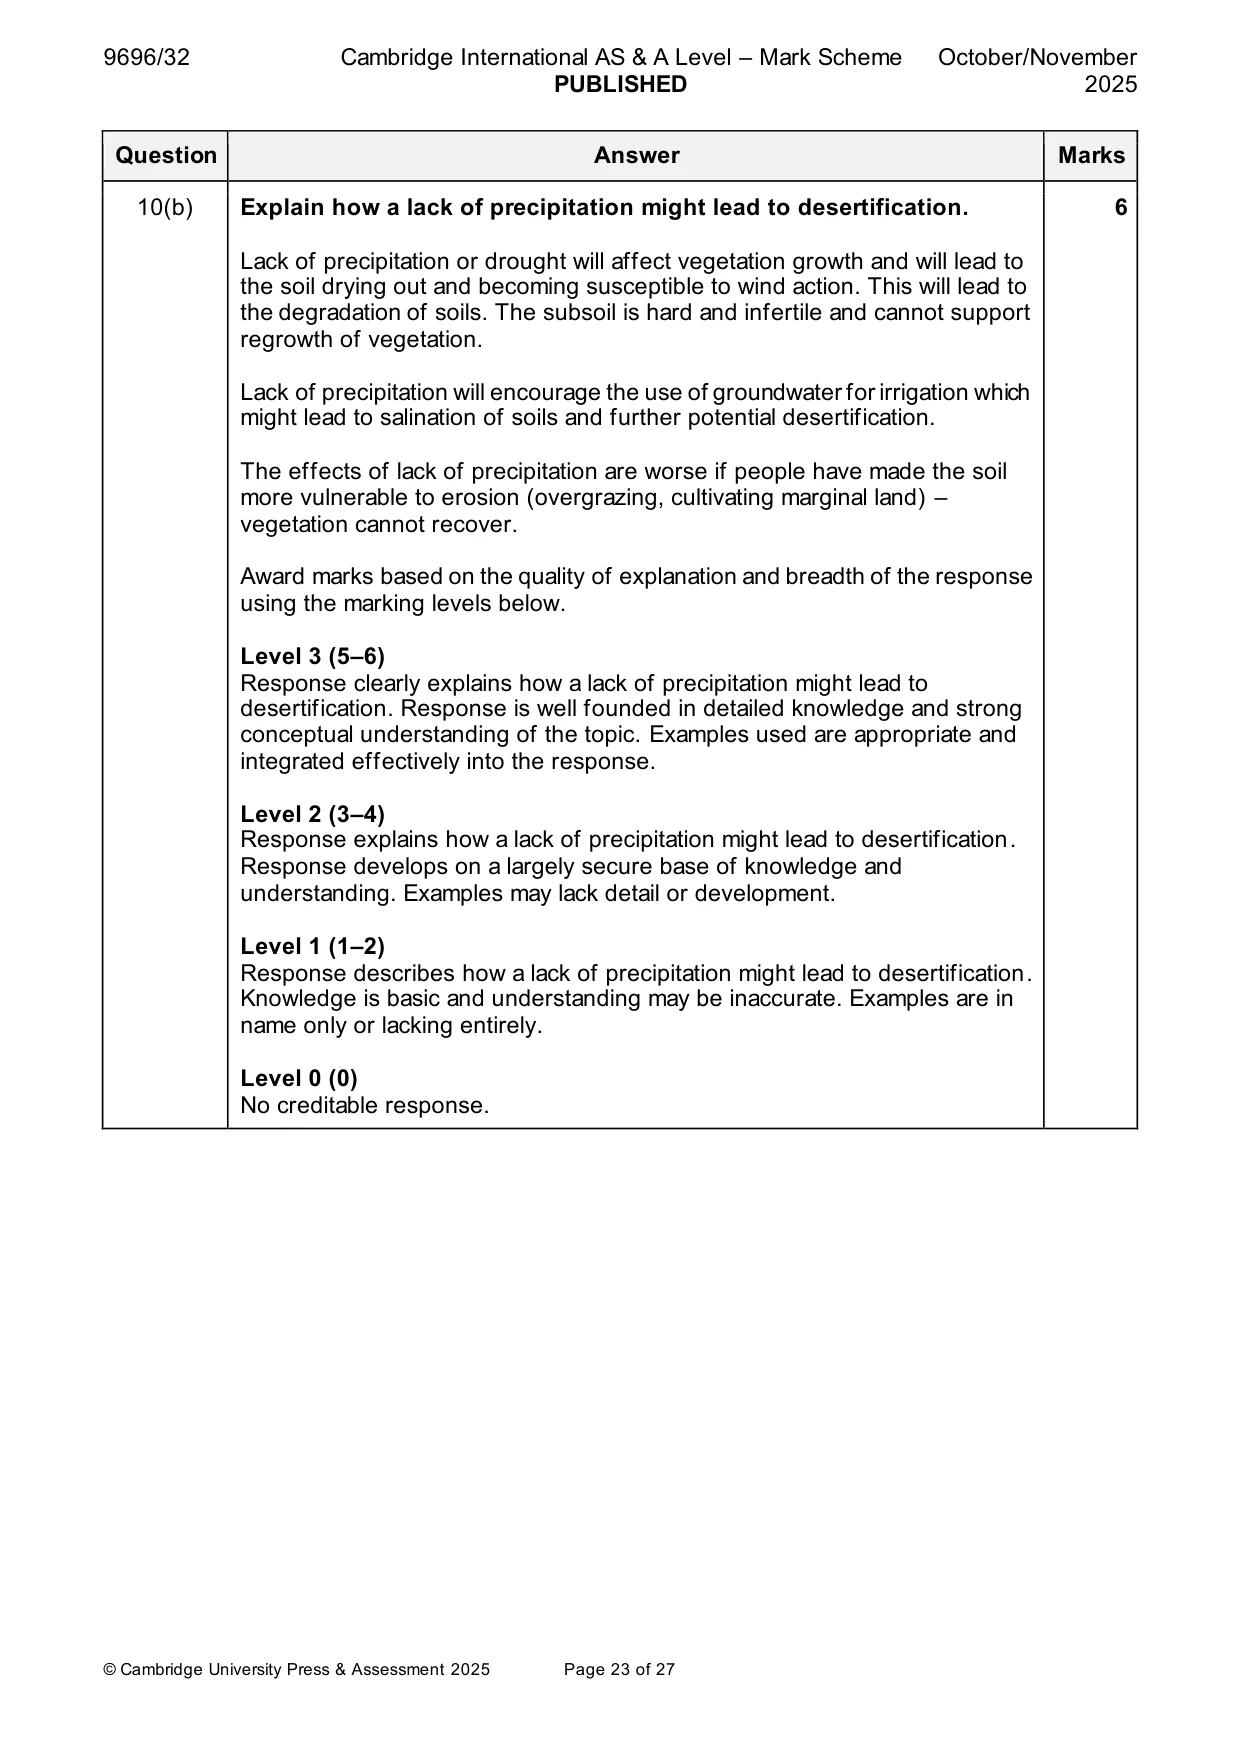
Mark scheme: 10(a) Fig. 10.1 shows annual precipitation anomalies for the semi-arid region 4 of the Sahel, Africa, 1915–2015. Describe the pattern of annual precipitation anomalies shown in Fig. 10.1. The main relevant points are: • Overall fluctuations • Mostly positive anomalies 1915–1967/mostly negative anomalies 1968– 2015 • Mostly positive anomalies 1915–1950 with some negative anomalies • All positive anomalies 1950–1967 • Negative anomalies 1968–1974 except for 1969 • Period of negative anomalies 1976–1993 • Mostly negative anomalies 1994–2015 with some positive anomalies • Greatest positive anomaly is 2.8 cm/month (1950) • Greatest negative anomaly is (–) 3.4 cm/month (1984) 1 mark for each descriptive point. Reserve 1 mark for use of data. 10(b) Explain how a lack of precipitation might lead to desertification. 6 Lack of precipitation or drought will affect vegetation growth and will lead to the soil drying out and becoming susceptible to wind action. This will lead to the degradation of soils. The subsoil is hard and infertile and cannot support regrowth of vegetation. Lack of precipitation will encourage the use of groundwater for irrigation which might lead to salination of soils and further potential desertification. The effects of lack of precipitation are worse if people have made the soil more vulnerable to erosion (overgrazing, cultivating marginal land) – vegetation cannot recover. Award marks based on the quality of explanation and breadth of the response using the marking levels below. Level 3 (5–6) Response clearly explains how a lack of precipitation might lead to desertification. Response is well founded in detailed knowledge and strong conceptual understanding of the topic. Examples used are appropriate and integrated effectively into the response. Level 2 (3–4) Response explains how a lack of precipitation might lead to desertification. Response develops on a largely secure base of knowledge and understanding. Examples may lack detail or development. Level 1 (1–2) Response describes how a lack of precipitation might lead to desertification. Knowledge is basic and understanding may be inaccurate. Examples are in name only or lacking entirely. Level 0 (0) No creditable response.
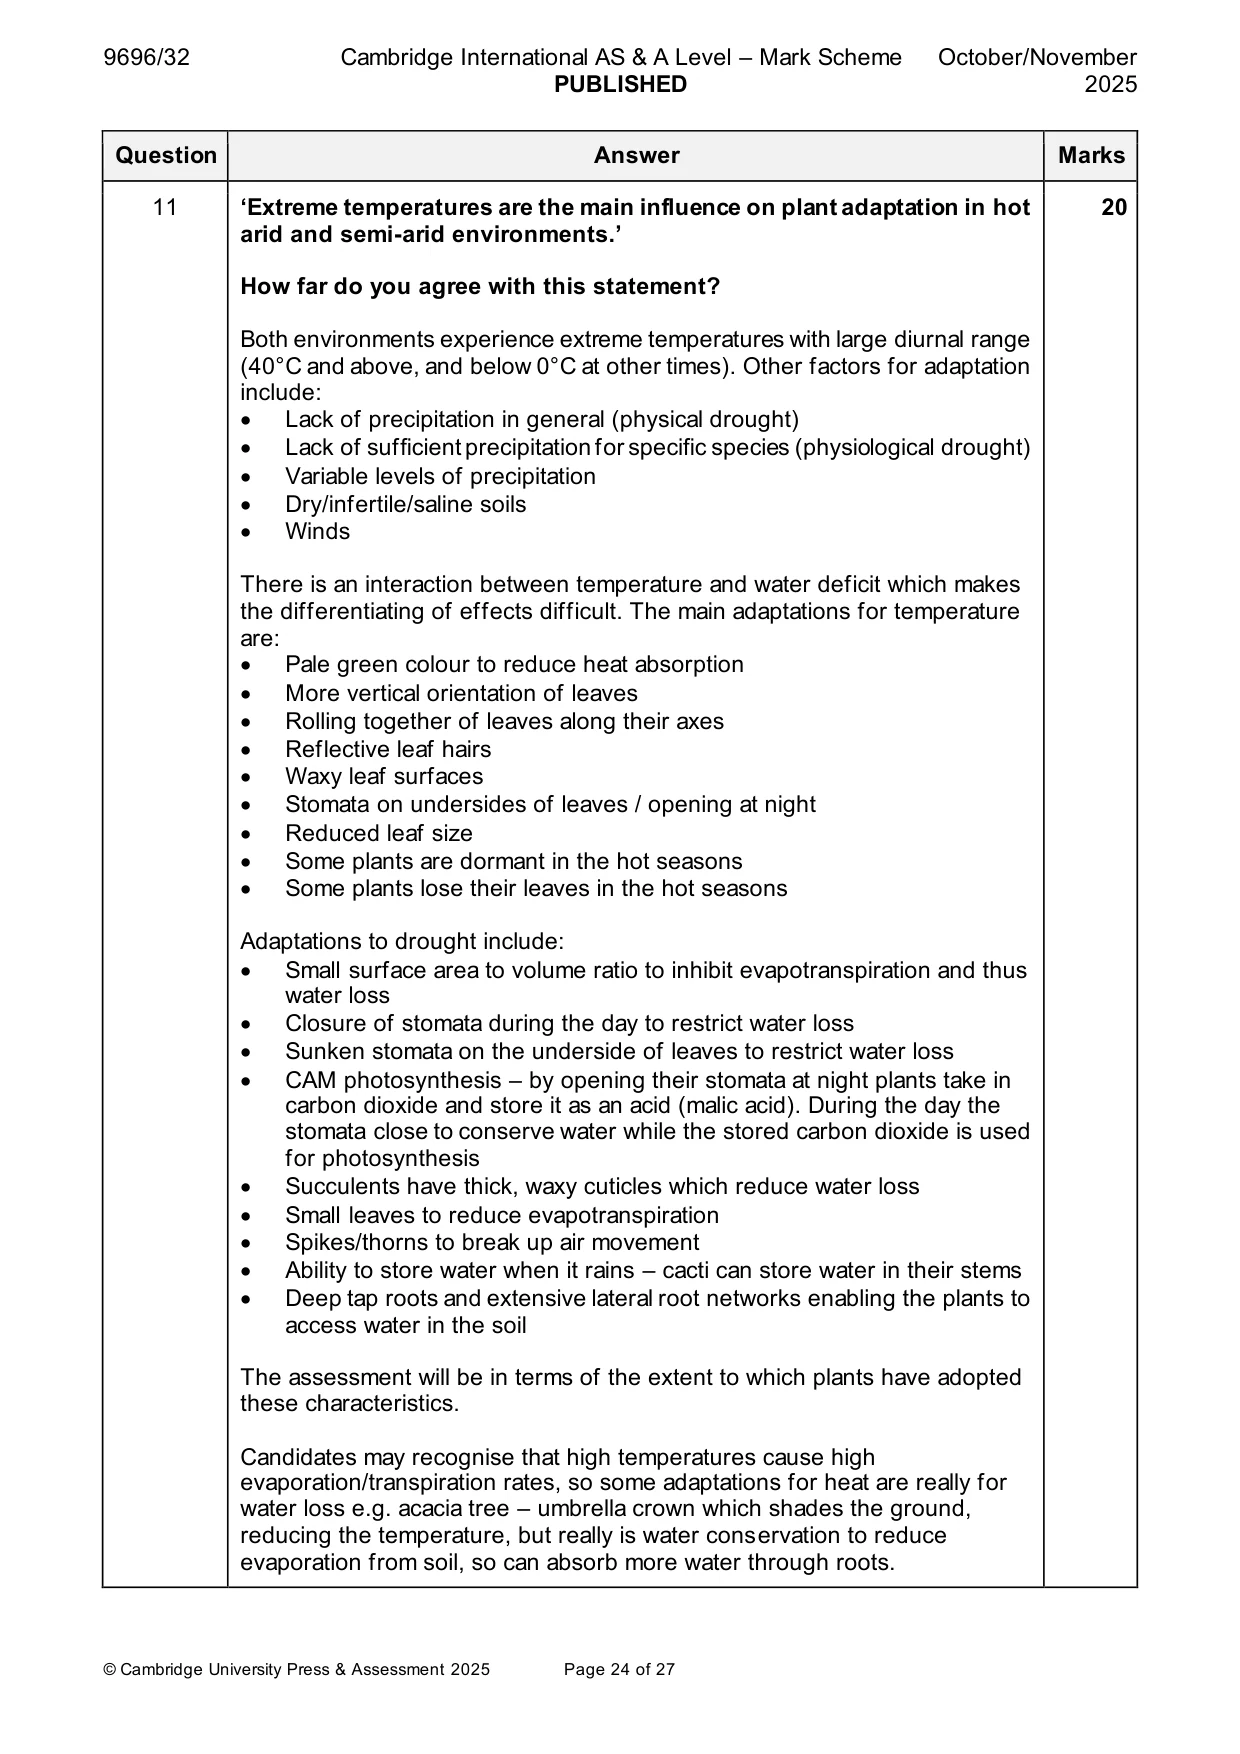
Q11 · ‘Extreme temperatures are the main influence on plant adaptation in hot arid and…
11 ‘Extreme temperatures are the main influence on plant adaptation in hot arid and semi-arid environments.’ How far do you agree with this statement? [20]
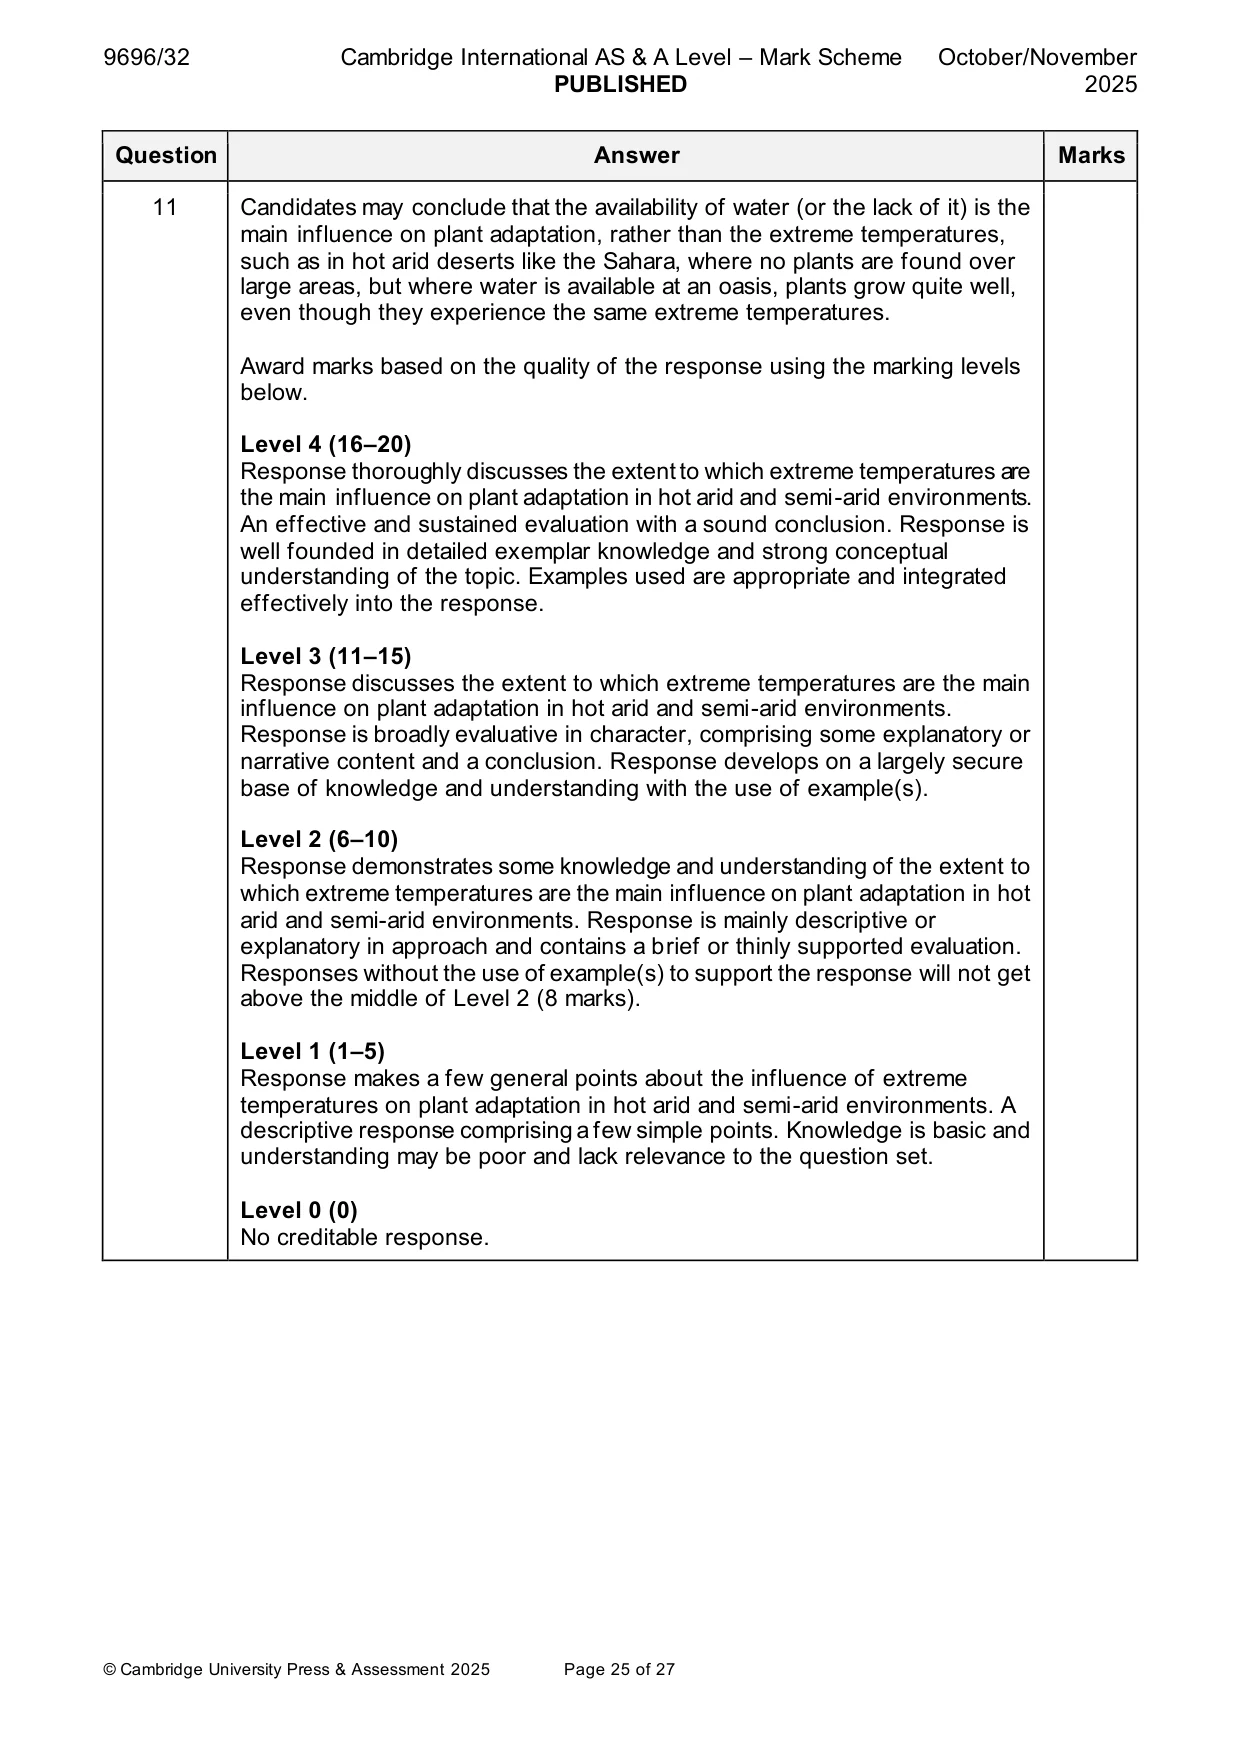
Mark scheme: 11 ‘Extreme temperatures are the main influence on plant adaptation in hot 20 arid and semi-arid environments.’ How far do you agree with this statement? Both environments experience extreme temperatures with large diurnal range (40°C and above, and below 0°C at other times). Other factors for adaptation include: • Lack of precipitation in general (physical drought) • Lack of sufficient precipitation for specific species (physiological drought) • Variable levels of precipitation • Dry/infertile/saline soils • Winds There is an interaction between temperature and water deficit which makes the differentiating of effects difficult. The main adaptations for temperature are: • Pale green colour to reduce heat absorption • More vertical orientation of leaves • Rolling together of leaves along their axes • Reflective leaf hairs • Waxy leaf surfaces • Stomata on undersides of leaves / opening at night • Reduced leaf size • Some plants are dormant in the hot seasons • Some plants lose their leaves in the hot seasons Adaptations to drought include: • Small surface area to volume ratio to inhibit evapotranspiration and thus water loss • Closure of stomata during the day to restrict water loss • Sunken stomata on the underside of leaves to restrict water loss • CAM photosynthesis – by opening their stomata at night plants take in carbon dioxide and store it as an acid (malic acid). During the day the stomata close to conserve water while the stored carbon dioxide is used for photosynthesis • Succulents have thick, waxy cuticles which reduce water loss • Small leaves to reduce evapotranspiration • Spikes/thorns to break up air movement • Ability to store water when it rains – cacti can store water in their stems • Deep tap roots and extensive lateral root networks enabling the plants to access water in the soil The assessment will be in terms of the extent to which plants have adopted these characteristics. Candidates may recognise that high temperatures cause high evaporation/transpiration rates, so some adaptations for heat are really for water loss e.g. acacia tree – umbrella crown which shades the ground, reducing the temperature, but really is water conservation to reduce evaporation from soil, so can absorb more water through roots. 11 Candidates may conclude that the availability of water (or the lack of it) is the main influence on plant adaptation, rather than the extreme temperatures, such as in hot arid deserts like the Sahara, where no plants are found over large areas, but where water is available at an oasis, plants grow quite well, even though they experience the same extreme temperatures. Award marks based on the quality of the response using the marking levels below. Level 4 (16–20) Response thoroughly discusses the extent to which extreme temperatures are the main influence on plant adaptation in hot arid and semi-arid environments. An effective and sustained evaluation with a sound conclusion. Response is well founded in detailed exemplar knowledge and strong conceptual understanding of the topic. Examples used are appropriate and integrated effectively into the response. Level 3 (11–15) Response discusses the extent to which extreme temperatures are the main influence on plant adaptation in hot arid and semi-arid environments. Response is broadly evaluative in character, comprising some explanatory or narrative content and a conclusion. Response develops on a largely secure base of knowledge and understanding with the use of example(s). Level 2 (6–10) Response demonstrates some knowledge and understanding of the extent to which extreme temperatures are the main influence on plant adaptation in hot arid and semi-arid environments. Response is mainly descriptive or explanatory in approach and contains a brief or thinly supported evaluation. Responses without the use of example(s) to support the response will not get above the middle of Level 2 (8 marks). Level 1 (1–5) Response makes a few general points about the influence of extreme temperatures on plant adaptation in hot arid and semi-arid environments. A descriptive response comprising a few simple points. Knowledge is basic and understanding may be poor and lack relevance to the question set. Level 0 (0) No creditable response.
What was in this paper
The subtopics covered by these 11 questions, and how many questions each got. Open one in a new tab to see every Cambridge question on it.
2Hazards resulting from tectonic processes2Humid tropical (rainforest) ecosystems and seasonally humid tropical (savanna) ecosystems2Sustainable management in hazardous environments2Soils and vegetation1Sustainable management of hot arid and semi-arid environments1Tropical climates1What you needed in this session
Cambridge’s own grade thresholds for 2025 Oct/Nov, Paper 3 · Variant 2. A higher threshold means an easier paper — the bar moves with how the cohort did.