Cambridge A Level Geography 9696 — 2023 Oct/Nov Paper 3 · Variant 2
9696/32/O/N/23 · 12 questions · 60 marks · ≈68 min
The question paper and its mark scheme, free to read here and free to download. This is Cambridge’s own paper, exactly as it was sat.
Question paper4 pages

Mark scheme24 pages
Answers below. Sit the paper first if you are practising.





Questions as text
Q1 · The movement of the monsoon across India
1 Fig. 1.1 shows the movement of the monsoon across India. (a) Describe the movement of the monsoon across India shown in Fig. 1.1. [4] (b) Explain the development and movement of monsoons. [6]
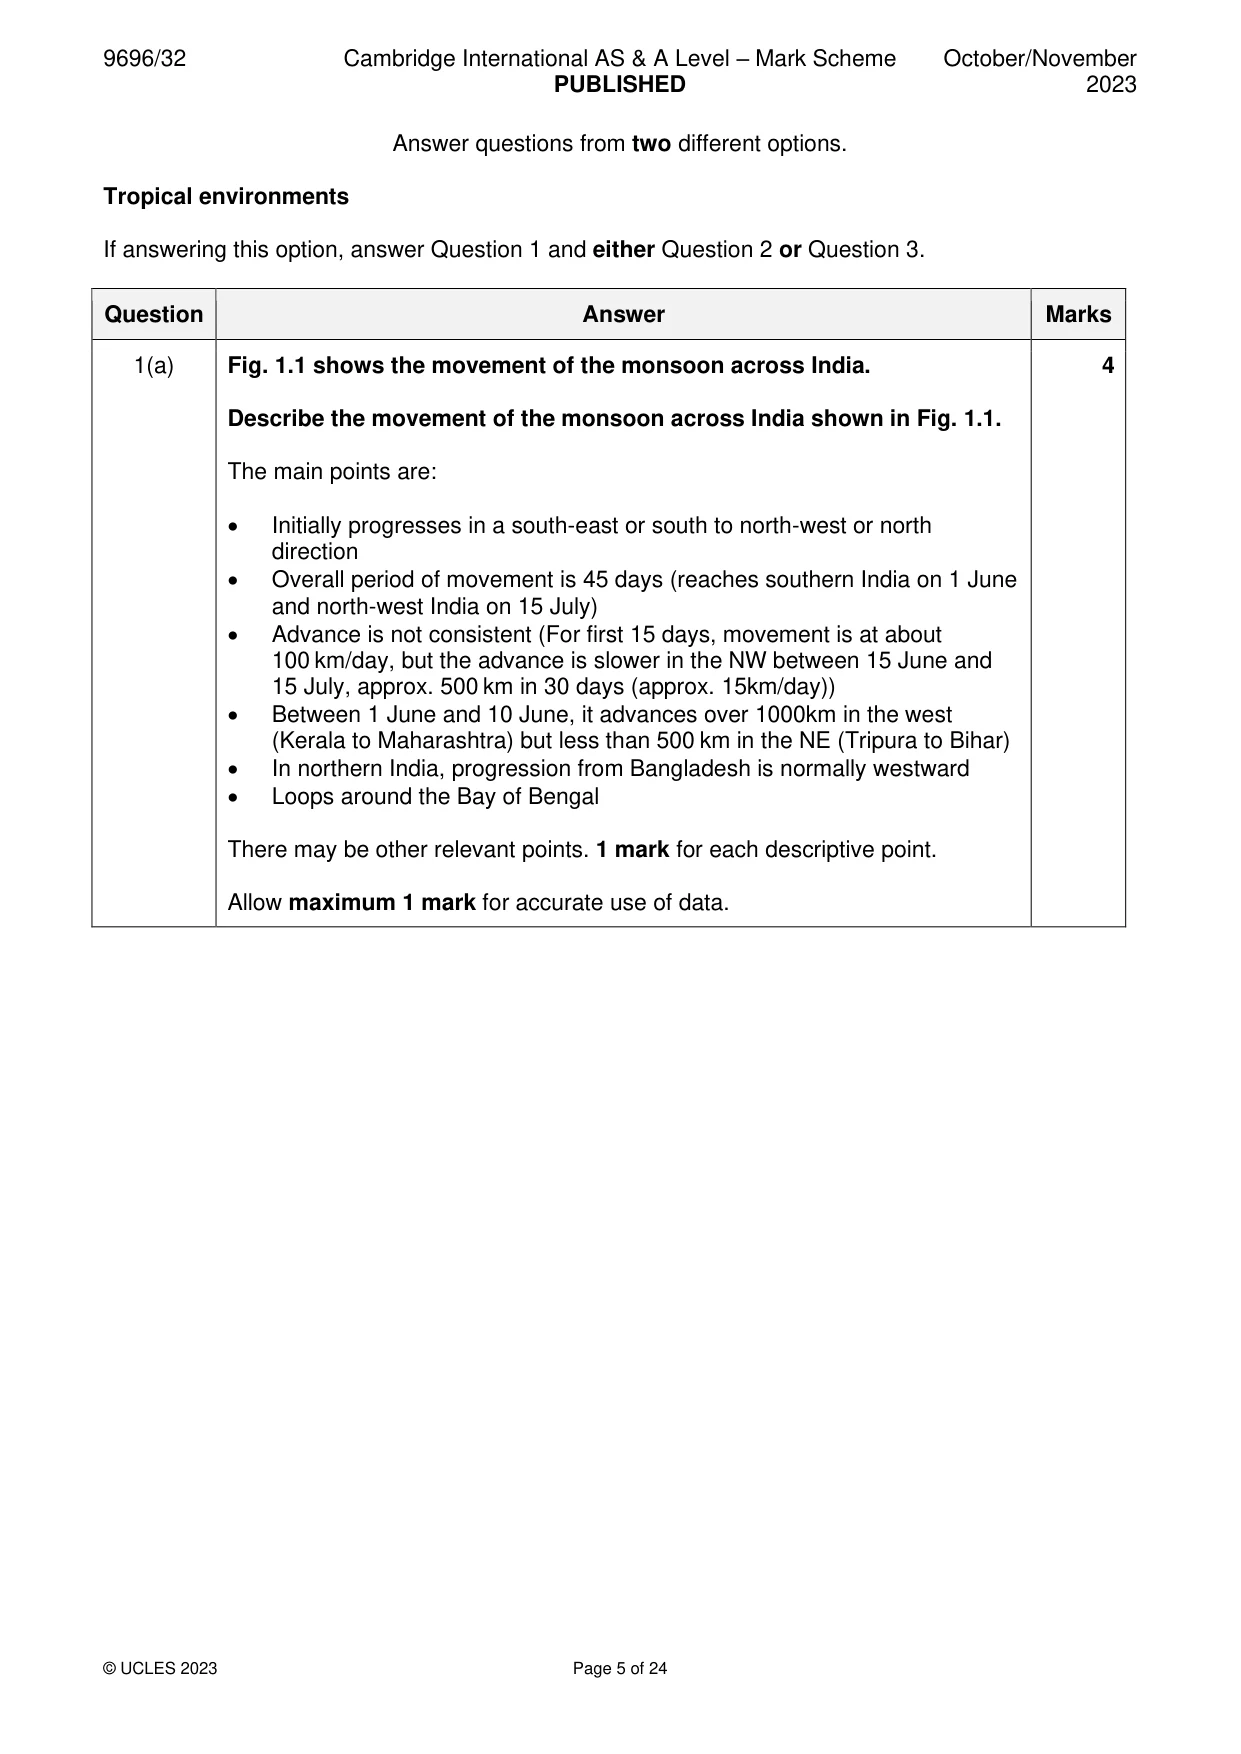
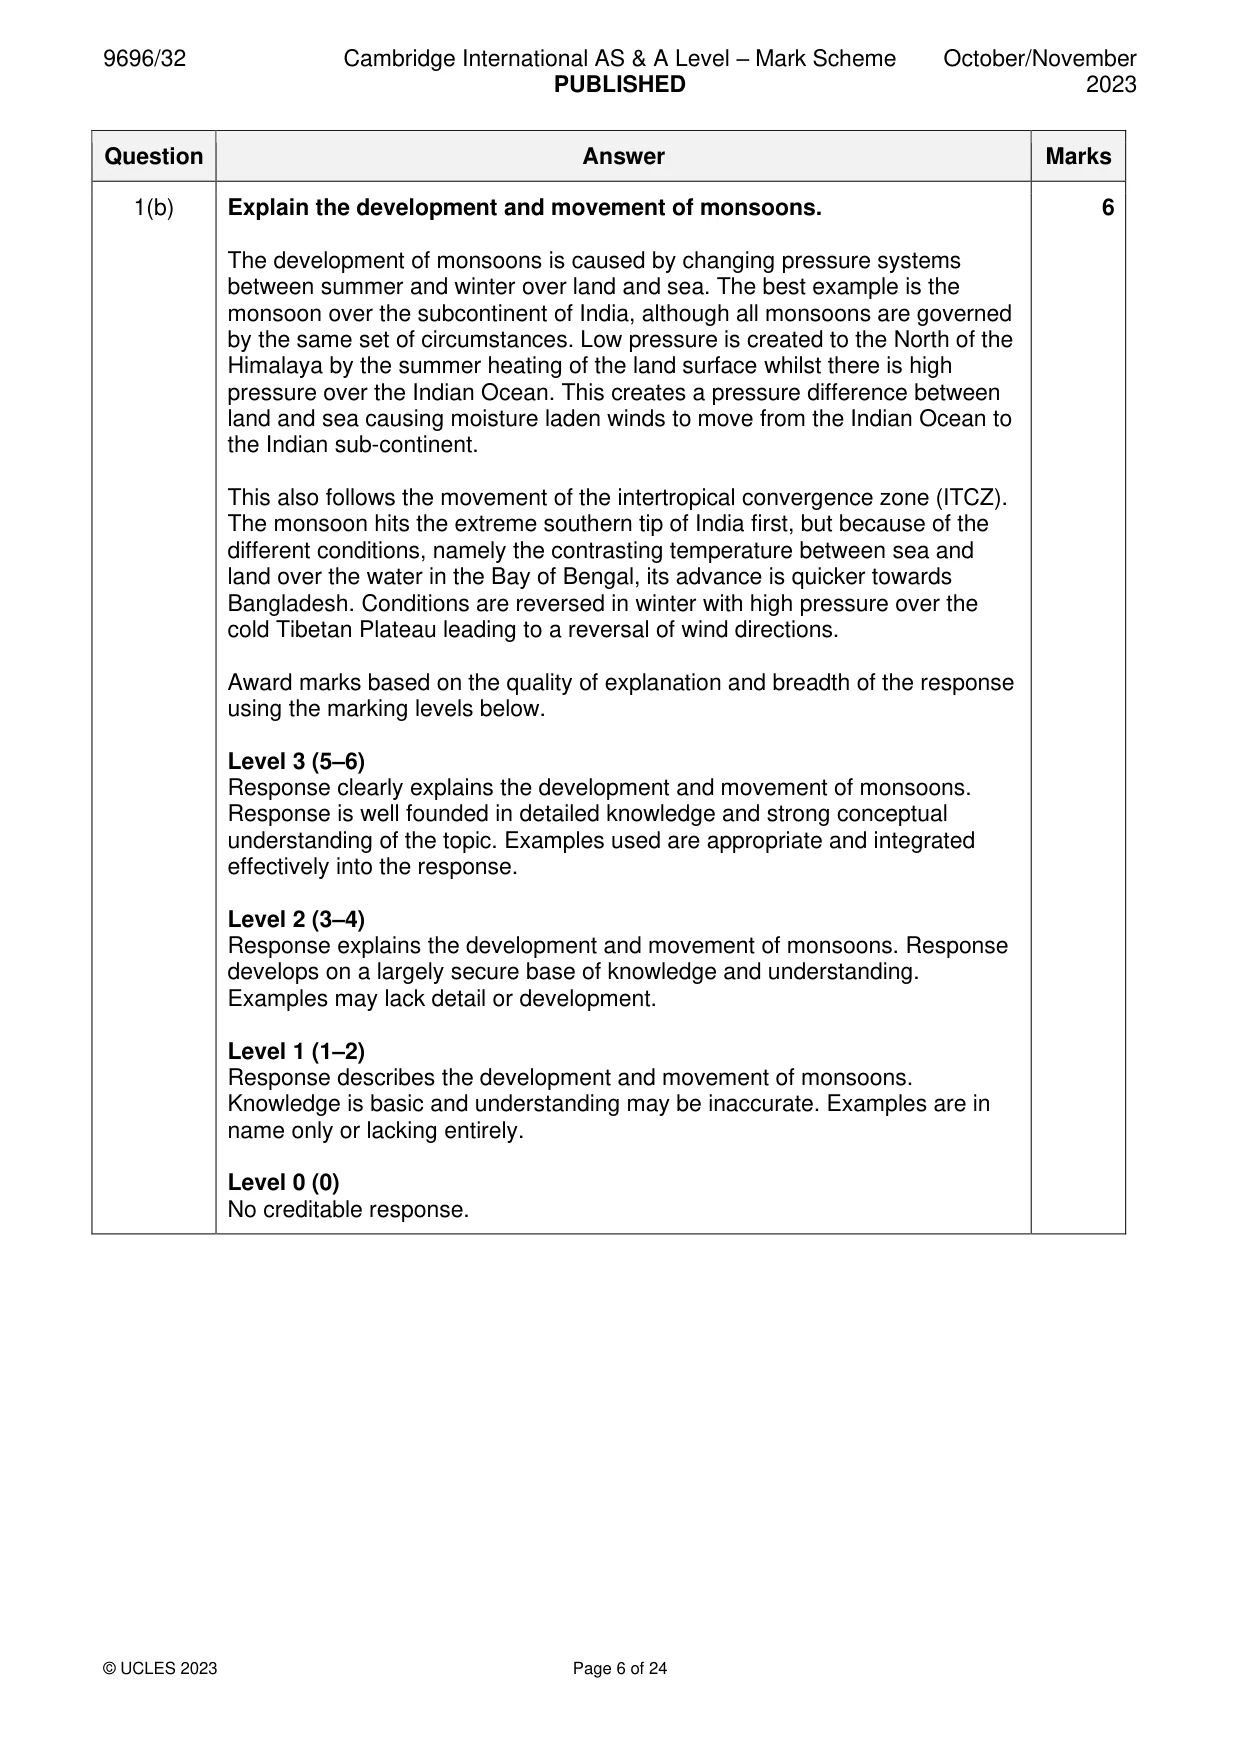
Mark scheme: Question Answer Marks 1(a) Fig. 1.1 shows the movement of the monsoon across India. 4 Describe the movement of the monsoon across India shown in Fig. 1.1. The main points are: • Initially progresses in a south-east or south to north-west or north direction • Overall period of movement is 45 days (reaches southern India on 1 June and north-west India on 15 July) • Advance is not consistent (For first 15 days, movement is at about 100 km/day, but the advance is slower in the NW between 15 June and 15 July, approx. 500 km in 30 days (approx. 15km/day)) • Between 1 June and 10 June, it advances over 1000km in the west (Kerala to Maharashtra) but less than 500 km in the NE (Tripura to Bihar) • In northern India, progression from Bangladesh is normally westward • Loops around the Bay of Bengal There may be other relevant points. 1 mark for each descriptive point. Allow maximum 1 mark for accurate use of data. 1(b) Explain the development and movement of monsoons. 6 The development of monsoons is caused by changing pressure systems between summer and winter over land and sea. The best example is the monsoon over the subcontinent of India, although all monsoons are governed by the same set of circumstances. Low pressure is created to the North of the Himalaya by the summer heating of the land surface whilst there is high pressure over the Indian Ocean. This creates a pressure difference between land and sea causing moisture laden winds to move from the Indian Ocean to the Indian sub-continent. This also follows the movement of the intertropical convergence zone (ITCZ). The monsoon hits the extreme southern tip of India first, but because of the different conditions, namely the contrasting temperature between sea and land over the water in the Bay of Bengal, its advance is quicker towards Bangladesh. Conditions are reversed in winter with high pressure over the cold Tibetan Plateau leading to a reversal of wind directions. Award marks based on the quality of explanation and breadth of the response using the marking levels below. Level 3 (5–6) Response clearly explains the development and movement of monsoons. Response is well founded in detailed knowledge and strong conceptual understanding of the topic. Examples used are appropriate and integrated effectively into the response. Level 2 (3–4) Response explains the development and movement of monsoons. Response develops on a largely secure base of knowledge and understanding. Examples may lack detail or development. Level 1 (1–2) Response describes the development and movement of monsoons. Knowledge is basic and understanding may be inaccurate. Examples are in name only or lacking entirely. Level 0 (0) No creditable response.
Q2 · Assess the influence of climate on the characteristics of vegetation in tropical…
2 Assess the influence of climate on the characteristics of vegetation in tropical ecosystems. [20]
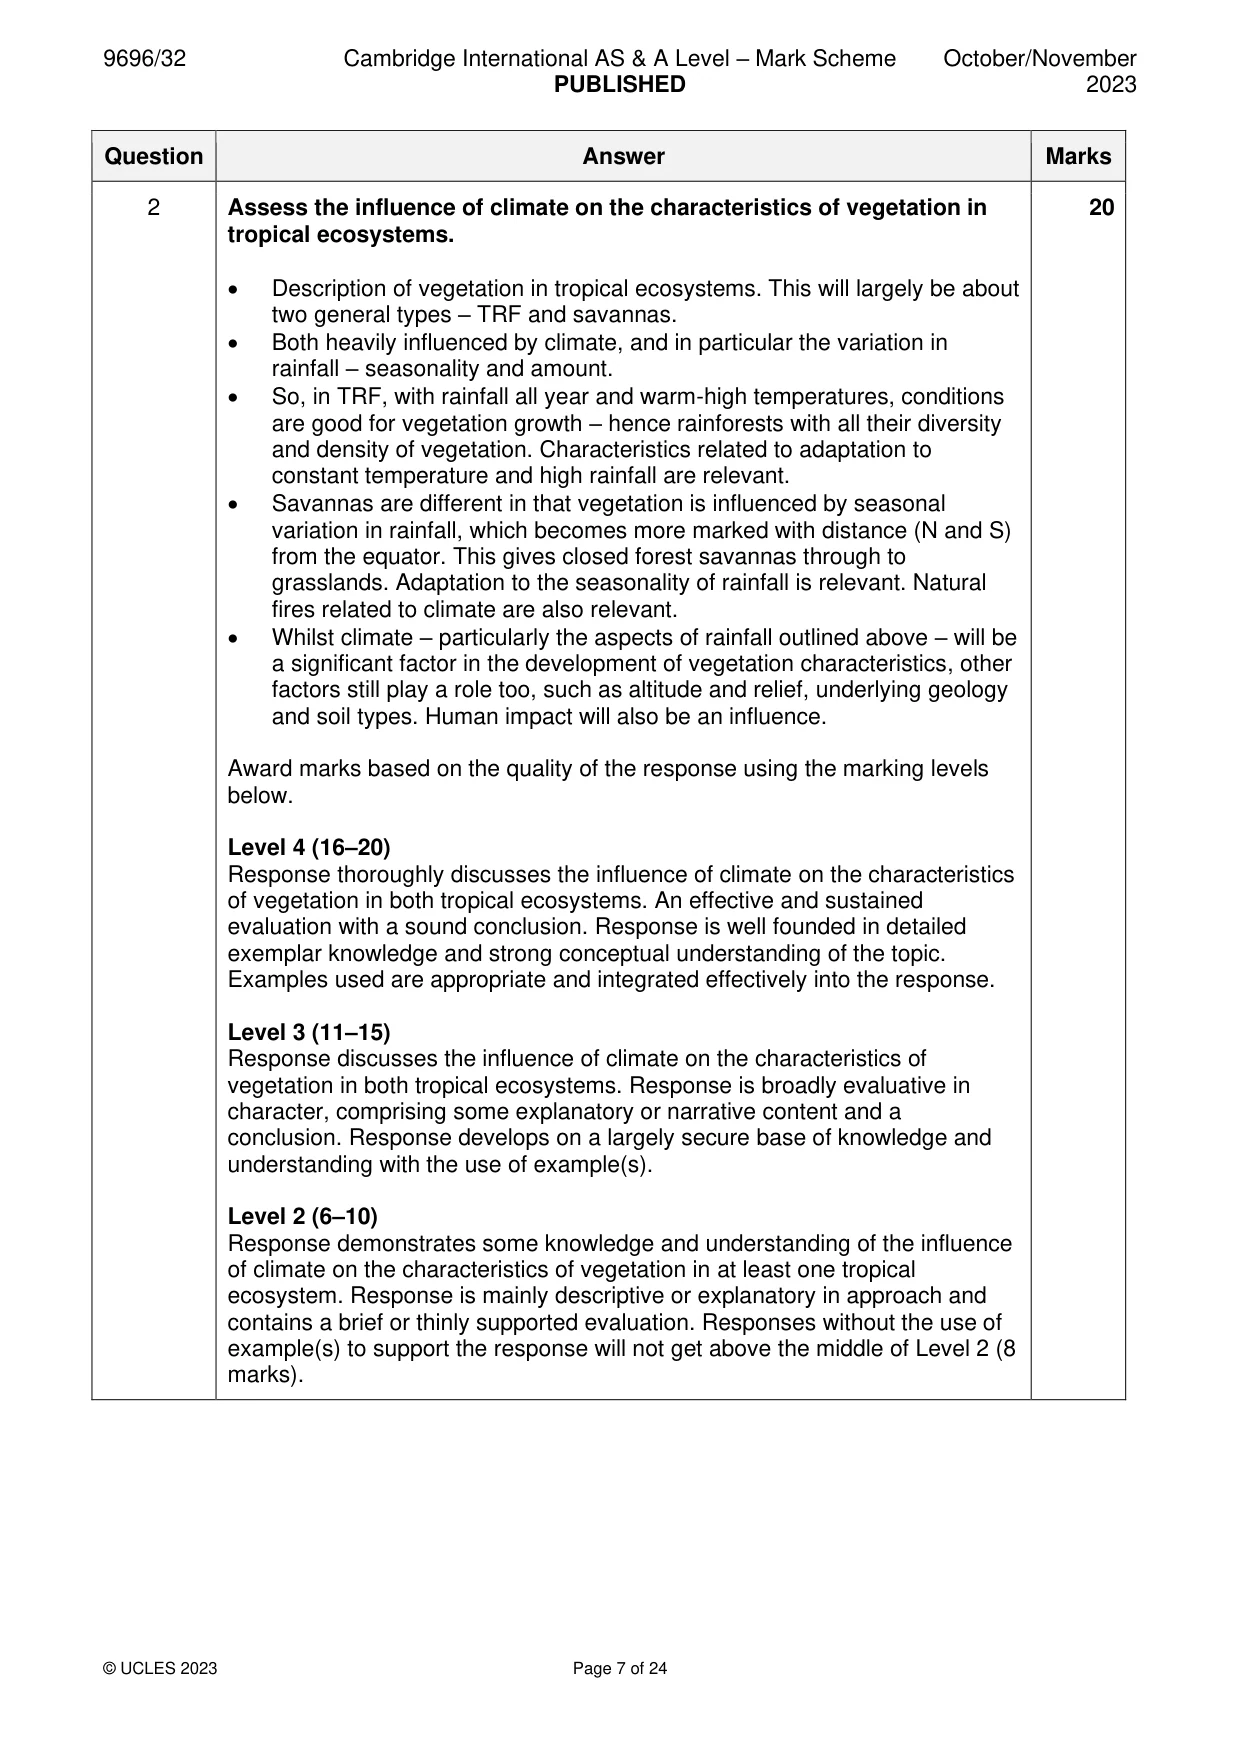
Mark scheme: 2 Assess the influence of climate on the characteristics of vegetation in 20 tropical ecosystems. • Description of vegetation in tropical ecosystems. This will largely be about two general types – TRF and savannas. • Both heavily influenced by climate, and in particular the variation in rainfall – seasonality and amount. • So, in TRF, with rainfall all year and warm-high temperatures, conditions are good for vegetation growth – hence rainforests with all their diversity and density of vegetation. Characteristics related to adaptation to constant temperature and high rainfall are relevant. • Savannas are different in that vegetation is influenced by seasonal variation in rainfall, which becomes more marked with distance (N and S) from the equator. This gives closed forest savannas through to grasslands. Adaptation to the seasonality of rainfall is relevant. Natural fires related to climate are also relevant. • Whilst climate – particularly the aspects of rainfall outlined above – will be a significant factor in the development of vegetation characteristics, other factors still play a role too, such as altitude and relief, underlying geology and soil types. Human impact will also be an influence. Award marks based on the quality of the response using the marking levels below. Level 4 (16–20) Response thoroughly discusses the influence of climate on the characteristics of vegetation in both tropical ecosystems. An effective and sustained evaluation with a sound conclusion. Response is well founded in detailed exemplar knowledge and strong conceptual understanding of the topic. Examples used are appropriate and integrated effectively into the response. Level 3 (11–15) Response discusses the influence of climate on the characteristics of vegetation in both tropical ecosystems. Response is broadly evaluative in character, comprising some explanatory or narrative content and a conclusion. Response develops on a largely secure base of knowledge and understanding with the use of example(s). Level 2 (6–10) Response demonstrates some knowledge and understanding of the influence of climate on the characteristics of vegetation in at least one tropical ecosystem. Response is mainly descriptive or explanatory in approach and contains a brief or thinly supported evaluation. Responses without the use of example(s) to support the response will not get above the middle of Level 2 (8 marks). 2 Level 1 (1–5) Response makes a few general points about the influence of climate on the characteristics of vegetation in at least one tropical ecosystem. A descriptive response comprising a few simple points. Knowledge is basic and understanding may be poor and lack relevance to the question set. Level 0 (0) No creditable response.
Q3 · ‘The sustainable management of a tropical ecosystem is made more difficult because of the…
3 ‘The sustainable management of a tropical ecosystem is made more difficult because of the characteristics of the soil.’ Using a case study of one tropical ecosystem, how far do you agree with this view? [20] Coastal environments If answering this option, answer Question 4 and either Question 5 or Question 6.
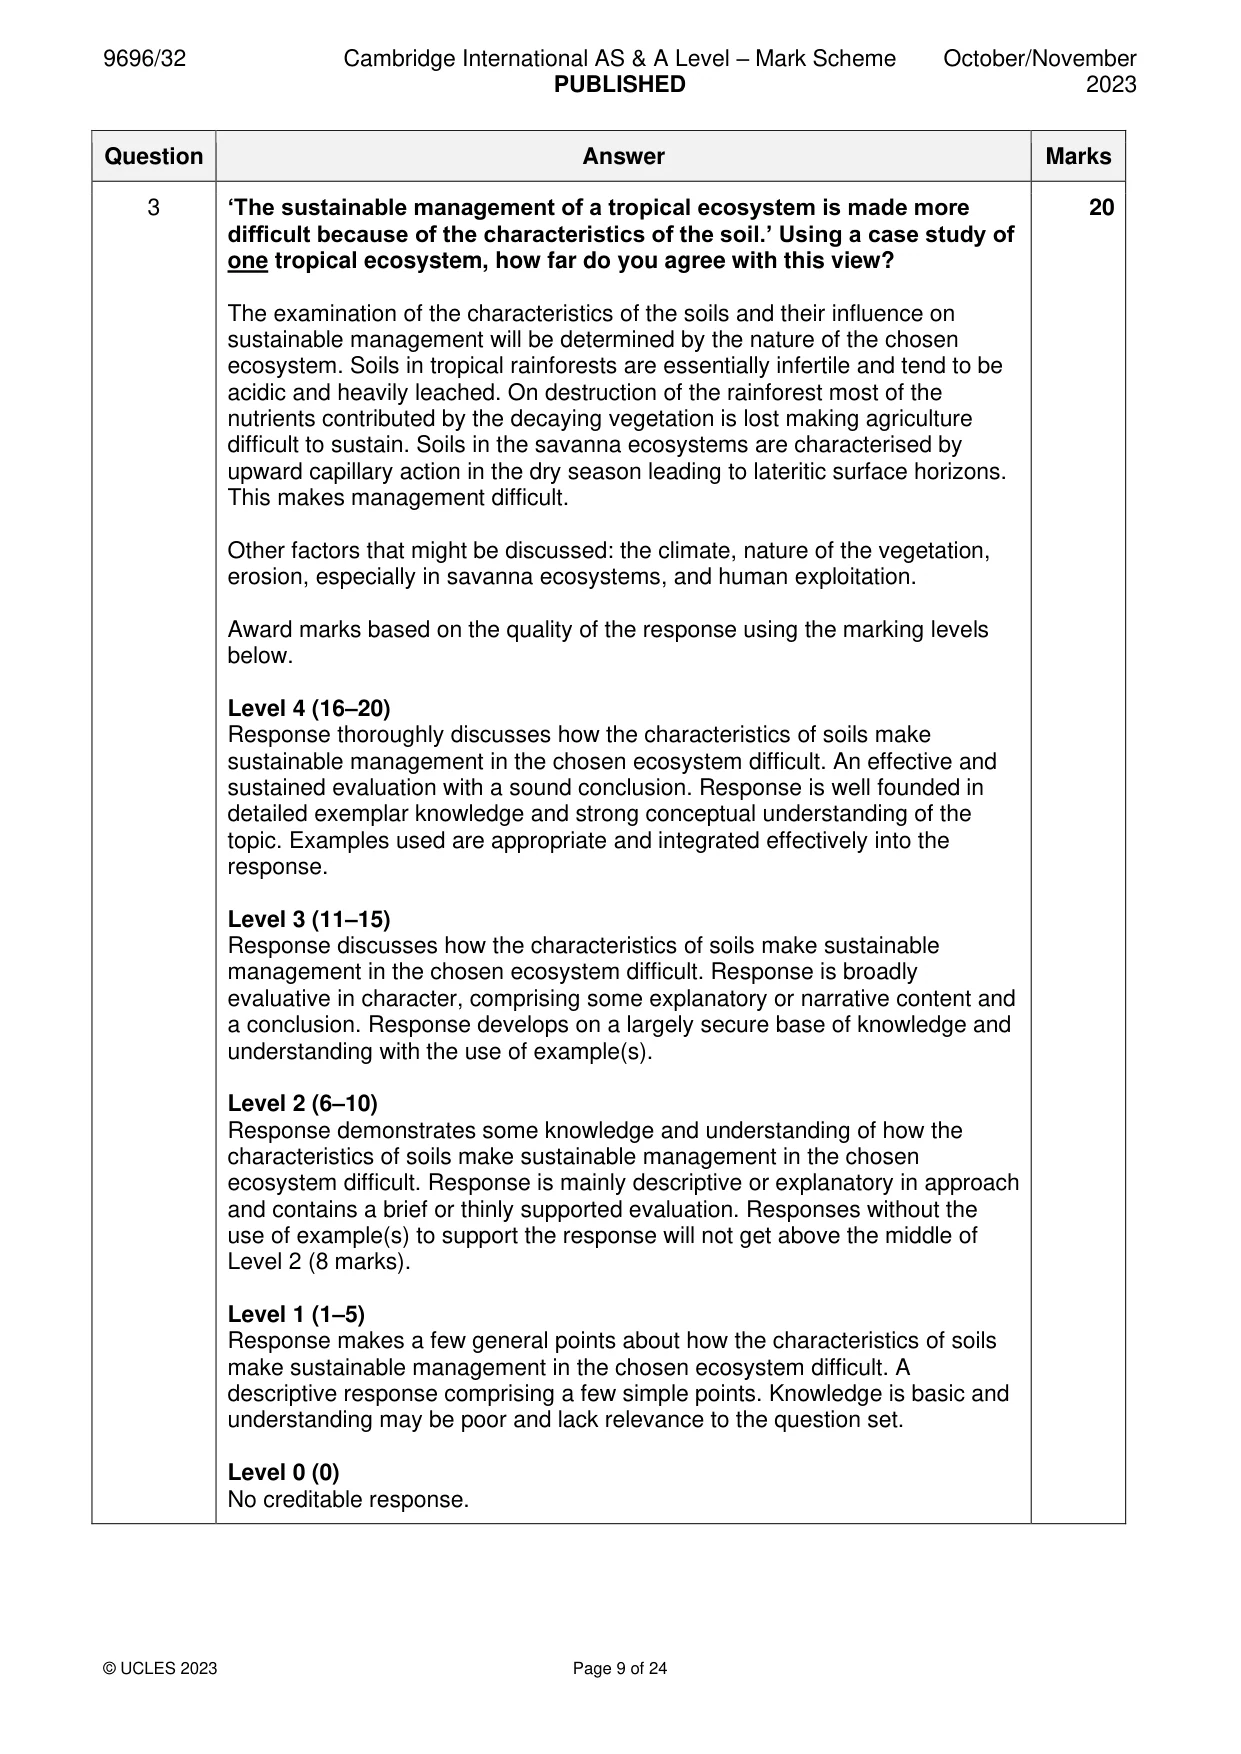
Mark scheme: 3 ‘The sustainable management of a tropical ecosystem is made more 20 difficult because of the characteristics of the soil.’ Using a case study of one tropical ecosystem, how far do you agree with this view? The examination of the characteristics of the soils and their influence on sustainable management will be determined by the nature of the chosen ecosystem. Soils in tropical rainforests are essentially infertile and tend to be acidic and heavily leached. On destruction of the rainforest most of the nutrients contributed by the decaying vegetation is lost making agriculture difficult to sustain. Soils in the savanna ecosystems are characterised by upward capillary action in the dry season leading to lateritic surface horizons. This makes management difficult. Other factors that might be discussed: the climate, nature of the vegetation, erosion, especially in savanna ecosystems, and human exploitation. Award marks based on the quality of the response using the marking levels below. Level 4 (16–20) Response thoroughly discusses how the characteristics of soils make sustainable management in the chosen ecosystem difficult. An effective and sustained evaluation with a sound conclusion. Response is well founded in detailed exemplar knowledge and strong conceptual understanding of the topic. Examples used are appropriate and integrated effectively into the response. Level 3 (11–15) Response discusses how the characteristics of soils make sustainable management in the chosen ecosystem difficult. Response is broadly evaluative in character, comprising some explanatory or narrative content and a conclusion. Response develops on a largely secure base of knowledge and understanding with the use of example(s). Level 2 (6–10) Response demonstrates some knowledge and understanding of how the characteristics of soils make sustainable management in the chosen ecosystem difficult. Response is mainly descriptive or explanatory in approach and contains a brief or thinly supported evaluation. Responses without the use of example(s) to support the response will not get above the middle of Level 2 (8 marks). Level 1 (1–5) Response makes a few general points about how the characteristics of soils make sustainable management in the chosen ecosystem difficult. A descriptive response comprising a few simple points. Knowledge is basic and understanding may be poor and lack relevance to the question set. Level 0 (0) No creditable response. Coastal environments If answering this option, answer Question 4 and either Question 5 or Question 6.
Q4 · Land lost and land gained for selected coastlines, 1984–2015
4 Fig. 4.1 shows land lost and land gained for selected coastlines, 1984–2015. (a) Describe the pattern of land lost and land gained shown in Fig. 4.1. [4] (b) Suggest two reasons why coastlines lose or gain land. [6]
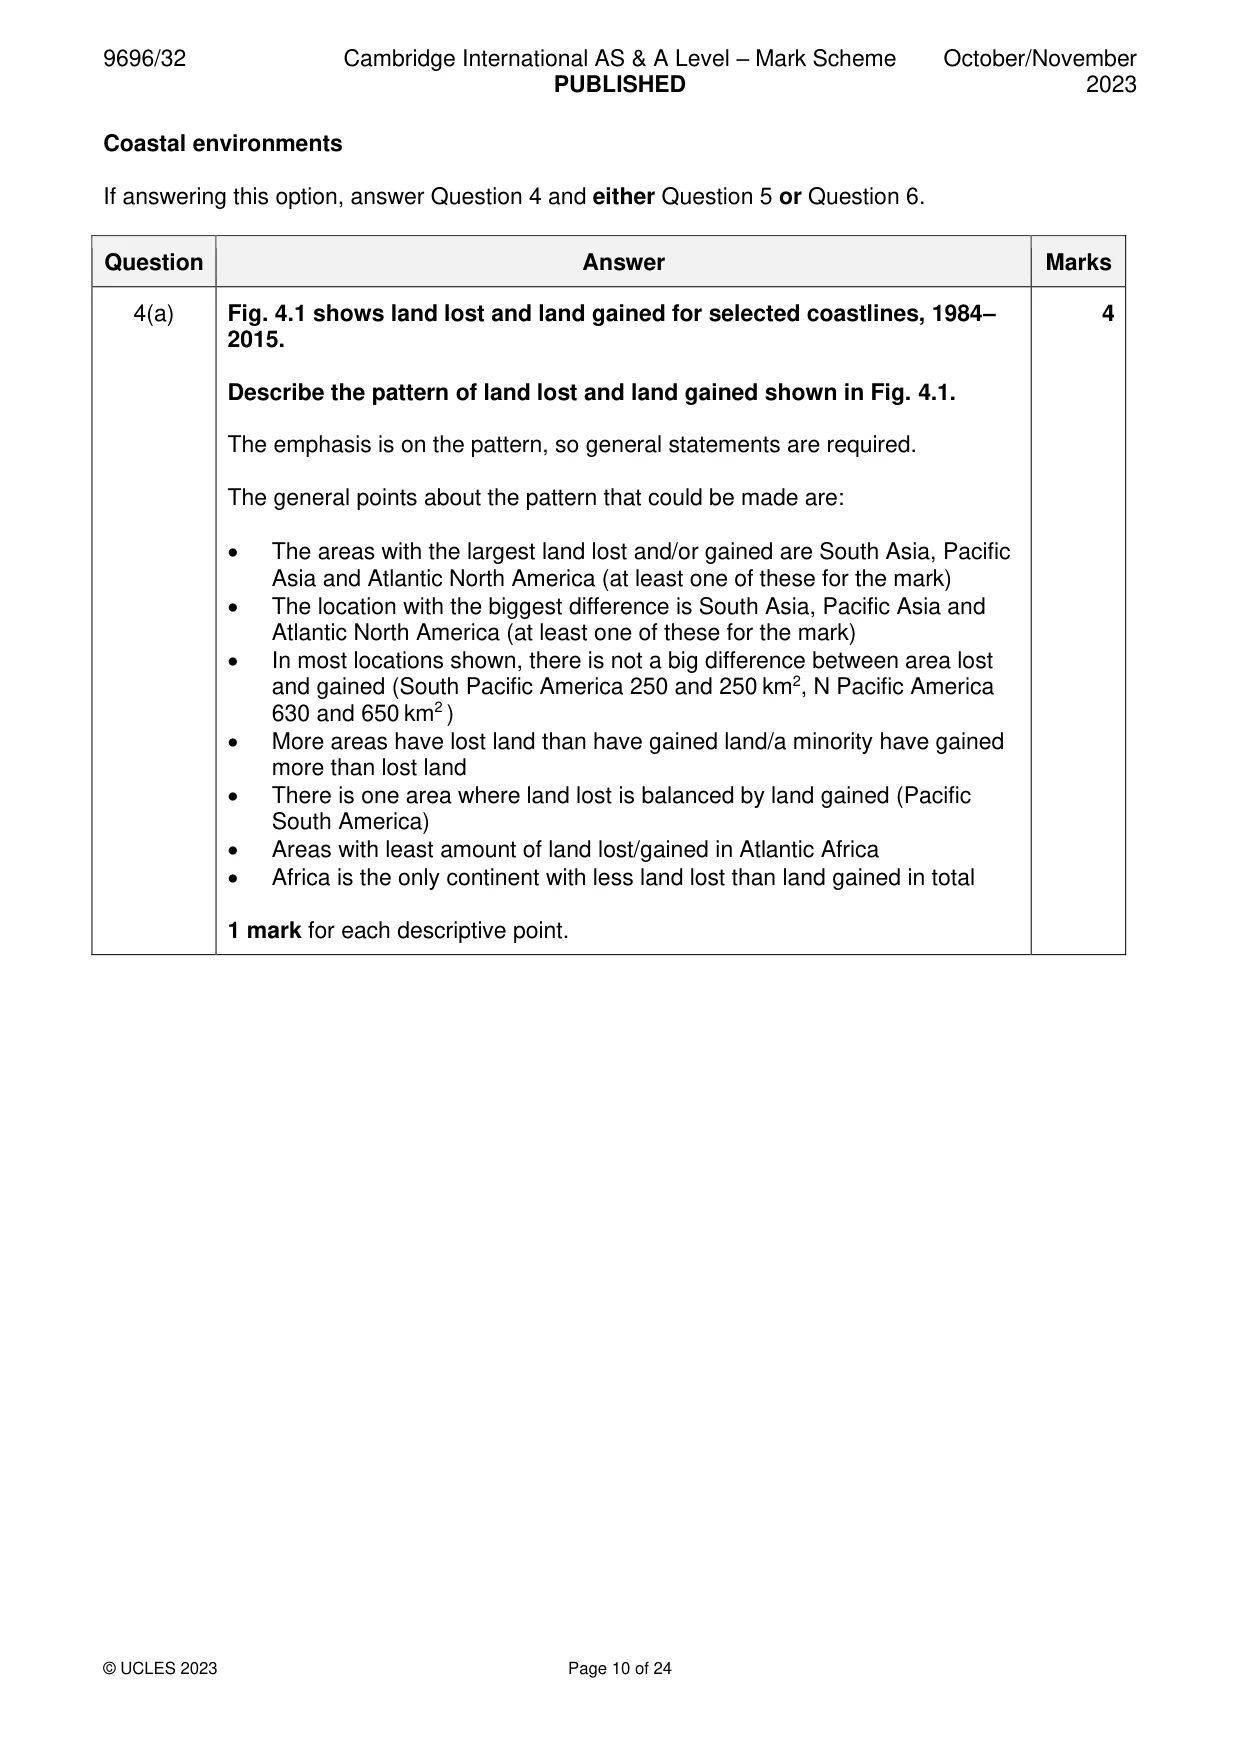
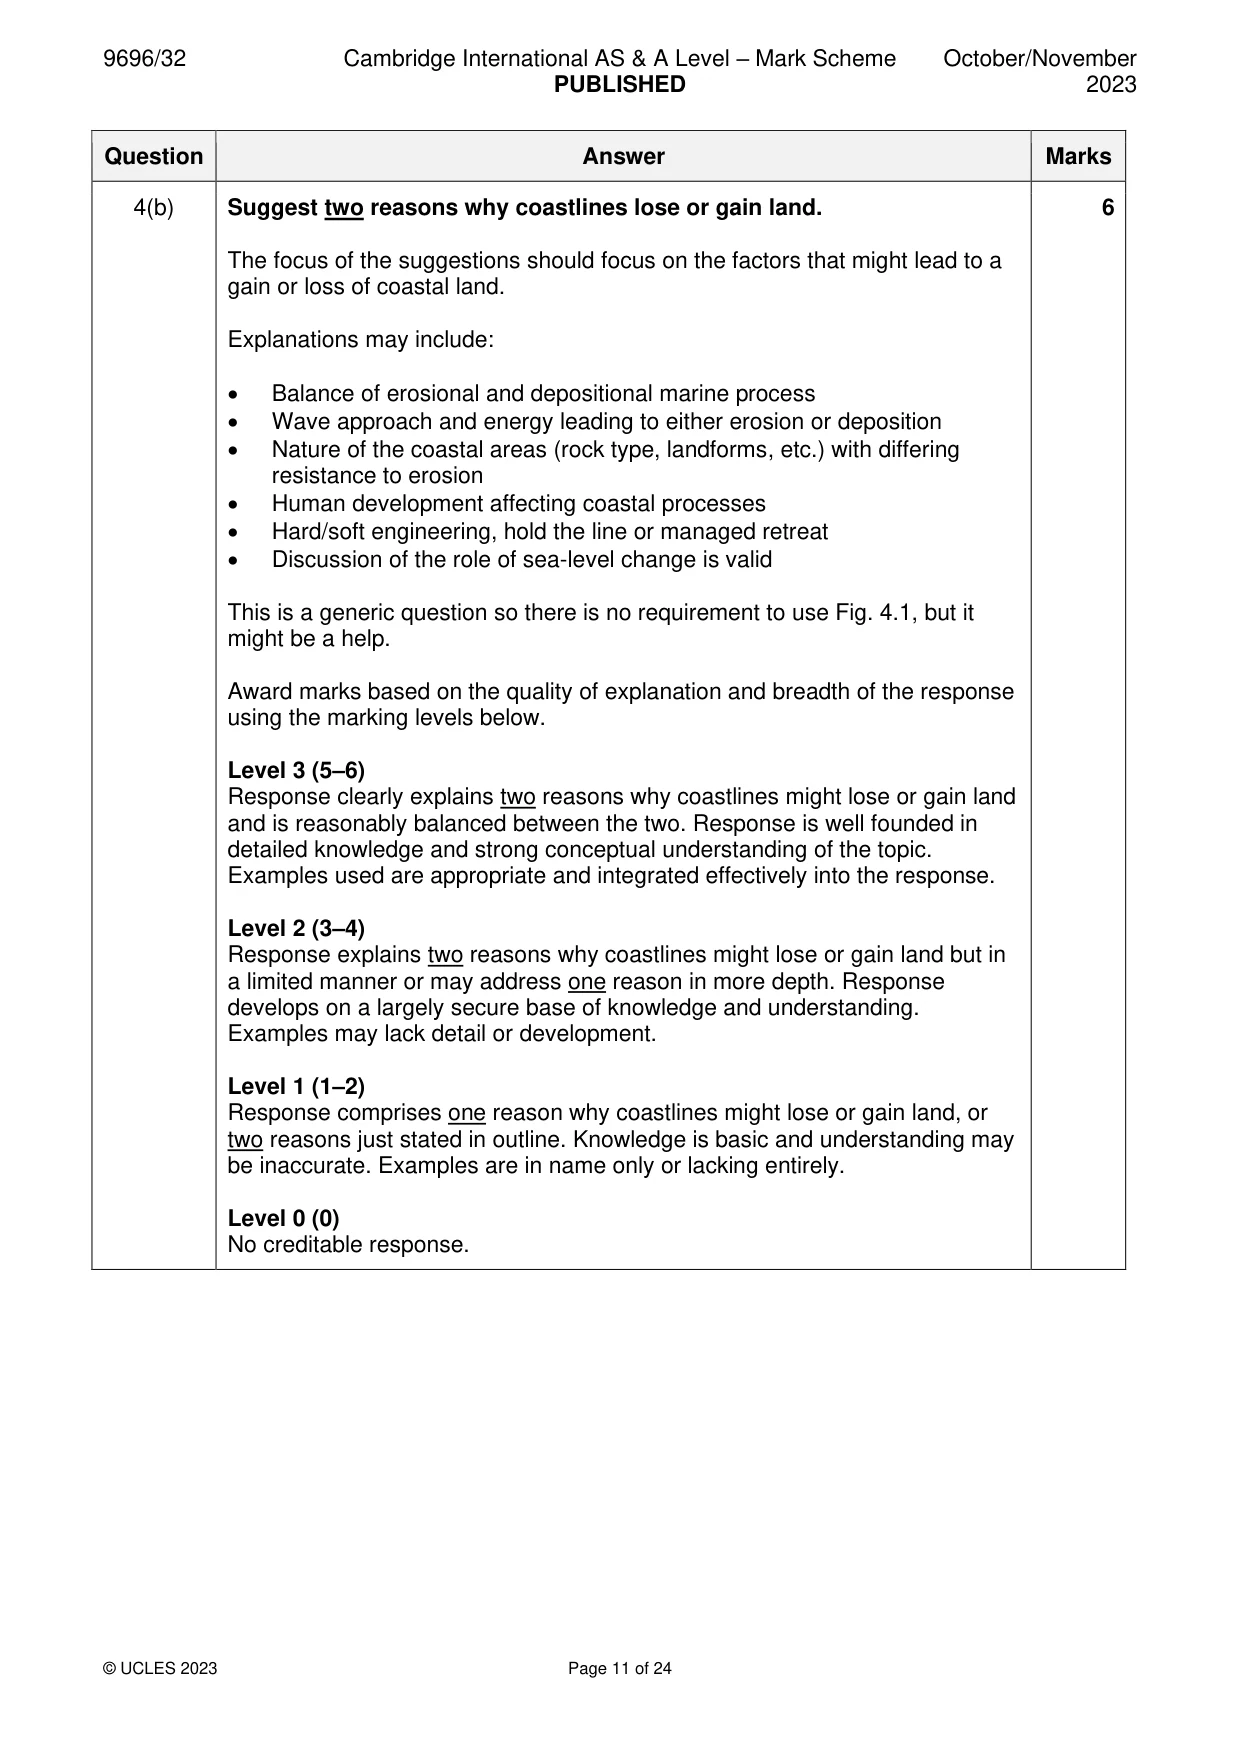
Mark scheme: 4(a) Fig. 4.1 shows land lost and land gained for selected coastlines, 1984– 4 2015. Describe the pattern of land lost and land gained shown in Fig. 4.1. The emphasis is on the pattern, so general statements are required. The general points about the pattern that could be made are: • The areas with the largest land lost and/or gained are South Asia, Pacific Asia and Atlantic North America (at least one of these for the mark) • The location with the biggest difference is South Asia, Pacific Asia and Atlantic North America (at least one of these for the mark) • In most locations shown, there is not a big difference between area lost and gained (South Pacific America 250 and 250 km2, N Pacific America 630 and 650 km2 ) • More areas have lost land than have gained land/a minority have gained more than lost land • There is one area where land lost is balanced by land gained (Pacific South America) • Areas with least amount of land lost/gained in Atlantic Africa • Africa is the only continent with less land lost than land gained in total 1 mark for each descriptive point. 4(b) Suggest two reasons why coastlines lose or gain land. 6 The focus of the suggestions should focus on the factors that might lead to a gain or loss of coastal land. Explanations may include: • Balance of erosional and depositional marine process • Wave approach and energy leading to either erosion or deposition • Nature of the coastal areas (rock type, landforms, etc.) with differing resistance to erosion • Human development affecting coastal processes • Hard/soft engineering, hold the line or managed retreat • Discussion of the role of sea-level change is valid This is a generic question so there is no requirement to use Fig. 4.1, but it might be a help. Award marks based on the quality of explanation and breadth of the response using the marking levels below. Level 3 (5–6) Response clearly explains two reasons why coastlines might lose or gain land and is reasonably balanced between the two. Response is well founded in detailed knowledge and strong conceptual understanding of the topic. Examples used are appropriate and integrated effectively into the response. Level 2 (3–4) Response explains two reasons why coastlines might lose or gain land but in a limited manner or may address one reason in more depth. Response develops on a largely secure base of knowledge and understanding. Examples may lack detail or development. Level 1 (1–2) Response comprises one reason why coastlines might lose or gain land, or two reasons just stated in outline. Knowledge is basic and understanding may be inaccurate. Examples are in name only or lacking entirely. Level 0 (0) No creditable response.
Q5 · Assess the extent to which the characteristics of coastal cliffs are the result of marine…
5 Assess the extent to which the characteristics of coastal cliffs are the result of marine processes. [20]
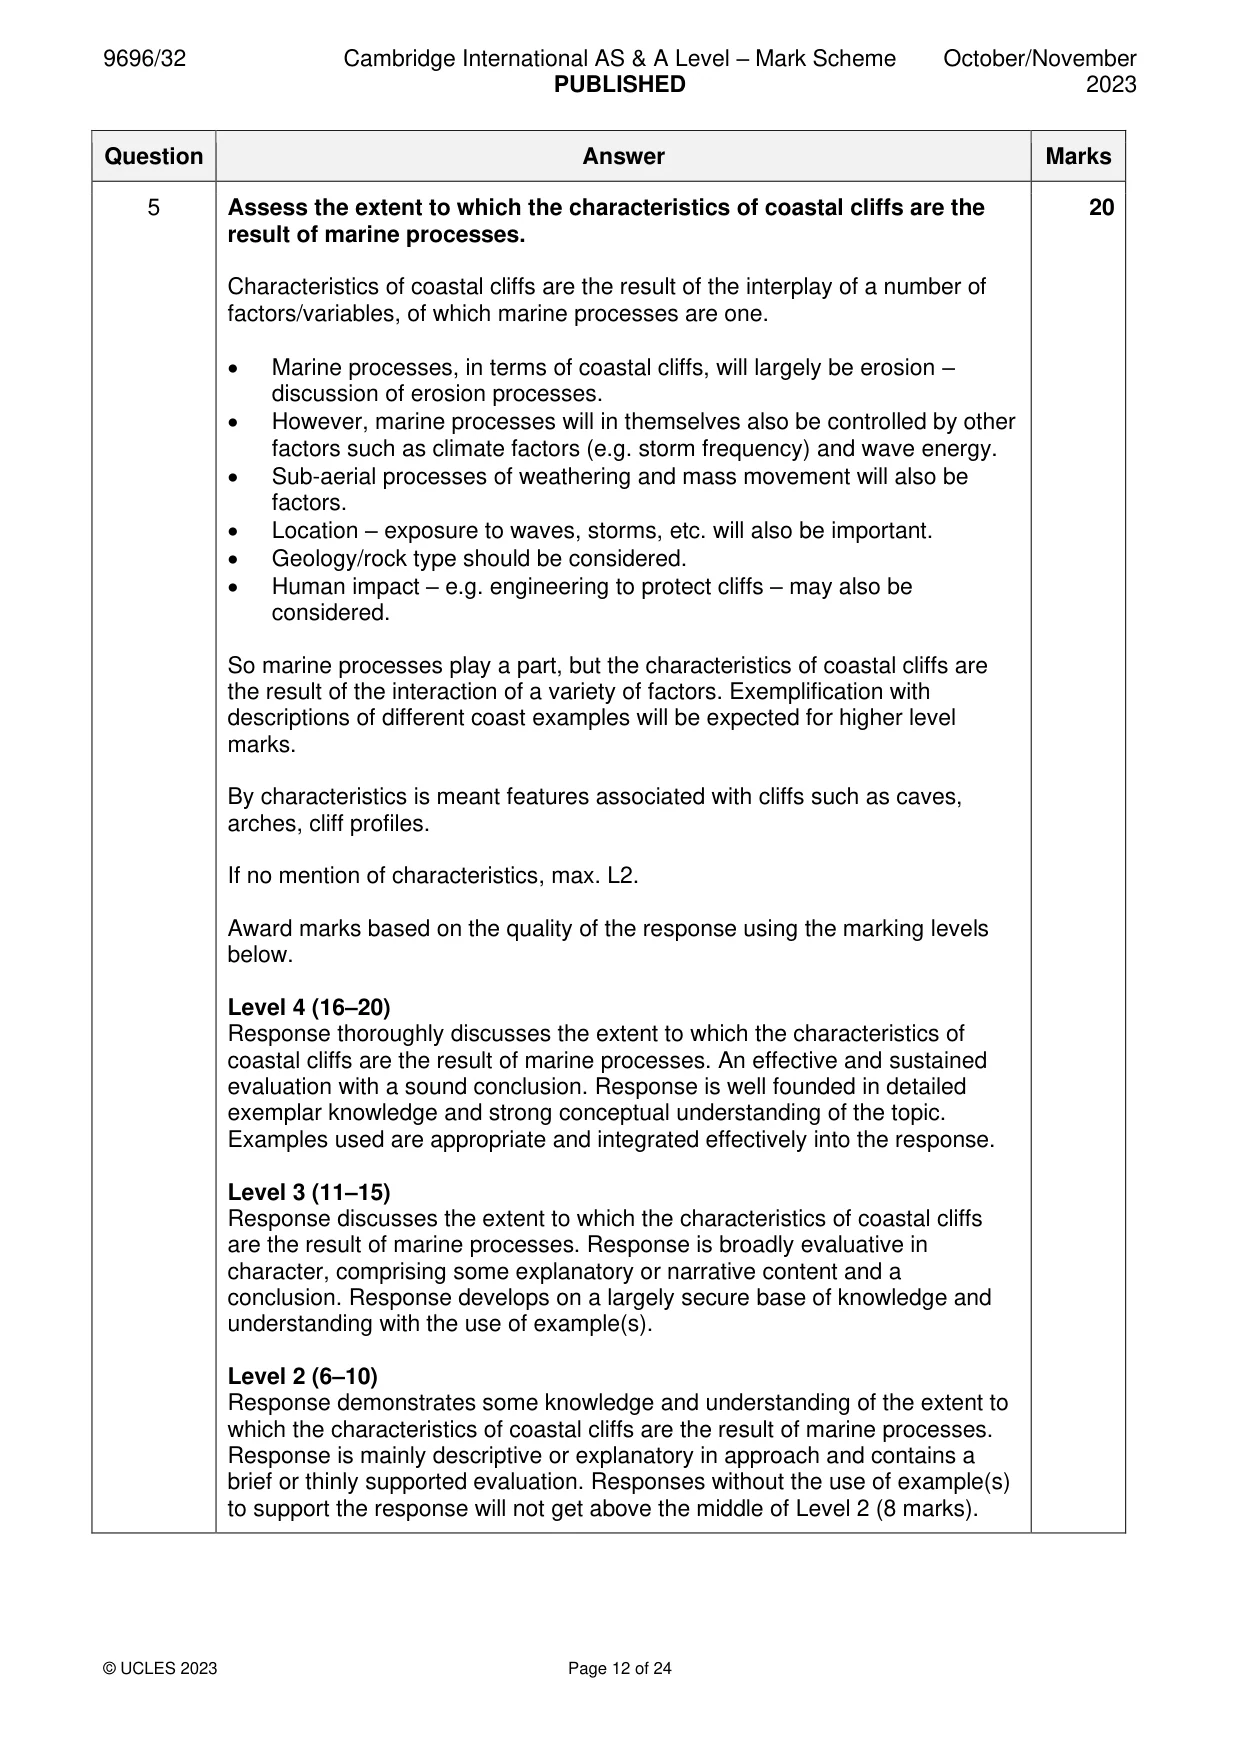
Mark scheme: 5 Assess the extent to which the characteristics of coastal cliffs are the 20 result of marine processes. Characteristics of coastal cliffs are the result of the interplay of a number of factors/variables, of which marine processes are one. • Marine processes, in terms of coastal cliffs, will largely be erosion – discussion of erosion processes. • However, marine processes will in themselves also be controlled by other factors such as climate factors (e.g. storm frequency) and wave energy. • Sub-aerial processes of weathering and mass movement will also be factors. • Location – exposure to waves, storms, etc. will also be important. • Geology/rock type should be considered. • Human impact – e.g. engineering to protect cliffs – may also be considered. So marine processes play a part, but the characteristics of coastal cliffs are the result of the interaction of a variety of factors. Exemplification with descriptions of different coast examples will be expected for higher level marks. By characteristics is meant features associated with cliffs such as caves, arches, cliff profiles. If no mention of characteristics, max. L2. Award marks based on the quality of the response using the marking levels below. Level 4 (16–20) Response thoroughly discusses the extent to which the characteristics of coastal cliffs are the result of marine processes. An effective and sustained evaluation with a sound conclusion. Response is well founded in detailed exemplar knowledge and strong conceptual understanding of the topic. Examples used are appropriate and integrated effectively into the response. Level 3 (11–15) Response discusses the extent to which the characteristics of coastal cliffs are the result of marine processes. Response is broadly evaluative in character, comprising some explanatory or narrative content and a conclusion. Response develops on a largely secure base of knowledge and understanding with the use of example(s). Level 2 (6–10) Response demonstrates some knowledge and understanding of the extent to which the characteristics of coastal cliffs are the result of marine processes. Response is mainly descriptive or explanatory in approach and contains a brief or thinly supported evaluation. Responses without the use of example(s) to support the response will not get above the middle of Level 2 (8 marks). 5 Level 1 (1–5) Response makes a few general points about the extent to which the characteristics of coastal cliffs are the result of marine processes. A descriptive response comprising a few simple points. Knowledge is basic and understanding may be poor and lack relevance to the question set. Level 0 (0) No creditable response.
Q6 · To what extent is hard engineering more successful than soft engineering in coastal…
6 To what extent is hard engineering more successful than soft engineering in coastal management? [20] Hazardous environments If answering this option, answer Question 7 and either Question 8 or Question 9.
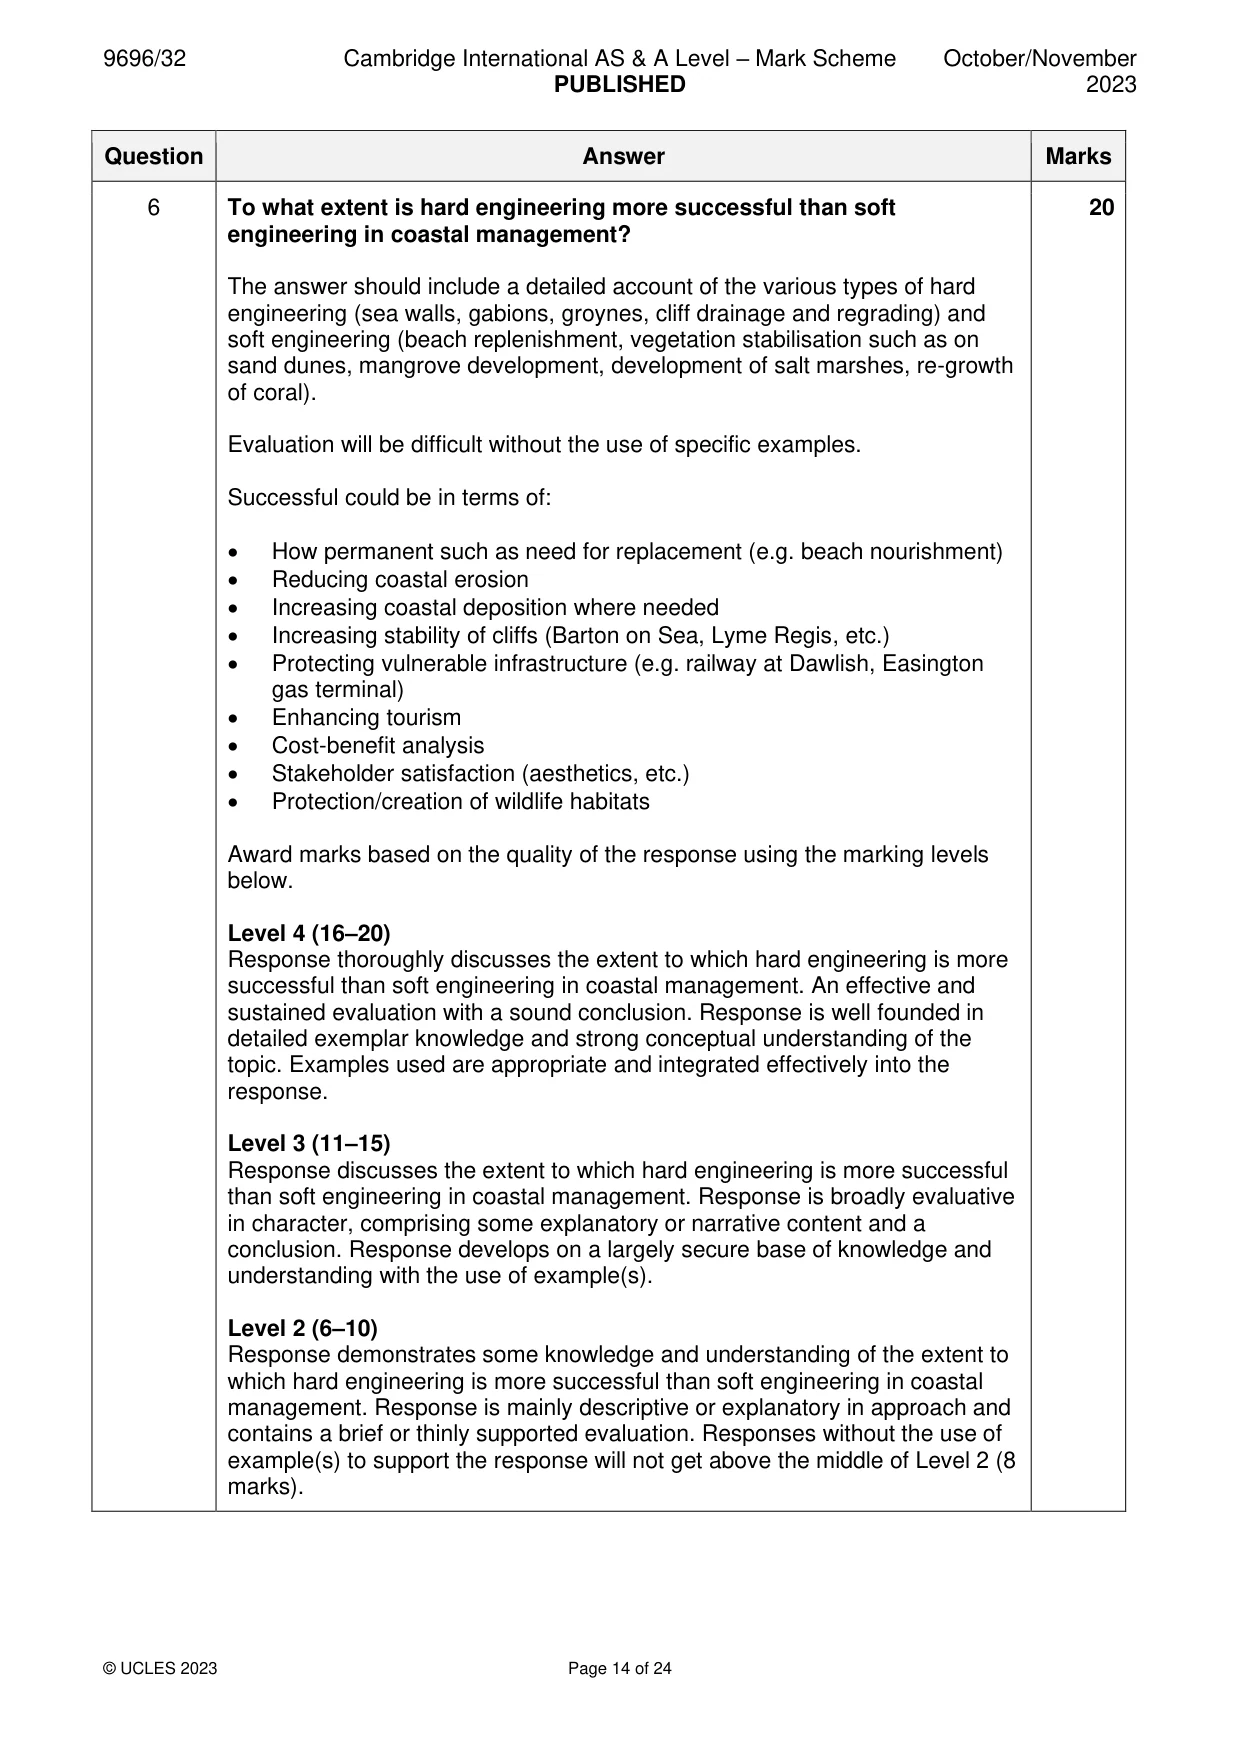
Mark scheme: 6 To what extent is hard engineering more successful than soft 20 engineering in coastal management? The answer should include a detailed account of the various types of hard engineering (sea walls, gabions, groynes, cliff drainage and regrading) and soft engineering (beach replenishment, vegetation stabilisation such as on sand dunes, mangrove development, development of salt marshes, re-growth of coral). Evaluation will be difficult without the use of specific examples. Successful could be in terms of: • How permanent such as need for replacement (e.g. beach nourishment) • Reducing coastal erosion • Increasing coastal deposition where needed • Increasing stability of cliffs (Barton on Sea, Lyme Regis, etc.) • Protecting vulnerable infrastructure (e.g. railway at Dawlish, Easington gas terminal) • Enhancing tourism • Cost-benefit analysis • Stakeholder satisfaction (aesthetics, etc.) • Protection/creation of wildlife habitats Award marks based on the quality of the response using the marking levels below. Level 4 (16–20) Response thoroughly discusses the extent to which hard engineering is more successful than soft engineering in coastal management. An effective and sustained evaluation with a sound conclusion. Response is well founded in detailed exemplar knowledge and strong conceptual understanding of the topic. Examples used are appropriate and integrated effectively into the response. Level 3 (11–15) Response discusses the extent to which hard engineering is more successful than soft engineering in coastal management. Response is broadly evaluative in character, comprising some explanatory or narrative content and a conclusion. Response develops on a largely secure base of knowledge and understanding with the use of example(s). Level 2 (6–10) Response demonstrates some knowledge and understanding of the extent to which hard engineering is more successful than soft engineering in coastal management. Response is mainly descriptive or explanatory in approach and contains a brief or thinly supported evaluation. Responses without the use of example(s) to support the response will not get above the middle of Level 2 (8 marks). 6 Level 1 (1–5) Response makes a few general points about the extent to which hard engineering is more successful than soft engineering in coastal management. A descriptive response comprising a few simple points. Knowledge is basic and understanding may be poor and lack relevance to the question set. Level 0 (0) No creditable response. Hazardous environments If answering this option, answer Question 7 and either Question 8 or Question 9.
Q7 · The duration of precursors and events for different natural hazards
7 Fig. 7.1 shows the duration of precursors and events for different natural hazards. Precursors are natural warning signs that often come before the event. (a) Compare the duration of precursors and events for the natural hazards shown in Fig. 7.1. [4] (b) Suggest reasons for the differences in duration of precursors for the natural hazards shown in Fig. 7.1. [6]
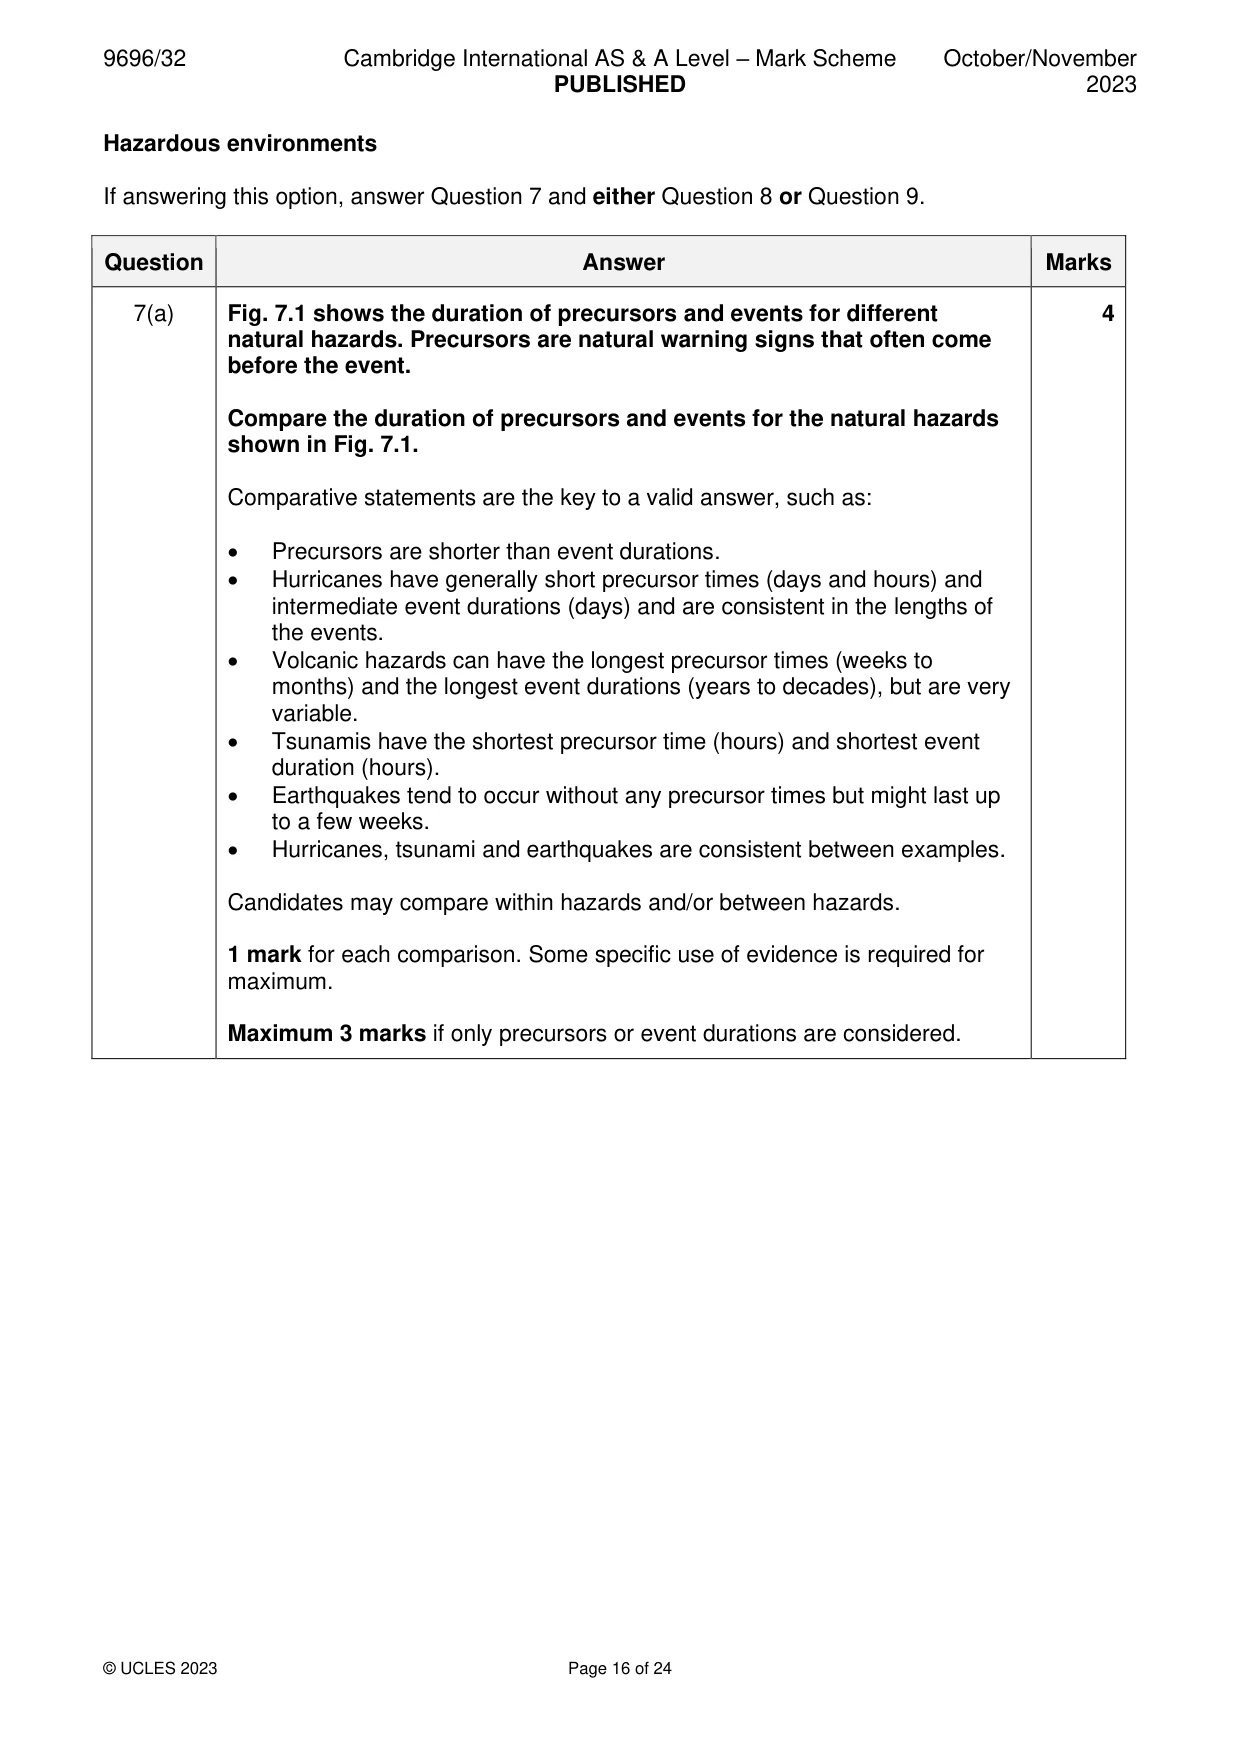
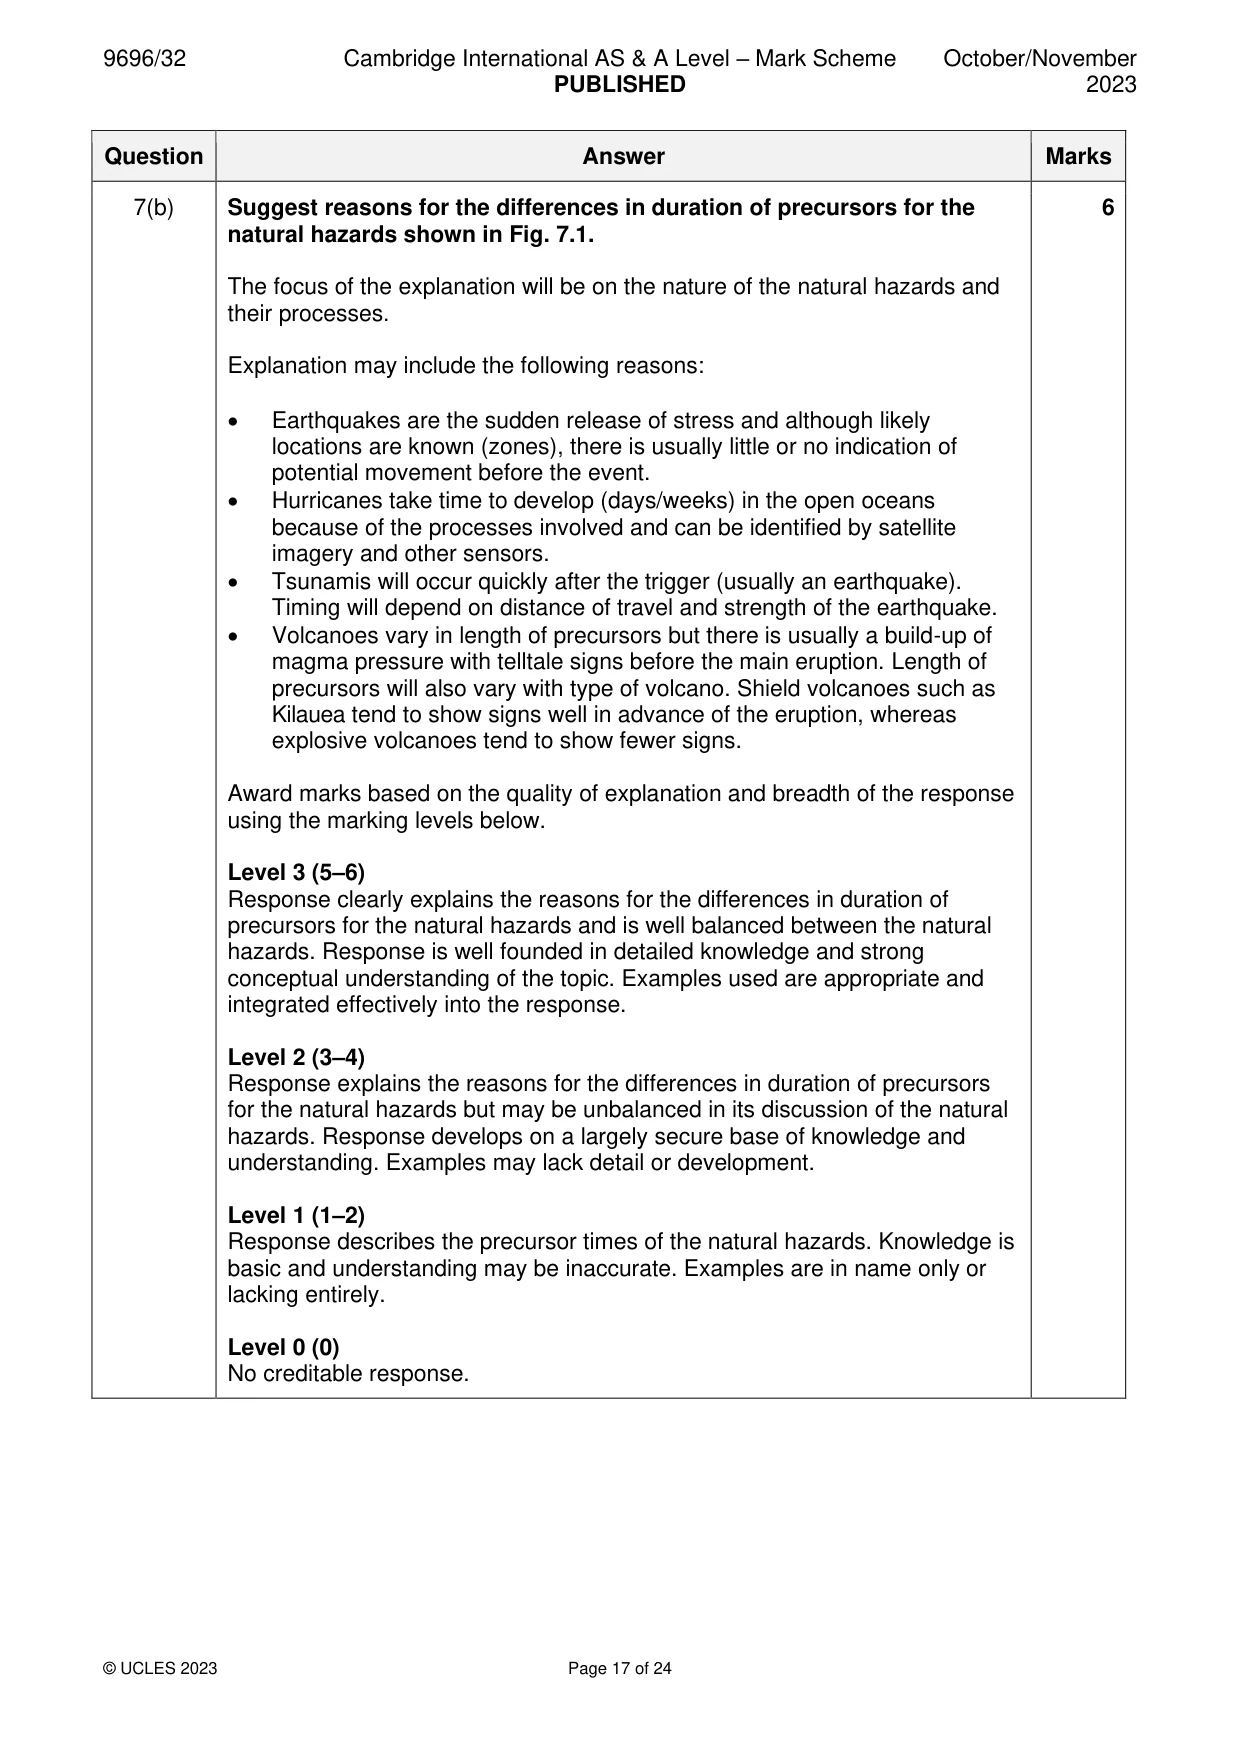
Mark scheme: 7(a) Fig. 7.1 shows the duration of precursors and events for different 4 natural hazards. Precursors are natural warning signs that often come before the event. Compare the duration of precursors and events for the natural hazards shown in Fig. 7.1. Comparative statements are the key to a valid answer, such as: • Precursors are shorter than event durations. • Hurricanes have generally short precursor times (days and hours) and intermediate event durations (days) and are consistent in the lengths of the events. • Volcanic hazards can have the longest precursor times (weeks to months) and the longest event durations (years to decades), but are very variable. • Tsunamis have the shortest precursor time (hours) and shortest event duration (hours). • Earthquakes tend to occur without any precursor times but might last up to a few weeks. • Hurricanes, tsunami and earthquakes are consistent between examples. Candidates may compare within hazards and/or between hazards. 1 mark for each comparison. Some specific use of evidence is required for maximum. Maximum 3 marks if only precursors or event durations are considered. 7(b) Suggest reasons for the differences in duration of precursors for the 6 natural hazards shown in Fig. 7.1. The focus of the explanation will be on the nature of the natural hazards and their processes. Explanation may include the following reasons: • Earthquakes are the sudden release of stress and although likely locations are known (zones), there is usually little or no indication of potential movement before the event. • Hurricanes take time to develop (days/weeks) in the open oceans because of the processes involved and can be identified by satellite imagery and other sensors. • Tsunamis will occur quickly after the trigger (usually an earthquake). Timing will depend on distance of travel and strength of the earthquake. • Volcanoes vary in length of precursors but there is usually a build-up of magma pressure with telltale signs before the main eruption. Length of precursors will also vary with type of volcano. Shield volcanoes such as Kilauea tend to show signs well in advance of the eruption, whereas explosive volcanoes tend to show fewer signs. Award marks based on the quality of explanation and breadth of the response using the marking levels below. Level 3 (5–6) Response clearly explains the reasons for the differences in duration of precursors for the natural hazards and is well balanced between the natural hazards. Response is well founded in detailed knowledge and strong conceptual understanding of the topic. Examples used are appropriate and integrated effectively into the response. Level 2 (3–4) Response explains the reasons for the differences in duration of precursors for the natural hazards but may be unbalanced in its discussion of the natural hazards. Response develops on a largely secure base of knowledge and understanding. Examples may lack detail or development. Level 1 (1–2) Response describes the precursor times of the natural hazards. Knowledge is basic and understanding may be inaccurate. Examples are in name only or lacking entirely. Level 0 (0) No creditable response.
Q8 · ‘Mass movement hazards vary in the extent to which they can be predicted and prepared…
8 ‘Mass movement hazards vary in the extent to which they can be predicted and prepared for.’ How far do you agree with this view? [20]
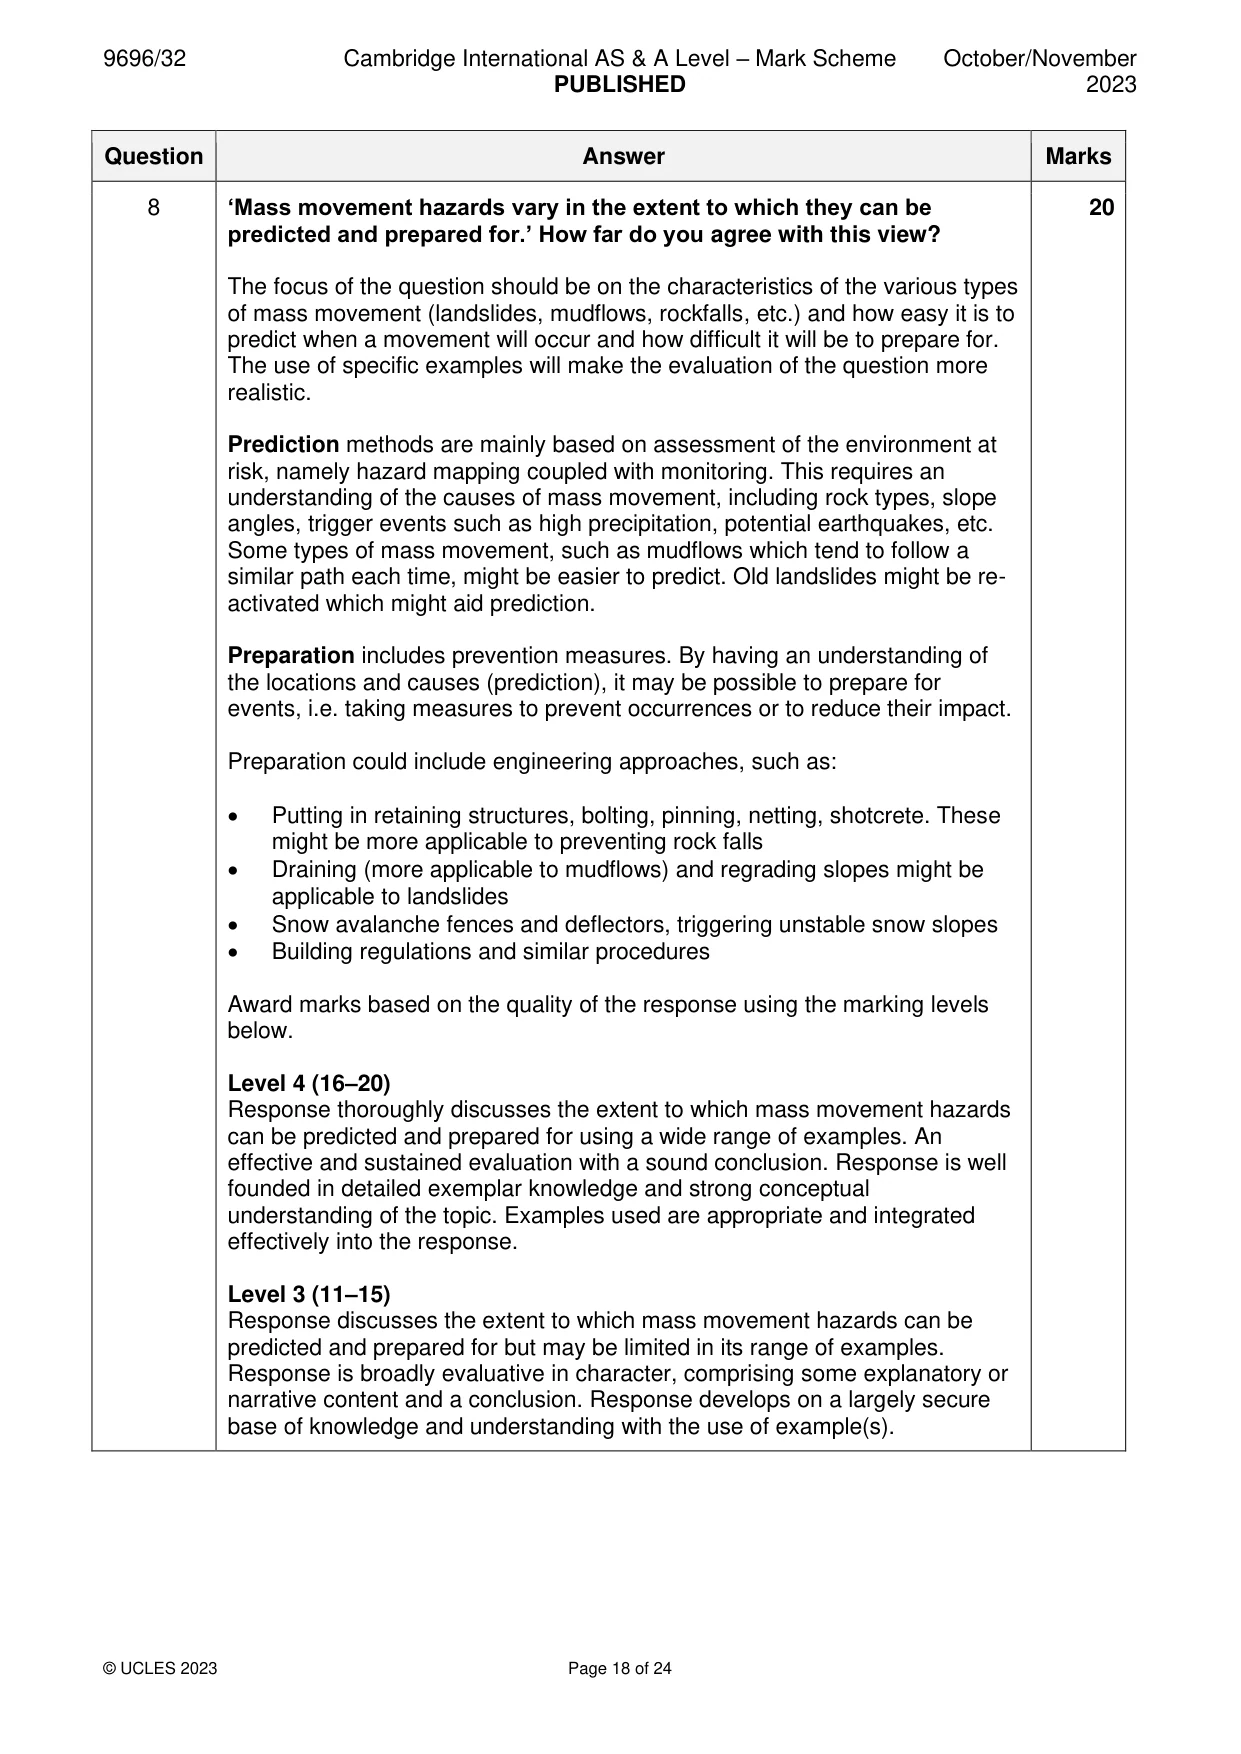
Mark scheme: 8 ‘Mass movement hazards vary in the extent to which they can be 20 predicted and prepared for.’ How far do you agree with this view? The focus of the question should be on the characteristics of the various types of mass movement (landslides, mudflows, rockfalls, etc.) and how easy it is to predict when a movement will occur and how difficult it will be to prepare for. The use of specific examples will make the evaluation of the question more realistic. Prediction methods are mainly based on assessment of the environment at risk, namely hazard mapping coupled with monitoring. This requires an understanding of the causes of mass movement, including rock types, slope angles, trigger events such as high precipitation, potential earthquakes, etc. Some types of mass movement, such as mudflows which tend to follow a similar path each time, might be easier to predict. Old landslides might be re- activated which might aid prediction. Preparation includes prevention measures. By having an understanding of the locations and causes (prediction), it may be possible to prepare for events, i.e. taking measures to prevent occurrences or to reduce their impact. Preparation could include engineering approaches, such as: • Putting in retaining structures, bolting, pinning, netting, shotcrete. These might be more applicable to preventing rock falls • Draining (more applicable to mudflows) and regrading slopes might be applicable to landslides • Snow avalanche fences and deflectors, triggering unstable snow slopes • Building regulations and similar procedures Award marks based on the quality of the response using the marking levels below. Level 4 (16–20) Response thoroughly discusses the extent to which mass movement hazards can be predicted and prepared for using a wide range of examples. An effective and sustained evaluation with a sound conclusion. Response is well founded in detailed exemplar knowledge and strong conceptual understanding of the topic. Examples used are appropriate and integrated effectively into the response. Level 3 (11–15) Response discusses the extent to which mass movement hazards can be predicted and prepared for but may be limited in its range of examples. Response is broadly evaluative in character, comprising some explanatory or narrative content and a conclusion. Response develops on a largely secure base of knowledge and understanding with the use of example(s). 8 Level 2 (6–10) Response demonstrates some knowledge and understanding of how mass movement hazards can be predicted and prepared for but may be unbalanced in the range of examples and explanation. Response is mainly descriptive or explanatory in approach and contains a brief or thinly supported evaluation. Responses without the use of example(s) to support the response will not get above the middle of Level 2 (8 marks). Level 1 (1–5) Response makes a few general points about how mass movement hazards can be predicted and prepared for. A descriptive response comprising a few simple points. Knowledge is basic and understanding may be poor and lack relevance to the question set. Level 0 (0) No creditable response.
Q9 · Assess the extent to which it is possible to prepare for the impacts of earthquakes
9 Assess the extent to which it is possible to prepare for the impacts of earthquakes. [20] Hot arid and semi‑arid environments If answering this option, answer Question 10 and either Question 11 or Question 12.
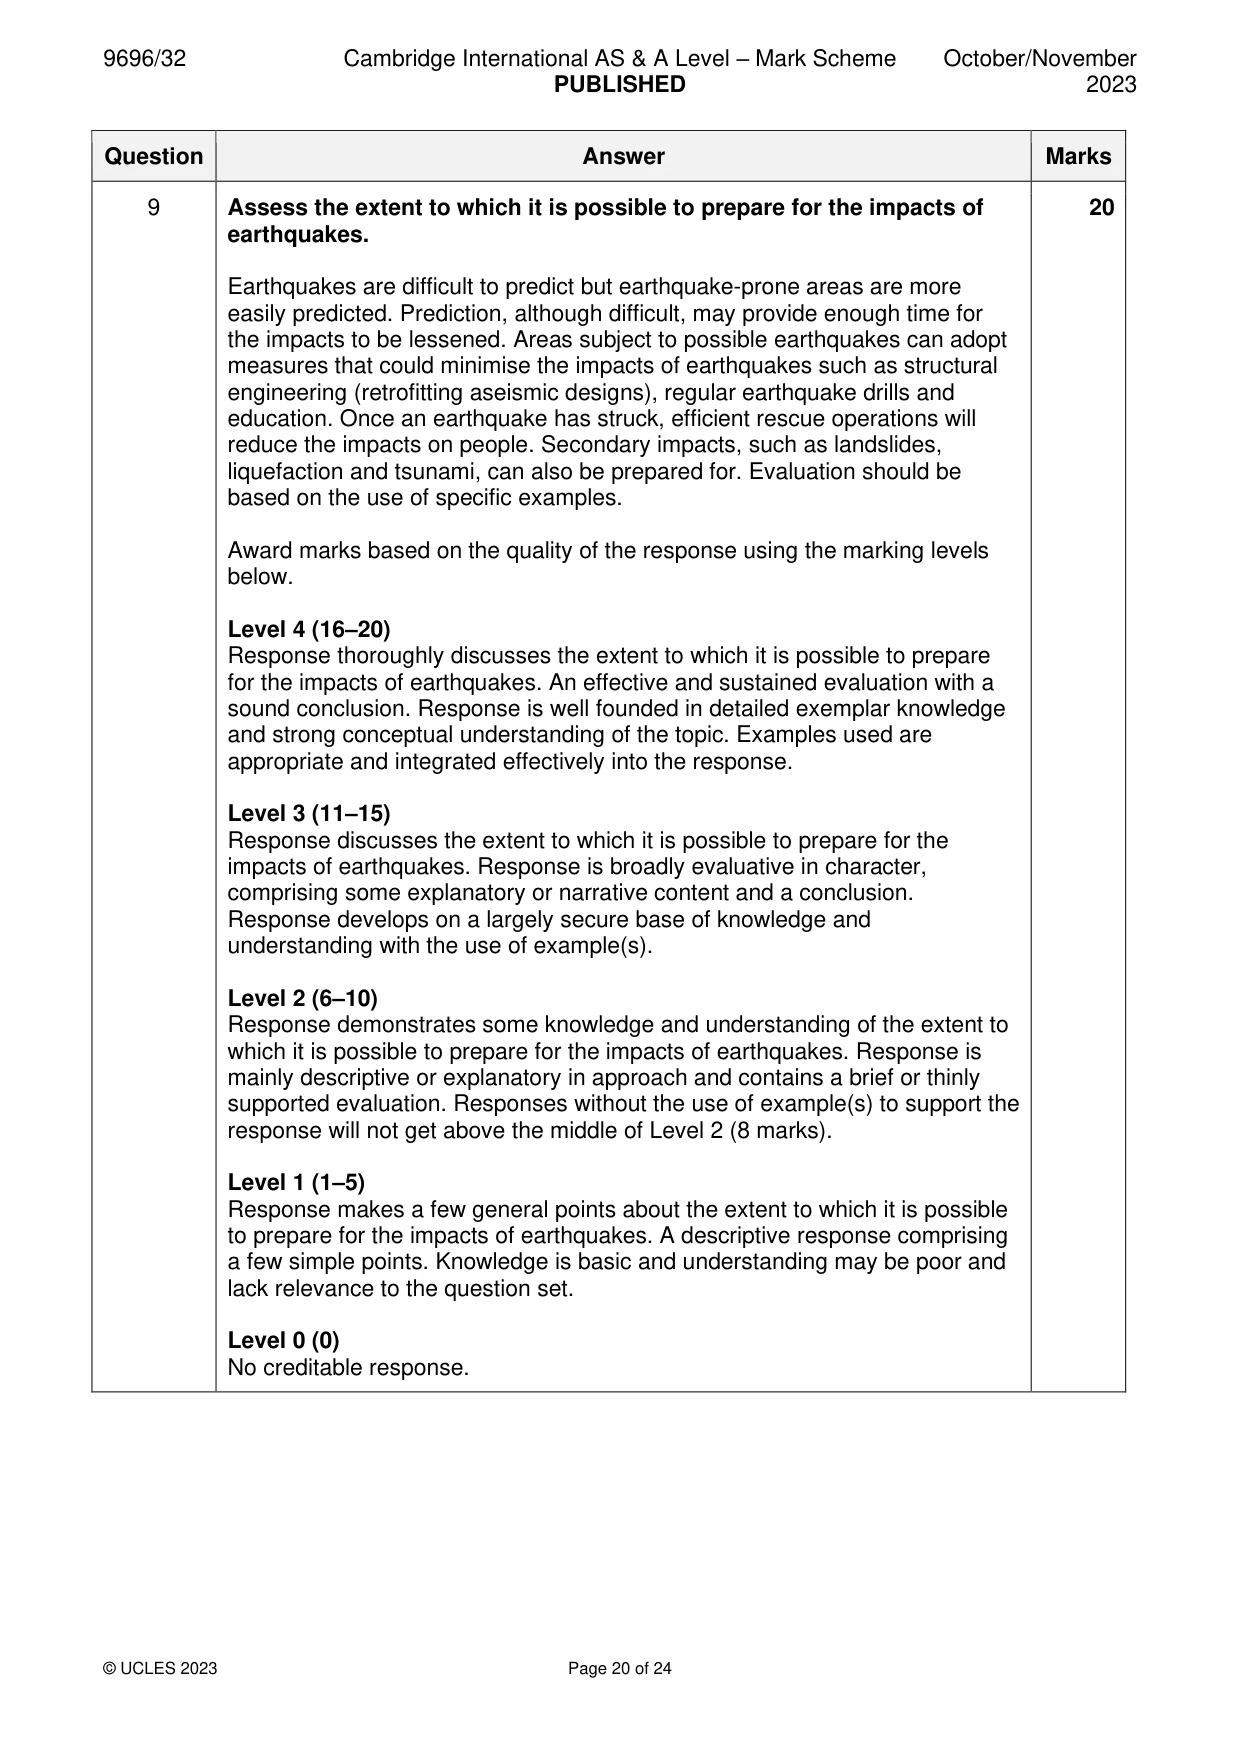
Mark scheme: 9 Assess the extent to which it is possible to prepare for the impacts of 20 earthquakes. Earthquakes are difficult to predict but earthquake-prone areas are more easily predicted. Prediction, although difficult, may provide enough time for the impacts to be lessened. Areas subject to possible earthquakes can adopt measures that could minimise the impacts of earthquakes such as structural engineering (retrofitting aseismic designs), regular earthquake drills and education. Once an earthquake has struck, efficient rescue operations will reduce the impacts on people. Secondary impacts, such as landslides, liquefaction and tsunami, can also be prepared for. Evaluation should be based on the use of specific examples. Award marks based on the quality of the response using the marking levels below. Level 4 (16–20) Response thoroughly discusses the extent to which it is possible to prepare for the impacts of earthquakes. An effective and sustained evaluation with a sound conclusion. Response is well founded in detailed exemplar knowledge and strong conceptual understanding of the topic. Examples used are appropriate and integrated effectively into the response. Level 3 (11–15) Response discusses the extent to which it is possible to prepare for the impacts of earthquakes. Response is broadly evaluative in character, comprising some explanatory or narrative content and a conclusion. Response develops on a largely secure base of knowledge and understanding with the use of example(s). Level 2 (6–10) Response demonstrates some knowledge and understanding of the extent to which it is possible to prepare for the impacts of earthquakes. Response is mainly descriptive or explanatory in approach and contains a brief or thinly supported evaluation. Responses without the use of example(s) to support the response will not get above the middle of Level 2 (8 marks). Level 1 (1–5) Response makes a few general points about the extent to which it is possible to prepare for the impacts of earthquakes. A descriptive response comprising a few simple points. Knowledge is basic and understanding may be poor and lack relevance to the question set. Level 0 (0) No creditable response. Hot arid and semi-arid environments If answering this option, answer Question 10 and either Question 11 or Question 12.
Q10 · A photograph which shows the vegetation in a semi‑arid environment in Arizona, USA
10 Fig. 10.1 is a photograph which shows the vegetation in a semi‑arid environment in Arizona, USA. (a) Describe the vegetation shown in Fig. 10.1. [4] (b) Explain how the vegetation in semi‑arid environments is adapted to drought. [6]
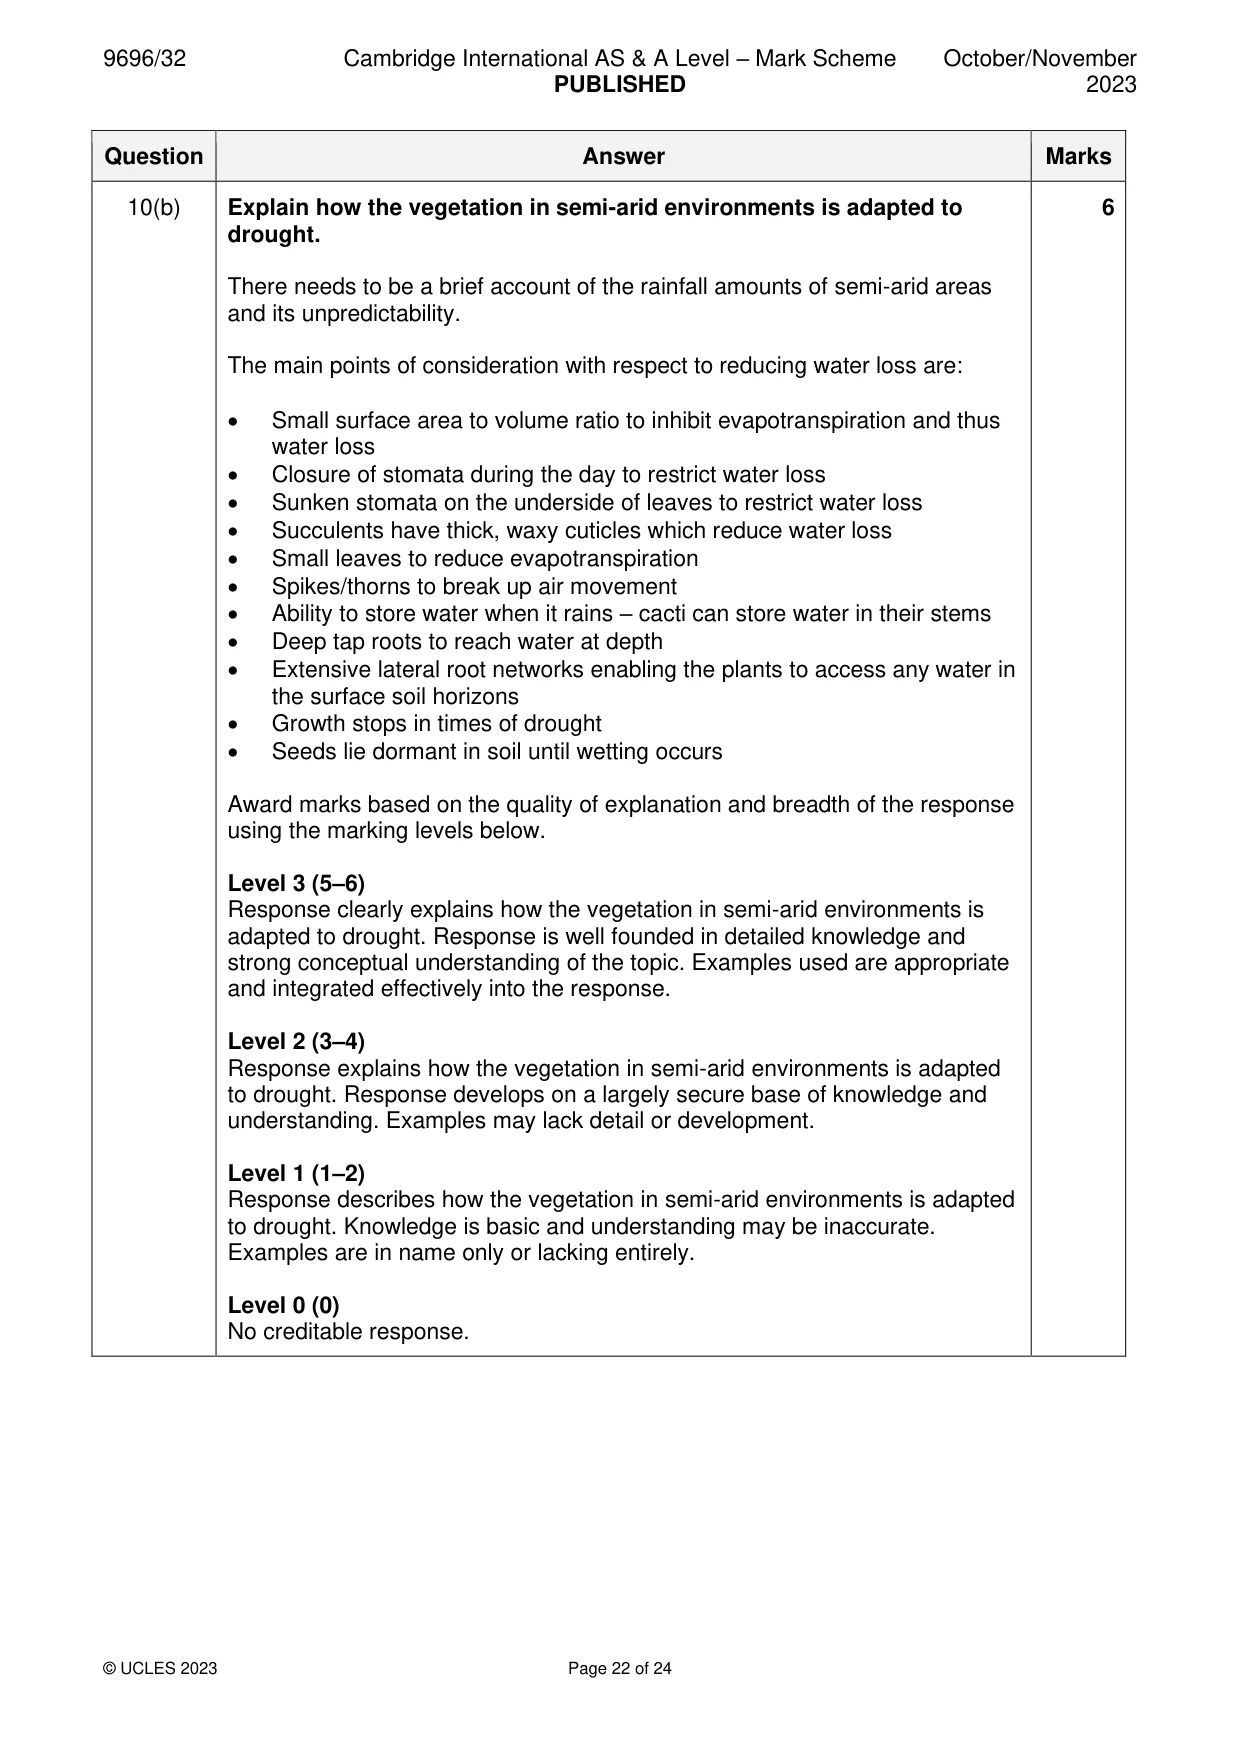
Mark scheme: 10(a) Fig. 10.1 is a photograph which shows the vegetation in a semi-arid 4 environment in Arizona, USA. Describe the vegetation shown in Fig. 10.1. The main points are: • Sparse vegetation • Little or no vegetation in the background, on higher ground/peak • Large/tall, cacti/succulent • Small/medium size bushes/shrubs/trees • Small/thorny shrubs/plants • Tufted grass • Few/small leaves on plants • Bare trees/shrubs 1 mark for each descriptive point. 10(b) Explain how the vegetation in semi-arid environments is adapted to 6 drought. There needs to be a brief account of the rainfall amounts of semi-arid areas and its unpredictability. The main points of consideration with respect to reducing water loss are: • Small surface area to volume ratio to inhibit evapotranspiration and thus water loss • Closure of stomata during the day to restrict water loss • Sunken stomata on the underside of leaves to restrict water loss • Succulents have thick, waxy cuticles which reduce water loss • Small leaves to reduce evapotranspiration • Spikes/thorns to break up air movement • Ability to store water when it rains – cacti can store water in their stems • Deep tap roots to reach water at depth • Extensive lateral root networks enabling the plants to access any water in the surface soil horizons • Growth stops in times of drought • Seeds lie dormant in soil until wetting occurs Award marks based on the quality of explanation and breadth of the response using the marking levels below. Level 3 (5–6) Response clearly explains how the vegetation in semi-arid environments is adapted to drought. Response is well founded in detailed knowledge and strong conceptual understanding of the topic. Examples used are appropriate and integrated effectively into the response. Level 2 (3–4) Response explains how the vegetation in semi-arid environments is adapted to drought. Response develops on a largely secure base of knowledge and understanding. Examples may lack detail or development. Level 1 (1–2) Response describes how the vegetation in semi-arid environments is adapted to drought. Knowledge is basic and understanding may be inaccurate. Examples are in name only or lacking entirely. Level 0 (0) No creditable response.
Q11 · ‘Variations in precipitation are the main problem for the sustainable management of…
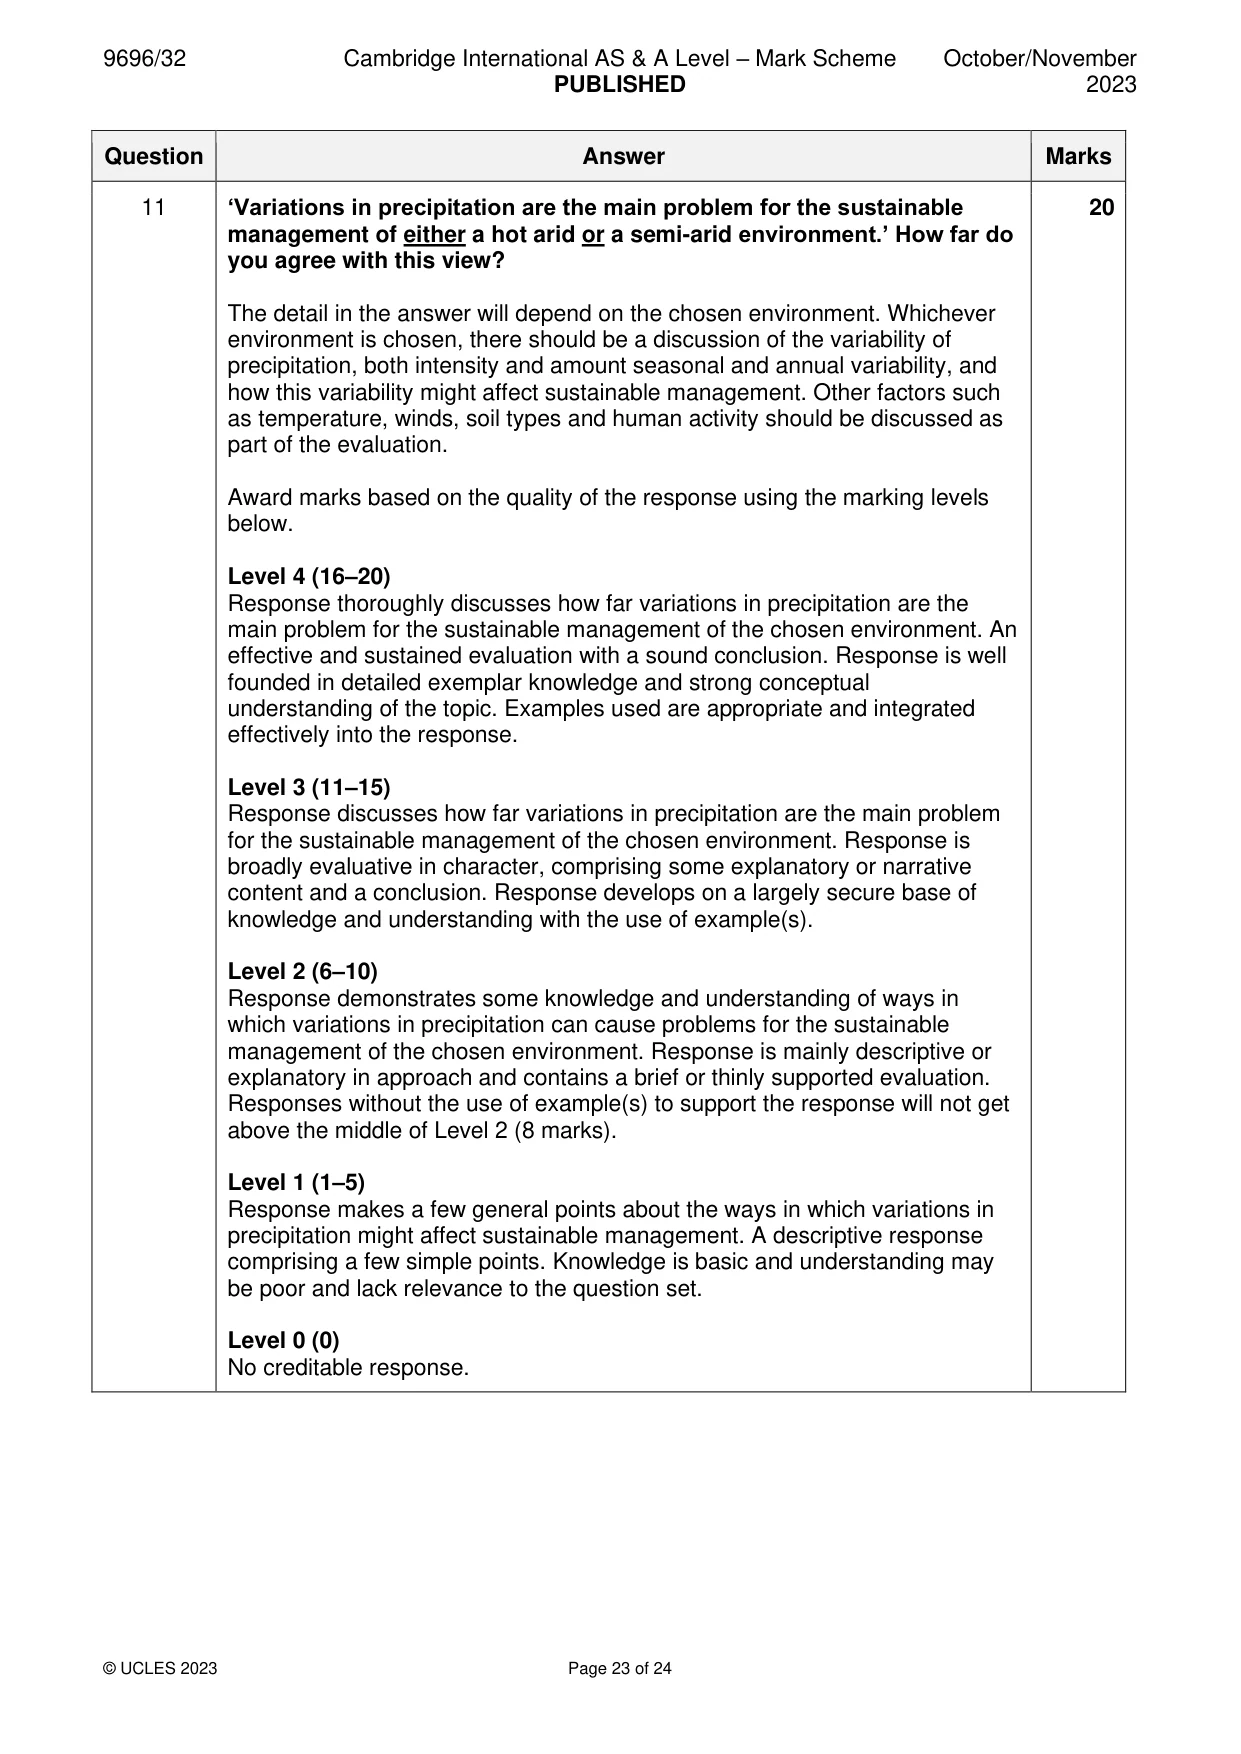
11 ‘Variations in precipitation are the main problem for the sustainable management of either a hot arid or a semi‑arid environment.’ How far do you agree with this view? [20]
Mark scheme: 11 ‘Variations in precipitation are the main problem for the sustainable 20 management of either a hot arid or a semi-arid environment.’ How far do you agree with this view? The detail in the answer will depend on the chosen environment. Whichever environment is chosen, there should be a discussion of the variability of precipitation, both intensity and amount seasonal and annual variability, and how this variability might affect sustainable management. Other factors such as temperature, winds, soil types and human activity should be discussed as part of the evaluation. Award marks based on the quality of the response using the marking levels below. Level 4 (16–20) Response thoroughly discusses how far variations in precipitation are the main problem for the sustainable management of the chosen environment. An effective and sustained evaluation with a sound conclusion. Response is well founded in detailed exemplar knowledge and strong conceptual understanding of the topic. Examples used are appropriate and integrated effectively into the response. Level 3 (11–15) Response discusses how far variations in precipitation are the main problem for the sustainable management of the chosen environment. Response is broadly evaluative in character, comprising some explanatory or narrative content and a conclusion. Response develops on a largely secure base of knowledge and understanding with the use of example(s). Level 2 (6–10) Response demonstrates some knowledge and understanding of ways in which variations in precipitation can cause problems for the sustainable management of the chosen environment. Response is mainly descriptive or explanatory in approach and contains a brief or thinly supported evaluation. Responses without the use of example(s) to support the response will not get above the middle of Level 2 (8 marks). Level 1 (1–5) Response makes a few general points about the ways in which variations in precipitation might affect sustainable management. A descriptive response comprising a few simple points. Knowledge is basic and understanding may be poor and lack relevance to the question set. Level 0 (0) No creditable response.
Q12 · Evaluate the role of wind in the formation of the landforms of hot arid and semi‑arid…
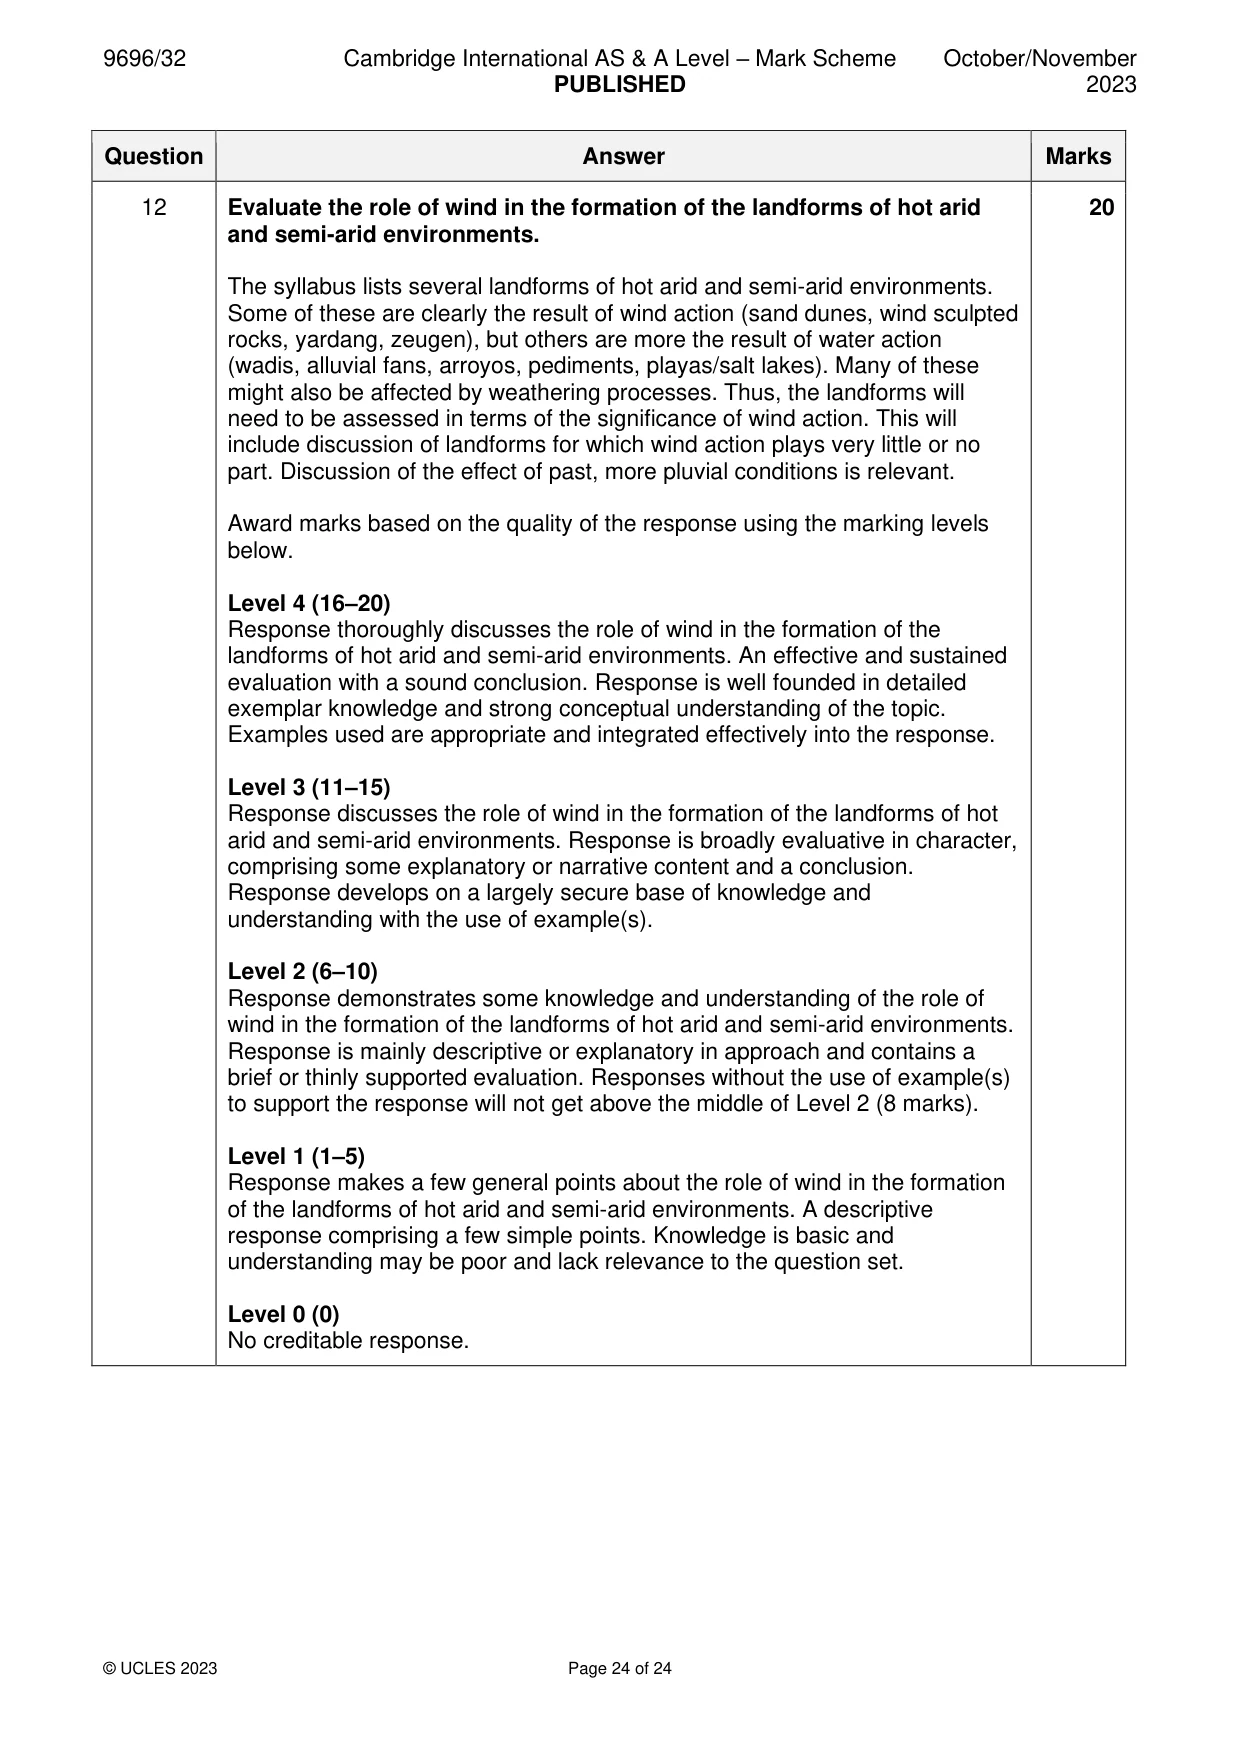
12 Evaluate the role of wind in the formation of the landforms of hot arid and semi‑arid environments. [20]
Mark scheme: 12 Evaluate the role of wind in the formation of the landforms of hot arid 20 and semi-arid environments. The syllabus lists several landforms of hot arid and semi-arid environments. Some of these are clearly the result of wind action (sand dunes, wind sculpted rocks, yardang, zeugen), but others are more the result of water action (wadis, alluvial fans, arroyos, pediments, playas/salt lakes). Many of these might also be affected by weathering processes. Thus, the landforms will need to be assessed in terms of the significance of wind action. This will include discussion of landforms for which wind action plays very little or no part. Discussion of the effect of past, more pluvial conditions is relevant. Award marks based on the quality of the response using the marking levels below. Level 4 (16–20) Response thoroughly discusses the role of wind in the formation of the landforms of hot arid and semi-arid environments. An effective and sustained evaluation with a sound conclusion. Response is well founded in detailed exemplar knowledge and strong conceptual understanding of the topic. Examples used are appropriate and integrated effectively into the response. Level 3 (11–15) Response discusses the role of wind in the formation of the landforms of hot arid and semi-arid environments. Response is broadly evaluative in character, comprising some explanatory or narrative content and a conclusion. Response develops on a largely secure base of knowledge and understanding with the use of example(s). Level 2 (6–10) Response demonstrates some knowledge and understanding of the role of wind in the formation of the landforms of hot arid and semi-arid environments. Response is mainly descriptive or explanatory in approach and contains a brief or thinly supported evaluation. Responses without the use of example(s) to support the response will not get above the middle of Level 2 (8 marks). Level 1 (1–5) Response makes a few general points about the role of wind in the formation of the landforms of hot arid and semi-arid environments. A descriptive response comprising a few simple points. Knowledge is basic and understanding may be poor and lack relevance to the question set. Level 0 (0) No creditable response.
What was in this paper
The subtopics covered by these 12 questions, and how many questions each got. Open one in a new tab to see every Cambridge question on it.
1Coastal processes1Hazards resulting from mass movements1Hazards resulting from tectonic processes1Humid tropical (rainforest) ecosystems and seasonally humid tropical (savanna) ecosystems1Landforms of hot arid and semi-arid environments1Soils and vegetation1Sustainable management in hazardous environments1Sustainable management of coasts1Sustainable management of hot arid and semi-arid environments1Sustainable management of tropical environments1Tropical climates1What you needed in this session
Cambridge’s own grade thresholds for 2023 Oct/Nov, Paper 3 · Variant 2. A higher threshold means an easier paper — the bar moves with how the cohort did.