Cambridge A Level Geography 9696 — 2025 Oct/Nov Paper 3 · Variant 3
9696/33/O/N/25 · 12 questions · 60 marks · ≈68 min
The question paper and its mark scheme, free to read here and free to download. This is Cambridge’s own paper, exactly as it was sat.
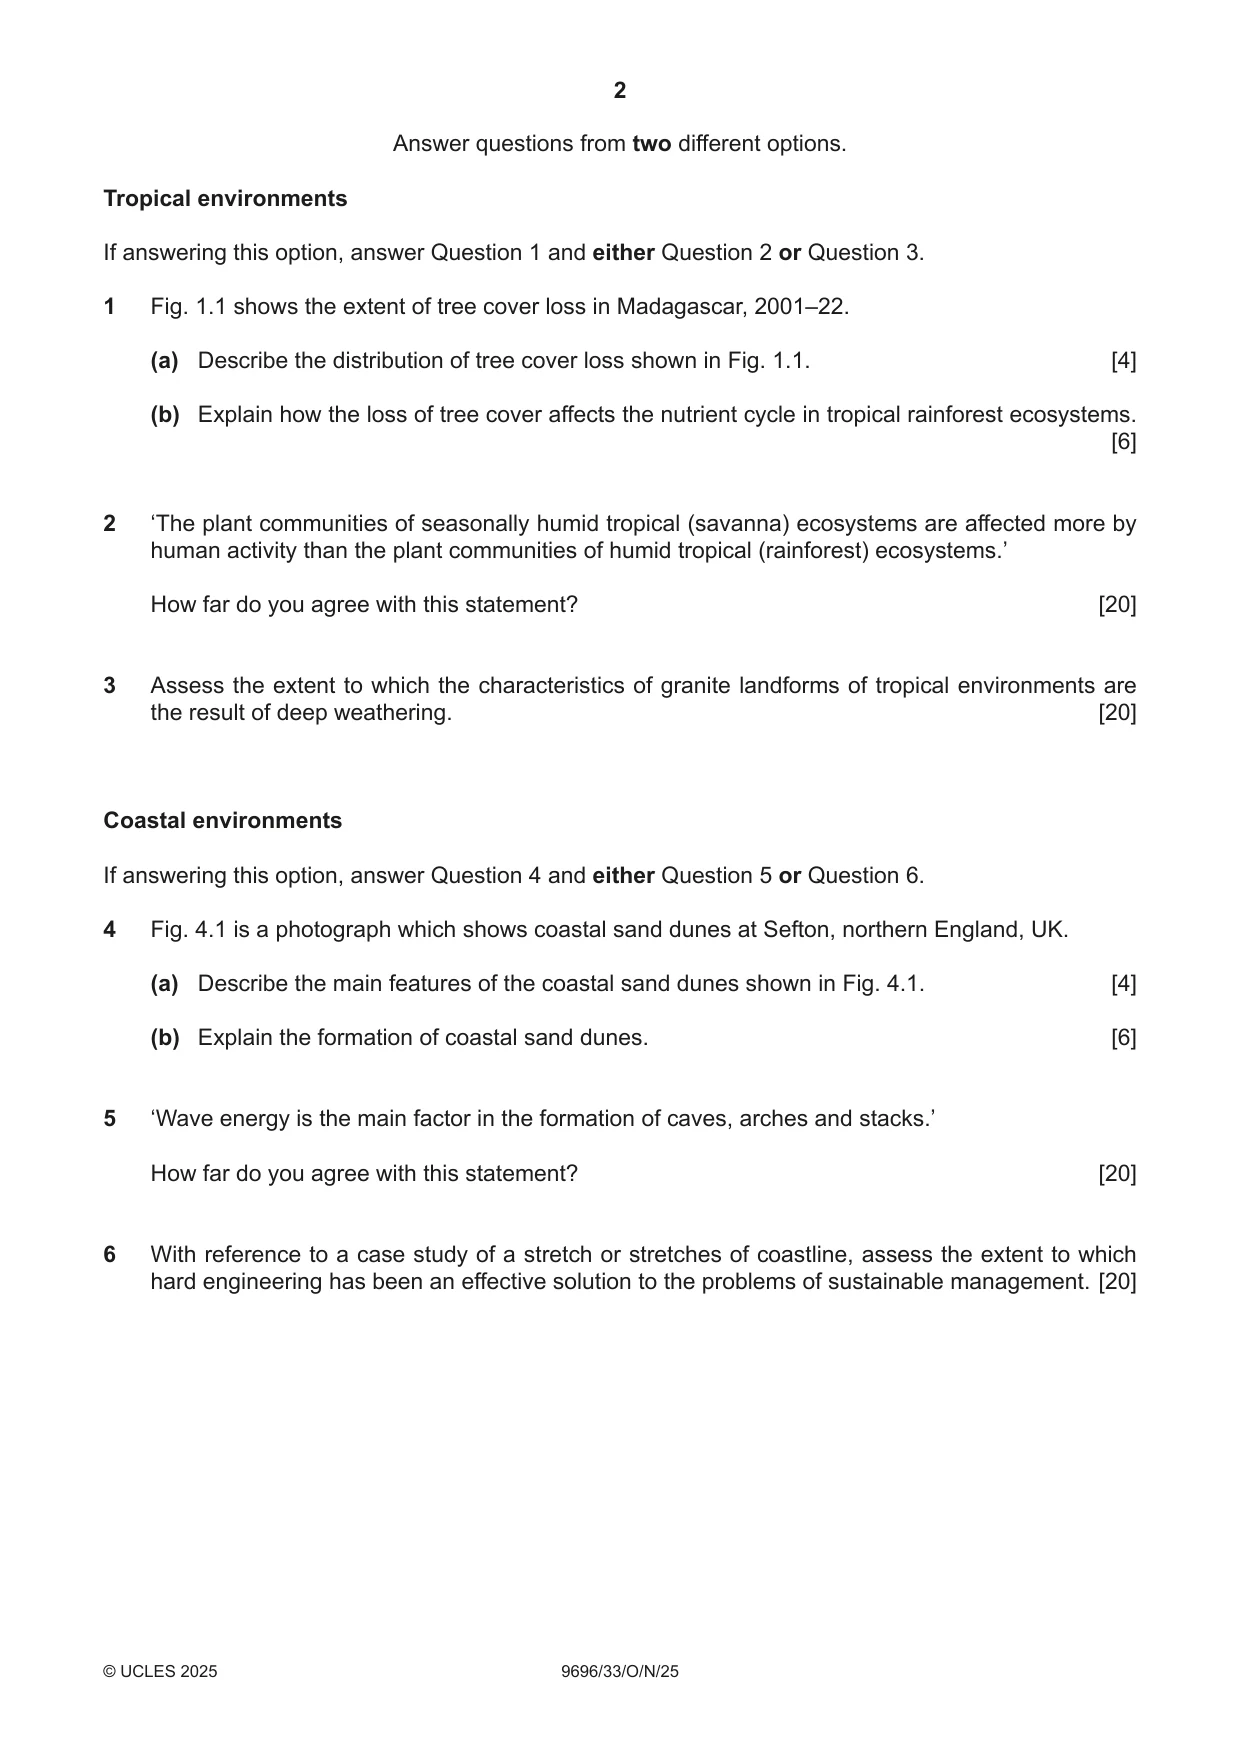
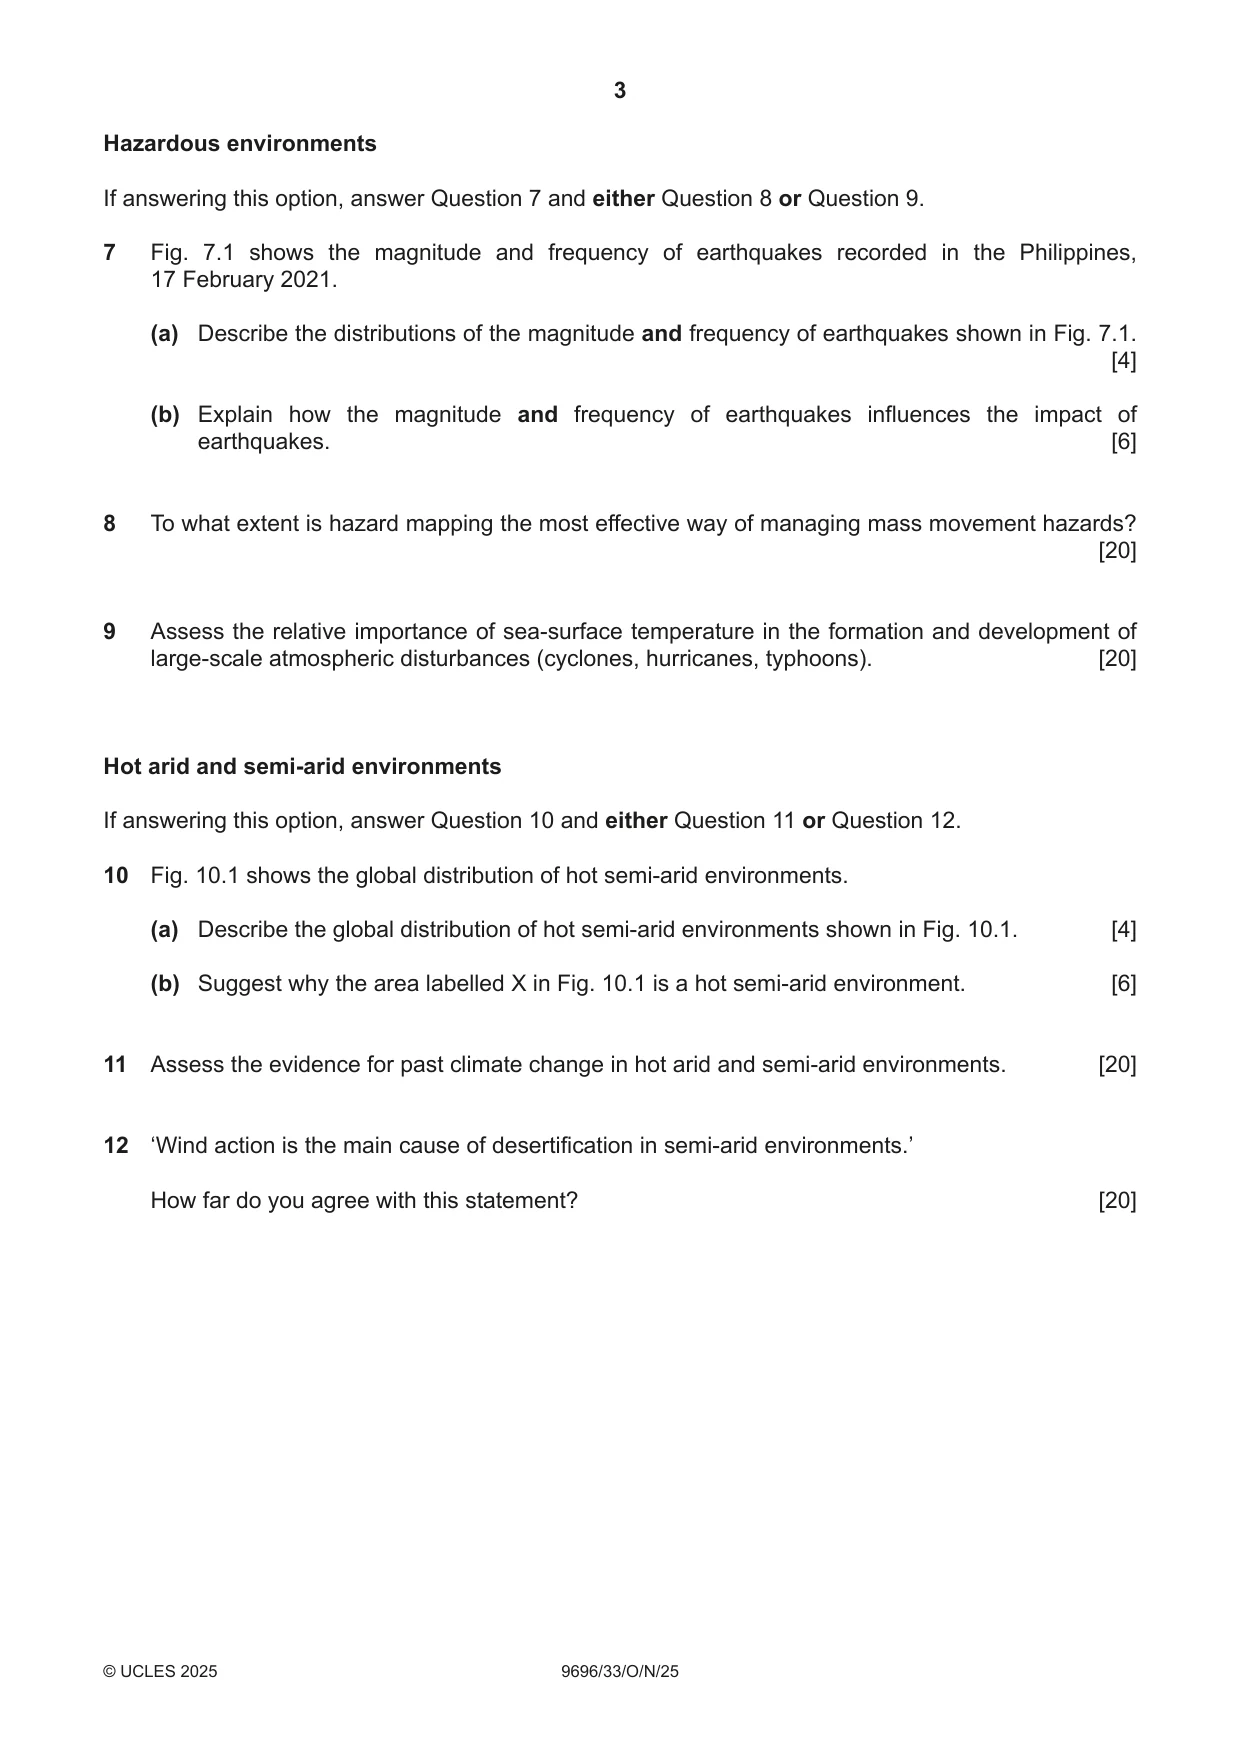
Question paper4 pages

Mark scheme26 pages
Answers below. Sit the paper first if you are practising.








Questions as text
Q1 · The extent of tree cover loss in Madagascar, 2001–22
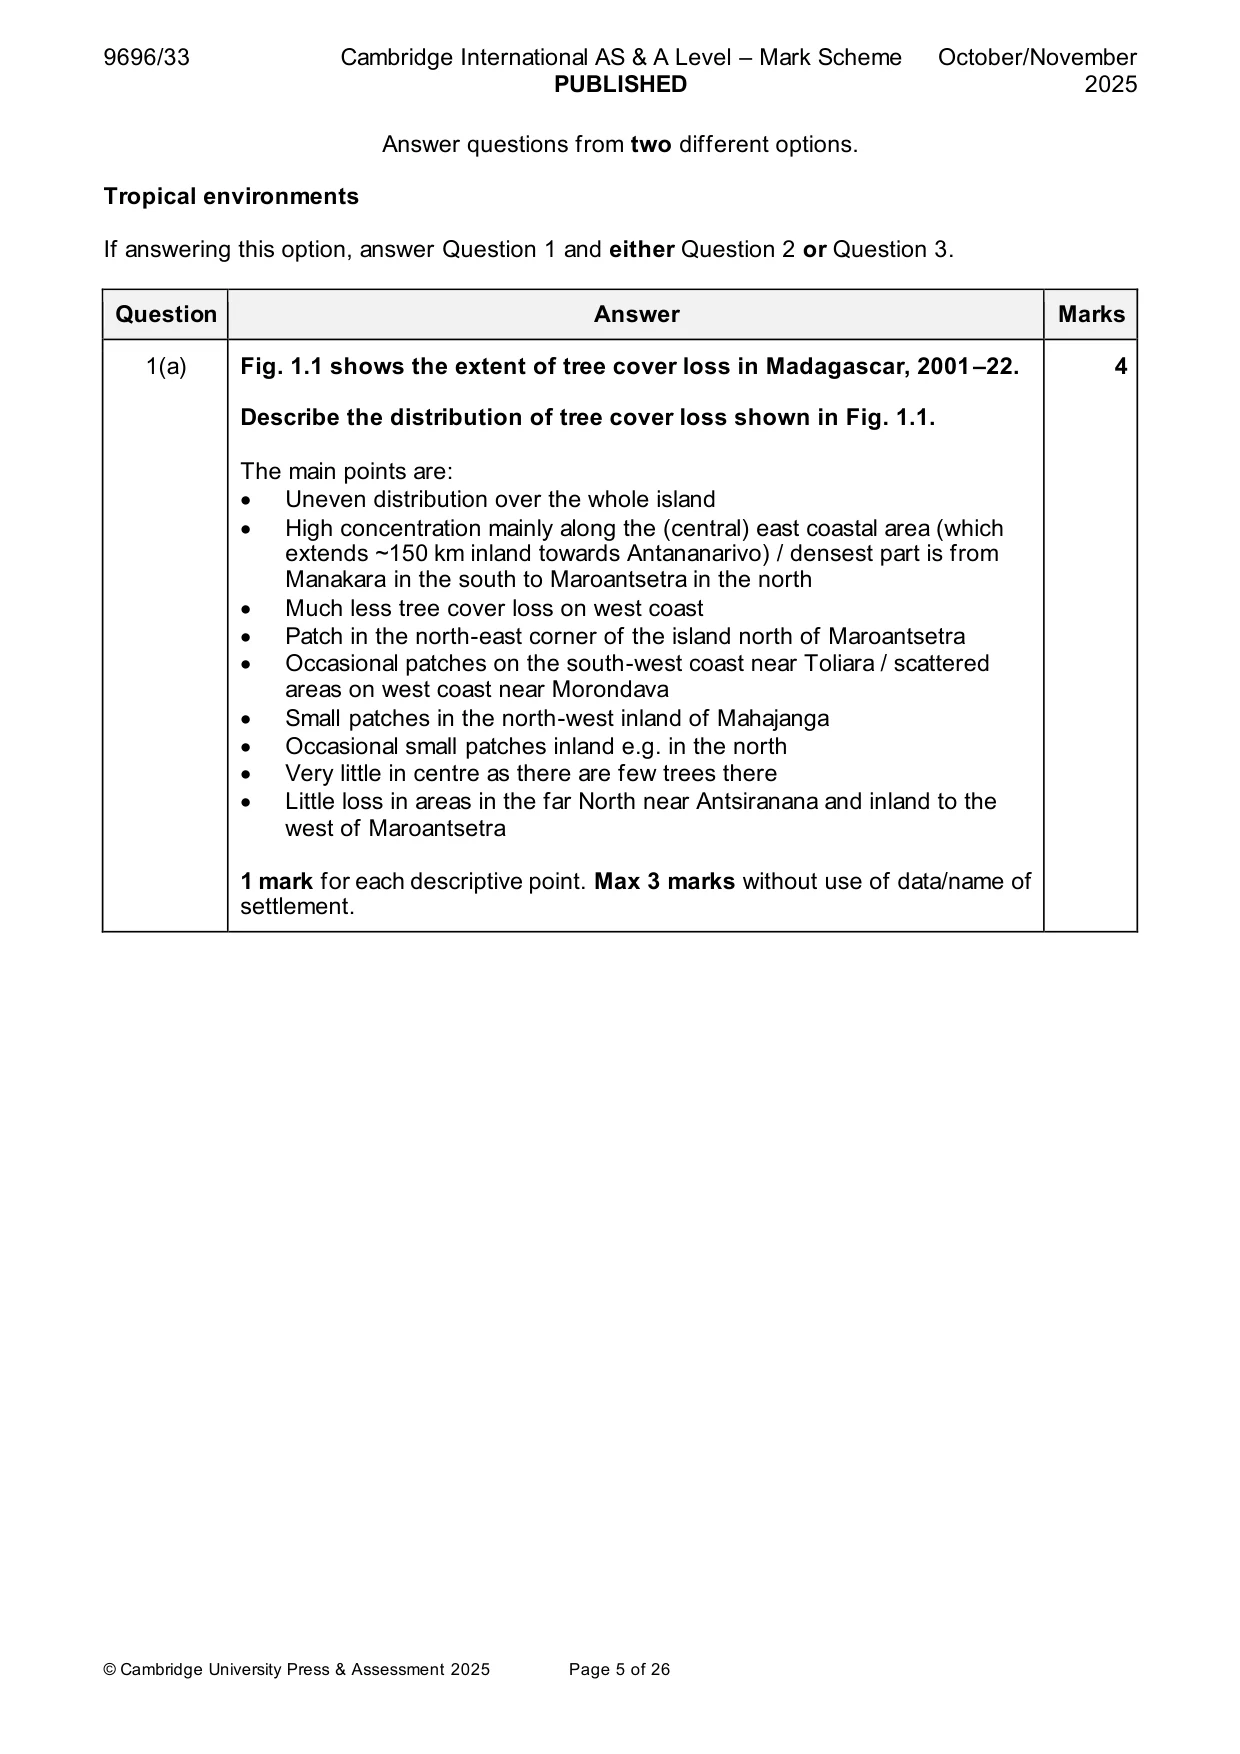
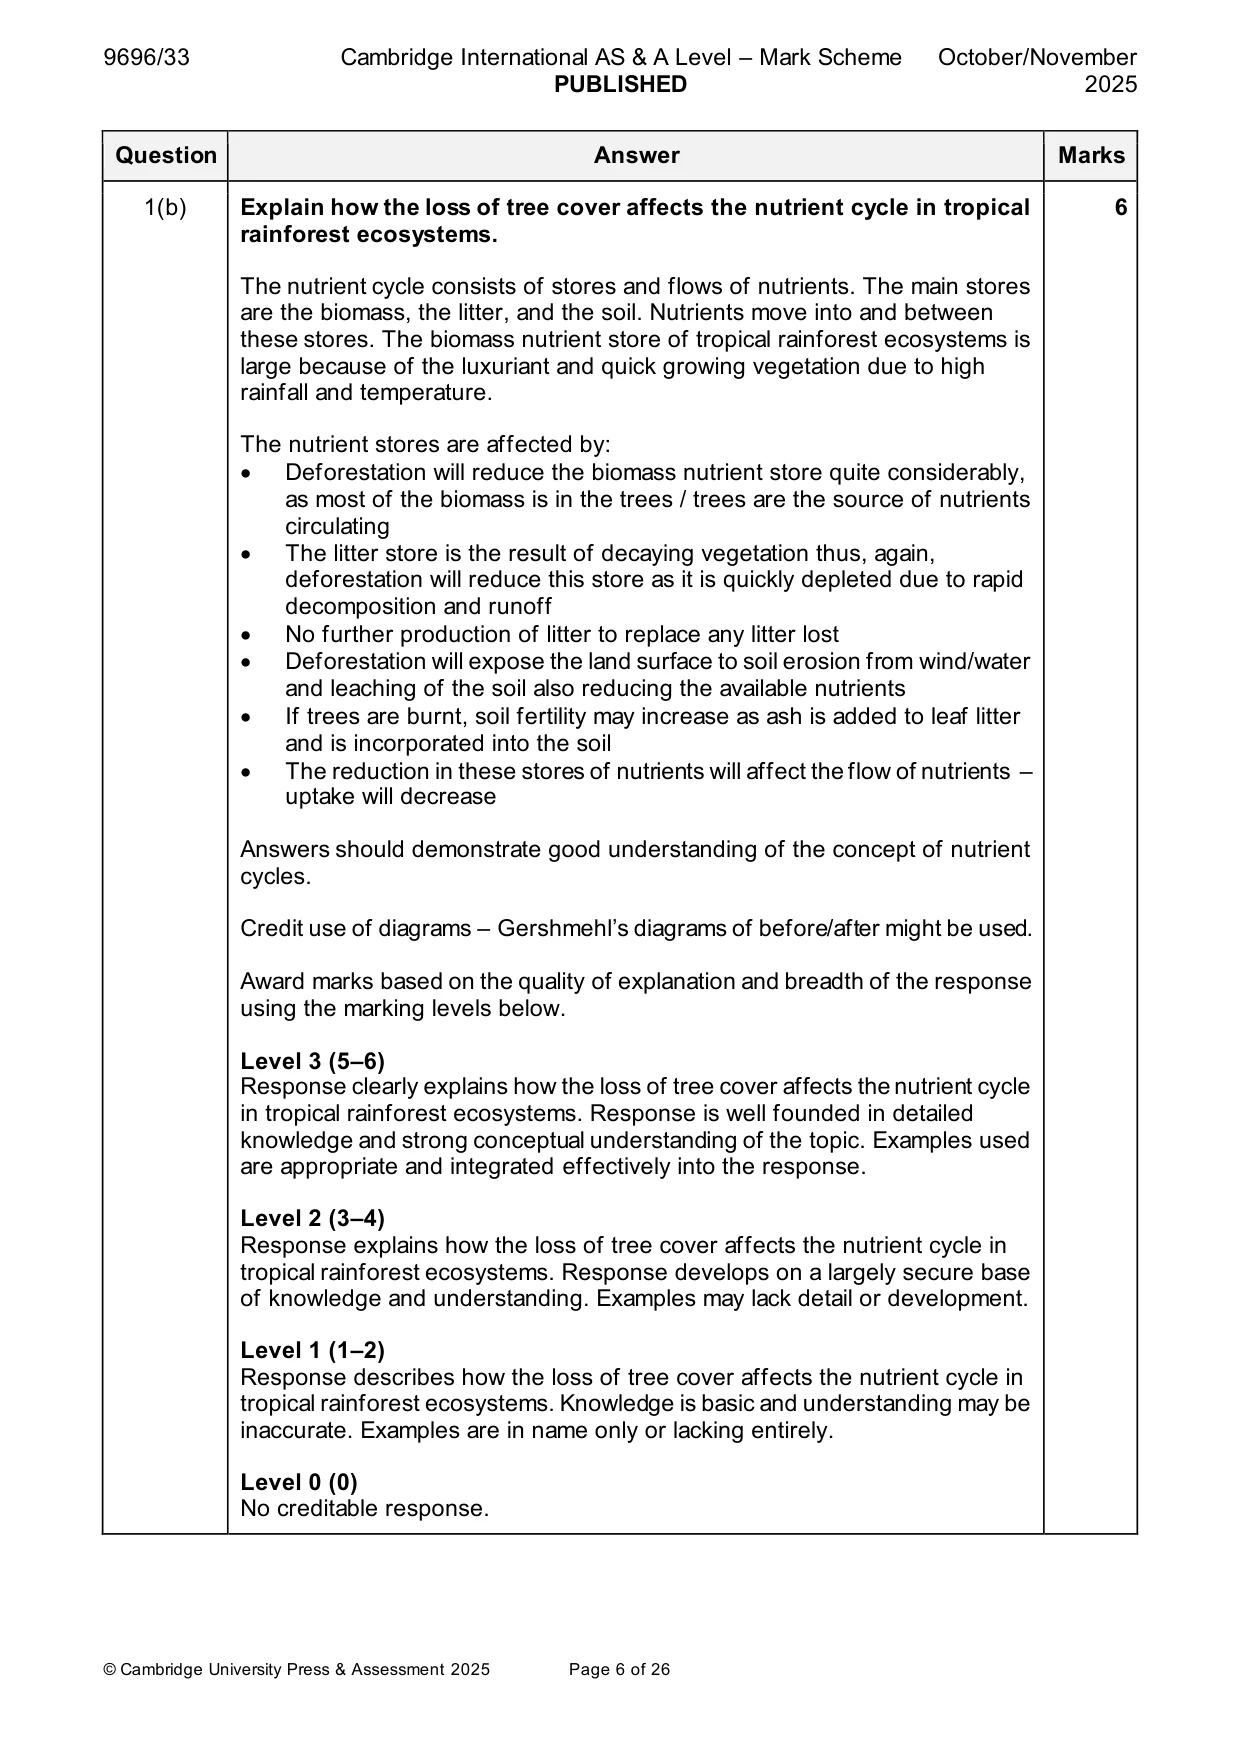
1 Fig. 1.1 shows the extent of tree cover loss in Madagascar, 2001–22. (a) Describe the distribution of tree cover loss shown in Fig. 1.1. [4] (b) Explain how the loss of tree cover affects the nutrient cycle in tropical rainforest ecosystems. [6]
Mark scheme: Question Answer Marks 1(a) Fig. 1.1 shows the extent of tree cover loss in Madagascar, 2001–22. 4 Describe the distribution of tree cover loss shown in Fig. 1.1. The main points are: • Uneven distribution over the whole island • High concentration mainly along the (central) east coastal area (which extends ~150 km inland towards Antananarivo) / densest part is from Manakara in the south to Maroantsetra in the north • Much less tree cover loss on west coast • Patch in the north-east corner of the island north of Maroantsetra • Occasional patches on the south-west coast near Toliara / scattered areas on west coast near Morondava • Small patches in the north-west inland of Mahajanga • Occasional small patches inland e.g. in the north • Very little in centre as there are few trees there • Little loss in areas in the far North near Antsiranana and inland to the west of Maroantsetra 1 mark for each descriptive point. Max 3 marks without use of data/name of settlement. 1(b) Explain how the loss of tree cover affects the nutrient cycle in tropical 6 rainforest ecosystems. The nutrient cycle consists of stores and flows of nutrients. The main stores are the biomass, the litter, and the soil. Nutrients move into and between these stores. The biomass nutrient store of tropical rainforest ecosystems is large because of the luxuriant and quick growing vegetation due to high rainfall and temperature. The nutrient stores are affected by: • Deforestation will reduce the biomass nutrient store quite considerably, as most of the biomass is in the trees / trees are the source of nutrients circulating • The litter store is the result of decaying vegetation thus, again, deforestation will reduce this store as it is quickly depleted due to rapid decomposition and runoff • No further production of litter to replace any litter lost • Deforestation will expose the land surface to soil erosion from wind/water and leaching of the soil also reducing the available nutrients • If trees are burnt, soil fertility may increase as ash is added to leaf litter and is incorporated into the soil • The reduction in these stores of nutrients will affect the flow of nutrients – uptake will decrease Answers should demonstrate good understanding of the concept of nutrient cycles. Credit use of diagrams – Gershmehl’s diagrams of before/after might be used. Award marks based on the quality of explanation and breadth of the response using the marking levels below. Level 3 (5–6) Response clearly explains how the loss of tree cover affects the nutrient cycle in tropical rainforest ecosystems. Response is well founded in detailed knowledge and strong conceptual understanding of the topic. Examples used are appropriate and integrated effectively into the response. Level 2 (3–4) Response explains how the loss of tree cover affects the nutrient cycle in tropical rainforest ecosystems. Response develops on a largely secure base of knowledge and understanding. Examples may lack detail or development. Level 1 (1–2) Response describes how the loss of tree cover affects the nutrient cycle in tropical rainforest ecosystems. Knowledge is basic and understanding may be inaccurate. Examples are in name only or lacking entirely. Level 0 (0) No creditable response.
Q2 · ‘The plant communities of seasonally humid tropical (savanna) ecosystems are affected…
2 ‘The plant communities of seasonally humid tropical (savanna) ecosystems are affected more by human activity than the plant communities of humid tropical (rainforest) ecosystems.’ How far do you agree with this statement? [20]
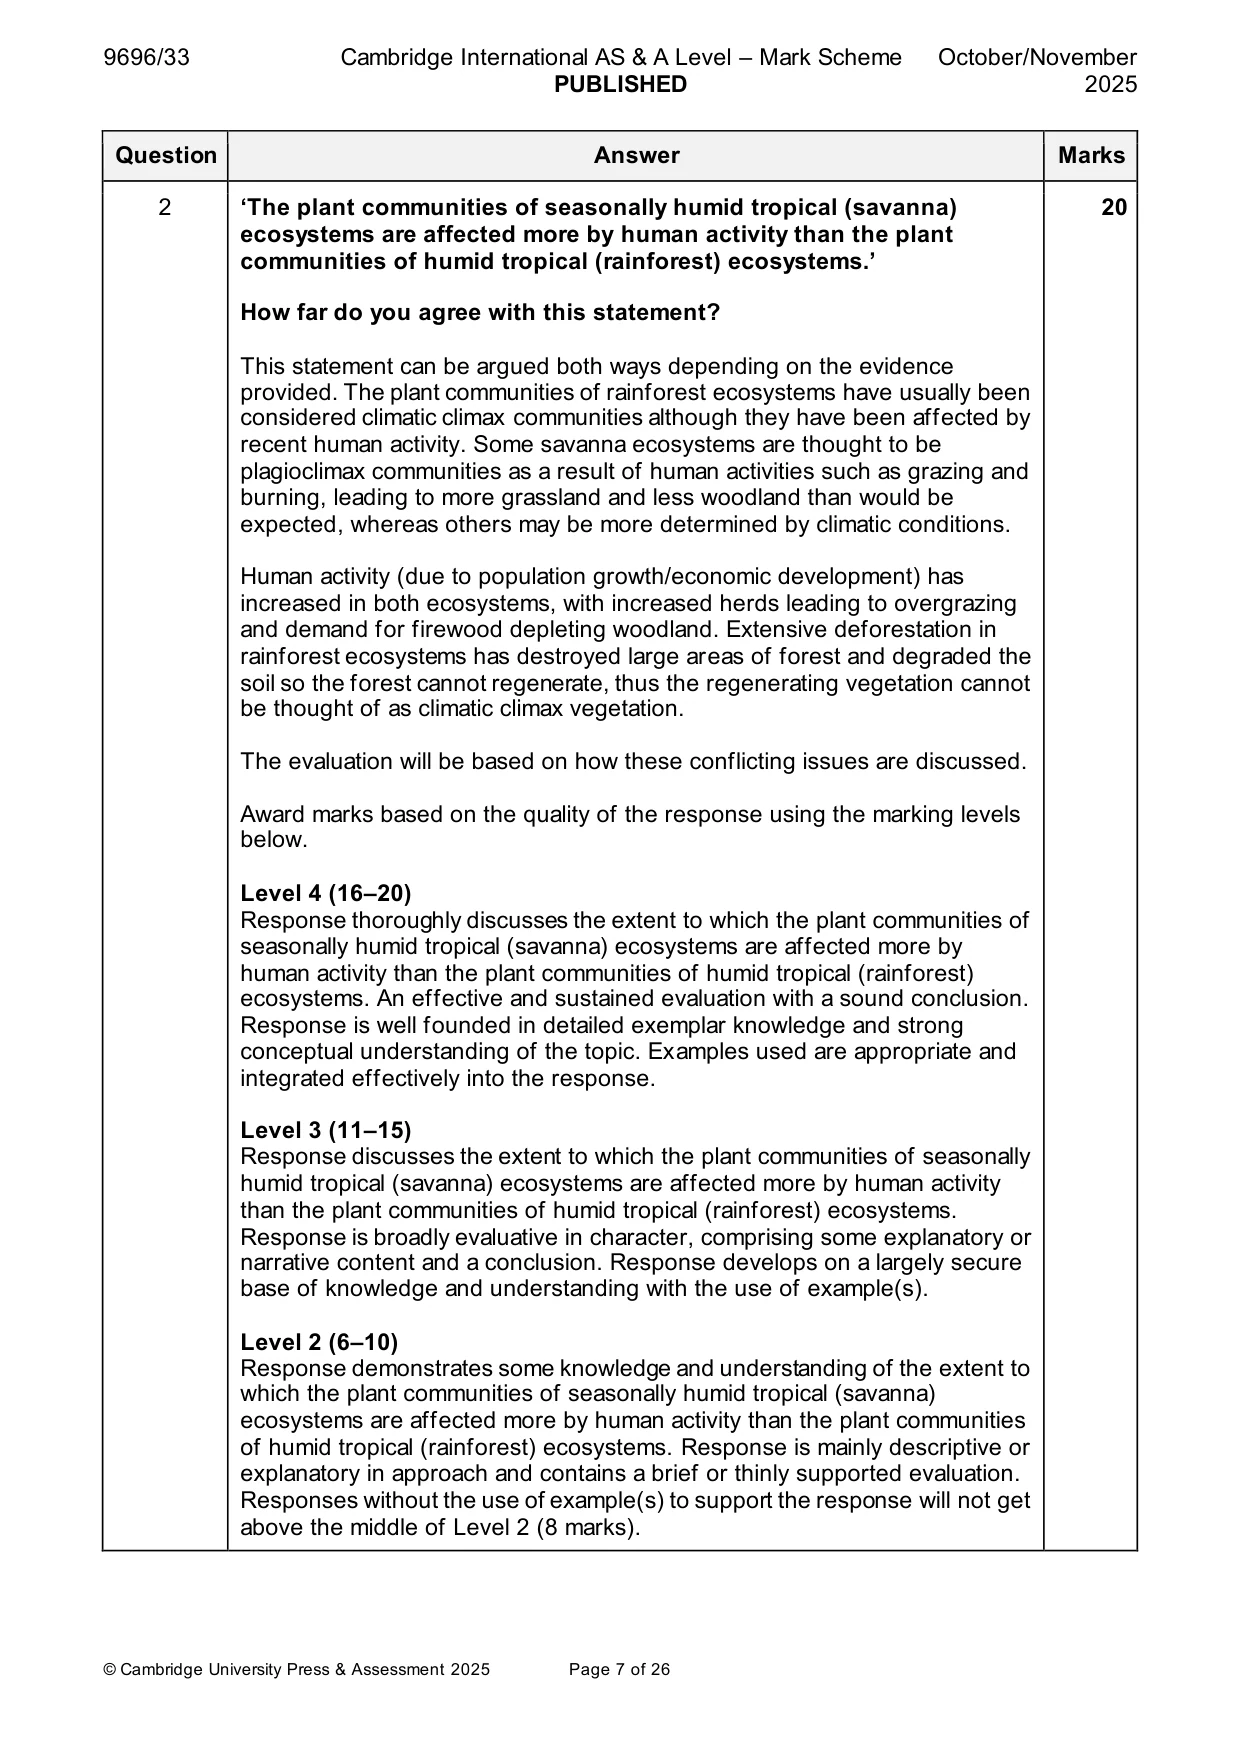
Mark scheme: 2 ‘The plant communities of seasonally humid tropical (savanna) 20 ecosystems are affected more by human activity than the plant communities of humid tropical (rainforest) ecosystems.’ How far do you agree with this statement? This statement can be argued both ways depending on the evidence provided. The plant communities of rainforest ecosystems have usually been considered climatic climax communities although they have been affected by recent human activity. Some savanna ecosystems are thought to be plagioclimax communities as a result of human activities such as grazing and burning, leading to more grassland and less woodland than would be expected, whereas others may be more determined by climatic conditions. Human activity (due to population growth/economic development) has increased in both ecosystems, with increased herds leading to overgrazing and demand for firewood depleting woodland. Extensive deforestation in rainforest ecosystems has destroyed large areas of forest and degraded the soil so the forest cannot regenerate, thus the regenerating vegetation cannot be thought of as climatic climax vegetation. The evaluation will be based on how these conflicting issues are discussed. Award marks based on the quality of the response using the marking levels below. Level 4 (16–20) Response thoroughly discusses the extent to which the plant communities of seasonally humid tropical (savanna) ecosystems are affected more by human activity than the plant communities of humid tropical (rainforest) ecosystems. An effective and sustained evaluation with a sound conclusion. Response is well founded in detailed exemplar knowledge and strong conceptual understanding of the topic. Examples used are appropriate and integrated effectively into the response. Level 3 (11–15) Response discusses the extent to which the plant communities of seasonally humid tropical (savanna) ecosystems are affected more by human activity than the plant communities of humid tropical (rainforest) ecosystems. Response is broadly evaluative in character, comprising some explanatory or narrative content and a conclusion. Response develops on a largely secure base of knowledge and understanding with the use of example(s). Level 2 (6–10) Response demonstrates some knowledge and understanding of the extent to which the plant communities of seasonally humid tropical (savanna) ecosystems are affected more by human activity than the plant communities of humid tropical (rainforest) ecosystems. Response is mainly descriptive or explanatory in approach and contains a brief or thinly supported evaluation. Responses without the use of example(s) to support the response will not get above the middle of Level 2 (8 marks). 2 Level 1 (1–5) Response makes a few general points about whether the plant communities of seasonally humid tropical (savanna) ecosystems are affected more by human activity than the plant communities of humid tropical (rainforest) ecosystems. A descriptive response comprising a few simple points. Knowledge is basic and understanding may be poor and lack relevance to the question set. Level 0 (0) No creditable response.
Q3 · Assess the extent to which the characteristics of granite landforms of tropical…
3 Assess the extent to which the characteristics of granite landforms of tropical environments are the result of deep weathering. [20] Coastal environments If answering this option, answer Question 4 and either Question 5 or Question 6.
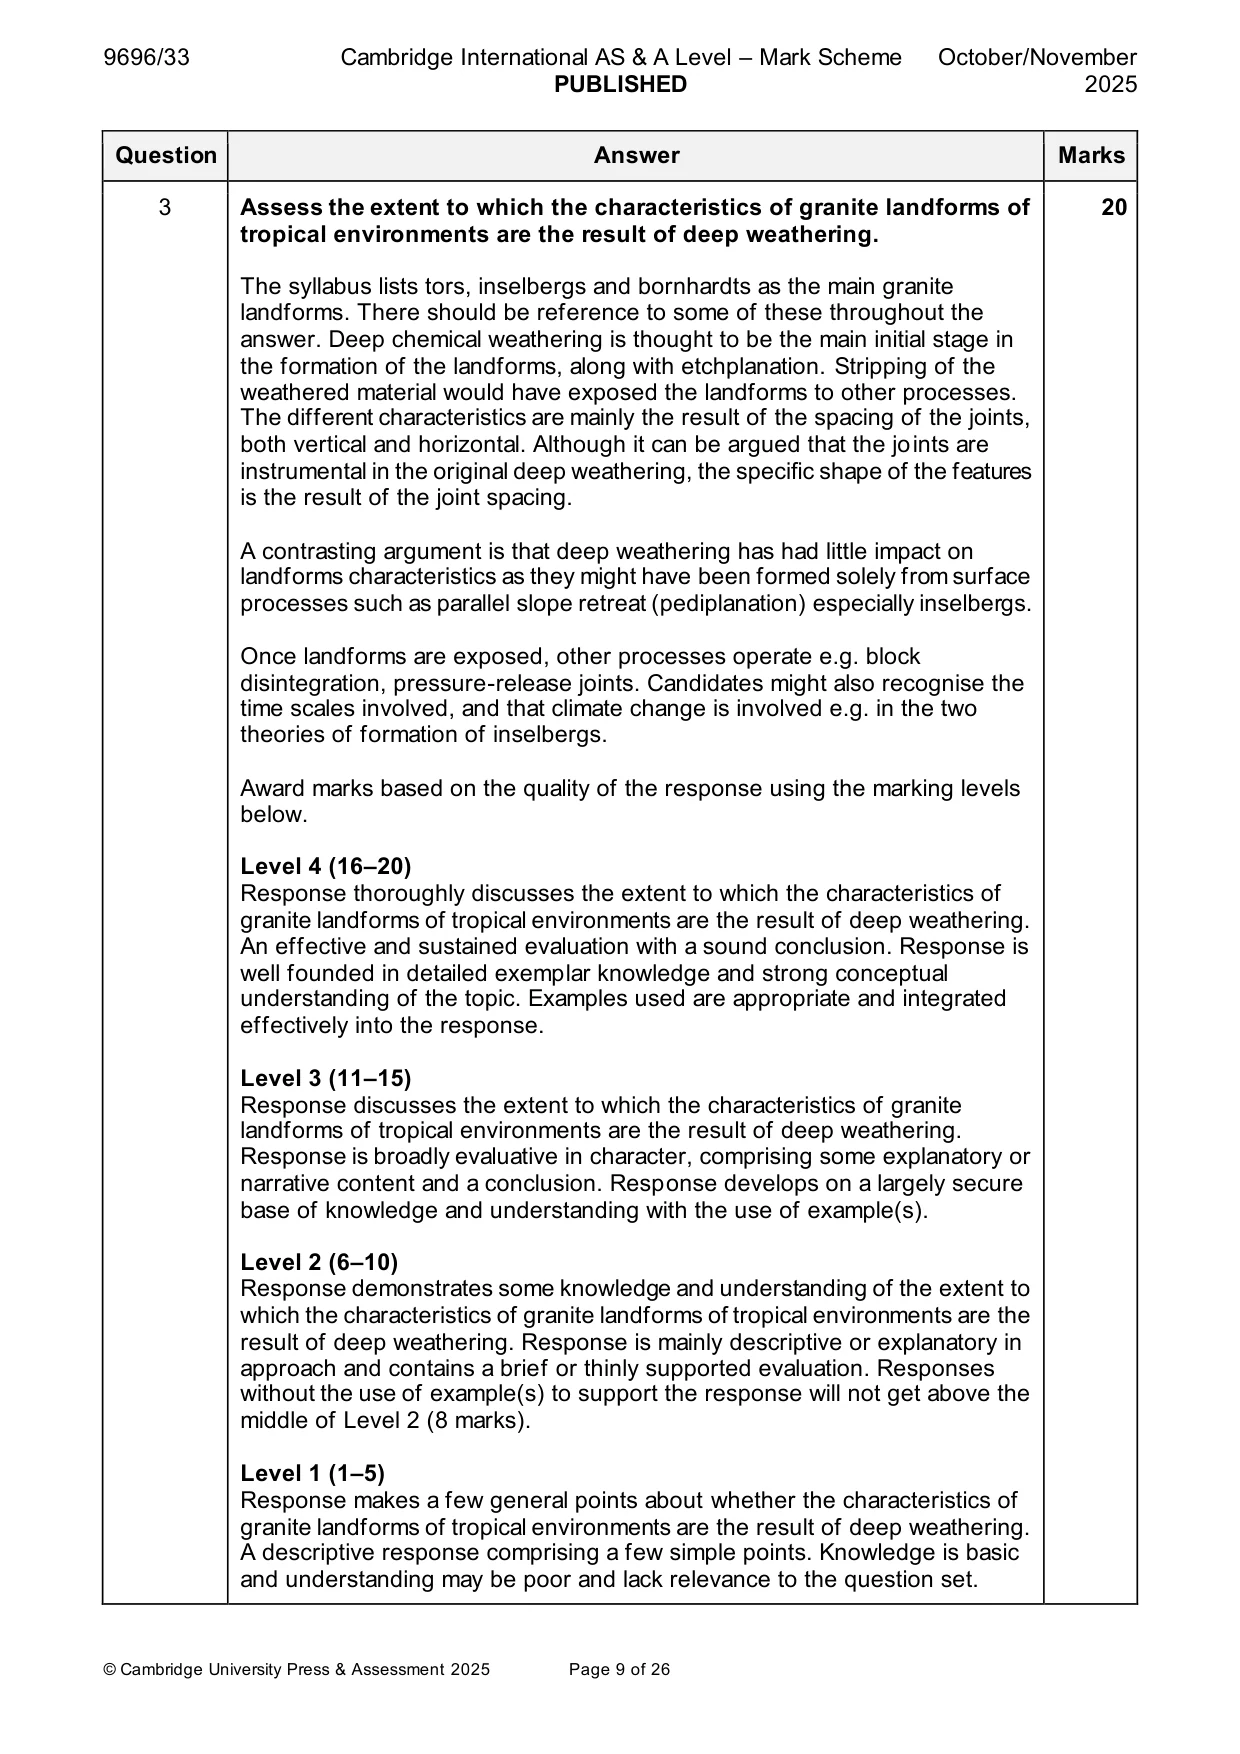
Mark scheme: 3 Assess the extent to which the characteristics of granite landforms of 20 tropical environments are the result of deep weathering. The syllabus lists tors, inselbergs and bornhardts as the main granite landforms. There should be reference to some of these throughout the answer. Deep chemical weathering is thought to be the main initial stage in the formation of the landforms, along with etchplanation. Stripping of the weathered material would have exposed the landforms to other processes. The different characteristics are mainly the result of the spacing of the joints, both vertical and horizontal. Although it can be argued that the joints are instrumental in the original deep weathering, the specific shape of the features is the result of the joint spacing. A contrasting argument is that deep weathering has had little impact on landforms characteristics as they might have been formed solely from surface processes such as parallel slope retreat (pediplanation) especially inselbergs. Once landforms are exposed, other processes operate e.g. block disintegration, pressure-release joints. Candidates might also recognise the time scales involved, and that climate change is involved e.g. in the two theories of formation of inselbergs. Award marks based on the quality of the response using the marking levels below. Level 4 (16–20) Response thoroughly discusses the extent to which the characteristics of granite landforms of tropical environments are the result of deep weathering. An effective and sustained evaluation with a sound conclusion. Response is well founded in detailed exemplar knowledge and strong conceptual understanding of the topic. Examples used are appropriate and integrated effectively into the response. Level 3 (11–15) Response discusses the extent to which the characteristics of granite landforms of tropical environments are the result of deep weathering. Response is broadly evaluative in character, comprising some explanatory or narrative content and a conclusion. Response develops on a largely secure base of knowledge and understanding with the use of example(s). Level 2 (6–10) Response demonstrates some knowledge and understanding of the extent to which the characteristics of granite landforms of tropical environments are the result of deep weathering. Response is mainly descriptive or explanatory in approach and contains a brief or thinly supported evaluation. Responses without the use of example(s) to support the response will not get above the middle of Level 2 (8 marks). Level 1 (1–5) Response makes a few general points about whether the characteristics of granite landforms of tropical environments are the result of deep weathering. A descriptive response comprising a few simple points. Knowledge is basic and understanding may be poor and lack relevance to the question set. 3 Level 0 (0) No creditable response. Coastal environments If answering this option, answer Question 4 and either Question 5 or Question 6.
Q4 · A photograph which shows coastal sand dunes at Sefton, northern England, UK
4 Fig. 4.1 is a photograph which shows coastal sand dunes at Sefton, northern England, UK. (a) Describe the main features of the coastal sand dunes shown in Fig. 4.1. [4] (b) Explain the formation of coastal sand dunes. [6]
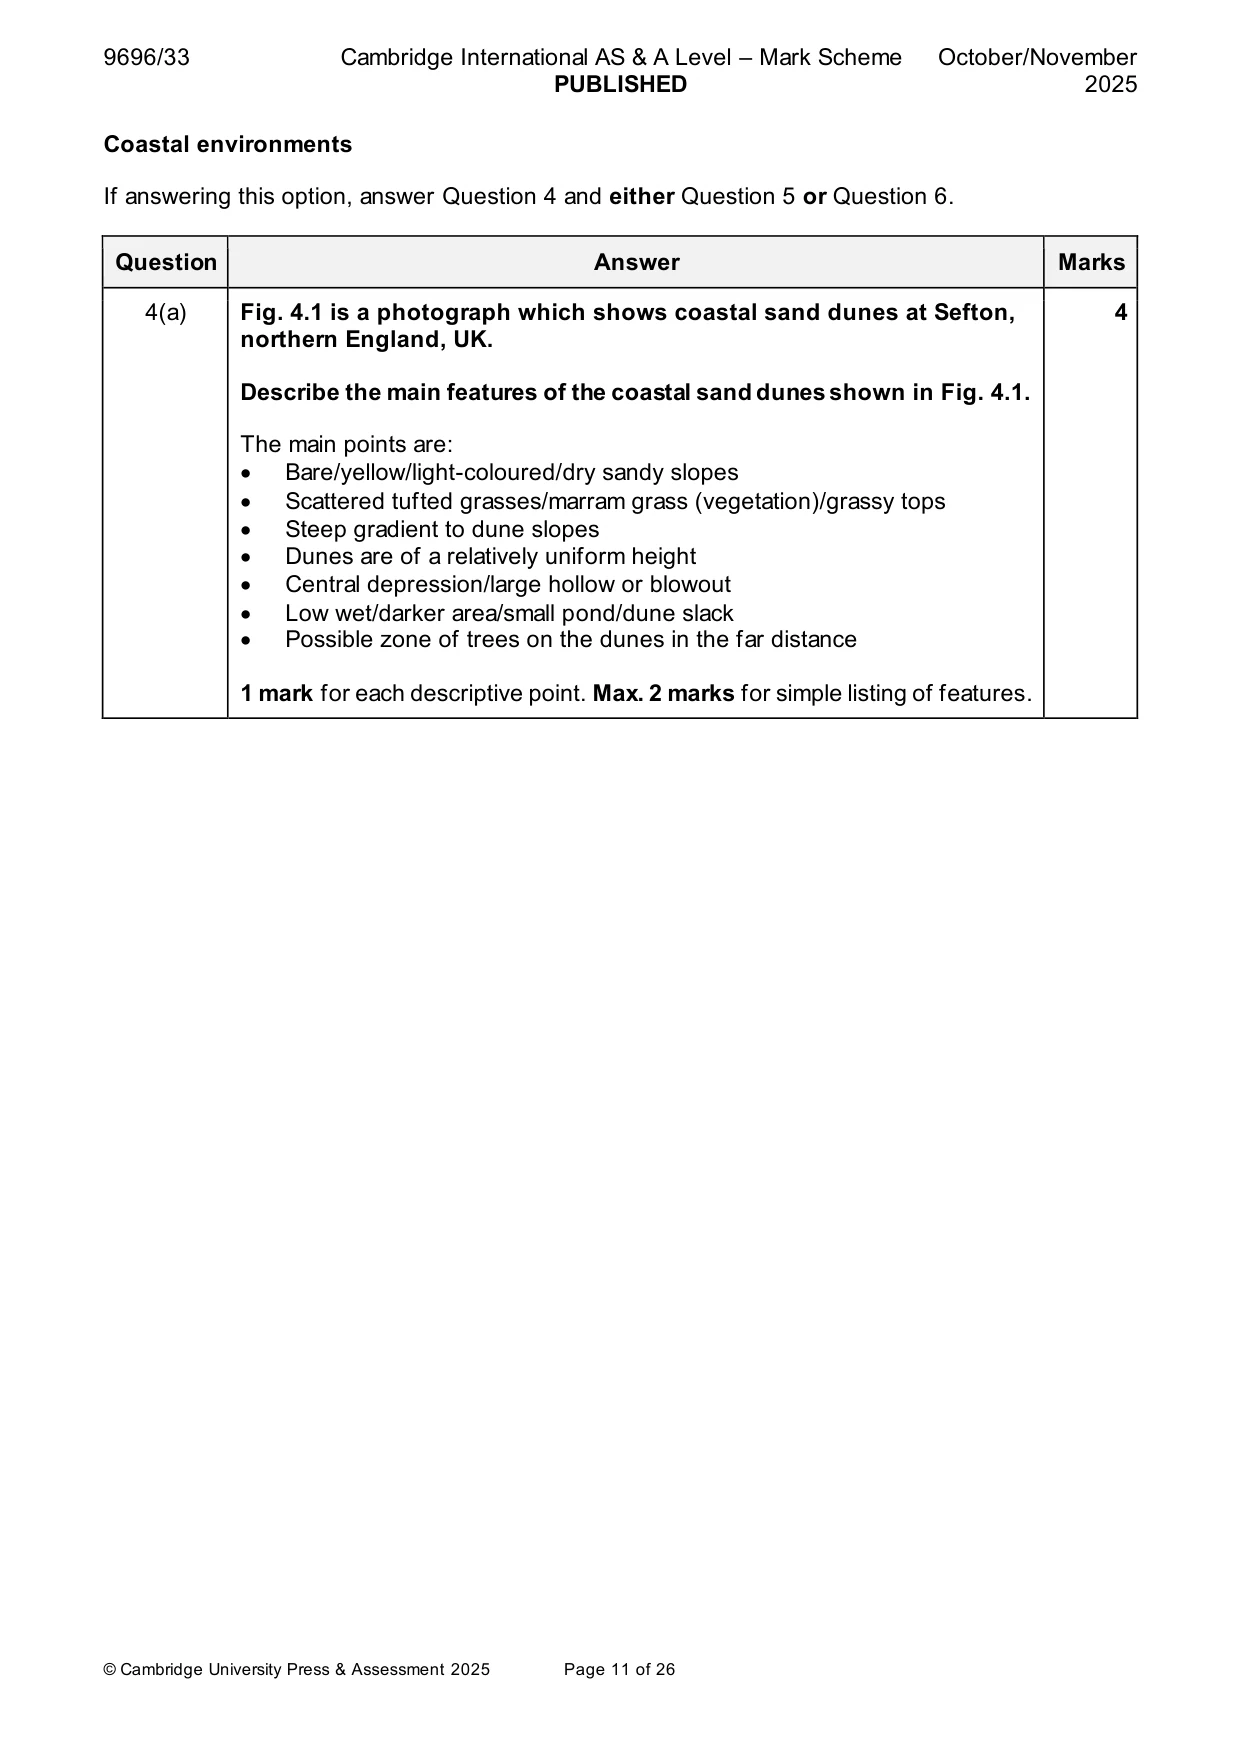
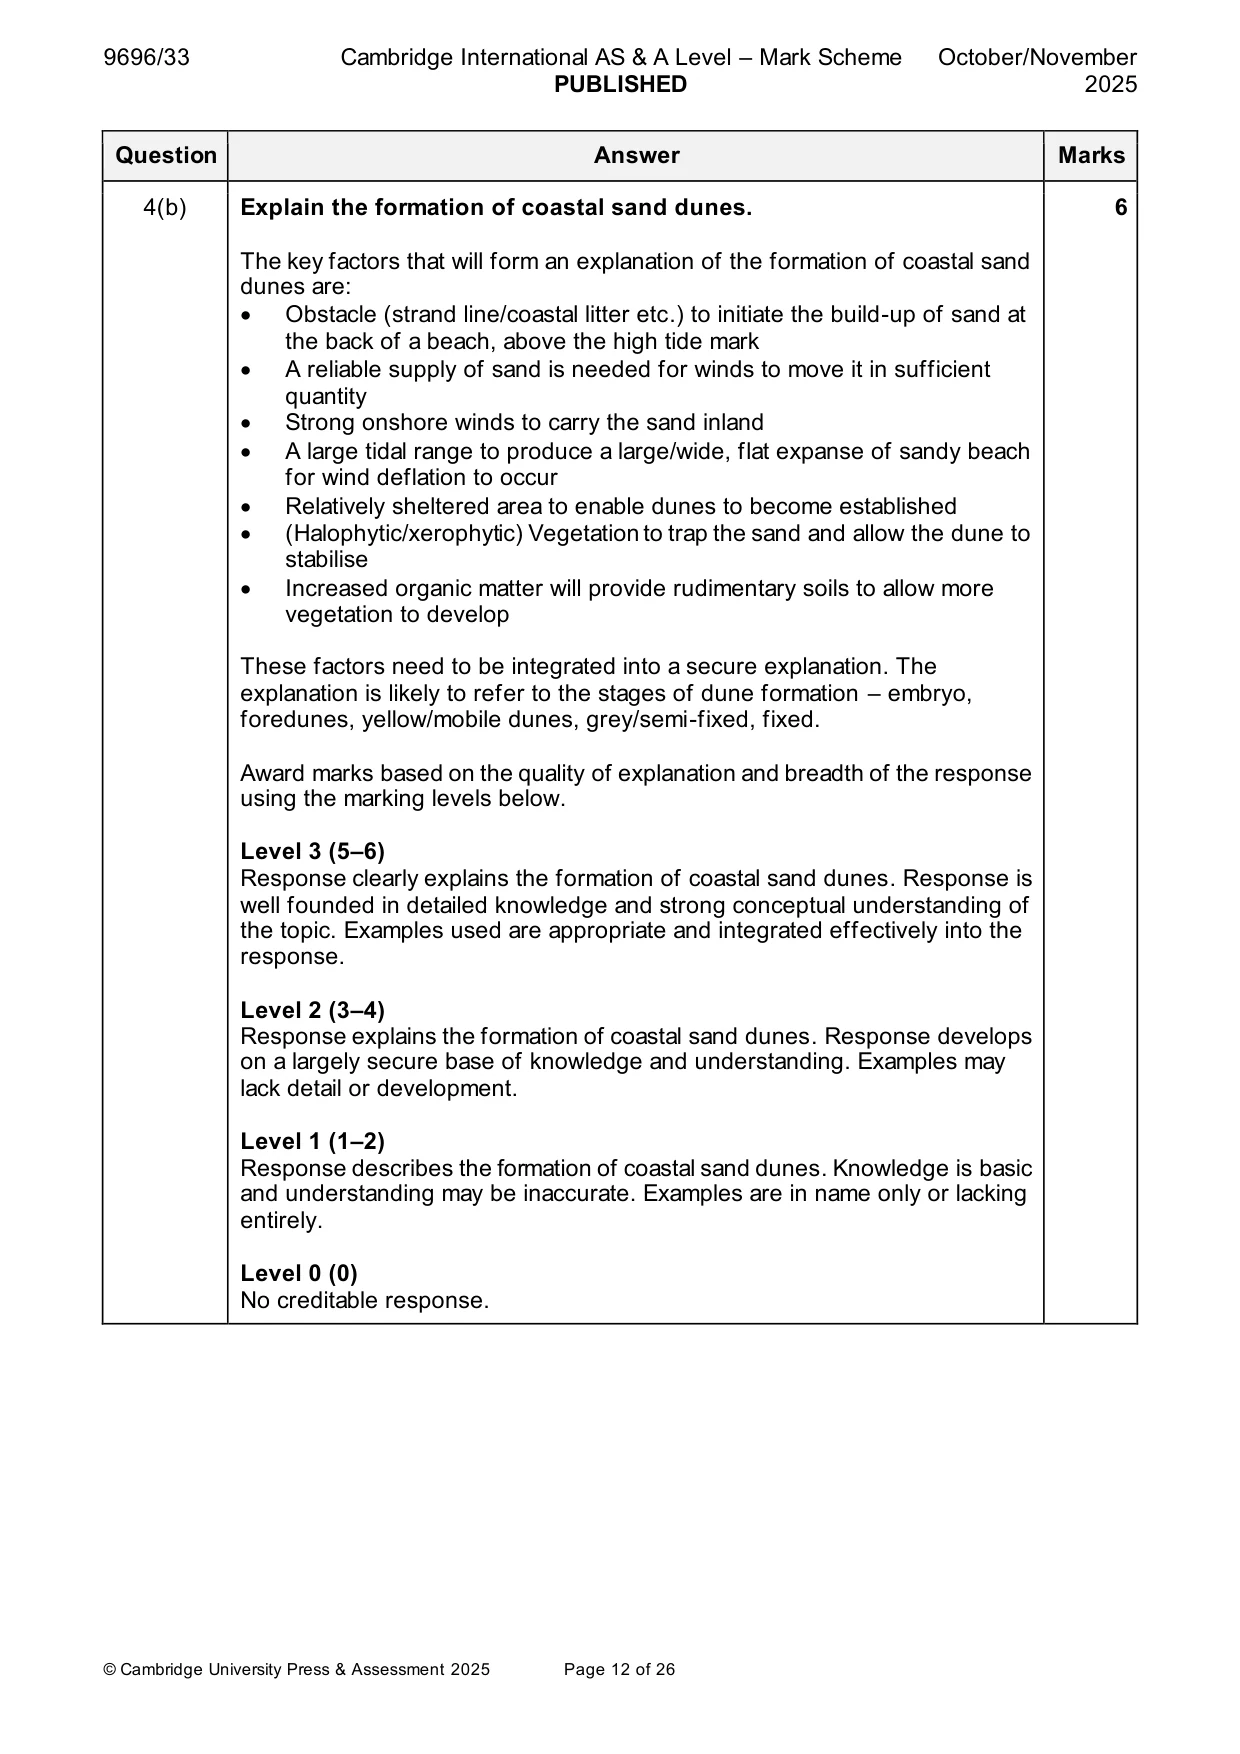
Mark scheme: 4(a) Fig. 4.1 is a photograph which shows coastal sand dunes at Sefton, 4 northern England, UK. Describe the main features of the coastal sand dunes shown in Fig. 4.1. The main points are: • Bare/yellow/light-coloured/dry sandy slopes • Scattered tufted grasses/marram grass (vegetation)/grassy tops • Steep gradient to dune slopes • Dunes are of a relatively uniform height • Central depression/large hollow or blowout • Low wet/darker area/small pond/dune slack • Possible zone of trees on the dunes in the far distance 1 mark for each descriptive point. Max. 2 marks for simple listing of features. 4(b) Explain the formation of coastal sand dunes. 6 The key factors that will form an explanation of the formation of coastal sand dunes are: • Obstacle (strand line/coastal litter etc.) to initiate the build-up of sand at the back of a beach, above the high tide mark • A reliable supply of sand is needed for winds to move it in sufficient quantity • Strong onshore winds to carry the sand inland • A large tidal range to produce a large/wide, flat expanse of sandy beach for wind deflation to occur • Relatively sheltered area to enable dunes to become established • (Halophytic/xerophytic) Vegetation to trap the sand and allow the dune to stabilise • Increased organic matter will provide rudimentary soils to allow more vegetation to develop These factors need to be integrated into a secure explanation. The explanation is likely to refer to the stages of dune formation – embryo, foredunes, yellow/mobile dunes, grey/semi-fixed, fixed. Award marks based on the quality of explanation and breadth of the response using the marking levels below. Level 3 (5–6) Response clearly explains the formation of coastal sand dunes. Response is well founded in detailed knowledge and strong conceptual understanding of the topic. Examples used are appropriate and integrated effectively into the response. Level 2 (3–4) Response explains the formation of coastal sand dunes. Response develops on a largely secure base of knowledge and understanding. Examples may lack detail or development. Level 1 (1–2) Response describes the formation of coastal sand dunes. Knowledge is basic and understanding may be inaccurate. Examples are in name only or lacking entirely. Level 0 (0) No creditable response.
Q5 · ‘Wave energy is the main factor in the formation of caves, arches and stacks.’ How far do…
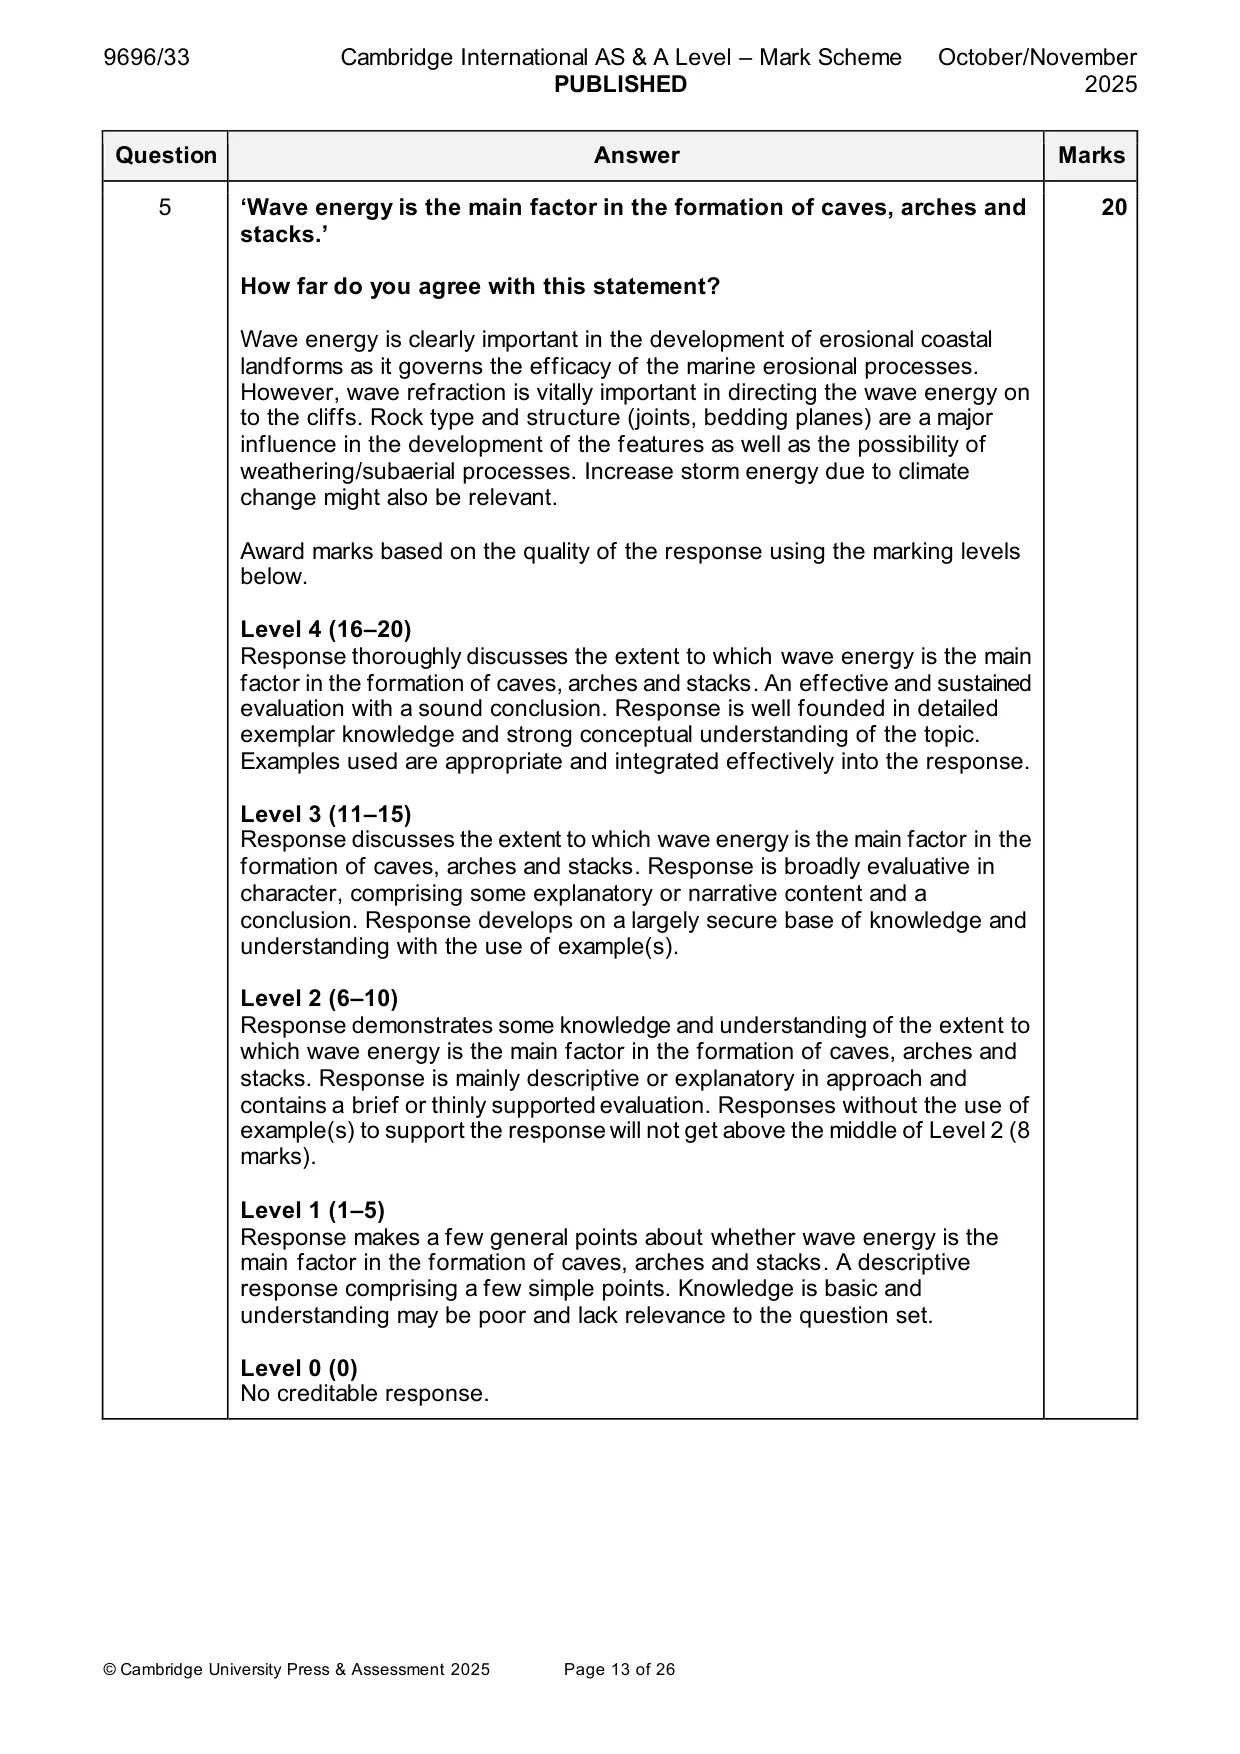
5 ‘Wave energy is the main factor in the formation of caves, arches and stacks.’ How far do you agree with this statement? [20]
Mark scheme: 5 ‘Wave energy is the main factor in the formation of caves, arches and 20 stacks.’ How far do you agree with this statement? Wave energy is clearly important in the development of erosional coastal landforms as it governs the efficacy of the marine erosional processes. However, wave refraction is vitally important in directing the wave energy on to the cliffs. Rock type and structure (joints, bedding planes) are a major influence in the development of the features as well as the possibility of weathering/subaerial processes. Increase storm energy due to climate change might also be relevant. Award marks based on the quality of the response using the marking levels below. Level 4 (16–20) Response thoroughly discusses the extent to which wave energy is the main factor in the formation of caves, arches and stacks. An effective and sustained evaluation with a sound conclusion. Response is well founded in detailed exemplar knowledge and strong conceptual understanding of the topic. Examples used are appropriate and integrated effectively into the response. Level 3 (11–15) Response discusses the extent to which wave energy is the main factor in the formation of caves, arches and stacks. Response is broadly evaluative in character, comprising some explanatory or narrative content and a conclusion. Response develops on a largely secure base of knowledge and understanding with the use of example(s). Level 2 (6–10) Response demonstrates some knowledge and understanding of the extent to which wave energy is the main factor in the formation of caves, arches and stacks. Response is mainly descriptive or explanatory in approach and contains a brief or thinly supported evaluation. Responses without the use of example(s) to support the response will not get above the middle of Level 2 (8 marks). Level 1 (1–5) Response makes a few general points about whether wave energy is the main factor in the formation of caves, arches and stacks. A descriptive response comprising a few simple points. Knowledge is basic and understanding may be poor and lack relevance to the question set. Level 0 (0) No creditable response.
Q6 · Hazardous environments If answering this option, answer Question 7 and either Question 8…
Hazardous environments If answering this option, answer Question 7 and either Question 8 or Question 9.
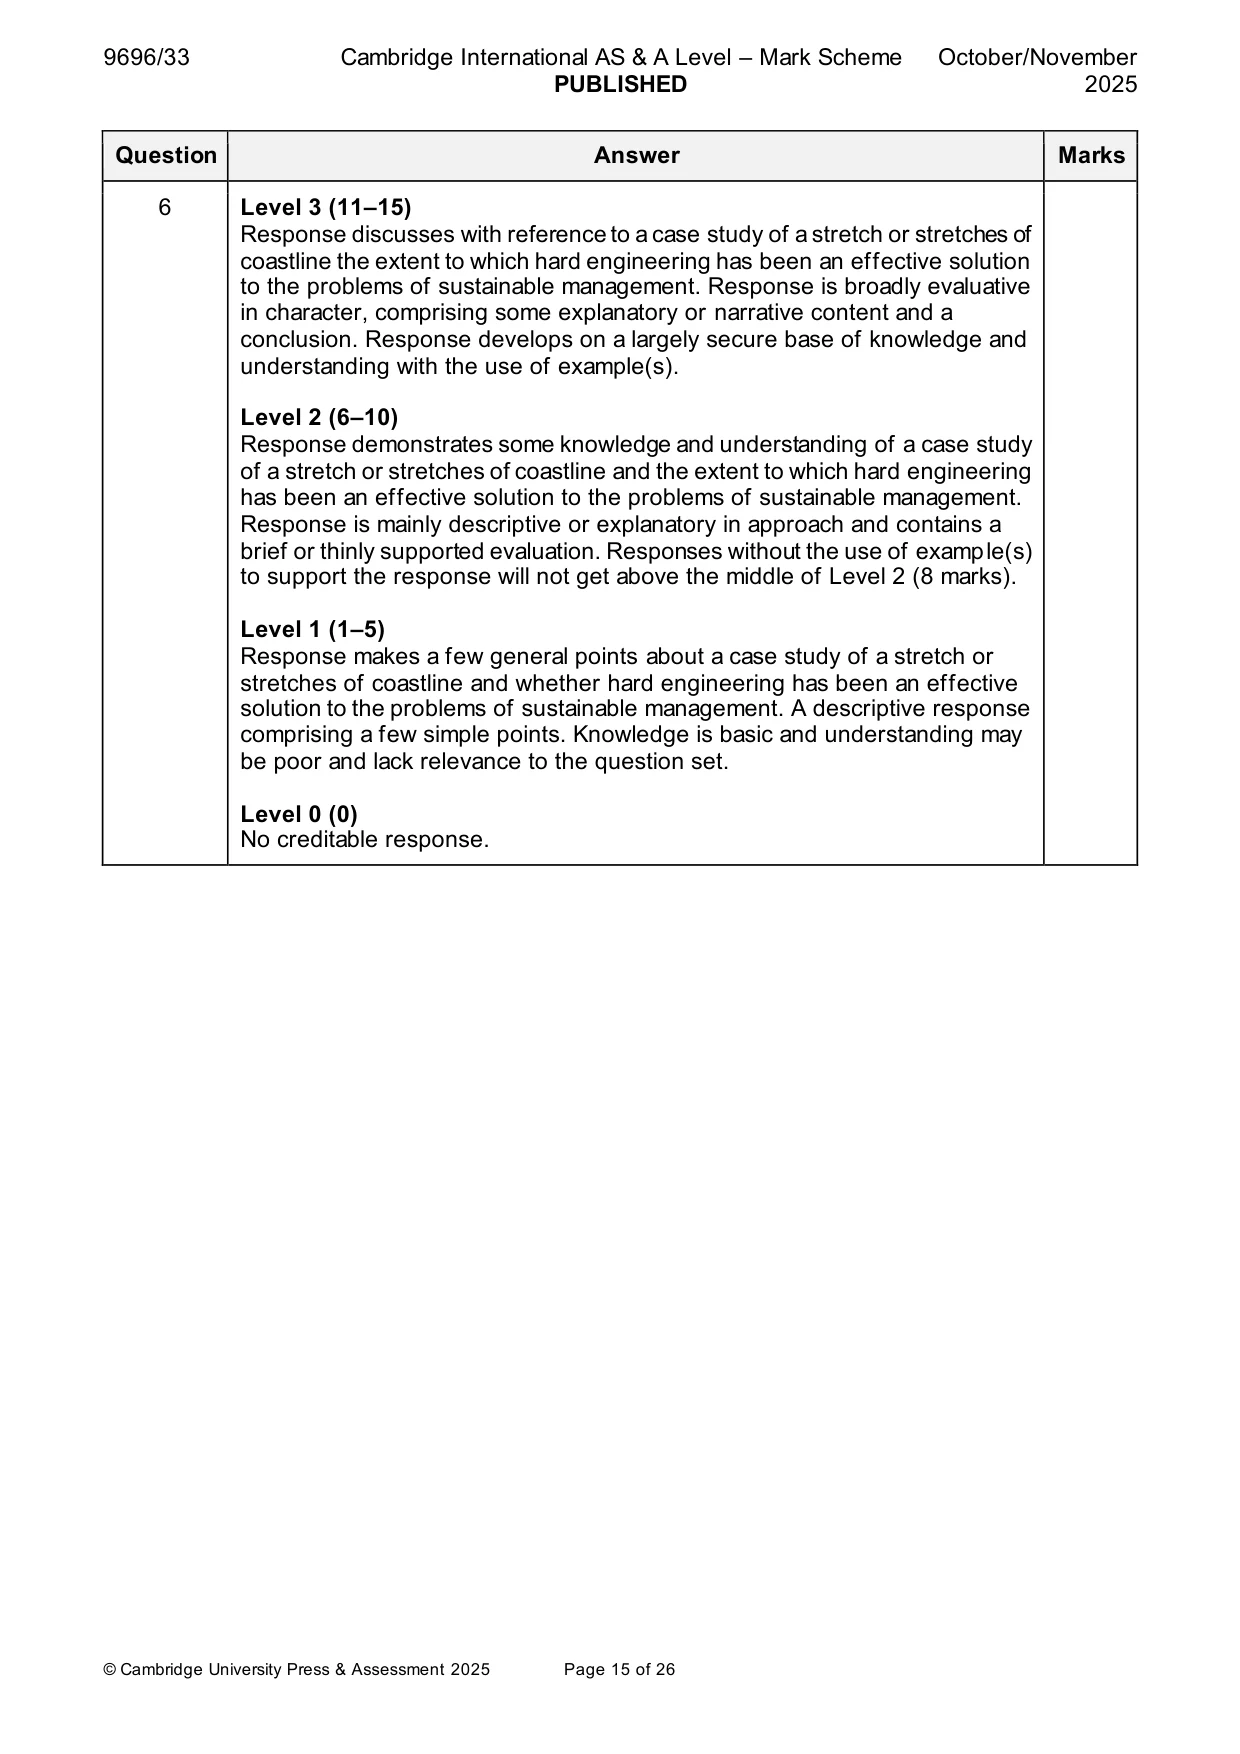
Mark scheme: 6 With reference to a case study of a stretch or stretches of coastline, 20 assess the extent to which hard engineering has been an effective solution to the problems of sustainable management. The detail in the answer will be determined by the choice of stretch or stretches of coastline analysed and the problems faced. The focus is on hard engineering so there will need to be a match between the problems discussed and the attempt by hard engineering strategies to alleviate these problems. Comparison with other strategies such as soft engineering might be provided. Stretch of coastline should not just be a named country – there needs to be a more focused approach on a particular stretch or stretches of coastline. Generic country reference will not score above Level 2. Problems of sustainable management might include: • Dynamic nature of coastal environment – links to rock type, wave/wind energy, longshore currents • Sea level rise • Climate change impacts e.g. increased storm energy • Impacts of management on other parts of the coastal system e.g. interference with sediment cells • Problems of achieving balance between social/economic/environmental needs • Land uses and conflicts between different interest groups • Limited economic development in some locations • Weak/ineffective governance Effectiveness could be considered in terms of: • Reduction of erosion and transportation (longshore drift) • Stabilising of cliffs • More substantial beaches for tourism, etc. • Reduction in coastal flooding • Cost-benefit analysis • Protection of sensitive infrastructure • Analysis of social, economic and environmental strands of sustainability e.g. enhancement of habitat, allowing people to continue with lifestyle/economic activity Award marks based on the quality of the response using the marking levels below. Level 4 (16–20) Response thoroughly discusses with reference to a case study of a stretch or stretches of coastline the extent to which hard engineering has been an effective solution to the problems of sustainable management. An effective and sustained evaluation with a sound conclusion. Response is well founded in detailed exemplar knowledge and strong conceptual understanding of the topic. Examples used are appropriate and integrated effectively into the response. 6 Level 3 (11–15) Response discusses with reference to a case study of a stretch or stretches of coastline the extent to which hard engineering has been an effective solution to the problems of sustainable management. Response is broadly evaluative in character, comprising some explanatory or narrative content and a conclusion. Response develops on a largely secure base of knowledge and understanding with the use of example(s). Level 2 (6–10) Response demonstrates some knowledge and understanding of a case study of a stretch or stretches of coastline and the extent to which hard engineering has been an effective solution to the problems of sustainable management. Response is mainly descriptive or explanatory in approach and contains a brief or thinly supported evaluation. Responses without the use of example(s) to support the response will not get above the middle of Level 2 (8 marks). Level 1 (1–5) Response makes a few general points about a case study of a stretch or stretches of coastline and whether hard engineering has been an effective solution to the problems of sustainable management. A descriptive response comprising a few simple points. Knowledge is basic and understanding may be poor and lack relevance to the question set. Level 0 (0) No creditable response. Hazardous environments If answering this option, answer Question 7 and either Question 8 or Question 9.
Q7 · The magnitude and frequency of earthquakes recorded in the Philippines, 17 February 2021
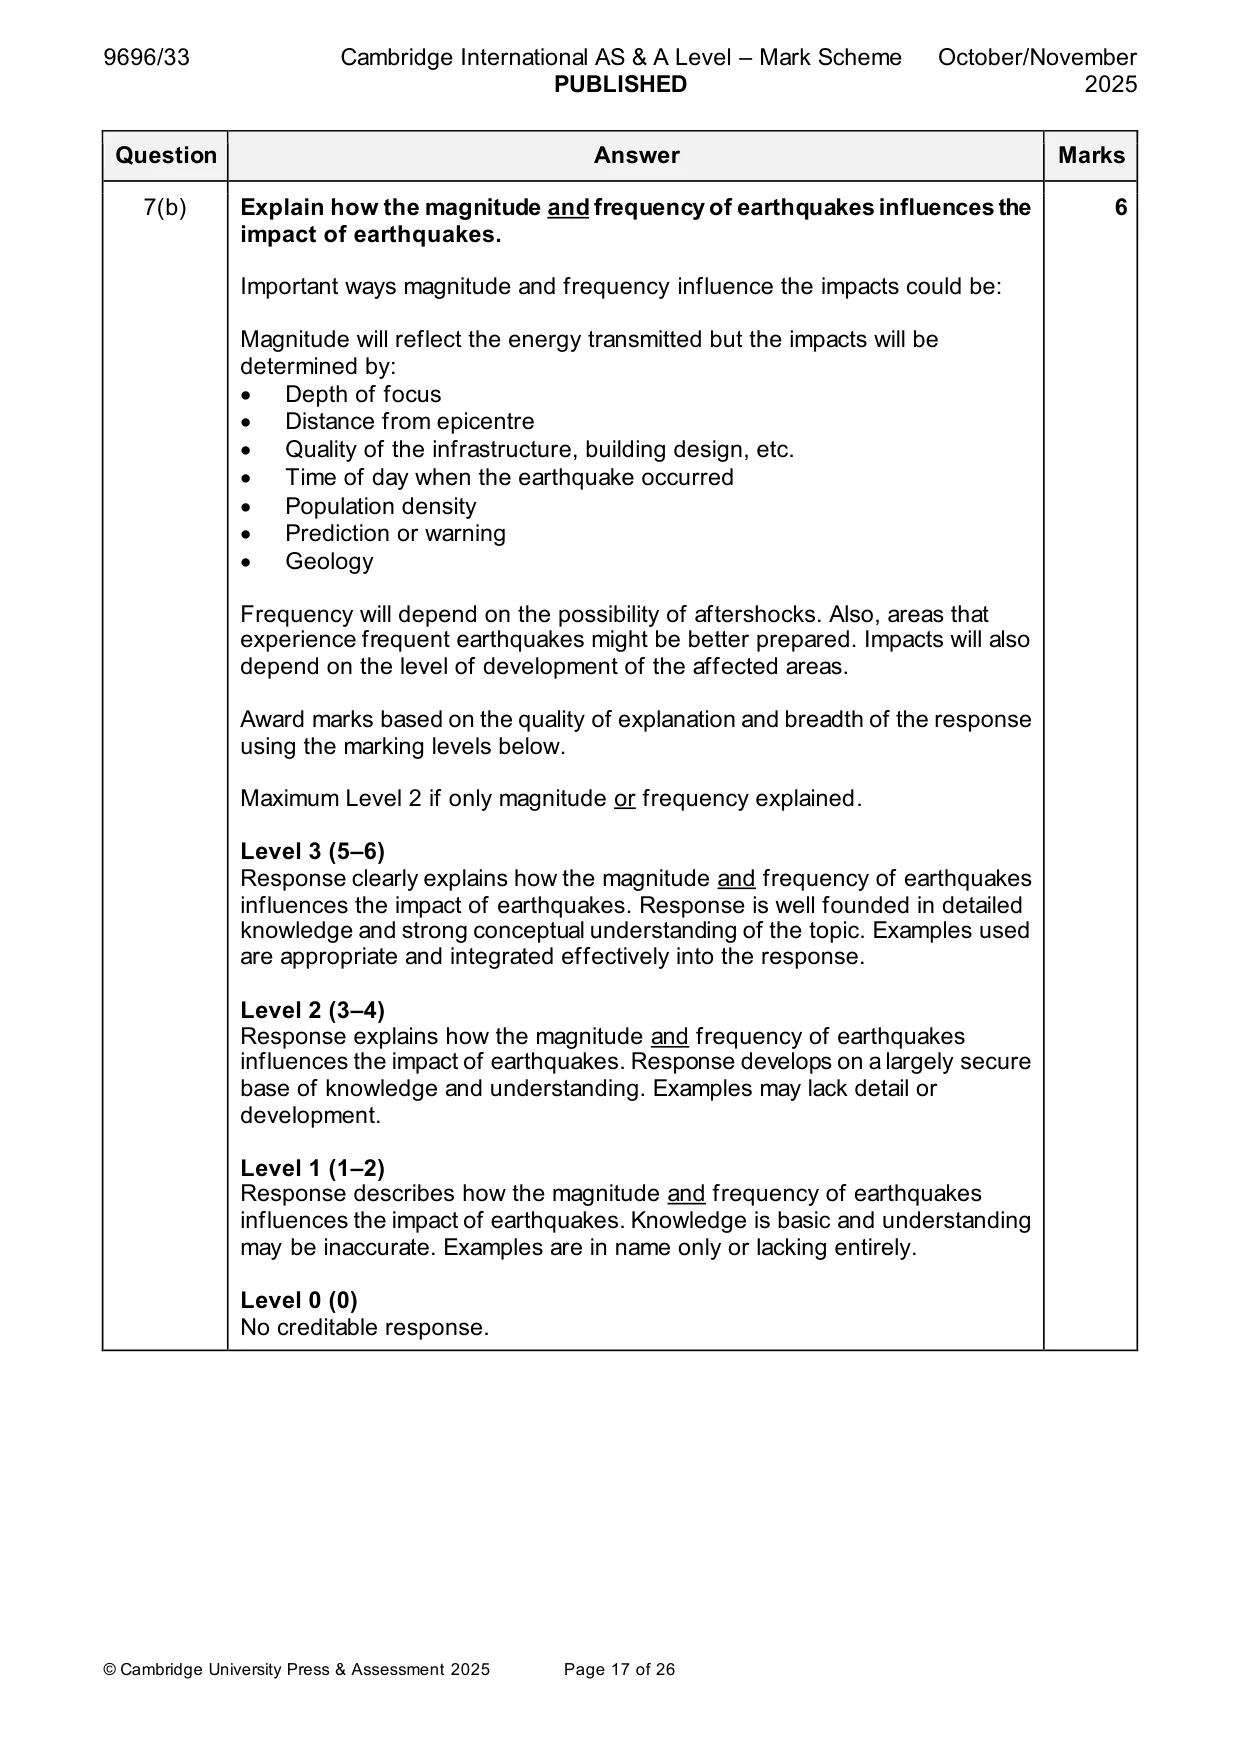
7 Fig. 7.1 shows the magnitude and frequency of earthquakes recorded in the Philippines, 17 February 2021. (a) Describe the distributions of the magnitude and frequency of earthquakes shown in Fig. 7.1. [4] (b) Explain how the magnitude and frequency of earthquakes influences the impact of earthquakes. [6]
Mark scheme: 7(a) Fig. 7.1 shows the magnitude and frequency of earthquakes recorded in 4 the Philippines, 17 February 2021. Describe the distributions of the magnitude and frequency of earthquakes shown in Fig. 7.1. The main points are: • Discontinuous/fluctuating/uneven distribution in frequency and magnitude (between 02:00 and 21:00) • Many gaps in occurrence in the morning / between midnight and noon, the earthquakes are intermittent, with one- or two-hour gaps between them. They occur in ones or twos per hour but with four between 08:00 and 9:00 • Maximum concentration between 12:00 and 18:00 / between noon and 21:00, the earthquakes are virtually continuous, with four or more an hour on four occasions • There are no earthquakes after 21:00 • The maximum frequency is 8 per hour between 13:00 and 14:00 • Only one earthquake of magnitude 4.0–4.9 • No earthquakes of magnitude 5.0 and above • Magnitude 2.0–2.9 is the most frequent followed by magnitude 1.0–1.9 • Only four occasions of magnitude 3.0–3.9 In terms of magnitude, there is some variation during the day. In the morning, most earthquakes are magnitude 2.0 to 2.9, with a couple of smaller ones and one between 3.0 and 3.9. In the afternoon and evening, most earthquakes are again between 2.0 and 2.9 but there are a significant number below 2.0, and four earthquakes above 3.0. The maximum magnitude is between 4.0 and 4.9, between 13:00 and 14:00 – the same time as the maximum frequency. 1 mark for each descriptive point. Max 3 marks without use of data. Must mention magnitude and frequency for 4 marks. 7(b) Explain how the magnitude and frequency of earthquakes influences the 6 impact of earthquakes. Important ways magnitude and frequency influence the impacts could be: Magnitude will reflect the energy transmitted but the impacts will be determined by: • Depth of focus • Distance from epicentre • Quality of the infrastructure, building design, etc. • Time of day when the earthquake occurred • Population density • Prediction or warning • Geology Frequency will depend on the possibility of aftershocks. Also, areas that experience frequent earthquakes might be better prepared. Impacts will also depend on the level of development of the affected areas. Award marks based on the quality of explanation and breadth of the response using the marking levels below. Maximum Level 2 if only magnitude or frequency explained. Level 3 (5–6) Response clearly explains how the magnitude and frequency of earthquakes influences the impact of earthquakes. Response is well founded in detailed knowledge and strong conceptual understanding of the topic. Examples used are appropriate and integrated effectively into the response. Level 2 (3–4) Response explains how the magnitude and frequency of earthquakes influences the impact of earthquakes. Response develops on a largely secure base of knowledge and understanding. Examples may lack detail or development. Level 1 (1–2) Response describes how the magnitude and frequency of earthquakes influences the impact of earthquakes. Knowledge is basic and understanding may be inaccurate. Examples are in name only or lacking entirely. Level 0 (0) No creditable response.
Q8 · To what extent is hazard mapping the most effective way of managing mass movement hazards?
8 To what extent is hazard mapping the most effective way of managing mass movement hazards? [20]
Mark scheme: 8 To what extent is hazard mapping the most effective way of managing 20 mass movement hazards? Prediction, monitoring and perception of risk are also listed in the syllabus. However, these may also be related to hazard mapping. There needs to be clear understanding as to what hazard mapping entails and how it may be used to prepare for the hazards from mass movement. Hazard mapping requires a good understanding of the factors that might lead to mass movements and evidence of any past movements. These factors (rock characteristics, soils, slope angle, slope position and aspect, precipitation patterns, climate) will vary depending on the type of mass movement. Thus, the evaluation should be mass movement specific and needs to be compared with other procedures for managing mass movement hazards. Effectiveness could be considered in terms of: • Reduction in frequency of mass movements • Reduction in the scale of mass movement • Limiting development in areas prone to mass movements • Reduction in injuries, loss of life • Damage to infrastructure such as buildings, transport networks Evaluation should be based on a comparison with other methods of preparation such as preventative procedures (pinning, grading, slope drainage, etc.) or education/training for emergency services. There may be discussion as to how, on its own, hazard mapping has limited effectiveness and needs to be used in combination. Award marks based on the quality of the response using the marking levels below. Level 4 (16–20) Response thoroughly discusses the extent to which hazard mapping is the most effective way of managing mass movement hazards. An effective and sustained evaluation with a sound conclusion. Response is well founded in detailed exemplar knowledge and strong conceptual understanding of the topic. Examples used are appropriate and integrated effectively into the response. Level 3 (11–15) Response discusses the extent to which hazard mapping is the most effective way of managing mass movement hazards. Response is broadly evaluative in character, comprising some explanatory or narrative content and a conclusion. Response develops on a largely secure base of knowledge and understanding with the use of example(s). Level 2 (6–10) Response demonstrates some knowledge and understanding of the extent to which hazard mapping is the most effective way of managing mass movement hazards. Response is mainly descriptive or explanatory in approach and contains a brief or thinly supported evaluation. Responses without the use of example(s) to support the response will not get above the middle of Level 2 (8 marks). 8 Level 1 (1–5) Response makes a few general points about whether hazard mapping is the most effective way of managing mass movement hazards. A descriptive response comprising a few simple points. Knowledge is basic and understanding may be poor and lack relevance to the question set. Level 0 (0) No creditable response.
Q9 · Assess the relative importance of sea‑surface temperature in the formation and…
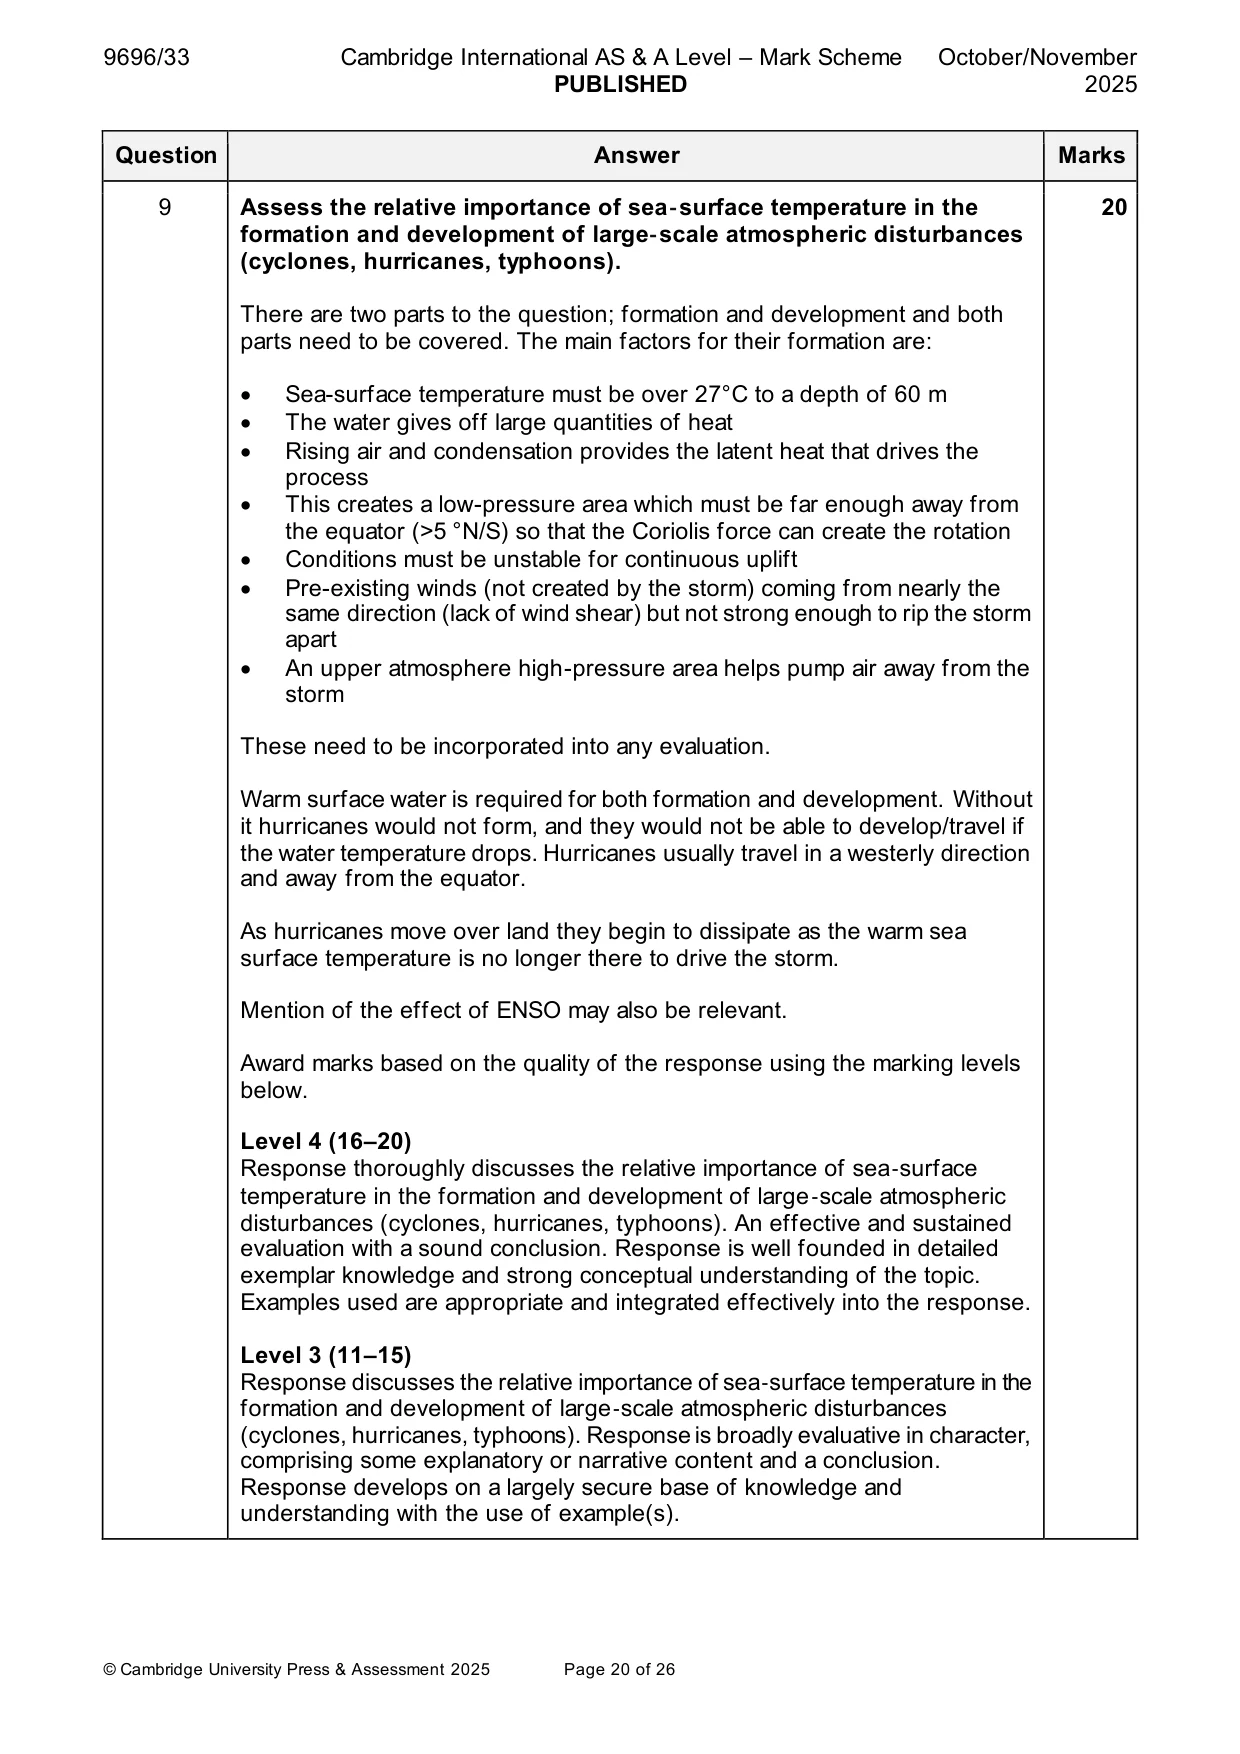
9 Assess the relative importance of sea‑surface temperature in the formation and development of large‑scale atmospheric disturbances (cyclones, hurricanes, typhoons). [20] Hot arid and semi‑arid environments If answering this option, answer Question 10 and either Question 11 or Question 12.
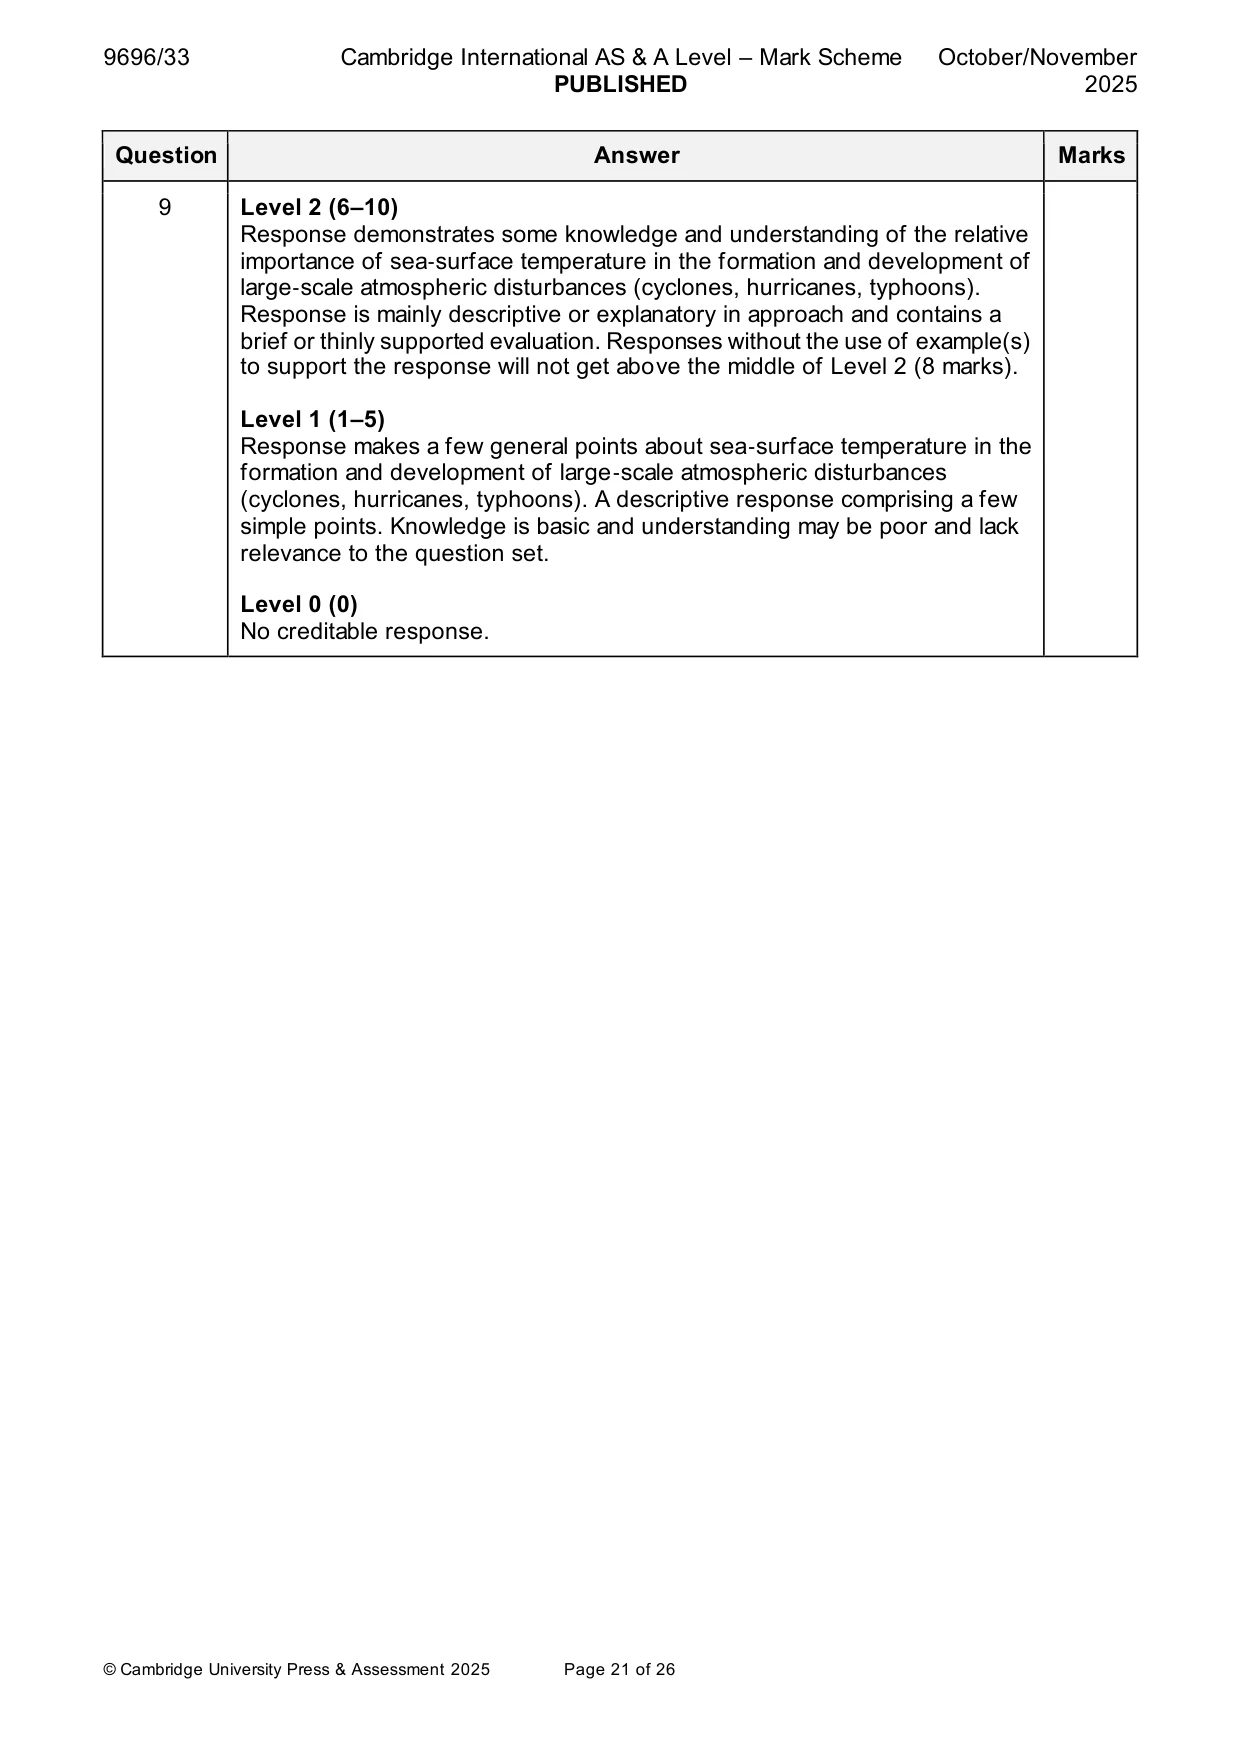
Mark scheme: 9 Assess the relative importance of sea‑surface temperature in the 20 formation and development of large‑scale atmospheric disturbances (cyclones, hurricanes, typhoons). There are two parts to the question; formation and development and both parts need to be covered. The main factors for their formation are: • Sea-surface temperature must be over 27°C to a depth of 60 m • The water gives off large quantities of heat • Rising air and condensation provides the latent heat that drives the process • This creates a low-pressure area which must be far enough away from the equator (>5 °N/S) so that the Coriolis force can create the rotation • Conditions must be unstable for continuous uplift • Pre-existing winds (not created by the storm) coming from nearly the same direction (lack of wind shear) but not strong enough to rip the storm apart • An upper atmosphere high-pressure area helps pump air away from the storm These need to be incorporated into any evaluation. Warm surface water is required for both formation and development. Without it hurricanes would not form, and they would not be able to develop/travel if the water temperature drops. Hurricanes usually travel in a westerly direction and away from the equator. As hurricanes move over land they begin to dissipate as the warm sea surface temperature is no longer there to drive the storm. Mention of the effect of ENSO may also be relevant. Award marks based on the quality of the response using the marking levels below. Level 4 (16–20) Response thoroughly discusses the relative importance of sea‑surface temperature in the formation and development of large‑scale atmospheric disturbances (cyclones, hurricanes, typhoons). An effective and sustained evaluation with a sound conclusion. Response is well founded in detailed exemplar knowledge and strong conceptual understanding of the topic. Examples used are appropriate and integrated effectively into the response. Level 3 (11–15) Response discusses the relative importance of sea‑surface temperature in the formation and development of large‑scale atmospheric disturbances (cyclones, hurricanes, typhoons). Response is broadly evaluative in character, comprising some explanatory or narrative content and a conclusion. Response develops on a largely secure base of knowledge and understanding with the use of example(s). 9 Level 2 (6–10) Response demonstrates some knowledge and understanding of the relative importance of sea‑surface temperature in the formation and development of large‑scale atmospheric disturbances (cyclones, hurricanes, typhoons). Response is mainly descriptive or explanatory in approach and contains a brief or thinly supported evaluation. Responses without the use of example(s) to support the response will not get above the middle of Level 2 (8 marks). Level 1 (1–5) Response makes a few general points about sea‑surface temperature in the formation and development of large‑scale atmospheric disturbances (cyclones, hurricanes, typhoons). A descriptive response comprising a few simple points. Knowledge is basic and understanding may be poor and lack relevance to the question set. Level 0 (0) No creditable response. Hot arid and semi-arid environments If answering this option, answer Question 10 and either Question 11 or Question 12.
Q10 · The global distribution of hot semi‑arid environments
10 Fig. 10.1 shows the global distribution of hot semi‑arid environments. (a) Describe the global distribution of hot semi‑arid environments shown in Fig. 10.1. [4] (b) Suggest why the area labelled X in Fig. 10.1 is a hot semi‑arid environment. [6]
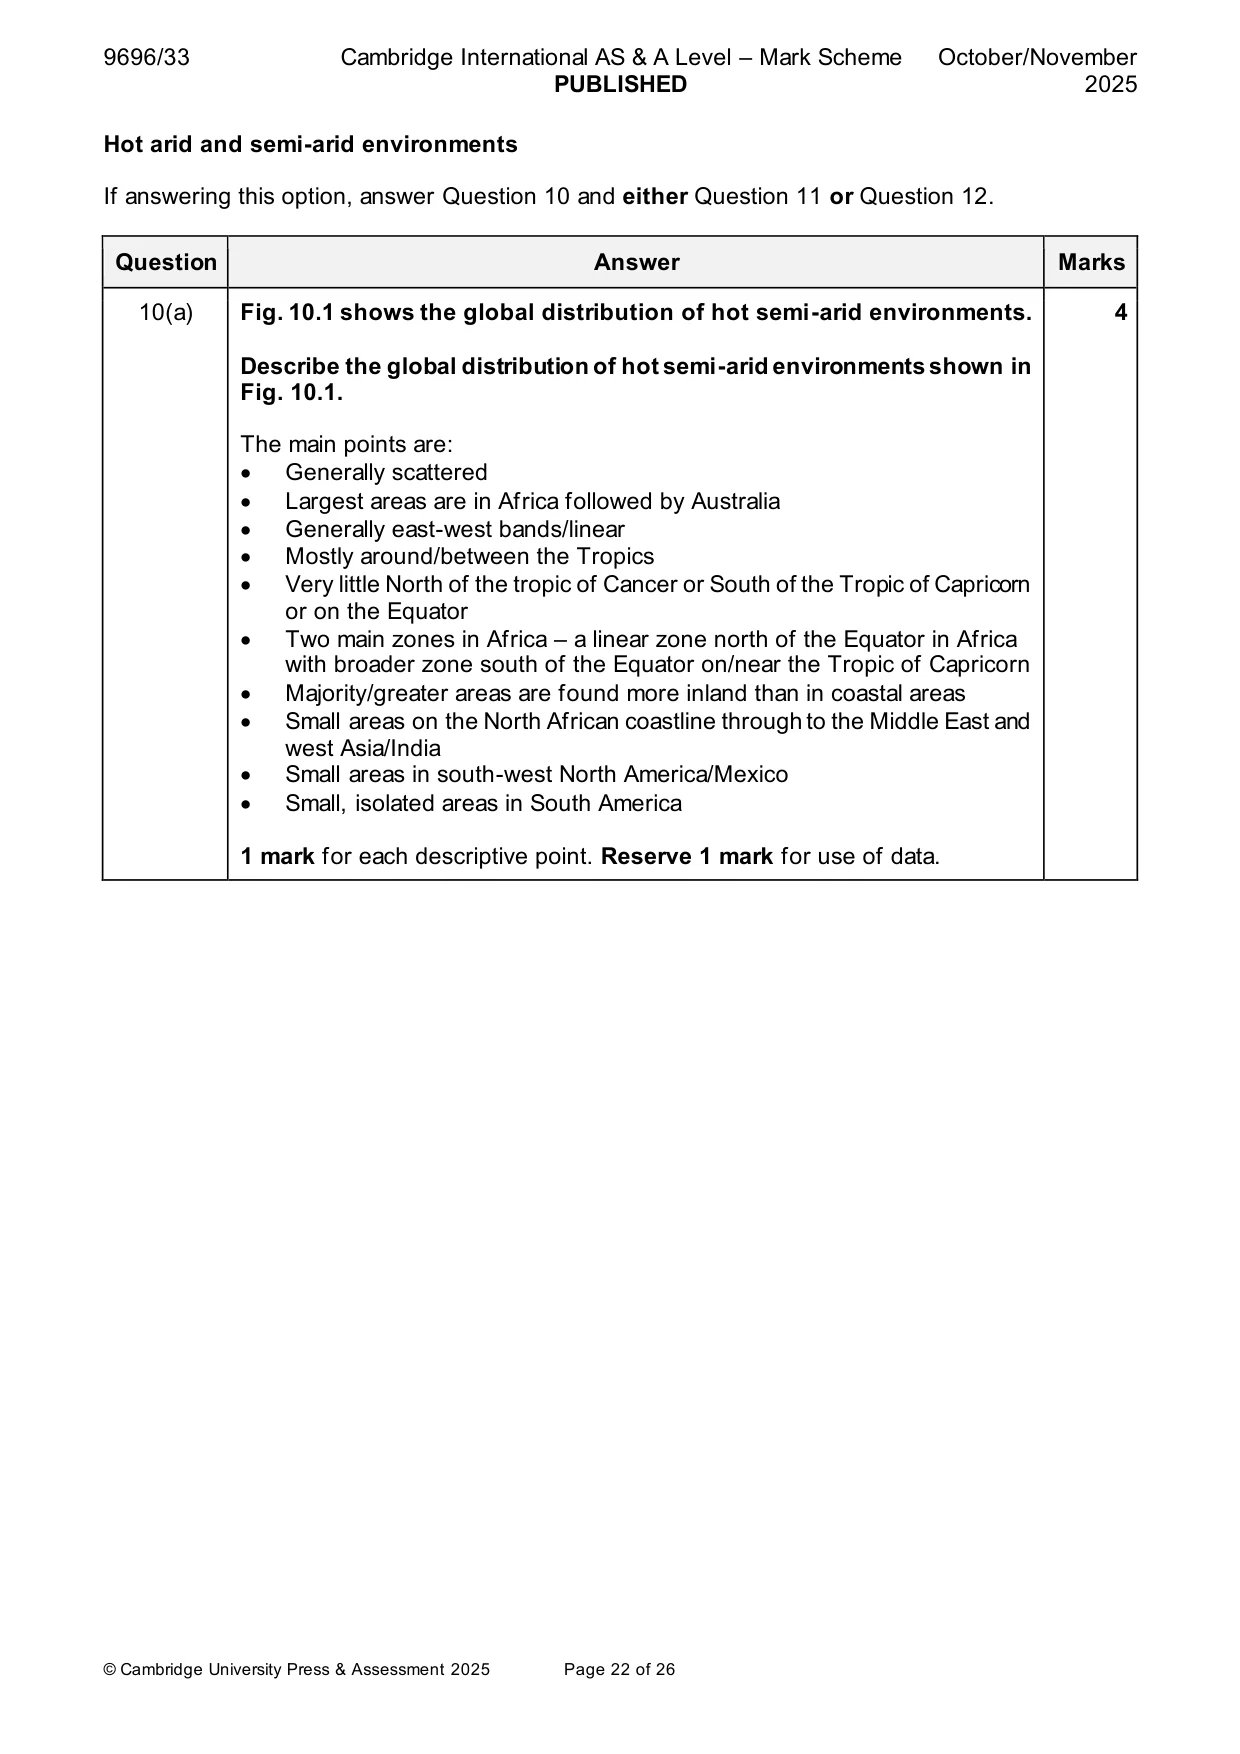
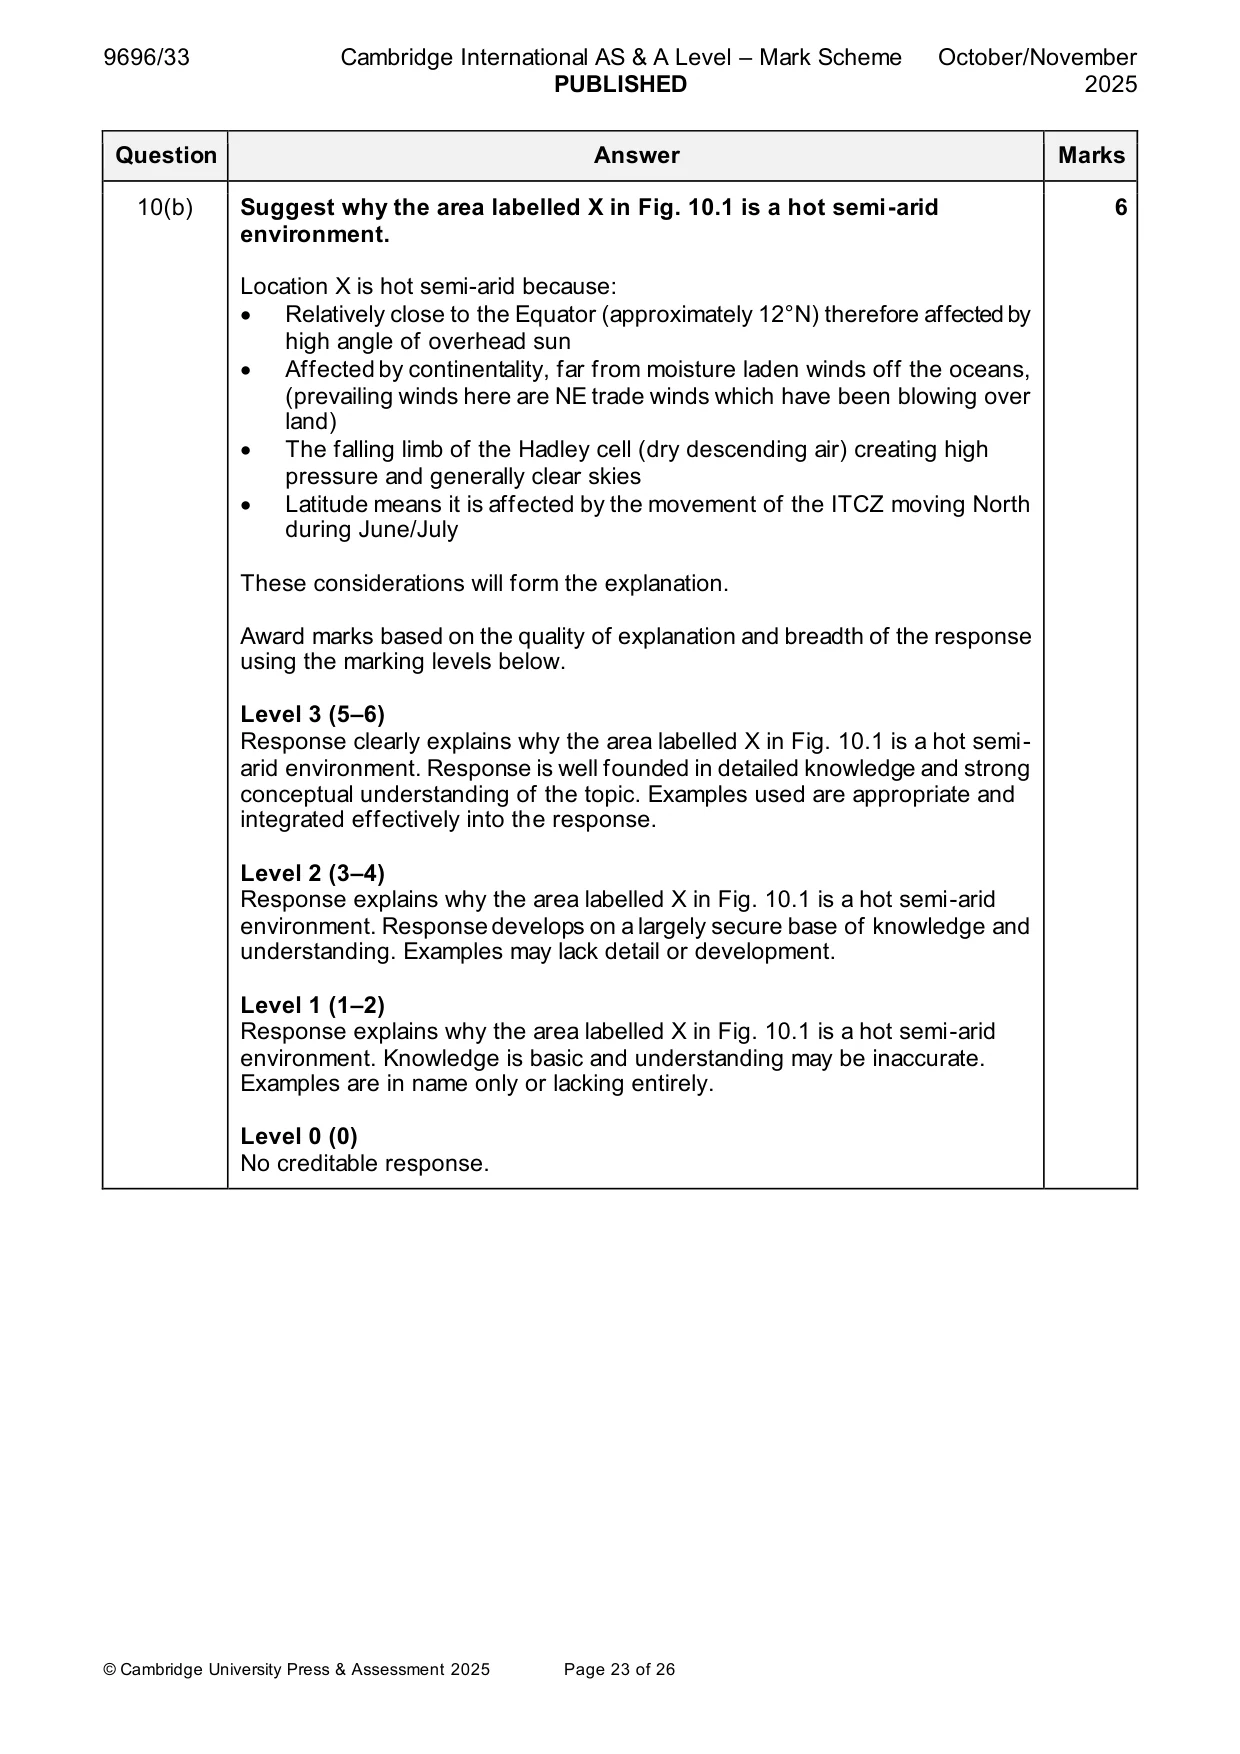
Mark scheme: 10(a) Fig. 10.1 shows the global distribution of hot semi-arid environments. 4 Describe the global distribution of hot semi-arid environments shown in Fig. 10.1. The main points are: • Generally scattered • Largest areas are in Africa followed by Australia • Generally east-west bands/linear • Mostly around/between the Tropics • Very little North of the tropic of Cancer or South of the Tropic of Capricorn or on the Equator • Two main zones in Africa – a linear zone north of the Equator in Africa with broader zone south of the Equator on/near the Tropic of Capricorn • Majority/greater areas are found more inland than in coastal areas • Small areas on the North African coastline through to the Middle East and west Asia/India • Small areas in south-west North America/Mexico • Small, isolated areas in South America 1 mark for each descriptive point. Reserve 1 mark for use of data. 10(b) Suggest why the area labelled X in Fig. 10.1 is a hot semi-arid 6 environment. Location X is hot semi-arid because: • Relatively close to the Equator (approximately 12°N) therefore affected by high angle of overhead sun • Affected by continentality, far from moisture laden winds off the oceans, (prevailing winds here are NE trade winds which have been blowing over land) • The falling limb of the Hadley cell (dry descending air) creating high pressure and generally clear skies • Latitude means it is affected by the movement of the ITCZ moving North during June/July These considerations will form the explanation. Award marks based on the quality of explanation and breadth of the response using the marking levels below. Level 3 (5–6) Response clearly explains why the area labelled X in Fig. 10.1 is a hot semi- arid environment. Response is well founded in detailed knowledge and strong conceptual understanding of the topic. Examples used are appropriate and integrated effectively into the response. Level 2 (3–4) Response explains why the area labelled X in Fig. 10.1 is a hot semi-arid environment. Response develops on a largely secure base of knowledge and understanding. Examples may lack detail or development. Level 1 (1–2) Response explains why the area labelled X in Fig. 10.1 is a hot semi-arid environment. Knowledge is basic and understanding may be inaccurate. Examples are in name only or lacking entirely. Level 0 (0) No creditable response.
Q11 · Assess the evidence for past climate change in hot arid and semi‑arid environments
11 Assess the evidence for past climate change in hot arid and semi‑arid environments. [20]
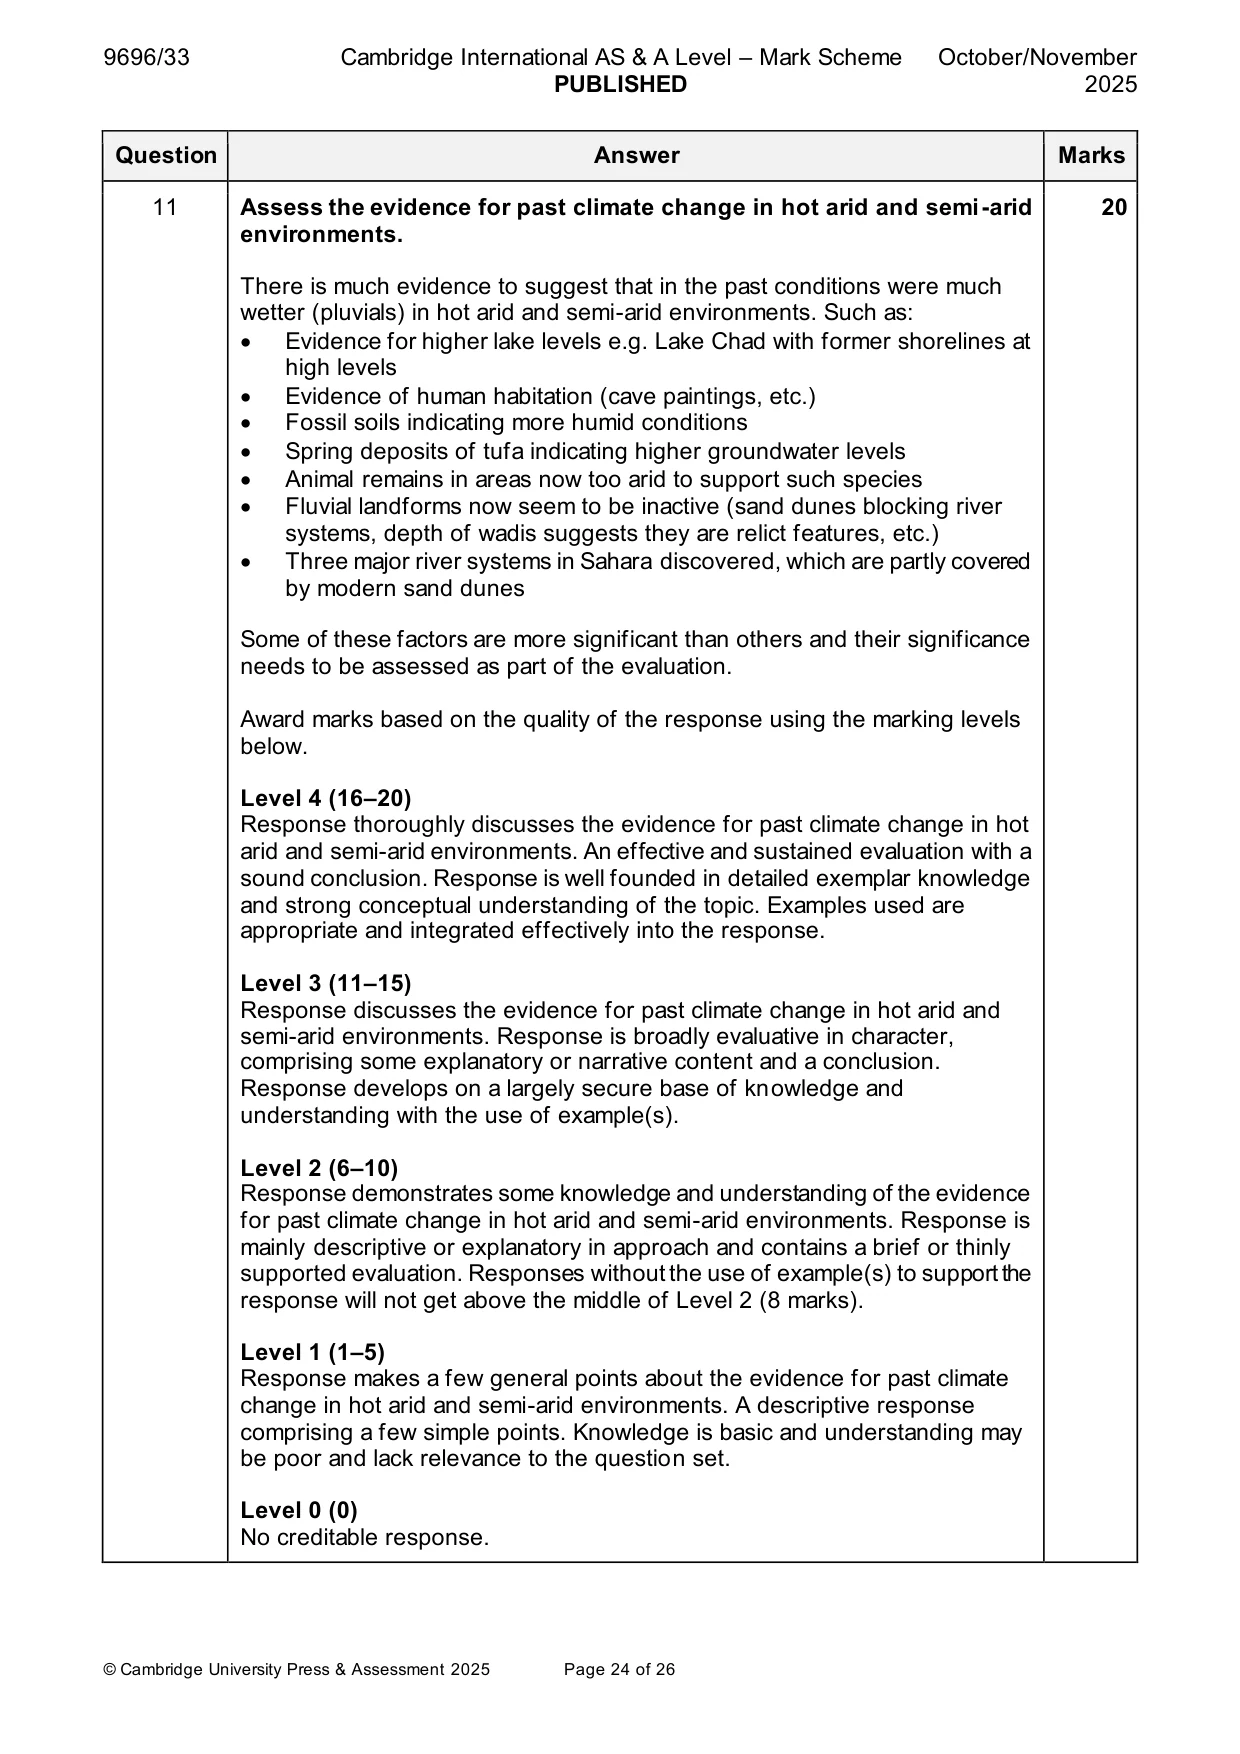
Mark scheme: 11 Assess the evidence for past climate change in hot arid and semi-arid 20 environments. There is much evidence to suggest that in the past conditions were much wetter (pluvials) in hot arid and semi-arid environments. Such as: • Evidence for higher lake levels e.g. Lake Chad with former shorelines at high levels • Evidence of human habitation (cave paintings, etc.) • Fossil soils indicating more humid conditions • Spring deposits of tufa indicating higher groundwater levels • Animal remains in areas now too arid to support such species • Fluvial landforms now seem to be inactive (sand dunes blocking river systems, depth of wadis suggests they are relict features, etc.) • Three major river systems in Sahara discovered, which are partly covered by modern sand dunes Some of these factors are more significant than others and their significance needs to be assessed as part of the evaluation. Award marks based on the quality of the response using the marking levels below. Level 4 (16–20) Response thoroughly discusses the evidence for past climate change in hot arid and semi-arid environments. An effective and sustained evaluation with a sound conclusion. Response is well founded in detailed exemplar knowledge and strong conceptual understanding of the topic. Examples used are appropriate and integrated effectively into the response. Level 3 (11–15) Response discusses the evidence for past climate change in hot arid and semi-arid environments. Response is broadly evaluative in character, comprising some explanatory or narrative content and a conclusion. Response develops on a largely secure base of knowledge and understanding with the use of example(s). Level 2 (6–10) Response demonstrates some knowledge and understanding of the evidence for past climate change in hot arid and semi-arid environments. Response is mainly descriptive or explanatory in approach and contains a brief or thinly supported evaluation. Responses without the use of example(s) to support the response will not get above the middle of Level 2 (8 marks). Level 1 (1–5) Response makes a few general points about the evidence for past climate change in hot arid and semi-arid environments. A descriptive response comprising a few simple points. Knowledge is basic and understanding may be poor and lack relevance to the question set. Level 0 (0) No creditable response.
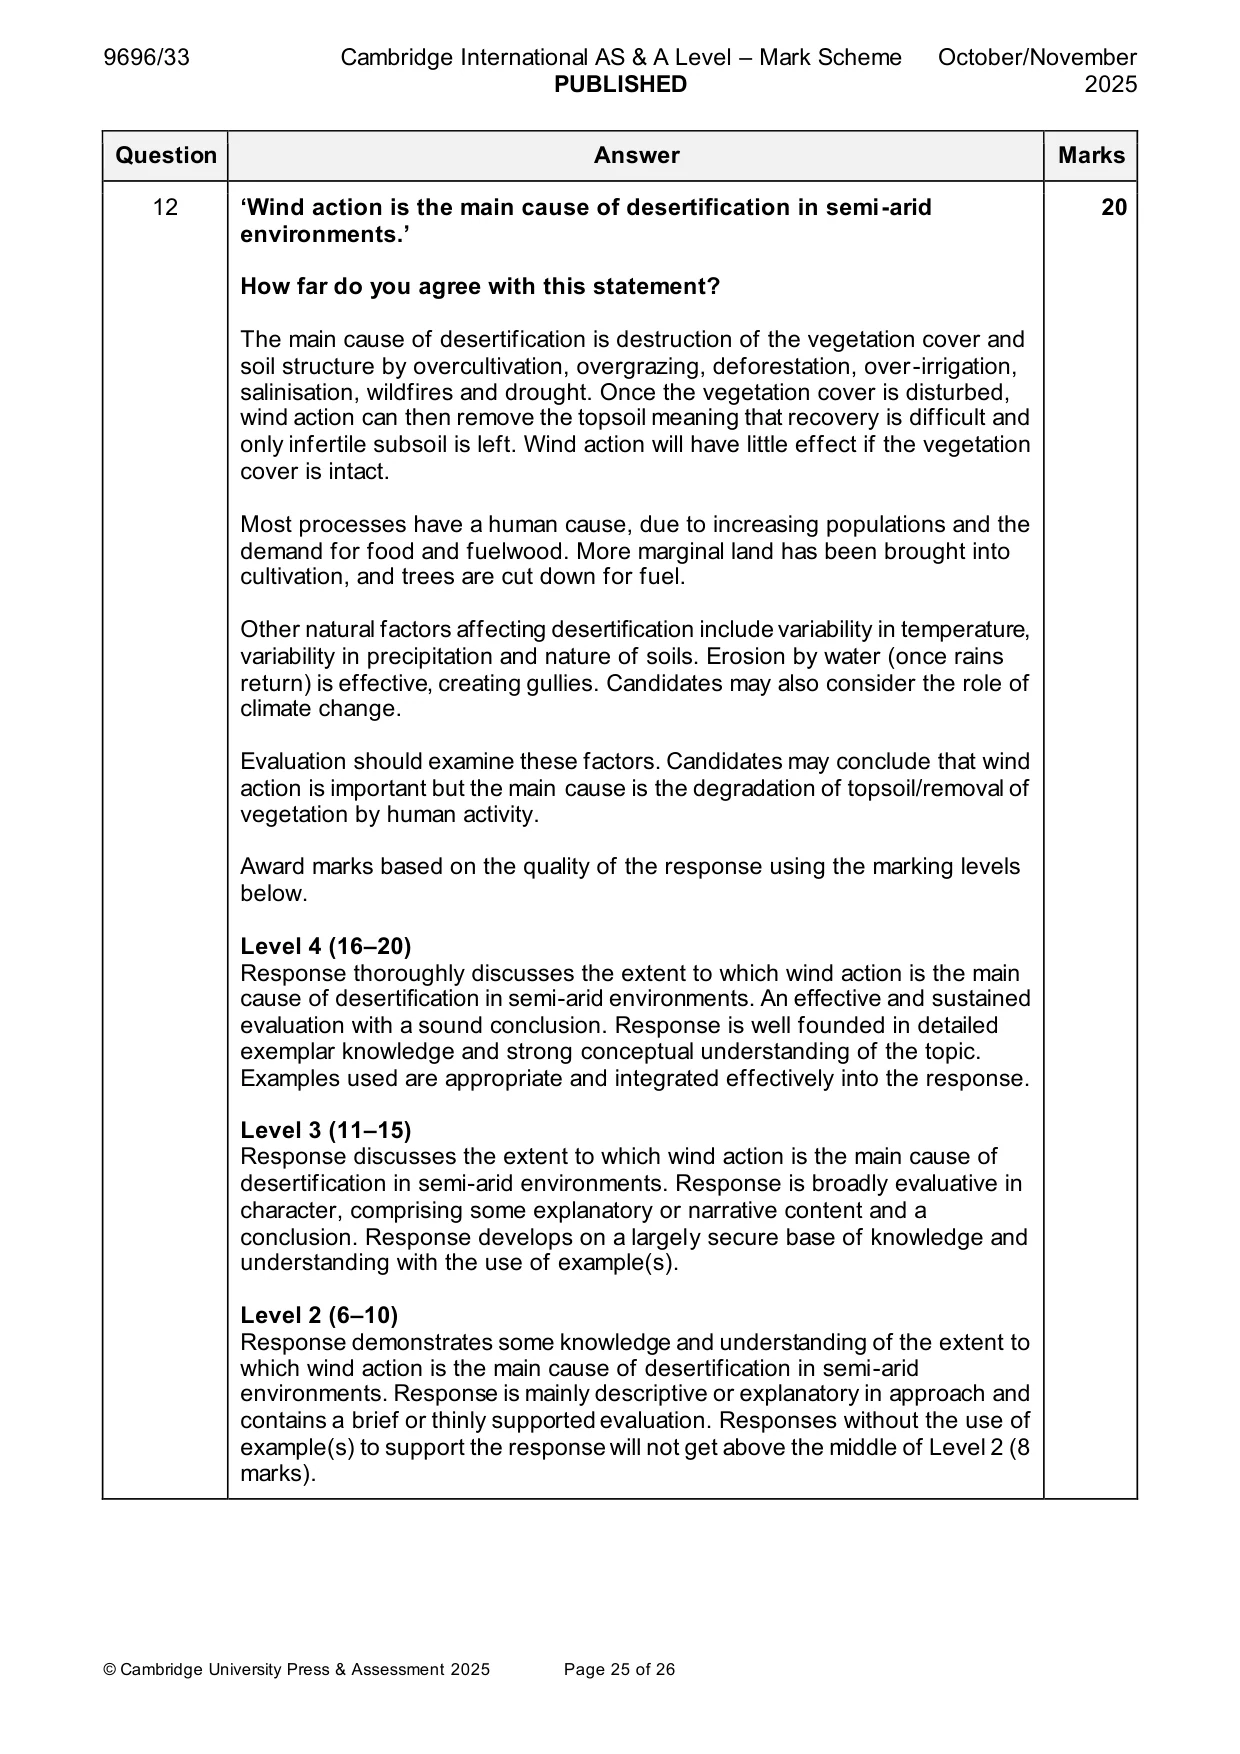
Q12 · ‘Wind action is the main cause of desertification in semi‑arid environments.’ How far do…
12 ‘Wind action is the main cause of desertification in semi‑arid environments.’ How far do you agree with this statement? [20]
Mark scheme: 12 ‘Wind action is the main cause of desertification in semi-arid 20 environments.’ How far do you agree with this statement? The main cause of desertification is destruction of the vegetation cover and soil structure by overcultivation, overgrazing, deforestation, over-irrigation, salinisation, wildfires and drought. Once the vegetation cover is disturbed, wind action can then remove the topsoil meaning that recovery is difficult and only infertile subsoil is left. Wind action will have little effect if the vegetation cover is intact. Most processes have a human cause, due to increasing populations and the demand for food and fuelwood. More marginal land has been brought into cultivation, and trees are cut down for fuel. Other natural factors affecting desertification include variability in temperature, variability in precipitation and nature of soils. Erosion by water (once rains return) is effective, creating gullies. Candidates may also consider the role of climate change. Evaluation should examine these factors. Candidates may conclude that wind action is important but the main cause is the degradation of topsoil/removal of vegetation by human activity. Award marks based on the quality of the response using the marking levels below. Level 4 (16–20) Response thoroughly discusses the extent to which wind action is the main cause of desertification in semi-arid environments. An effective and sustained evaluation with a sound conclusion. Response is well founded in detailed exemplar knowledge and strong conceptual understanding of the topic. Examples used are appropriate and integrated effectively into the response. Level 3 (11–15) Response discusses the extent to which wind action is the main cause of desertification in semi-arid environments. Response is broadly evaluative in character, comprising some explanatory or narrative content and a conclusion. Response develops on a largely secure base of knowledge and understanding with the use of example(s). Level 2 (6–10) Response demonstrates some knowledge and understanding of the extent to which wind action is the main cause of desertification in semi-arid environments. Response is mainly descriptive or explanatory in approach and contains a brief or thinly supported evaluation. Responses without the use of example(s) to support the response will not get above the middle of Level 2 (8 marks). 12 Level 1 (1–5) Response makes a few general points about whether wind action is the main cause of desertification in semi-arid environments. A descriptive response comprising a few simple points. Knowledge is basic and understanding may be poor and lack relevance to the question set. Level 0 (0) No creditable response.
What was in this paper
The subtopics covered by these 12 questions, and how many questions each got. Open one in a new tab to see every Cambridge question on it.
2Hot arid and semi-arid climates2Humid tropical (rainforest) ecosystems and seasonally humid tropical (savanna) ecosystems2Hazards resulting from atmospheric disturbances1Hazards resulting from mass movements1Hazards resulting from tectonic processes1Landforms of tropical environments1Sustainable management in hazardous environments1Sustainable management of hot arid and semi-arid environments1What you needed in this session
Cambridge’s own grade thresholds for 2025 Oct/Nov, Paper 3 · Variant 3. A higher threshold means an easier paper — the bar moves with how the cohort did.