Cambridge A Level Geography 9696 — 2024 May/June Paper 3 · Variant 2
9696/32/M/J/24 · 11 questions · 60 marks · ≈68 min
The question paper and its mark scheme, free to read here and free to download. This is Cambridge’s own paper, exactly as it was sat.
Question paper4 pages
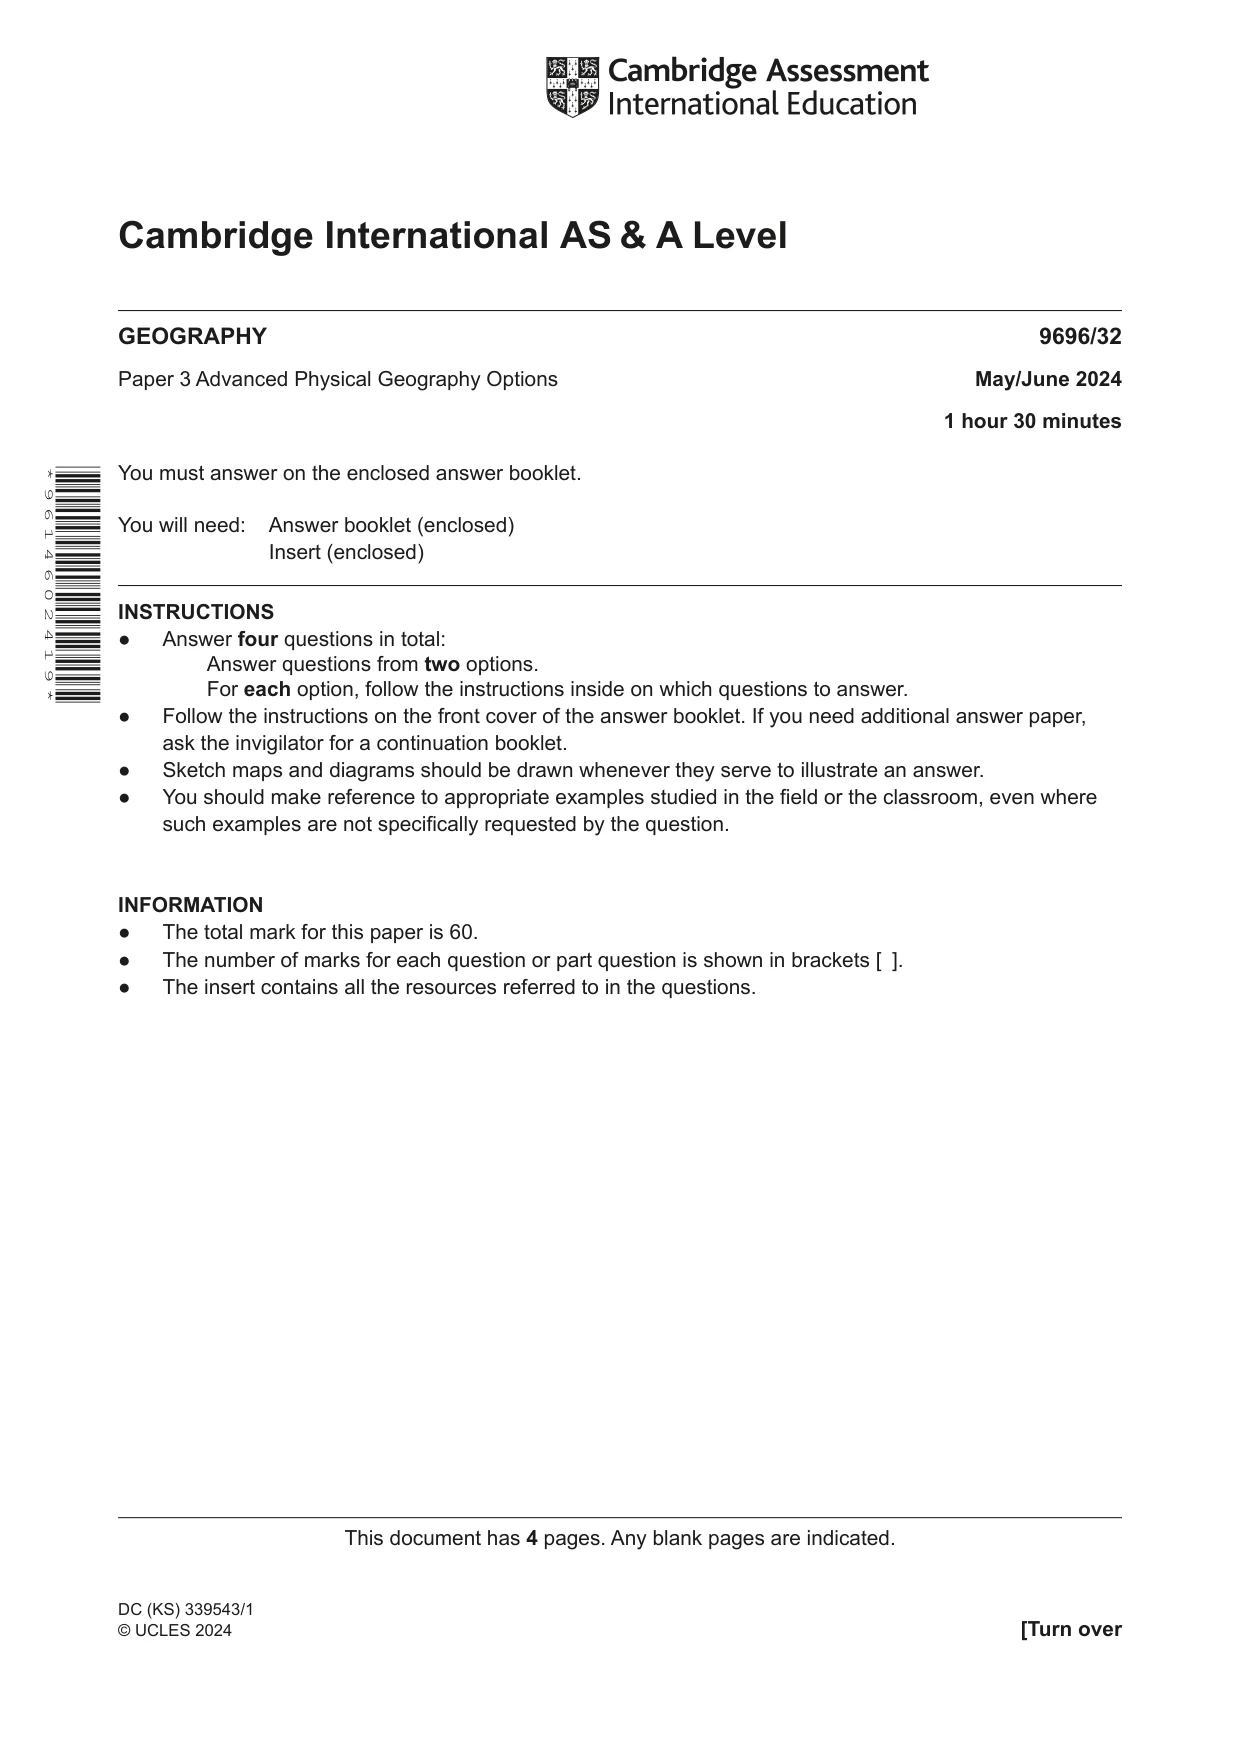
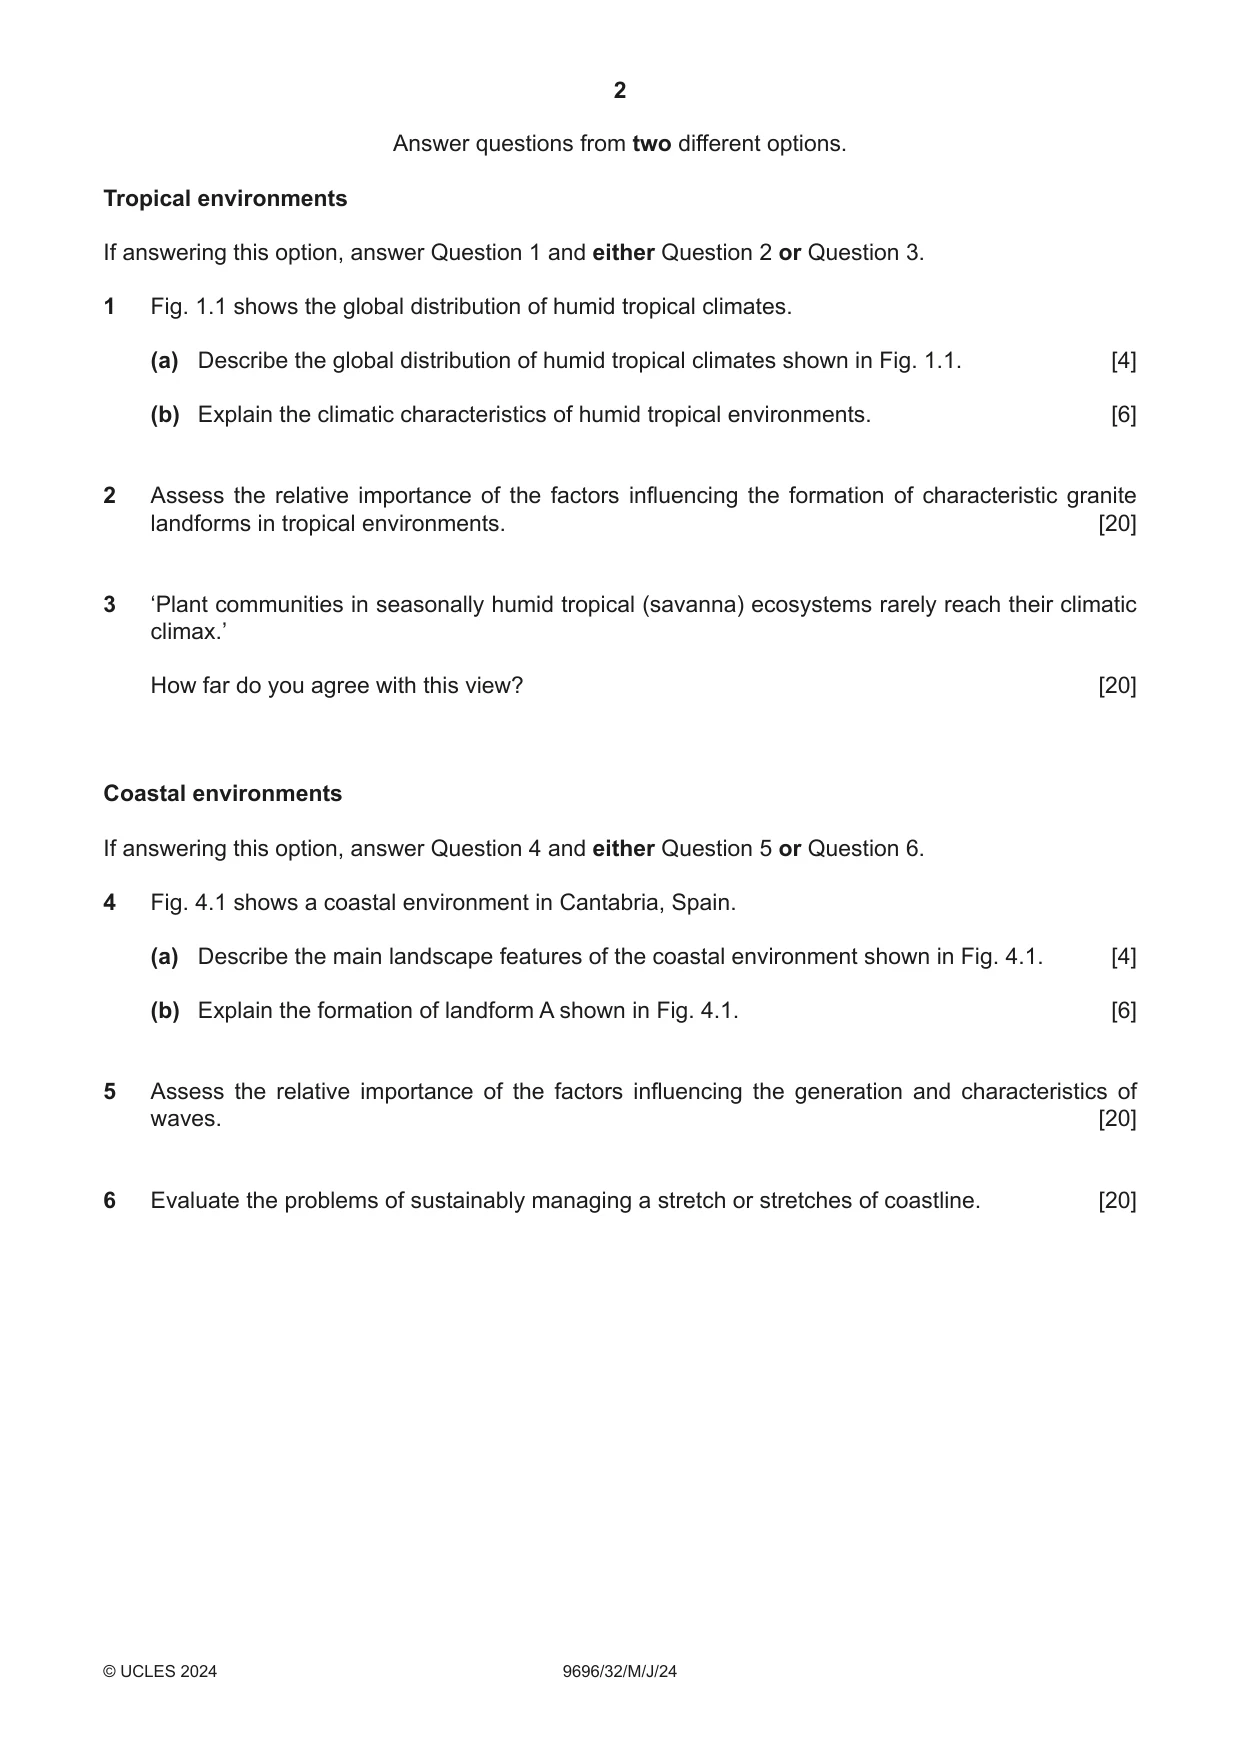
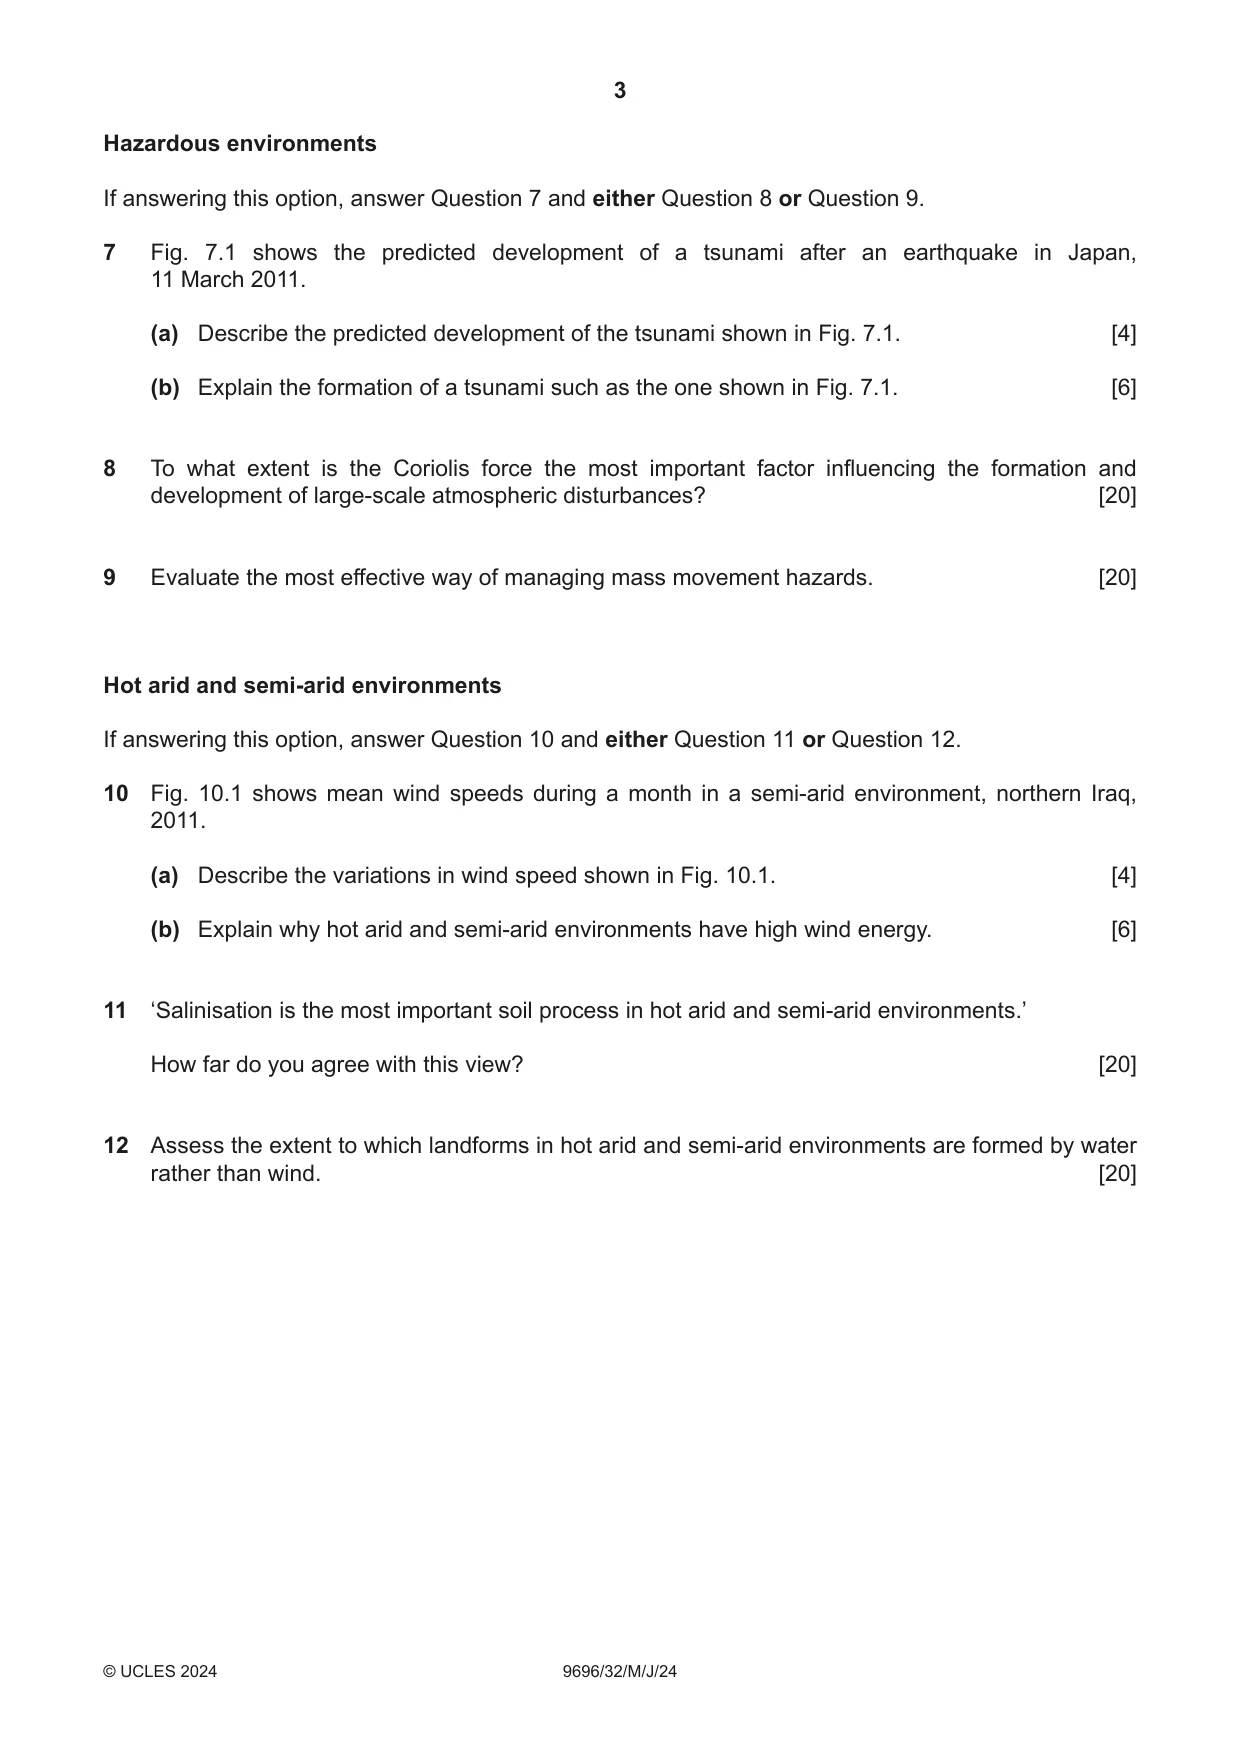

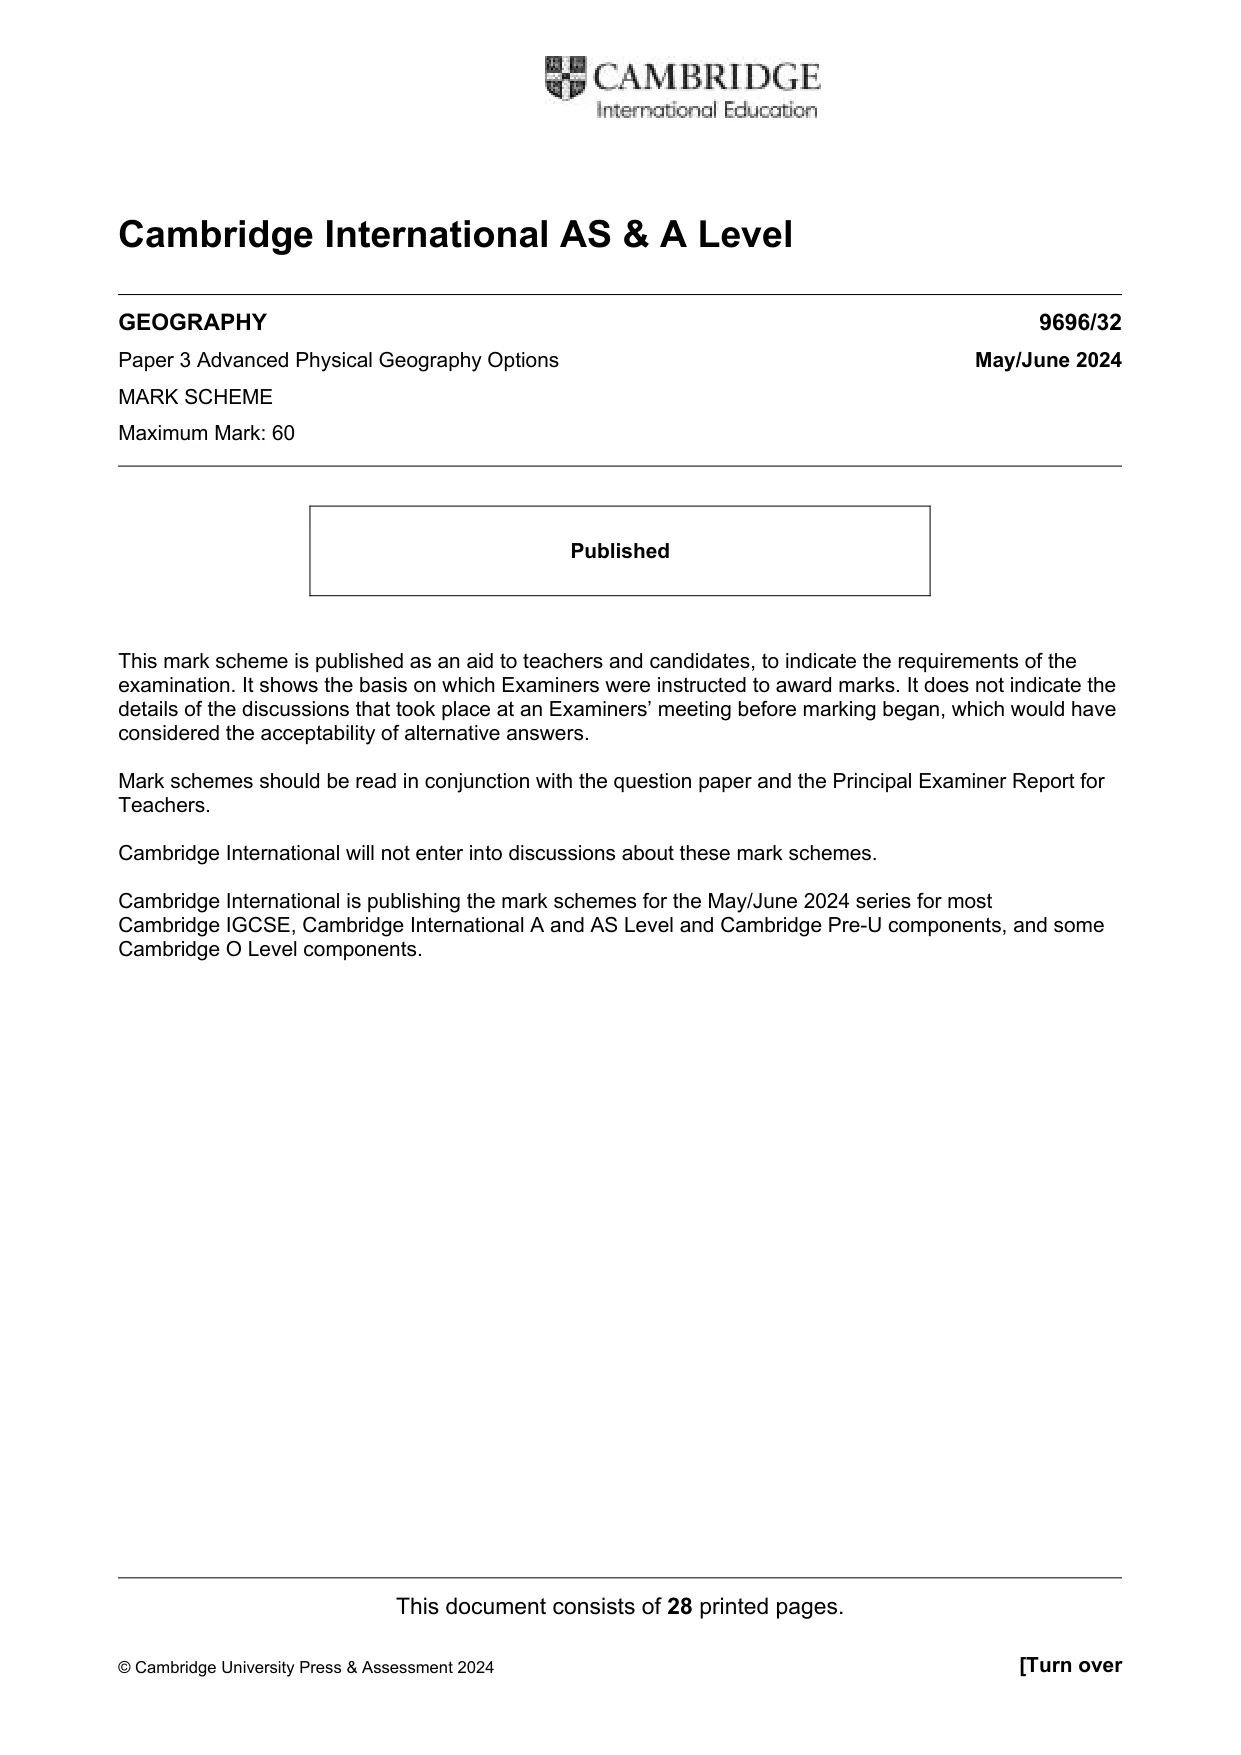
Mark scheme28 pages
Answers below. Sit the paper first if you are practising.

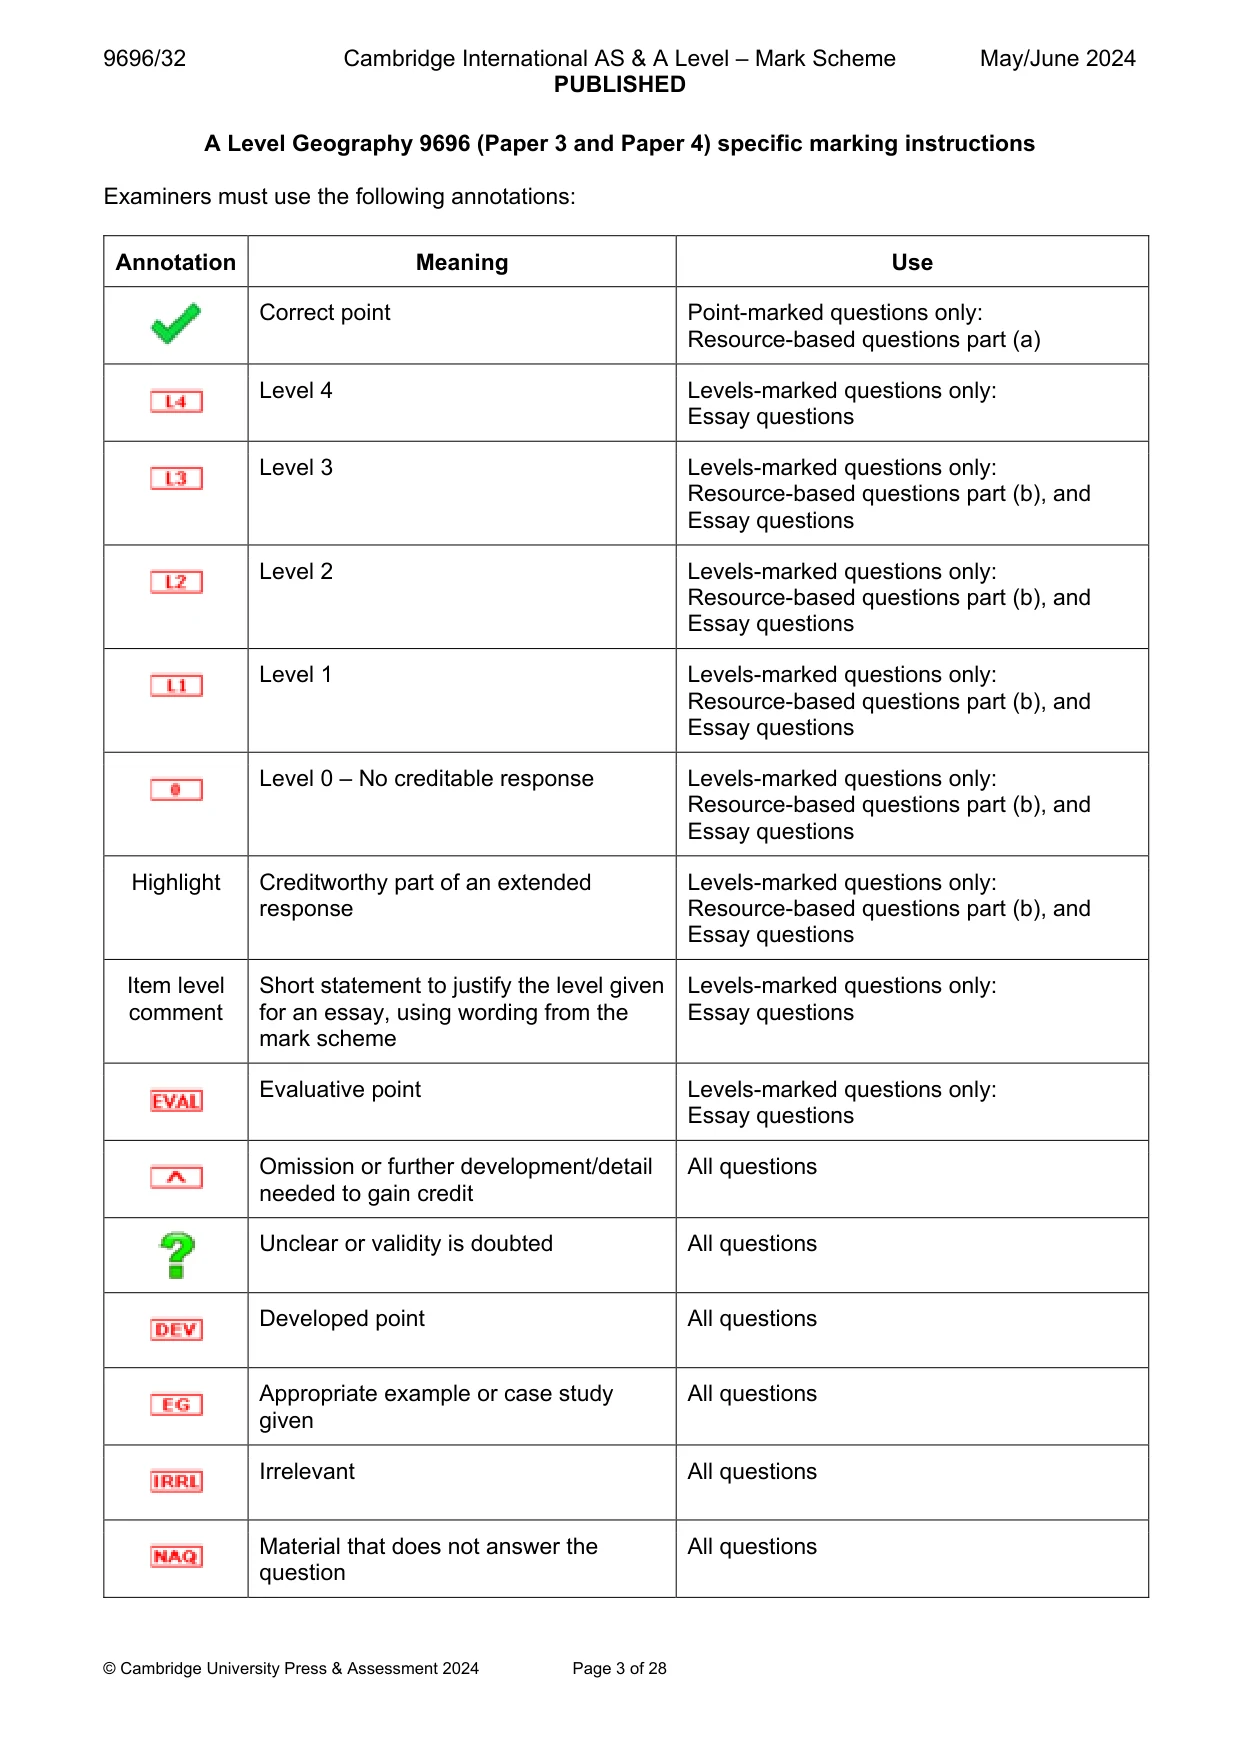








Questions as text
Q1 · The global distribution of humid tropical climates
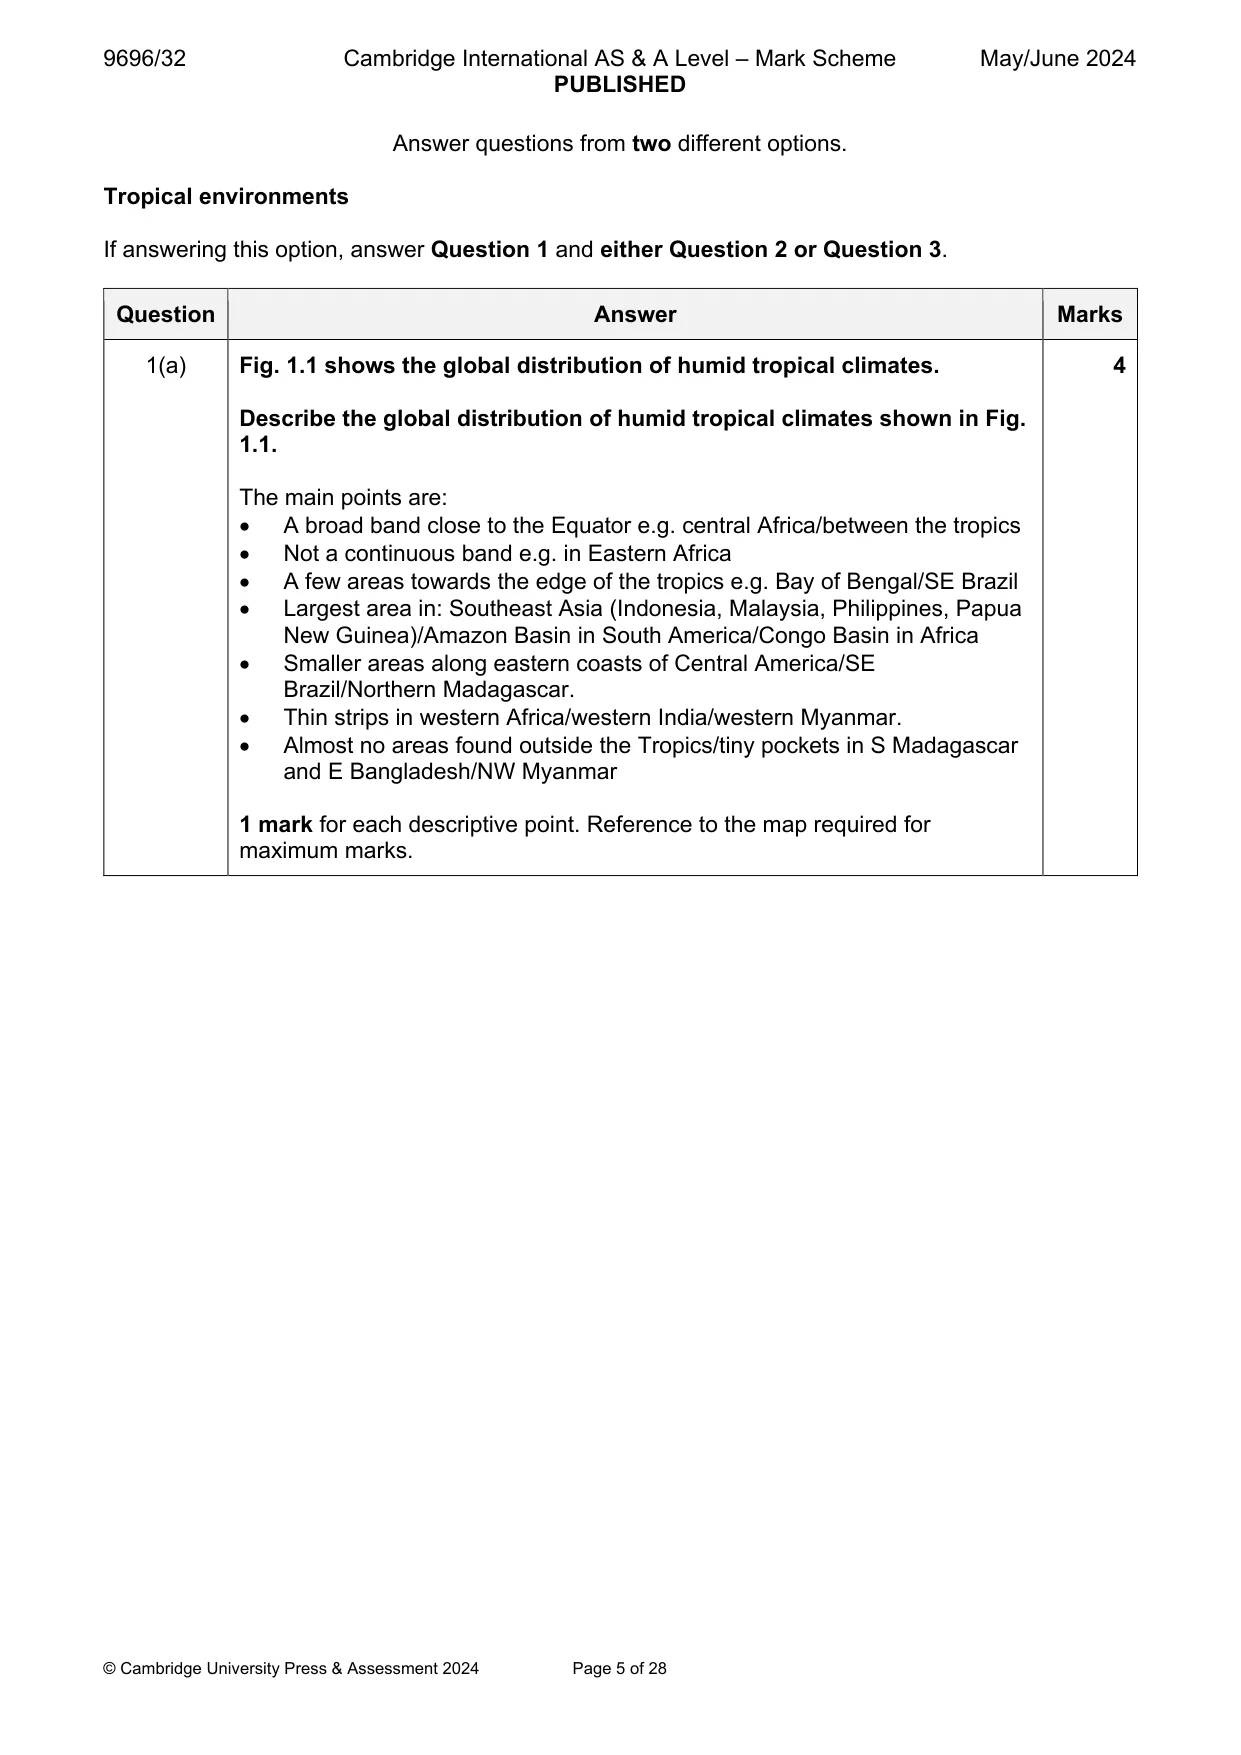
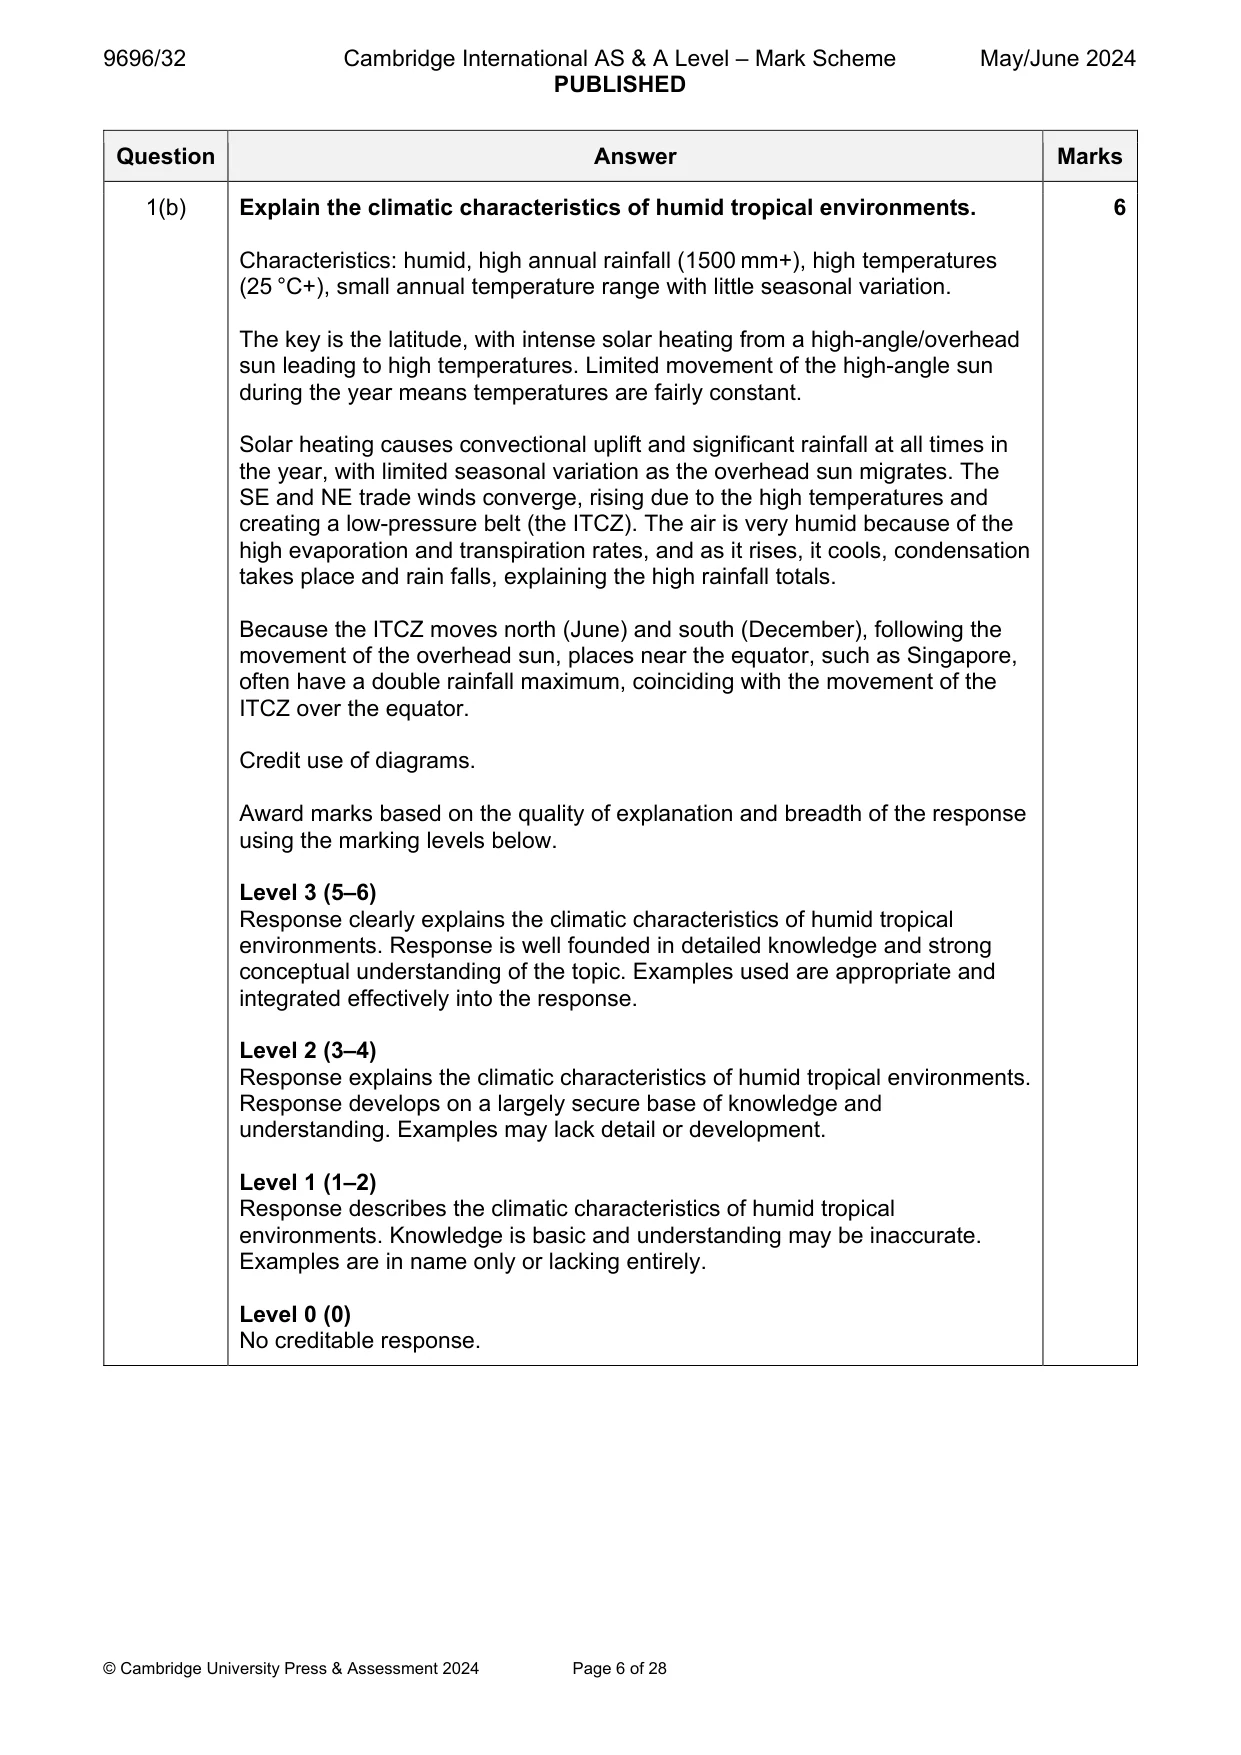
1 Fig. 1.1 shows the global distribution of humid tropical climates. (a) Describe the global distribution of humid tropical climates shown in Fig. 1.1. [4] (b) Explain the climatic characteristics of humid tropical environments. [6]
Mark scheme: Question Answer Marks 1(a) Fig. 1.1 shows the global distribution of humid tropical climates. 4 Describe the global distribution of humid tropical climates shown in Fig. 1.1. The main points are: A broad band close to the Equator e.g. central Africa/between the tropics Not a continuous band e.g. in Eastern Africa A few areas towards the edge of the tropics e.g. Bay of Bengal/SE Brazil Largest area in: Southeast Asia (Indonesia, Malaysia, Philippines, Papua New Guinea)/Amazon Basin in South America/Congo Basin in Africa Smaller areas along eastern coasts of Central America/SE Brazil/Northern Madagascar. Thin strips in western Africa/western India/western Myanmar. Almost no areas found outside the Tropics/tiny pockets in S Madagascar and E Bangladesh/NW Myanmar 1 mark for each descriptive point. Reference to the map required for maximum marks. 1(b) Explain the climatic characteristics of humid tropical environments. 6 Characteristics: humid, high annual rainfall (1500 mm+), high temperatures (25 °C+), small annual temperature range with little seasonal variation. The key is the latitude, with intense solar heating from a high-angle/overhead sun leading to high temperatures. Limited movement of the high-angle sun during the year means temperatures are fairly constant. Solar heating causes convectional uplift and significant rainfall at all times in the year, with limited seasonal variation as the overhead sun migrates. The SE and NE trade winds converge, rising due to the high temperatures and creating a low-pressure belt (the ITCZ). The air is very humid because of the high evaporation and transpiration rates, and as it rises, it cools, condensation takes place and rain falls, explaining the high rainfall totals. Because the ITCZ moves north (June) and south (December), following the movement of the overhead sun, places near the equator, such as Singapore, often have a double rainfall maximum, coinciding with the movement of the ITCZ over the equator. Credit use of diagrams. Award marks based on the quality of explanation and breadth of the response using the marking levels below. Level 3 (5–6) Response clearly explains the climatic characteristics of humid tropical environments. Response is well founded in detailed knowledge and strong conceptual understanding of the topic. Examples used are appropriate and integrated effectively into the response. Level 2 (3–4) Response explains the climatic characteristics of humid tropical environments. Response develops on a largely secure base of knowledge and understanding. Examples may lack detail or development. Level 1 (1–2) Response describes the climatic characteristics of humid tropical environments. Knowledge is basic and understanding may be inaccurate. Examples are in name only or lacking entirely. Level 0 (0) No creditable response.
Q2 · Assess the relative importance of the factors influencing the formation of characteristic…
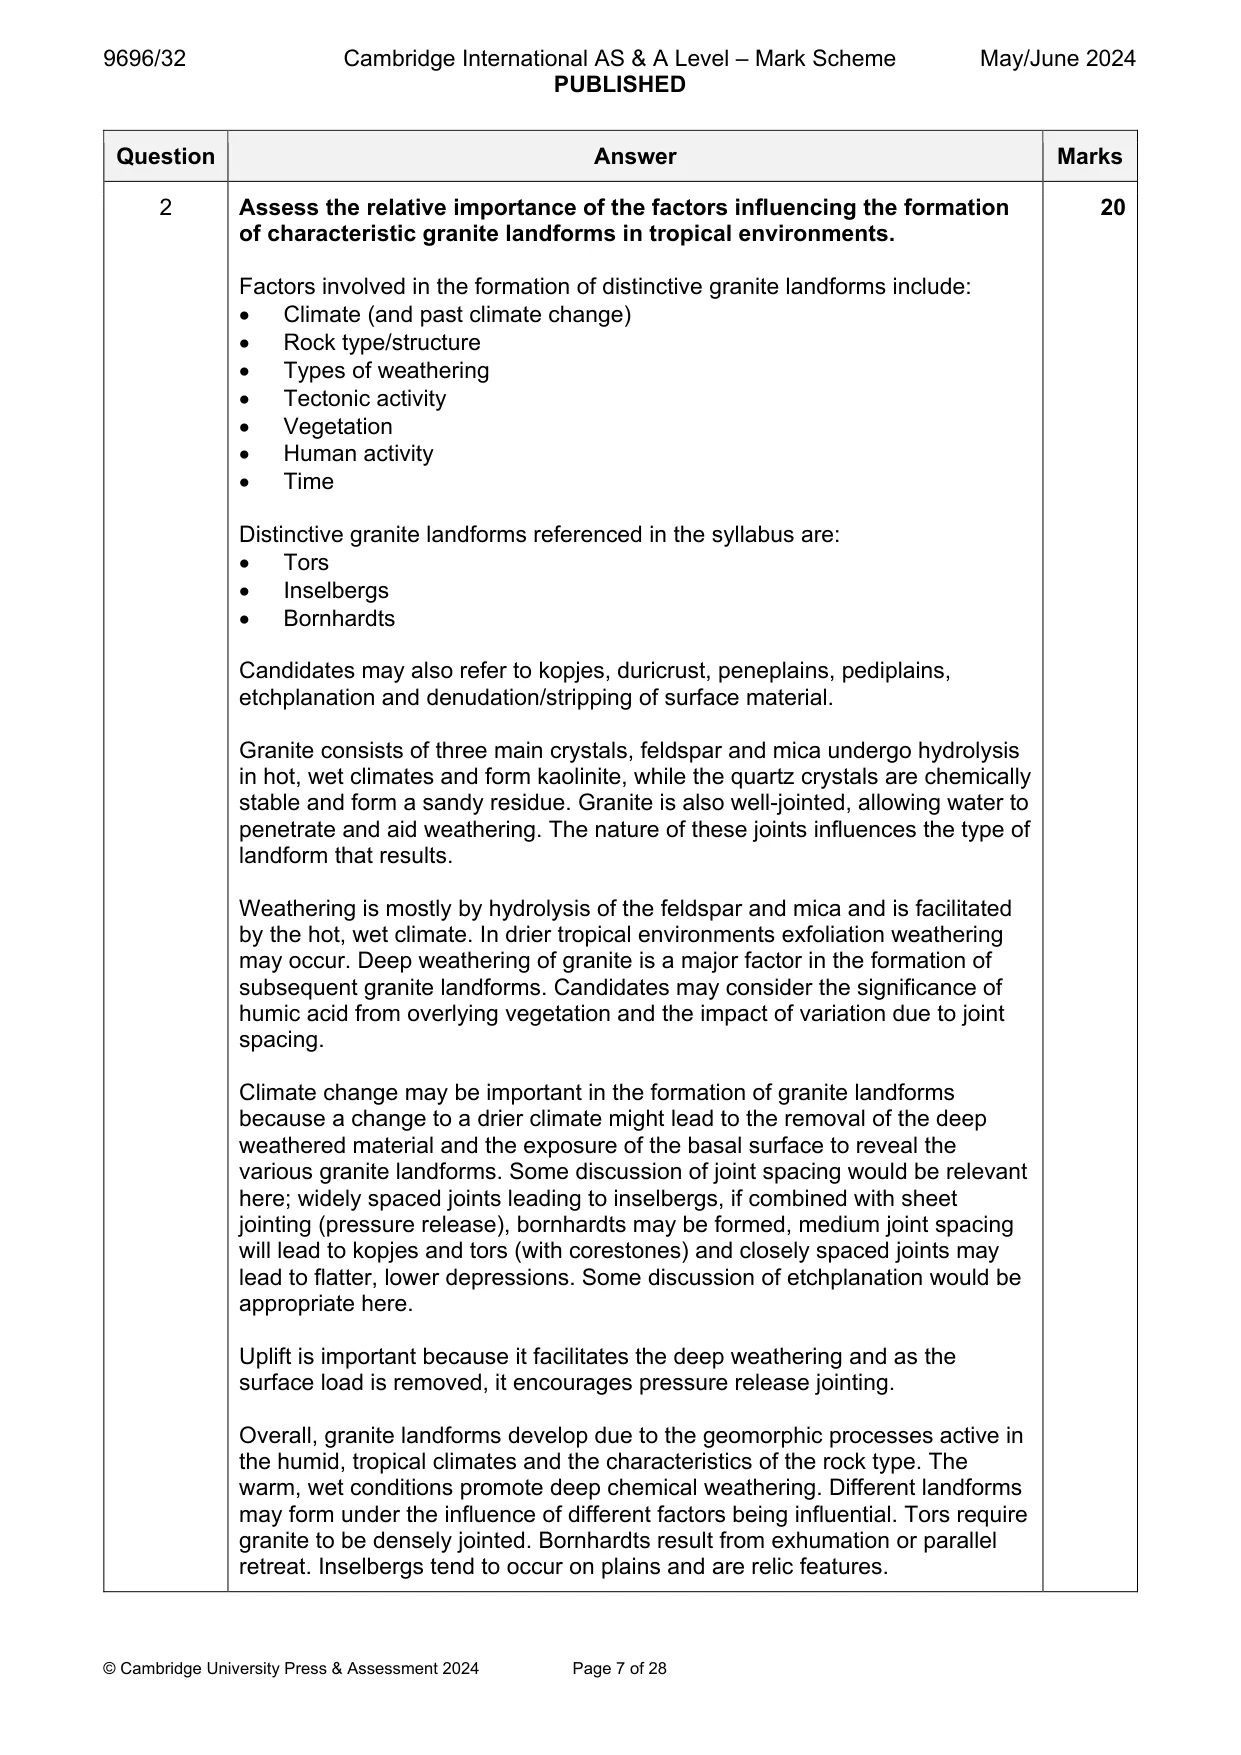
2 Assess the relative importance of the factors influencing the formation of characteristic granite landforms in tropical environments. [20]
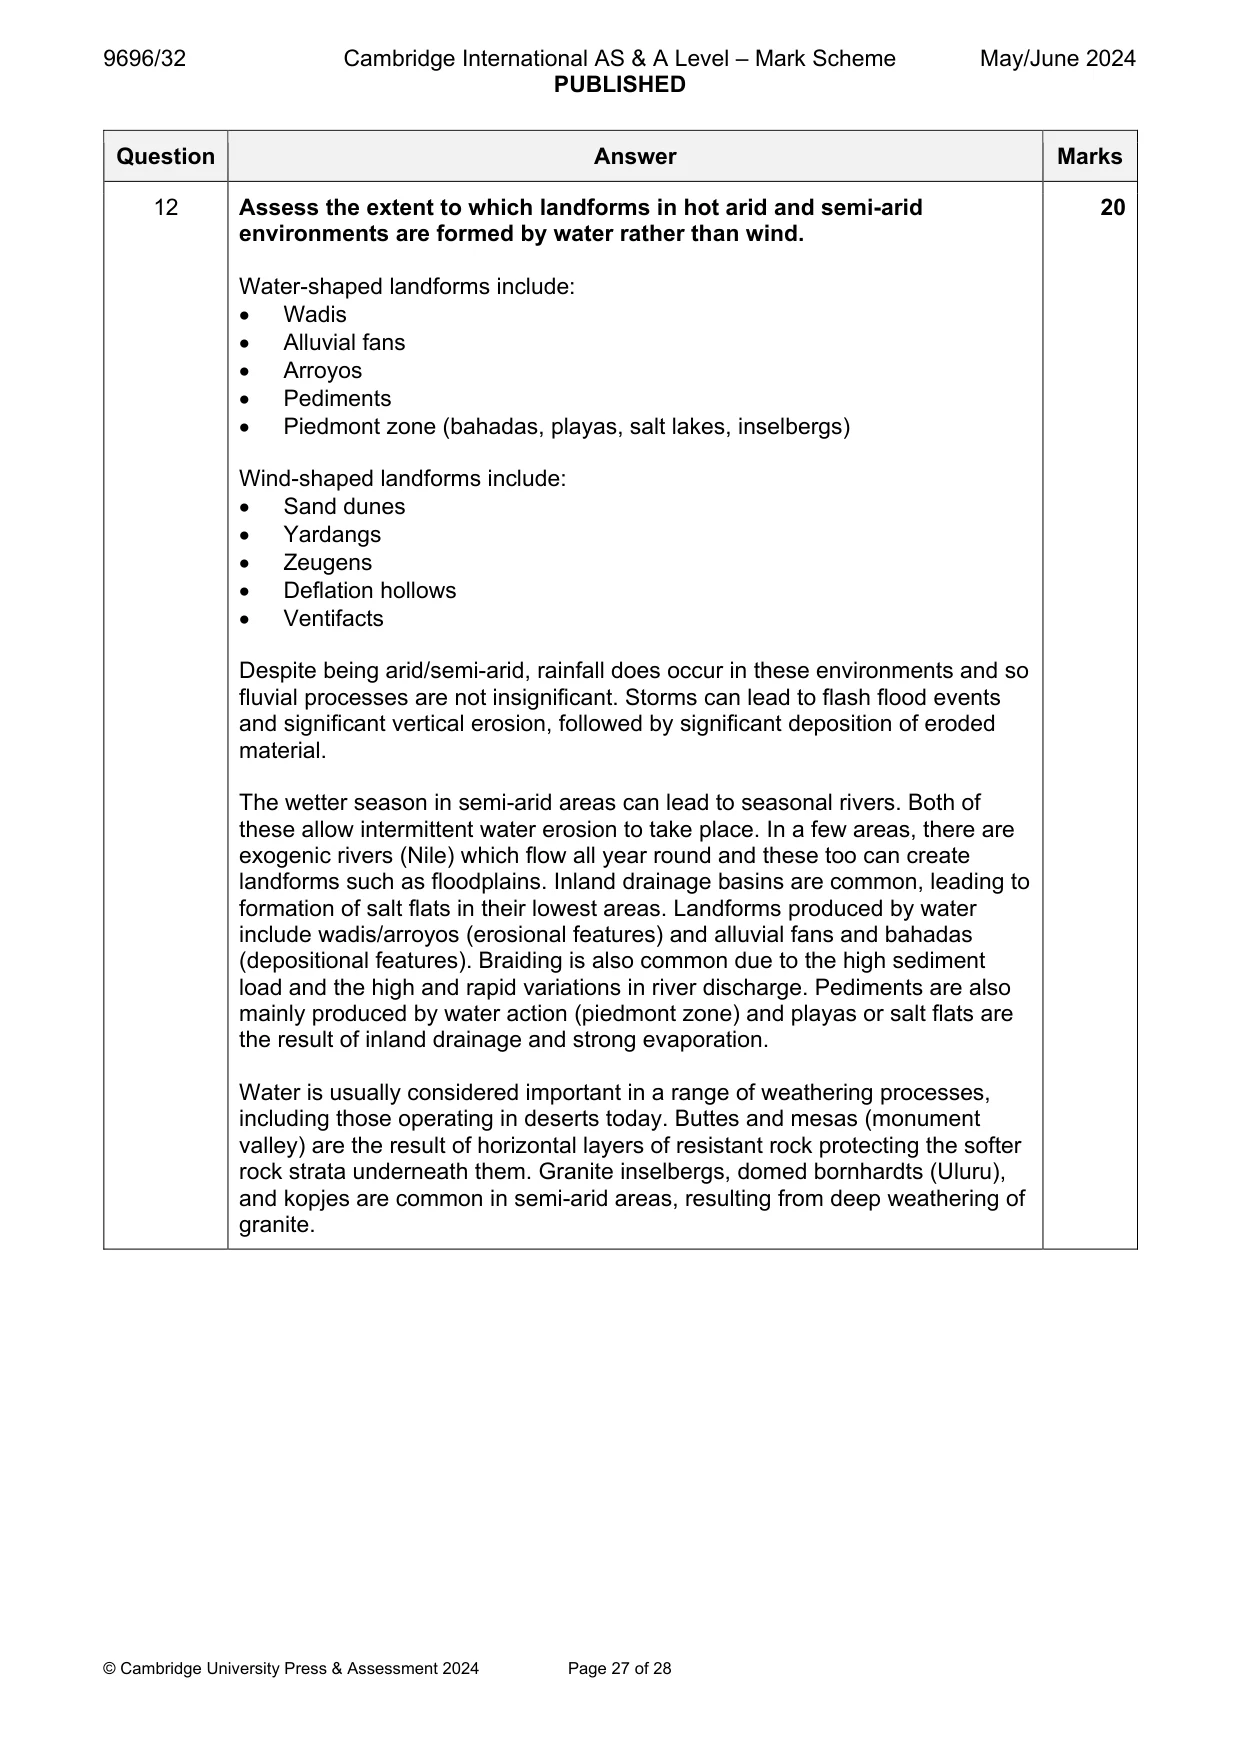
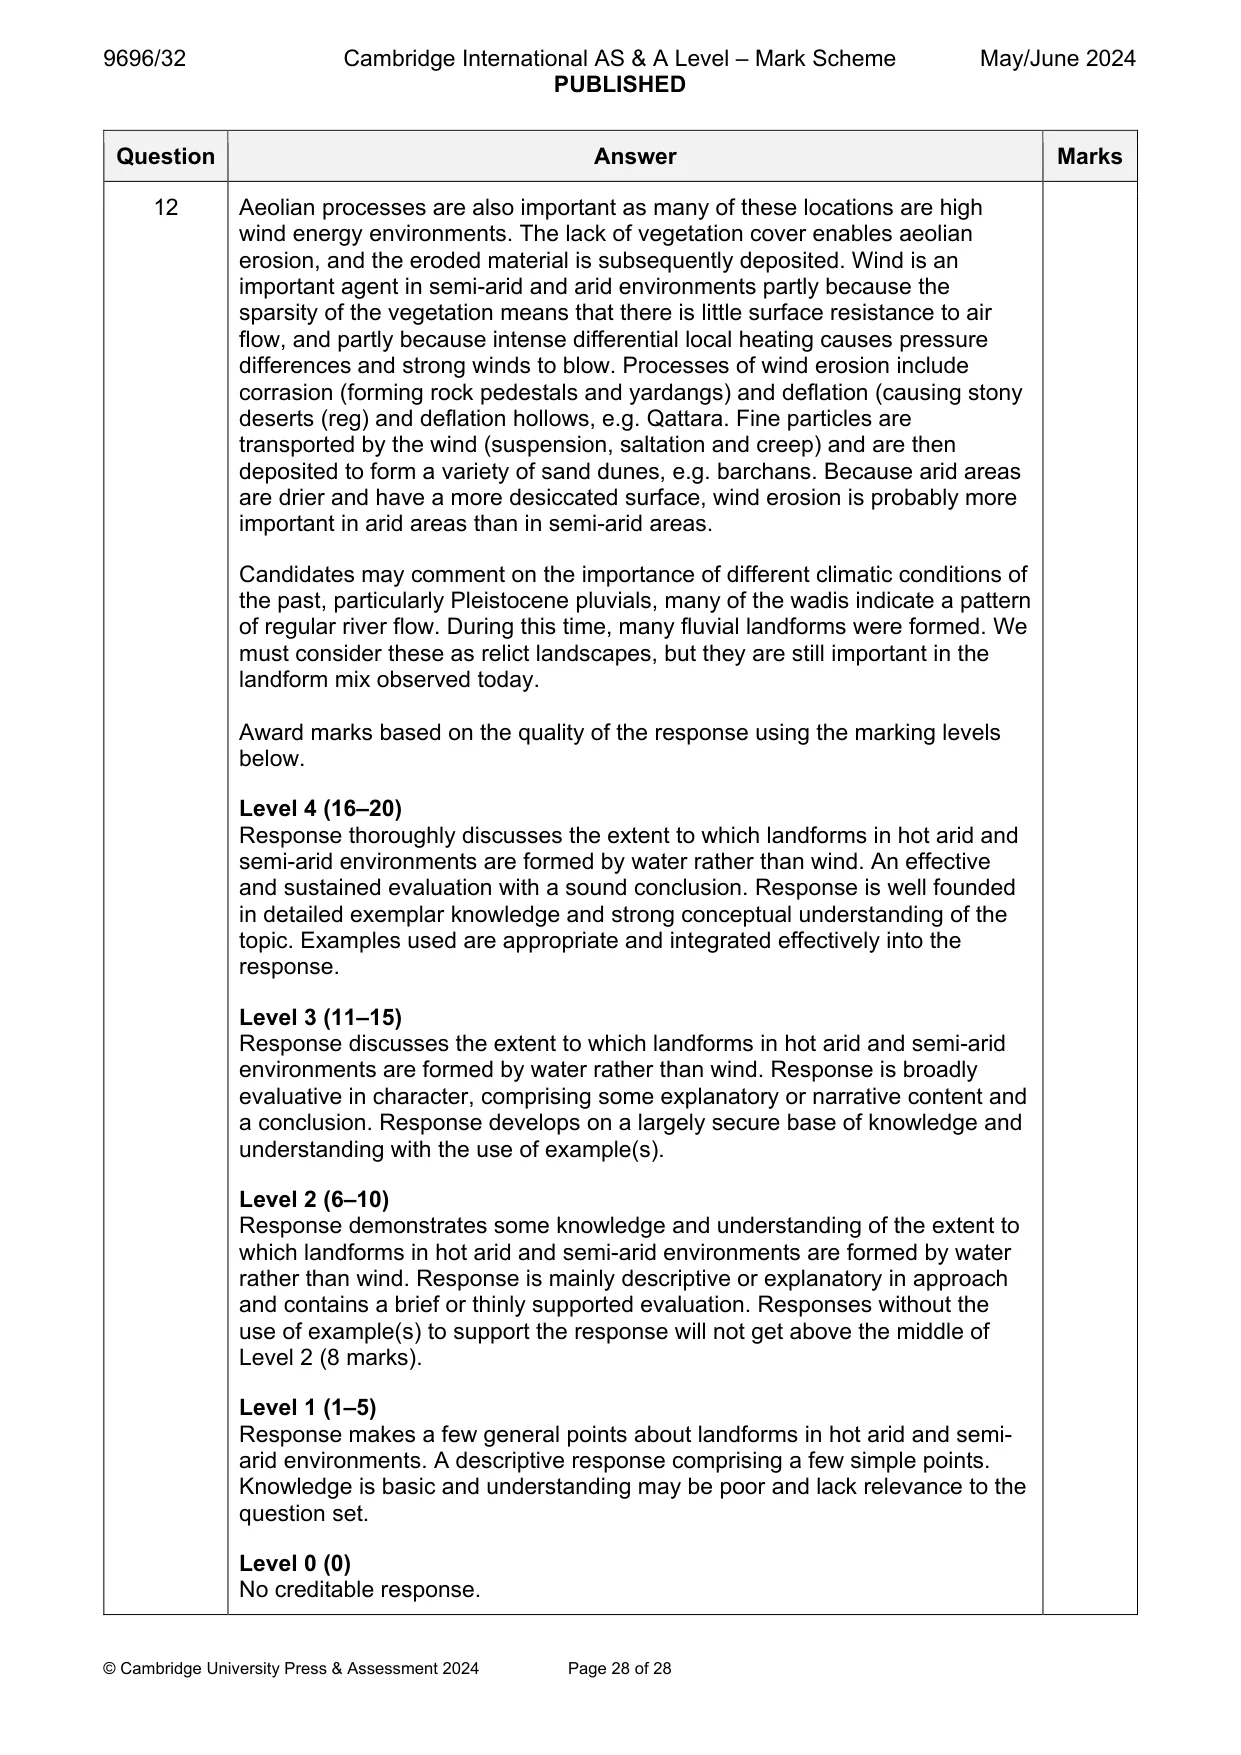
Mark scheme: 2 Assess the relative importance of the factors influencing the formation 20 of characteristic granite landforms in tropical environments. Factors involved in the formation of distinctive granite landforms include: Climate (and past climate change) Rock type/structure Types of weathering Tectonic activity Vegetation Human activity Time Distinctive granite landforms referenced in the syllabus are: Tors Inselbergs Bornhardts Candidates may also refer to kopjes, duricrust, peneplains, pediplains, etchplanation and denudation/stripping of surface material. Granite consists of three main crystals, feldspar and mica undergo hydrolysis in hot, wet climates and form kaolinite, while the quartz crystals are chemically stable and form a sandy residue. Granite is also well-jointed, allowing water to penetrate and aid weathering. The nature of these joints influences the type of landform that results. Weathering is mostly by hydrolysis of the feldspar and mica and is facilitated by the hot, wet climate. In drier tropical environments exfoliation weathering may occur. Deep weathering of granite is a major factor in the formation of subsequent granite landforms. Candidates may consider the significance of humic acid from overlying vegetation and the impact of variation due to joint spacing. Climate change may be important in the formation of granite landforms because a change to a drier climate might lead to the removal of the deep weathered material and the exposure of the basal surface to reveal the various granite landforms. Some discussion of joint spacing would be relevant here; widely spaced joints leading to inselbergs, if combined with sheet jointing (pressure release), bornhardts may be formed, medium joint spacing will lead to kopjes and tors (with corestones) and closely spaced joints may lead to flatter, lower depressions. Some discussion of etchplanation would be appropriate here. Uplift is important because it facilitates the deep weathering and as the surface load is removed, it encourages pressure release jointing. Overall, granite landforms develop due to the geomorphic processes active in the humid, tropical climates and the characteristics of the rock type. The warm, wet conditions promote deep chemical weathering. Different landforms may form under the influence of different factors being influential. Tors require granite to be densely jointed. Bornhardts result from exhumation or parallel retreat. Inselbergs tend to occur on plains and are relic features. 2 However, candidates are likely to conclude that overall, it is rock type, and especially the density of jointing, that is the most important factor in determining the depth of weathering and the nature of landforms that emerge when the regolith is removed. Other factors are of much lesser importance. Examples could include different parts of the world, the different landforms and actual named features. Award marks based on the quality of the response using the marking levels below. Level 4 (16–20) Response thoroughly discusses the relative importance of the factors influencing the formation of characteristic granite landforms in tropical environments. An effective and sustained evaluation with a sound conclusion. Response is well founded in detailed exemplar knowledge and strong conceptual understanding of the topic. Examples used are appropriate and integrated effectively into the response. Level 3 (11–15) Response discusses the relative importance of the factors influencing the formation of characteristic granite landforms in tropical environments. Response is broadly evaluative in character, comprising some explanatory or narrative content and a conclusion. Response develops on a largely secure base of knowledge and understanding with the use of example(s). Level 2 (6–10) Response demonstrates some knowledge and understanding of the relative importance of the factors influencing the formation of characteristic granite landforms in tropical environments. Response is mainly descriptive or explanatory in approach and contains a brief or thinly supported evaluation. Responses without the use of example(s) to support the response will not get above the middle of Level 2 (8 marks). Level 1 (1–5) Response makes a few general points about the factors influencing the formation of characteristic granite landforms in tropical environments. A descriptive response comprising a few simple points. Knowledge is basic and understanding may be poor and lack relevance to the question set. Level 0 (0) No creditable response.
Q3 · ‘Plant communities in seasonally humid tropical (savanna) ecosystems rarely reach their…
3 ‘Plant communities in seasonally humid tropical (savanna) ecosystems rarely reach their climatic climax.’ How far do you agree with this view? [20] Coastal environments If answering this option, answer Question 4 and either Question 5 or Question 6.
Mark scheme: 3 ‘Plant communities in seasonally humid tropical (savanna) ecosystems 20 rarely reach their climatic climax.’ How far do you agree with this view? Seasonally humid climates are hot with temperatures usually > 20 °C. The key climatic feature is the dry season which varies in length and intensity, typically 1–7 months with a mean precipitation < 50 mm/month. There is an annual excess of evapotranspiration over precipitation, and this in turn is related to the length of the wet season, determined by the movement of the ITCZ. Vegetation communities are the combination of different species living together in an ecosystem. They develop over time and succession theory suggests that eventually they achieve an equilibrium, climax state under the controlling influence of the climate. In the savanna, the longer the dry season, the more xerophytic the adaptations shown. There is no one savanna ecosystem but an ecocline – e.g. in West Africa, the dry season and the xerophytic adaptations increase as you go north, and four main types of savanna can be recognised: wooded savanna (1200 mm of rain p.a.), park savanna (900 mm p.a.), shrub savanna (600 mm p.a.) and grass savanna (500 mm p.a.). However, there is not a clear correlation between rainfall and type, and often a sharp boundary between forest and grassland, so rainfall may not be the determining factor. However, other local limiting factors are important, and can lead to a sub- climax or plagio-climax vegetation. This often stops the tallest vegetation from succeeding to climax. These may include: Natural fires started by lightning strikes during the wet season Drainage and soil conditions Human-induced fires started by herders to encourage grass growth Grazing animals –if young saplings are eaten, they cannot regrow, grasses regrow quicker Agriculture Resource extraction Population pressure Some argue that the savanna community itself is a sub-climax community resulting from Pleistocene climate change and natural fires; dominant species now tend to be fire-resistant. There are significant variations in climate and other factors across the savanna giving rise to communities ranging from grassland, to parkland, to woodland. Examples could include more vegetation species, more xerophytic adaptations, and reference to specific savanna areas. 3 Award marks based on the quality of the response using the marking levels below. Level 4 (16–20) Response thoroughly discusses the extent to which plant communities in seasonally humid tropical (savanna) ecosystems rarely reach their climatic climax. An effective and sustained evaluation with a sound conclusion. Response is well founded in detailed exemplar knowledge and strong conceptual understanding of the topic. Examples used are appropriate and integrated effectively into the response. Level 3 (11–15) Response discusses the extent to which plant communities in seasonally humid tropical (savanna) ecosystems rarely reach their climatic climax. Response is broadly evaluative in character, comprising some explanatory or narrative content and a conclusion. Response develops on a largely secure base of knowledge and understanding with the use of example(s). Level 2 (6–10) Response demonstrates some knowledge and understanding of the extent to which plant communities in seasonally humid tropical (savanna) ecosystems rarely reach their climatic climax. Response is mainly descriptive or explanatory in approach and contains a brief or thinly supported evaluation. Responses without the use of example(s) to support the response will not get above the middle of Level 2 (8 marks). Level 1 (1–5) Response makes a few general points about the succession of savanna plant communities. A descriptive response comprising a few simple points. Knowledge is basic and understanding may be poor and lack relevance to the question set. Level 0 (0) No creditable response. Coastal environments If answering this option, answer Question 4 and either Question 5 or Question 6.
Q4 · A coastal environment in Cantabria, Spain
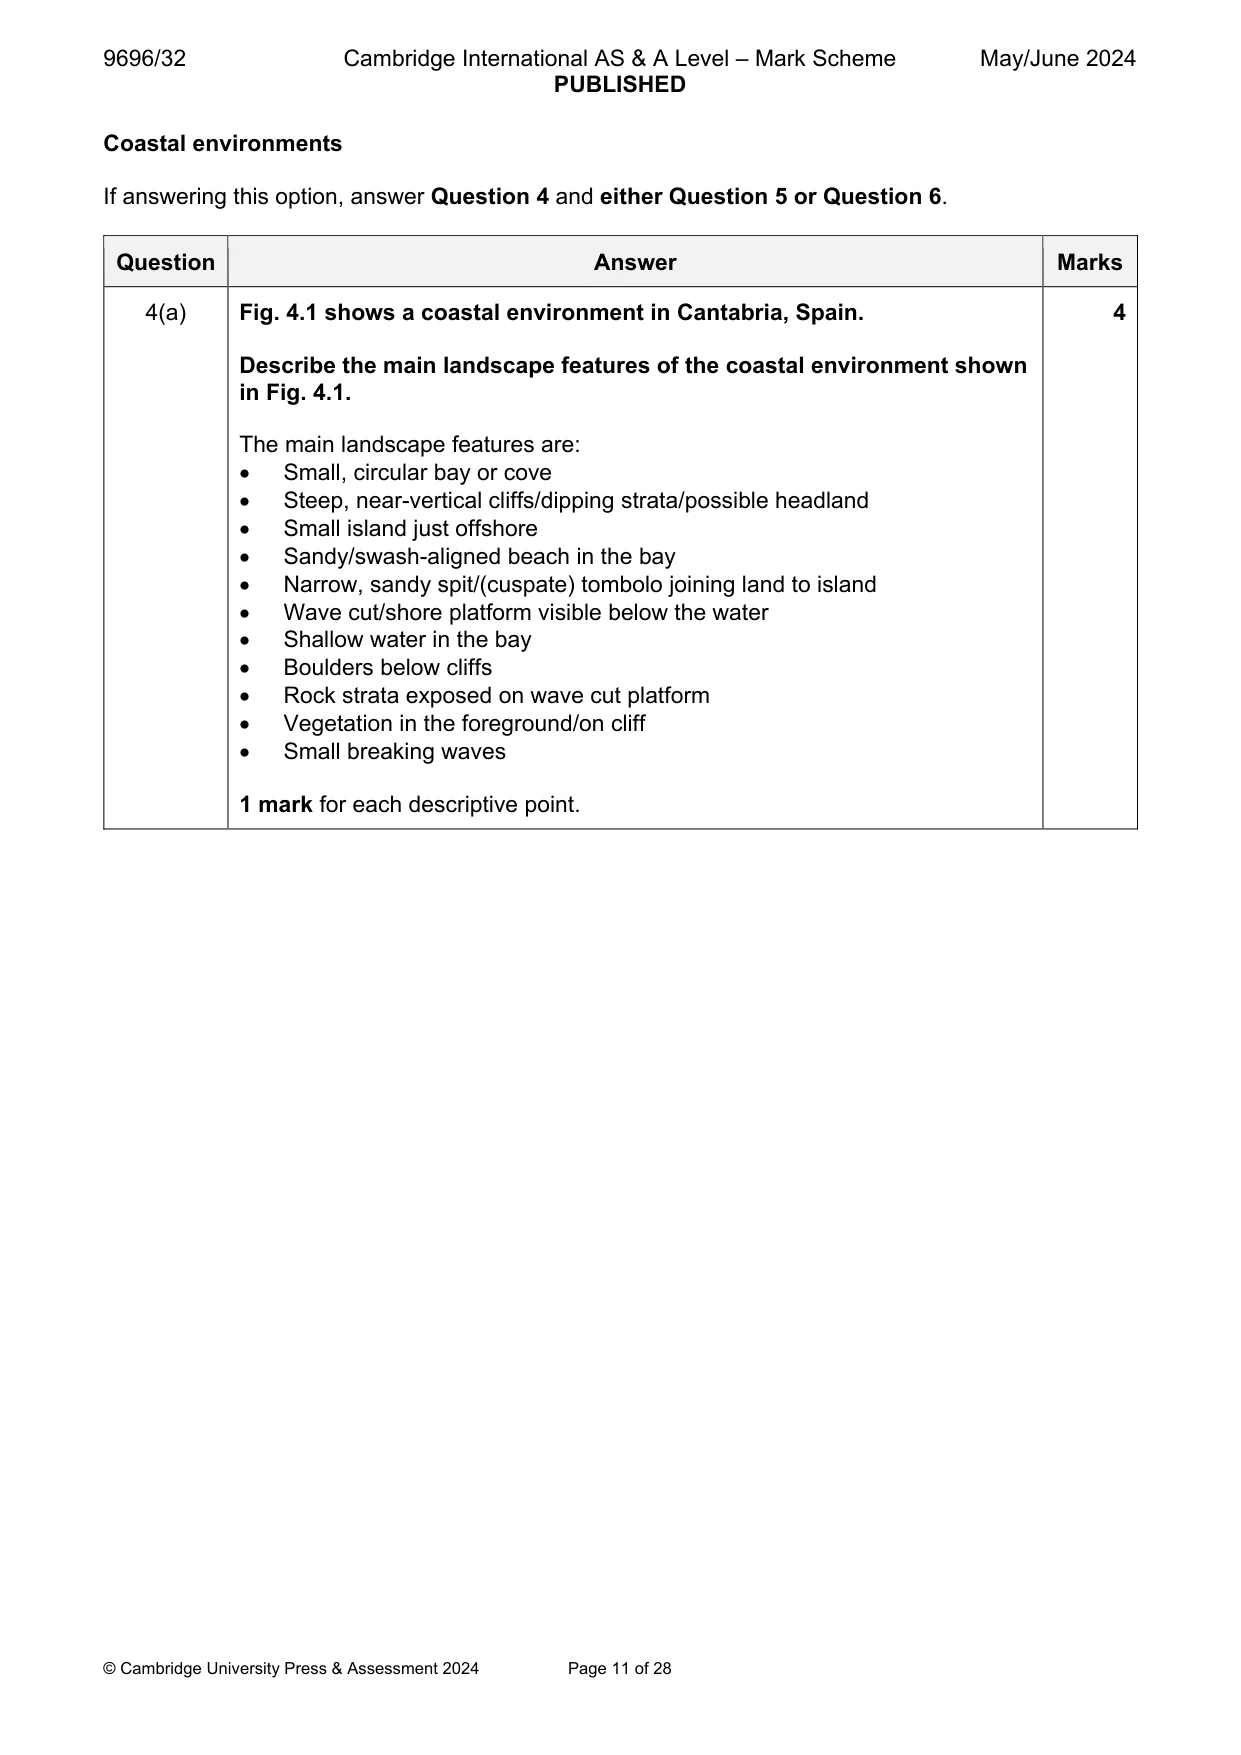
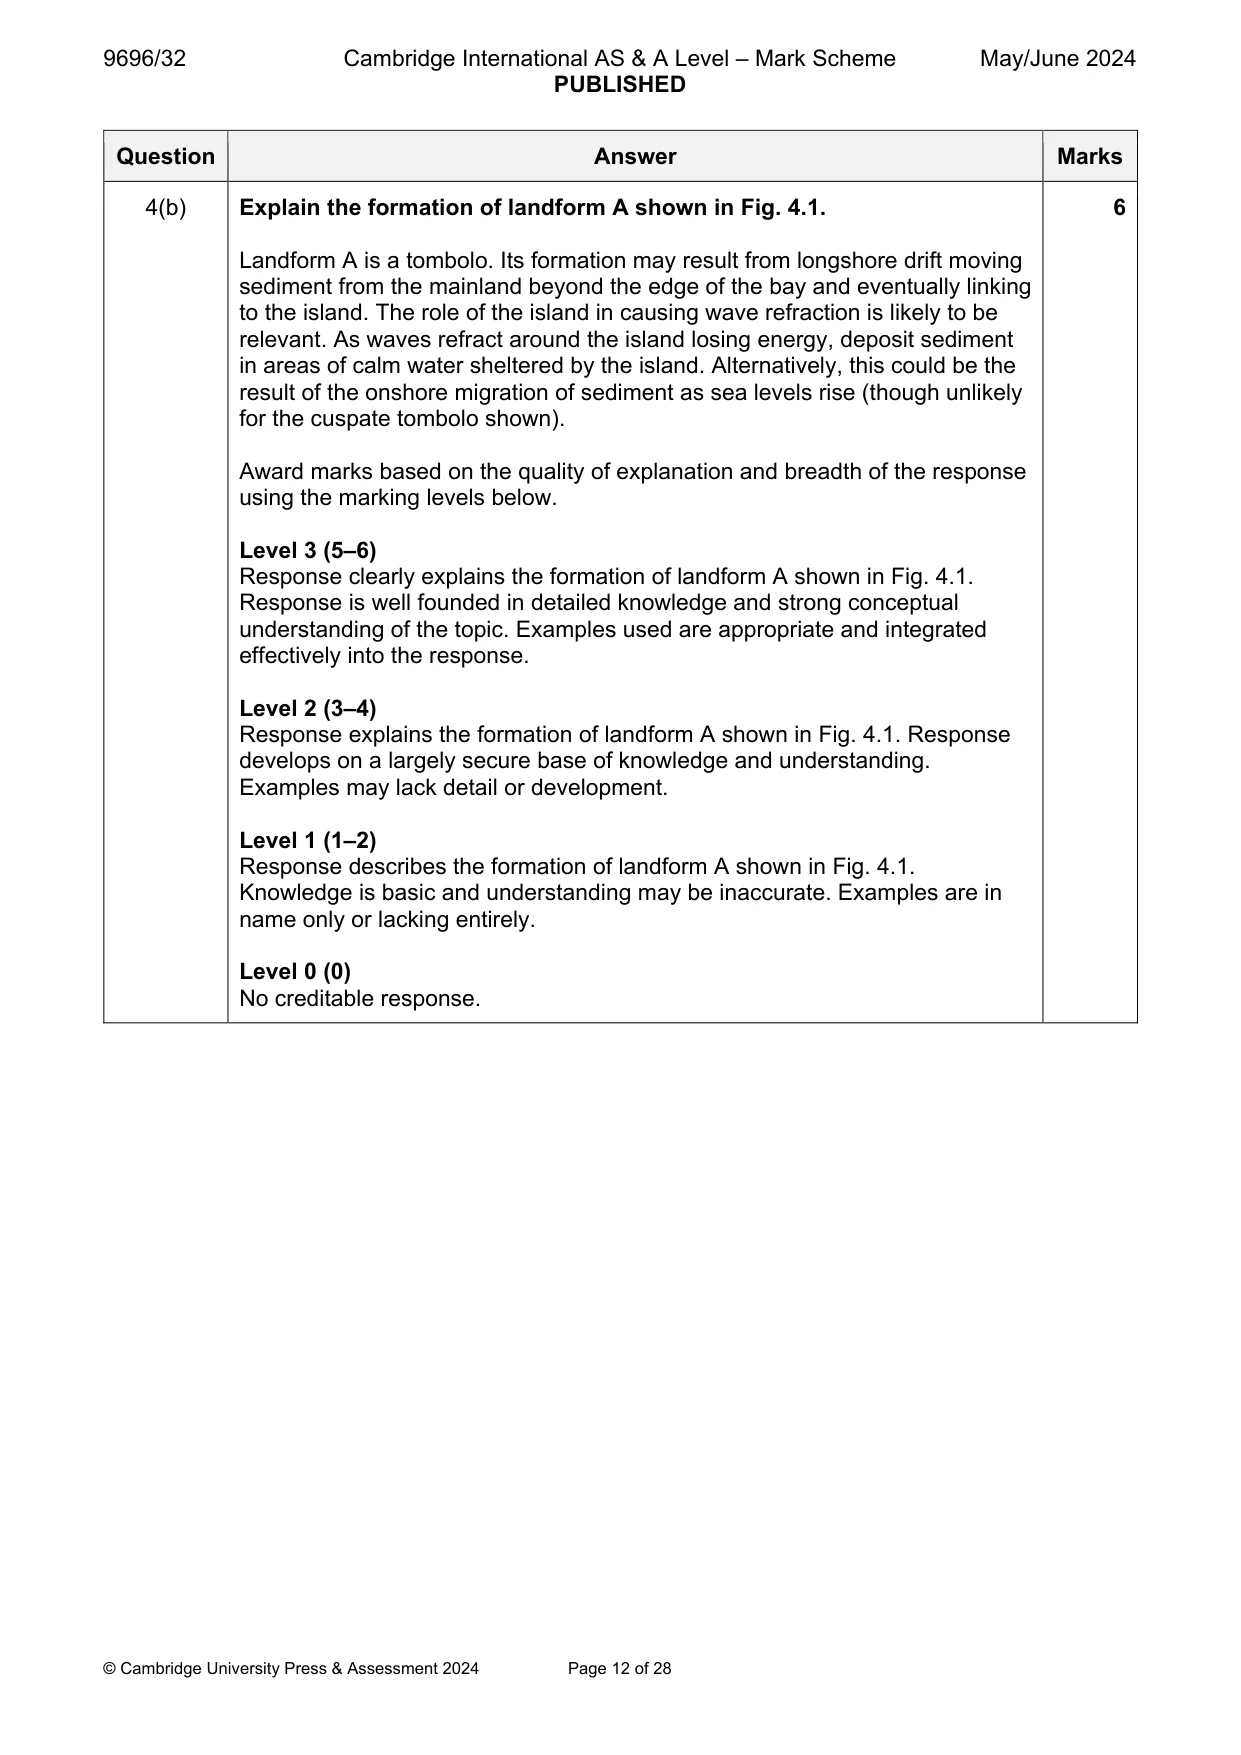
4 Fig. 4.1 shows a coastal environment in Cantabria, Spain. (a) Describe the main landscape features of the coastal environment shown in Fig. 4.1. [4] (b) Explain the formation of landform A shown in Fig. 4.1. [6]
Mark scheme: 4(a) Fig. 4.1 shows a coastal environment in Cantabria, Spain. 4 Describe the main landscape features of the coastal environment shown in Fig. 4.1. The main landscape features are: Small, circular bay or cove Steep, near-vertical cliffs/dipping strata/possible headland Small island just offshore Sandy/swash-aligned beach in the bay Narrow, sandy spit/(cuspate) tombolo joining land to island Wave cut/shore platform visible below the water Shallow water in the bay Boulders below cliffs Rock strata exposed on wave cut platform Vegetation in the foreground/on cliff Small breaking waves 1 mark for each descriptive point. 4(b) Explain the formation of landform A shown in Fig. 4.1. 6 Landform A is a tombolo. Its formation may result from longshore drift moving sediment from the mainland beyond the edge of the bay and eventually linking to the island. The role of the island in causing wave refraction is likely to be relevant. As waves refract around the island losing energy, deposit sediment in areas of calm water sheltered by the island. Alternatively, this could be the result of the onshore migration of sediment as sea levels rise (though unlikely for the cuspate tombolo shown). Award marks based on the quality of explanation and breadth of the response using the marking levels below. Level 3 (5–6) Response clearly explains the formation of landform A shown in Fig. 4.1. Response is well founded in detailed knowledge and strong conceptual understanding of the topic. Examples used are appropriate and integrated effectively into the response. Level 2 (3–4) Response explains the formation of landform A shown in Fig. 4.1. Response develops on a largely secure base of knowledge and understanding. Examples may lack detail or development. Level 1 (1–2) Response describes the formation of landform A shown in Fig. 4.1. Knowledge is basic and understanding may be inaccurate. Examples are in name only or lacking entirely. Level 0 (0) No creditable response.
Q5 · Assess the relative importance of the factors influencing the generation and…
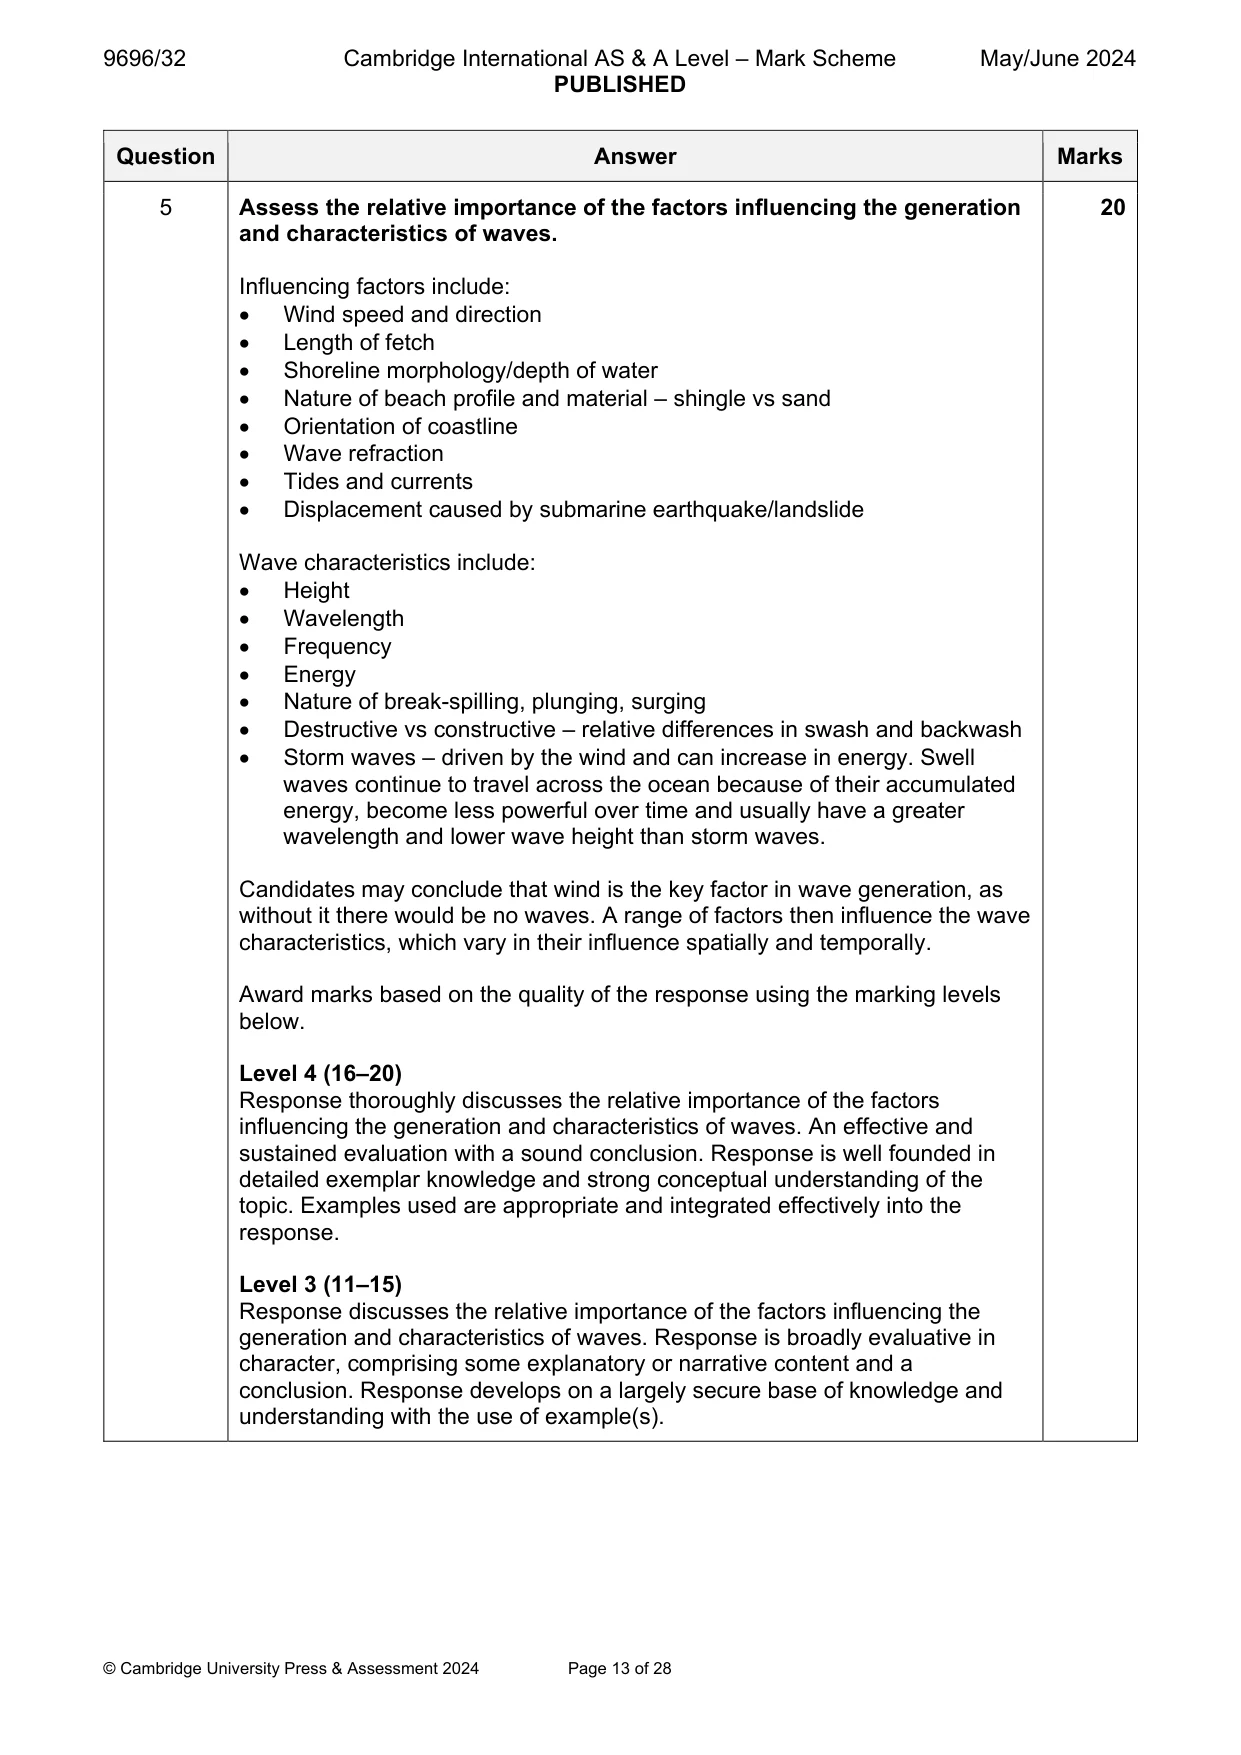
5 Assess the relative importance of the factors influencing the generation and characteristics of waves. [20]
Mark scheme: 5 Assess the relative importance of the factors influencing the generation 20 and characteristics of waves. Influencing factors include: Wind speed and direction Length of fetch Shoreline morphology/depth of water Nature of beach profile and material – shingle vs sand Orientation of coastline Wave refraction Tides and currents Displacement caused by submarine earthquake/landslide Wave characteristics include: Height Wavelength Frequency Energy Nature of break-spilling, plunging, surging Destructive vs constructive – relative differences in swash and backwash Storm waves – driven by the wind and can increase in energy. Swell waves continue to travel across the ocean because of their accumulated energy, become less powerful over time and usually have a greater wavelength and lower wave height than storm waves. Candidates may conclude that wind is the key factor in wave generation, as without it there would be no waves. A range of factors then influence the wave characteristics, which vary in their influence spatially and temporally. Award marks based on the quality of the response using the marking levels below. Level 4 (16–20) Response thoroughly discusses the relative importance of the factors influencing the generation and characteristics of waves. An effective and sustained evaluation with a sound conclusion. Response is well founded in detailed exemplar knowledge and strong conceptual understanding of the topic. Examples used are appropriate and integrated effectively into the response. Level 3 (11–15) Response discusses the relative importance of the factors influencing the generation and characteristics of waves. Response is broadly evaluative in character, comprising some explanatory or narrative content and a conclusion. Response develops on a largely secure base of knowledge and understanding with the use of example(s). 5 Level 2 (6–10) Response demonstrates some knowledge and understanding of the relative importance of the factors influencing the generation and characteristics of waves. Response is mainly descriptive or explanatory in approach and contains a brief or thinly supported evaluation. Responses without the use of example(s) to support the response will not get above the middle of Level 2 (8 marks). Level 1 (1–5) Response makes a few general points about the factors influencing the generation and characteristics of waves. A descriptive response comprising a few simple points. Knowledge is basic and understanding may be poor and lack relevance to the question set. Level 0 (0) No creditable response.
Q6 · Hazardous environments If answering this option, answer Question 7 and either Question 8…
Hazardous environments If answering this option, answer Question 7 and either Question 8 or Question 9.
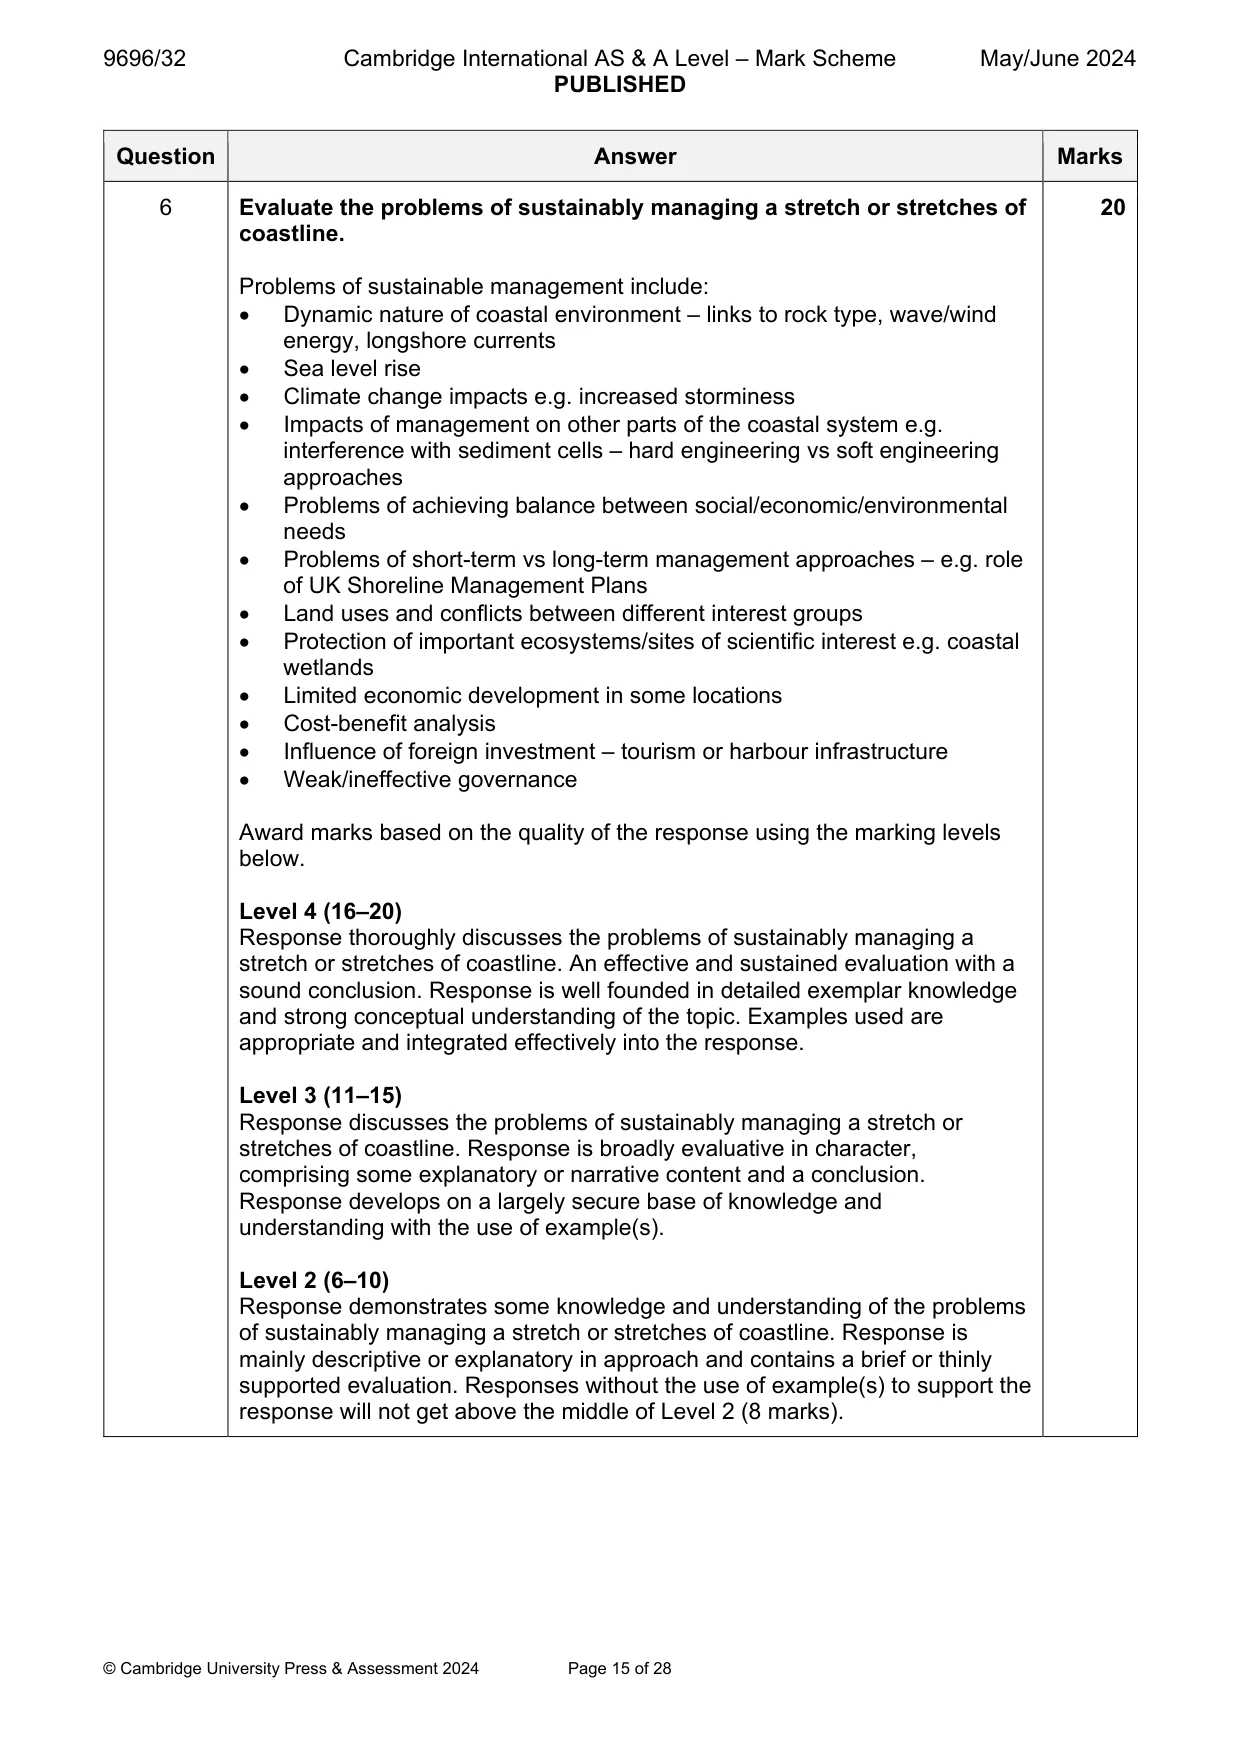
Mark scheme: 6 Evaluate the problems of sustainably managing a stretch or stretches of 20 coastline. Problems of sustainable management include: Dynamic nature of coastal environment – links to rock type, wave/wind energy, longshore currents Sea level rise Climate change impacts e.g. increased storminess Impacts of management on other parts of the coastal system e.g. interference with sediment cells – hard engineering vs soft engineering approaches Problems of achieving balance between social/economic/environmental needs Problems of short-term vs long-term management approaches – e.g. role of UK Shoreline Management Plans Land uses and conflicts between different interest groups Protection of important ecosystems/sites of scientific interest e.g. coastal wetlands Limited economic development in some locations Cost-benefit analysis Influence of foreign investment – tourism or harbour infrastructure Weak/ineffective governance Award marks based on the quality of the response using the marking levels below. Level 4 (16–20) Response thoroughly discusses the problems of sustainably managing a stretch or stretches of coastline. An effective and sustained evaluation with a sound conclusion. Response is well founded in detailed exemplar knowledge and strong conceptual understanding of the topic. Examples used are appropriate and integrated effectively into the response. Level 3 (11–15) Response discusses the problems of sustainably managing a stretch or stretches of coastline. Response is broadly evaluative in character, comprising some explanatory or narrative content and a conclusion. Response develops on a largely secure base of knowledge and understanding with the use of example(s). Level 2 (6–10) Response demonstrates some knowledge and understanding of the problems of sustainably managing a stretch or stretches of coastline. Response is mainly descriptive or explanatory in approach and contains a brief or thinly supported evaluation. Responses without the use of example(s) to support the response will not get above the middle of Level 2 (8 marks). 6 Level 1 (1–5) Response makes a few general points about the problems of sustainably managing a stretch or stretches of coastline. A descriptive response comprising a few simple points. Knowledge is basic and understanding may be poor and lack relevance to the question set. Level 0 (0) No creditable response. Hazardous environments If answering this option, answer Question 7 and either Question 8 or Question 9.
Q7 · The predicted development of a tsunami after an earthquake in Japan, 11 March 2011
7 Fig. 7.1 shows the predicted development of a tsunami after an earthquake in Japan, 11 March 2011. (a) Describe the predicted development of the tsunami shown in Fig. 7.1. [4] (b) Explain the formation of a tsunami such as the one shown in Fig. 7.1. [6]
Mark scheme: 7(a) Fig. 7.1 shows the predicted development of a tsunami after an 4 earthquake in Japan, 11 March 2011. Describe the predicted development of the tsunami shown in Fig. 7.1. The main features of the predicted development are: Tsunami spreads out eastwards/then southeast across the Pacific Ocean from the epicentre of the earthquake The height is predicted to be highest at over 2.4 m high close to the epicentre Height decreases with distance from the epicentre, reaching 0 m near Australia Spreads in a fan like shape Height decreases more slowly across the middle of the Pacific, being 0.6–0.9 m high after 3 hours. Whereas it is <0.3 m after the same time around the ocean edges There are some anomalies to this, with higher height in thin bands across the ocean towards places such as the northern part of the USA coast Some areas experience no wave e.g. SW of Papua New Guinea or New Caledonia The tsunami travels similar distances during each 3-hour period i.e. speed is predicted to be fairly constant Some islands (Fiji, Hawaii, Galápagos) see an increase in wave height 1 mark for each descriptive point. Max. 2 marks for simple description of heights at different times. Reserve 1 mark for use of data. Reference to the map required for maximum marks. 7(b) Explain the formation of a tsunami such as the one shown in Fig. 7.1. 6 Tsunami are typically formed when a sub-marine earthquake displaces the seabed vertically as a result of movement along a fault line at a subduction zone. The violent motion displaces a large volume of water in the ocean water column, which then moves outwards from the point of displacement. Tsunami can also be formed by landslides or even the eruptions of volcanic islands on the sea floor, both of which can displace the ocean column in a similar way. Tsunami waves spread out from the source region. In the open ocean, the wave crest is small but the wavelength is very long. Reaching shallow water, the tsunami slows and rises dramatically in height, firstly drawing water away from the shore and then hitting the coast with tremendous force. Islands and peninsulas can protect the coastlines behind them from the wave. Award marks based on the quality of explanation and breadth of the response using the marking levels below. Level 3 (5–6) Response clearly explains the formation of a tsunami such as the one shown in Fig. 7.1. Response is well founded in detailed knowledge and strong conceptual understanding of the topic. Examples used are appropriate and integrated effectively into the response. Level 2 (3–4) Response explains the formation of a tsunami such as the one shown in Fig. 7.1. Response develops on a largely secure base of knowledge and understanding. Examples may lack detail or development. Level 1 (1–2) Response describes the formation of a tsunami such as the one shown in Fig. 7.1. Knowledge is basic and understanding may be inaccurate. Examples are in name only or lacking entirely. Level 0 (0) No creditable response.
Q8 · To what extent is the Coriolis force the most important factor influencing the formation…
8 To what extent is the Coriolis force the most important factor influencing the formation and development of large‑scale atmospheric disturbances? [20]
Mark scheme: 8 To what extent is the Coriolis force the most important factor 20 influencing the formation and development of large-scale atmospheric disturbances? Large-scale atmospheric disturbances include cyclones, hurricanes and typhoons. Answers should address both their initial formation and their subsequent development. This includes their movement and changes in their size and intensity. Factors influencing their formation include: Coriolis force Sea temperatures over 27 °C to a depth of 50–60 m – this is seasonal Unstable atmospheric conditions Wind shear can break up or weaken the developing storm Factors influencing their development include: Movement over the ocean Prevailing winds e.g. westerlies at the equatorial edge of sub-tropical high-pressure zones (e.g. the Bermuda High in the North Atlantic) Making landfall Moving poleward (over colder waters) Low pressure areas need to be far enough away from the Equator for the Coriolis force to create rotation in the rising air. Tropical storms will not form without this. The warm, ocean water provides both heat and moisture for condensation and cloud formation, and the release of latent heat energy. They develop by moving westwards, driven by the prevailing trade winds, intensifying as they do with continued inputs of heat and moisture. As they reach land, they start to decline as the energy source from rising warm moist air is removed and with friction reducing wind speeds. They move poleward along the land sea border into areas of higher pressure which adds more air causing them to eventually die. Candidates may conclude that factors are of differing importance for formation compared to development, and that ocean temperature is most important to both. Award marks based on the quality of the response using the marking levels below. Level 4 (16–20) Response thoroughly discusses the extent to which the Coriolis force is the most important factor influencing the formation and development of large- scale atmospheric disturbances. An effective and sustained evaluation with a sound conclusion. Response is well founded in detailed exemplar knowledge and strong conceptual understanding of the topic. Examples used are appropriate and integrated effectively into the response. 8 Level 3 (11–15) Response discusses the extent to which the Coriolis force is the most important factor influencing the formation and development of large-scale atmospheric disturbances. Response is broadly evaluative in character, comprising some explanatory or narrative content and a conclusion. Response develops on a largely secure base of knowledge and understanding with the use of example(s). Level 2 (6–10) Response demonstrates some knowledge and understanding of the extent to which the Coriolis force is the most important factor influencing the formation and development of large-scale atmospheric disturbances. Response is mainly descriptive or explanatory in approach and contains a brief or thinly supported evaluation. Responses without the use of example(s) to support the response will not get above the middle of Level 2 (8 marks). Level 1 (1–5) Response makes a few general points about the factors influencing the formation and development of large-scale atmospheric disturbances. A descriptive response comprising a few simple points. Knowledge is basic and understanding may be poor and lack relevance to the question set. Level 0 (0) No creditable response.
Q9 · Evaluate the most effective way of managing mass movement hazards
9 Evaluate the most effective way of managing mass movement hazards. [20] Hot arid and semi‑arid environments If answering this option, answer Question 10 and either Question 11 or Question 12.
Mark scheme: 9 Evaluate the most effective way of managing mass movement hazards. 20 Responses may consider different types of mass movement hazards: Flows involve material mixed with water Landslides (often in one coherent piece) and slumps (involve material which lacks coherence) Rockfalls Soil creep Snow avalanches may also be credited Ways of managing mass movement hazards include: Prediction e.g. past mass movements data linked to weather conditions Monitoring e.g. using GPS, tiltmeters, and groundwater monitoring, observations (cracks to slope surface) Hazard mapping using knowledge of processes, past events and local landscape, subsequent building/land use restrictions Preparedness – trained rescue teams can reduce death rate, avalanche shelters over roads/railways Prevention – stabilising the slope e.g. use of pinning, drainage, netting, gabions, afforestation, shotcrete, etc. Modifying avalanche hazards e.g. use of snow fences, trees Modifying the loss – search and rescue, emergency services Effectiveness can be judged with reference to: Success against aims Cost vs benefit analysis Sustainability Candidates may conclude that different hazards can be managed effectively using different ways. Award marks based on the quality of the response using the marking levels below. Level 4 (16–20) Response thoroughly discusses the most effective way of managing mass movement hazards. An effective and sustained evaluation with a sound conclusion. Response is well founded in detailed exemplar knowledge and strong conceptual understanding of the topic. Examples used are appropriate and integrated effectively into the response. Level 3 (11–15) Response discusses the most effective way of managing mass movement hazards. Response is broadly evaluative in character, comprising some explanatory or narrative content and a conclusion. Response develops on a largely secure base of knowledge and understanding with the use of example(s). 9 Level 2 (6–10) Response demonstrates some knowledge and understanding of the most effective way of managing mass movement hazards. Response is mainly descriptive or explanatory in approach and contains a brief or thinly supported evaluation. Responses without the use of example(s) to support the response will not get above the middle of Level 2 (8 marks). Level 1 (1–5) Response makes a few general points about the ways of managing mass movement hazards. A descriptive response comprising a few simple points. Knowledge is basic and understanding may be poor and lack relevance to the question set. Level 0 (0) No creditable response. Hot arid and semi-arid environments If answering this option, answer Question 10 and either Question 11 or Question 12.
Q10 · Mean wind speeds during a month in a semi‑arid environment, northern Iraq, 2011
10 Fig. 10.1 shows mean wind speeds during a month in a semi‑arid environment, northern Iraq, 2011. (a) Describe the variations in wind speed shown in Fig. 10.1. [4] (b) Explain why hot arid and semi‑arid environments have high wind energy. [6]
Mark scheme: 10(a) Fig. 10.1 shows mean wind speeds during a month in a semi-arid 4 environment, northern Iraq, 2011. Describe the variations in wind speed shown in Fig. 10.1. The main points are: High degree of variability/no evident pattern over the month Significant fluctuations most days/during the day Max. speeds reach 13.3–13.5 m/s on 22nd, min. speeds just above 0 m/s at various times including on 2nd Range = 13.5 m/s Period of relatively low speeds between 7th and 11th day Period of greatest variability 11th to 18th 1 mark for each descriptive point. Reference to data required for maximum marks. 10(b) Explain why hot arid and semi-arid environments have high wind 6 energy. Hot arid and semi-arid environments often have strong winds. Air near the surface is heated by intense solar radiation (no clouds) which rises, creating localised low pressure. Overall, pressure in such environments is high and sinking air comes in to replace rising air, and this movement of air results in winds. The greater the pressure difference the larger the pressure gradient and the stronger the winds. Many such environments are also areas of low, flat relief and so friction from surface unevenness is limited. The lack of vegetation also reduces surface friction. Channelling of winds between high relief points, such as mountain passes, can also increase wind speeds. Arid areas near the coast will have differential heating of the sea and land, leading to sea breezes during the day and land breezes at night. Daytime heating and nighttime cooling of mountain slopes, exacerbated by the lack of cloud cover, may lead to anabatic (upslope) and katabatic (downslope) winds, affecting the slopes and adjacent lowland areas. Award marks based on the quality of explanation and breadth of the response using the marking levels below. Level 3 (5–6) Response clearly explains why hot arid and semi-arid environments have high wind energy. Response is well founded in detailed knowledge and strong conceptual understanding of the topic. Examples used are appropriate and integrated effectively into the response. Level 2 (3–4) Response explains why hot arid and semi-arid environments have high wind energy. Response develops on a largely secure base of knowledge and understanding. Examples may lack detail or development. Level 1 (1–2) Response describes how hot arid and semi-arid environments have high wind energy. Knowledge is basic and understanding may be inaccurate. Examples are in name only or lacking entirely. Level 0 (0) No creditable response.
Q11 · ‘Salinisation is the most important soil process in hot arid and semi‑arid environments.’…
11 ‘Salinisation is the most important soil process in hot arid and semi‑arid environments.’ How far do you agree with this view? [20]
Mark scheme: 11 ‘Salinisation is the most important soil process in hot arid and semi-arid 20 environments.’ How far do you agree with this view? Soil processes may include: Salinisation Humification Leaching Laterization Weathering Human influence Wind/water erosion Soils in hot arid and semi-arid environments are aridisols. They have a low organic content due to the lack of vegetation, reducing soil structure and soil strength. Natural salinisation is the process whereby potassium and sodium salts enter into solution and move down through the soil after rainfall. However, once the rainfall stops, intense heating of the surface leads to the water evaporating and drawing soil water to the surface by capillary rise, where it also evaporates. This leaves the salty compounds of potassium and sodium in the soil. Salty soils are not good for plants to grow in, especially commercial crop plants. Salinisation leads to soil degradation. The lack of water means leaching is limited. High temperatures cause upward movement of water by capillary action. Soluble salts can be carried towards the surface and then deposited as the soil water evaporates. This produces solonchaks (with high concentrations of a variety of soluble salts) and solonetz (with high concentrations of sodium salts) soils. In extreme cases a salt duricrust forms; again, the character of this depends upon the salts involved. Irrigation can enhance this process in agricultural soils. Salinisation is also a product of inefficient irrigation in semi-arid areas. Irrigation water, containing small amounts of salt enters the soil and is then evaporated. Over time this leads to the build-up of salt in the soil, rendering it infertile. This is a big problem in the Thar desert in India/Pakistan but also affects farms in Western Australia. Economically, then, salinisation could be considered the most important soil process in arid and semi-arid environments. Indeed, salinisation could be considered the most important natural soil process in these areas. However, in semi-arid areas, there is enough rainfall to leach the potassium and sodium salts out of the soil entirely, and calcium is left in the soil – a process known as calcification. This has a far more benign effect on soil fertility. However, in the semi-arid Sahel region of Africa, human-induced soil processes are very important. In these areas, over-cropping, overgrazing and deforestation lead to a situation where the soil becomes bare and compacted, with low fertility and weak structure. This means that wind erosion and water erosion (sheetwash and gullying) are important soil processes, leading to the removal of the topsoil, rendering the rest of the soil infertile and unable to support plant growth. 11 Candidates may well conclude that salinisation is the most important factor, given the high temperature of the climate and the limited role of other processes. Salinisation is common in both arid and semi-arid, however truly arid areas rarely have true soil. Semi-arid areas have more rainfall to aid the process. Natural processes are slow whereas human activity can rapidly degrade the soil. Salinisation needs to be compared with the other soil processes listed earlier. Award marks based on the quality of the response using the marking levels below. Level 4 (16–20) Response thoroughly discusses the extent to which salinisation is the most important soil process in hot arid and semi-arid environments. An effective and sustained evaluation with a sound conclusion. Response is well founded in detailed exemplar knowledge and strong conceptual understanding of the topic. Examples used are appropriate and integrated effectively into the response. Level 3 (11–15) Response discusses the extent to which salinisation is the most important soil process in hot arid and semi-arid environments. Response is broadly evaluative in character, comprising some explanatory or narrative content and a conclusion. Response develops on a largely secure base of knowledge and understanding with the use of example(s). Level 2 (6–10) Response demonstrates some knowledge and understanding of the extent to which salinisation is the most important soil process in hot arid and semi-arid environments. Response is mainly descriptive or explanatory in approach and contains a brief or thinly supported evaluation. Responses without the use of example(s) to support the response will not get above the middle of Level 2 (8 marks). Level 1 (1–5) Response makes a few general points about the soil processes in hot arid and semi-arid environments. A descriptive response comprising a few simple points. Knowledge is basic and understanding may be poor and lack relevance to the question set. Level 0 (0) No creditable response.
What was in this paper
The subtopics covered by these 11 questions, and how many questions each got. Open one in a new tab to see every Cambridge question on it.
2Characteristics and formation of coastal landforms1Coastal processes1Hazards resulting from atmospheric disturbances1Hazards resulting from tectonic processes1Hot arid and semi-arid climates1Humid tropical (rainforest) ecosystems and seasonally humid tropical (savanna) ecosystems1Landforms of tropical environments1Soils and vegetation1Tropical climates1What you needed in this session
Cambridge’s own grade thresholds for 2024 May/June, Paper 3 · Variant 2. A higher threshold means an easier paper — the bar moves with how the cohort did.