Cambridge A Level Geography 9696 — 2024 Oct/Nov Paper 3 · Variant 2
9696/32/O/N/24 · 12 questions · 60 marks · ≈68 min
The question paper and its mark scheme, free to read here and free to download. This is Cambridge’s own paper, exactly as it was sat.
Question paper4 pages


Mark scheme23 pages
Answers below. Sit the paper first if you are practising.











Questions as text
Q1 · The average climatic characteristics of two tropical locations
1 Fig. 1.1 shows the average climatic characteristics of two tropical locations. (a) Compare the climatic characteristics of the two locations shown in Fig. 1.1. [4] (b) Suggest reasons for the climatic characteristics of Chittagong shown in Fig. 1.1. [6]
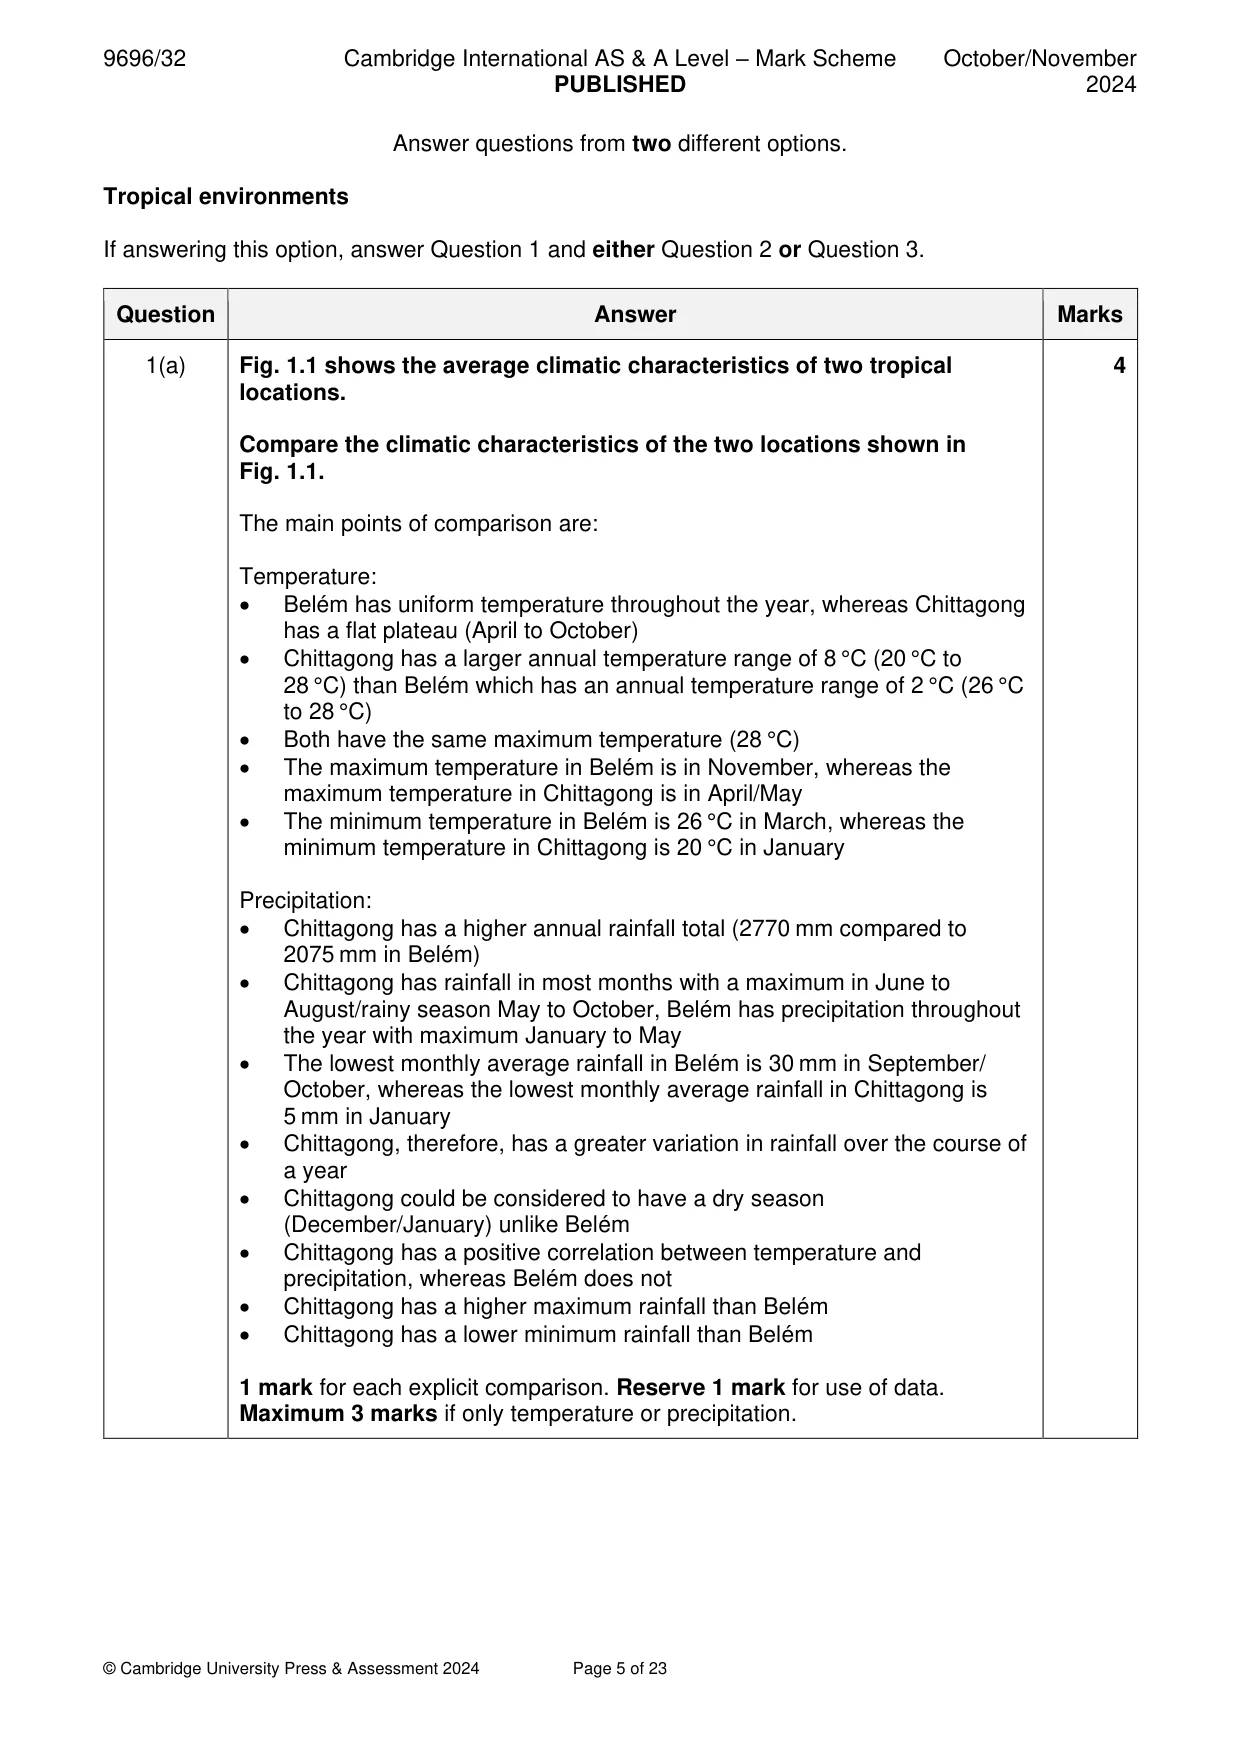
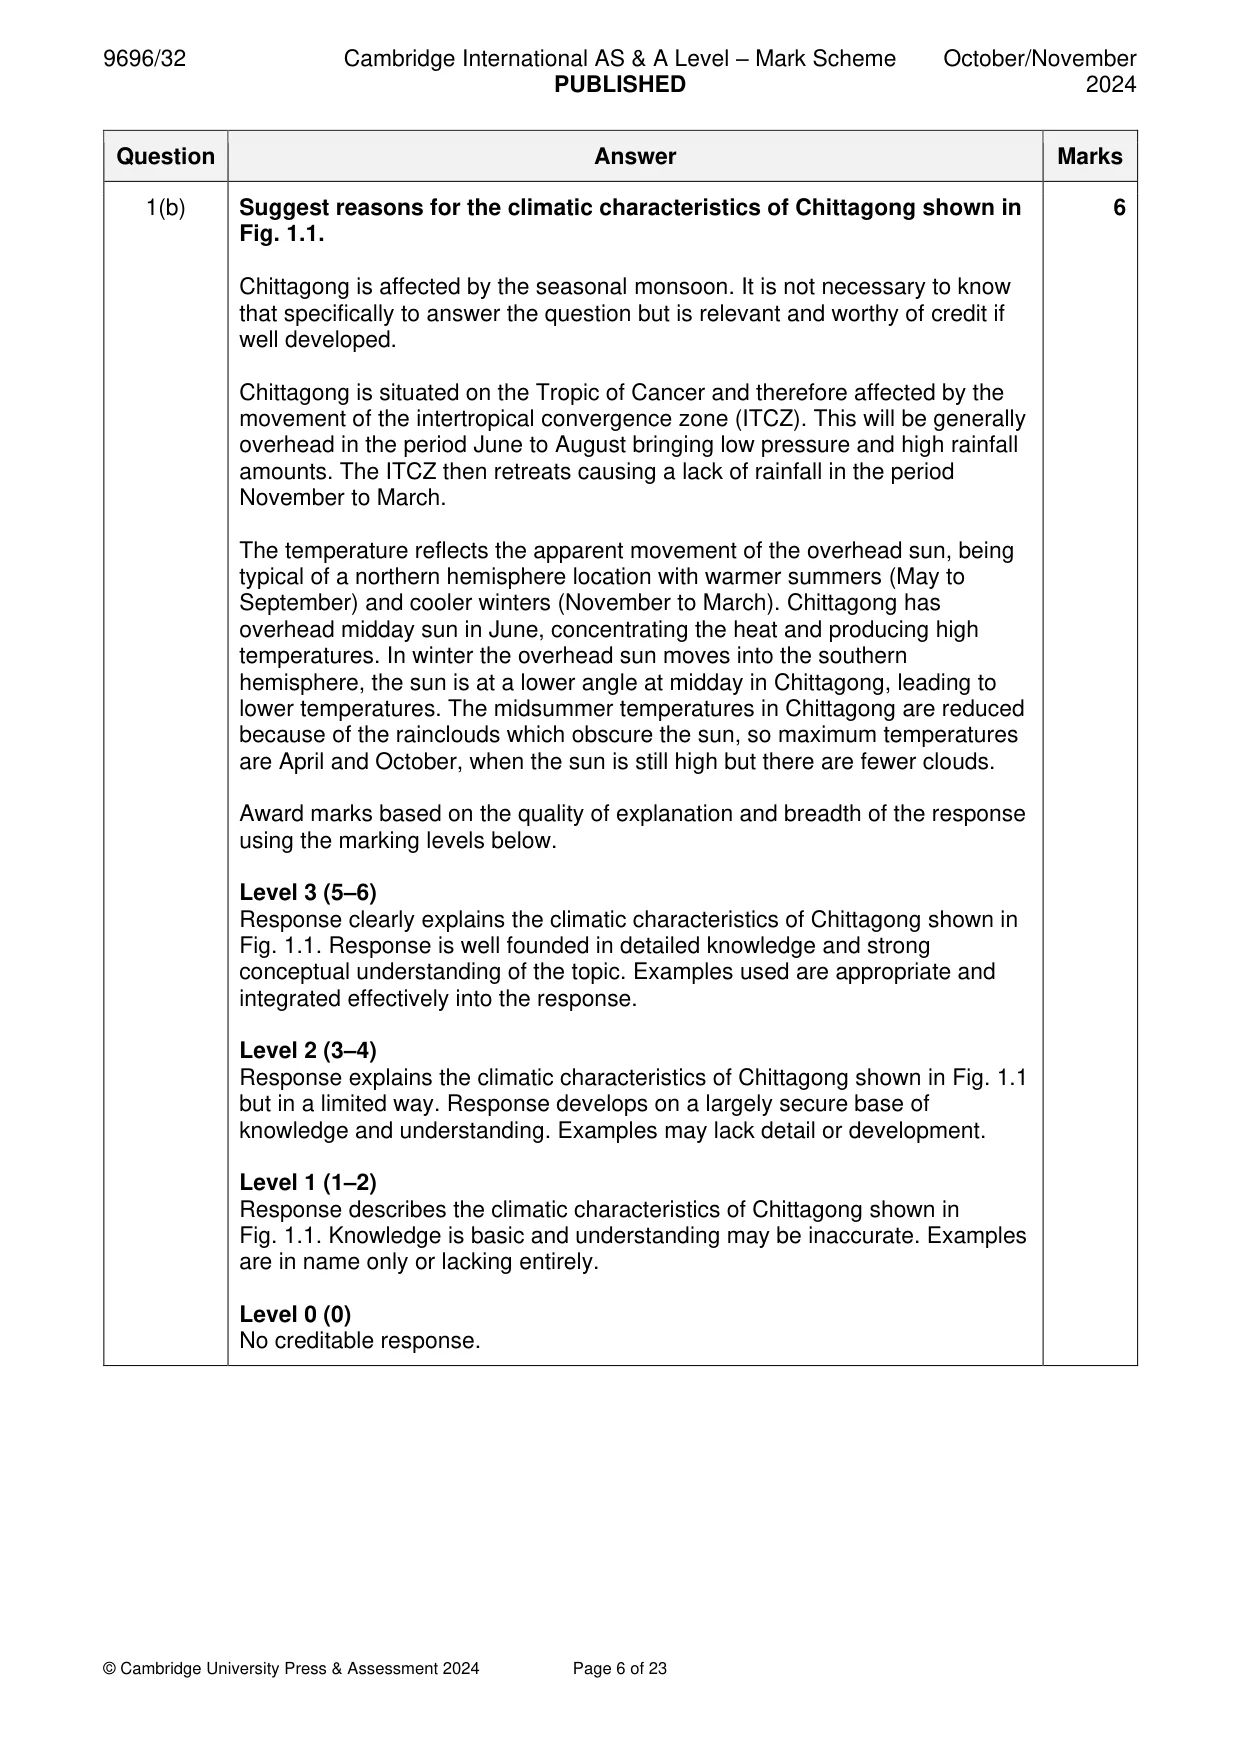
Mark scheme: Question Answer Marks 1(a) Fig. 1.1 shows the average climatic characteristics of two tropical 4 locations. Compare the climatic characteristics of the two locations shown in Fig. 1.1. The main points of comparison are: Temperature: • Belém has uniform temperature throughout the year, whereas Chittagong has a flat plateau (April to October) • Chittagong has a larger annual temperature range of 8 °C (20 °C to 28 °C) than Belém which has an annual temperature range of 2 °C (26 °C to 28 °C) • Both have the same maximum temperature (28 °C) • The maximum temperature in Belém is in November, whereas the maximum temperature in Chittagong is in April/May • The minimum temperature in Belém is 26 °C in March, whereas the minimum temperature in Chittagong is 20 °C in January Precipitation: • Chittagong has a higher annual rainfall total (2770 mm compared to 2075 mm in Belém) • Chittagong has rainfall in most months with a maximum in June to August/rainy season May to October, Belém has precipitation throughout the year with maximum January to May • The lowest monthly average rainfall in Belém is 30 mm in September/ October, whereas the lowest monthly average rainfall in Chittagong is 5 mm in January • Chittagong, therefore, has a greater variation in rainfall over the course of a year • Chittagong could be considered to have a dry season (December/January) unlike Belém • Chittagong has a positive correlation between temperature and precipitation, whereas Belém does not • Chittagong has a higher maximum rainfall than Belém • Chittagong has a lower minimum rainfall than Belém 1 mark for each explicit comparison. Reserve 1 mark for use of data. Maximum 3 marks if only temperature or precipitation. 1(b) Suggest reasons for the climatic characteristics of Chittagong shown in 6 Fig. 1.1. Chittagong is affected by the seasonal monsoon. It is not necessary to know that specifically to answer the question but is relevant and worthy of credit if well developed. Chittagong is situated on the Tropic of Cancer and therefore affected by the movement of the intertropical convergence zone (ITCZ). This will be generally overhead in the period June to August bringing low pressure and high rainfall amounts. The ITCZ then retreats causing a lack of rainfall in the period November to March. The temperature reflects the apparent movement of the overhead sun, being typical of a northern hemisphere location with warmer summers (May to September) and cooler winters (November to March). Chittagong has overhead midday sun in June, concentrating the heat and producing high temperatures. In winter the overhead sun moves into the southern hemisphere, the sun is at a lower angle at midday in Chittagong, leading to lower temperatures. The midsummer temperatures in Chittagong are reduced because of the rainclouds which obscure the sun, so maximum temperatures are April and October, when the sun is still high but there are fewer clouds. Award marks based on the quality of explanation and breadth of the response using the marking levels below. Level 3 (5–6) Response clearly explains the climatic characteristics of Chittagong shown in Fig. 1.1. Response is well founded in detailed knowledge and strong conceptual understanding of the topic. Examples used are appropriate and integrated effectively into the response. Level 2 (3–4) Response explains the climatic characteristics of Chittagong shown in Fig. 1.1 but in a limited way. Response develops on a largely secure base of knowledge and understanding. Examples may lack detail or development. Level 1 (1–2) Response describes the climatic characteristics of Chittagong shown in Fig. 1.1. Knowledge is basic and understanding may be inaccurate. Examples are in name only or lacking entirely. Level 0 (0) No creditable response.
Q2 · ‘The vegetation of humid tropical (rainforest) ecosystems has developed into a climatic…
2 ‘The vegetation of humid tropical (rainforest) ecosystems has developed into a climatic climax plant community, but the vegetation of seasonally humid tropical (savanna) ecosystems has developed into a plagioclimax plant community.’ How far do you agree with this view? [20]
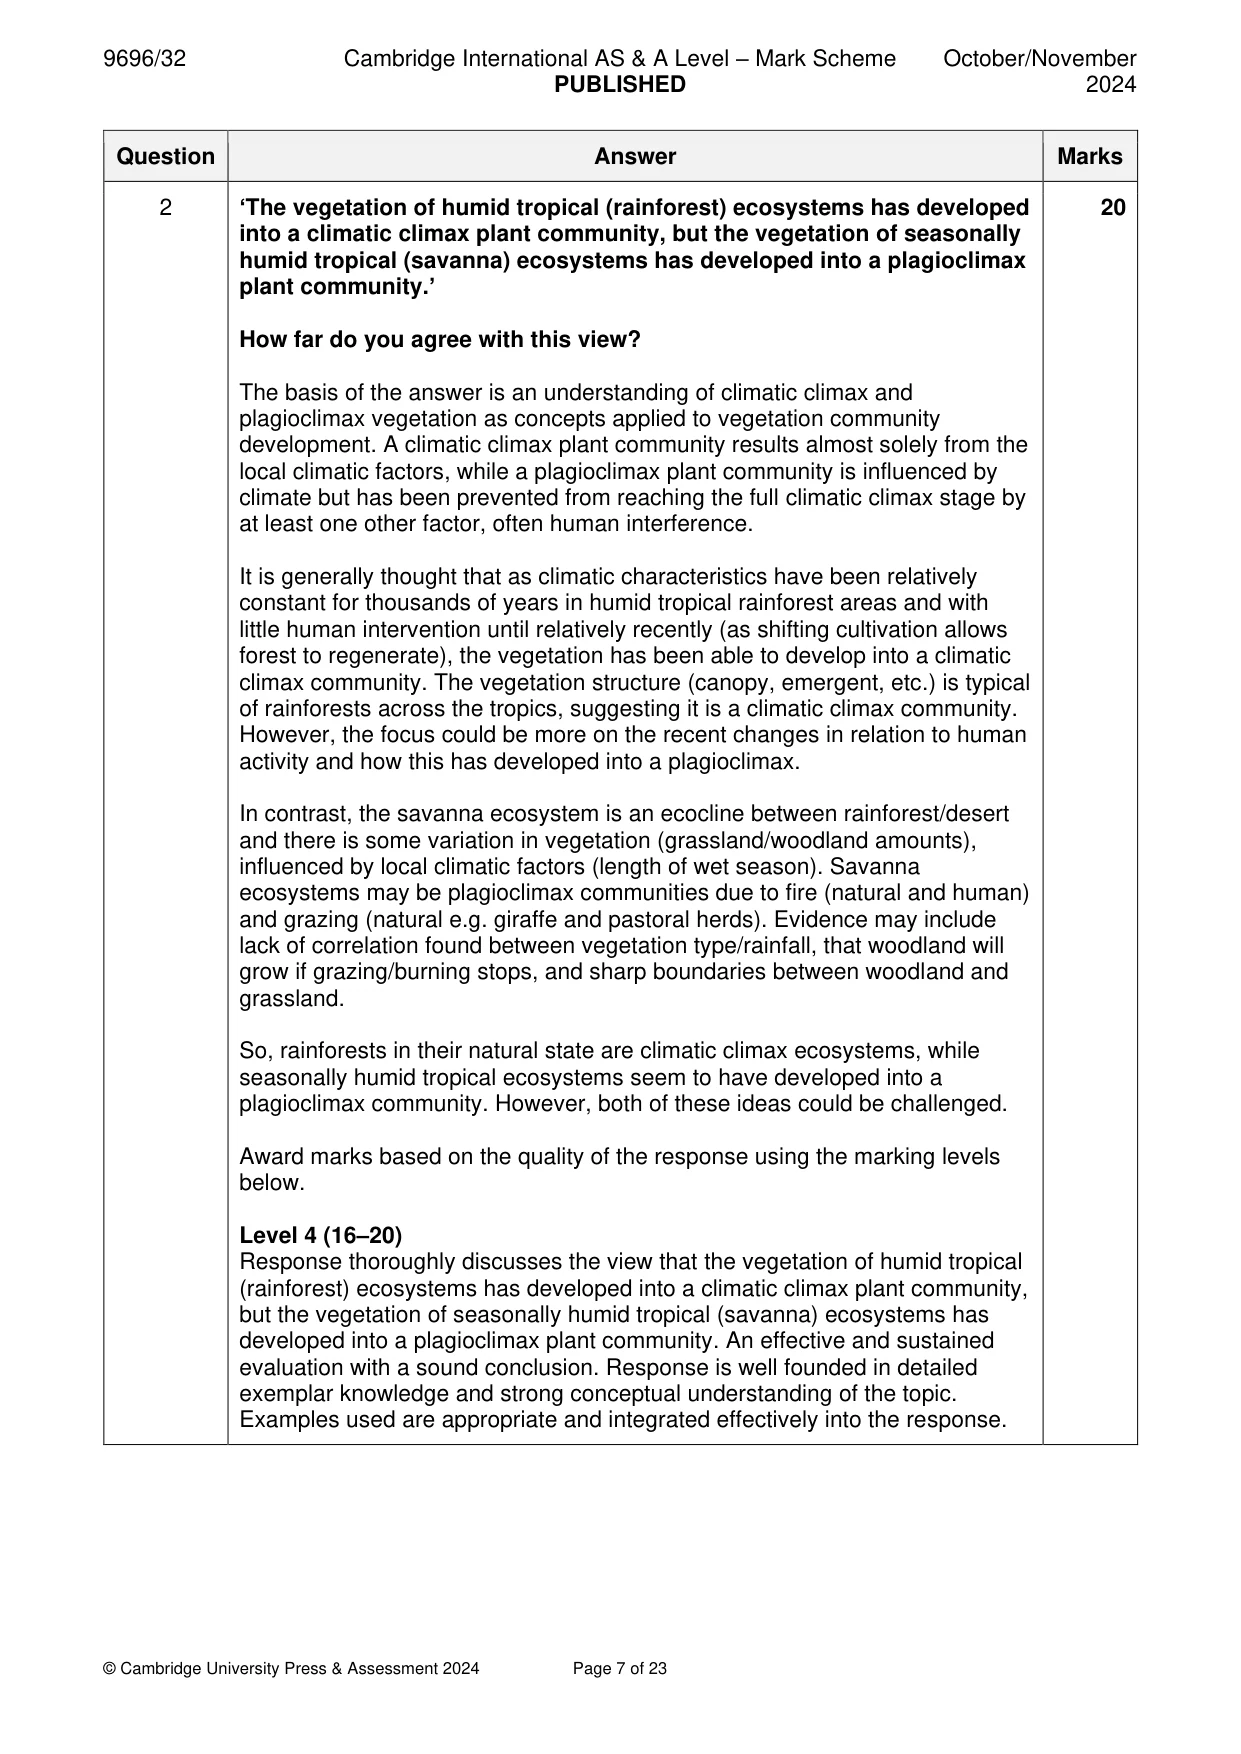
Mark scheme: 2 ‘The vegetation of humid tropical (rainforest) ecosystems has developed 20 into a climatic climax plant community, but the vegetation of seasonally humid tropical (savanna) ecosystems has developed into a plagioclimax plant community.’ How far do you agree with this view? The basis of the answer is an understanding of climatic climax and plagioclimax vegetation as concepts applied to vegetation community development. A climatic climax plant community results almost solely from the local climatic factors, while a plagioclimax plant community is influenced by climate but has been prevented from reaching the full climatic climax stage by at least one other factor, often human interference. It is generally thought that as climatic characteristics have been relatively constant for thousands of years in humid tropical rainforest areas and with little human intervention until relatively recently (as shifting cultivation allows forest to regenerate), the vegetation has been able to develop into a climatic climax community. The vegetation structure (canopy, emergent, etc.) is typical of rainforests across the tropics, suggesting it is a climatic climax community. However, the focus could be more on the recent changes in relation to human activity and how this has developed into a plagioclimax. In contrast, the savanna ecosystem is an ecocline between rainforest/desert and there is some variation in vegetation (grassland/woodland amounts), influenced by local climatic factors (length of wet season). Savanna ecosystems may be plagioclimax communities due to fire (natural and human) and grazing (natural e.g. giraffe and pastoral herds). Evidence may include lack of correlation found between vegetation type/rainfall, that woodland will grow if grazing/burning stops, and sharp boundaries between woodland and grassland. So, rainforests in their natural state are climatic climax ecosystems, while seasonally humid tropical ecosystems seem to have developed into a plagioclimax community. However, both of these ideas could be challenged. Award marks based on the quality of the response using the marking levels below. Level 4 (16–20) Response thoroughly discusses the view that the vegetation of humid tropical (rainforest) ecosystems has developed into a climatic climax plant community, but the vegetation of seasonally humid tropical (savanna) ecosystems has developed into a plagioclimax plant community. An effective and sustained evaluation with a sound conclusion. Response is well founded in detailed exemplar knowledge and strong conceptual understanding of the topic. Examples used are appropriate and integrated effectively into the response. 2 Level 3 (11–15) Response discusses the view that the vegetation of humid tropical (rainforest) ecosystems has developed into a climatic climax plant community, but the vegetation of seasonally humid tropical (savanna) ecosystems has developed into a plagioclimax plant community. Response is broadly evaluative in character, comprising some explanatory or narrative content and a conclusion. Response develops on a largely secure base of knowledge and understanding with the use of example(s). Level 2 (6–10) Response demonstrates some knowledge and understanding of the view that the vegetation of humid tropical (rainforest) ecosystems has developed into a climatic climax plant community, but the vegetation of seasonally humid tropical (savanna) ecosystems has developed into a plagioclimax plant community. Response is mainly descriptive or explanatory in approach and contains a brief or thinly supported evaluation. Responses without the use of example(s) to support the response will not get above the middle of Level 2 (8 marks). Level 1 (1–5) Response makes a few general points about how the vegetation of humid tropical (rainforest) ecosystems has developed into a climatic climax plant community, but the vegetation of seasonally humid tropical (savanna) ecosystems has developed into a plagioclimax plant community. A descriptive response comprising a few simple points. Knowledge is basic and understanding may be poor and lack relevance to the question set. Level 0 (0) No creditable response.
Q3 · Assess the view that tors, inselbergs and bornhardts in tropical environments have been…
3 Assess the view that tors, inselbergs and bornhardts in tropical environments have been formed by the same processes and differ only in their size. [20] Coastal environments If answering this option, answer Question 4 and either Question 5 or Question 6.
Mark scheme: 3 Assess the view that tors, inselbergs and bornhardts in tropical 20 environments have been formed by the same processes and differ only in their size. Tors, inselbergs and bornhardts are the main landform features of granitic rocks in tropical environments, although they occur in other climatic environments. There is also an issue with terminology. Bornhardts have often been called domed inselbergs and tors as boulder inselbergs, although in this case size is an issue for classification. In terms of size, tors are clearly the smallest feature and inselbergs tend to be the largest but there is an overlap between bornhardts and inselbergs, ignoring the confusion over terminology. Thus, it can be said that, in general, they do differ in size. But they also differ in shape. Tors are blocky, well jointed features. Bornhardts tend to be rounded bare rock domes and inselbergs tend to be more angular or plateau- like. All are formed by the sub-surface chemical weathering of jointed granite followed by exhumation. They vary in the degree of rock jointing, both vertical and horizontal. Some bornhardts and especially many inselbergs may have been formed by the parallel retreat of slopes. It is unlikely that tors, in tropical environments, have been formed in this way. Award marks based on the quality of the response using the marking levels below. Level 4 (16–20) Response thoroughly discusses the view that tors, inselbergs and bornhardts in tropical environments have been formed by the same processes and differ only in their size. An effective and sustained evaluation with a sound conclusion. Response is well founded in detailed exemplar knowledge and strong conceptual understanding of the topic. Examples used are appropriate and integrated effectively into the response. Level 3 (11–15) Response discusses the view that tors, inselbergs and bornhardts in tropical environments have been formed by the same processes and differ only in their size. Response is broadly evaluative in character, comprising some explanatory or narrative content and a conclusion. Response develops on a largely secure base of knowledge and understanding with the use of example(s). Level 2 (6–10) Response demonstrates some knowledge and understanding of the view that tors, inselbergs and bornhardts in tropical environments have been formed by the same processes and differ only in their size. Response is mainly descriptive or explanatory in approach and contains a brief or thinly supported evaluation. Responses without the use of example(s) to support the response will not get above the middle of Level 2 (8 marks). Level 1 (1–5) Response makes a few general points about the view that tors, inselbergs and bornhardts in tropical environments have been formed by the same processes and differ only in their size. A descriptive response comprising a few simple points. Knowledge is basic and understanding may be poor and lack relevance to the question set. 3 Level 0 (0) No creditable response. Coastal environments If answering this option, answer Question 4 and either Question 5 or Question 6.
Q4 · Generalised summer and winter beach profiles of a sandy beach
4 Fig. 4.1 shows generalised summer and winter beach profiles of a sandy beach. (a) Compare the summer and winter beach profiles shown in Fig. 4.1. [4] (b) Explain the summer and winter beach profiles shown in Fig. 4.1. [6]
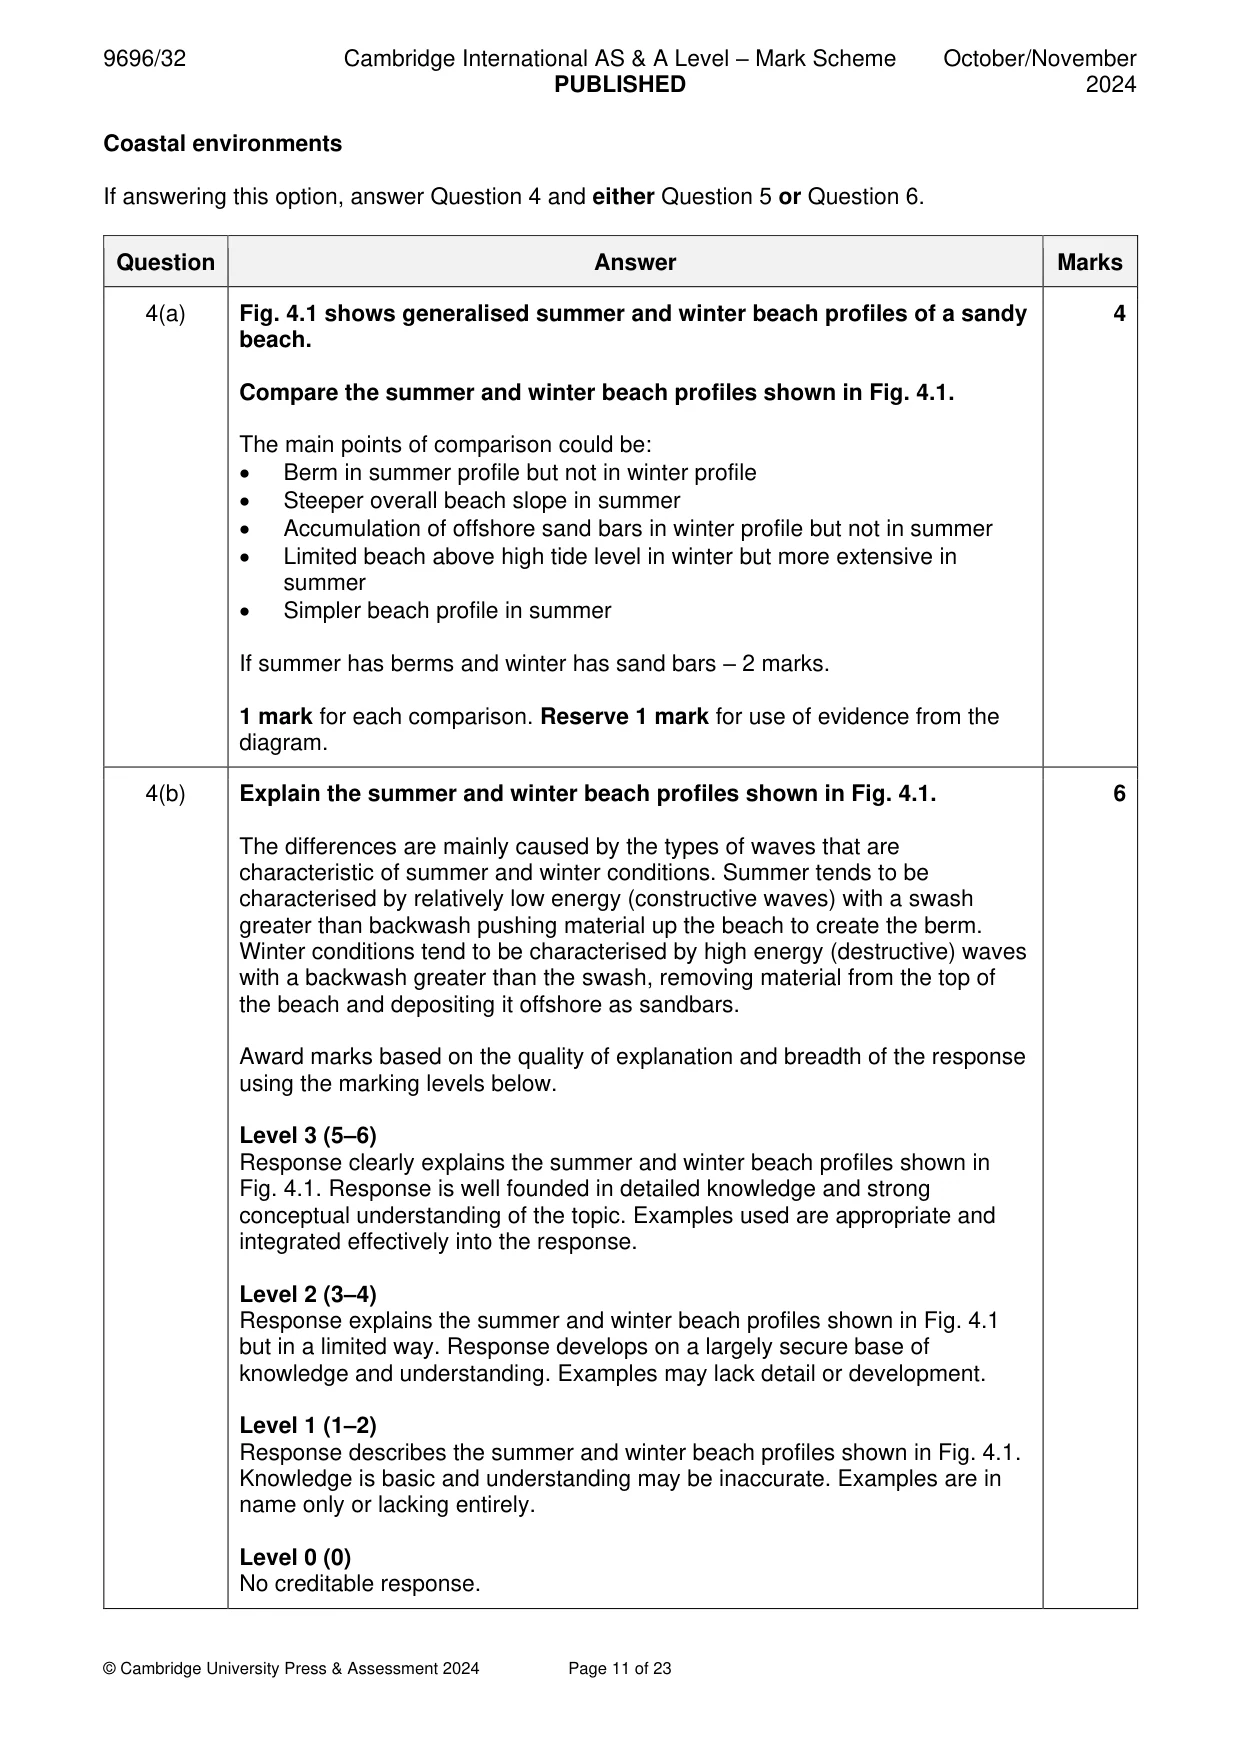
Mark scheme: 4(a) Fig. 4.1 shows generalised summer and winter beach profiles of a sandy 4 beach. Compare the summer and winter beach profiles shown in Fig. 4.1. The main points of comparison could be: • Berm in summer profile but not in winter profile • Steeper overall beach slope in summer • Accumulation of offshore sand bars in winter profile but not in summer • Limited beach above high tide level in winter but more extensive in summer • Simpler beach profile in summer If summer has berms and winter has sand bars – 2 marks. 1 mark for each comparison. Reserve 1 mark for use of evidence from the diagram. 4(b) Explain the summer and winter beach profiles shown in Fig. 4.1. 6 The differences are mainly caused by the types of waves that are characteristic of summer and winter conditions. Summer tends to be characterised by relatively low energy (constructive waves) with a swash greater than backwash pushing material up the beach to create the berm. Winter conditions tend to be characterised by high energy (destructive) waves with a backwash greater than the swash, removing material from the top of the beach and depositing it offshore as sandbars. Award marks based on the quality of explanation and breadth of the response using the marking levels below. Level 3 (5–6) Response clearly explains the summer and winter beach profiles shown in Fig. 4.1. Response is well founded in detailed knowledge and strong conceptual understanding of the topic. Examples used are appropriate and integrated effectively into the response. Level 2 (3–4) Response explains the summer and winter beach profiles shown in Fig. 4.1 but in a limited way. Response develops on a largely secure base of knowledge and understanding. Examples may lack detail or development. Level 1 (1–2) Response describes the summer and winter beach profiles shown in Fig. 4.1. Knowledge is basic and understanding may be inaccurate. Examples are in name only or lacking entirely. Level 0 (0) No creditable response.
Q5 · Evaluate the role of wind in the formation and characteristics of coastal dunes
5 Evaluate the role of wind in the formation and characteristics of coastal dunes. [20]
Mark scheme: 5 Evaluate the role of wind in the formation and characteristics of coastal 20 dunes. There are two components to this question: formation and characteristics. Formation is controlled by onshore winds but there needs to be a source of sand to be moved such as wide sand beaches at low tide plus an obstacle for the initial accumulation of the sand. The characteristics of the dunes are then developed by the gradual growth of vegetation, decalcification and the development of a rudimentary soil (embryo dunes, yellow foredunes, vegetated grey dunes) with intervening slacks. Human interference (trampling and management) may also be an important factor. Thus, the role of wind must be evaluated with respect to these other factors. Award marks based on the quality of the response using the marking levels below. Level 4 (16–20) Response thoroughly discusses the role of wind in the formation and characteristics of coastal dunes. An effective and sustained evaluation with a sound conclusion. Response is well founded in detailed exemplar knowledge and strong conceptual understanding of the topic. Examples used are appropriate and integrated effectively into the response. Level 3 (11–15) Response discusses the role of wind in the formation and characteristics of coastal dunes. Response is broadly evaluative in character, comprising some explanatory or narrative content and a conclusion. Response develops on a largely secure base of knowledge and understanding with the use of example(s). Level 2 (6–10) Response demonstrates some knowledge and understanding of the role of wind in the formation and/or characteristics of coastal dunes. Response is mainly descriptive or explanatory in approach and contains a brief or thinly supported evaluation. Responses without the use of example(s) to support the response will not get above the middle of Level 2 (8 marks). Level 1 (1–5) Response makes a few general points about the role of wind in the formation and/or characteristics of coastal dunes. A descriptive response comprising a few simple points. Knowledge is basic and understanding may be poor and lack relevance to the question set. Level 0 (0) No creditable response.
Q6 · Hazardous environments If answering this option, answer Question 7 and either Question 8…
Hazardous environments If answering this option, answer Question 7 and either Question 8 or Question 9.
Mark scheme: 6 Assess the success of attempts to sustainably manage a stretch or 20 stretches of coastline. The detail will depend on the stretch or stretches of coastline chosen for the answer. The problems faced by the coastline(s) need establishing with an assessment of the attempts to manage those problems sustainably. The way this is discussed will probably determine the relevant Level. There are three main ‘pillars’ of sustainability: • Economic sustainability – ensuring coastal communities are able to maintain or improve their standard of living through engaging in economic activities such as fishing, agriculture, industry and tourism • Social sustainability – maintaining the quality of life of coastal communities by, for example, ensuring their homes are not destroyed by coastal erosion or damaged by coastal flooding • Environmental sustainability – conserving ecosystems, reducing pollution and maintaining the aesthetic appeal of the coastline Better answers will cover all three and they should be used to assess the attempts. Strategies include the varieties of both hard engineering and soft engineering and will depend on the specific stretches of coastline. Managed retreat and shoreline management plans are also relevant. Award marks based on the quality of the response using the marking levels below. Level 4 (16–20) Response thoroughly discusses the success of attempts to sustainably manage a stretch or stretches of coastline. An effective and sustained evaluation with a sound conclusion. Response is well founded in detailed exemplar knowledge and strong conceptual understanding of the topic. Examples used are appropriate and integrated effectively into the response. Level 3 (11–15) Response discusses the success of attempts to sustainably manage a stretch or stretches of coastline. Response is broadly evaluative in character, comprising some explanatory or narrative content and a conclusion. Response develops on a largely secure base of knowledge and understanding with the use of example(s). Level 2 (6–10) Response demonstrates some knowledge and understanding of the success of attempts to sustainably manage a stretch or stretches of coastline. Response is mainly descriptive or explanatory in approach and contains a brief or thinly supported evaluation. Responses without the use of example(s) to support the response will not get above the middle of Level 2 (8 marks). 6 Level 1 (1–5) Response makes a few general points about management of a stretch or stretches of coastline. A descriptive response comprising a few simple points. Knowledge is basic and understanding may be poor and lack relevance to the question set. Level 0 (0) No creditable response. Hazardous environments If answering this option, answer Question 7 and either Question 8 or Question 9.
Q7 · A photograph which shows the eruption of the Soufrière Hills volcano, on the Caribbean…
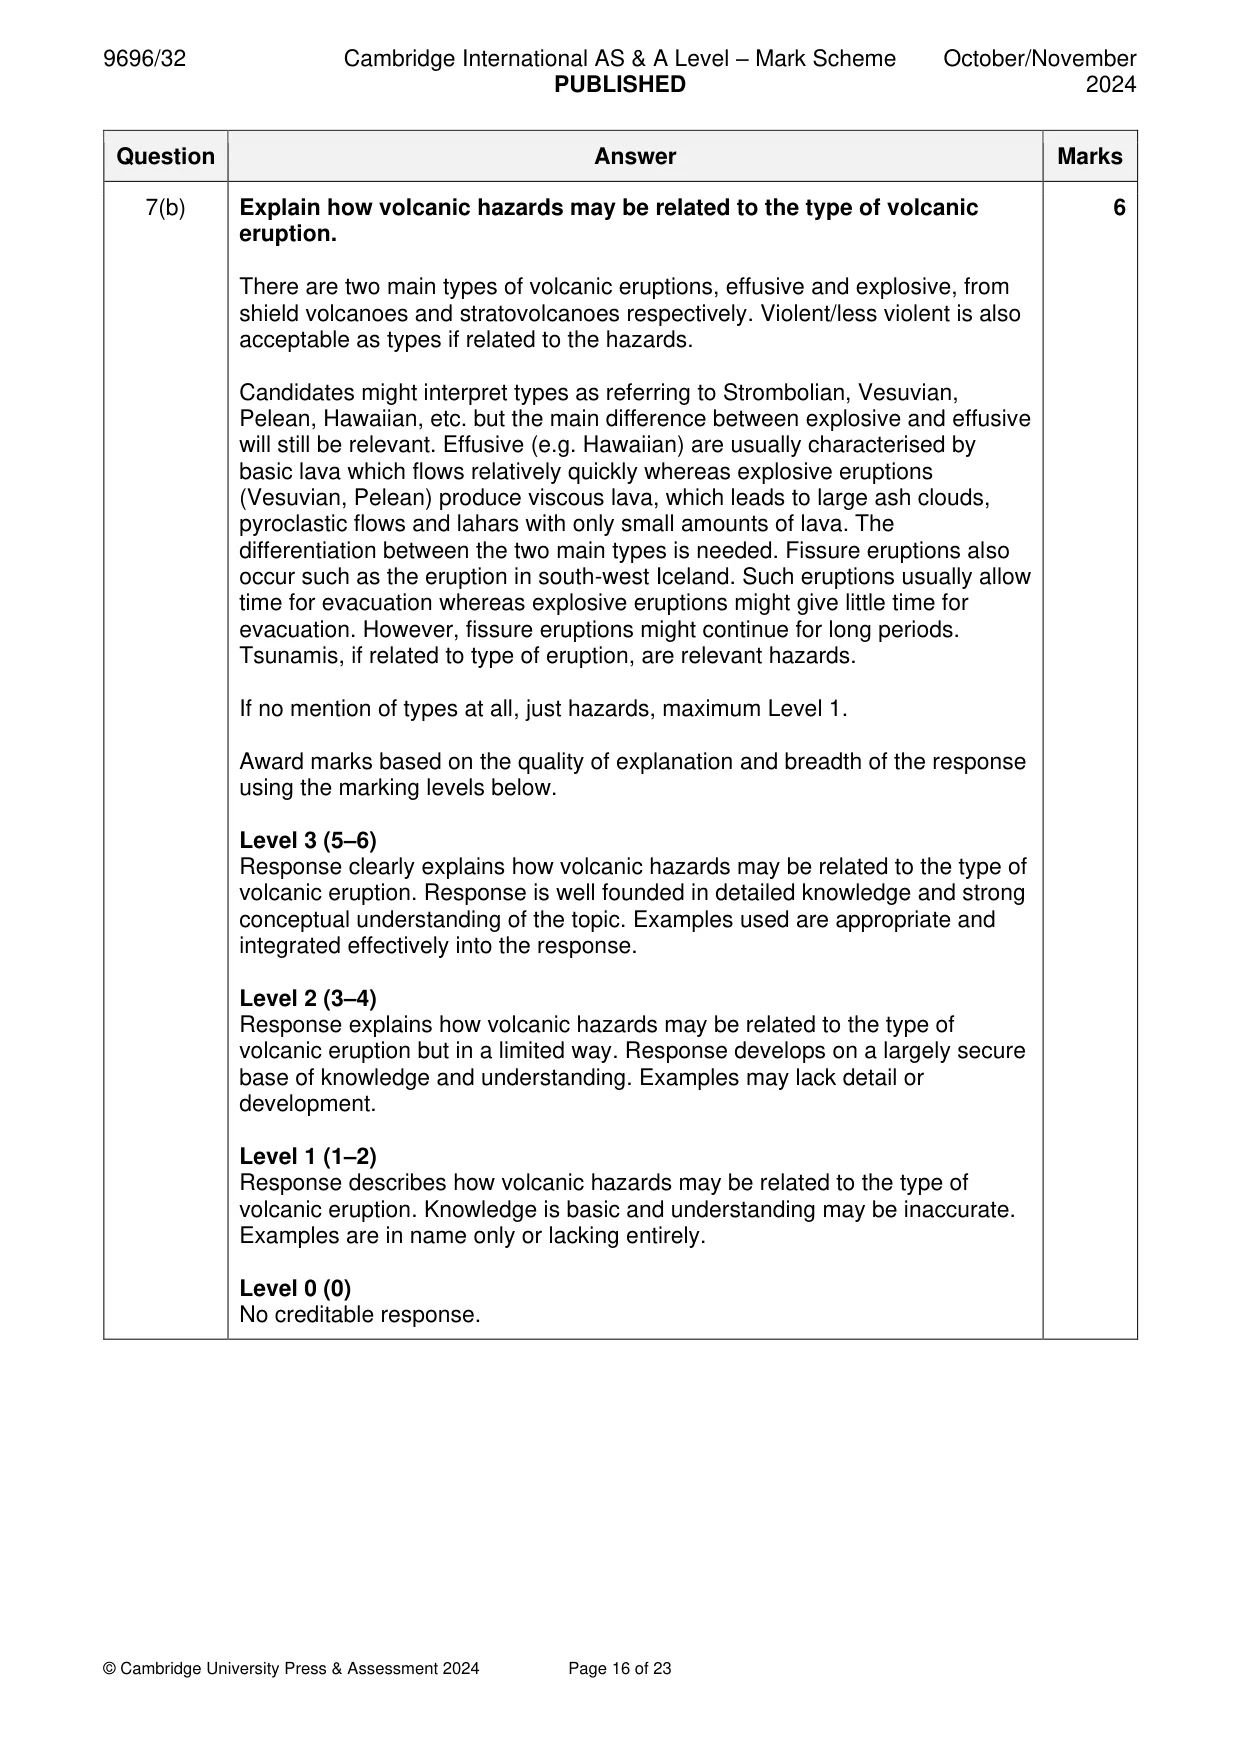
7 Fig. 7.1 is a photograph which shows the eruption of the Soufrière Hills volcano, on the Caribbean island of Montserrat, in 2010. (a) Describe the main characteristics of the volcanic eruption shown in Fig. 7.1. [4] (b) Explain how volcanic hazards may be related to the type of volcanic eruption. [6]
Mark scheme: 7(a) Fig. 7.1 is a photograph which shows the eruption of the Soufrière Hills 4 volcano, on the Caribbean island of Montserrat, in 2010. Describe the main characteristics of the volcanic eruption shown in Fig. 7.1. The main characteristics that could be noted are: • Dense ash surge/pyroclastic flow hugging the slope • Higher ash cloud on the upper slopes • Short flows of incandescent material/lava • Some lava seems to be forming a fountain • Entire slope covered in ash and boulders/volcanic bombs • Small fumaroles emitting gas/steam on the left slope • High gas clouds/smoke clouds at the top No marks for simple identification of features without description. 1 mark for each descriptive point. 7(b) Explain how volcanic hazards may be related to the type of volcanic 6 eruption. There are two main types of volcanic eruptions, effusive and explosive, from shield volcanoes and stratovolcanoes respectively. Violent/less violent is also acceptable as types if related to the hazards. Candidates might interpret types as referring to Strombolian, Vesuvian, Pelean, Hawaiian, etc. but the main difference between explosive and effusive will still be relevant. Effusive (e.g. Hawaiian) are usually characterised by basic lava which flows relatively quickly whereas explosive eruptions (Vesuvian, Pelean) produce viscous lava, which leads to large ash clouds, pyroclastic flows and lahars with only small amounts of lava. The differentiation between the two main types is needed. Fissure eruptions also occur such as the eruption in south-west Iceland. Such eruptions usually allow time for evacuation whereas explosive eruptions might give little time for evacuation. However, fissure eruptions might continue for long periods. Tsunamis, if related to type of eruption, are relevant hazards. If no mention of types at all, just hazards, maximum Level 1. Award marks based on the quality of explanation and breadth of the response using the marking levels below. Level 3 (5–6) Response clearly explains how volcanic hazards may be related to the type of volcanic eruption. Response is well founded in detailed knowledge and strong conceptual understanding of the topic. Examples used are appropriate and integrated effectively into the response. Level 2 (3–4) Response explains how volcanic hazards may be related to the type of volcanic eruption but in a limited way. Response develops on a largely secure base of knowledge and understanding. Examples may lack detail or development. Level 1 (1–2) Response describes how volcanic hazards may be related to the type of volcanic eruption. Knowledge is basic and understanding may be inaccurate. Examples are in name only or lacking entirely. Level 0 (0) No creditable response.
Q8 · ‘Hazard mapping is the most effective way to prepare for hazards from mass movements.’…
8 ‘Hazard mapping is the most effective way to prepare for hazards from mass movements.’ How far do you agree with this view? [20]
Mark scheme: 8 ‘Hazard mapping is the most effective way to prepare for hazards from 20 mass movements.’ How far do you agree with this view? The syllabus lists prediction, hazard mapping, preparedness and monitoring as the main elements in the management of mass movement hazards. Mass movements are very difficult to predict, but the likelihood can be determined by the nature of the slope, the material it is made of, and the history of mass movements in the area. Monitoring allows warnings and evacuation, by use of GPS, tiltmeters, observations along with weather forecasts. Hard engineering methods can be used to stabilise slopes such as grading, slope drainage. But these are informed by hazard mapping. Thus, hazard mapping can be assessed with respect to the other procedures for a reasoned assessment. Award marks based on the quality of the response using the marking levels below. Level 4 (16–20) Response thoroughly discusses the view that hazard mapping is the most effective way to prepare for hazards from mass movements. An effective and sustained evaluation with a sound conclusion. Response is well founded in detailed exemplar knowledge and strong conceptual understanding of the topic. Examples used are appropriate and integrated effectively into the response. Level 3 (11–15) Response discusses the view that hazard mapping is the most effective way to prepare for hazards from mass movements. Response is broadly evaluative in character, comprising some explanatory or narrative content and a conclusion. Response develops on a largely secure base of knowledge and understanding with the use of example(s). Level 2 (6–10) Response demonstrates some knowledge and understanding of the view that hazard mapping is the most effective way to prepare for hazards from mass movements. Response is mainly descriptive or explanatory in approach and contains a brief or thinly supported evaluation. Responses without the use of example(s) to support the response will not get above the middle of Level 2 (8 marks). Level 1 (1–5) Response makes a few general points about whether hazard mapping is the most effective way to prepare for hazards from mass movements. A descriptive response comprising a few simple points. Knowledge is basic and understanding may be poor and lack relevance to the question set. Level 0 (0) No creditable response.
Q9 · Assess the view that it is easier to predict and monitor large-scale atmospheric…
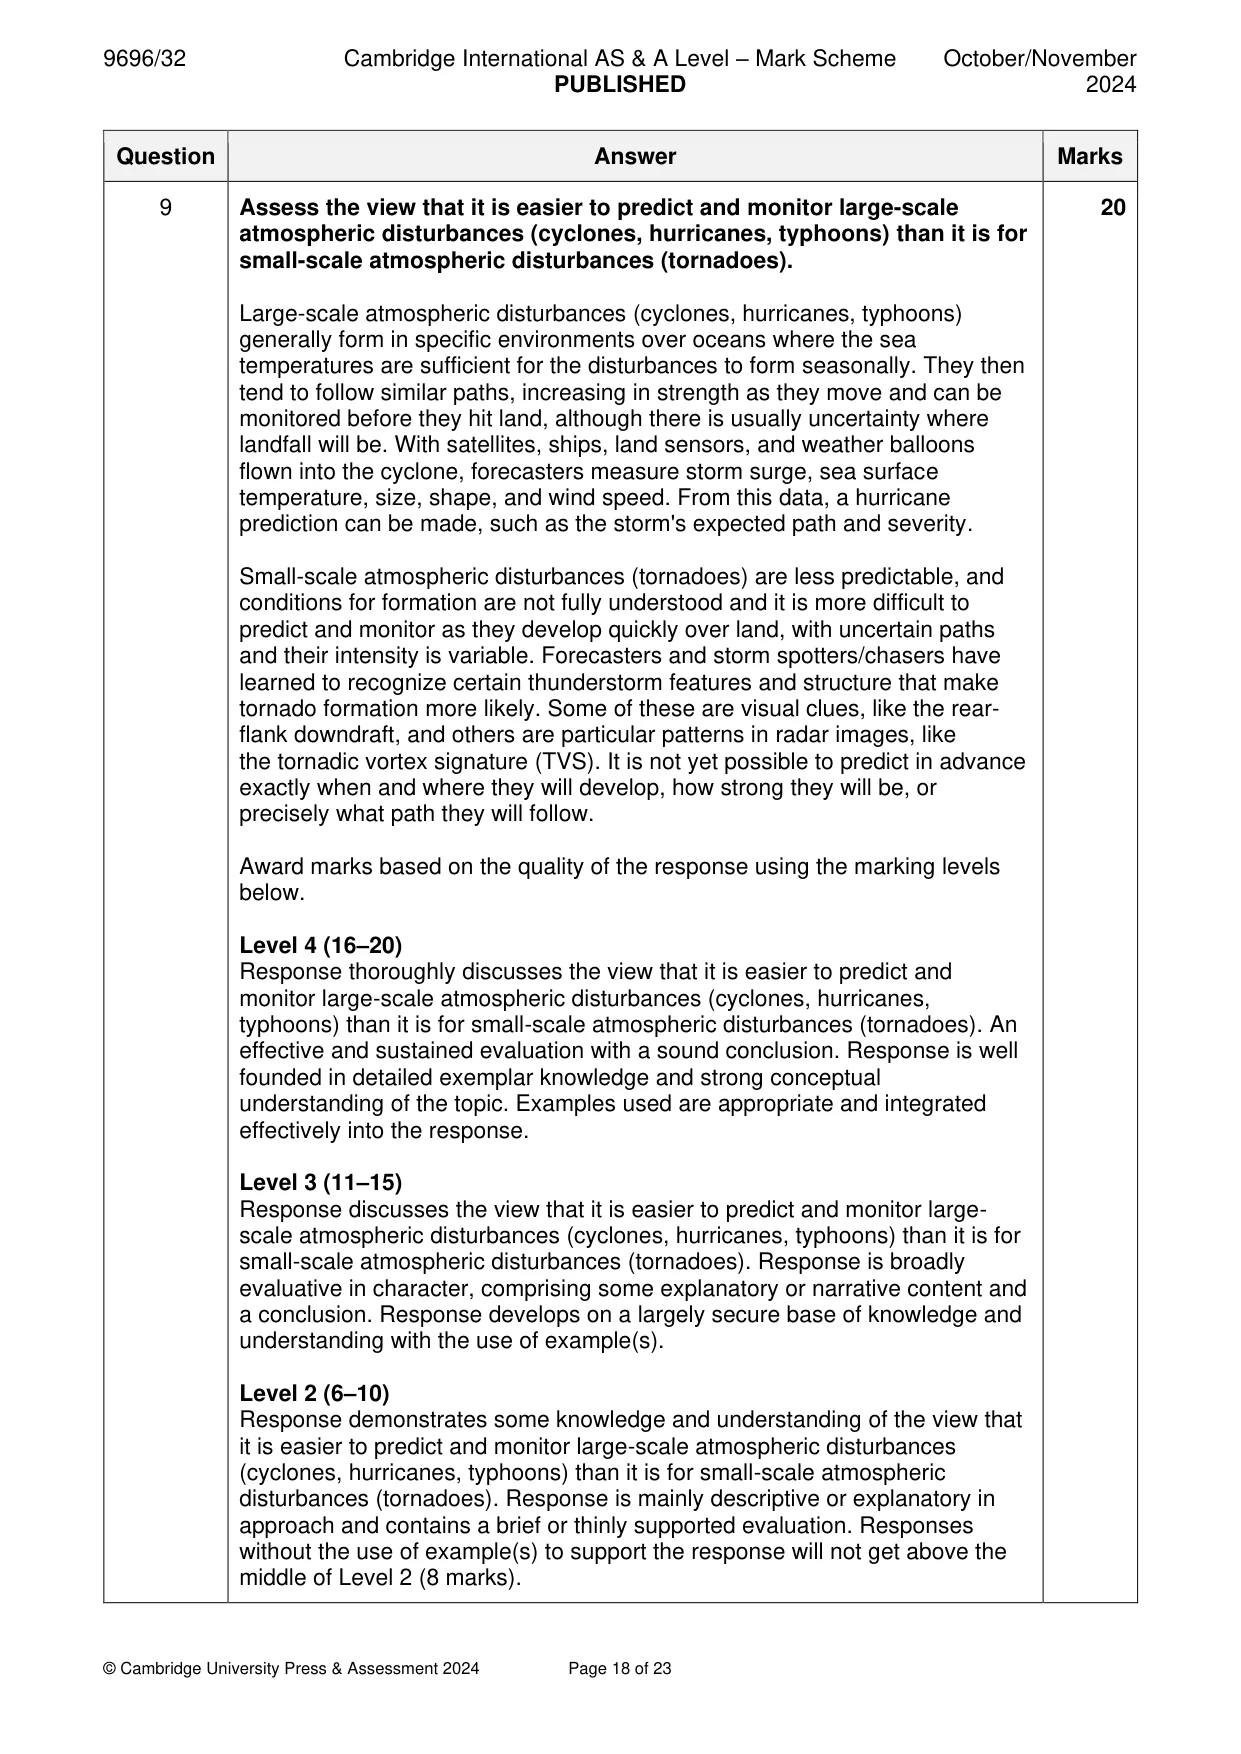
9 Assess the view that it is easier to predict and monitor large-scale atmospheric disturbances (cyclones, hurricanes, typhoons) than it is for small-scale atmospheric disturbances (tornadoes). [20] Hot arid and semi-arid environments If answering this option, answer Question 10 and either Question 11 or Question 12.
Mark scheme: 9 Assess the view that it is easier to predict and monitor large-scale 20 atmospheric disturbances (cyclones, hurricanes, typhoons) than it is for small-scale atmospheric disturbances (tornadoes). Large-scale atmospheric disturbances (cyclones, hurricanes, typhoons) generally form in specific environments over oceans where the sea temperatures are sufficient for the disturbances to form seasonally. They then tend to follow similar paths, increasing in strength as they move and can be monitored before they hit land, although there is usually uncertainty where landfall will be. With satellites, ships, land sensors, and weather balloons flown into the cyclone, forecasters measure storm surge, sea surface temperature, size, shape, and wind speed. From this data, a hurricane prediction can be made, such as the storm's expected path and severity. Small-scale atmospheric disturbances (tornadoes) are less predictable, and conditions for formation are not fully understood and it is more difficult to predict and monitor as they develop quickly over land, with uncertain paths and their intensity is variable. Forecasters and storm spotters/chasers have learned to recognize certain thunderstorm features and structure that make tornado formation more likely. Some of these are visual clues, like the rear- flank downdraft, and others are particular patterns in radar images, like the tornadic vortex signature (TVS). It is not yet possible to predict in advance exactly when and where they will develop, how strong they will be, or precisely what path they will follow. Award marks based on the quality of the response using the marking levels below. Level 4 (16–20) Response thoroughly discusses the view that it is easier to predict and monitor large-scale atmospheric disturbances (cyclones, hurricanes, typhoons) than it is for small-scale atmospheric disturbances (tornadoes). An effective and sustained evaluation with a sound conclusion. Response is well founded in detailed exemplar knowledge and strong conceptual understanding of the topic. Examples used are appropriate and integrated effectively into the response. Level 3 (11–15) Response discusses the view that it is easier to predict and monitor large- scale atmospheric disturbances (cyclones, hurricanes, typhoons) than it is for small-scale atmospheric disturbances (tornadoes). Response is broadly evaluative in character, comprising some explanatory or narrative content and a conclusion. Response develops on a largely secure base of knowledge and understanding with the use of example(s). Level 2 (6–10) Response demonstrates some knowledge and understanding of the view that it is easier to predict and monitor large-scale atmospheric disturbances (cyclones, hurricanes, typhoons) than it is for small-scale atmospheric disturbances (tornadoes). Response is mainly descriptive or explanatory in approach and contains a brief or thinly supported evaluation. Responses without the use of example(s) to support the response will not get above the middle of Level 2 (8 marks). 9 Level 1 (1–5) Response makes a few general points about the view that it is easier to predict and monitor large-scale atmospheric disturbances (cyclones, hurricanes, typhoons) than it is for small-scale atmospheric disturbances (tornadoes). A descriptive response comprising a few simple points. Knowledge is basic and understanding may be poor and lack relevance to the question set. Level 0 (0) No creditable response. Hot arid and semi-arid environments If answering this option, answer Question 10 and either Question 11 or Question 12.
Q10 · The rainfall variability over the semi-arid regions of Namibia, Botswana and north- west…
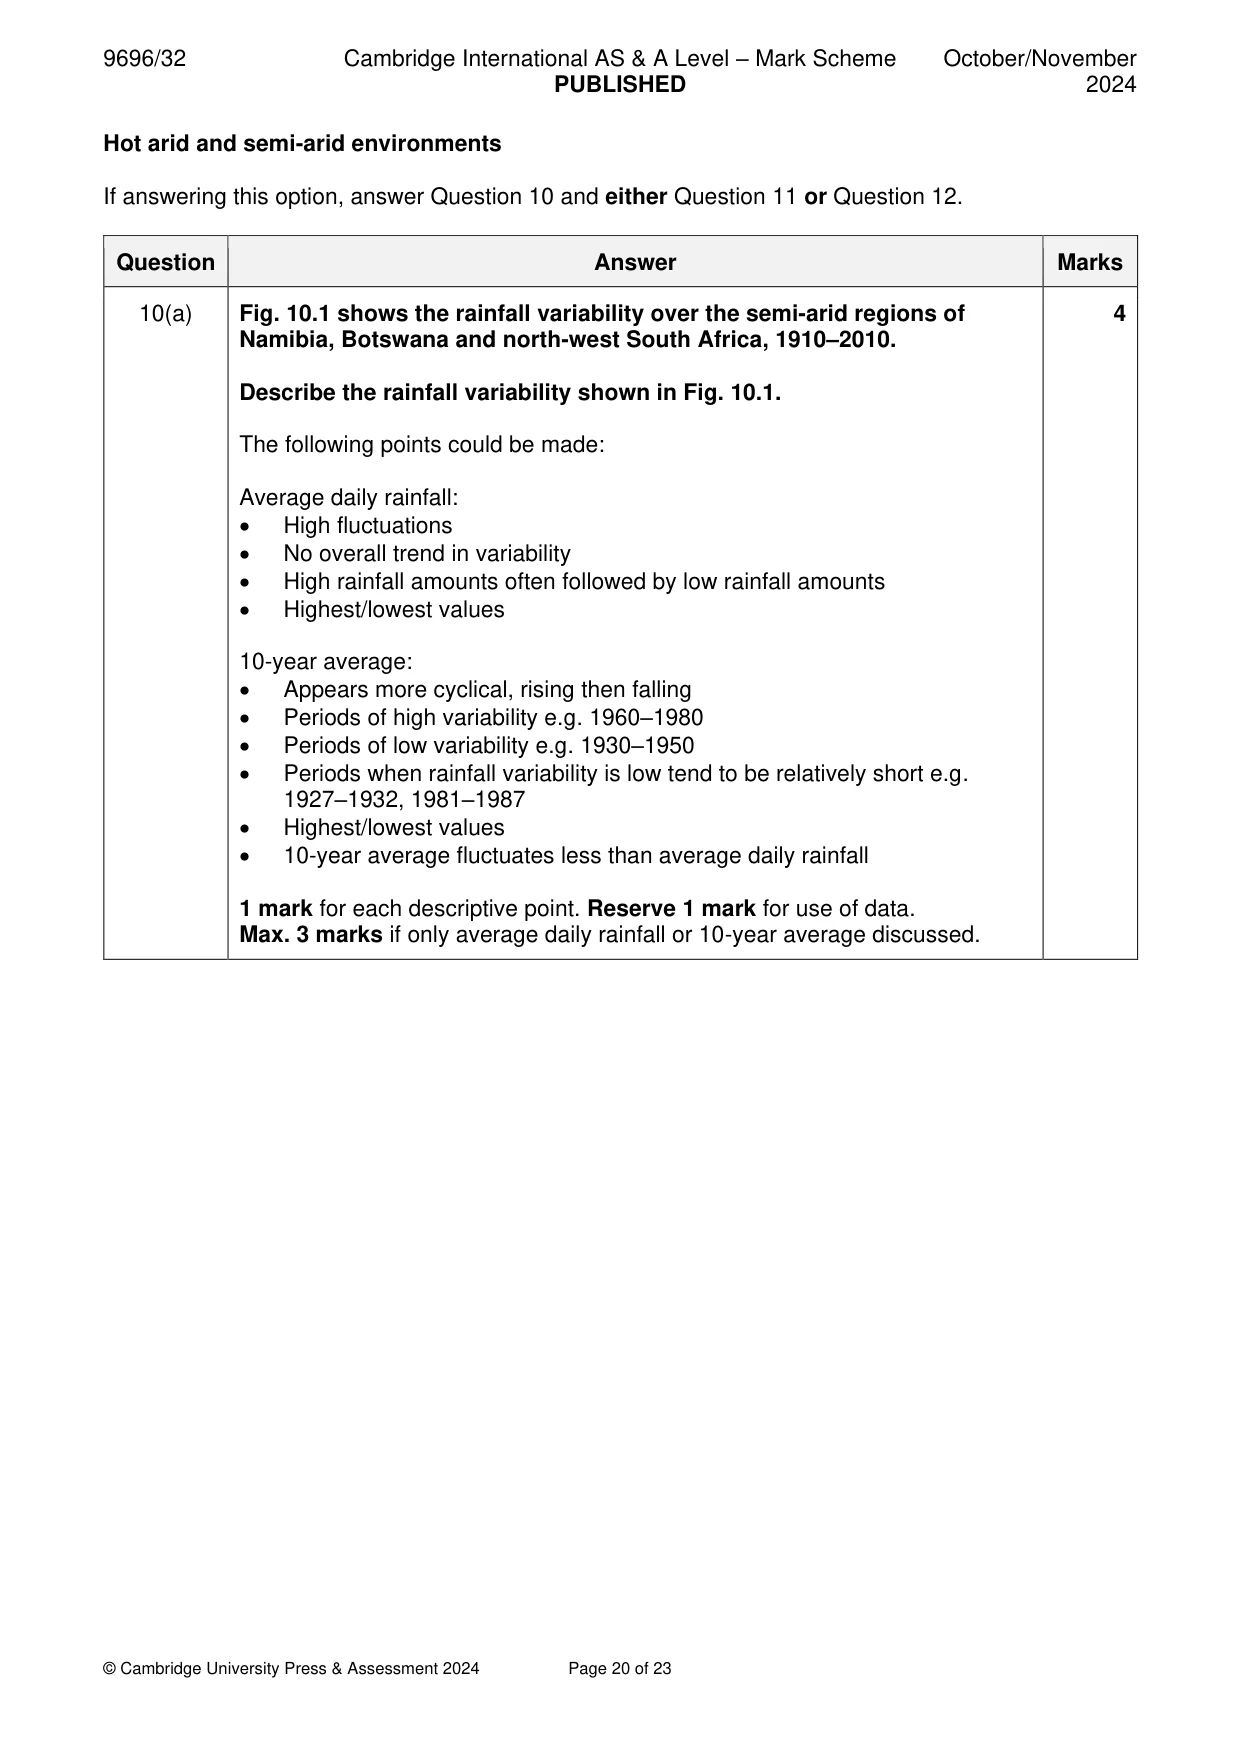
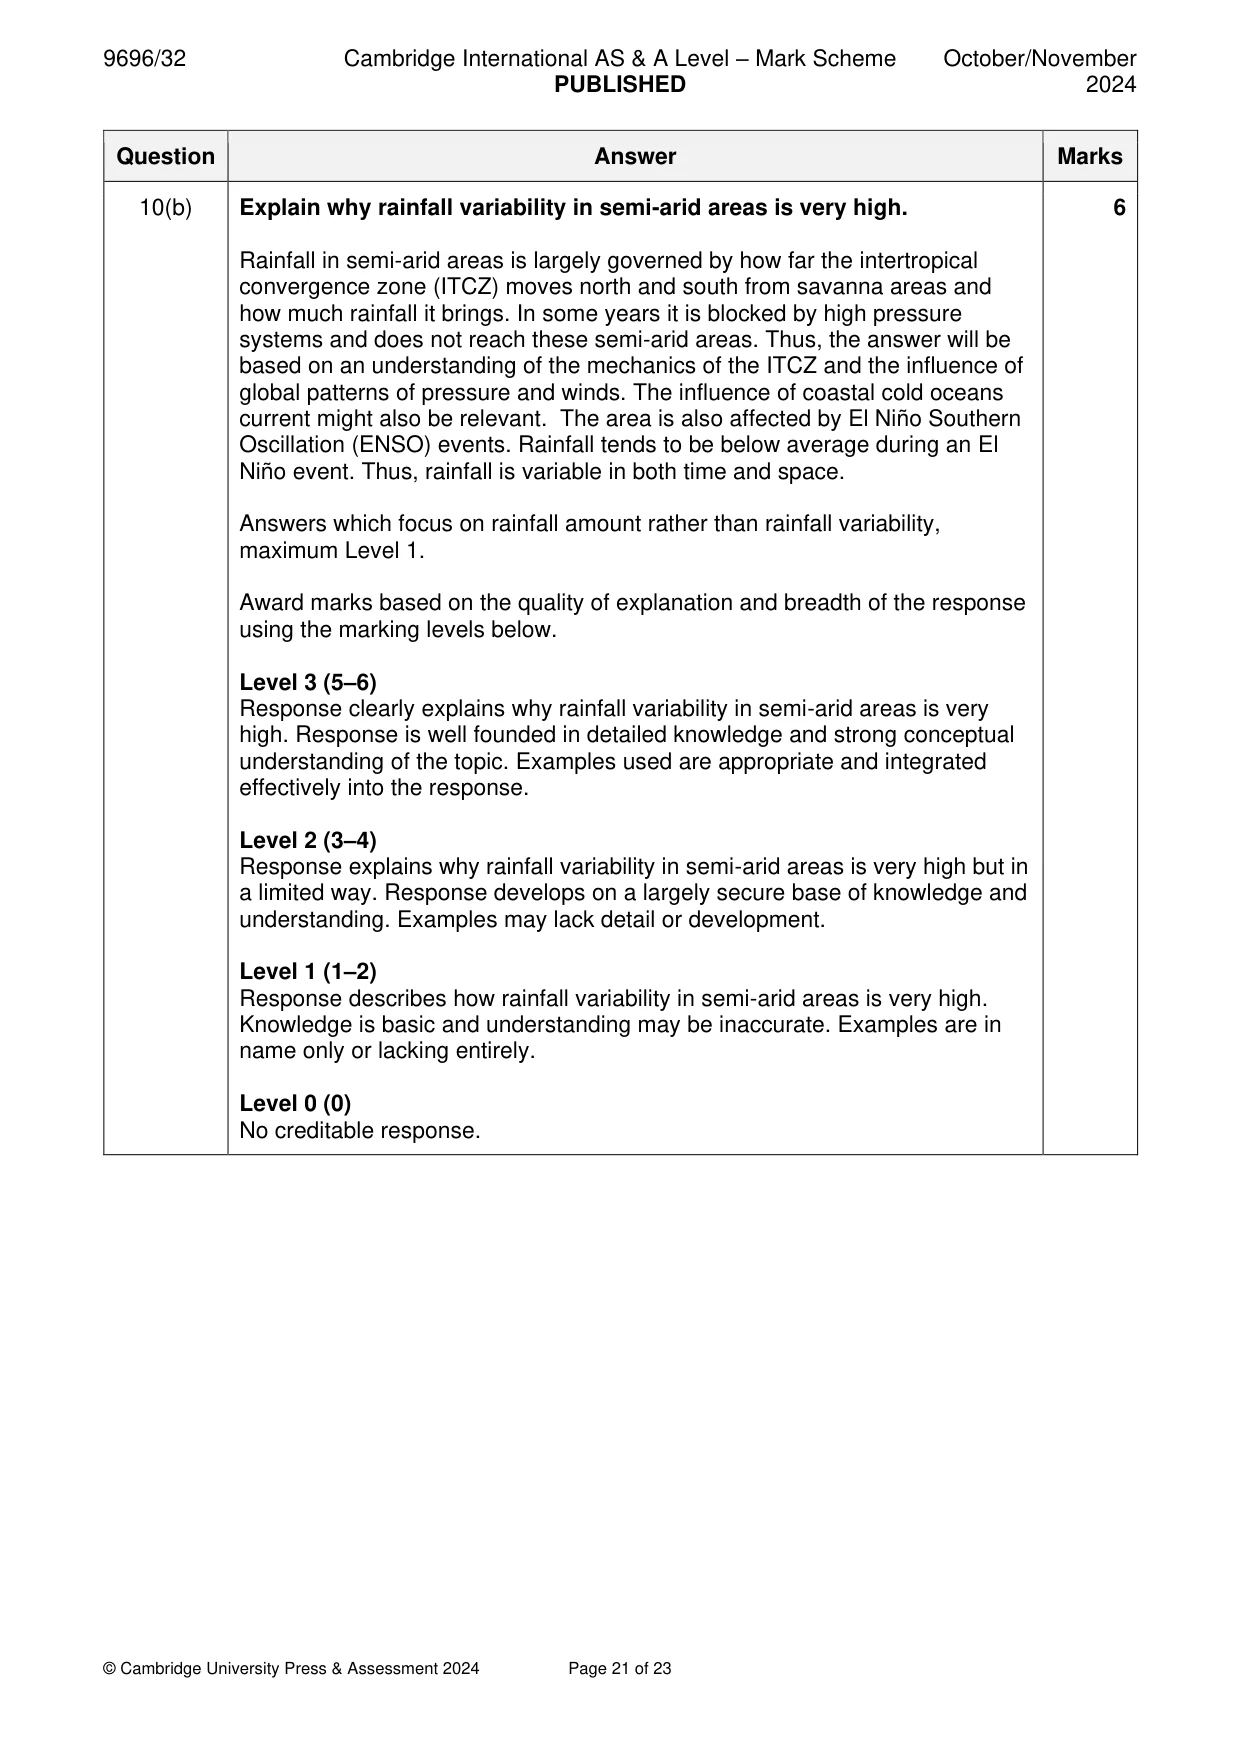
10 Fig. 10.1 shows the rainfall variability over the semi-arid regions of Namibia, Botswana and north- west South Africa, 1910–2010. (a) Describe the rainfall variability shown in Fig. 10.1. [4] (b) Explain why rainfall variability in semi-arid areas is very high. [6]
Mark scheme: 10(a) Fig. 10.1 shows the rainfall variability over the semi-arid regions of 4 Namibia, Botswana and north-west South Africa, 1910–2010. Describe the rainfall variability shown in Fig. 10.1. The following points could be made: Average daily rainfall: • High fluctuations • No overall trend in variability • High rainfall amounts often followed by low rainfall amounts • Highest/lowest values 10-year average: • Appears more cyclical, rising then falling • Periods of high variability e.g. 1960–1980 • Periods of low variability e.g. 1930–1950 • Periods when rainfall variability is low tend to be relatively short e.g. 1927–1932, 1981–1987 • Highest/lowest values • 10-year average fluctuates less than average daily rainfall 1 mark for each descriptive point. Reserve 1 mark for use of data. Max. 3 marks if only average daily rainfall or 10-year average discussed. 10(b) Explain why rainfall variability in semi-arid areas is very high. 6 Rainfall in semi-arid areas is largely governed by how far the intertropical convergence zone (ITCZ) moves north and south from savanna areas and how much rainfall it brings. In some years it is blocked by high pressure systems and does not reach these semi-arid areas. Thus, the answer will be based on an understanding of the mechanics of the ITCZ and the influence of global patterns of pressure and winds. The influence of coastal cold oceans current might also be relevant. The area is also affected by El Niño Southern Oscillation (ENSO) events. Rainfall tends to be below average during an El Niño event. Thus, rainfall is variable in both time and space. Answers which focus on rainfall amount rather than rainfall variability, maximum Level 1. Award marks based on the quality of explanation and breadth of the response using the marking levels below. Level 3 (5–6) Response clearly explains why rainfall variability in semi-arid areas is very high. Response is well founded in detailed knowledge and strong conceptual understanding of the topic. Examples used are appropriate and integrated effectively into the response. Level 2 (3–4) Response explains why rainfall variability in semi-arid areas is very high but in a limited way. Response develops on a largely secure base of knowledge and understanding. Examples may lack detail or development. Level 1 (1–2) Response describes how rainfall variability in semi-arid areas is very high. Knowledge is basic and understanding may be inaccurate. Examples are in name only or lacking entirely. Level 0 (0) No creditable response.
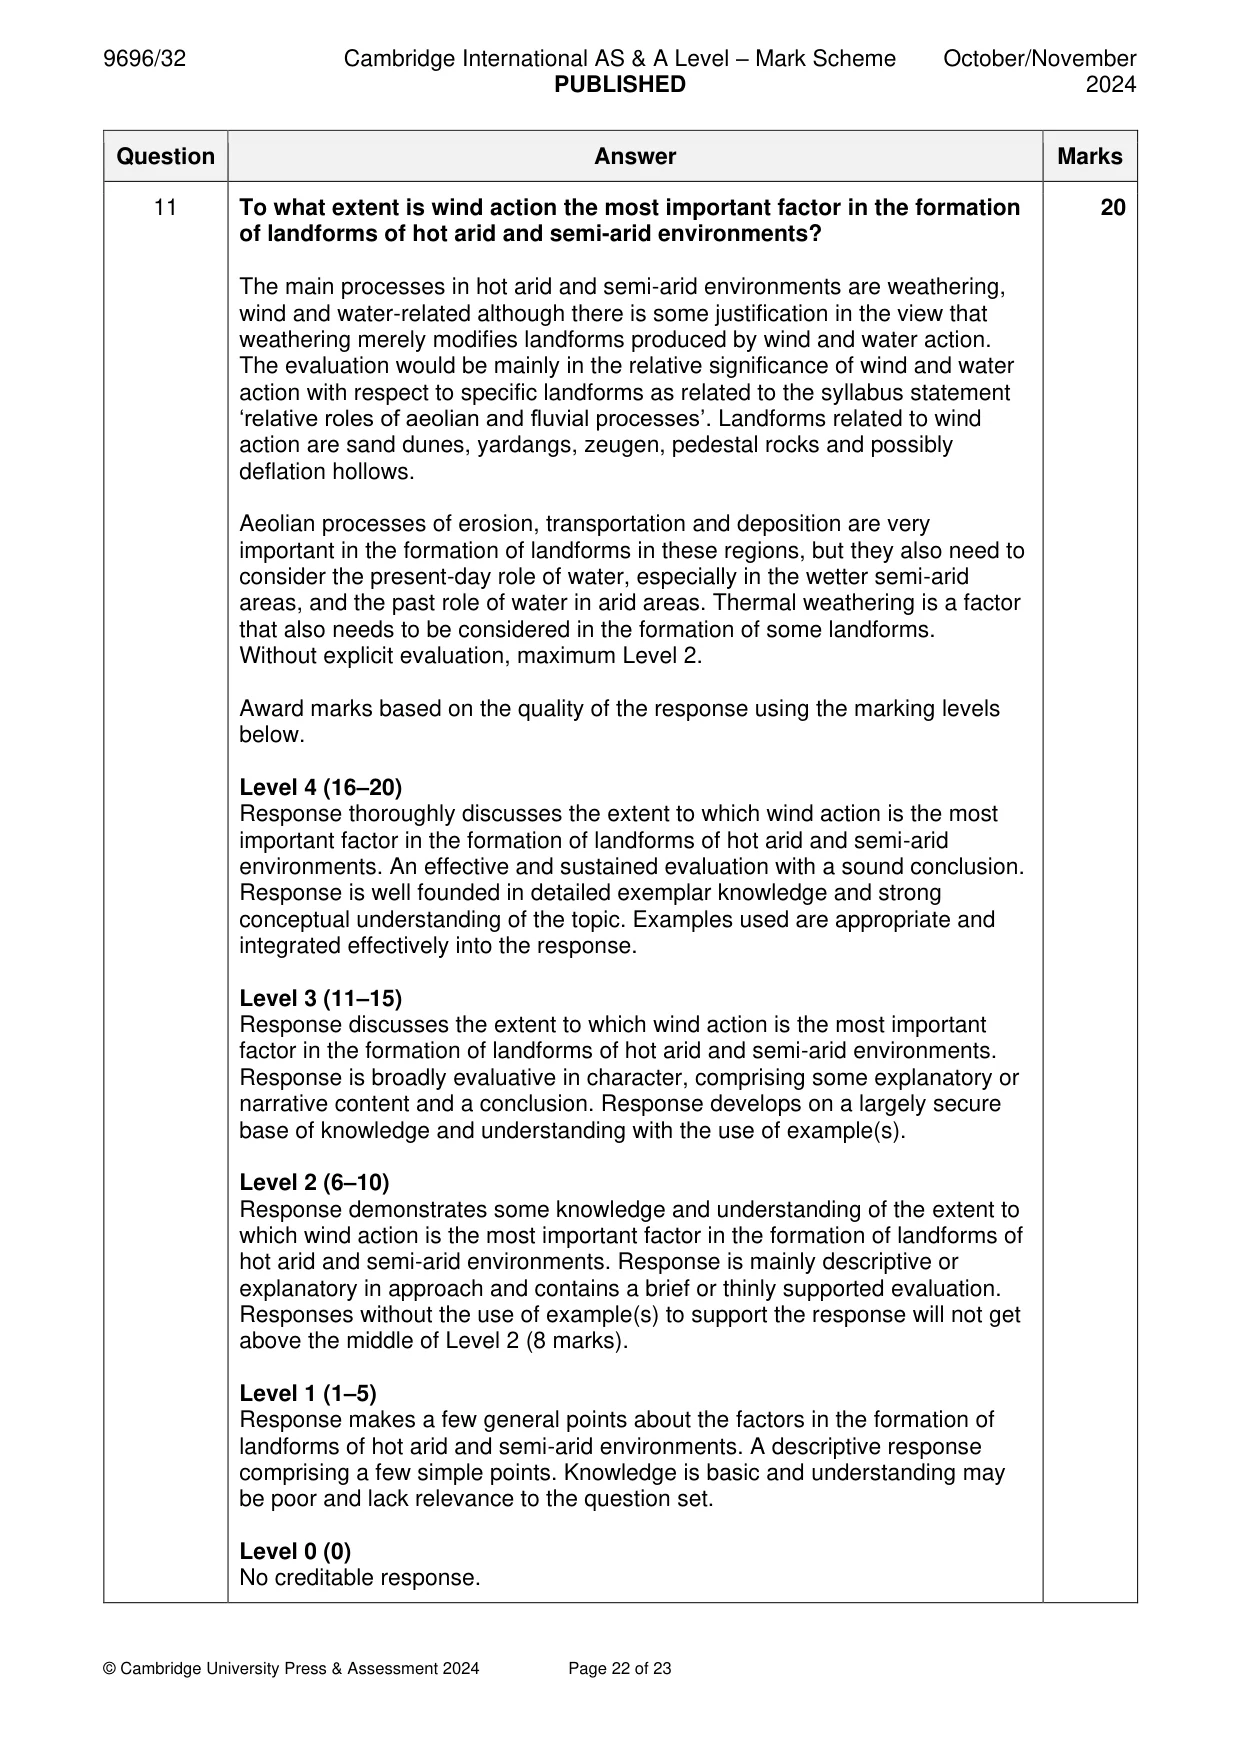
Q11 · To what extent is wind action the most important factor in the formation of landforms of…
11 To what extent is wind action the most important factor in the formation of landforms of hot arid and semi-arid environments? [20]
Mark scheme: 11 To what extent is wind action the most important factor in the formation 20 of landforms of hot arid and semi-arid environments? The main processes in hot arid and semi-arid environments are weathering, wind and water-related although there is some justification in the view that weathering merely modifies landforms produced by wind and water action. The evaluation would be mainly in the relative significance of wind and water action with respect to specific landforms as related to the syllabus statement ‘relative roles of aeolian and fluvial processes’. Landforms related to wind action are sand dunes, yardangs, zeugen, pedestal rocks and possibly deflation hollows. Aeolian processes of erosion, transportation and deposition are very important in the formation of landforms in these regions, but they also need to consider the present-day role of water, especially in the wetter semi-arid areas, and the past role of water in arid areas. Thermal weathering is a factor that also needs to be considered in the formation of some landforms. Without explicit evaluation, maximum Level 2. Award marks based on the quality of the response using the marking levels below. Level 4 (16–20) Response thoroughly discusses the extent to which wind action is the most important factor in the formation of landforms of hot arid and semi-arid environments. An effective and sustained evaluation with a sound conclusion. Response is well founded in detailed exemplar knowledge and strong conceptual understanding of the topic. Examples used are appropriate and integrated effectively into the response. Level 3 (11–15) Response discusses the extent to which wind action is the most important factor in the formation of landforms of hot arid and semi-arid environments. Response is broadly evaluative in character, comprising some explanatory or narrative content and a conclusion. Response develops on a largely secure base of knowledge and understanding with the use of example(s). Level 2 (6–10) Response demonstrates some knowledge and understanding of the extent to which wind action is the most important factor in the formation of landforms of hot arid and semi-arid environments. Response is mainly descriptive or explanatory in approach and contains a brief or thinly supported evaluation. Responses without the use of example(s) to support the response will not get above the middle of Level 2 (8 marks). Level 1 (1–5) Response makes a few general points about the factors in the formation of landforms of hot arid and semi-arid environments. A descriptive response comprising a few simple points. Knowledge is basic and understanding may be poor and lack relevance to the question set. Level 0 (0) No creditable response.
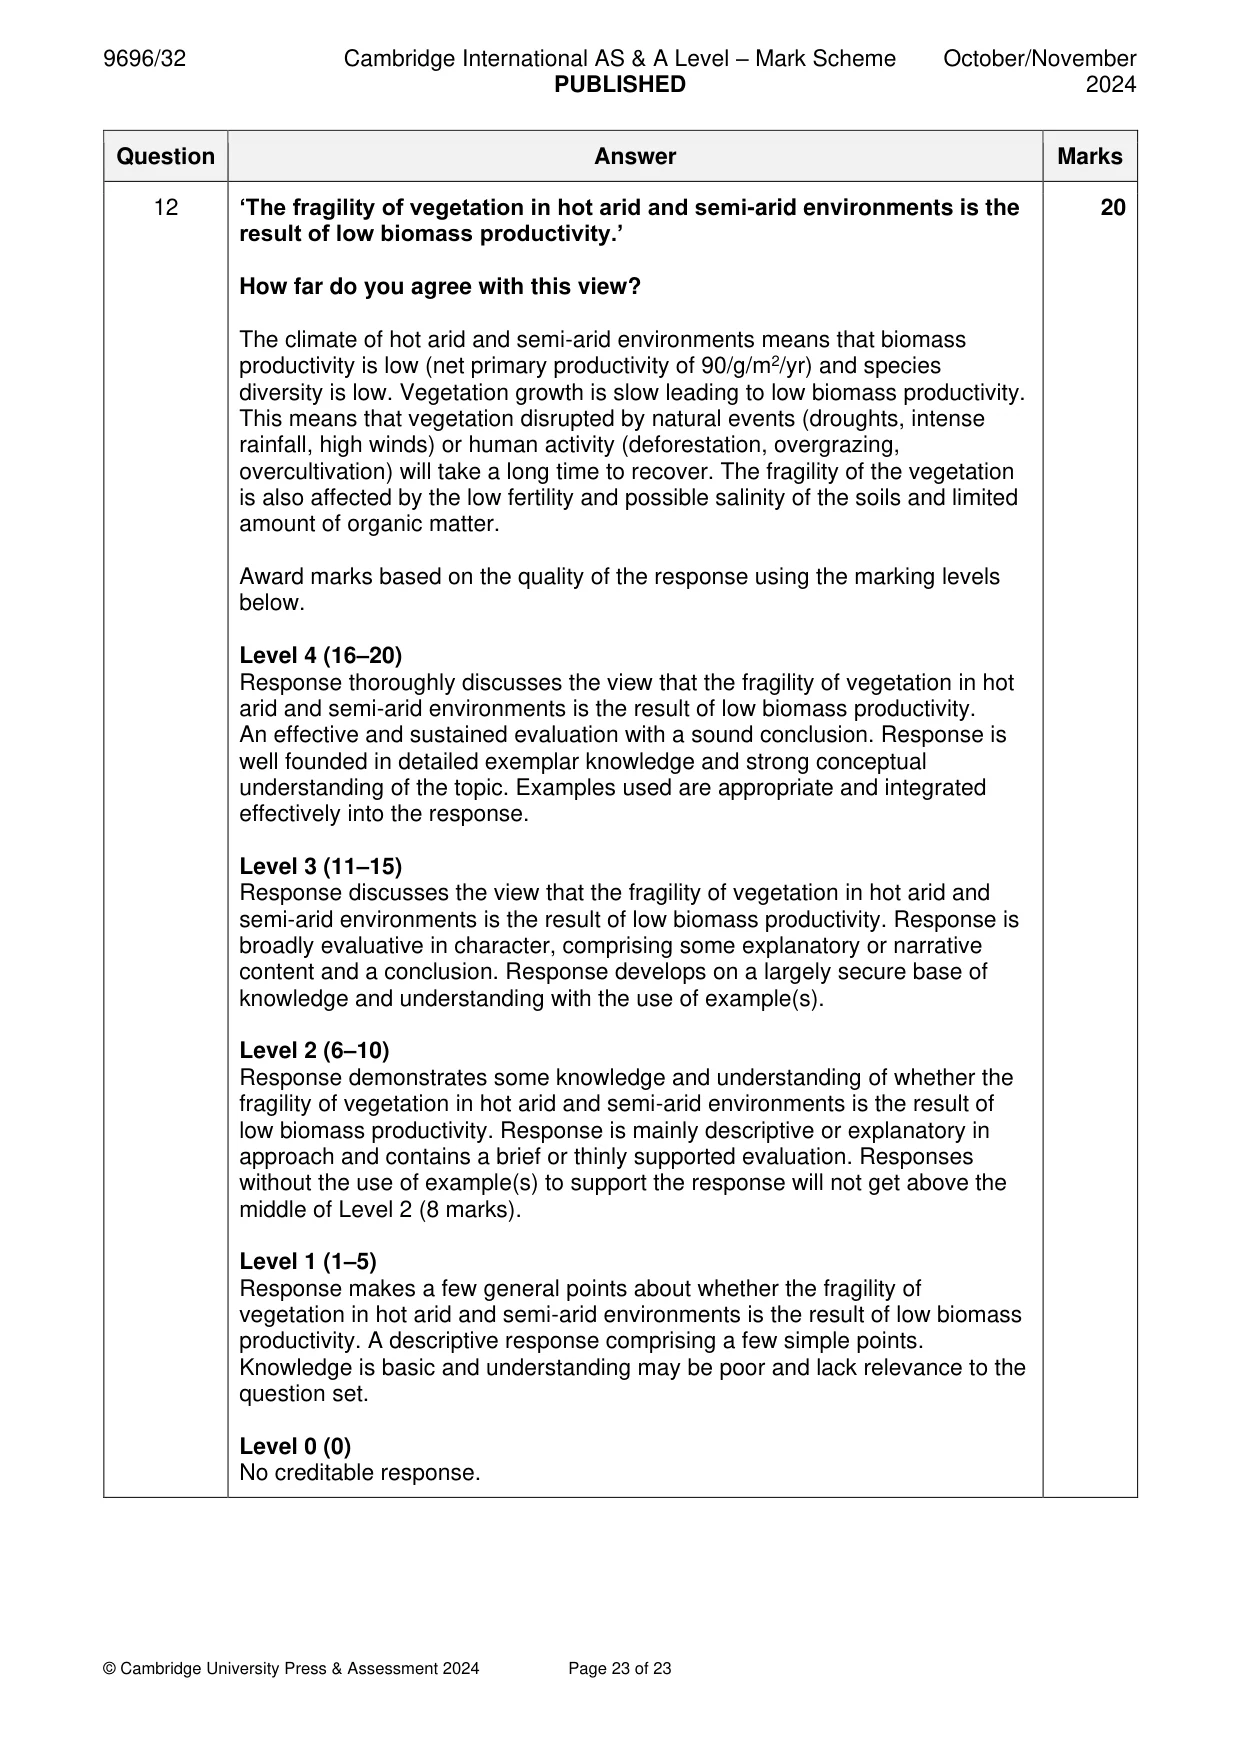
Q12 · ‘The fragility of vegetation in hot arid and semi-arid environments is the result of low…
12 ‘The fragility of vegetation in hot arid and semi-arid environments is the result of low biomass productivity.’ How far do you agree with this view? [20]
Mark scheme: 12 ‘The fragility of vegetation in hot arid and semi-arid environments is the 20 result of low biomass productivity.’ How far do you agree with this view? The climate of hot arid and semi-arid environments means that biomass productivity is low (net primary productivity of 90/g/m2/yr) and species diversity is low. Vegetation growth is slow leading to low biomass productivity. This means that vegetation disrupted by natural events (droughts, intense rainfall, high winds) or human activity (deforestation, overgrazing, overcultivation) will take a long time to recover. The fragility of the vegetation is also affected by the low fertility and possible salinity of the soils and limited amount of organic matter. Award marks based on the quality of the response using the marking levels below. Level 4 (16–20) Response thoroughly discusses the view that the fragility of vegetation in hot arid and semi-arid environments is the result of low biomass productivity. An effective and sustained evaluation with a sound conclusion. Response is well founded in detailed exemplar knowledge and strong conceptual understanding of the topic. Examples used are appropriate and integrated effectively into the response. Level 3 (11–15) Response discusses the view that the fragility of vegetation in hot arid and semi-arid environments is the result of low biomass productivity. Response is broadly evaluative in character, comprising some explanatory or narrative content and a conclusion. Response develops on a largely secure base of knowledge and understanding with the use of example(s). Level 2 (6–10) Response demonstrates some knowledge and understanding of whether the fragility of vegetation in hot arid and semi-arid environments is the result of low biomass productivity. Response is mainly descriptive or explanatory in approach and contains a brief or thinly supported evaluation. Responses without the use of example(s) to support the response will not get above the middle of Level 2 (8 marks). Level 1 (1–5) Response makes a few general points about whether the fragility of vegetation in hot arid and semi-arid environments is the result of low biomass productivity. A descriptive response comprising a few simple points. Knowledge is basic and understanding may be poor and lack relevance to the question set. Level 0 (0) No creditable response.
What was in this paper
The subtopics covered by these 12 questions, and how many questions each got. Open one in a new tab to see every Cambridge question on it.
1Coastal processes1Hazards resulting from atmospheric disturbances1Hazards resulting from mass movements1Hazards resulting from tectonic processes1Hot arid and semi-arid climates1Humid tropical (rainforest) ecosystems and seasonally humid tropical (savanna) ecosystems1Landforms of hot arid and semi-arid environments1Landforms of tropical environments1Soils and vegetation1Sustainable management in hazardous environments1Tropical climates1What you needed in this session
Cambridge’s own grade thresholds for 2024 Oct/Nov, Paper 3 · Variant 2. A higher threshold means an easier paper — the bar moves with how the cohort did.