Cambridge A Level Geography 9696 — 2024 Oct/Nov Paper 4 · Variant 3
9696/43/O/N/24 · 12 questions · 60 marks · ≈68 min
The question paper and its mark scheme, free to read here and free to download. This is Cambridge’s own paper, exactly as it was sat.
Question paper4 pages


Mark scheme27 pages
Answers below. Sit the paper first if you are practising.







Questions as text
Q1 · Food supply and food demand in Bangladesh, projected for 2030
1 Fig. 1.1 shows food supply and food demand in Bangladesh, projected for 2030. (a) Compare the projections of food supply and food demand shown in Fig. 1.1. [4] (b) Explain the concept of an agricultural system. [6]
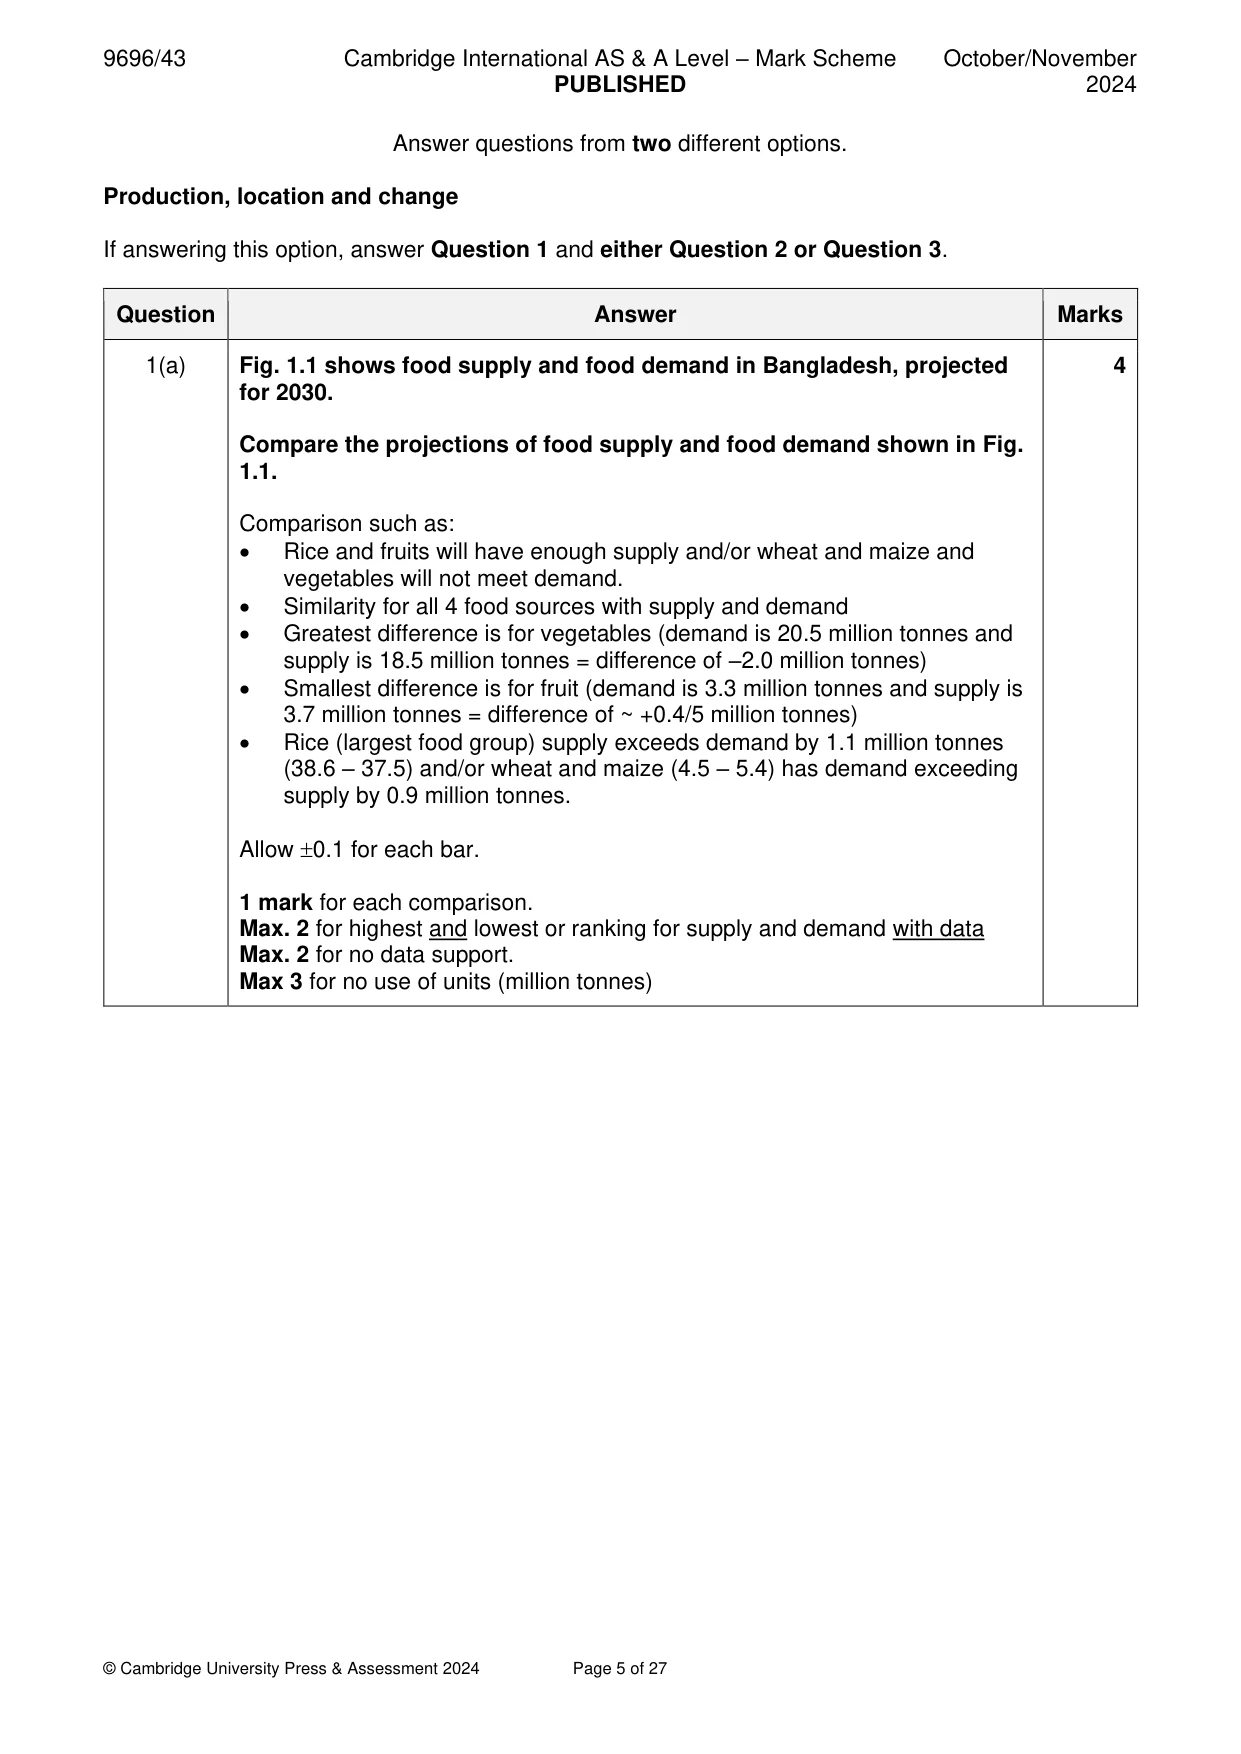
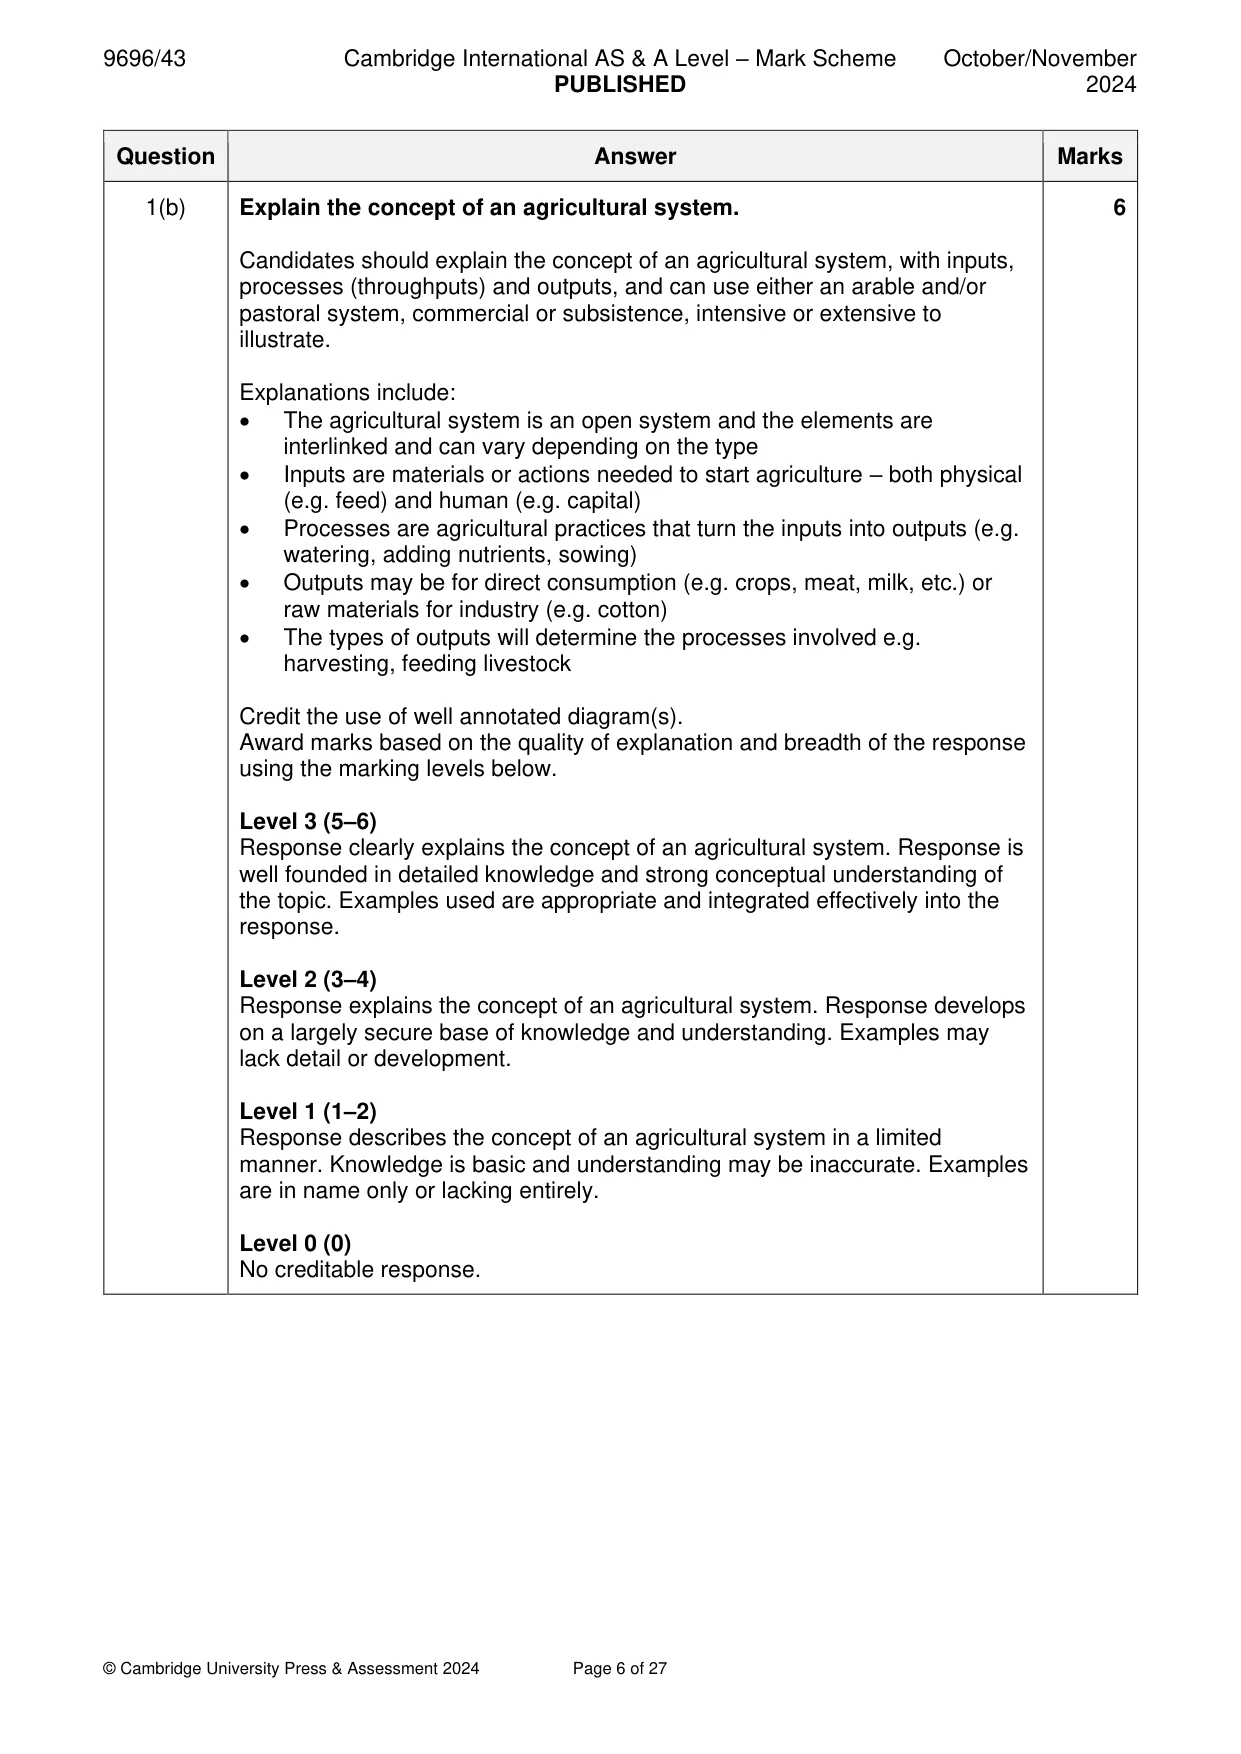
Mark scheme: Question Answer Marks 1(a) Fig. 1.1 shows food supply and food demand in Bangladesh, projected 4 for 2030. Compare the projections of food supply and food demand shown in Fig. 1.1. Comparison such as: • Rice and fruits will have enough supply and/or wheat and maize and vegetables will not meet demand. • Similarity for all 4 food sources with supply and demand • Greatest difference is for vegetables (demand is 20.5 million tonnes and supply is 18.5 million tonnes = difference of –2.0 million tonnes) • Smallest difference is for fruit (demand is 3.3 million tonnes and supply is 3.7 million tonnes = difference of ~ +0.4/5 million tonnes) • Rice (largest food group) supply exceeds demand by 1.1 million tonnes (38.6 – 37.5) and/or wheat and maize (4.5 – 5.4) has demand exceeding supply by 0.9 million tonnes. Allow 0.1 for each bar. 1 mark for each comparison. Max. 2 for highest and lowest or ranking for supply and demand with data Max. 2 for no data support. Max 3 for no use of units (million tonnes) 1(b) Explain the concept of an agricultural system. 6 Candidates should explain the concept of an agricultural system, with inputs, processes (throughputs) and outputs, and can use either an arable and/or pastoral system, commercial or subsistence, intensive or extensive to illustrate. Explanations include: • The agricultural system is an open system and the elements are interlinked and can vary depending on the type • Inputs are materials or actions needed to start agriculture – both physical (e.g. feed) and human (e.g. capital) • Processes are agricultural practices that turn the inputs into outputs (e.g. watering, adding nutrients, sowing) • Outputs may be for direct consumption (e.g. crops, meat, milk, etc.) or raw materials for industry (e.g. cotton) • The types of outputs will determine the processes involved e.g. harvesting, feeding livestock Credit the use of well annotated diagram(s). Award marks based on the quality of explanation and breadth of the response using the marking levels below. Level 3 (5–6) Response clearly explains the concept of an agricultural system. Response is well founded in detailed knowledge and strong conceptual understanding of the topic. Examples used are appropriate and integrated effectively into the response. Level 2 (3–4) Response explains the concept of an agricultural system. Response develops on a largely secure base of knowledge and understanding. Examples may lack detail or development. Level 1 (1–2) Response describes the concept of an agricultural system in a limited manner. Knowledge is basic and understanding may be inaccurate. Examples are in name only or lacking entirely. Level 0 (0) No creditable response.
Q2 · For one country, assess the relative importance of the difficulties in the management of…
2 For one country, assess the relative importance of the difficulties in the management of agricultural change at the local scale. [20]
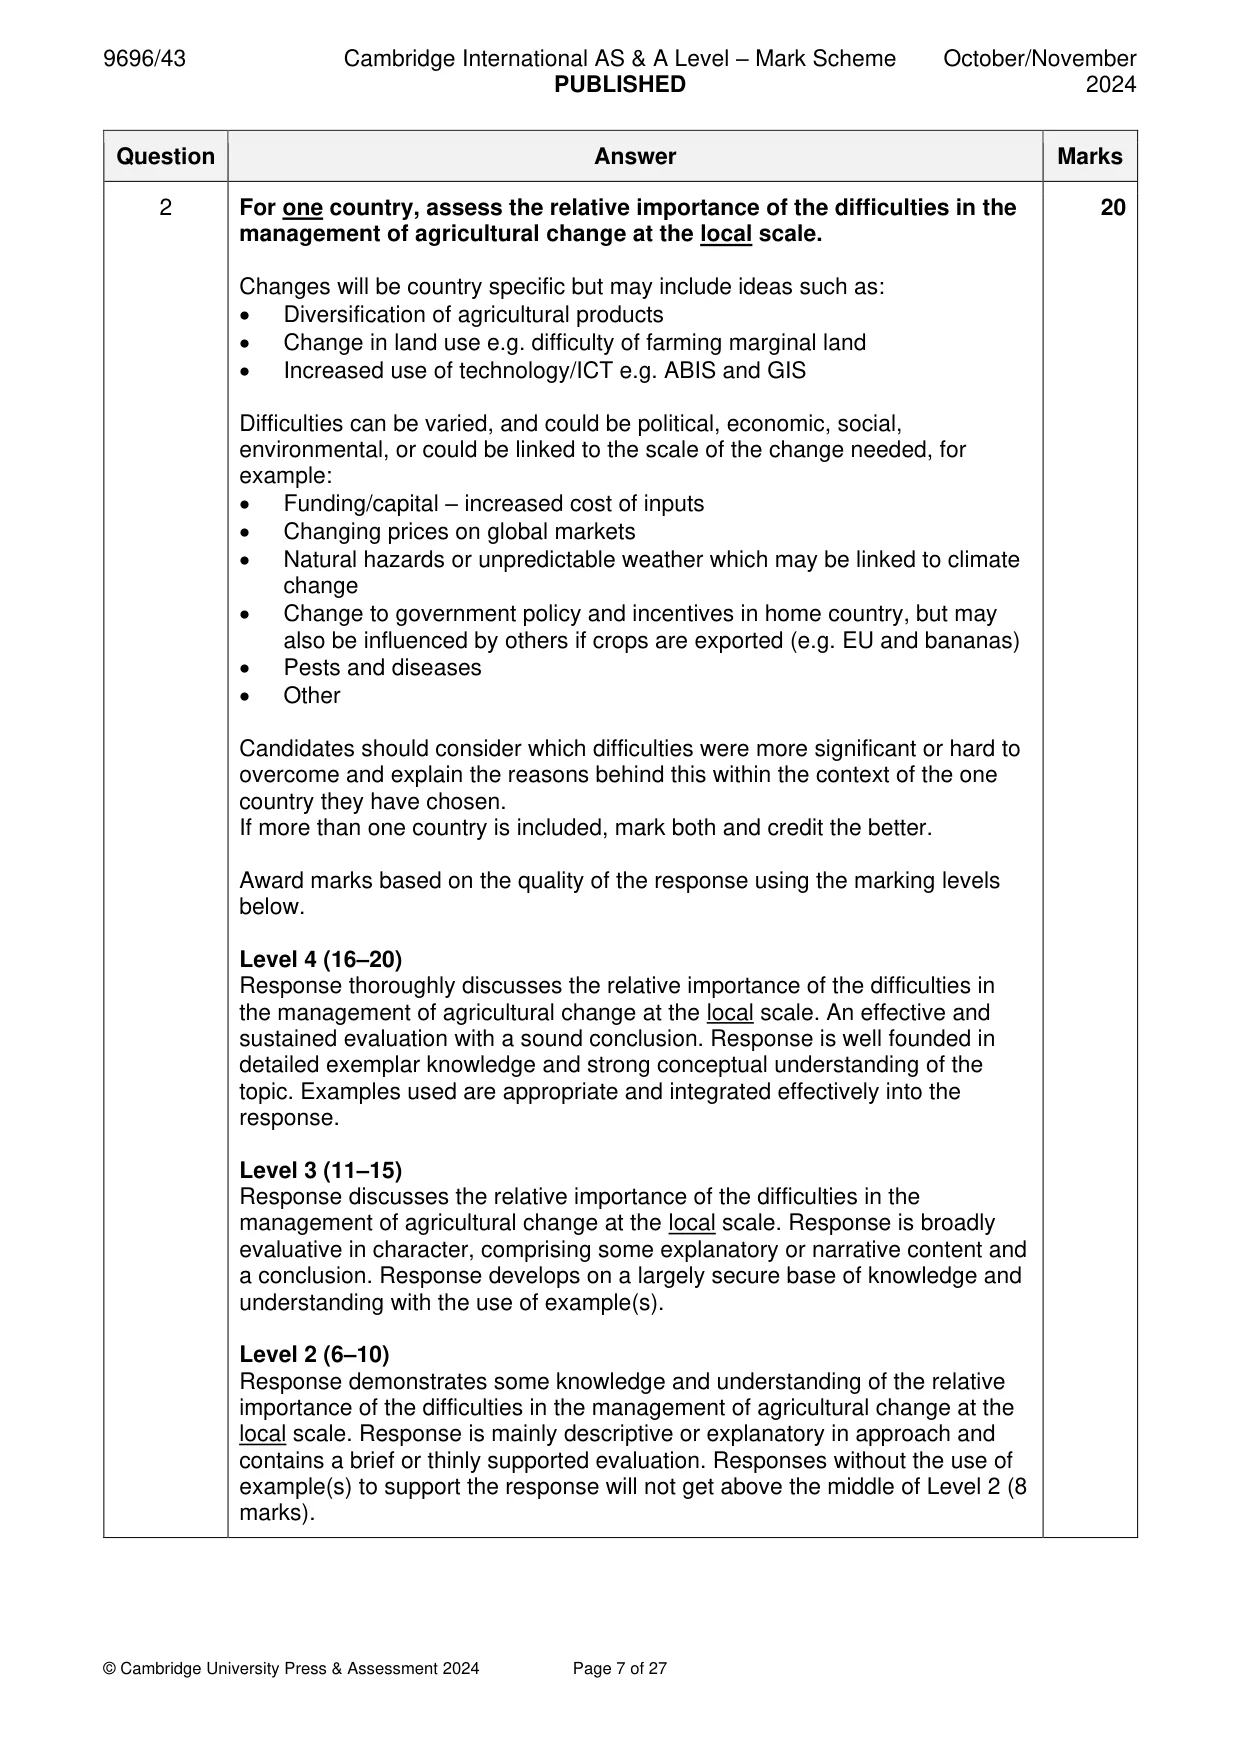
Mark scheme: 2 For one country, assess the relative importance of the difficulties in the 20 management of agricultural change at the local scale. Changes will be country specific but may include ideas such as: • Diversification of agricultural products • Change in land use e.g. difficulty of farming marginal land • Increased use of technology/ICT e.g. ABIS and GIS Difficulties can be varied, and could be political, economic, social, environmental, or could be linked to the scale of the change needed, for example: • Funding/capital – increased cost of inputs • Changing prices on global markets • Natural hazards or unpredictable weather which may be linked to climate change • Change to government policy and incentives in home country, but may also be influenced by others if crops are exported (e.g. EU and bananas) • Pests and diseases • Other Candidates should consider which difficulties were more significant or hard to overcome and explain the reasons behind this within the context of the one country they have chosen. If more than one country is included, mark both and credit the better. Award marks based on the quality of the response using the marking levels below. Level 4 (16–20) Response thoroughly discusses the relative importance of the difficulties in the management of agricultural change at the local scale. An effective and sustained evaluation with a sound conclusion. Response is well founded in detailed exemplar knowledge and strong conceptual understanding of the topic. Examples used are appropriate and integrated effectively into the response. Level 3 (11–15) Response discusses the relative importance of the difficulties in the management of agricultural change at the local scale. Response is broadly evaluative in character, comprising some explanatory or narrative content and a conclusion. Response develops on a largely secure base of knowledge and understanding with the use of example(s). Level 2 (6–10) Response demonstrates some knowledge and understanding of the relative importance of the difficulties in the management of agricultural change at the local scale. Response is mainly descriptive or explanatory in approach and contains a brief or thinly supported evaluation. Responses without the use of example(s) to support the response will not get above the middle of Level 2 (8 marks). 2 Level 1 (1–5) Response makes a few general points about the difficulties in the management of agricultural change. A descriptive response comprising a few simple points. Knowledge is basic and understanding may be poor and lack relevance to the question set. Level 0 (0) No creditable response.
Q3 · Evaluate the advantages and disadvantages to manufacturing and related service industry…
3 Evaluate the advantages and disadvantages to manufacturing and related service industry of locating in industrial estates. [20] Environmental management If answering this option, answer Question 4 and either Question 5 or Question 6.
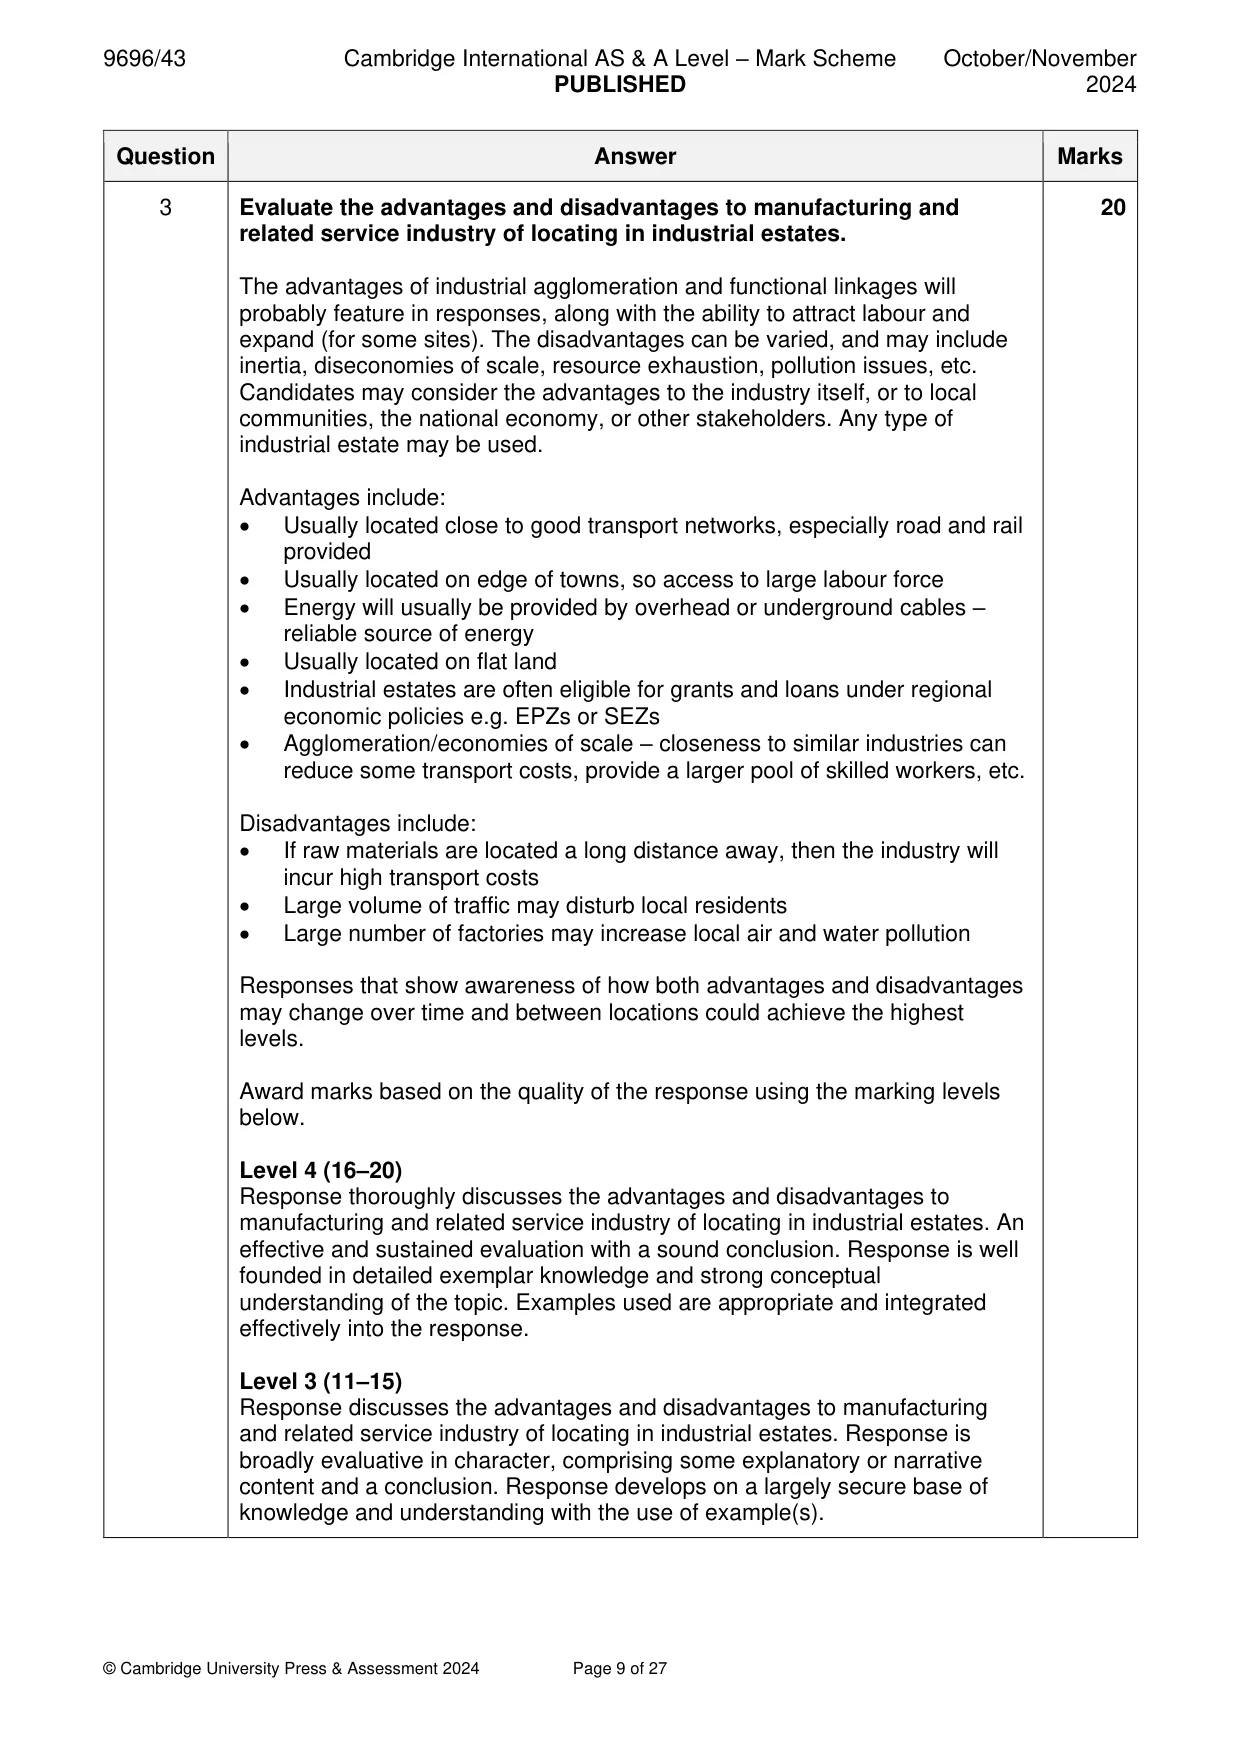
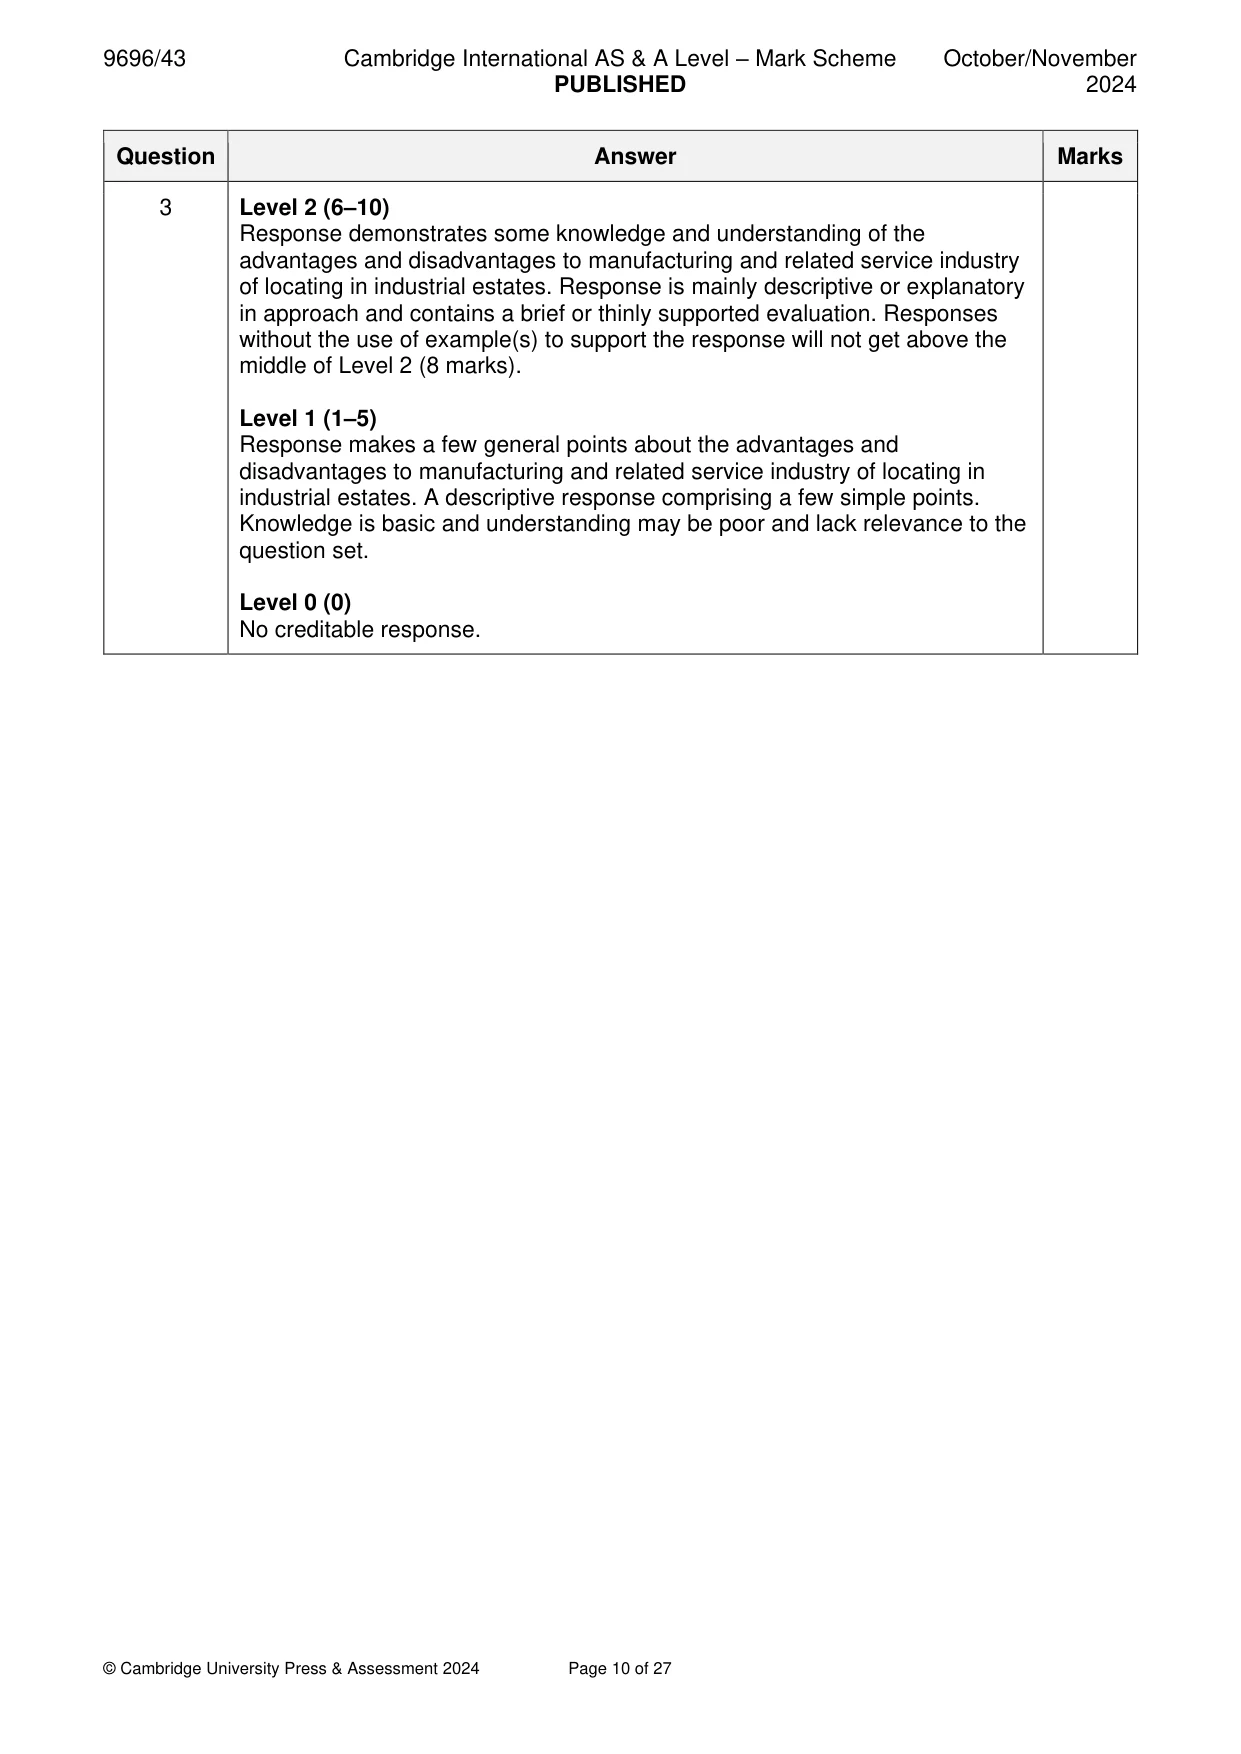
Mark scheme: 3 Evaluate the advantages and disadvantages to manufacturing and 20 related service industry of locating in industrial estates. The advantages of industrial agglomeration and functional linkages will probably feature in responses, along with the ability to attract labour and expand (for some sites). The disadvantages can be varied, and may include inertia, diseconomies of scale, resource exhaustion, pollution issues, etc. Candidates may consider the advantages to the industry itself, or to local communities, the national economy, or other stakeholders. Any type of industrial estate may be used. Advantages include: • Usually located close to good transport networks, especially road and rail provided • Usually located on edge of towns, so access to large labour force • Energy will usually be provided by overhead or underground cables – reliable source of energy • Usually located on flat land • Industrial estates are often eligible for grants and loans under regional economic policies e.g. EPZs or SEZs • Agglomeration/economies of scale – closeness to similar industries can reduce some transport costs, provide a larger pool of skilled workers, etc. Disadvantages include: • If raw materials are located a long distance away, then the industry will incur high transport costs • Large volume of traffic may disturb local residents • Large number of factories may increase local air and water pollution Responses that show awareness of how both advantages and disadvantages may change over time and between locations could achieve the highest levels. Award marks based on the quality of the response using the marking levels below. Level 4 (16–20) Response thoroughly discusses the advantages and disadvantages to manufacturing and related service industry of locating in industrial estates. An effective and sustained evaluation with a sound conclusion. Response is well founded in detailed exemplar knowledge and strong conceptual understanding of the topic. Examples used are appropriate and integrated effectively into the response. Level 3 (11–15) Response discusses the advantages and disadvantages to manufacturing and related service industry of locating in industrial estates. Response is broadly evaluative in character, comprising some explanatory or narrative content and a conclusion. Response develops on a largely secure base of knowledge and understanding with the use of example(s). 3 Level 2 (6–10) Response demonstrates some knowledge and understanding of the advantages and disadvantages to manufacturing and related service industry of locating in industrial estates. Response is mainly descriptive or explanatory in approach and contains a brief or thinly supported evaluation. Responses without the use of example(s) to support the response will not get above the middle of Level 2 (8 marks). Level 1 (1–5) Response makes a few general points about the advantages and disadvantages to manufacturing and related service industry of locating in industrial estates. A descriptive response comprising a few simple points. Knowledge is basic and understanding may be poor and lack relevance to the question set. Level 0 (0) No creditable response. Environmental management If answering this option, answer Question 4 and either Question 5 or Question 6.
Q4 · Number of households reporting diseases at different distances from unplanned waste sites…
4 Fig. 4.1 shows number of households reporting diseases at different distances from unplanned waste sites in the Islamabad–Rawalpindi metropolitan area, Pakistan, 2021. (a) Describe the relationship between diseases and distance from unplanned waste sites shown in Fig. 4.1. [4] (b) Explain two factors which lead to the degradation of rural environments. [6]
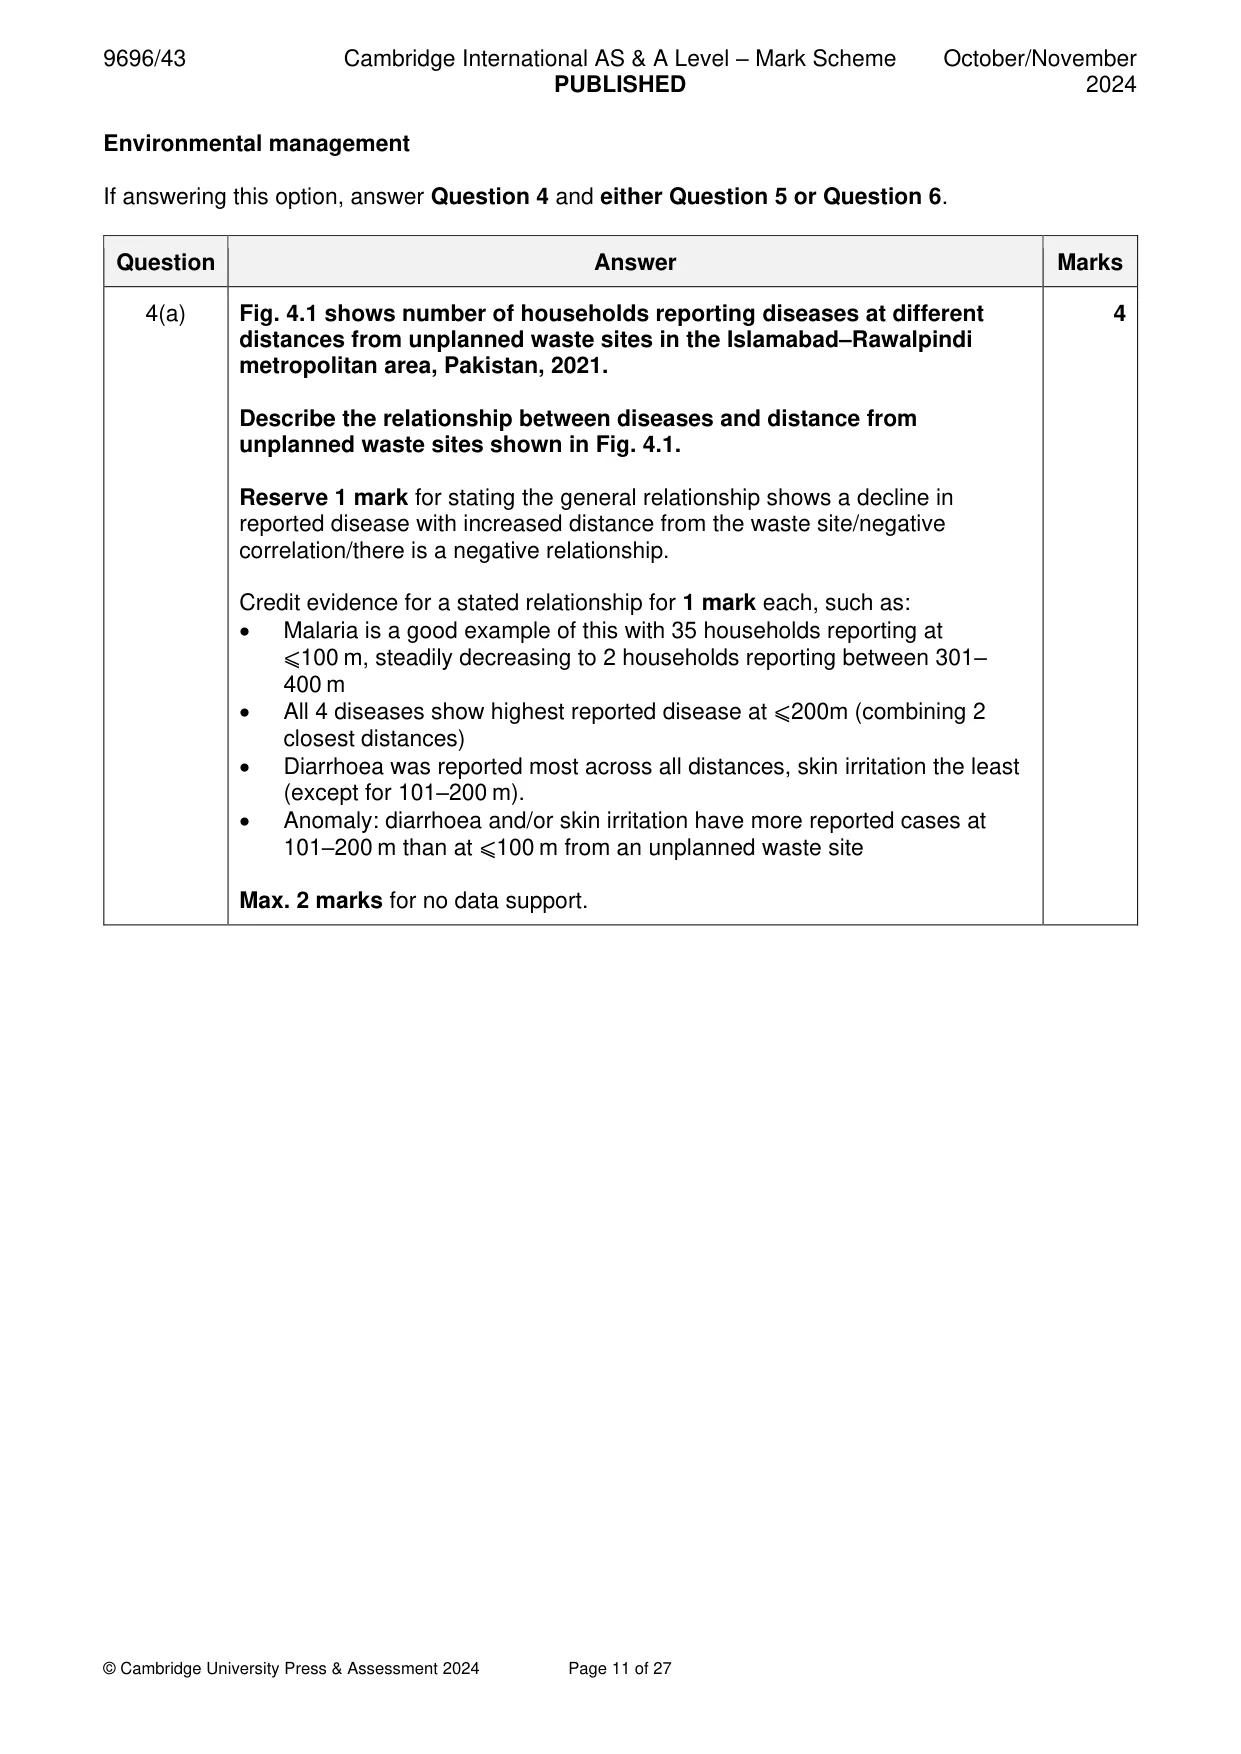
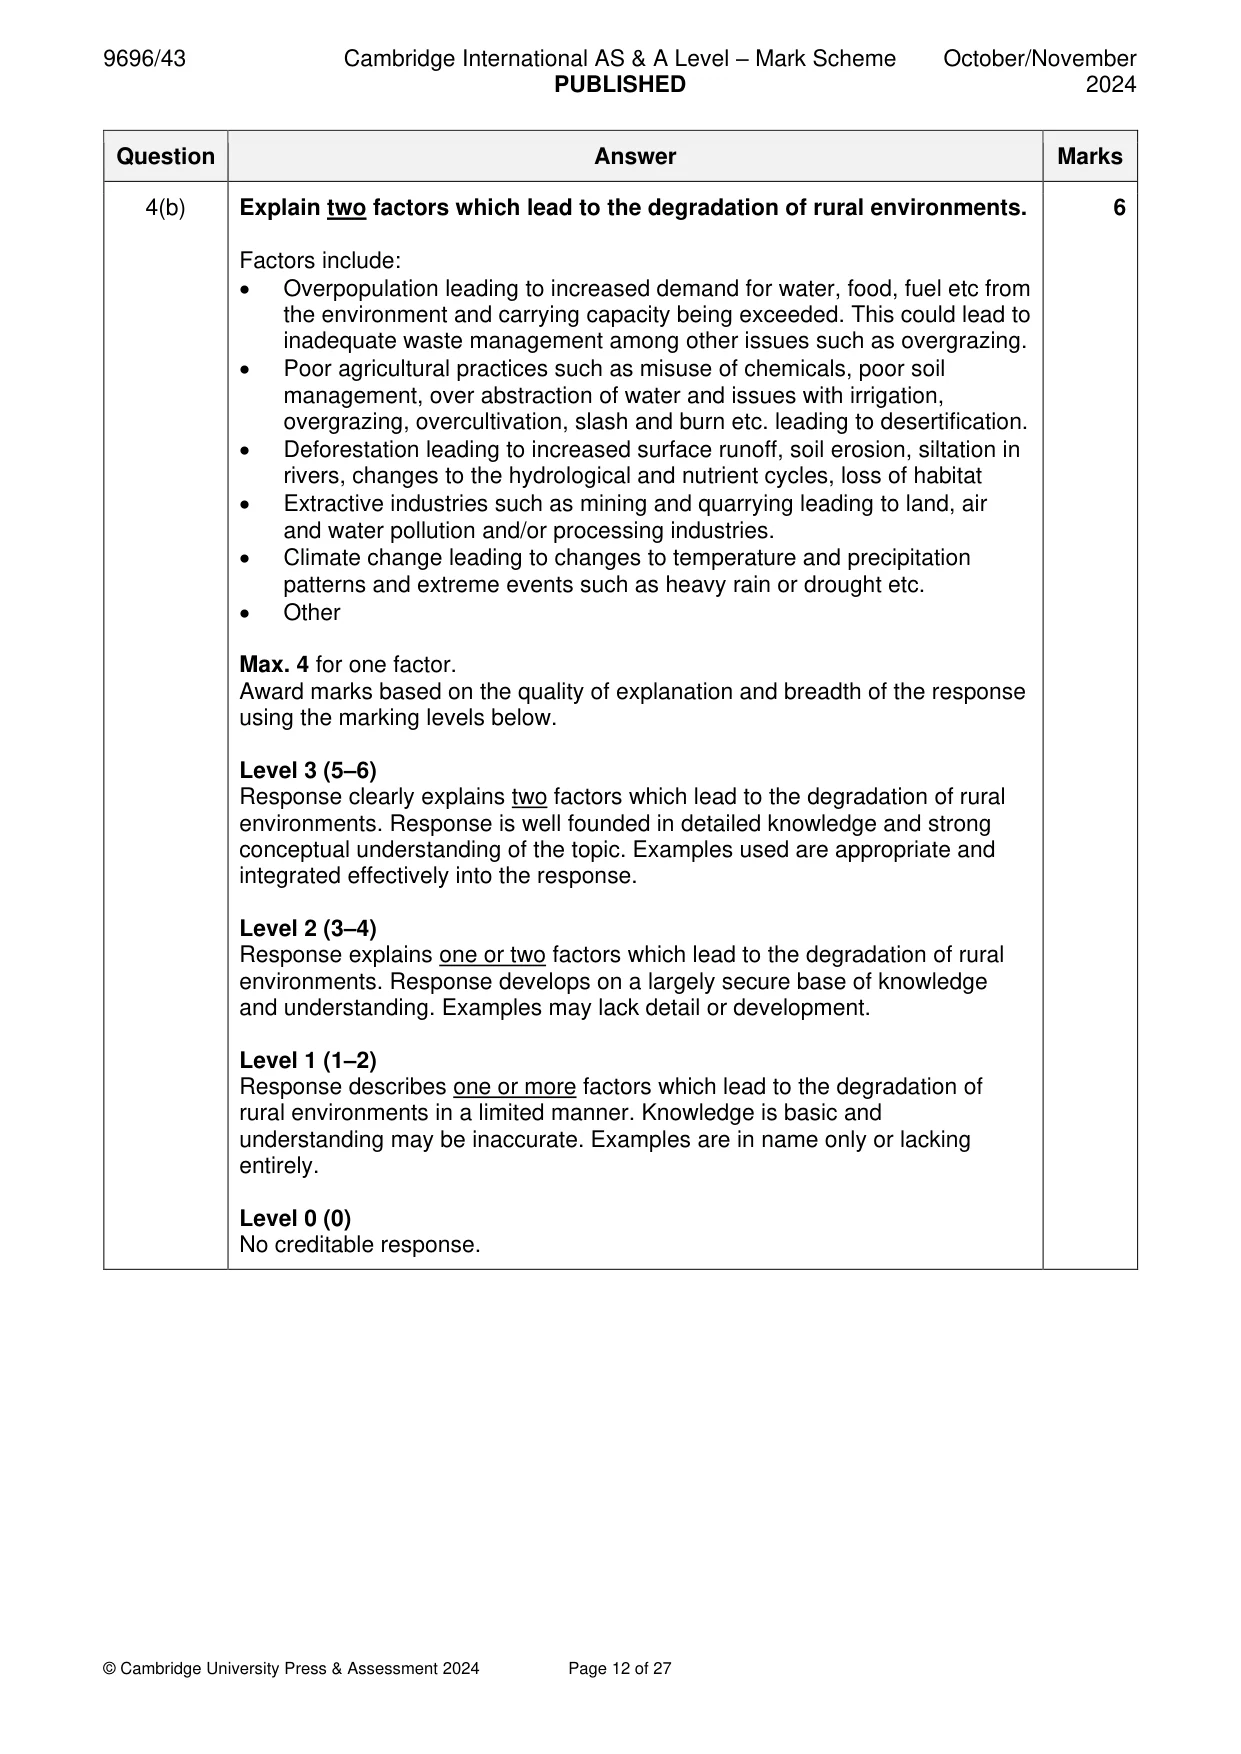
Mark scheme: 4(a) Fig. 4.1 shows number of households reporting diseases at different 4 distances from unplanned waste sites in the Islamabad–Rawalpindi metropolitan area, Pakistan, 2021. Describe the relationship between diseases and distance from unplanned waste sites shown in Fig. 4.1. Reserve 1 mark for stating the general relationship shows a decline in reported disease with increased distance from the waste site/negative correlation/there is a negative relationship. Credit evidence for a stated relationship for 1 mark each, such as: • Malaria is a good example of this with 35 households reporting at ⩽100 m, steadily decreasing to 2 households reporting between 301– 400 m • All 4 diseases show highest reported disease at ⩽200m (combining 2 closest distances) • Diarrhoea was reported most across all distances, skin irritation the least (except for 101–200 m). • Anomaly: diarrhoea and/or skin irritation have more reported cases at 101–200 m than at ⩽100 m from an unplanned waste site Max. 2 marks for no data support. 4(b) Explain two factors which lead to the degradation of rural environments. 6 Factors include: • Overpopulation leading to increased demand for water, food, fuel etc from the environment and carrying capacity being exceeded. This could lead to inadequate waste management among other issues such as overgrazing. • Poor agricultural practices such as misuse of chemicals, poor soil management, over abstraction of water and issues with irrigation, overgrazing, overcultivation, slash and burn etc. leading to desertification. • Deforestation leading to increased surface runoff, soil erosion, siltation in rivers, changes to the hydrological and nutrient cycles, loss of habitat • Extractive industries such as mining and quarrying leading to land, air and water pollution and/or processing industries. • Climate change leading to changes to temperature and precipitation patterns and extreme events such as heavy rain or drought etc. • Other Max. 4 for one factor. Award marks based on the quality of explanation and breadth of the response using the marking levels below. Level 3 (5–6) Response clearly explains two factors which lead to the degradation of rural environments. Response is well founded in detailed knowledge and strong conceptual understanding of the topic. Examples used are appropriate and integrated effectively into the response. Level 2 (3–4) Response explains one or two factors which lead to the degradation of rural environments. Response develops on a largely secure base of knowledge and understanding. Examples may lack detail or development. Level 1 (1–2) Response describes one or more factors which lead to the degradation of rural environments in a limited manner. Knowledge is basic and understanding may be inaccurate. Examples are in name only or lacking entirely. Level 0 (0) No creditable response.
Q5 · Evaluate the success of one named located scheme to produce electricity in overcoming…
5 Evaluate the success of one named located scheme to produce electricity in overcoming issues of changes in demand and supply. [20]
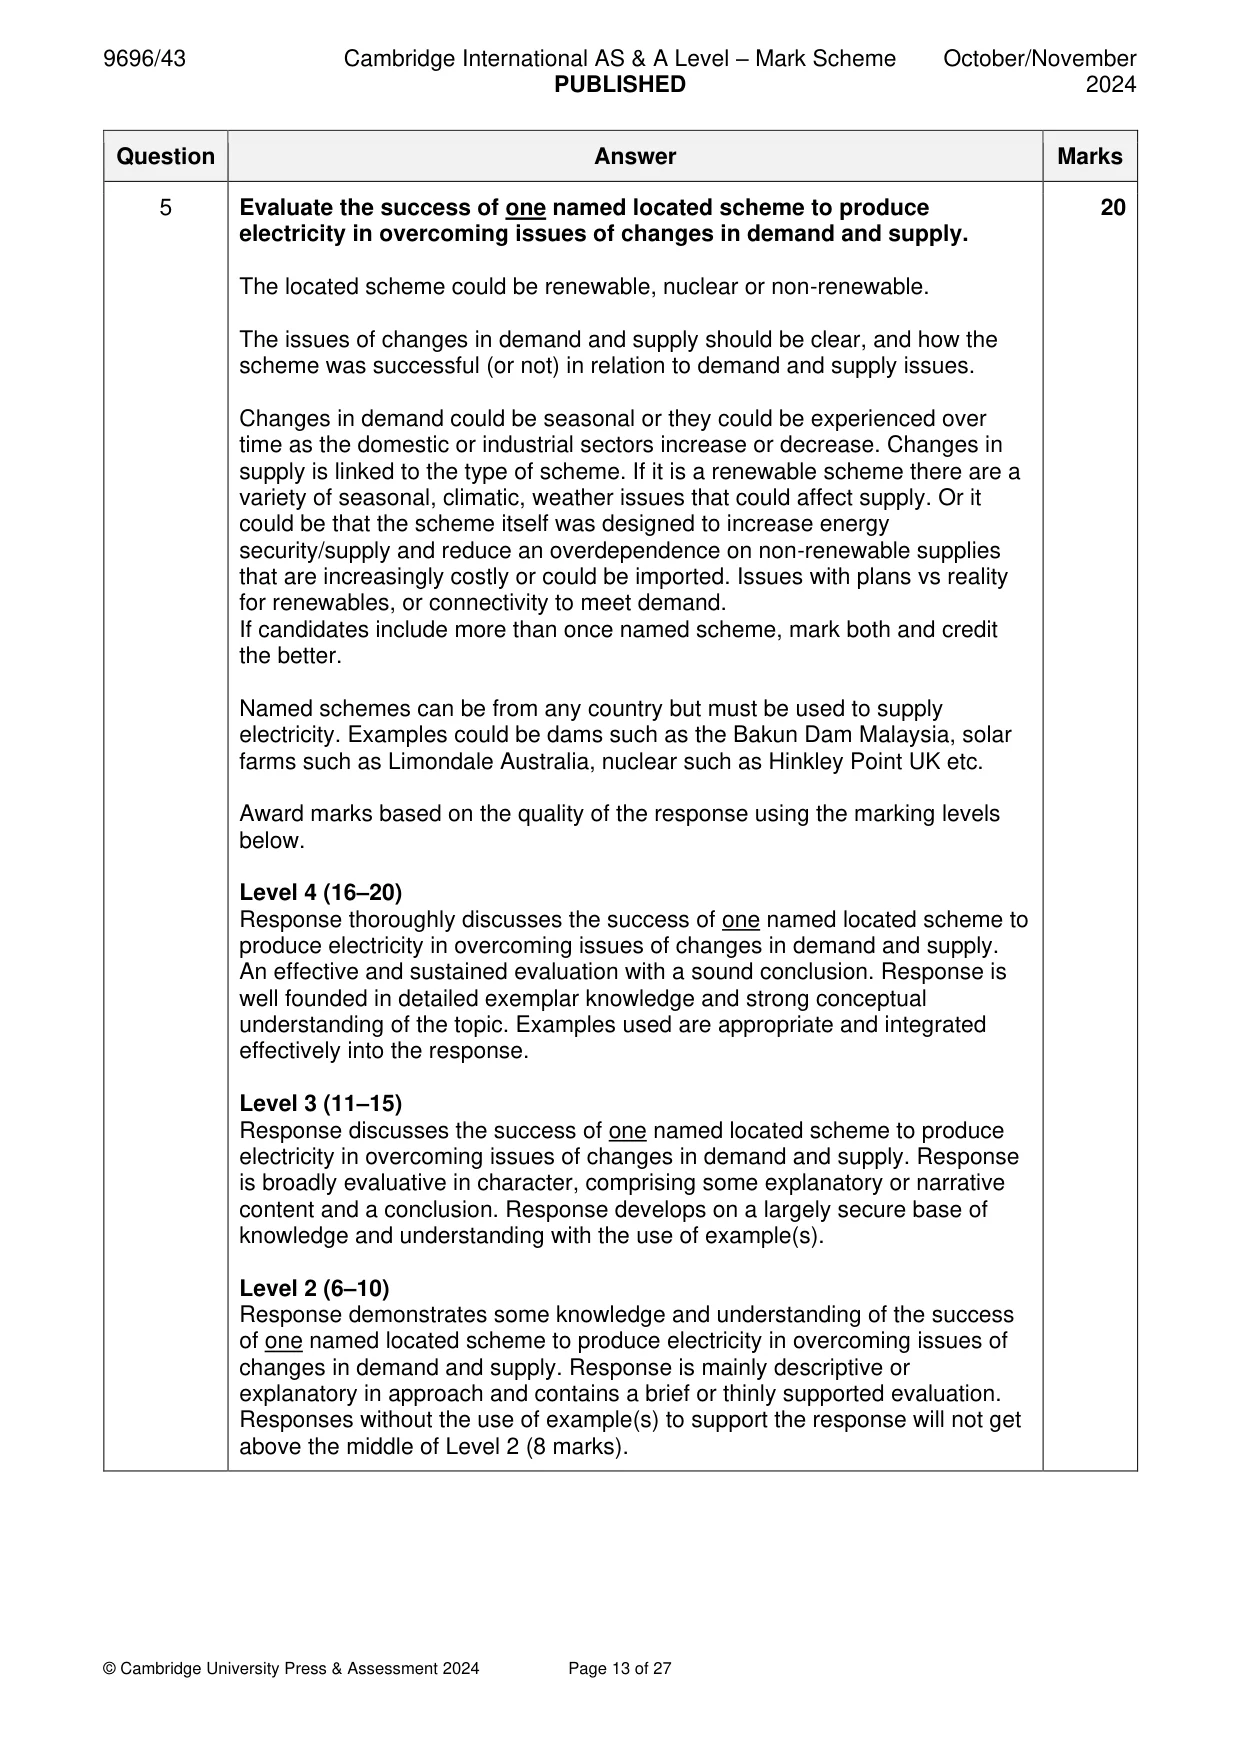
Mark scheme: 5 Evaluate the success of one named located scheme to produce 20 electricity in overcoming issues of changes in demand and supply. The located scheme could be renewable, nuclear or non-renewable. The issues of changes in demand and supply should be clear, and how the scheme was successful (or not) in relation to demand and supply issues. Changes in demand could be seasonal or they could be experienced over time as the domestic or industrial sectors increase or decrease. Changes in supply is linked to the type of scheme. If it is a renewable scheme there are a variety of seasonal, climatic, weather issues that could affect supply. Or it could be that the scheme itself was designed to increase energy security/supply and reduce an overdependence on non-renewable supplies that are increasingly costly or could be imported. Issues with plans vs reality for renewables, or connectivity to meet demand. If candidates include more than once named scheme, mark both and credit the better. Named schemes can be from any country but must be used to supply electricity. Examples could be dams such as the Bakun Dam Malaysia, solar farms such as Limondale Australia, nuclear such as Hinkley Point UK etc. Award marks based on the quality of the response using the marking levels below. Level 4 (16–20) Response thoroughly discusses the success of one named located scheme to produce electricity in overcoming issues of changes in demand and supply. An effective and sustained evaluation with a sound conclusion. Response is well founded in detailed exemplar knowledge and strong conceptual understanding of the topic. Examples used are appropriate and integrated effectively into the response. Level 3 (11–15) Response discusses the success of one named located scheme to produce electricity in overcoming issues of changes in demand and supply. Response is broadly evaluative in character, comprising some explanatory or narrative content and a conclusion. Response develops on a largely secure base of knowledge and understanding with the use of example(s). Level 2 (6–10) Response demonstrates some knowledge and understanding of the success of one named located scheme to produce electricity in overcoming issues of changes in demand and supply. Response is mainly descriptive or explanatory in approach and contains a brief or thinly supported evaluation. Responses without the use of example(s) to support the response will not get above the middle of Level 2 (8 marks). 5 Level 1 (1–5) Response makes a few general points about the success of one named located scheme to produce electricity and/or overcoming issues of changes in demand and supply. A descriptive response comprising a few simple points. Knowledge is basic and understanding may be poor and lack relevance to the question set. Level 0 (0) No creditable response.
Q6 · ‘There are always solutions to the problems faced in attempts to improve degraded…
6 ‘There are always solutions to the problems faced in attempts to improve degraded environments.’ With reference to one or more examples, how far do you agree with this statement? [20] Global interdependence If answering this option, answer Question 7 and either Question 8 or Question 9.
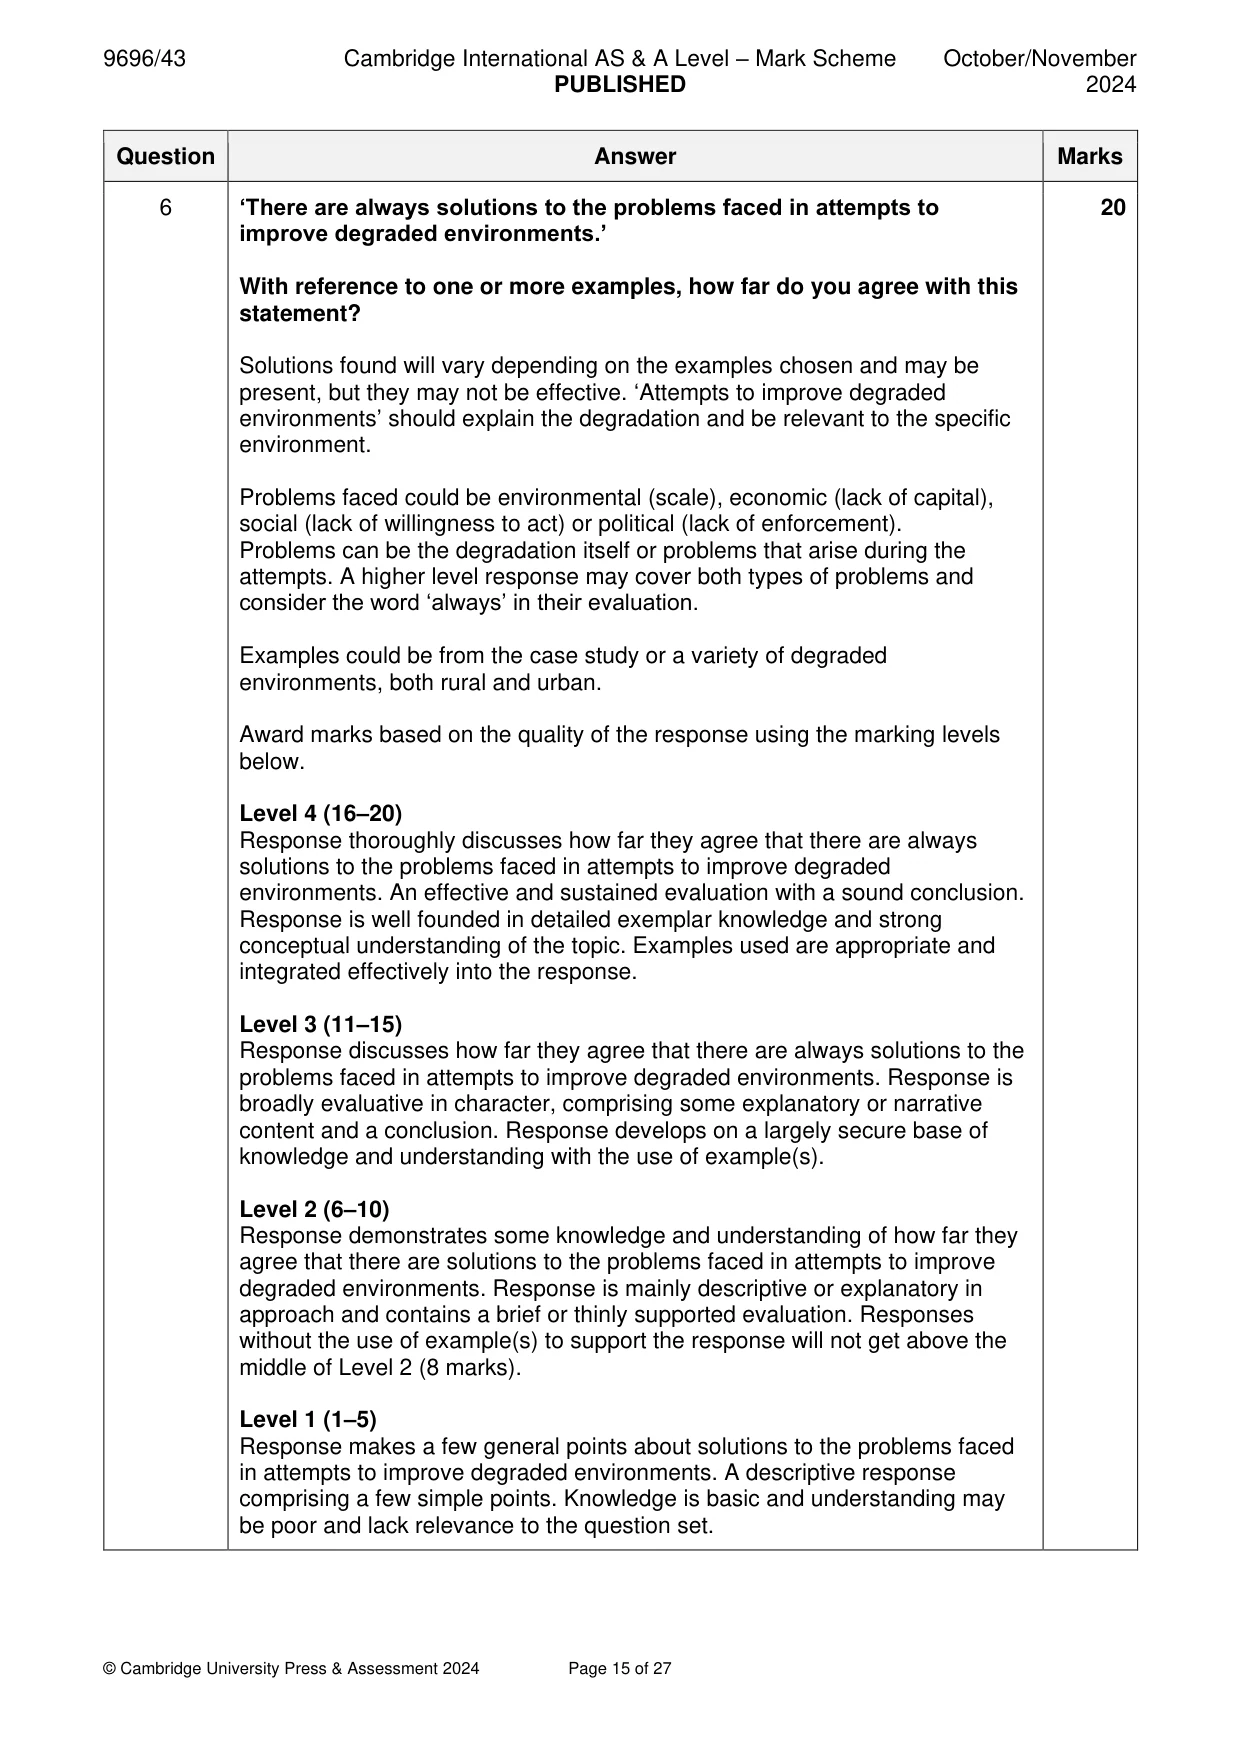
Mark scheme: 6 ‘There are always solutions to the problems faced in attempts to 20 improve degraded environments.’ With reference to one or more examples, how far do you agree with this statement? Solutions found will vary depending on the examples chosen and may be present, but they may not be effective. ‘Attempts to improve degraded environments’ should explain the degradation and be relevant to the specific environment. Problems faced could be environmental (scale), economic (lack of capital), social (lack of willingness to act) or political (lack of enforcement). Problems can be the degradation itself or problems that arise during the attempts. A higher level response may cover both types of problems and consider the word ‘always’ in their evaluation. Examples could be from the case study or a variety of degraded environments, both rural and urban. Award marks based on the quality of the response using the marking levels below. Level 4 (16–20) Response thoroughly discusses how far they agree that there are always solutions to the problems faced in attempts to improve degraded environments. An effective and sustained evaluation with a sound conclusion. Response is well founded in detailed exemplar knowledge and strong conceptual understanding of the topic. Examples used are appropriate and integrated effectively into the response. Level 3 (11–15) Response discusses how far they agree that there are always solutions to the problems faced in attempts to improve degraded environments. Response is broadly evaluative in character, comprising some explanatory or narrative content and a conclusion. Response develops on a largely secure base of knowledge and understanding with the use of example(s). Level 2 (6–10) Response demonstrates some knowledge and understanding of how far they agree that there are solutions to the problems faced in attempts to improve degraded environments. Response is mainly descriptive or explanatory in approach and contains a brief or thinly supported evaluation. Responses without the use of example(s) to support the response will not get above the middle of Level 2 (8 marks). Level 1 (1–5) Response makes a few general points about solutions to the problems faced in attempts to improve degraded environments. A descriptive response comprising a few simple points. Knowledge is basic and understanding may be poor and lack relevance to the question set. 6 Level 0 (0) No creditable response. Global interdependence If answering this option, answer Question 7 and either Question 8 or Question 9.
Q7 · Embassies and consulates in Africa, by sending country, 2016
7 Fig. 7.1 shows embassies and consulates in Africa, by sending country, 2016. Fig. 7.2 shows the countries of Africa. (a) Describe the distribution of embassies/consulates which opened since 2013 shown in Fig. 7.1. [4] (b) Explain how two changes in the global market have affected global trade. [6]
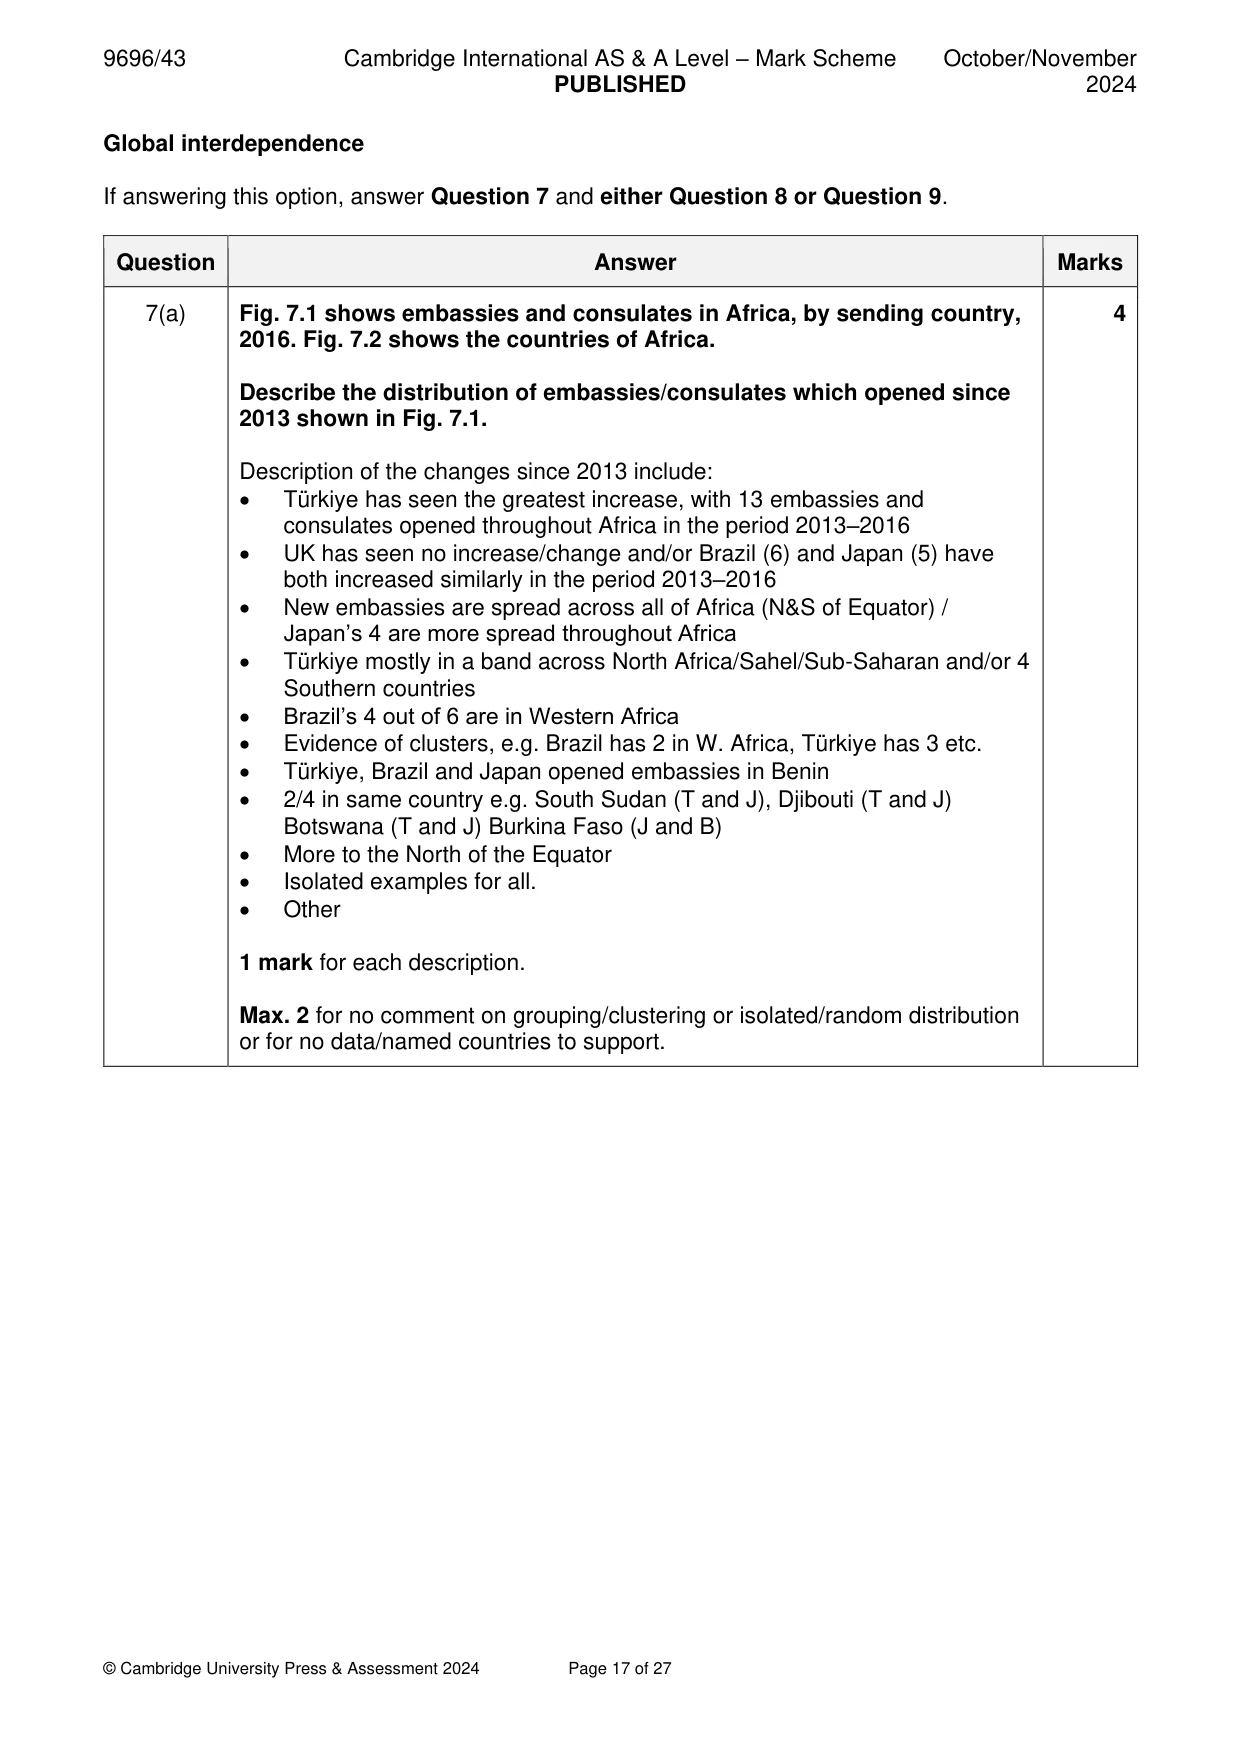
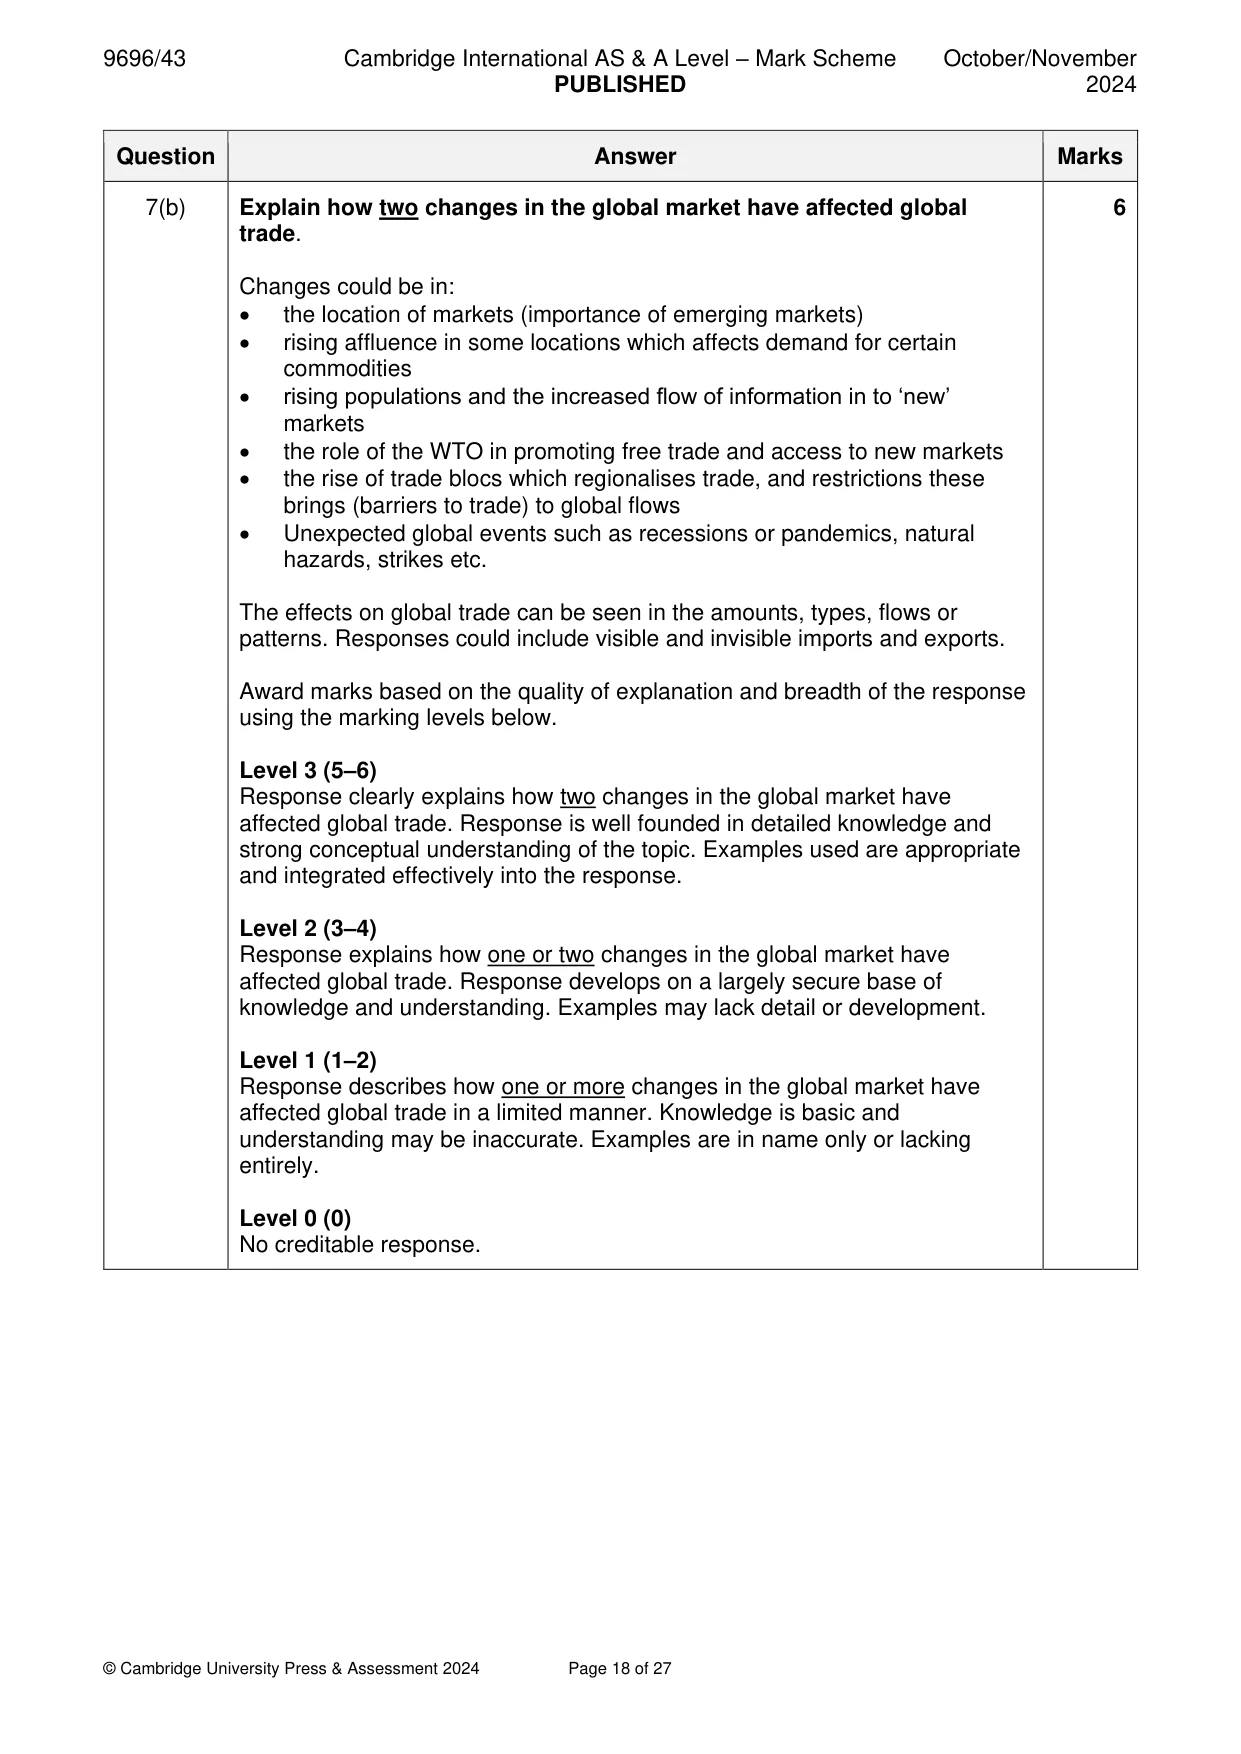
Mark scheme: 7(a) Fig. 7.1 shows embassies and consulates in Africa, by sending country, 4 2016. Fig. 7.2 shows the countries of Africa. Describe the distribution of embassies/consulates which opened since 2013 shown in Fig. 7.1. Description of the changes since 2013 include: • Türkiye has seen the greatest increase, with 13 embassies and consulates opened throughout Africa in the period 2013–2016 • UK has seen no increase/change and/or Brazil (6) and Japan (5) have both increased similarly in the period 2013–2016 • New embassies are spread across all of Africa (N&S of Equator) / Japan’s 4 are more spread throughout Africa • Türkiye mostly in a band across North Africa/Sahel/Sub-Saharan and/or 4 Southern countries • Brazil’s 4 out of 6 are in Western Africa • Evidence of clusters, e.g. Brazil has 2 in W. Africa, Türkiye has 3 etc. • Türkiye, Brazil and Japan opened embassies in Benin • 2/4 in same country e.g. South Sudan (T and J), Djibouti (T and J) Botswana (T and J) Burkina Faso (J and B) • More to the North of the Equator • Isolated examples for all. • Other 1 mark for each description. Max. 2 for no comment on grouping/clustering or isolated/random distribution or for no data/named countries to support. 7(b) Explain how two changes in the global market have affected global 6 trade. Changes could be in: • the location of markets (importance of emerging markets) • rising affluence in some locations which affects demand for certain commodities • rising populations and the increased flow of information in to ‘new’ markets • the role of the WTO in promoting free trade and access to new markets • the rise of trade blocs which regionalises trade, and restrictions these brings (barriers to trade) to global flows • Unexpected global events such as recessions or pandemics, natural hazards, strikes etc. The effects on global trade can be seen in the amounts, types, flows or patterns. Responses could include visible and invisible imports and exports. Award marks based on the quality of explanation and breadth of the response using the marking levels below. Level 3 (5–6) Response clearly explains how two changes in the global market have affected global trade. Response is well founded in detailed knowledge and strong conceptual understanding of the topic. Examples used are appropriate and integrated effectively into the response. Level 2 (3–4) Response explains how one or two changes in the global market have affected global trade. Response develops on a largely secure base of knowledge and understanding. Examples may lack detail or development. Level 1 (1–2) Response describes how one or more changes in the global market have affected global trade in a limited manner. Knowledge is basic and understanding may be inaccurate. Examples are in name only or lacking entirely. Level 0 (0) No creditable response.
Q8 · How far do you agree that the impacts of trade are positive for both exporting and…
8 How far do you agree that the impacts of trade are positive for both exporting and importing countries? [20]
Mark scheme: 8 How far do you agree that the impacts of trade are positive for both 20 exporting and importing countries? Impacts can be varied, such as social, economic, political, environmental. Positive impacts of trade for exporting countries may include: • It is cheaper, faster and more diverse than ever before • Increases GDP of country • Increases revenue for country • Allows country to reinvest this money in infrastructure within country • Provides employment for population which in turn allows population to have greater spending capacity and standard of living • Leads to a better balance of payments for country. Positive impacts of trade for importing countries may include: • Allows countries to import products it cannot grow or extract • Allows for greater range of goods potentially at lower cost for customers • Allows for industries to develop using imported raw materials that otherwise would not develop, therefore providing jobs, etc. • Allows for transport to occur within country as many rely on imports of oil, for petrol, diesel. Candidates should be able to critically evaluate the impacts and come to a conclusion as to whether they have been positive or negative overall. It is likely that candidates will consider the relative value of the goods being exported or imported and the impacts on domestic production, jobs and wages, and how overall balance of trade determines economic development. Award marks based on the quality of the response using the marking levels below. Level 4 (16–20) Response thoroughly discusses how far they agree that the impacts of trade are positive for both exporting and importing countries. An effective and sustained evaluation with a sound conclusion. Response is well founded in detailed exemplar knowledge and strong conceptual understanding of the topic. Examples used are appropriate and integrated effectively into the response. Level 3 (11–15) Response discusses how far they agree that the impacts of trade are positive for both exporting and importing countries. Response is broadly evaluative in character, comprising some explanatory or narrative content and a conclusion. Response develops on a largely secure base of knowledge and understanding with the use of example(s). Level 2 (6–10) Response demonstrates some knowledge and understanding of how far they agree that the impacts of trade are positive for both exporting and importing countries. Response is mainly descriptive or explanatory in approach and contains a brief or thinly supported evaluation. Responses without the use of example(s) to support the response will not get above the middle of Level 2 (8 marks). 8 Level 1 (1–5) Response makes a few general points about the impacts of trade for exporting and importing countries. A descriptive response comprising a few simple points. Knowledge is basic and understanding may be poor and lack relevance to the question set. Level 0 (0) No creditable response.
Q9 · To what extent does the carrying capacity of a tourist destination(s) limit the tourism…
9 To what extent does the carrying capacity of a tourist destination(s) limit the tourism multiplier effect? [20] Economic transition If answering this option, answer Question 10 and either Question 11 or Question 12.
Mark scheme: 9 To what extent does the carrying capacity of a tourist destination(s) limit 20 the tourism multiplier effect? Carrying capacity is the concept of a maximum number of visitors who can visit at the same time, without causing degradation to the physical, economic and socio-cultural environment. The quality of the experience for the tourist should also remain positive. The tourism multiplier effect is the circulation of tourism revenue in an economy e.g. spending on goods and services by tourists, investment from TNCs, government spending on improvements in infrastructure. Any sector of an economy can benefit from tourism. Candidates may argue that there is an optimum number of tourists which can be carefully managed but, if exceeded, there can then be a negative multiplier effect as tourists go elsewhere. Candidates may consider sustainable tourism, where carrying capacity is limited, and reference the impact this has on the multiplier effect. Use of the life-cycle model of tourism would be appropriate here. It is expected that examples of tourist destinations should be used throughout, or one destination used in detail. Assessment may involve discussing the limiting effects of other factors such as unexpected events on the tourism multiplier effect. Award marks based on the quality of the response using the marking levels below. Level 4 (16–20) Response thoroughly discusses to what extent the carrying capacity of a tourist destination(s) limits the tourism multiplier effect. An effective and sustained evaluation with a sound conclusion. Response is well founded in detailed exemplar knowledge and strong conceptual understanding of the topic. Examples used are appropriate and integrated effectively into the response. Level 3 (11–15) Response discusses to what extent the carrying capacity of a tourist destination(s) limits the tourism multiplier effect. Response is broadly evaluative in character, comprising some explanatory or narrative content and a conclusion. Response develops on a largely secure base of knowledge and understanding with the use of example(s). Level 2 (6–10) Response demonstrates some knowledge and understanding of to what extent the carrying capacity of a tourist destination(s) limits the tourism multiplier effect. Response is mainly descriptive or explanatory in approach and contains a brief or thinly supported evaluation. Responses without the use of example(s) to support the response will not get above the middle of Level 2 (8 marks). 9 Level 1 (1–5) Response makes a few general points about the carrying capacity of a tourist destination(s) and/or limits to the tourism multiplier effect. A descriptive response comprising a few simple points. Knowledge is basic and understanding may be poor and lack relevance to the question set. Level 0 (0) No creditable response. Economic transition If answering this option, answer Question 10 and either Question 11 or Question 12.
Q10 · Foreign Direct Investment (FDI) inflows to Thailand, an MIC in Asia, in 2017
10 Fig. 10.1 shows Foreign Direct Investment (FDI) inflows to Thailand, an MIC in Asia, in 2017. (a) Describe the FDI inflows to Thailand shown in Fig. 10.1. [4] (b) Explain two reasons for the New International Division of Labour (NIDL). [6]
Mark scheme: 10(a) Fig. 10.1 shows Foreign Direct Investment (FDI) inflows to Thailand, an 4 MIC in Asia, in 2017. Describe the FDI inflows to Thailand shown in Fig. 10.1. Description of FDI inflows include: • Overall, Asian countries shown account for the most (Japan, China, ASEAN total = 62%) • Japan invests more than twice (nearly 3x) more (41%) than the next largest, (USA at 14%) • USA and Canada (North America) contribute a significant amount (20%) / USA and China contribute half of that of the biggest contributor Japan • 15% from ‘Other’ countries is a significant contribution/2nd largest • For ASEAN states the vast majority)/significant/more than ¾ is from Singapore • 97% of contribution from ASEAN is from only two countries (Singapore and Malaysia) out of the 10 member states • Singapore is 78% of 9% making 7% of total • Germany is the only European country named/smallest named contribution but others could be within ‘Other’ category. 1 mark for each description. Max. 2 for highest and lowest or ranking with data for both pie charts Max. 2 for no data support. 10(b) Explain two reasons for the New International Division of Labour (NIDL). 6 Reasons could include: • Political –Open Door Policies/deregulation, incentives to attract FDI (e.g. investing in infrastructure), SEZs, prioritising education, etc. • Technology – growth of containerisation, improvements in air freight, improvements in ICT meaning manufacturing can be more easily controlled/monitored from HQ in other countries • Socio-economic – cheaper labour, appropriate skill level, cheaper overhead costs, location of emerging markets/saving transport costs, etc. • Environmental – resource exhaustion/new frontiers, pollution laws, etc. Reasons could be the negatives of operating in traditional locations i.e. political, environmental, social and economic changes in HICs. Award marks based on the quality of explanation and breadth of the response using the marking levels below. Level 3 (5–6) Response clearly explains two reasons for the New International Division of Labour (NIDL). Response is well founded in detailed knowledge and strong conceptual understanding of the topic. Examples used are appropriate and integrated effectively into the response. Level 2 (3–4) Response explains one or two reasons for the New International Division of Labour (NIDL). Response develops on a largely secure base of knowledge and understanding. Examples may lack detail or development. Level 1 (1–2) Response describes one or more reasons for the New International Division of Labour (NIDL) in a limited manner. Knowledge is basic and understanding may be inaccurate. Examples are in name only or lacking entirely. Level 0 (0) No creditable response.
Q11 · Evaluate the impacts caused by changes in the global spatial organisation and operation…
11 Evaluate the impacts caused by changes in the global spatial organisation and operation of transnational corporations (TNCs). [20]
Mark scheme: 11 Evaluate the impacts caused by changes in the global spatial 20 organisation and operation of transnational corporations (TNCs). This could be outsourcing of manufacturing or offshoring of services and can be for any country involved in the supply chain of any TNC. Therefore, the impacts could be negative or positive, depending on the TNCs chosen or the location. Impacts could be social, economic, political, or environmental. Impacts for HICs (for example economies of scale or unemployment etc.) and MICs or LICs (for example upskilling of workers, increased disposable income for their workforce or environmental degradation) and NICs (impact on emergence on growth) and evaluating the relative impacts for these different locations may be an indication of a higher-level response. Candidates may also consider the impact on the TNC – increased profit, negative company image due to poor working conditions, etc. Award marks based on the quality of the response using the marking levels below. Level 4 (16–20) Response thoroughly discusses the impacts caused by changes in the global spatial organisation and operation of transnational corporations (TNCs). An effective and sustained evaluation with a sound conclusion. Response is well founded in detailed exemplar knowledge and strong conceptual understanding of the topic. Examples used are appropriate and integrated effectively into the response. Level 3 (11–15) Response discusses the impacts caused by changes in the global spatial organisation and operation of transnational corporations (TNCs). Response is broadly evaluative in character, comprising some explanatory or narrative content and a conclusion. Response develops on a largely secure base of knowledge and understanding with the use of example(s). Level 2 (6–10) Response demonstrates some knowledge and understanding of the impacts caused by changes in the global spatial organisation and operation of transnational corporations (TNCs). Response is mainly descriptive or explanatory in approach and contains a brief or thinly supported evaluation. Responses without the use of example(s) to support the response will not get above the middle of Level 2 (8 marks). Level 1 (1–5) Response makes a few general points about the impacts of transnational corporations (TNCs). A descriptive response comprising a few simple points. Knowledge is basic and understanding may be poor and lack relevance to the question set. Level 0 (0) No creditable response.
Q12 · ‘Regional disparities in social and economic development are both difficult to overcome.’…
12 ‘Regional disparities in social and economic development are both difficult to overcome.’ With reference to one or more examples, how far do you agree with this statement? [20]
Mark scheme: 12 ‘Regional disparities in social and economic development are both 20 difficult to overcome.’ With reference to one or more examples, how far do you agree with this statement? Candidates should discuss how far they agree with the statement. Often both go hand in hand but depending on how the disparity is being solved one may improve before the other. If there is a focus on education and health, then social disparities may improve before much improvement in economic disparity is seen, although an injection of money is needed for this to occur. Improvements in employability can lead to further disparity as young people leave for the core region to find better paying jobs (brain drain). Candidates may consider the reasons these disparities exist in the first place (a lack of initial advantages in an area) and the challenge this poses. Candidates may consider the difficulties that were faced in their case study and focus on general difficulties if they address the ‘both’ aspect of this question. Candidates may approach this question from a theoretical standpoint referring to core-periphery, spread and backwash, and cumulative causation. Award marks based on the quality of the response using the marking levels below. Level 4 (16–20) Response thoroughly discusses how far they agree that regional disparities in social and economic development are both difficult to overcome. An effective and sustained evaluation with a sound conclusion. Response is well founded in detailed exemplar knowledge and strong conceptual understanding of the topic. Examples used are appropriate and integrated effectively into the response. Level 3 (11–15) Response discusses how far they agree that regional disparities in social and economic development are both difficult to overcome. Response is broadly evaluative in character, comprising some explanatory or narrative content and a conclusion. Response develops on a largely secure base of knowledge and understanding with the use of example(s). Level 2 (6–10) Response demonstrates some knowledge and understanding of how far they agree that regional disparities in social and economic development are both difficult to overcome. Response is mainly descriptive or explanatory in approach and contains a brief or thinly supported evaluation. Responses without the use of example(s) to support the response will not get above the middle of Level 2 (8 marks). Level 1 (1–5) Response makes a few general points about regional disparities in social and economic development. A descriptive response comprising a few simple points. Knowledge is basic and understanding may be poor and lack relevance to the question set. 12 Level 0 (0) No creditable response.
What was in this paper
The subtopics covered by these 12 questions, and how many questions each got. Open one in a new tab to see every Cambridge question on it.
2Trade flows and trading patterns2Agricultural systems and food production1Environmental degradation1Manufacturing and related service industry1The management of a degraded environment1The management of a tourist destination1The management of agricultural change1The management of energy supply1The management of regional development1What you needed in this session
Cambridge’s own grade thresholds for 2024 Oct/Nov, Paper 4 · Variant 3. A higher threshold means an easier paper — the bar moves with how the cohort did.