Cambridge A Level Geography 9696 — 2023 May/June Paper 4 · Variant 1
9696/41/M/J/23 · 12 questions · 60 marks · ≈68 min
The question paper and its mark scheme, free to read here and free to download. This is Cambridge’s own paper, exactly as it was sat.
Question paper4 pages




Mark scheme27 pages
Answers below. Sit the paper first if you are practising.

























Questions as text
Q1 · A photograph which shows an industrial estate in Thailand, an MIC in Asia
1 Fig. 1.1 is a photograph which shows an industrial estate in Thailand, an MIC in Asia. (a) Describe the main characteristics of the industrial estate shown in Fig. 1.1. [4] (b) Suggest how industrial estates such as that shown in Fig. 1.1 attempt to reduce their impact on the local environment. [6]
Mark scheme: Question Answer Marks 1(a) Fig. 1.1 is a photograph which shows an industrial estate in Thailand, 4 an MIC in Asia. Describe the main characteristics of the industrial estate shown in Fig. 1.1. The main characteristics may be described as: Off a major road system Wide/4 lanes Each unit has own access and parking A large unit in centre of photograph Different to the others (either a power plant or large heavy manufacturing plant) Buildings of variable size but similar shapes Some without windows, some clearly two floors others may have only one very tall level Green space bordering each unit Lighting or power along the roads Flat land Room for further development/expansion/vacant space Separate from urban areas/rural location Reservoir in background Other descriptive points 1 mark for each description using evidence from the photograph. Each characteristic may be developed for 2 marks. Up to 2 marks for each of buildings, infrastructure (transport/roads, power or lighting) and other aspects. For example: rectangular plots (1), variable in size (1). 1(b) Suggest how industrial estates such as that shown in Fig. 1.1 attempt 6 to reduce their impact on the local environment. There may be reference to evidence in the photograph such as the planting of bushes/trees and maintenance of the grass areas. Other points may be more speculative such as: Use of clean energy Appropriate disposal of waste products Creation of a pleasant working environment/green spaces/trees which absorb pollutants Separated from residential area Agglomeration to control pollution Devices on chimneys to trap pollutants Other valid points Maximum marks could be achieved without using Fig. 1.1. Focus of responses should be on ‘local scale’, whilst environment is land, air, water pollution with impacts on people and ‘nature’. Award marks based on the quality of explanation and breadth of the response using the marking levels below. Level 3 (5–6) Response clearly explains how industrial estates such as that shown in Fig. 1.1 attempt to reduce their impact on the local environment. Response is well founded in detailed knowledge and strong conceptual understanding of the topic. Examples used are appropriate and integrated effectively into the response. Level 2 (3–4) Response explains in a more limited way how industrial estates such as that shown in Fig. 1.1 attempt to reduce their impact on the local environment. Response develops on a largely secure base of knowledge and understanding. Examples may lack detail or development. Level 1 (1–2) Response makes one or two points about industrial estates or lacks the context of reducing impact on the local environment. Knowledge is basic and understanding may be inaccurate. Examples are in name only or lacking entirely. Level 0 (0) No creditable response.
Q2 · With reference to one country, assess the extent to which the management of agricultural…
2 With reference to one country, assess the extent to which the management of agricultural change has been successful. [20]
Mark scheme: 2 With reference to one country, assess the extent to which the 20 management of agricultural change has been successful. Candidates are free to develop their own approach to the question and responses will vary depending on the example(s) chosen. Whichever approach is chosen, essays which address the question and support their argument with relevant examples will be credited. The direction of the response and evaluation made will depend on the approach chosen, and any evaluation is therefore valid if argued and based on evidence. Candidates should assess the extent to which the management of agricultural change in one country has been successful. The response should be set in the context of both management and clear agricultural change. Management could be at any scale: local (the farm holding or producer) or national. Assessment of success might refer to aspects such as: increased production, unit output or profitability, increasing food security, diversification, responding to the factors/need for change, such as overcoming difficulties presented by the natural environment (including climate change), economic and/or social factors, reducing or improving environmental impacts, sustainability and any other measure and be at any scale. Award marks based on the quality of the response using the marking levels below. Level 4 (16–20) Response thoroughly discusses with reference to one country, the extent to which the management of agricultural change has been successful. An effective and sustained evaluation with a sound conclusion. Response is well founded in detailed exemplar knowledge and strong conceptual understanding of the topic. Examples used are appropriate and integrated effectively into the response. Level 3 (11–15) Response discusses with reference to one country, the extent to which the management of agricultural change has been successful. Response is broadly evaluative in character, comprising some explanatory or narrative content and a conclusion. Response develops on a largely secure base of knowledge and understanding with the use of example(s). 2 Level 2 (6–10) Response demonstrates some knowledge and understanding of the management of agricultural change in one country with some comment on how successful this has been. Response is mainly descriptive or explanatory in approach and contains a brief or thinly supported evaluation. Responses without the use of example(s) to support the response will not get above the middle of Level 2 (8 marks). Level 1 (1–5) Response makes a few general points about agriculture in one country with little comment about change. A descriptive response comprising a few simple points. Knowledge is basic and understanding may be poor and lack relevance to the question set. Level 0 (0) No creditable response
Q3 · ‘Markets are the most important factor influencing the location of manufacturing and…
3 ‘Markets are the most important factor influencing the location of manufacturing and related service industry.’ With reference to one or more examples, how far do you agree? [20] Environmental management If answering this option, answer Question 4 and either Question 5 or Question 6.
Mark scheme: 3 ‘Markets are the most important factor influencing the location of 20 manufacturing and related service industry.’ With reference to one or more examples, how far do you agree? Candidates are free to develop their own approach to the question and responses will vary depending on the example(s) chosen. Whichever approach is chosen, essays which address the question and support their argument with relevant examples will be credited. The direction of the response and evaluation made will depend on the approach chosen, and any evaluation is therefore valid if argued and based on evidence. Candidates should use at least one example of a manufacturing or related service industry to consider how far they agree that markets are the most important locational factor. Markets may be seen as important in terms of size, consumer wealth, preference and changes, transport cost, nature of the products and other market factors. Better responses may well consider the complexity of factors with examples such as political factors influencing market access and improvements through free trade and trade blocs, quotas and tariff reduction or imposition. There should be an emphasis on markets, but other locational factors could be assessed e.g. land, labour, capital, materials, technology, economies and diseconomies of scale, inertia, transport and government policies. At least one other factor should be considered. A response could develop by considering different types of industry. Award marks based on the quality of the response using the marking levels below. Level 4 (16–20) Response thoroughly discusses how far markets are the most important factor influencing the location of manufacturing and related service industry. An effective and sustained evaluation with a sound conclusion. Response is well founded in detailed exemplar knowledge and strong conceptual understanding of the topic. Examples used are appropriate and integrated effectively into the response. Level 3 (11–15) Response discusses how far markets are the most important factor influencing the location of manufacturing and related service industry. Response is broadly evaluative in character, comprising some explanatory or narrative content and a conclusion. Response develops on a largely secure base of knowledge and understanding with the use of example(s). 3 Level 2 (6–10) Response demonstrates some knowledge and understanding of how markets are the most important factor influencing the location of manufacturing and related service industry. Response is mainly descriptive or explanatory in approach and contains a brief or thinly supported evaluation. Responses without the use of example(s) to support the response will not get above the middle of Level 2 (8 marks). Level 1 (1–5) Response makes a few general points about factors influencing the location of manufacturing and related service industry. A descriptive response comprising a few simple points. Knowledge is basic and understanding may be poor and lack relevance to the question set. Level 0 (0) No creditable response. Environmental management If answering this option, answer Question 4 and either Question 5 or Question 6.
Q4 · The types of energy resources used for electricity generation in selected countries in…
4 Fig. 4.1 shows the types of energy resources used for electricity generation in selected countries in 2017. (a) Describe the variations in the types of energy resources used for electricity generation for the countries shown in Fig. 4.1. [4] (b) Suggest two reasons why the use of hydroelectric power (HEP) varies between countries. [6]
Mark scheme: 4(a) Fig. 4.1 shows the types of energy resources used for electricity 4 generation in selected countries in 2017. Describe the variations in the types of energy resources used for electricity generation for the countries shown in Fig. 4.1. Credit may be awarded as simple points for 1 mark and allow the development of one point for a second mark. Candidates might make one developed point for 2 marks and two other points or four simple points for 4 marks. Fossil fuels are the most common fuel (1) 58% or more in 13/15 countries/Brazil and Canada are anomalies with much lower fossil fuels/ less than 30% (28% and 20%)/Saudi Arabia the highest, Canada the lowest/solar the least (1) HEP or nuclear are the largest alternatives to fossil fuels (1) but not found everywhere (14 use HEP (Saudi Arabia the exception) 11 use nuclear (Saudi Arabia, Indonesia, Australia and Turkey the exceptions) (1) Wind and solar are the smallest contributors (1) but are contributors everywhere (1) Some countries have a high proportion of both HEP and nuclear e.g. Canada (1) Comment on order of alternatives to fossil fuels including reference to wind and solar (1) Amount of renewable energy is inversely proportional to the amount of fossil fuels (1) Other valid points. Allow only 1 mark for highest/lowest approach for each type of energy resource/country. For maximum marks, there must be some use of percentage data and named countries. 4(b) Suggest two reasons why the use of hydroelectric power (HEP) varies 6 between countries. Reasons may include: Climate characteristics which encourage/preclude the use of HEP Physical factors which encourage/discourage construction Capital issues Variations in demand Population distribution versus suitable sites Infrastructure issues Other valid reasons If only one reason is offered but is very well explained award up to 4 marks. Level 3 requires some reference to ‘varies between countries’. Award marks based on the quality of explanation and breadth of the response using the marking levels below. Level 3 (5–6) Response clearly explains two reasons why the use of HEP may vary between countries. Response is well founded in detailed knowledge and strong conceptual understanding of the topic. Examples used are appropriate and integrated effectively into the response. Level 2 (3–4) Response explains two reasons why the use of HEP may vary between countries in a more limited way. Response develops on a largely secure base of knowledge and understanding. Examples may lack detail or development. Level 1 (1–2) Response makes one or two points about HEP. Knowledge is basic and understanding may be inaccurate. Examples are in name only or lacking entirely. Level 0 (0) No creditable response.
Q5 · Evaluate the success of one named located scheme to produce electricity
5 Evaluate the success of one named located scheme to produce electricity. [20]
Mark scheme: 5 Evaluate the success of one named located scheme to produce 20 electricity. Candidates are free to develop their own approach to the question and responses will vary depending on the example(s) chosen. Whichever approach is chosen, essays which address the question and support their argument with relevant examples will be credited. The direction of the response and evaluation made will depend on the approach chosen, and any evaluation is therefore valid if argued and based on evidence. Candidates should assess the success of one named located scheme to produce electricity. The response should show knowledge of the location and how this influences the ability to produce electricity. The success or not of the scheme could be expressed in terms of: electrical energy produced, its reliability and flexibility, economic benefits against costs, sustainability (economically and environmentally) and other social and/or environmental factors. Success might also be considered from the viewpoint of different stakeholders. If a candidate considers the overall electrical energy strategy without reference to any named located scheme, max. Level 1. If two or more named located schemes are used, mark both or all and award credit to the best or better. Award marks based on the quality of the response using the marking levels below. Level 4 (16–20) Response thoroughly discusses the success of one named located scheme to produce electricity. An effective and sustained evaluation with a sound conclusion. Response is well founded in detailed exemplar knowledge and strong conceptual understanding of the topic. Examples used are appropriate and integrated effectively into the response. Level 3 (11–15) Response discusses the success of one named located scheme to produce electricity. Response is broadly evaluative in character, comprising some explanatory or narrative content and a conclusion. Response develops on a largely secure base of knowledge and understanding with the use of example(s). Level 2 (6–10) Response demonstrates some knowledge and understanding of the success of one named located scheme to produce electricity. Response is mainly descriptive or explanatory in approach and contains a brief or thinly supported evaluation. Responses without the use of example(s) to support the response will not get above the middle of Level 2 (8 marks). 5 Level 1 (1–5) Response makes a few general points about one named located scheme to produce electricity or refers only to the overall energy strategy of a country. A descriptive response comprising a few simple points. Knowledge is basic and understanding may be poor and lack relevance to the question set. Level 0 (0) No creditable response
Q6 · Global interdependence If answering this option, answer Question 7 and either Question 8…
Global interdependence If answering this option, answer Question 7 and either Question 8 or Question 9.
Mark scheme: 6 How far do you agree that a global view is needed to solve problems of 20 pollution? Candidates are free to develop their own approach to the question and responses will vary depending on the example(s) chosen. Whichever approach is chosen, essays which address the question and support their argument with relevant examples will be credited. The direction of the response and evaluation made will depend on the approach chosen, and any evaluation is therefore valid if argued and based on evidence. Candidates should assess the extent to which they agree that a global view is needed to solve problems of pollution. The question is open to pollution of land, air and/or water and their argument about scale and global view might vary for differing types, sources, causes and the problems arising from pollution. Problems of pollution could be social, economic, environmental or political. Award marks based on the quality of the response using the marking levels below. Level 4 (16–20) Response thoroughly discusses how far they agree that a global view is needed to solve problems of pollution. An effective and sustained evaluation with a sound conclusion. Response is well founded in detailed exemplar knowledge and strong conceptual understanding of the topic. Examples used are appropriate and integrated effectively into the response. Level 3 (11–15) Response discusses how far they agree that a global view is needed to solve problems of pollution. Response is broadly evaluative in character, comprising some explanatory or narrative content and a conclusion. Response develops on a largely secure base of knowledge and understanding with the use of example(s). Level 2 (6–10) Response demonstrates some knowledge and understanding of whether a global view is needed to solve problems of pollution. Response is mainly descriptive or explanatory in approach and contains a brief or thinly supported evaluation. Responses without the use of example(s) to support the response will not get above the middle of Level 2 (8 marks). Level 1 (1–5) Response makes a few general points about the problems of pollution. A descriptive response comprising a few simple points. Knowledge is basic and understanding may be poor and lack relevance to the question set. Level 0 (0) No creditable response. Global interdependence If answering this option, answer Question 7 and either Question 8 or Question 9.
Q7 · Government debt as a percentage of gross domestic product (GDP) of LICs from 1970 to 2018
7 Fig. 7.1 shows government debt as a percentage of gross domestic product (GDP) of LICs from 1970 to 2018. (a) Describe the trends shown in Fig. 7.1. [4] (b) Explain two causes of debt for countries. [6]
Mark scheme: 7(a) Fig. 7.1 shows government debt as a percentage of gross domestic 4 product (GDP) of LICs from 1970 to 2018. Describe the trends shown in Fig. 7.1. 3 marks for identification of the main trends: a rise from 1970 to 1994 (1) and a fall from 1994 to 2012 (1) rises from 2013 to 2017/fluctuates from 2008 to 2018 (1) 1 mark for development of a trend, such as: Uneven rise – continuous increase from 1970 to 1985/but 1985 to 1994 still rises but has 3 years with decline Uneven fall from 1994 to 2012 but has 3 years with a rise or a more rapid decline until 2006 Rapid rise and fall around peak year – 1993 to 1996 Overall, a rise from 1970 level – 13% to 28% in 2018 Slight fall in 2018 Other valid descriptions Step by step description of the trends max. 2. 7(b) Explain two causes of debt for countries. 6 Candidates should explain two causes of debt for countries. The causes are of debt itself not the international debt crisis. They may offer reasons such as those below but could combine these to develop a cause. Causes of debt for countries might include: Government spending exceeds income, so money is borrowed from sources outside the country Interest payments increase debt owed, especially from variable interest agreements Global factors influence interest rates, such as inflation or recession reducing demand or prices of exports Inability of local financial markets to provide finance or to be competitive Borrowing to finance development projects Consequences of taking on historical odious debt War and impact on production leading to borrowing Debt cycle/spiral Other Award up to 4 marks for one cause. Award marks based on the quality of explanation and breadth of the response using the marking levels below. Level 3 (5–6) Response clearly explains two causes of debt for countries. Response is well founded in detailed knowledge and strong conceptual understanding of the topic. Examples used are appropriate and integrated effectively into the response. Level 2 (3–4) Response explains two causes of debt for countries in a more limited way. Response develops on a largely secure base of knowledge and understanding. Examples may lack detail or development. Level 1 (1–2) Response comprises one or two points about debt. Knowledge is basic and understanding may be inaccurate. Examples are in name only or lacking entirely. Level 0 (0) No creditable response.
Q8 · Assess the relative importance of factors affecting global inequalities in trade flows
8 Assess the relative importance of factors affecting global inequalities in trade flows. [20]
Mark scheme: 8 Assess the relative importance of factors affecting global inequalities 20 in trade flows. Candidates are free to develop their own approach to the question and responses will vary depending on the example(s) chosen. Whichever approach is chosen, essays which address the question and support their argument with relevant examples will be credited. The direction of the response and evaluation made will depend on the approach chosen, and any evaluation is therefore valid if argued and based on evidence. Candidates should assess the relative importance of factors affecting global inequalities in trade flows. There should be knowledge of at least two global inequalities in trade flows. Inequalities in global trade might include: Dominance of HICs Majority of trade by HICs is with other HICs LICs have issues such as primary product dependency Exports of HICs consist of more high-tech and mid-tech/ high value products than LICs which are dominated by low-tech products/low value Trade is becoming more regionalised/within trade blocs Dominance of some countries over essential resources and price fixing Inequalities could be linked to volume, value, type of goods Other aspects of inequalities in trade flows A characteristic of a higher-level response (mid-Level 3 upwards) may have discussion of the complexity of factors affecting general and specific inequalities in trade flows and/or comment on how various factors are responsible for differing inequalities. Broadly candidates are likely to comment on the following factors: resource endowment, locational advantage, historical, trade agreements, changes in the global market, free trade and the role of the World Trade Organization. Award marks based on the quality of the response using the marking levels below. Level 4 (16–20) Response thoroughly discusses the relative importance of factors affecting global inequalities in trade flows. An effective and sustained evaluation with a sound conclusion. Response is well founded in detailed exemplar knowledge and strong conceptual understanding of the topic. Examples used are appropriate and integrated effectively into the response. Level 3 (11–15) Response discusses the relative importance of factors affecting global inequalities in trade flows. Response is broadly evaluative in character, comprising some explanatory or narrative content and a conclusion. Response develops on a largely secure base of knowledge and understanding with the use of example(s). 8 Level 2 (6–10) Response demonstrates some knowledge and understanding of factors affecting global trade with limited reference to inequalities in trade flows. Response is mainly descriptive or explanatory in approach and contains a brief or thinly supported evaluation. Responses without the use of example(s) to support the response will not get above the middle of Level 2 (8 marks). Level 1 (1–5) Response makes a few general points about global inequalities in trade flows or factors influencing trade. A descriptive response comprising a few simple points. Knowledge is basic and understanding may be poor and lack relevance to the question set. Level 0 (0) No creditable response.
Q9 · ‘The key to sustainable management of a tourist destination is learning from the past.’…
9 ‘The key to sustainable management of a tourist destination is learning from the past.’ With reference to one or more examples, how far do you agree? [20] Economic transition If answering this option, answer Question 10 and either Question 11 or Question 12.
Mark scheme: 9 ‘The key to sustainable management of a tourist destination is learning 20 from the past.’ With reference to one or more examples, how far do you agree? Candidates are free to develop their own approach to the question and responses will vary depending on the example(s) chosen. Whichever approach is chosen, essays which address the question and support their argument with relevant examples will be credited. The direction of the response and evaluation made will depend on the approach chosen, and any evaluation is therefore valid if argued and based on evidence. Candidates should assess the extent to which the key to sustainable management of a tourist destination(s) is learning from the past. Learning from the past could be related to either positive or negative experiences in the destination or from experiences in other destinations. Learning from the past might include reference to the Butler model and its links to the development over time and its use as a predictive tool in planning tourist developments. They should display knowledge of sustainable management of the destination(s) and be able to link this to learning from the past in this or other destinations. Sustainable management could be considered at any scale and be for management of the environment, society or economy. Award marks based on the quality of the response using the marking levels below. Level 4 (16–20) Response thoroughly discusses the extent to which they agree that the key to sustainable management of a tourist destination(s) is learning from the past. An effective and sustained evaluation with a sound conclusion. Response is well founded in detailed exemplar knowledge and strong conceptual understanding of the topic. Examples used are appropriate and integrated effectively into the response. Level 3 (11–15) Response discusses the extent to which they agree that the key to sustainable management of a tourist destination(s) is learning from the past. Response is broadly evaluative in character, comprising some explanatory or narrative content and a conclusion. Response develops on a largely secure base of knowledge and understanding with the use of example(s). 9 Level 2 (6–10) Response demonstrates some knowledge and understanding of sustainable management of a tourist destination(s) but has limited reference to learning from the past. Response is mainly descriptive or explanatory in approach and contains a brief or thinly supported evaluation. Responses without the use of example(s) to support the response will not get above the middle of Level 2 (8 marks). Level 1 (1–5) Response makes a few general points about a tourist destination(s). A descriptive response comprising a few simple points. Knowledge is basic and understanding may be poor and lack relevance to the question set. Level 0 (0) No creditable response. Economic transition If answering this option, answer Question 10 and either Question 11 or Question 12.
Q10 · The distribution of employment by sector for LICs and HICs in 1991 and 2018
10 Fig. 10.1 shows the distribution of employment by sector for LICs and HICs in 1991 and 2018. (a) Compare the changes in employment for LICs and HICs shown in Fig. 10.1. [4] (b) Explain the role of the primary sector in economic development. [6]
Mark scheme: 10(a) Fig. 10.1 shows the distribution of employment by sector for LICs and 4 HICs in 1991 and 2018. Compare the changes in employment for LICs and HICs shown in Fig. 10.1. Comparisons include: Both have falls in agriculture, LICs by 8%, HICs by 3%, but more decline in LICs, (in HICs from 6% to 3%, whereas in LICs 70% to 62%), Both have increases in services LICs +5%, HICs +11%, but more so in HICs (64%–75%), whereas 21–26% in LICs, Manufacturing sector remains at 6% in LICs, but falls in HICs (20% to 12%) Both are still dominated by one sector (LICs agriculture, HICs services), but the dominance of services in HICs has increased, whilst in LICs agriculture has fallen In both groups, construction shows little change but has grown in LICs (2% to 4%), whilst it stays the same in HICs (8%) Mining rises from 1 to 2% in LICs and remains the same (2%) in HICs but is the smallest in both Other comparisons may be valid 1 mark for each valid comparison. Allow development of one change for a second mark such as the comments following ‘but’ above in each bullet point. Max. 1 for two separate descriptions of changes in LICs and HICs. Max. 2 for no data. Allow ±1% tolerance for data reading. 10(b) Explain the role of the primary sector in economic development. 6 Candidates should explain the role of the primary sector in economic development. The explanation does not need to be comprehensive for full marks. Explanations include: Provides raw materials for other sectors Some of the products are sold directly to consumers Provides sources of finance to develop other sectors of the economy, including foreign currency Provides food for population in general and workforce in all sectors Provides employment and wages for spending on other sectors A market for both secondary goods and services Source of medicines In LICs, primary sector is predominantly agriculture, where it employs a lot of people, often subsistence small holdings, and it is often inefficient In some economies, the primary sector is dominated by mineral extraction, and in oil-rich countries this has directly led to rapid economic development As an economy develops there is usually a switch from primary to secondary and tertiary, as agriculture becomes more developed, fewer workers are required The shift to more efficient farming methods enables that sector to contribute more to the economy of the country Other Award marks based on the quality of explanation and breadth of the response using the marking levels below. Level 3 (5–6) Response clearly explains the role of the primary sector in economic development. Response is well founded in detailed knowledge and strong conceptual understanding of the topic. Examples used are appropriate and integrated effectively into the response. Level 2 (3–4) Response explains the role of the primary sector in economic development in a more limited way. Response develops on a largely secure base of knowledge and understanding. Examples may lack detail or development. Level 1 (1–2) Response comprises one or two points about the primary sector in an economy. Knowledge is basic and understanding may be inaccurate. Examples are in name only or lacking entirely. Level 0 (0) No creditable response.
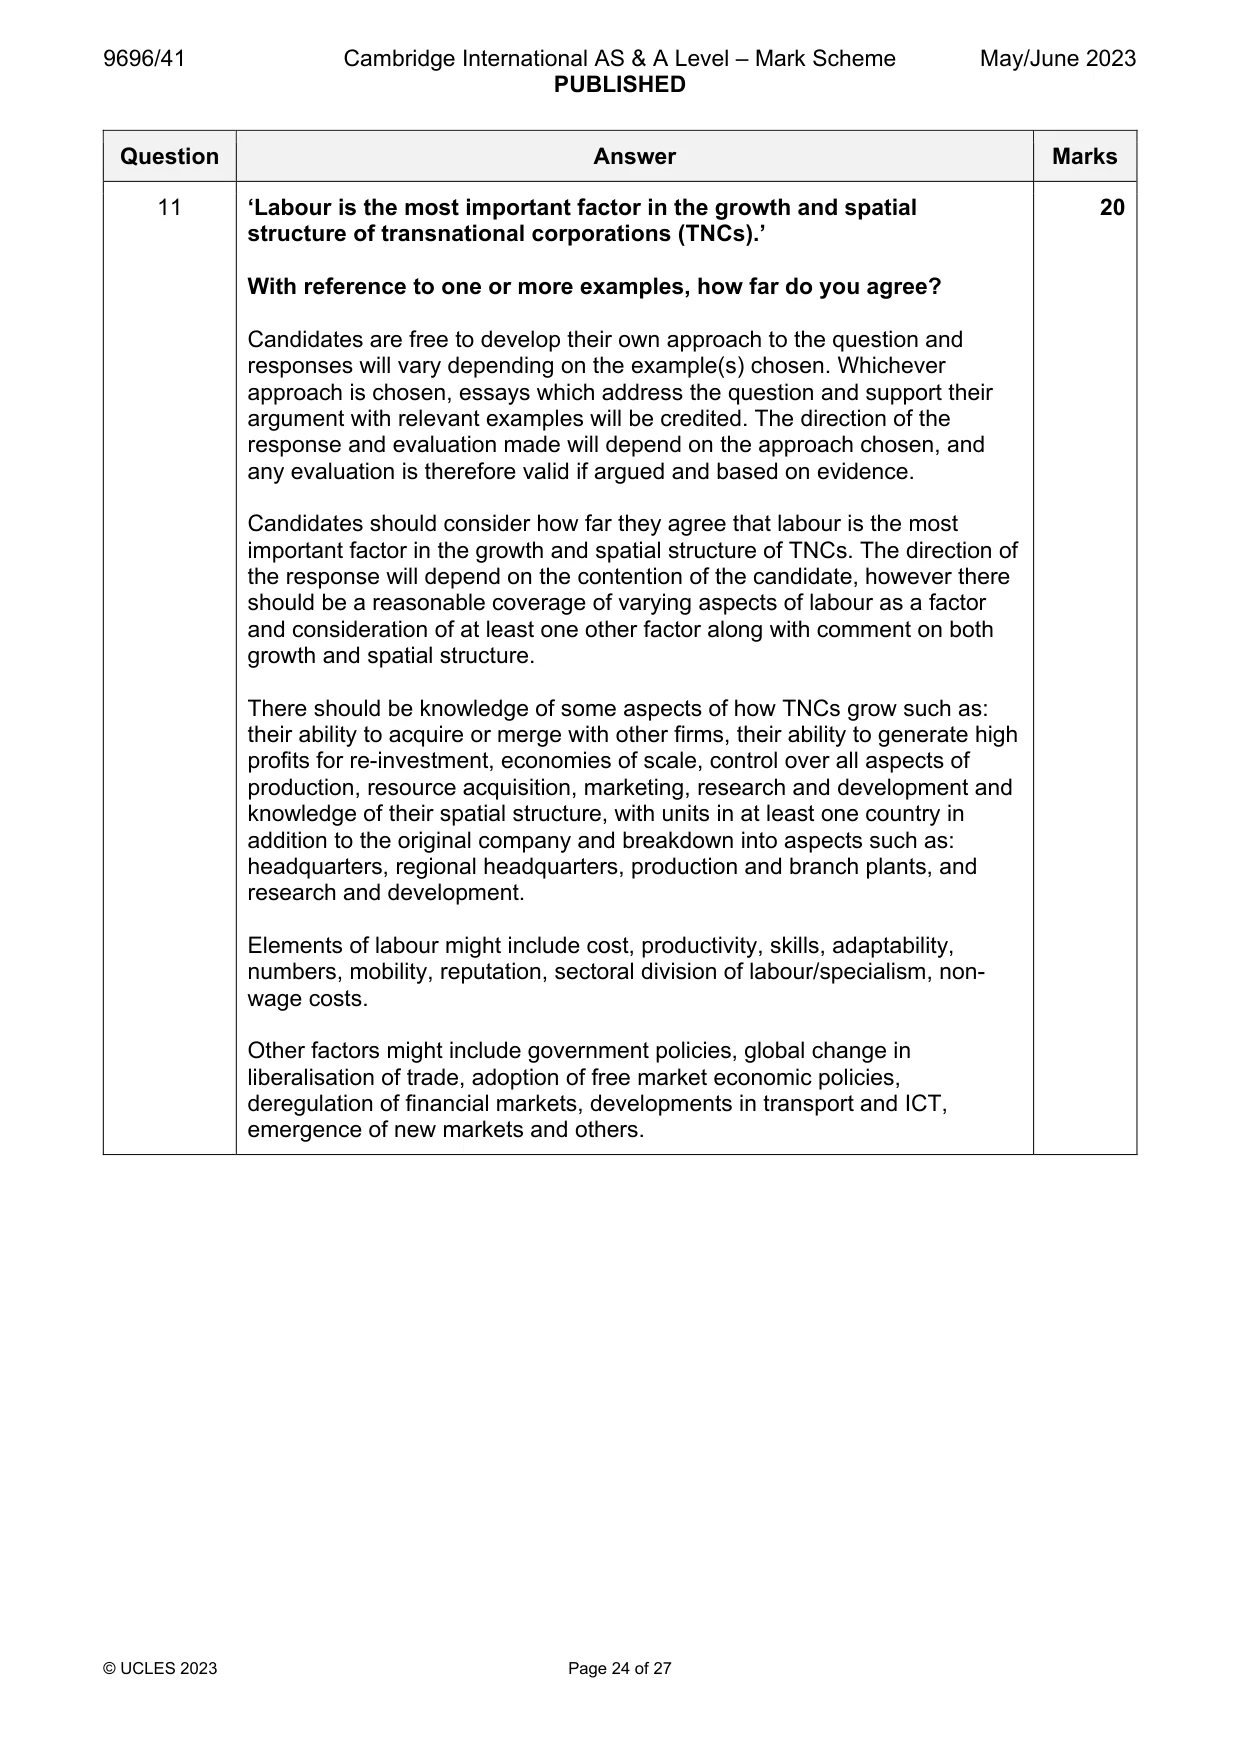
Q11 · ‘Labour is the most important factor in the growth and spatial structure of transnational…
11 ‘Labour is the most important factor in the growth and spatial structure of transnational corporations (TNCs).’ With reference to one or more examples, how far do you agree? [20]
Mark scheme: 11 ‘Labour is the most important factor in the growth and spatial 20 structure of transnational corporations (TNCs).’ With reference to one or more examples, how far do you agree? Candidates are free to develop their own approach to the question and responses will vary depending on the example(s) chosen. Whichever approach is chosen, essays which address the question and support their argument with relevant examples will be credited. The direction of the response and evaluation made will depend on the approach chosen, and any evaluation is therefore valid if argued and based on evidence. Candidates should consider how far they agree that labour is the most important factor in the growth and spatial structure of TNCs. The direction of the response will depend on the contention of the candidate, however there should be a reasonable coverage of varying aspects of labour as a factor and consideration of at least one other factor along with comment on both growth and spatial structure. There should be knowledge of some aspects of how TNCs grow such as: their ability to acquire or merge with other firms, their ability to generate high profits for re-investment, economies of scale, control over all aspects of production, resource acquisition, marketing, research and development and knowledge of their spatial structure, with units in at least one country in addition to the original company and breakdown into aspects such as: headquarters, regional headquarters, production and branch plants, and research and development. Elements of labour might include cost, productivity, skills, adaptability, numbers, mobility, reputation, sectoral division of labour/specialism, non- wage costs. Other factors might include government policies, global change in liberalisation of trade, adoption of free market economic policies, deregulation of financial markets, developments in transport and ICT, emergence of new markets and others. 11 Award marks based on the quality of the response using the marking levels below. Level 4 (16–20) Response thoroughly discusses the extent to which labour is the most important factor in the growth and spatial structure of TNCs. An effective and sustained evaluation with a sound conclusion. Response is well founded in detailed exemplar knowledge and strong conceptual understanding of the topic. Examples used are appropriate and integrated effectively into the response. Level 3 (11–15) Response discusses the extent to which labour is the most important factor in the growth and spatial structure of TNCs. Response is broadly evaluative in character, comprising some explanatory or narrative content and a conclusion. Response develops on a largely secure base of knowledge and understanding with the use of example(s). Level 2 (6–10) Response demonstrates some knowledge and understanding of factors in the growth or spatial structure of TNCs but with limited comment on the importance of the labour factor. Response is mainly descriptive or explanatory in approach and contains a brief or thinly supported evaluation. Responses without the use of example(s) to support the response will not get above the middle of Level 2 (8 marks). Level 1 (1–5) Response makes a few general points about TNCs. A descriptive response comprising a few simple points. Knowledge is basic and understanding may be poor and lack relevance to the question set. Level 0 (0) No creditable response.
Q12 · With reference to one country, assess the extent to which physical factors cause regional…
12 With reference to one country, assess the extent to which physical factors cause regional disparities. [20]
Mark scheme: 12 With reference to one country, assess the extent to which physical 20 factors cause regional disparities. Candidates are free to develop their own approach to the question and responses will vary depending on the example(s) chosen. Whichever approach is chosen, essays which address the question and support their argument with relevant examples will be credited. The direction of the response and evaluation made will depend on the approach chosen, and any evaluation is therefore valid if argued and based on evidence. Candidates should consider the extent to which they agree that physical factors cause regional disparities in one country. There should be consideration of at least two regions within the chosen country and at least one other factor. Physical factors might include climate, soils, vegetation, geology, relief, water resources, other resources, accessibility/remoteness (as influenced by physical factors), endemic disease and other valid factors. Other factors may include reference to theoretical concepts e.g. core– periphery and cumulative causation along with other factors such as: historical, locational advantage, government policies, economic and social. Award marks based on the quality of the response using the marking levels below. Level 4 (16–20) Response thoroughly discusses the extent to which physical factors cause regional disparities in one country. An effective and sustained evaluation with a sound conclusion. Response is well founded in detailed exemplar knowledge and strong conceptual understanding of the topic. Examples used are appropriate and integrated effectively into the response. Level 3 (11–15) Response discusses the extent to which physical factors cause regional disparities. Response is broadly evaluative in character, comprising some explanatory or narrative content and a conclusion. Response develops on a largely secure base of knowledge and understanding with the use of example(s). 12 Level 2 (6–10) Response demonstrates some knowledge and understanding of the causes of regional disparities in one country with little discussion of the importance of physical factors. Response is mainly descriptive or explanatory in approach and contains a brief or thinly supported evaluation. Responses without the use of example(s) to support the response will not get above the middle of Level 2 (8 marks). Level 1 (1–5) Response makes a few general points about disparities in one country with little focus on regional disparities and/or the importance of physical factors. A descriptive response comprising a few simple points. Knowledge is basic and understanding may be poor and lack relevance to the question set. Level 0 (0) No creditable response.
What was in this paper
The subtopics covered by these 12 questions, and how many questions each got. Open one in a new tab to see every Cambridge question on it.
2International debt and international aid1Manufacturing and related service industry1National development1Regional development within countries1Sustainable energy supplies1The globalisation of economic activity1The management of a degraded environment1The management of a tourist destination1The management of agricultural change1The management of energy supply1What you needed in this session
Cambridge’s own grade thresholds for 2023 May/June, Paper 4 · Variant 1. A higher threshold means an easier paper — the bar moves with how the cohort did.