Cambridge A Level Geography 9696 — 2020 Oct/Nov Paper 4 · Variant 2
9696/42/O/N/20 · 12 questions · 60 marks · ≈68 min
The question paper and its mark scheme, free to read here and free to download. This is Cambridge’s own paper, exactly as it was sat.
Question paper4 pages



Mark scheme25 pages
Answers below. Sit the paper first if you are practising.









Questions as text
Q1 · Export processing zones (EPZs) in Bangladesh in 2012
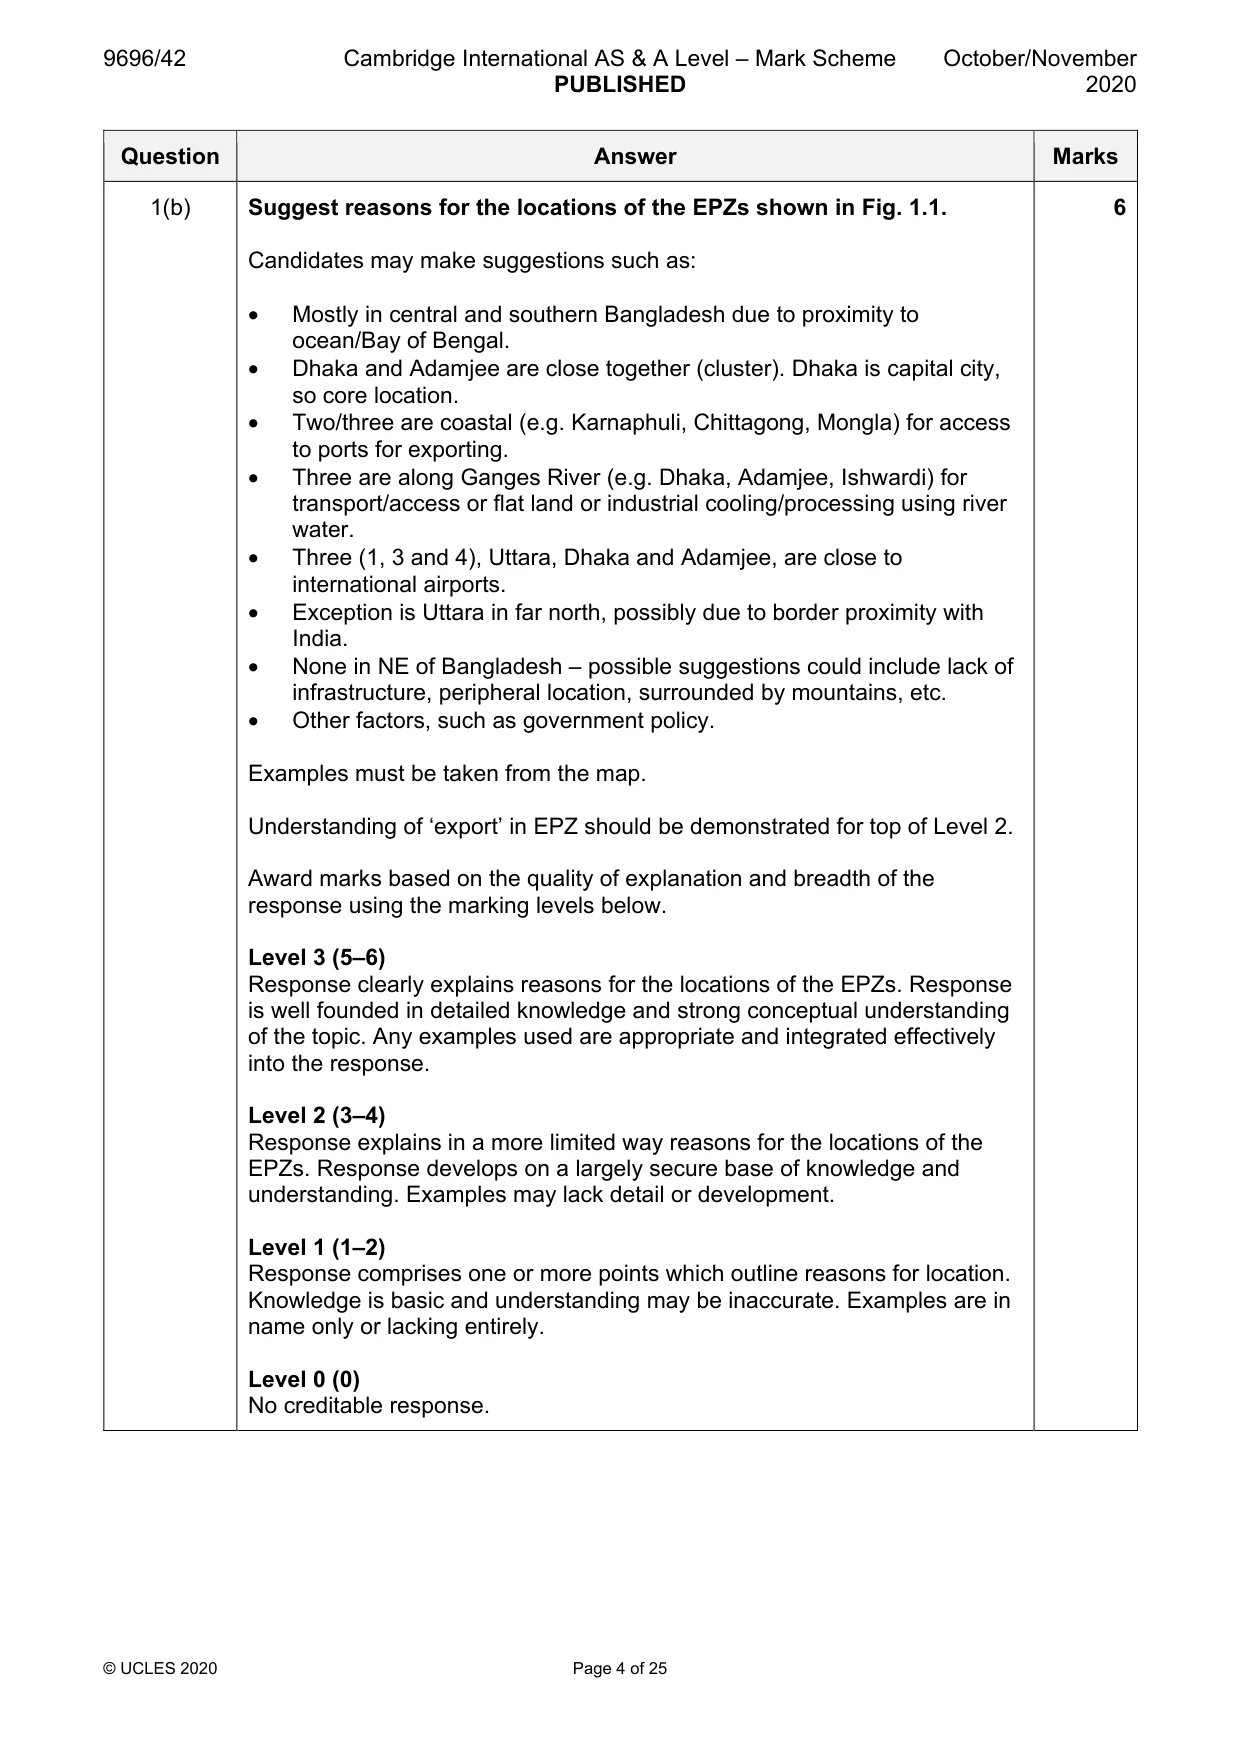
1 Fig. 1.1 shows export processing zones (EPZs) in Bangladesh in 2012. (a) Describe the pattern of EPZs shown in Fig. 1.1. [4] (b) Suggest reasons for the locations of the EPZs shown in Fig. 1.1. [6]
Mark scheme: Question Answer Marks 1(a) Fig. 1.1 shows export processing zones (EPZs) in Bangladesh in 2012. 4 Describe the pattern of EPZs shown in Fig. 1.1. Candidates should give a description of the pattern of EPZs using the map as evidence: • Mostly in central and southern Bangladesh • Dhaka and Adamjee (3 and 4) are close together (cluster) • Two/three are coastal (8, 7 and 6), e.g. Karnaphuli, Chittagong, Mongla • Three (2, 3, 4) are along/near river, e.g. Ishwardi, Dhaka, Adamjee • Exception is Uttara in far north • None in NE of Bangladesh • Reference to human features, e.g. airports, railways is valid 1 mark for each valid description. 2 marks for a description supported with map evidence to the maximum. Max. 2 marks for description which focuses on individual locations rather than distribution. 1(b) Suggest reasons for the locations of the EPZs shown in Fig. 1.1. 6 Candidates may make suggestions such as: • Mostly in central and southern Bangladesh due to proximity to ocean/Bay of Bengal. • Dhaka and Adamjee are close together (cluster). Dhaka is capital city, so core location. • Two/three are coastal (e.g. Karnaphuli, Chittagong, Mongla) for access to ports for exporting. • Three are along Ganges River (e.g. Dhaka, Adamjee, Ishwardi) for transport/access or flat land or industrial cooling/processing using river water. • Three (1, 3 and 4), Uttara, Dhaka and Adamjee, are close to international airports. • Exception is Uttara in far north, possibly due to border proximity with India. • None in NE of Bangladesh – possible suggestions could include lack of infrastructure, peripheral location, surrounded by mountains, etc. • Other factors, such as government policy. Examples must be taken from the map. Understanding of ‘export’ in EPZ should be demonstrated for top of Level 2. Award marks based on the quality of explanation and breadth of the response using the marking levels below. Level 3 (5–6) Response clearly explains reasons for the locations of the EPZs. Response is well founded in detailed knowledge and strong conceptual understanding of the topic. Any examples used are appropriate and integrated effectively into the response. Level 2 (3–4) Response explains in a more limited way reasons for the locations of the EPZs. Response develops on a largely secure base of knowledge and understanding. Examples may lack detail or development. Level 1 (1–2) Response comprises one or more points which outline reasons for location. Knowledge is basic and understanding may be inaccurate. Examples are in name only or lacking entirely. Level 0 (0) No creditable response.
Q2 · To what extent was new agricultural technology the main cause of agricultural change in…
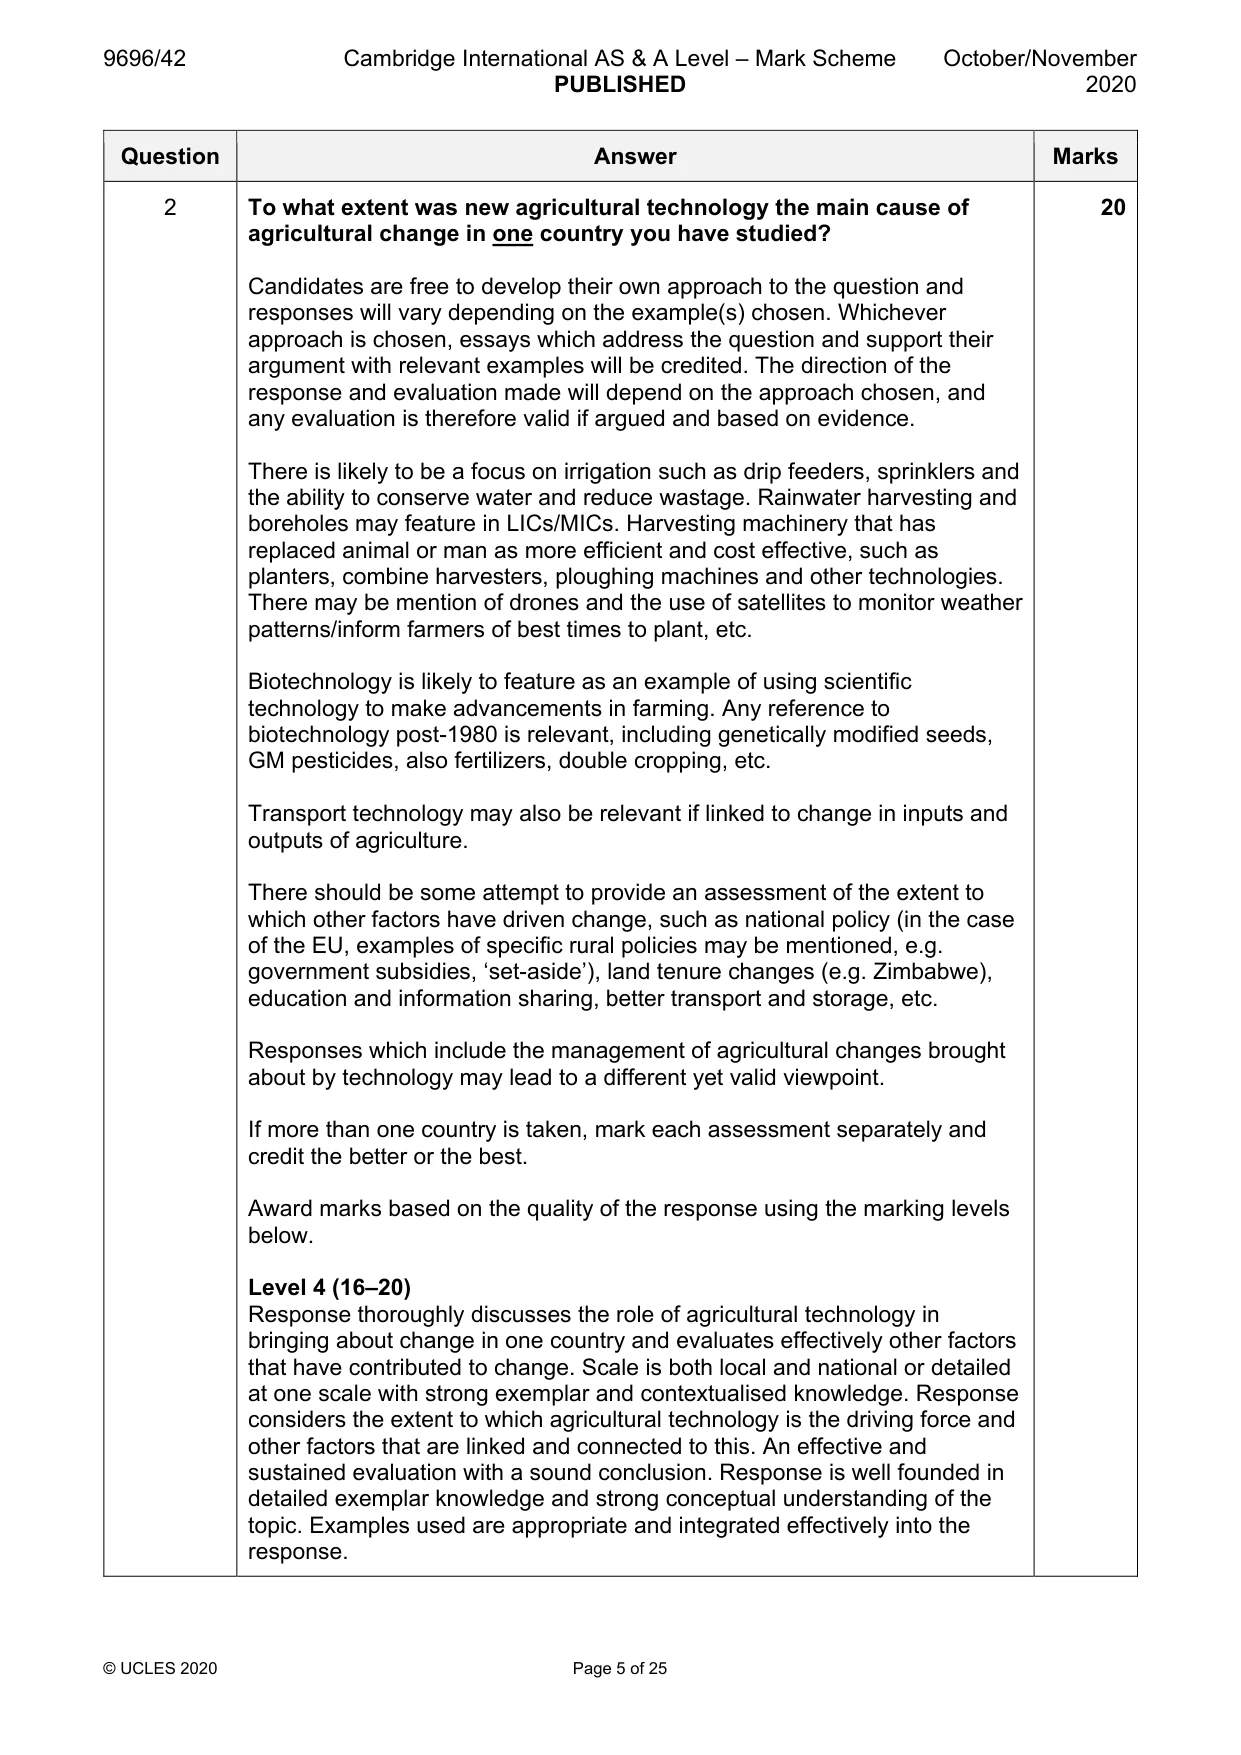
2 To what extent was new agricultural technology the main cause of agricultural change in one country you have studied? [20]
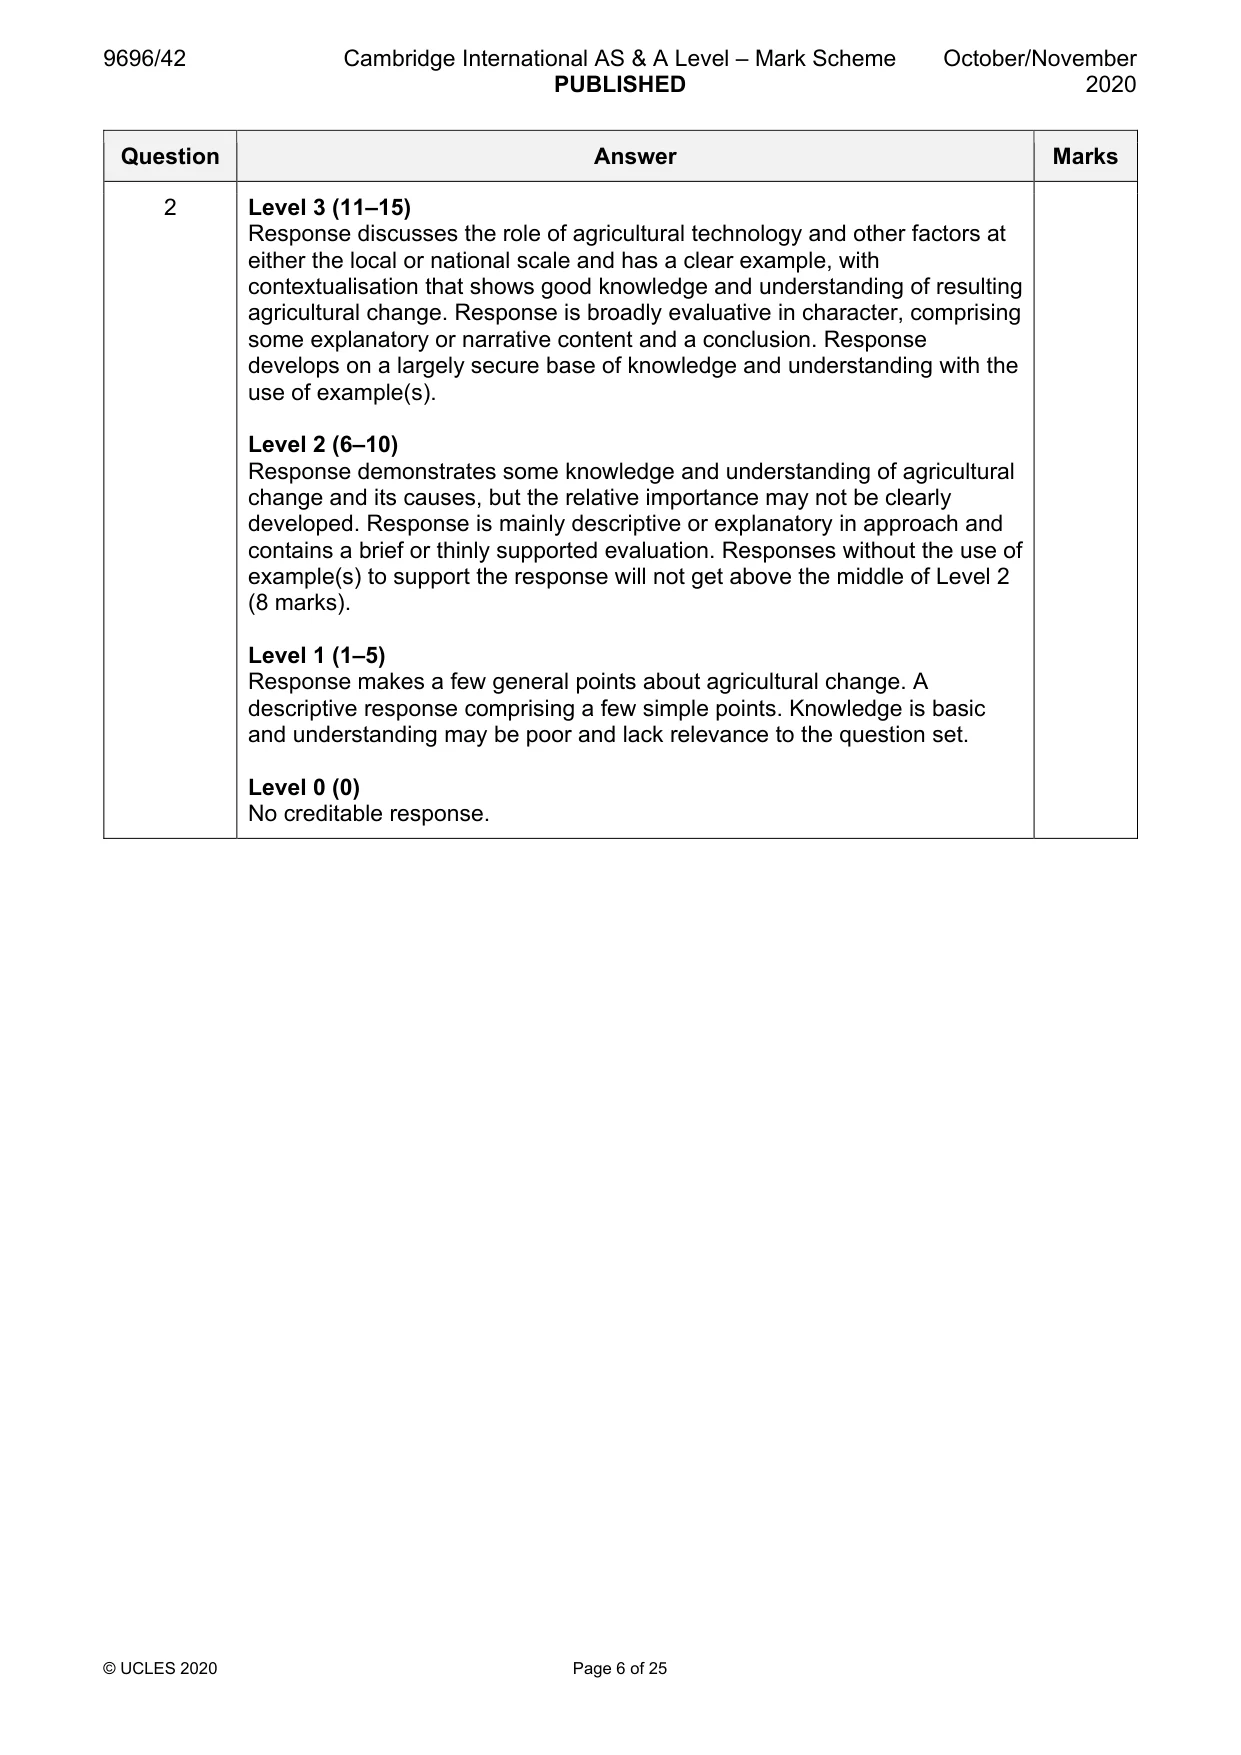
Mark scheme: 2 To what extent was new agricultural technology the main cause of 20 agricultural change in one country you have studied? Candidates are free to develop their own approach to the question and responses will vary depending on the example(s) chosen. Whichever approach is chosen, essays which address the question and support their argument with relevant examples will be credited. The direction of the response and evaluation made will depend on the approach chosen, and any evaluation is therefore valid if argued and based on evidence. There is likely to be a focus on irrigation such as drip feeders, sprinklers and the ability to conserve water and reduce wastage. Rainwater harvesting and boreholes may feature in LICs/MICs. Harvesting machinery that has replaced animal or man as more efficient and cost effective, such as planters, combine harvesters, ploughing machines and other technologies. There may be mention of drones and the use of satellites to monitor weather patterns/inform farmers of best times to plant, etc. Biotechnology is likely to feature as an example of using scientific technology to make advancements in farming. Any reference to biotechnology post-1980 is relevant, including genetically modified seeds, GM pesticides, also fertilizers, double cropping, etc. Transport technology may also be relevant if linked to change in inputs and outputs of agriculture. There should be some attempt to provide an assessment of the extent to which other factors have driven change, such as national policy (in the case of the EU, examples of specific rural policies may be mentioned, e.g. government subsidies, ‘set-aside’), land tenure changes (e.g. Zimbabwe), education and information sharing, better transport and storage, etc. Responses which include the management of agricultural changes brought about by technology may lead to a different yet valid viewpoint. If more than one country is taken, mark each assessment separately and credit the better or the best. Award marks based on the quality of the response using the marking levels below. Level 4 (16–20) Response thoroughly discusses the role of agricultural technology in bringing about change in one country and evaluates effectively other factors that have contributed to change. Scale is both local and national or detailed at one scale with strong exemplar and contextualised knowledge. Response considers the extent to which agricultural technology is the driving force and other factors that are linked and connected to this. An effective and sustained evaluation with a sound conclusion. Response is well founded in detailed exemplar knowledge and strong conceptual understanding of the topic. Examples used are appropriate and integrated effectively into the response. 2 Level 3 (11–15) Response discusses the role of agricultural technology and other factors at either the local or national scale and has a clear example, with contextualisation that shows good knowledge and understanding of resulting agricultural change. Response is broadly evaluative in character, comprising some explanatory or narrative content and a conclusion. Response develops on a largely secure base of knowledge and understanding with the use of example(s). Level 2 (6–10) Response demonstrates some knowledge and understanding of agricultural change and its causes, but the relative importance may not be clearly developed. Response is mainly descriptive or explanatory in approach and contains a brief or thinly supported evaluation. Responses without the use of example(s) to support the response will not get above the middle of Level 2 (8 marks). Level 1 (1–5) Response makes a few general points about agricultural change. A descriptive response comprising a few simple points. Knowledge is basic and understanding may be poor and lack relevance to the question set. Level 0 (0) No creditable response.
Q3 · With reference to one or more examples, evaluate the role of government policy in causing…
3 With reference to one or more examples, evaluate the role of government policy in causing changes to the character, location and organisation of manufacturing industry. [20] Environmental management If answering this option, answer Question 4 and either Question 5 or Question 6.
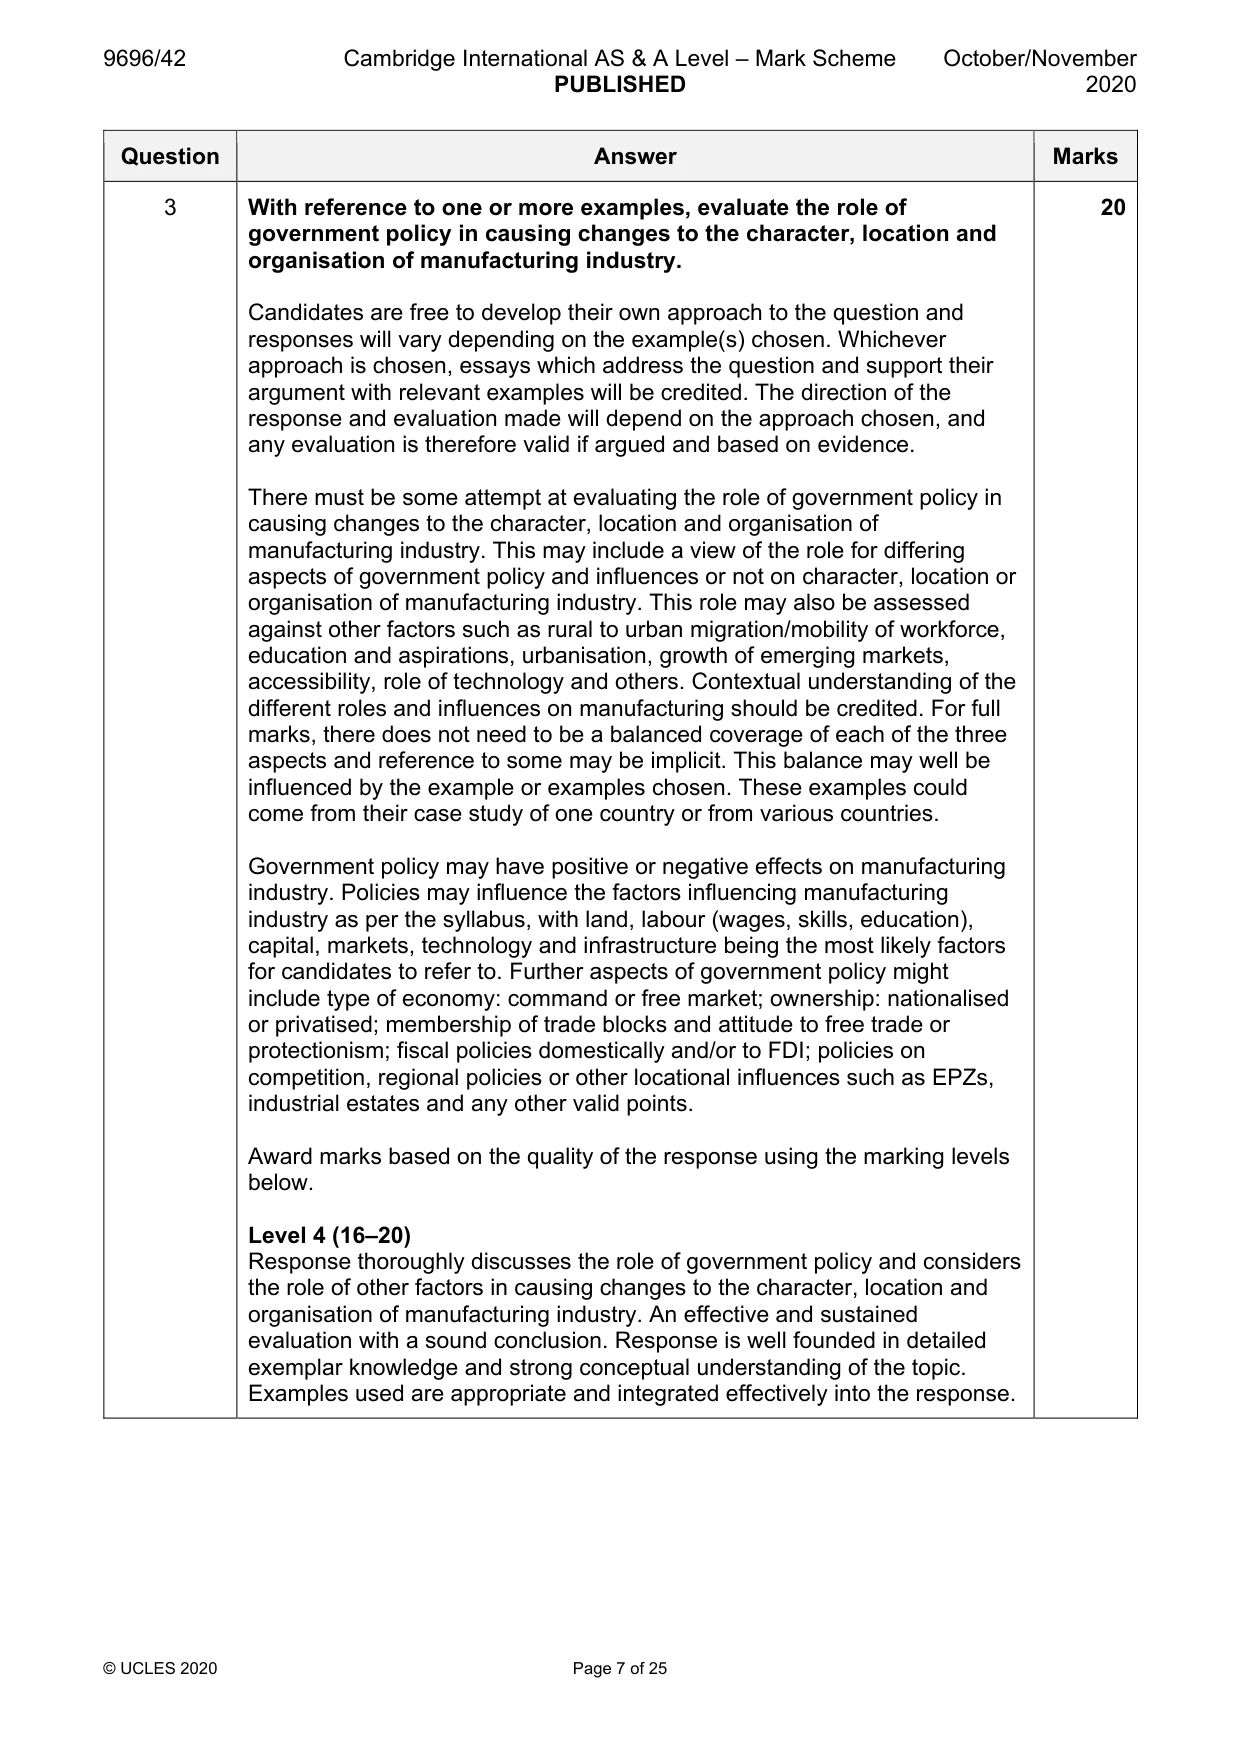
Mark scheme: 3 With reference to one or more examples, evaluate the role of 20 government policy in causing changes to the character, location and organisation of manufacturing industry. Candidates are free to develop their own approach to the question and responses will vary depending on the example(s) chosen. Whichever approach is chosen, essays which address the question and support their argument with relevant examples will be credited. The direction of the response and evaluation made will depend on the approach chosen, and any evaluation is therefore valid if argued and based on evidence. There must be some attempt at evaluating the role of government policy in causing changes to the character, location and organisation of manufacturing industry. This may include a view of the role for differing aspects of government policy and influences or not on character, location or organisation of manufacturing industry. This role may also be assessed against other factors such as rural to urban migration/mobility of workforce, education and aspirations, urbanisation, growth of emerging markets, accessibility, role of technology and others. Contextual understanding of the different roles and influences on manufacturing should be credited. For full marks, there does not need to be a balanced coverage of each of the three aspects and reference to some may be implicit. This balance may well be influenced by the example or examples chosen. These examples could come from their case study of one country or from various countries. Government policy may have positive or negative effects on manufacturing industry. Policies may influence the factors influencing manufacturing industry as per the syllabus, with land, labour (wages, skills, education), capital, markets, technology and infrastructure being the most likely factors for candidates to refer to. Further aspects of government policy might include type of economy: command or free market; ownership: nationalised or privatised; membership of trade blocks and attitude to free trade or protectionism; fiscal policies domestically and/or to FDI; policies on competition, regional policies or other locational influences such as EPZs, industrial estates and any other valid points. Award marks based on the quality of the response using the marking levels below. Level 4 (16–20) Response thoroughly discusses the role of government policy and considers the role of other factors in causing changes to the character, location and organisation of manufacturing industry. An effective and sustained evaluation with a sound conclusion. Response is well founded in detailed exemplar knowledge and strong conceptual understanding of the topic. Examples used are appropriate and integrated effectively into the response. 3 Level 3 (11–15) Response discusses one or more aspects of government policy and is likely to consider factors other than national policy in causing changes to the character, location and organisation of manufacturing industry. Response is broadly evaluative in character, comprising some explanatory or narrative content and a conclusion. Response develops on a largely secure base of knowledge and understanding with the use of example(s). Level 2 (6–10) Response demonstrates some knowledge and understanding of the role of government policy towards manufacturing industry, but evaluation may not be clearly developed. Response is mainly descriptive or explanatory in approach and contains a brief or thinly supported evaluation. Responses without the use of example(s) to support the response will not get above the middle of Level 2 (8 marks). Level 1 (1–5) Response makes a few general points about either government policy or changes in manufacturing. A descriptive response comprising a few simple points. Knowledge is basic and understanding may be poor and lack relevance to the question set. Level 0 (0) No creditable response. Environmental management If answering this option, answer Question 4 and either Question 5 or Question 6.
Q4 · Global electricity production from nuclear power, 1970–2018
4 Fig. 4.1 shows global electricity production from nuclear power, 1970–2018. (a) Describe the trends in global electricity production from nuclear power shown in Fig. 4.1. [4] (b) Explain two reasons for the changes in global electricity production from nuclear power between 1970 and 2018 shown in Fig. 4.1. [6]
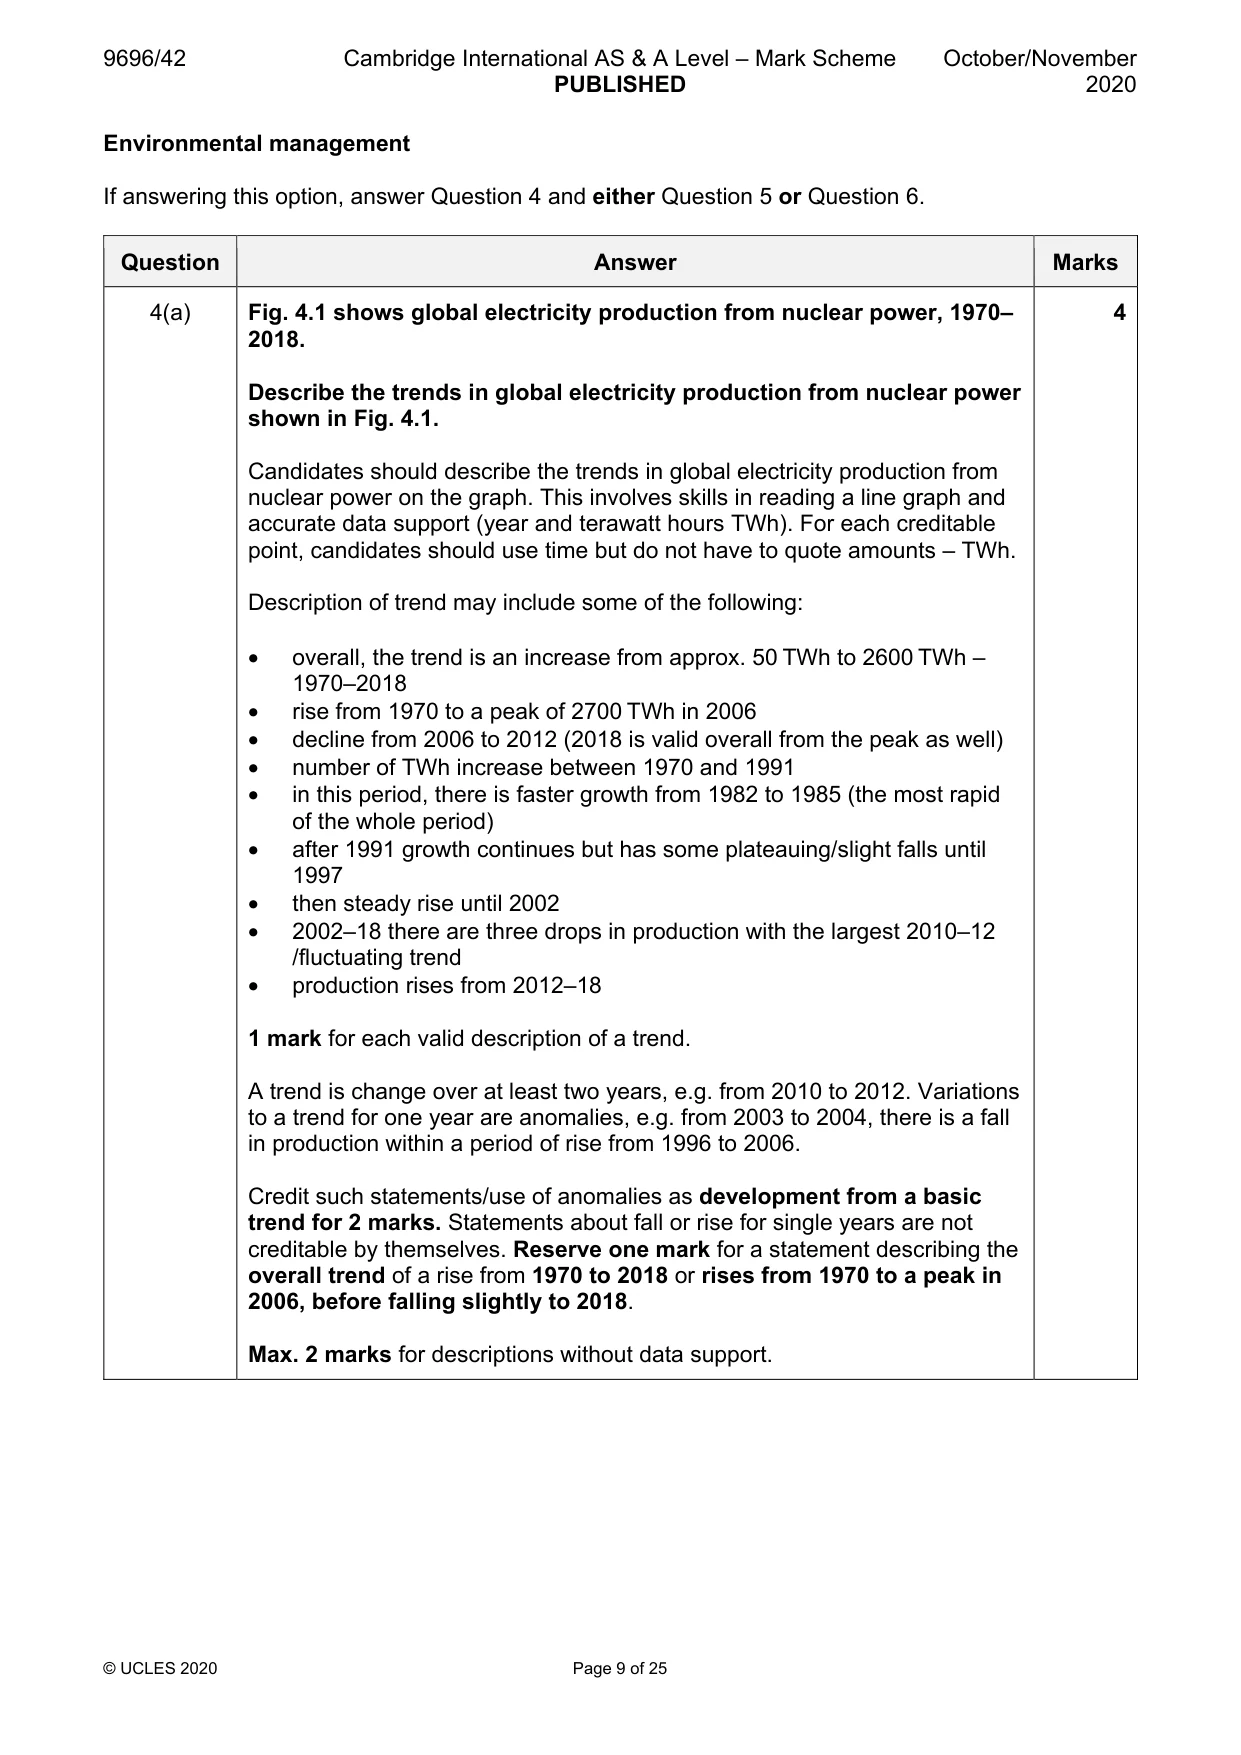
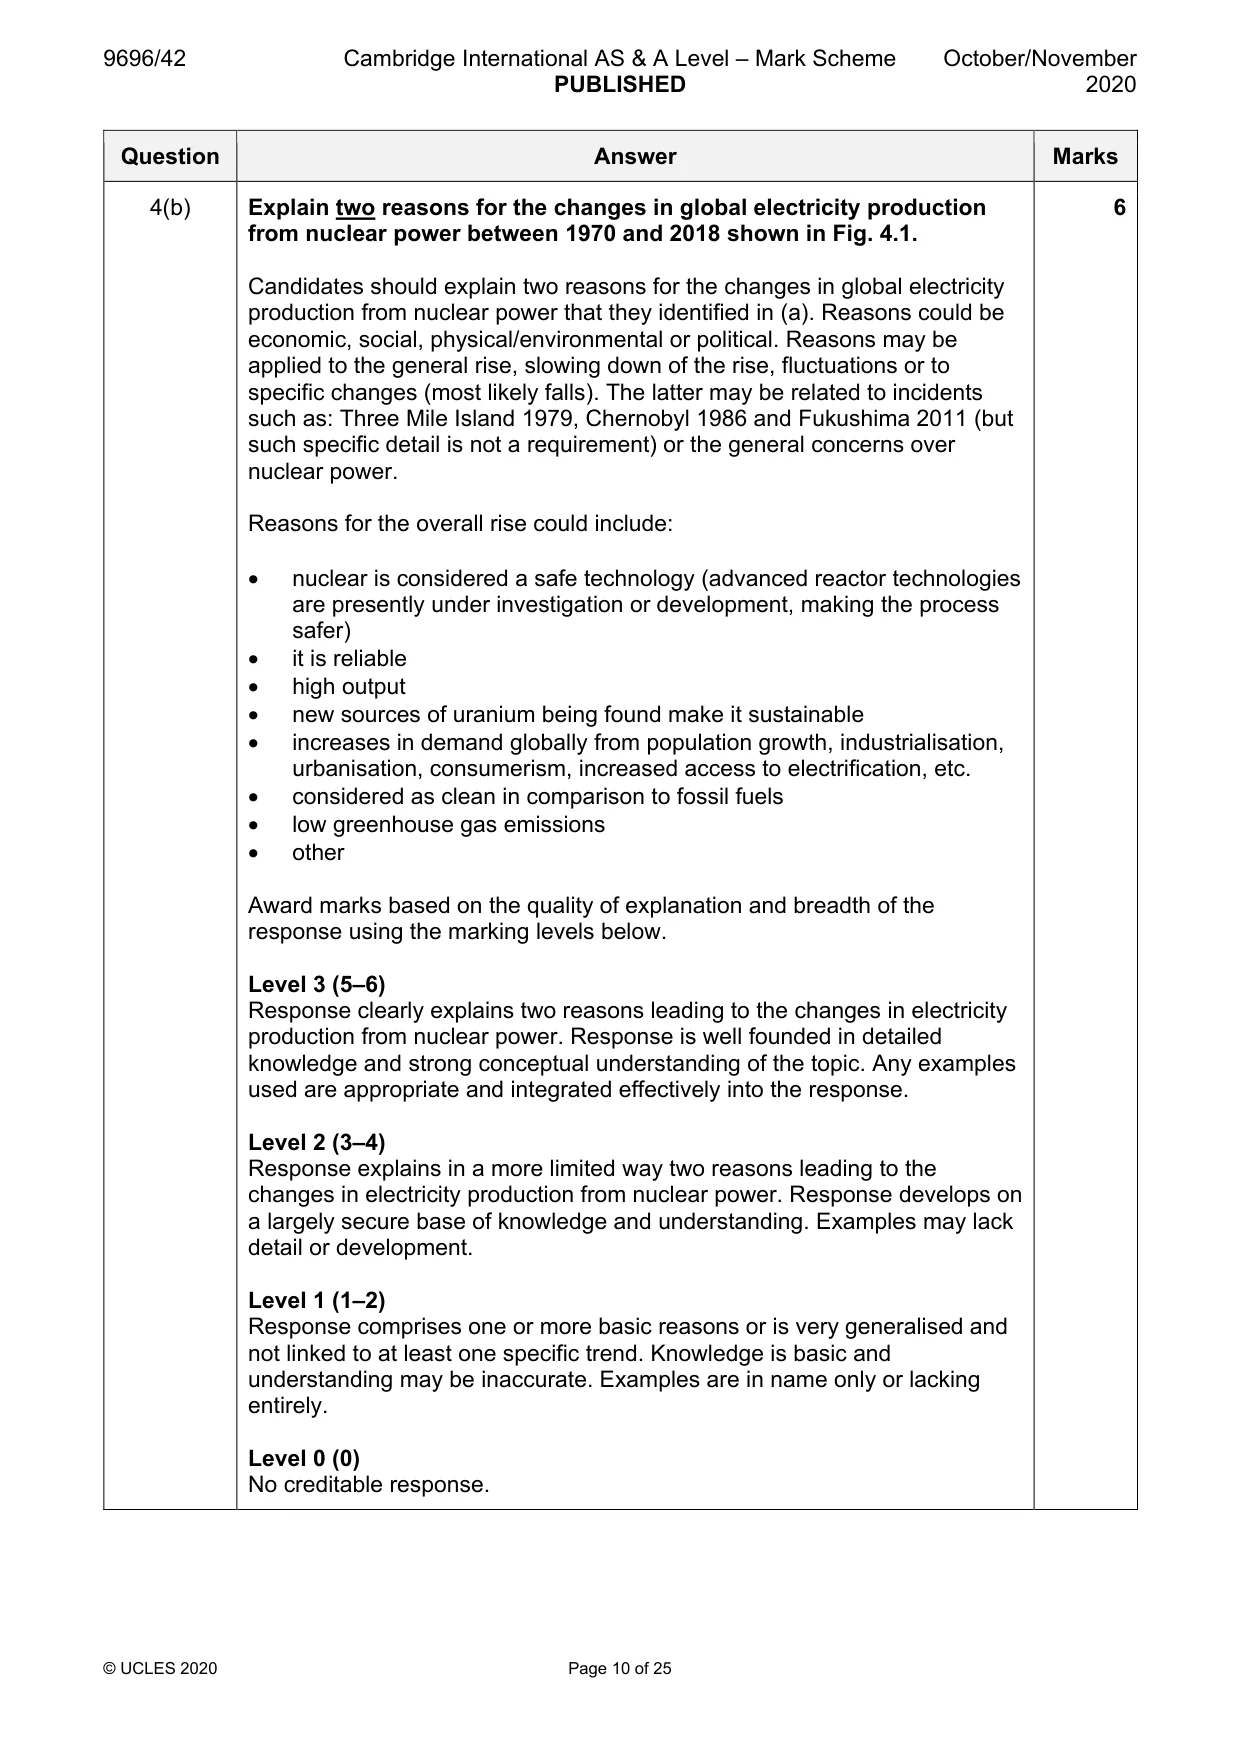
Mark scheme: 4(a) Fig. 4.1 shows global electricity production from nuclear power, 1970– 4 2018. Describe the trends in global electricity production from nuclear power shown in Fig. 4.1. Candidates should describe the trends in global electricity production from nuclear power on the graph. This involves skills in reading a line graph and accurate data support (year and terawatt hours TWh). For each creditable point, candidates should use time but do not have to quote amounts – TWh. Description of trend may include some of the following: • overall, the trend is an increase from approx. 50 TWh to 2600 TWh – 1970–2018 • rise from 1970 to a peak of 2700 TWh in 2006 • decline from 2006 to 2012 (2018 is valid overall from the peak as well) • number of TWh increase between 1970 and 1991 • in this period, there is faster growth from 1982 to 1985 (the most rapid of the whole period) • after 1991 growth continues but has some plateauing/slight falls until 1997 • then steady rise until 2002 • 2002–18 there are three drops in production with the largest 2010–12 /fluctuating trend • production rises from 2012–18 1 mark for each valid description of a trend. A trend is change over at least two years, e.g. from 2010 to 2012. Variations to a trend for one year are anomalies, e.g. from 2003 to 2004, there is a fall in production within a period of rise from 1996 to 2006. Credit such statements/use of anomalies as development from a basic trend for 2 marks. Statements about fall or rise for single years are not creditable by themselves. Reserve one mark for a statement describing the overall trend of a rise from 1970 to 2018 or rises from 1970 to a peak in 2006, before falling slightly to 2018. Max. 2 marks for descriptions without data support. 4(b) Explain two reasons for the changes in global electricity production 6 from nuclear power between 1970 and 2018 shown in Fig. 4.1. Candidates should explain two reasons for the changes in global electricity production from nuclear power that they identified in (a). Reasons could be economic, social, physical/environmental or political. Reasons may be applied to the general rise, slowing down of the rise, fluctuations or to specific changes (most likely falls). The latter may be related to incidents such as: Three Mile Island 1979, Chernobyl 1986 and Fukushima 2011 (but such specific detail is not a requirement) or the general concerns over nuclear power. Reasons for the overall rise could include: • nuclear is considered a safe technology (advanced reactor technologies are presently under investigation or development, making the process safer) • it is reliable • high output • new sources of uranium being found make it sustainable • increases in demand globally from population growth, industrialisation, urbanisation, consumerism, increased access to electrification, etc. • considered as clean in comparison to fossil fuels • low greenhouse gas emissions • other Award marks based on the quality of explanation and breadth of the response using the marking levels below. Level 3 (5–6) Response clearly explains two reasons leading to the changes in electricity production from nuclear power. Response is well founded in detailed knowledge and strong conceptual understanding of the topic. Any examples used are appropriate and integrated effectively into the response. Level 2 (3–4) Response explains in a more limited way two reasons leading to the changes in electricity production from nuclear power. Response develops on a largely secure base of knowledge and understanding. Examples may lack detail or development. Level 1 (1–2) Response comprises one or more basic reasons or is very generalised and not linked to at least one specific trend. Knowledge is basic and understanding may be inaccurate. Examples are in name only or lacking entirely. Level 0 (0) No creditable response.
Q5 · “By 2040, we project a 28% increase in world consumption of energy from all fuel…
5 “By 2040, we project a 28% increase in world consumption of energy from all fuel sources.” (International Energy Outlook, 2017) How far do you agree that the global environmental impacts of this projected increase will be negative? [20]
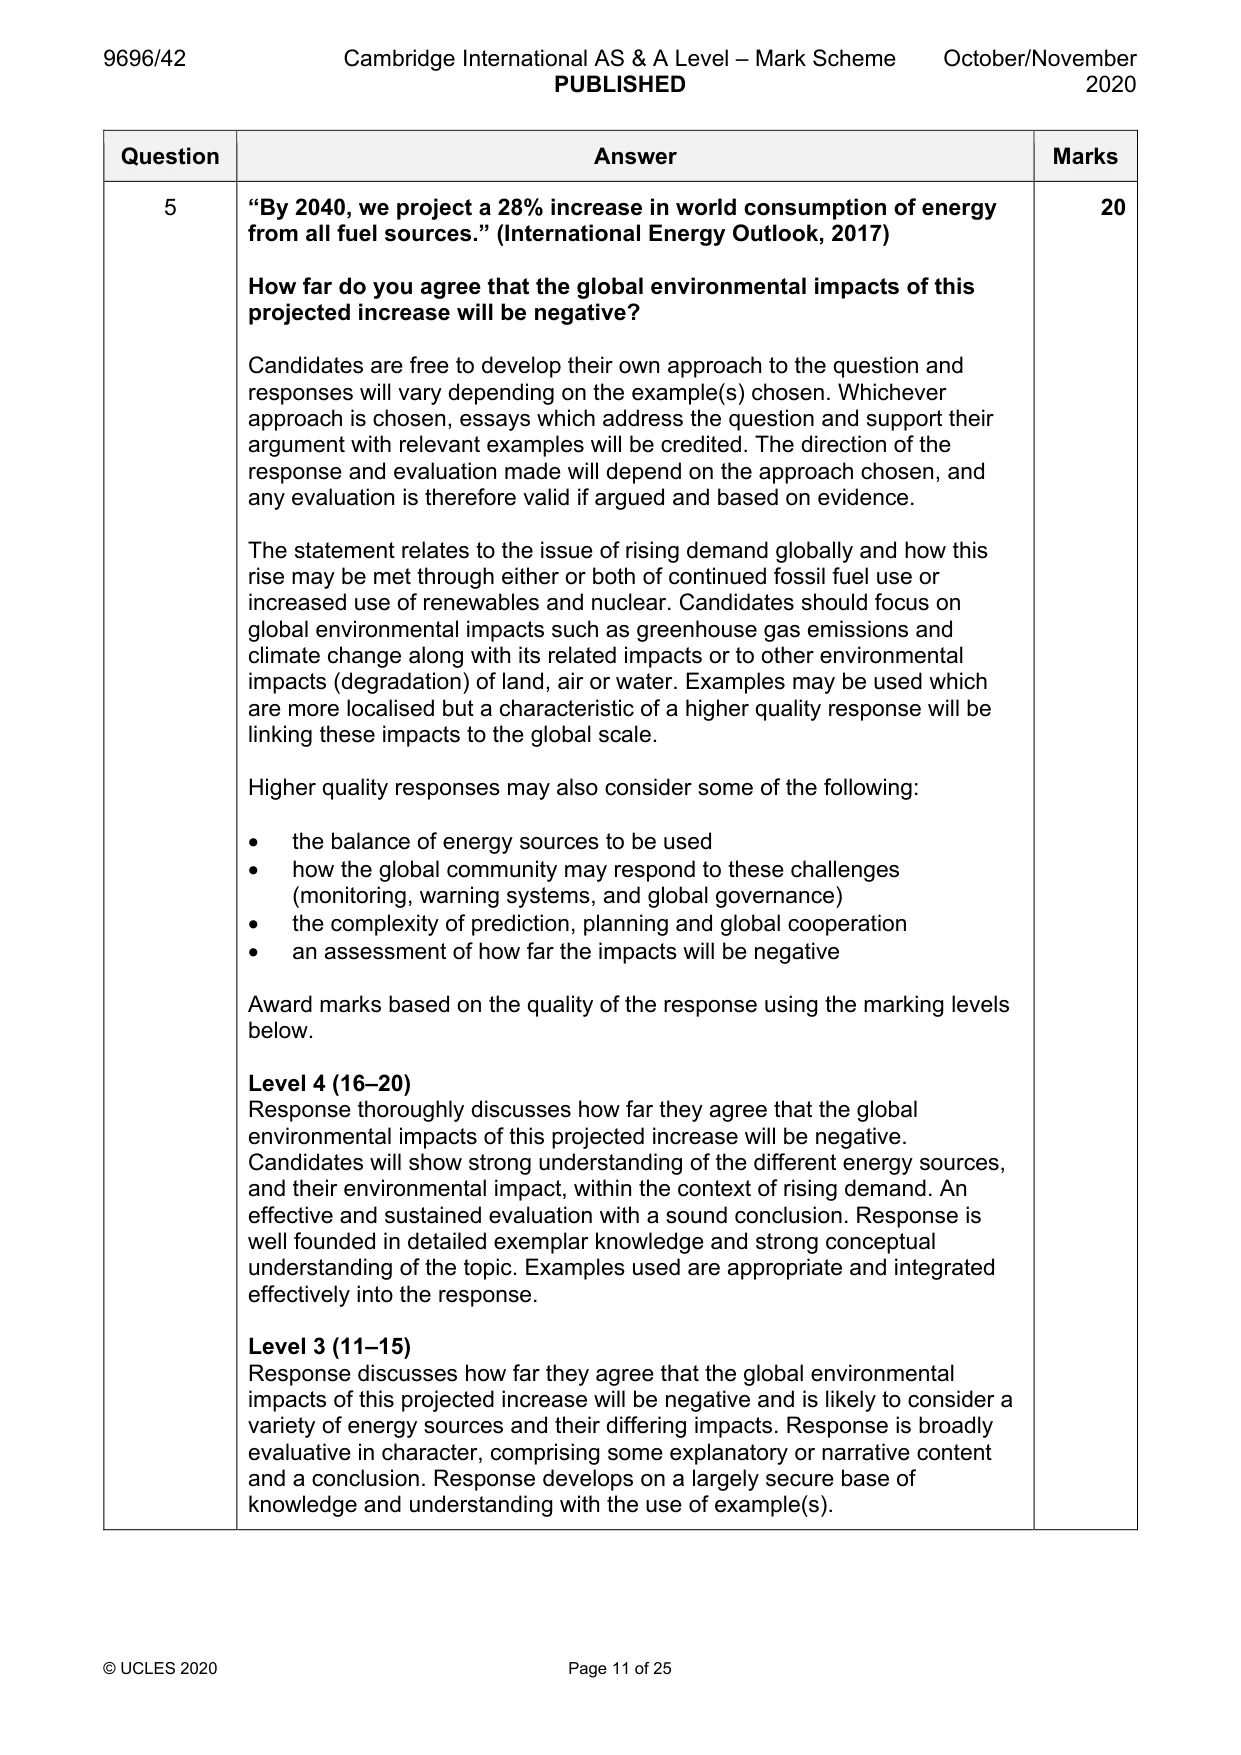
Mark scheme: 5 “By 2040, we project a 28% increase in world consumption of energy 20 from all fuel sources.” (International Energy Outlook, 2017) How far do you agree that the global environmental impacts of this projected increase will be negative? Candidates are free to develop their own approach to the question and responses will vary depending on the example(s) chosen. Whichever approach is chosen, essays which address the question and support their argument with relevant examples will be credited. The direction of the response and evaluation made will depend on the approach chosen, and any evaluation is therefore valid if argued and based on evidence. The statement relates to the issue of rising demand globally and how this rise may be met through either or both of continued fossil fuel use or increased use of renewables and nuclear. Candidates should focus on global environmental impacts such as greenhouse gas emissions and climate change along with its related impacts or to other environmental impacts (degradation) of land, air or water. Examples may be used which are more localised but a characteristic of a higher quality response will be linking these impacts to the global scale. Higher quality responses may also consider some of the following: • the balance of energy sources to be used • how the global community may respond to these challenges (monitoring, warning systems, and global governance) • the complexity of prediction, planning and global cooperation • an assessment of how far the impacts will be negative Award marks based on the quality of the response using the marking levels below. Level 4 (16–20) Response thoroughly discusses how far they agree that the global environmental impacts of this projected increase will be negative. Candidates will show strong understanding of the different energy sources, and their environmental impact, within the context of rising demand. An effective and sustained evaluation with a sound conclusion. Response is well founded in detailed exemplar knowledge and strong conceptual understanding of the topic. Examples used are appropriate and integrated effectively into the response. Level 3 (11–15) Response discusses how far they agree that the global environmental impacts of this projected increase will be negative and is likely to consider a variety of energy sources and their differing impacts. Response is broadly evaluative in character, comprising some explanatory or narrative content and a conclusion. Response develops on a largely secure base of knowledge and understanding with the use of example(s). 5 Level 2 (6–10) Response demonstrates some knowledge and understanding of environmental impacts of the projected increase, but the argument may not be clearly developed. Response is mainly descriptive or explanatory in approach and contains a brief or thinly supported evaluation. Responses without the use of example(s) to support the response will not get above the middle of Level 2 (8 marks). Level 1 (1–5) Response makes a few general points about environmental impacts of energy consumption. A descriptive response comprising a few simple points. Knowledge is basic and understanding may be poor and lack relevance to the question set. Level 0 (0) No creditable response.
Q6 · To what extent do you agree that while there are always constraints when improving…
6 To what extent do you agree that while there are always constraints when improving degraded environments, economic constraints are the most important? [20] Global interdependence If answering this option, answer Question 7 and either Question 8 or Question 9.
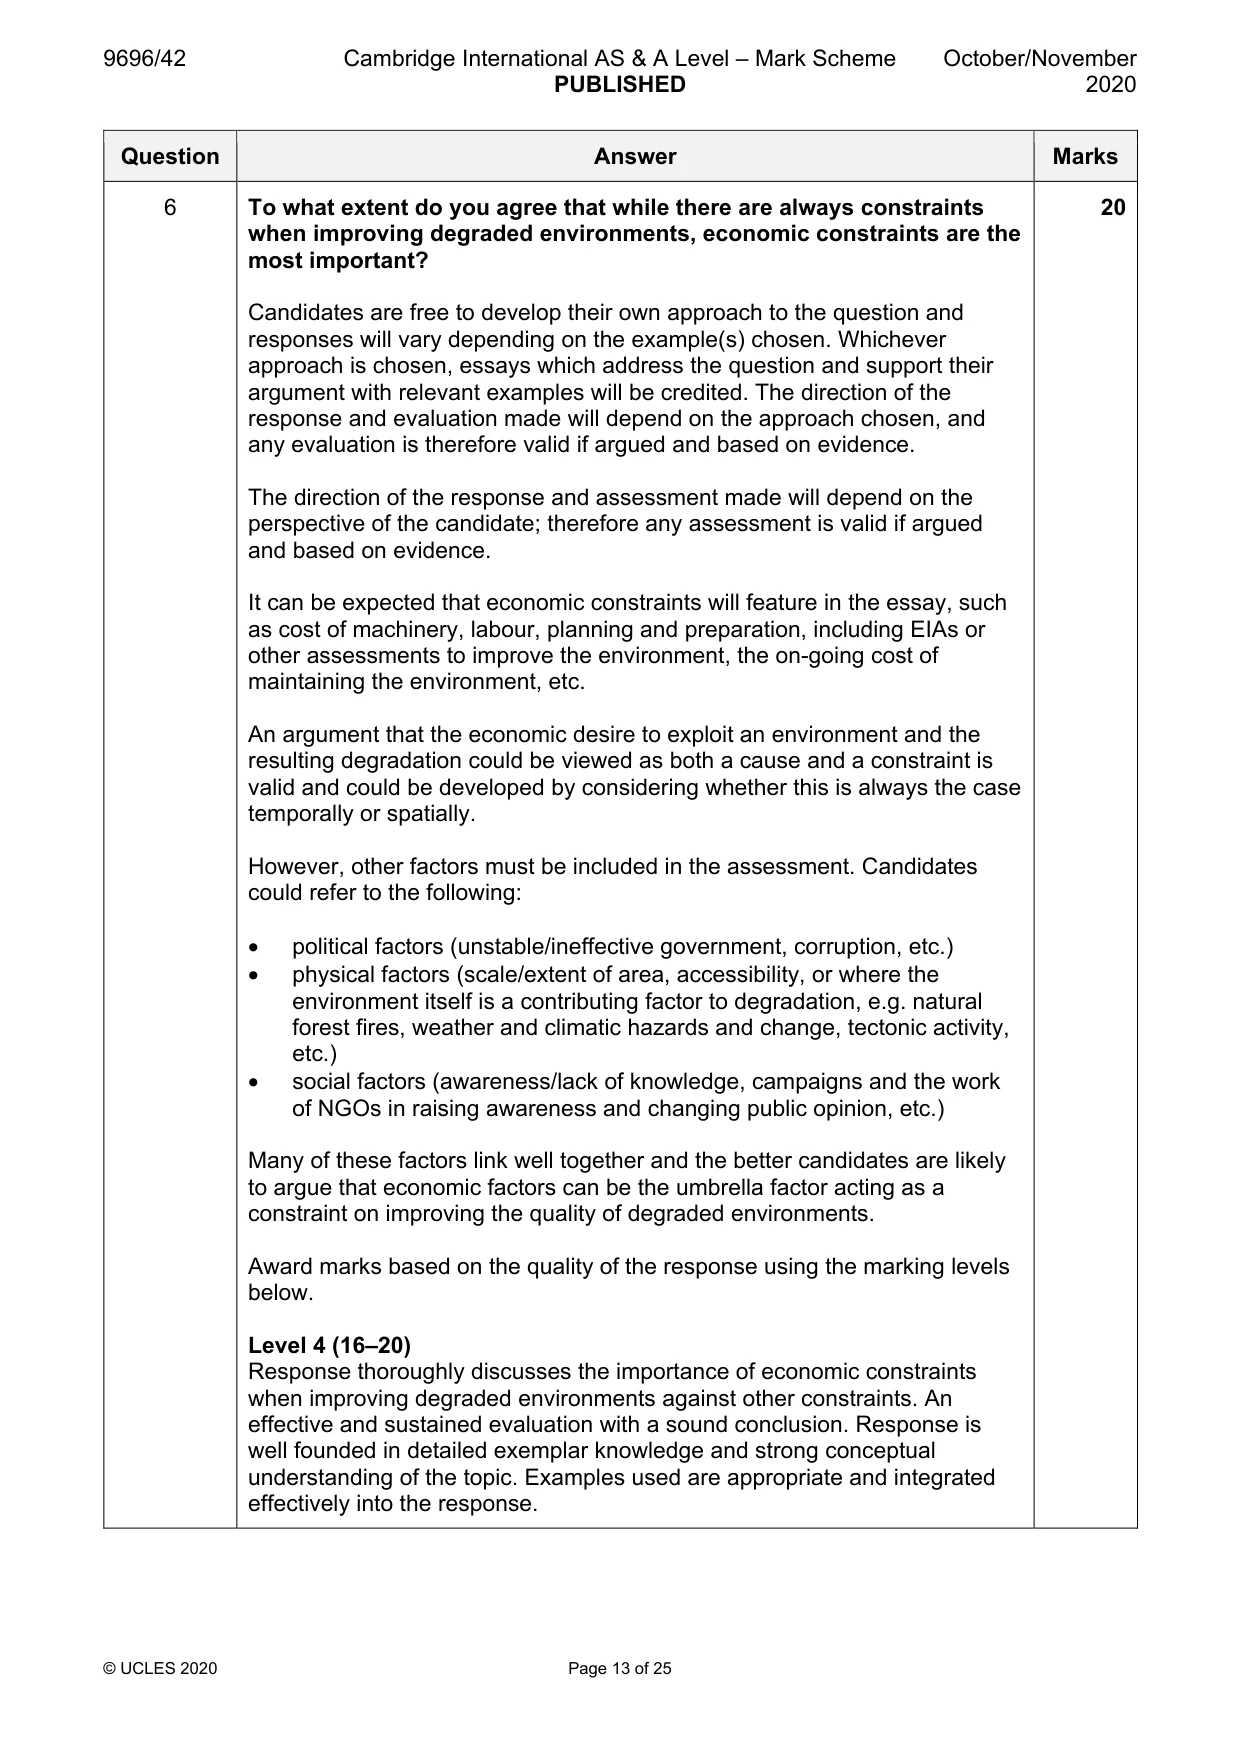
Mark scheme: 6 To what extent do you agree that while there are always constraints 20 when improving degraded environments, economic constraints are the most important? Candidates are free to develop their own approach to the question and responses will vary depending on the example(s) chosen. Whichever approach is chosen, essays which address the question and support their argument with relevant examples will be credited. The direction of the response and evaluation made will depend on the approach chosen, and any evaluation is therefore valid if argued and based on evidence. The direction of the response and assessment made will depend on the perspective of the candidate; therefore any assessment is valid if argued and based on evidence. It can be expected that economic constraints will feature in the essay, such as cost of machinery, labour, planning and preparation, including EIAs or other assessments to improve the environment, the on-going cost of maintaining the environment, etc. An argument that the economic desire to exploit an environment and the resulting degradation could be viewed as both a cause and a constraint is valid and could be developed by considering whether this is always the case temporally or spatially. However, other factors must be included in the assessment. Candidates could refer to the following: • political factors (unstable/ineffective government, corruption, etc.) • physical factors (scale/extent of area, accessibility, or where the environment itself is a contributing factor to degradation, e.g. natural forest fires, weather and climatic hazards and change, tectonic activity, etc.) • social factors (awareness/lack of knowledge, campaigns and the work of NGOs in raising awareness and changing public opinion, etc.) Many of these factors link well together and the better candidates are likely to argue that economic factors can be the umbrella factor acting as a constraint on improving the quality of degraded environments. Award marks based on the quality of the response using the marking levels below. Level 4 (16–20) Response thoroughly discusses the importance of economic constraints when improving degraded environments against other constraints. An effective and sustained evaluation with a sound conclusion. Response is well founded in detailed exemplar knowledge and strong conceptual understanding of the topic. Examples used are appropriate and integrated effectively into the response. 6 Level 3 (11–15) Response discusses the importance of economic constraints when improving degraded environments against other constraints, with contextualisation that shows good knowledge and understanding. Response is broadly evaluative in character, comprising some explanatory or narrative content and a conclusion. Response develops on a largely secure base of knowledge and understanding with the use of example(s). Level 2 (6–10) Response demonstrates some knowledge and understanding of economic constraints on improving degraded environments and other constraints but is unbalanced. Response is mainly descriptive or explanatory in approach and contains a brief or thinly supported evaluation. Responses without the use of example(s) to support the response will not get above the middle of Level 2 (8 marks). Level 1 (1–5) Response makes a few general points about economic or other constraints in relation to improving degraded environments. A descriptive response comprising a few simple points. Knowledge is basic and understanding may be poor and lack relevance to the question set. Level 0 (0) No creditable response. Global interdependence If answering this option, answer Question 7 and either Question 8 or Question 9.
Q7 · Selected trade agreements in Africa in 2020
7 Fig. 7.1 shows selected trade agreements in Africa in 2020. Fig. 7.2 shows the countries of Africa. (a) Describe the distribution of trade agreements shown in Fig. 7.1. [4] (b) Explain two advantages for member countries of trade agreements. [6]
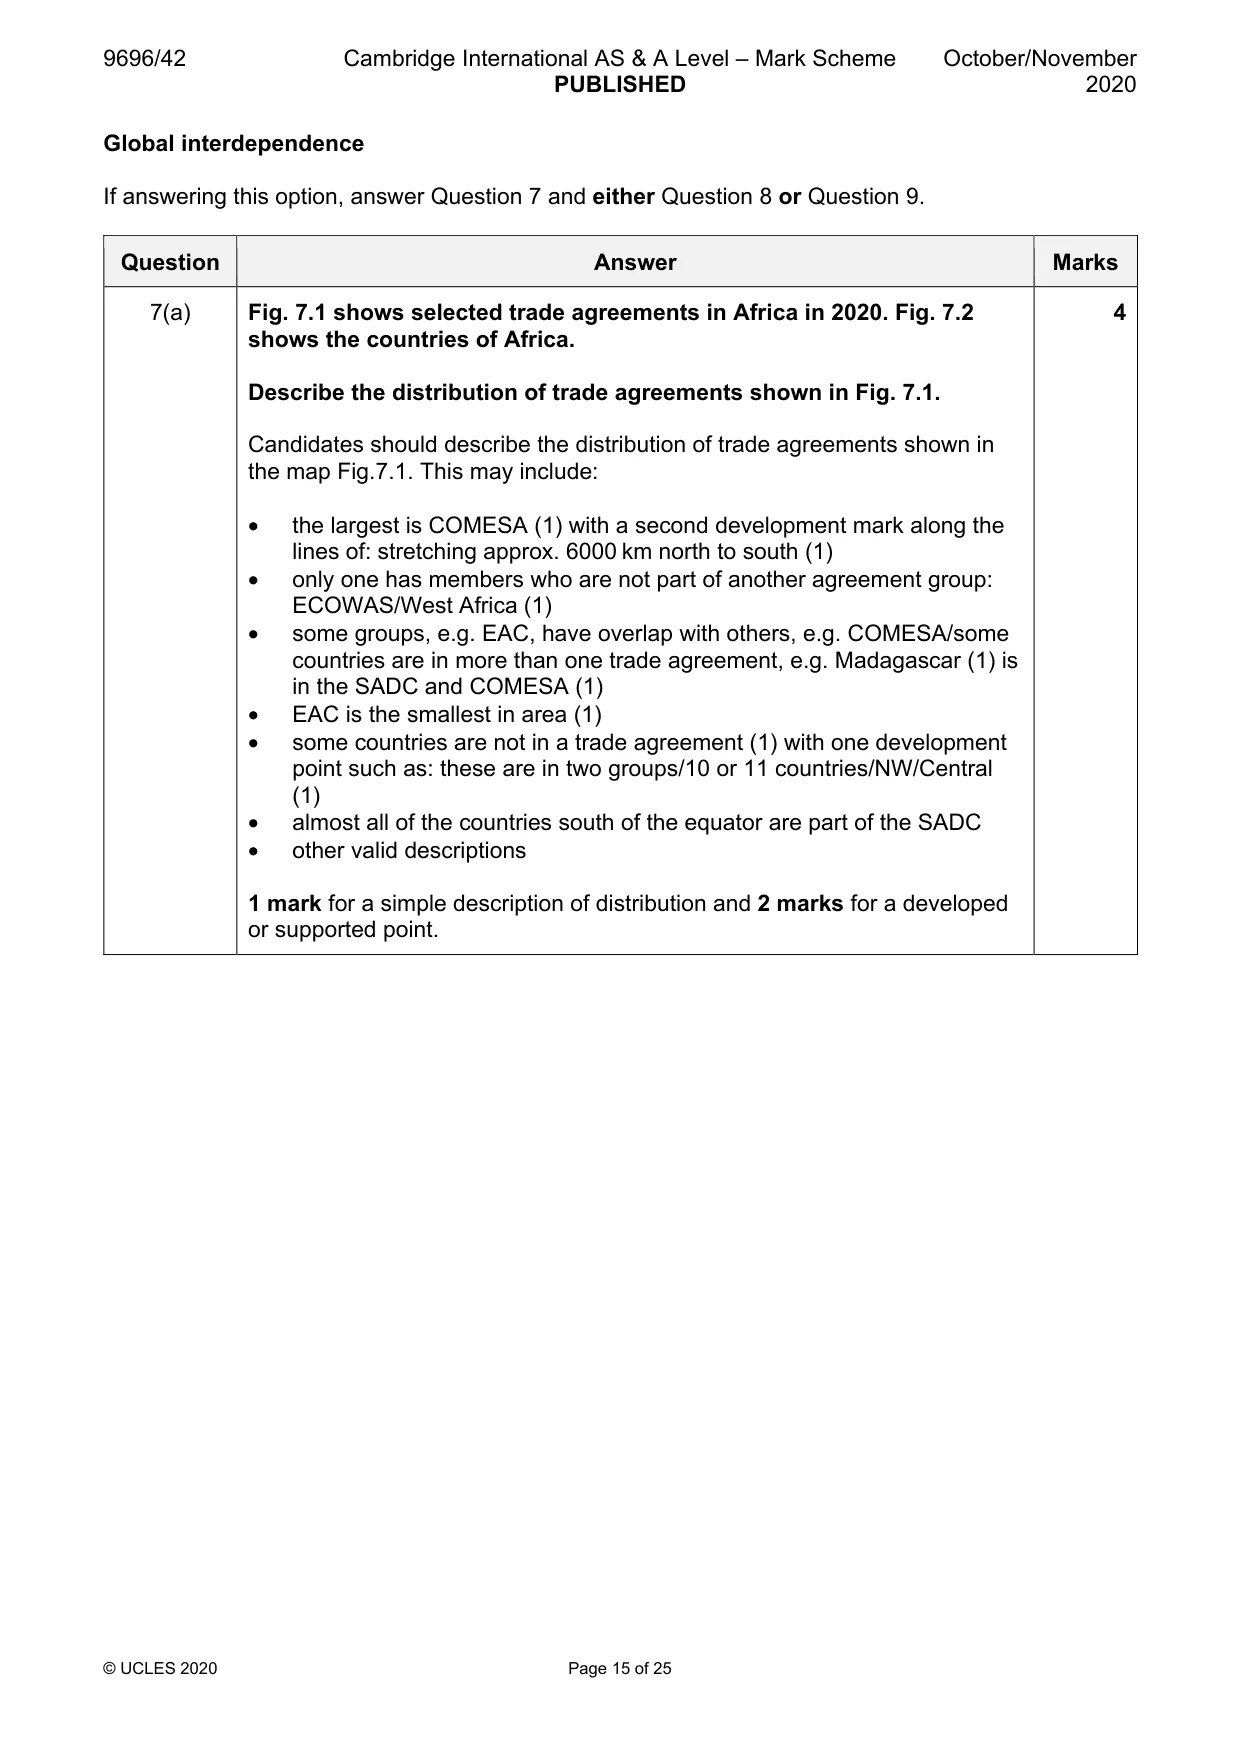
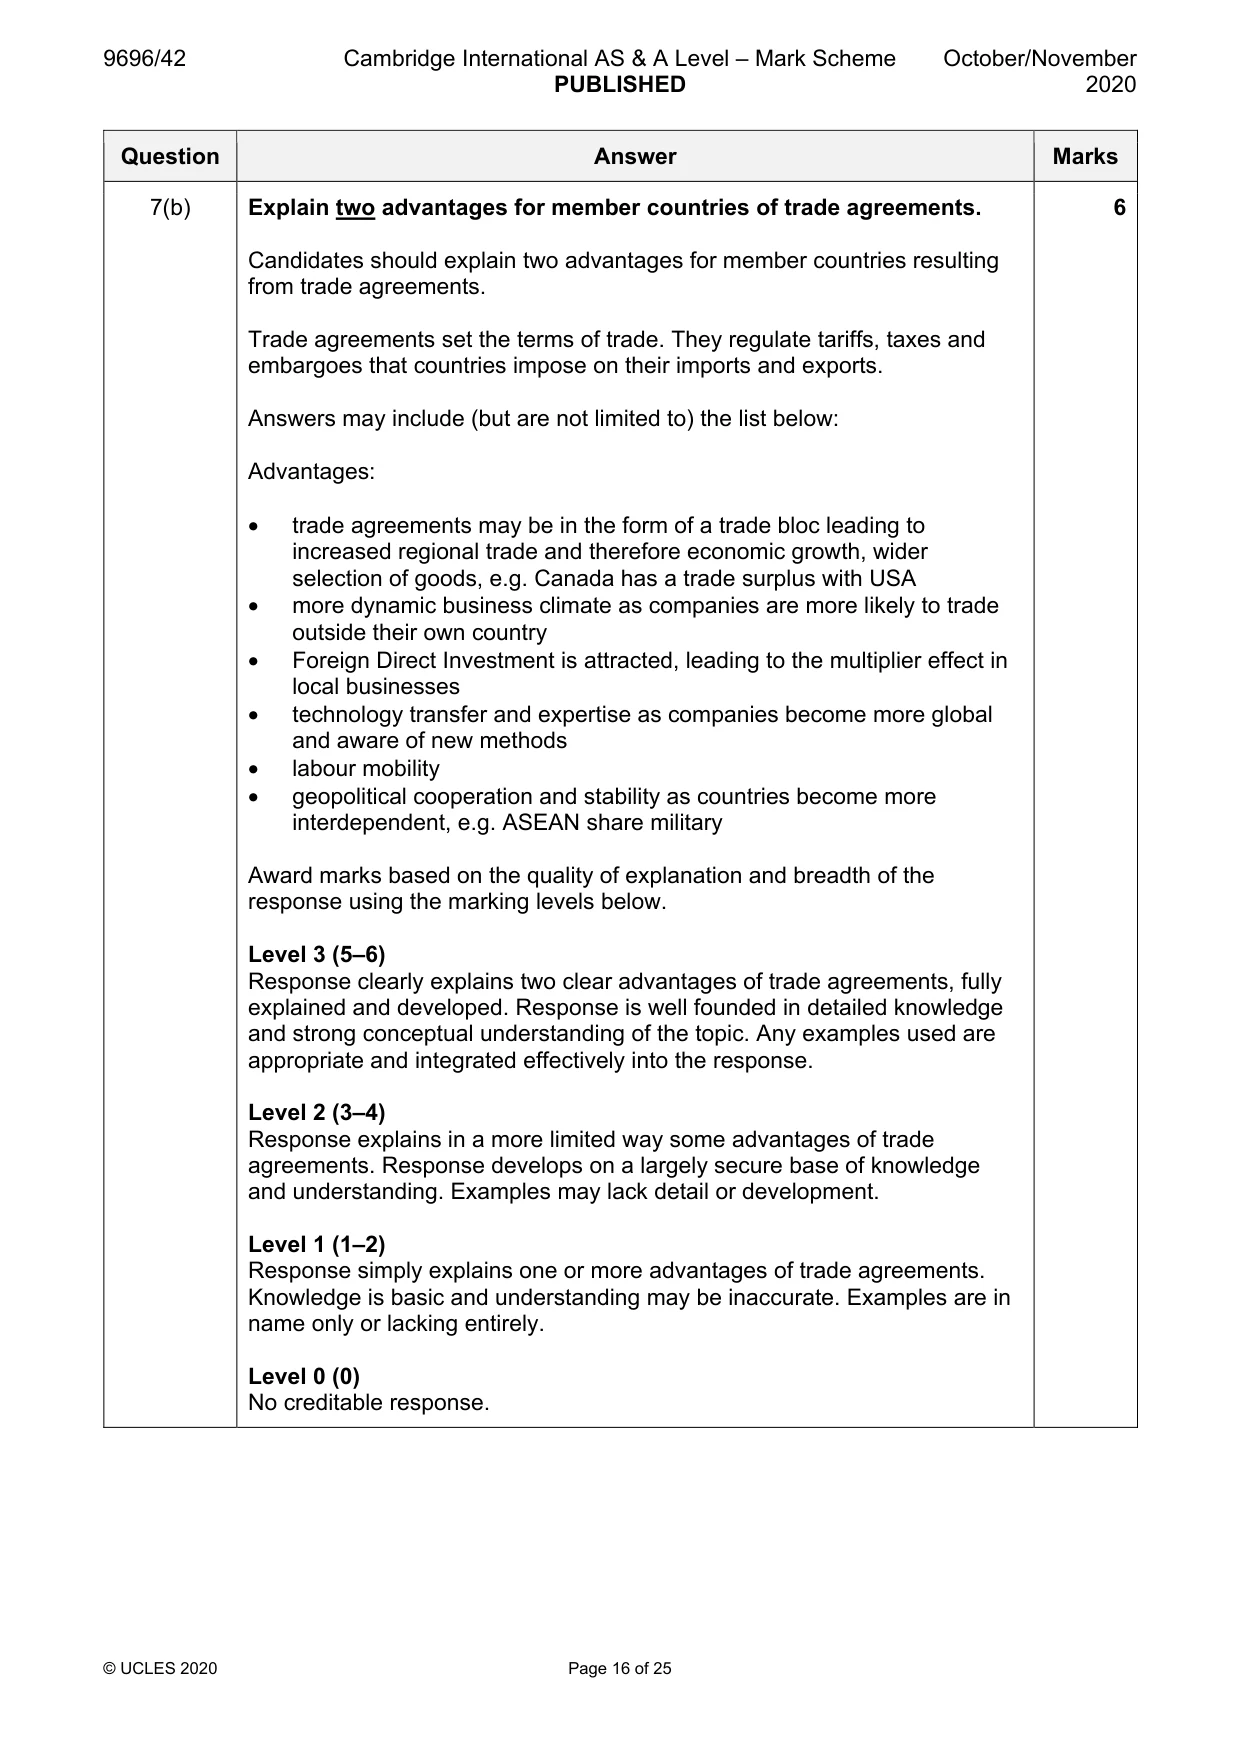
Mark scheme: 7(a) Fig. 7.1 shows selected trade agreements in Africa in 2020. Fig. 7.2 4 shows the countries of Africa. Describe the distribution of trade agreements shown in Fig. 7.1. Candidates should describe the distribution of trade agreements shown in the map Fig.7.1. This may include: • the largest is COMESA (1) with a second development mark along the lines of: stretching approx. 6000 km north to south (1) • only one has members who are not part of another agreement group: ECOWAS/West Africa (1) • some groups, e.g. EAC, have overlap with others, e.g. COMESA/some countries are in more than one trade agreement, e.g. Madagascar (1) is in the SADC and COMESA (1) • EAC is the smallest in area (1) • some countries are not in a trade agreement (1) with one development point such as: these are in two groups/10 or 11 countries/NW/Central (1) • almost all of the countries south of the equator are part of the SADC • other valid descriptions 1 mark for a simple description of distribution and 2 marks for a developed or supported point. 7(b) Explain two advantages for member countries of trade agreements. 6 Candidates should explain two advantages for member countries resulting from trade agreements. Trade agreements set the terms of trade. They regulate tariffs, taxes and embargoes that countries impose on their imports and exports. Answers may include (but are not limited to) the list below: Advantages: • trade agreements may be in the form of a trade bloc leading to increased regional trade and therefore economic growth, wider selection of goods, e.g. Canada has a trade surplus with USA • more dynamic business climate as companies are more likely to trade outside their own country • Foreign Direct Investment is attracted, leading to the multiplier effect in local businesses • technology transfer and expertise as companies become more global and aware of new methods • labour mobility • geopolitical cooperation and stability as countries become more interdependent, e.g. ASEAN share military Award marks based on the quality of explanation and breadth of the response using the marking levels below. Level 3 (5–6) Response clearly explains two clear advantages of trade agreements, fully explained and developed. Response is well founded in detailed knowledge and strong conceptual understanding of the topic. Any examples used are appropriate and integrated effectively into the response. Level 2 (3–4) Response explains in a more limited way some advantages of trade agreements. Response develops on a largely secure base of knowledge and understanding. Examples may lack detail or development. Level 1 (1–2) Response simply explains one or more advantages of trade agreements. Knowledge is basic and understanding may be inaccurate. Examples are in name only or lacking entirely. Level 0 (0) No creditable response.
Q8 · ‘People’s social and economic wellbeing is increased more by development aid than by…
8 ‘People’s social and economic wellbeing is increased more by development aid than by relief aid.’ How far do you agree with this statement? [20]
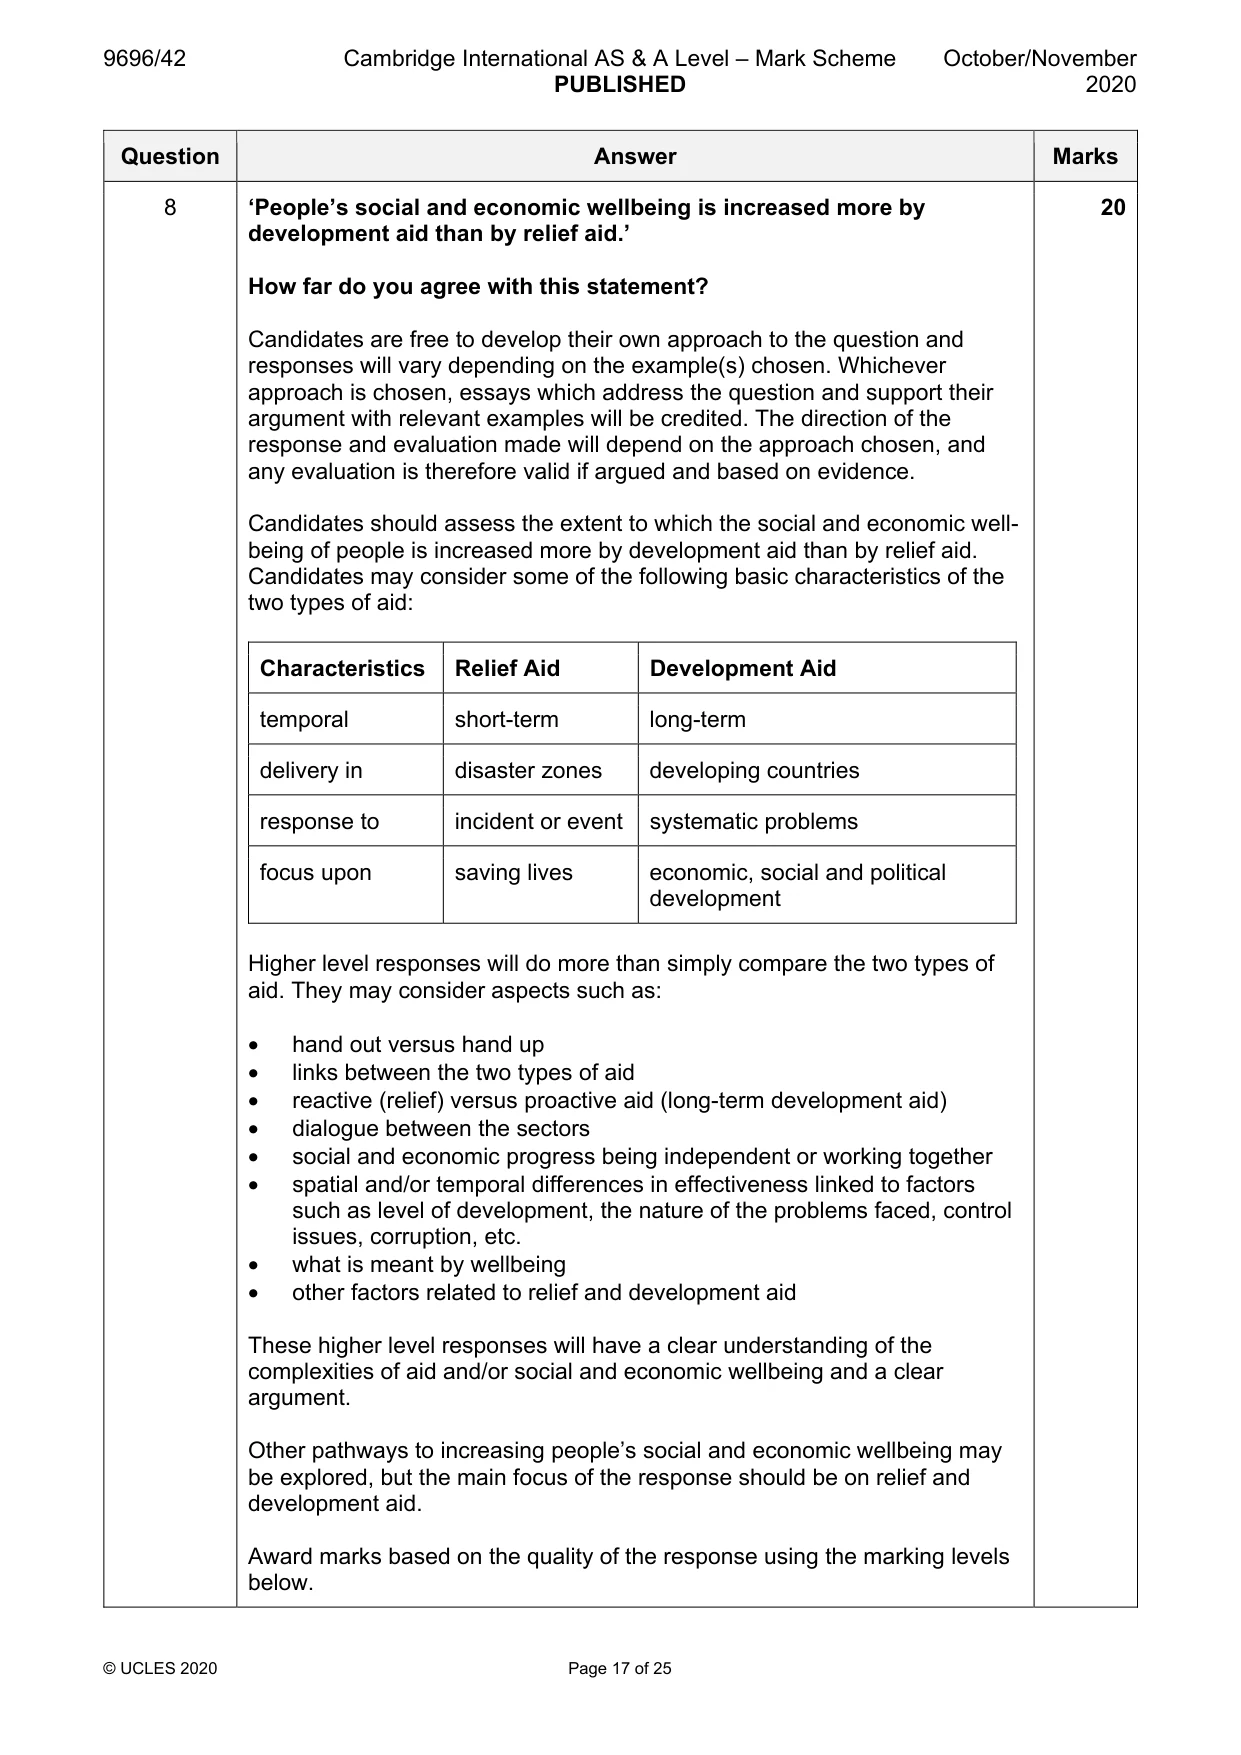
Mark scheme: 8 ‘People’s social and economic wellbeing is increased more by 20 development aid than by relief aid.’ How far do you agree with this statement? Candidates are free to develop their own approach to the question and responses will vary depending on the example(s) chosen. Whichever approach is chosen, essays which address the question and support their argument with relevant examples will be credited. The direction of the response and evaluation made will depend on the approach chosen, and any evaluation is therefore valid if argued and based on evidence. Candidates should assess the extent to which the social and economic well- being of people is increased more by development aid than by relief aid. Candidates may consider some of the following basic characteristics of the two types of aid: Characteristics Relief Aid Development Aid temporal short-term long-term delivery in disaster zones developing countries response to incident or event systematic problems focus upon saving lives economic, social and political development Higher level responses will do more than simply compare the two types of aid. They may consider aspects such as: • hand out versus hand up • links between the two types of aid • reactive (relief) versus proactive aid (long-term development aid) • dialogue between the sectors • social and economic progress being independent or working together • spatial and/or temporal differences in effectiveness linked to factors such as level of development, the nature of the problems faced, control issues, corruption, etc. • what is meant by wellbeing • other factors related to relief and development aid These higher level responses will have a clear understanding of the complexities of aid and/or social and economic wellbeing and a clear argument. Other pathways to increasing people’s social and economic wellbeing may be explored, but the main focus of the response should be on relief and development aid. Award marks based on the quality of the response using the marking levels below. 8 Level 4 (16–20) Response thoroughly discusses how far the candidate agrees that development aid increases people’s social and economic wellbeing more than relief aid. An effective and sustained evaluation with a sound conclusion. Response is well founded in detailed exemplar knowledge and strong conceptual understanding of the topic. Examples used are appropriate and integrated effectively into the response. Level 3 (11–15) Response discusses how far the candidate agrees that development aid increases people’s social and economic wellbeing more than relief aid. Response is broadly evaluative in character, comprising some explanatory or narrative content and a conclusion. Response develops on a largely secure base of knowledge and understanding with the use of example(s). Level 2 (6–10) Response demonstrates some knowledge and understanding of relief and development aid but the discussion is weakly developed. Response is mainly descriptive or explanatory in approach and contains a brief or thinly supported evaluation. Responses without the use of example(s) to support the response will not get above the middle of Level 2 (8 marks). Level 1 (1–5) Response makes a few general points about aid and how it improves wellbeing. A descriptive response comprising a few simple points. Knowledge is basic and understanding may be poor and lack relevance to the question set. Level 0 (0) No creditable response.
Q9 · To what extent have recent developments in different types of tourism caused tourist…
9 To what extent have recent developments in different types of tourism caused tourist destinations to experience decline? [20] Economic transition If answering this option, answer Question 10 and either Question 11 or Question 12.
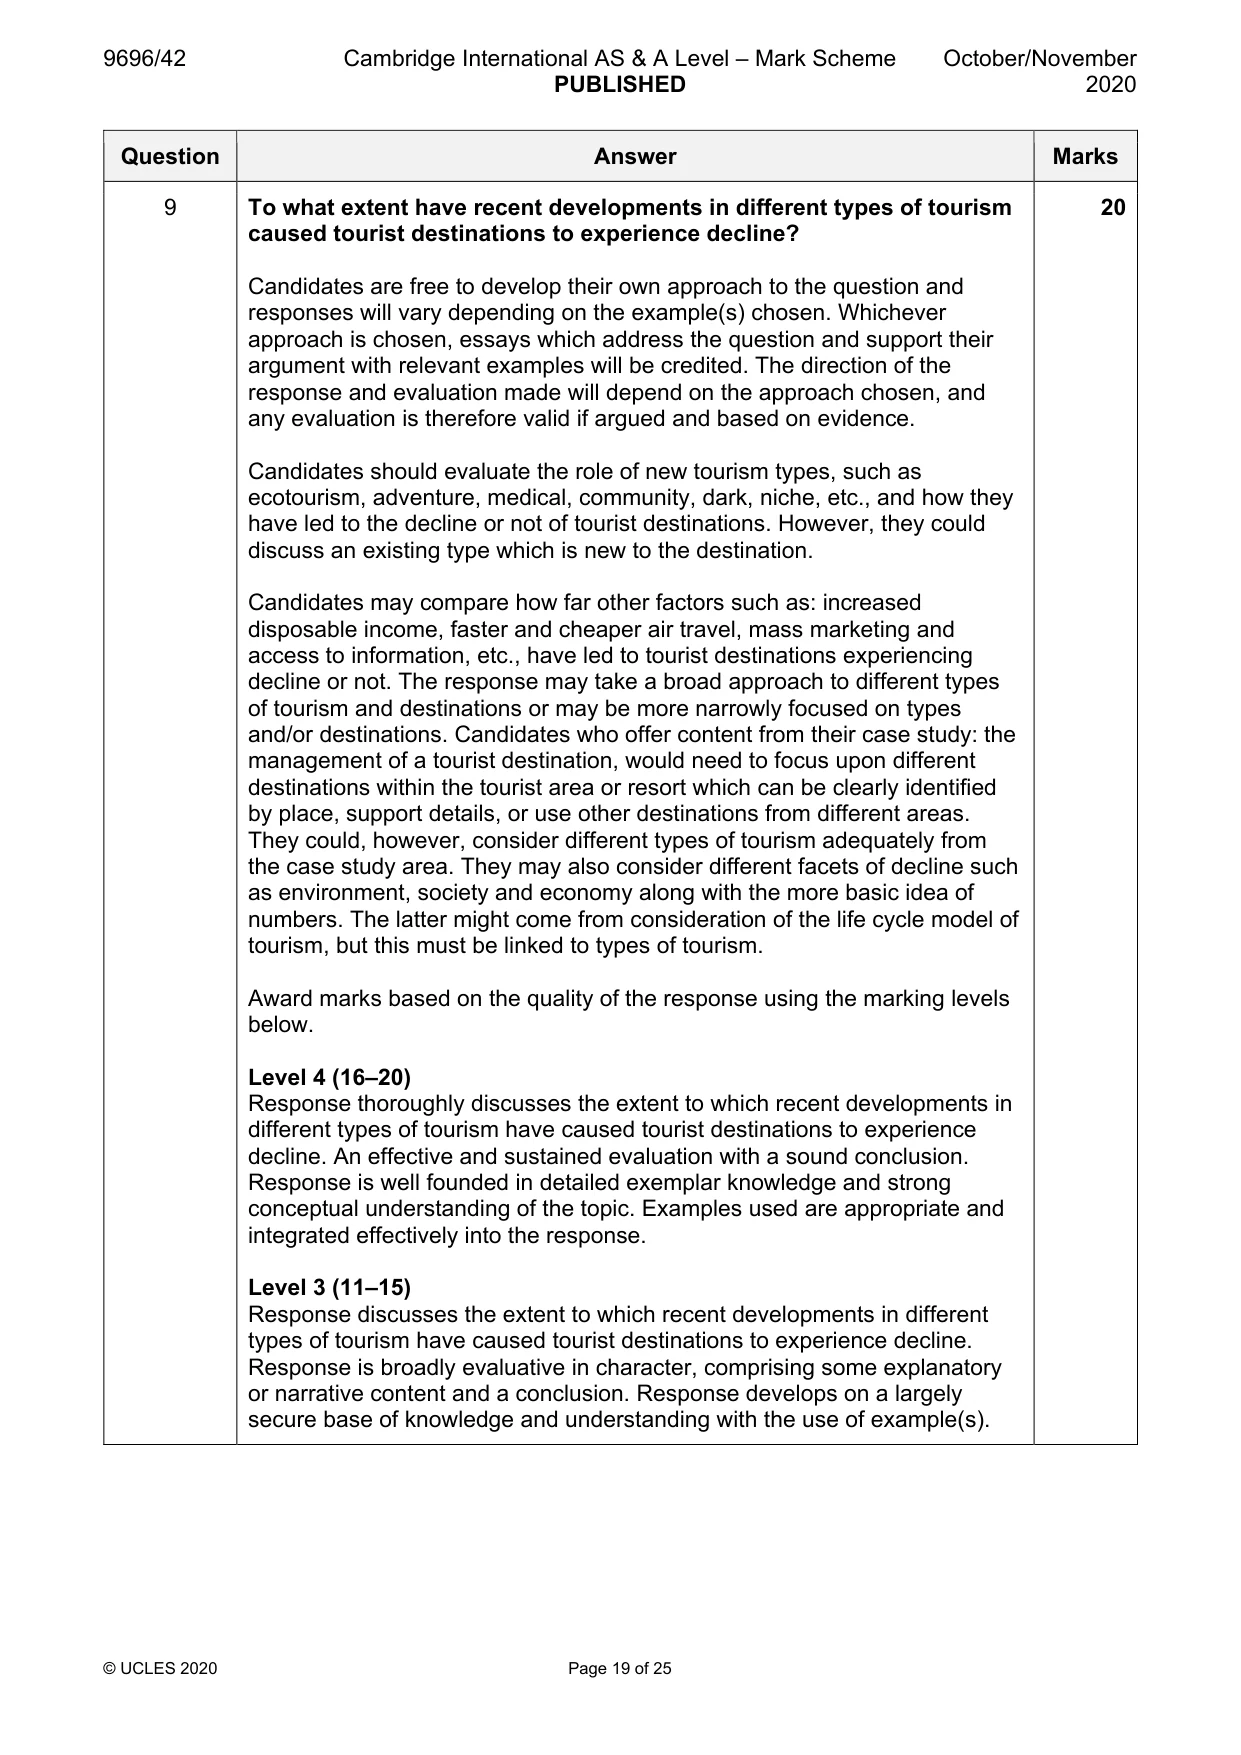
Mark scheme: 9 To what extent have recent developments in different types of tourism 20 caused tourist destinations to experience decline? Candidates are free to develop their own approach to the question and responses will vary depending on the example(s) chosen. Whichever approach is chosen, essays which address the question and support their argument with relevant examples will be credited. The direction of the response and evaluation made will depend on the approach chosen, and any evaluation is therefore valid if argued and based on evidence. Candidates should evaluate the role of new tourism types, such as ecotourism, adventure, medical, community, dark, niche, etc., and how they have led to the decline or not of tourist destinations. However, they could discuss an existing type which is new to the destination. Candidates may compare how far other factors such as: increased disposable income, faster and cheaper air travel, mass marketing and access to information, etc., have led to tourist destinations experiencing decline or not. The response may take a broad approach to different types of tourism and destinations or may be more narrowly focused on types and/or destinations. Candidates who offer content from their case study: the management of a tourist destination, would need to focus upon different destinations within the tourist area or resort which can be clearly identified by place, support details, or use other destinations from different areas. They could, however, consider different types of tourism adequately from the case study area. They may also consider different facets of decline such as environment, society and economy along with the more basic idea of numbers. The latter might come from consideration of the life cycle model of tourism, but this must be linked to types of tourism. Award marks based on the quality of the response using the marking levels below. Level 4 (16–20) Response thoroughly discusses the extent to which recent developments in different types of tourism have caused tourist destinations to experience decline. An effective and sustained evaluation with a sound conclusion. Response is well founded in detailed exemplar knowledge and strong conceptual understanding of the topic. Examples used are appropriate and integrated effectively into the response. Level 3 (11–15) Response discusses the extent to which recent developments in different types of tourism have caused tourist destinations to experience decline. Response is broadly evaluative in character, comprising some explanatory or narrative content and a conclusion. Response develops on a largely secure base of knowledge and understanding with the use of example(s). 9 Level 2 (6–10) Response demonstrates some knowledge and understanding of recent developments in different types of and decline of tourist destinations, but the connection to destinations may not be clearly developed or the response is unbalanced. Response is mainly descriptive or explanatory in approach and contains a brief or thinly supported evaluation. Responses without the use of example(s) to support the response will not get above the middle of Level 2 (8 marks). Level 1 (1–5) Response makes a few general points about types of tourism and how it has led to growth or decline. A descriptive response comprising a few simple points. Knowledge is basic and understanding may be poor and lack relevance to the question set. Level 0 (0) No creditable response. Economic transition If answering this option, answer Question 10 and either Question 11 or Question 12.
Q10 · Hourly pay in manufacturing for selected countries in 1996 and 2016
10 Table 10.1 shows hourly pay in manufacturing for selected countries in 1996 and 2016. (a) Compare the changes in hourly pay in manufacturing shown in Table 10.1. [4] (b) Explain two factors, other than labour cost, that have contributed to the new international division of labour (NIDL). [6]
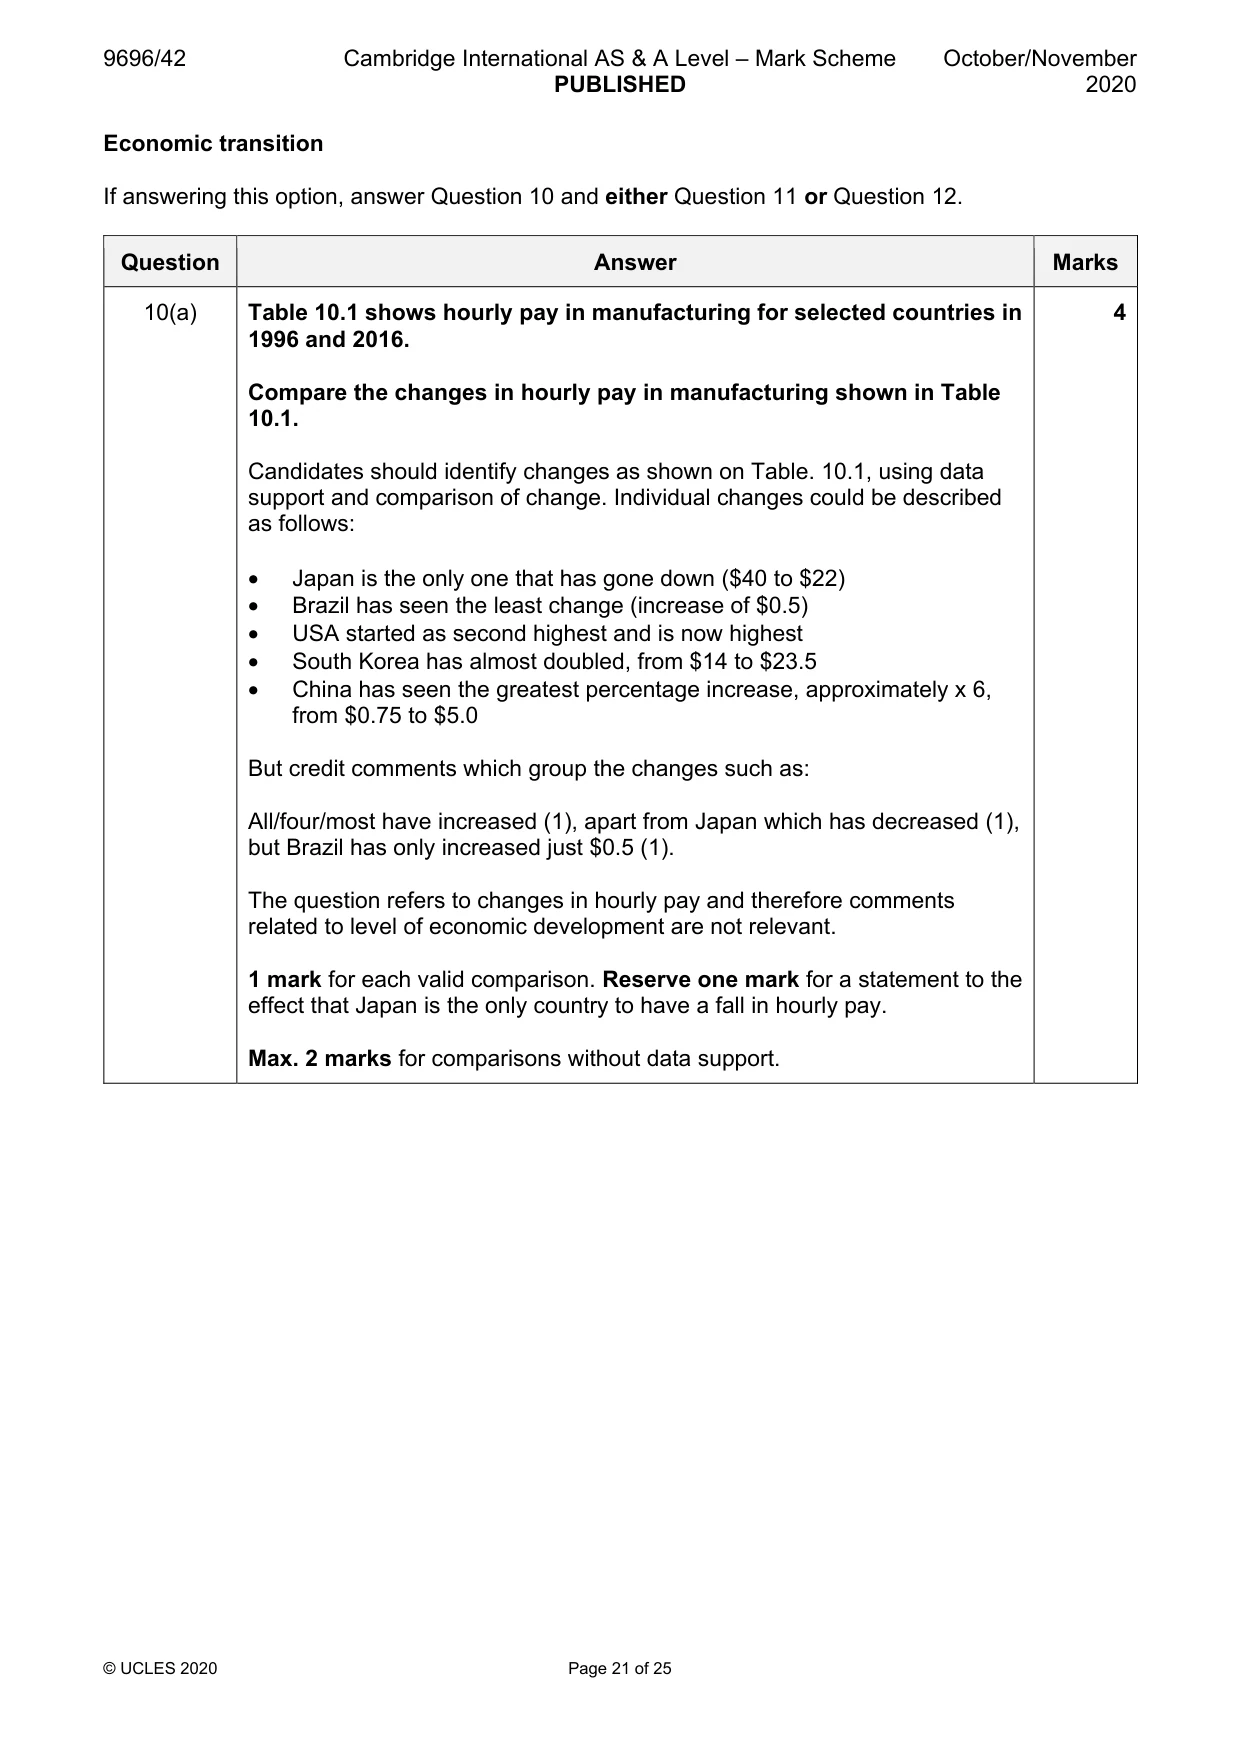
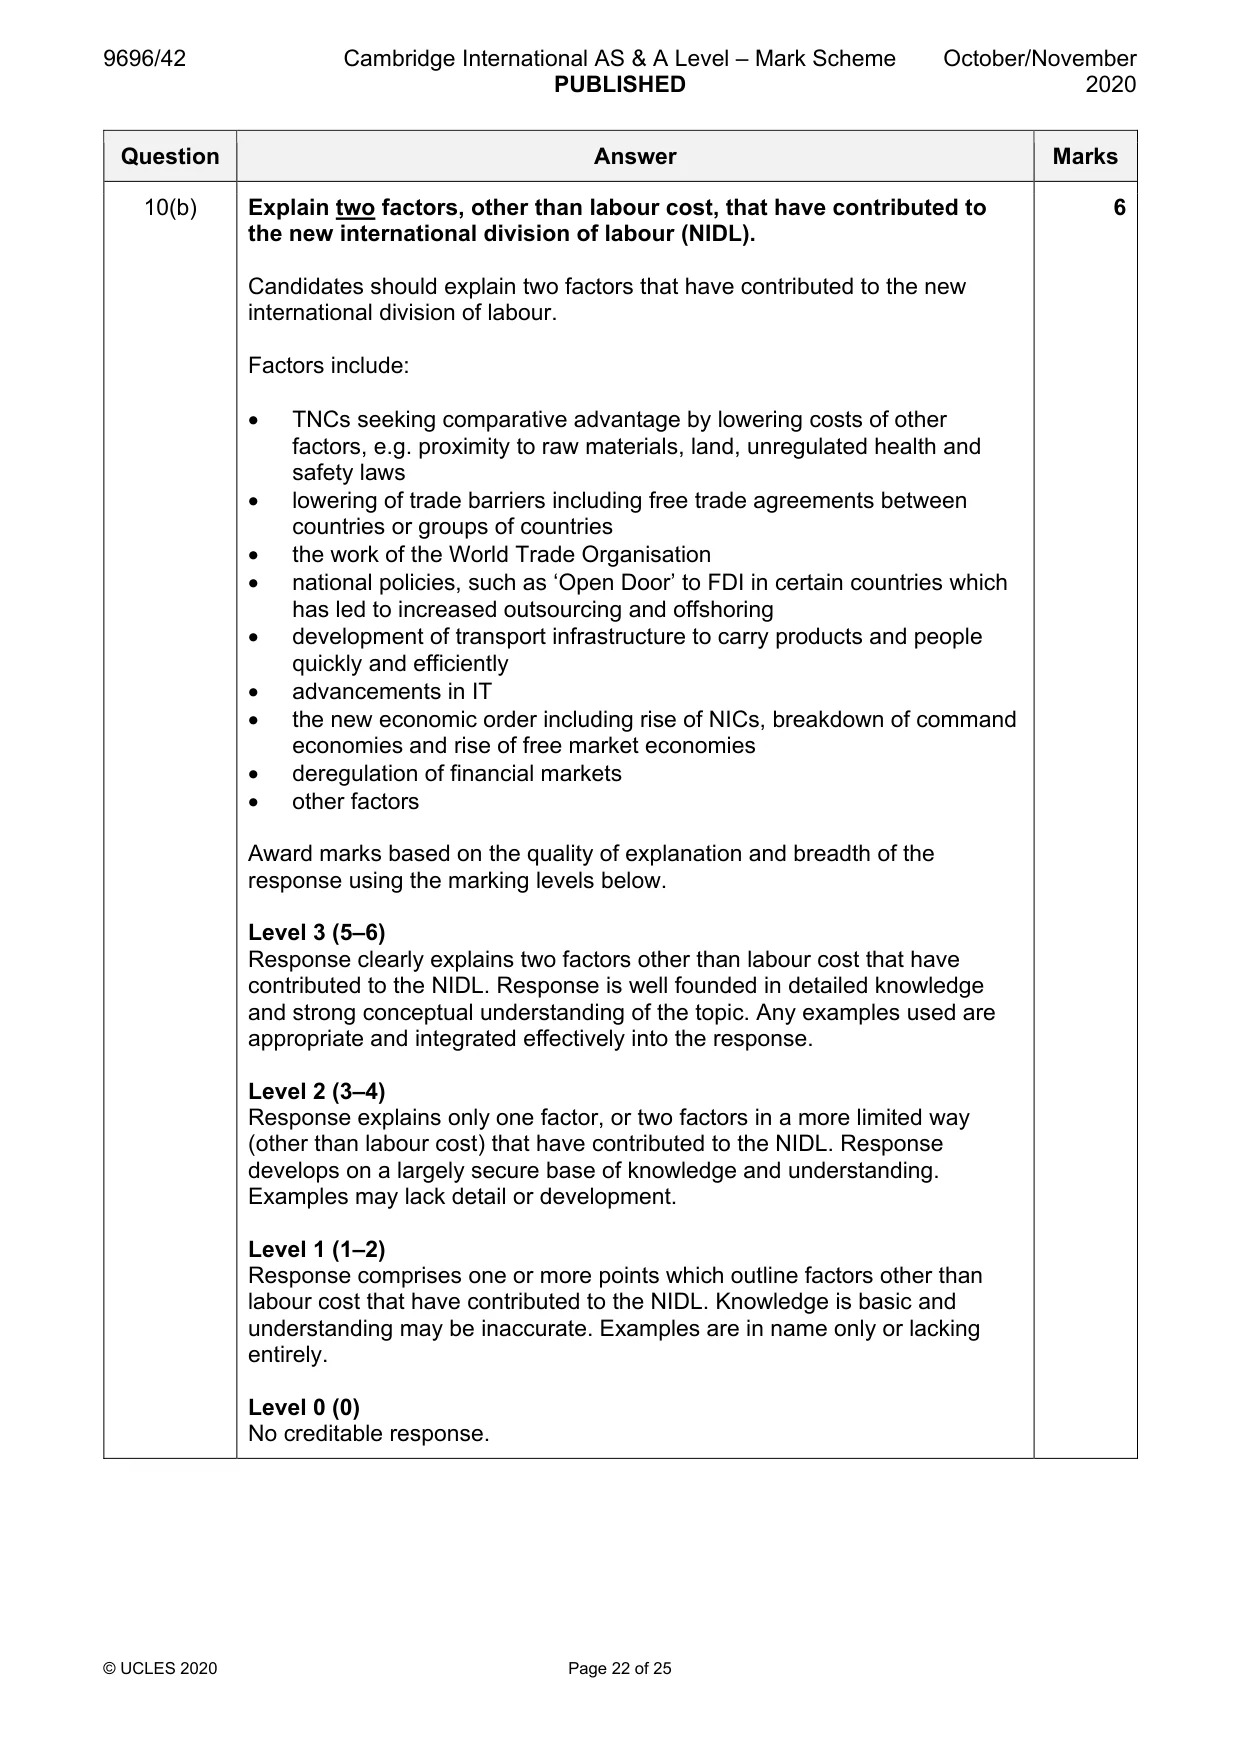
Mark scheme: 10(a) Table 10.1 shows hourly pay in manufacturing for selected countries in 4 1996 and 2016. Compare the changes in hourly pay in manufacturing shown in Table 10.1. Candidates should identify changes as shown on Table. 10.1, using data support and comparison of change. Individual changes could be described as follows: • Japan is the only one that has gone down ($40 to $22) • Brazil has seen the least change (increase of $0.5) • USA started as second highest and is now highest • South Korea has almost doubled, from $14 to $23.5 • China has seen the greatest percentage increase, approximately x 6, from $0.75 to $5.0 But credit comments which group the changes such as: All/four/most have increased (1), apart from Japan which has decreased (1), but Brazil has only increased just $0.5 (1). The question refers to changes in hourly pay and therefore comments related to level of economic development are not relevant. 1 mark for each valid comparison. Reserve one mark for a statement to the effect that Japan is the only country to have a fall in hourly pay. Max. 2 marks for comparisons without data support. 10(b) Explain two factors, other than labour cost, that have contributed to 6 the new international division of labour (NIDL). Candidates should explain two factors that have contributed to the new international division of labour. Factors include: • TNCs seeking comparative advantage by lowering costs of other factors, e.g. proximity to raw materials, land, unregulated health and safety laws • lowering of trade barriers including free trade agreements between countries or groups of countries • the work of the World Trade Organisation • national policies, such as ‘Open Door’ to FDI in certain countries which has led to increased outsourcing and offshoring • development of transport infrastructure to carry products and people quickly and efficiently • advancements in IT • the new economic order including rise of NICs, breakdown of command economies and rise of free market economies • deregulation of financial markets • other factors Award marks based on the quality of explanation and breadth of the response using the marking levels below. Level 3 (5–6) Response clearly explains two factors other than labour cost that have contributed to the NIDL. Response is well founded in detailed knowledge and strong conceptual understanding of the topic. Any examples used are appropriate and integrated effectively into the response. Level 2 (3–4) Response explains only one factor, or two factors in a more limited way (other than labour cost) that have contributed to the NIDL. Response develops on a largely secure base of knowledge and understanding. Examples may lack detail or development. Level 1 (1–2) Response comprises one or more points which outline factors other than labour cost that have contributed to the NIDL. Knowledge is basic and understanding may be inaccurate. Examples are in name only or lacking entirely. Level 0 (0) No creditable response.
Q11 · ‘The positive effects of outsourcing manufacturing are greater than the negative…
11 ‘The positive effects of outsourcing manufacturing are greater than the negative effects.’ With the aid of examples, to what extent do you agree with this statement? [20]
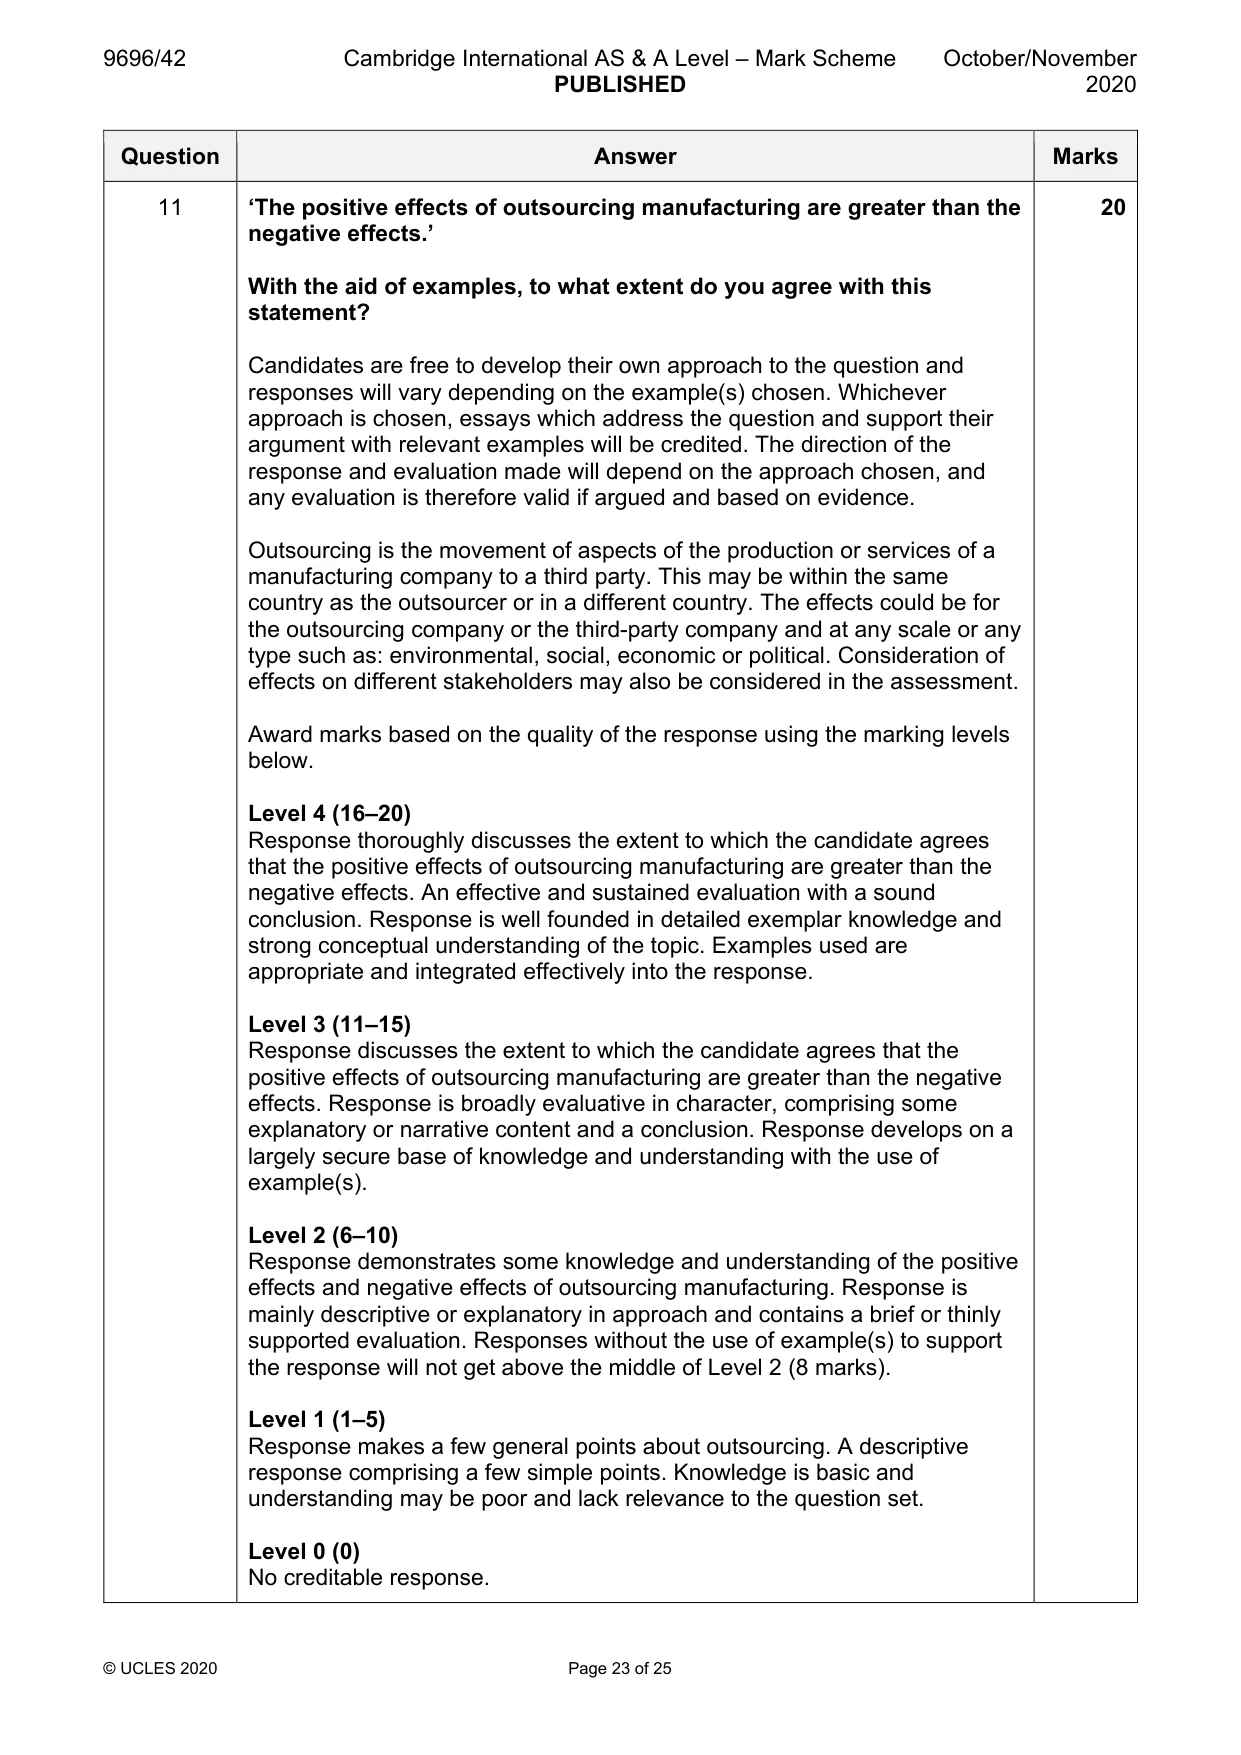
Mark scheme: 11 ‘The positive effects of outsourcing manufacturing are greater than the 20 negative effects.’ With the aid of examples, to what extent do you agree with this statement? Candidates are free to develop their own approach to the question and responses will vary depending on the example(s) chosen. Whichever approach is chosen, essays which address the question and support their argument with relevant examples will be credited. The direction of the response and evaluation made will depend on the approach chosen, and any evaluation is therefore valid if argued and based on evidence. Outsourcing is the movement of aspects of the production or services of a manufacturing company to a third party. This may be within the same country as the outsourcer or in a different country. The effects could be for the outsourcing company or the third-party company and at any scale or any type such as: environmental, social, economic or political. Consideration of effects on different stakeholders may also be considered in the assessment. Award marks based on the quality of the response using the marking levels below. Level 4 (16–20) Response thoroughly discusses the extent to which the candidate agrees that the positive effects of outsourcing manufacturing are greater than the negative effects. An effective and sustained evaluation with a sound conclusion. Response is well founded in detailed exemplar knowledge and strong conceptual understanding of the topic. Examples used are appropriate and integrated effectively into the response. Level 3 (11–15) Response discusses the extent to which the candidate agrees that the positive effects of outsourcing manufacturing are greater than the negative effects. Response is broadly evaluative in character, comprising some explanatory or narrative content and a conclusion. Response develops on a largely secure base of knowledge and understanding with the use of example(s). Level 2 (6–10) Response demonstrates some knowledge and understanding of the positive effects and negative effects of outsourcing manufacturing. Response is mainly descriptive or explanatory in approach and contains a brief or thinly supported evaluation. Responses without the use of example(s) to support the response will not get above the middle of Level 2 (8 marks). Level 1 (1–5) Response makes a few general points about outsourcing. A descriptive response comprising a few simple points. Knowledge is basic and understanding may be poor and lack relevance to the question set. Level 0 (0) No creditable response.
Q12 · Assess why some attempts to overcome regional disparities are more successful than others
12 Assess why some attempts to overcome regional disparities are more successful than others. [20]
Mark scheme: 12 Assess why some attempts to overcome regional disparities are more 20 successful than others. Candidates are free to develop their own approach to the question and responses will vary depending on the example(s) chosen. Whichever approach is chosen, essays which address the question and support their argument with relevant examples will be credited. The direction of the response and evaluation made will depend on the approach chosen, and any evaluation is therefore valid if argued and based on evidence. Candidates should assess why some attempts to overcome regional disparities are more successful than others. Attempts to overcome regional disparities may focus on raising the level of social and economic wellbeing in lagging regions through attempts based on financial resource transfer, area focused developments, incentives for promoting investment, etc. Alternatively, responses might focus on limiting growth of core regions or the transfer of activity from core to periphery regions. Some national policies such as development of the national economy and/or society in general may have an overall aim to raise social and economic wellbeing and therefore a regional element, and candidates who make this clear should be credited. Candidates may use their case study: the management of regional development, since it should contain attempts and an evaluation of the success or not of these attempts. They may add to this case study or develop a response on more than one country, or they may synthesise through a consideration of types of attempt and/or what makes some attempts more successful than others. Success may be considered from a variety of perspectives and at a variety of scales. Possible reasons for success may include stable government and policy making, openness to FDI, cultural understanding, high investment in education, sustainable planning, etc. Lack of success may include corruption, natural hazards, lack of monitoring/maintenance of projects, etc. Reference to the theoretical background such as core periphery, cumulative causation, spread and backwash may be introduced into the assessment. Additionally, candidates may evaluate the difficulties faced in trying to overcome the disparities as reasons for more success of some attempts compared to others. Award marks based on the quality of the response using the marking levels below. Level 4 (16–20) Response thoroughly discusses why some attempts to overcome regional disparities are more successful than others. An effective and sustained evaluation with a sound conclusion. Response is well founded in detailed exemplar knowledge and strong conceptual understanding of the topic. Examples used are appropriate and integrated effectively into the response. Level 3 (11–15) Response discusses why some attempts to overcome regional disparities are more successful than others with comment on relative success. Response is broadly evaluative in character, comprising some explanatory or narrative content and a conclusion. Response develops on a largely secure base of knowledge and understanding with the use of example(s). 12 Level 2 (6–10) Response demonstrates some knowledge and understanding of attempts to overcome regional disparity, which may contain basic comment on success and/or failure of the policy. Response is mainly descriptive or explanatory in approach and should contain a brief or thinly supported evaluation. Responses without the use of example(s) to support the response will not get above the middle of Level 2 (8 marks). Level 1 (1–5) Response makes a few general points about regional disparity. A descriptive response comprising a few simple points. Knowledge is basic and understanding may be poor and lack relevance to the question set. Level 0 (0) No creditable response.
What was in this paper
The subtopics covered by these 12 questions, and how many questions each got. Open one in a new tab to see every Cambridge question on it.
2Environmental degradation1International debt and international aid1The globalisation of economic activity1The management of a degraded environment1The management of a tourist destination1The management of agricultural change1The management of change in manufacturing industry1The management of energy supply1The management of regional development1Trade flows and trading patterns1What you needed in this session
Cambridge’s own grade thresholds for 2020 Oct/Nov, Paper 4 · Variant 2. A higher threshold means an easier paper — the bar moves with how the cohort did.