Cambridge A Level Geography 9696 — 2018 Oct/Nov Paper 2 · Variant 3
9696/23/O/N/18 · 6 questions · 60 marks · ≈68 min
The question paper and its mark scheme, free to read here and free to download. This is Cambridge’s own paper, exactly as it was sat.
Question paper4 pages
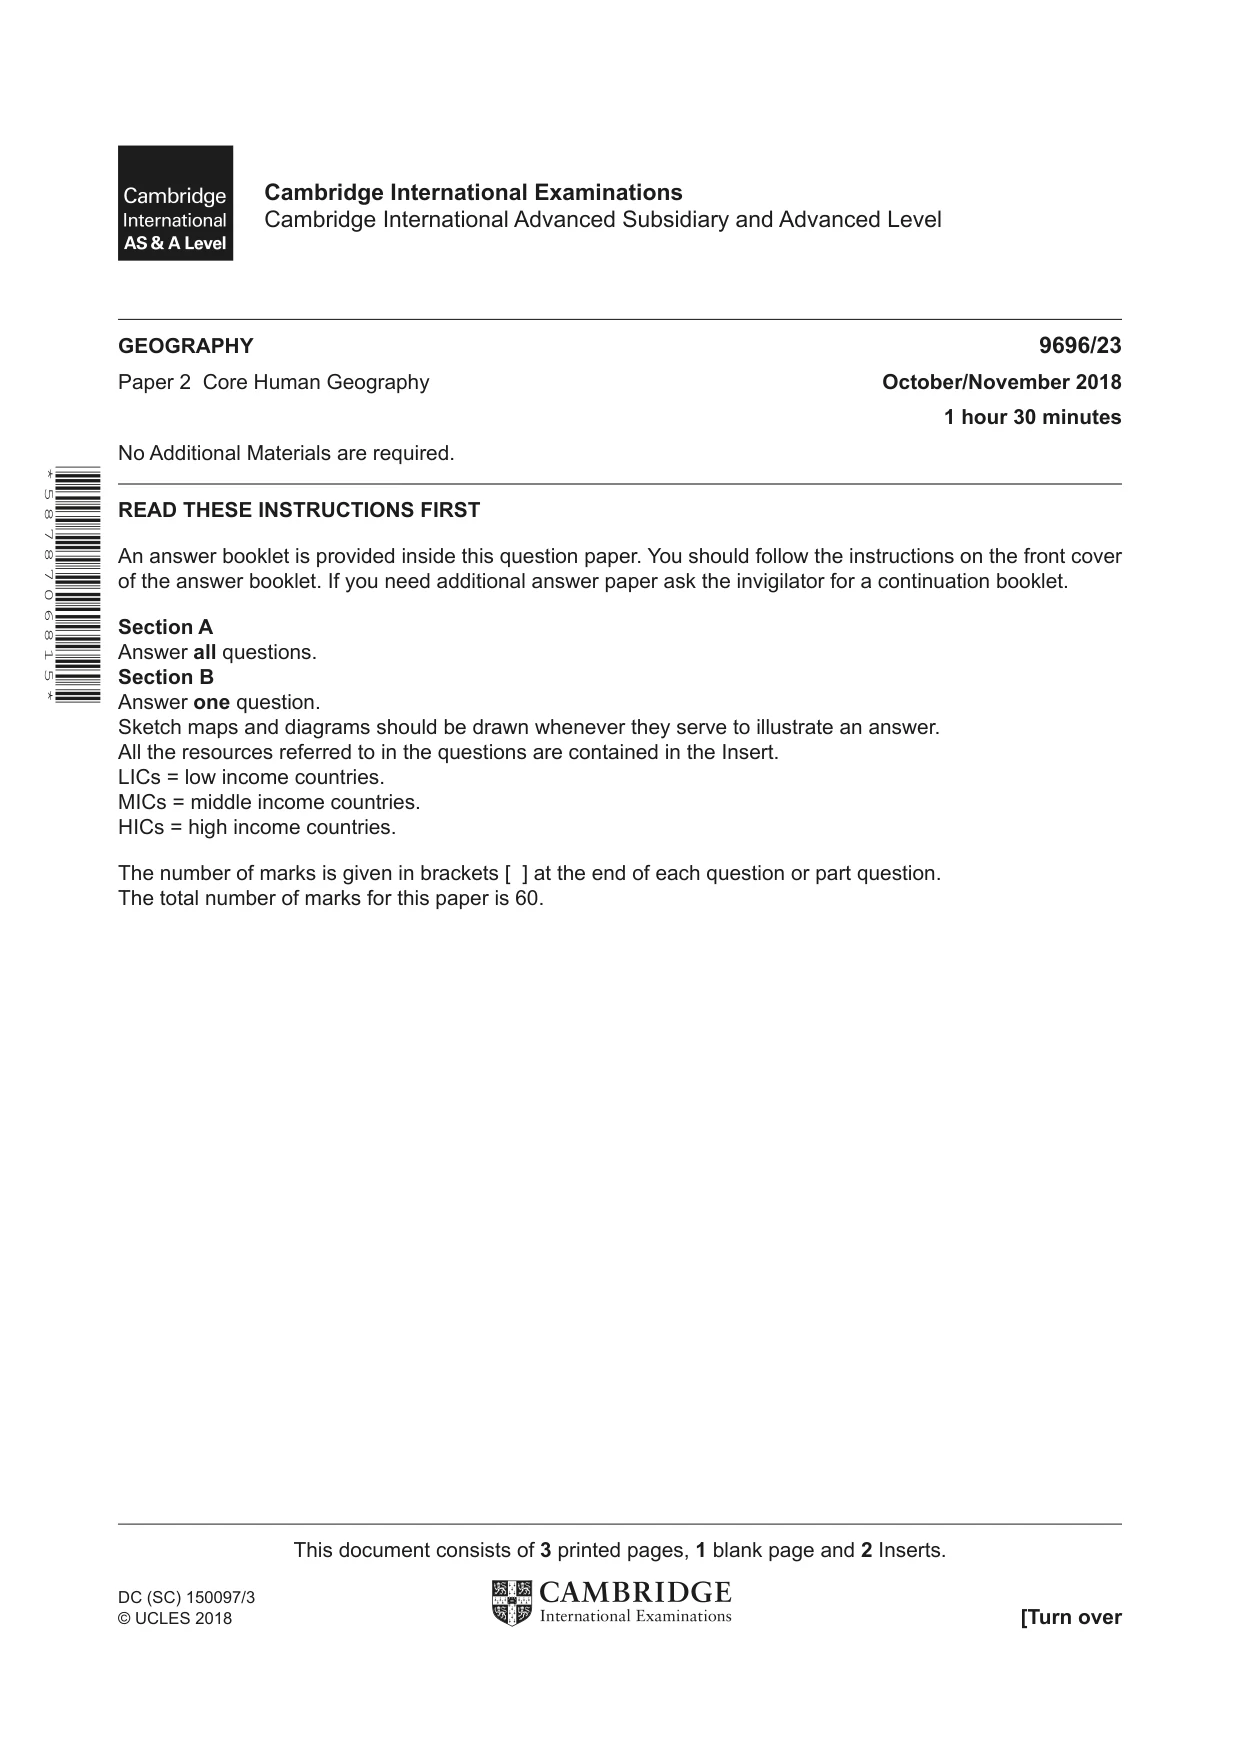
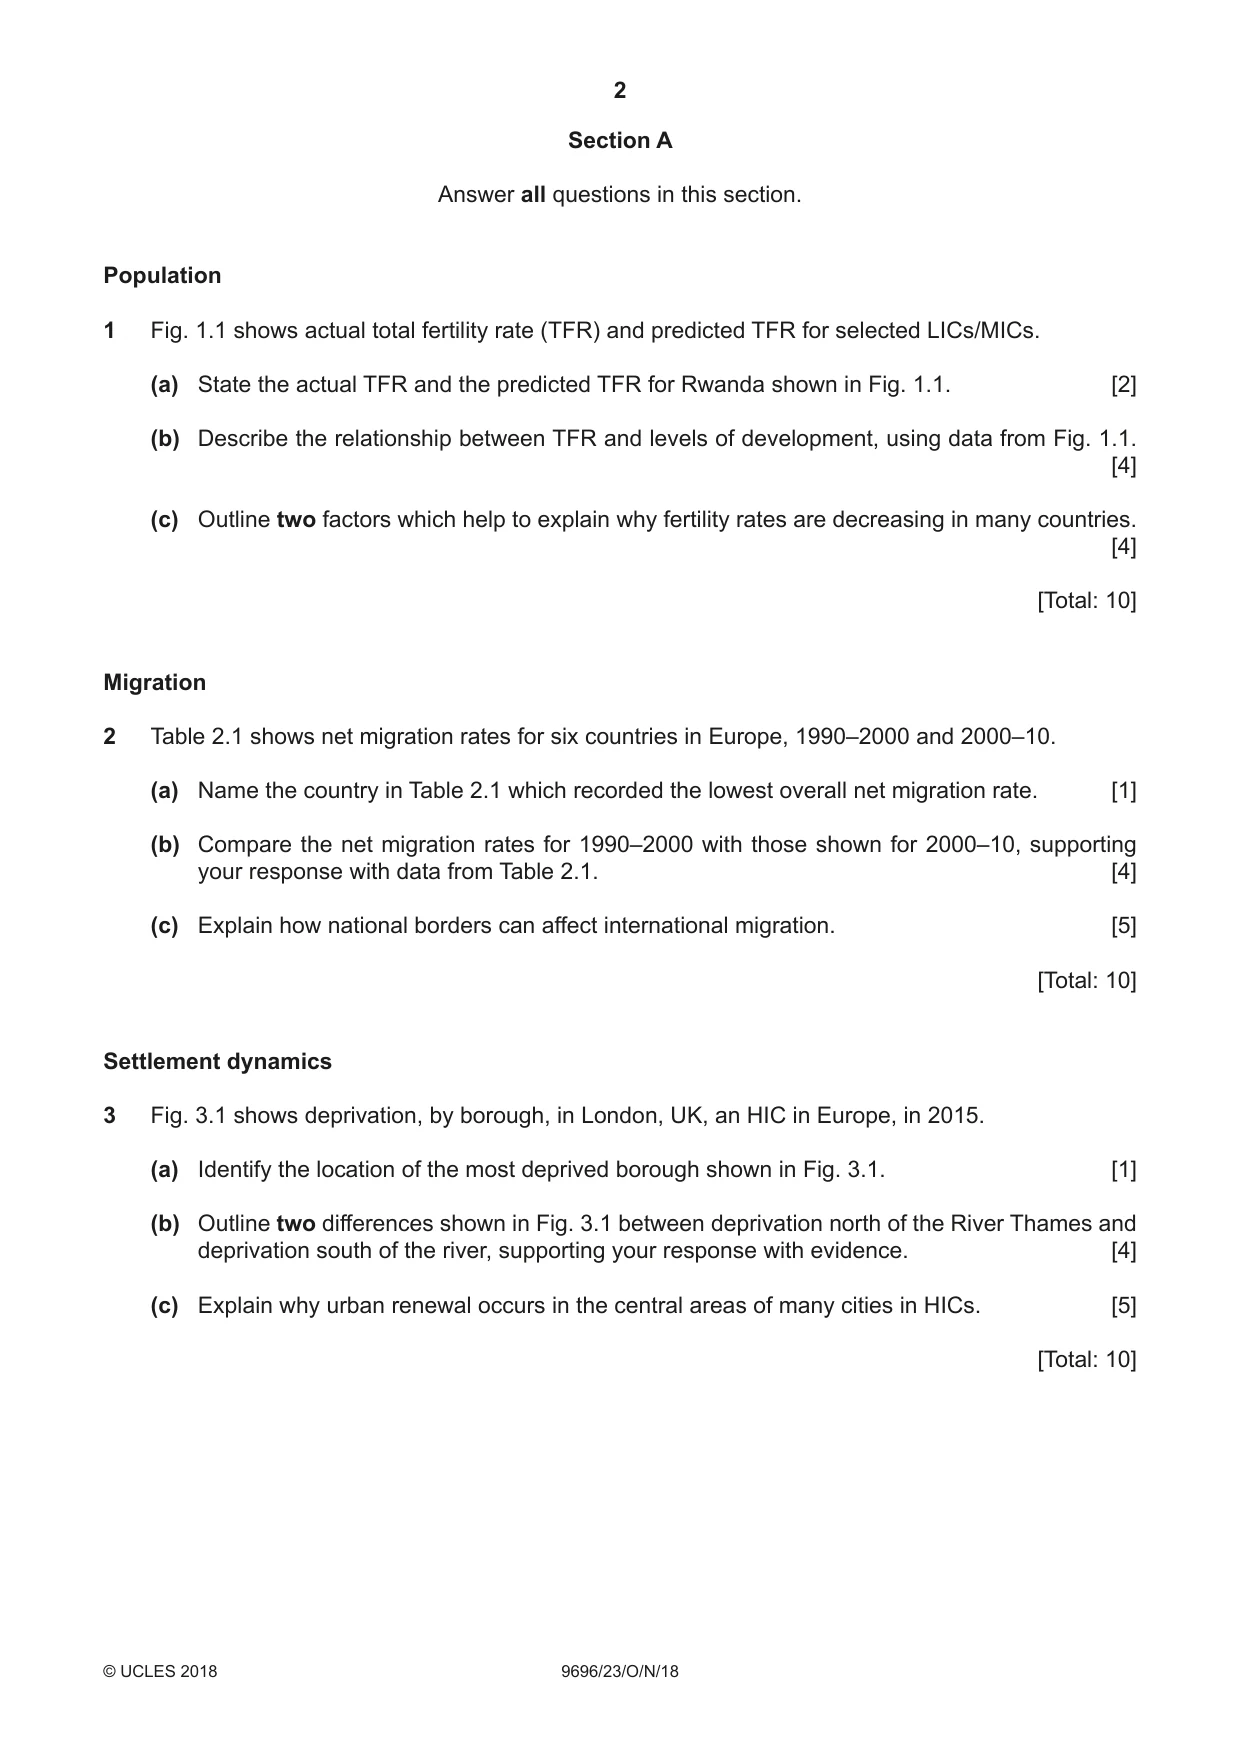
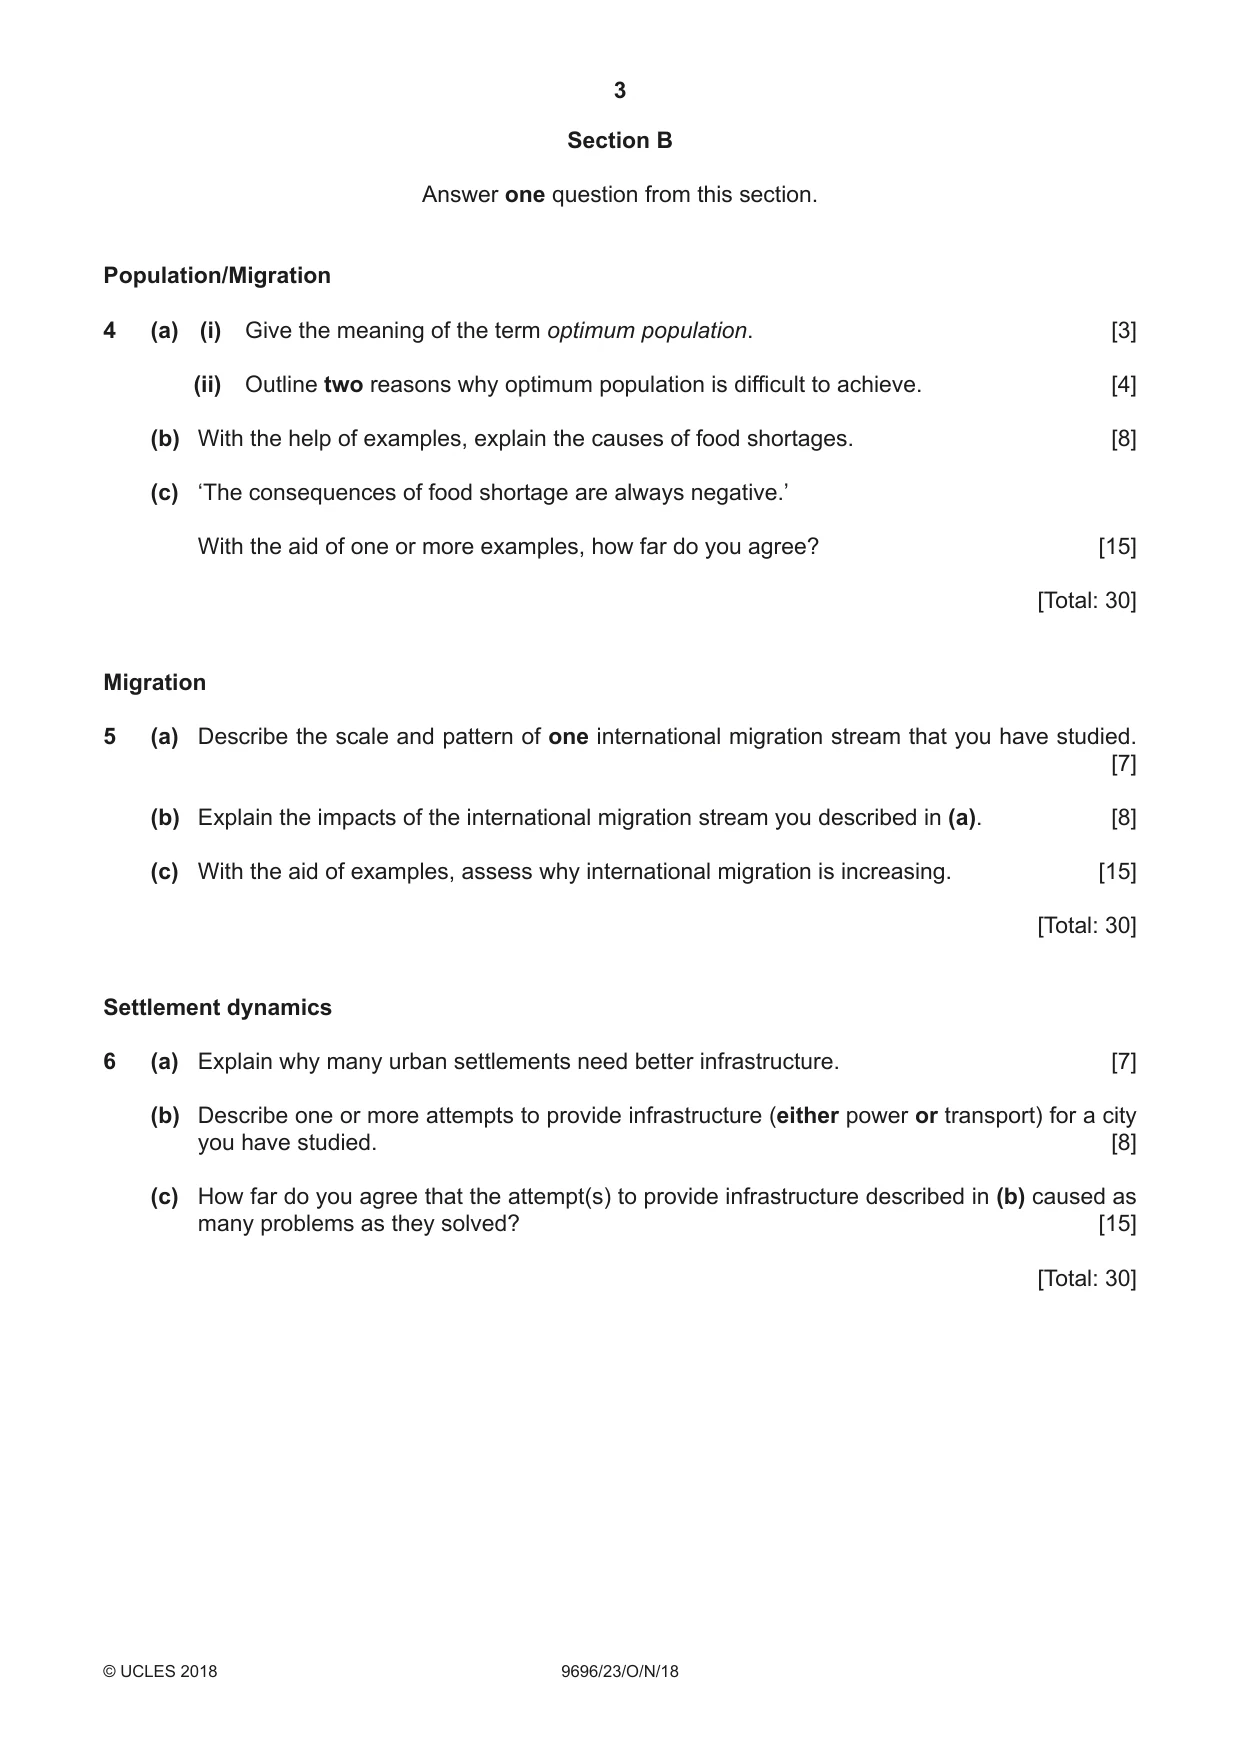

Mark scheme15 pages
Answers below. Sit the paper first if you are practising.

Questions as text
Q1 · Actual total fertility rate (TFR) and predicted TFR for selected LICs/MICs
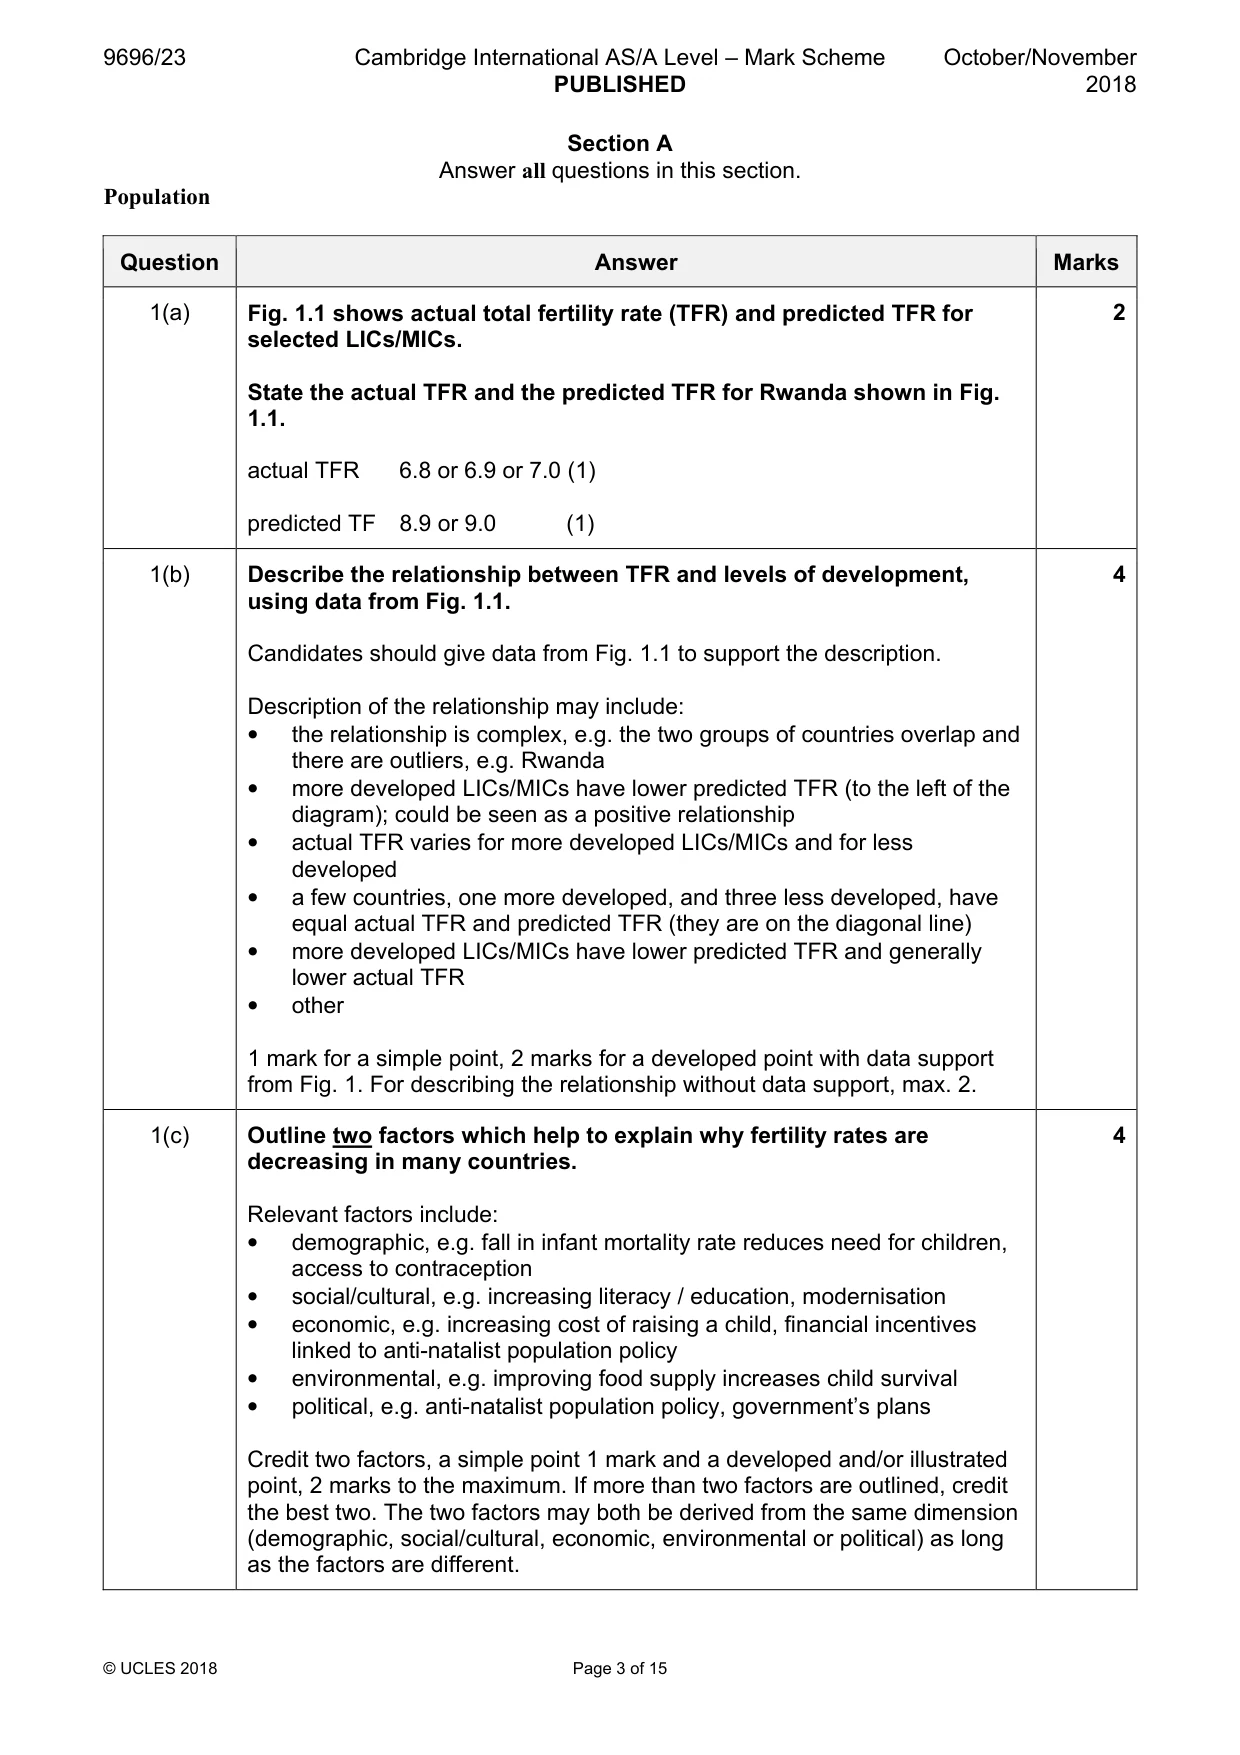
1 Fig. 1.1 shows actual total fertility rate (TFR) and predicted TFR for selected LICs/MICs. (a) State the actual TFR and the predicted TFR for Rwanda shown in Fig. 1.1. [2] (b) Describe the relationship between TFR and levels of development, using data from Fig. 1.1. [4] (c) Outline two factors which help to explain why fertility rates are decreasing in many countries. [4] [Total: 10] Migration
Mark scheme: Question Answer Marks 1(a) Fig. 1.1 shows actual total fertility rate (TFR) and predicted TFR for 2 selected LICs/MICs. State the actual TFR and the predicted TFR for Rwanda shown in Fig. 1.1. actual TFR 6.8 or 6.9 or 7.0 (1) predicted TF 8.9 or 9.0 (1) 1(b) Describe the relationship between TFR and levels of development, 4 using data from Fig. 1.1. Candidates should give data from Fig. 1.1 to support the description. Description of the relationship may include: • the relationship is complex, e.g. the two groups of countries overlap and there are outliers, e.g. Rwanda • more developed LICs/MICs have lower predicted TFR (to the left of the diagram); could be seen as a positive relationship • actual TFR varies for more developed LICs/MICs and for less developed • a few countries, one more developed, and three less developed, have equal actual TFR and predicted TFR (they are on the diagonal line) • more developed LICs/MICs have lower predicted TFR and generally lower actual TFR • other 1 mark for a simple point, 2 marks for a developed point with data support from Fig. 1. For describing the relationship without data support, max. 2. 1(c) Outline two factors which help to explain why fertility rates are 4 decreasing in many countries. Relevant factors include: • demographic, e.g. fall in infant mortality rate reduces need for children, access to contraception • social/cultural, e.g. increasing literacy / education, modernisation • economic, e.g. increasing cost of raising a child, financial incentives linked to anti-natalist population policy • environmental, e.g. improving food supply increases child survival • political, e.g. anti-natalist population policy, government’s plans Credit two factors, a simple point 1 mark and a developed and/or illustrated point, 2 marks to the maximum. If more than two factors are outlined, credit the best two. The two factors may both be derived from the same dimension (demographic, social/cultural, economic, environmental or political) as long as the factors are different. Migration
Q2 · Net migration rates for six countries in Europe, 1990–2000 and 2000–10
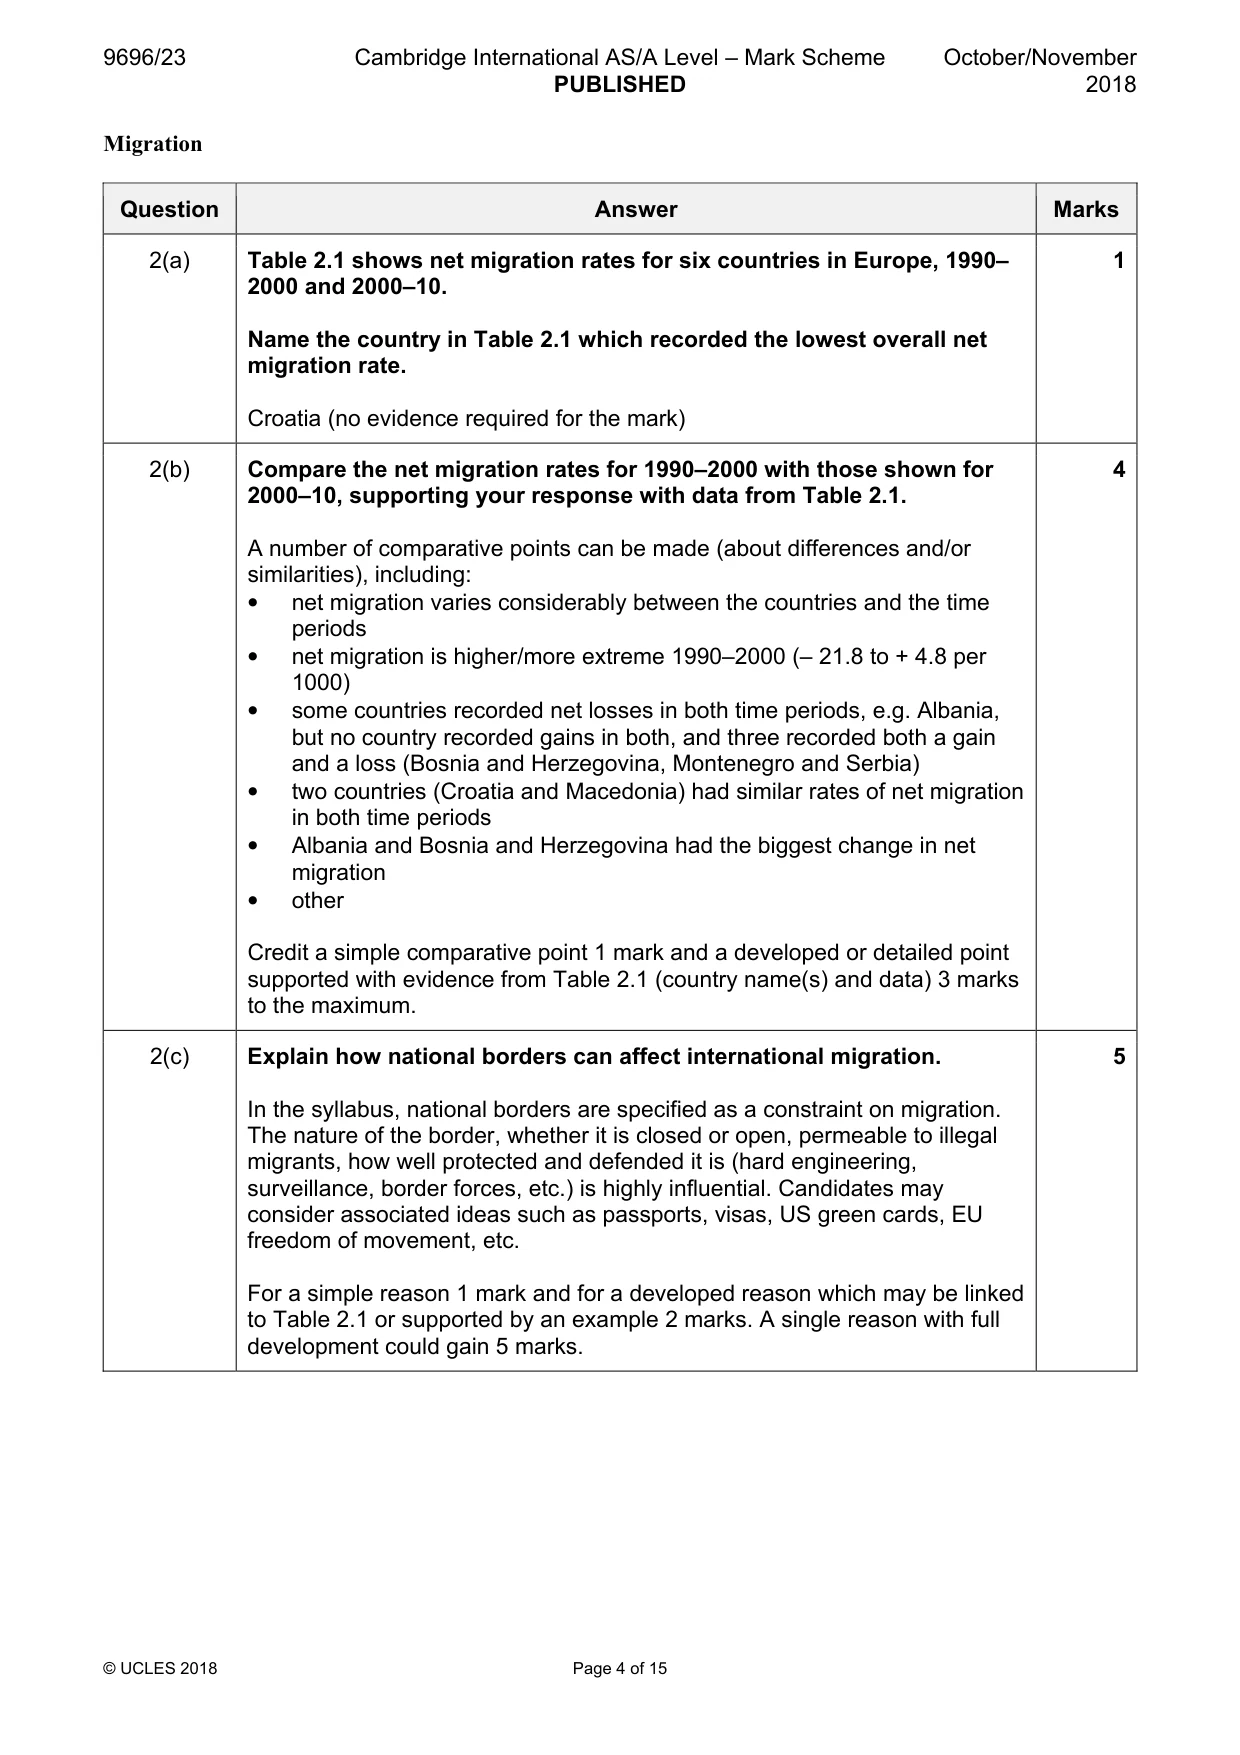
2 Table 2.1 shows net migration rates for six countries in Europe, 1990–2000 and 2000–10. (a) Name the country in Table 2.1 which recorded the lowest overall net migration rate. [1] (b) Compare the net migration rates for 1990–2000 with those shown for 2000–10, supporting your response with data from Table 2.1. [4] (c) Explain how national borders can affect international migration. [5] [Total: 10] Settlement dynamics
Mark scheme: 2(a) Table 2.1 shows net migration rates for six countries in Europe, 1990– 1 2000 and 2000–10. Name the country in Table 2.1 which recorded the lowest overall net migration rate. Croatia (no evidence required for the mark) 2(b) Compare the net migration rates for 1990–2000 with those shown for 4 2000–10, supporting your response with data from Table 2.1. A number of comparative points can be made (about differences and/or similarities), including: • net migration varies considerably between the countries and the time periods • net migration is higher/more extreme 1990–2000 (– 21.8 to + 4.8 per 1000) • some countries recorded net losses in both time periods, e.g. Albania, but no country recorded gains in both, and three recorded both a gain and a loss (Bosnia and Herzegovina, Montenegro and Serbia) • two countries (Croatia and Macedonia) had similar rates of net migration in both time periods • Albania and Bosnia and Herzegovina had the biggest change in net migration • other Credit a simple comparative point 1 mark and a developed or detailed point supported with evidence from Table 2.1 (country name(s) and data) 3 marks to the maximum. 2(c) Explain how national borders can affect international migration. 5 In the syllabus, national borders are specified as a constraint on migration. The nature of the border, whether it is closed or open, permeable to illegal migrants, how well protected and defended it is (hard engineering, surveillance, border forces, etc.) is highly influential. Candidates may consider associated ideas such as passports, visas, US green cards, EU freedom of movement, etc. For a simple reason 1 mark and for a developed reason which may be linked to Table 2.1 or supported by an example 2 marks. A single reason with full development could gain 5 marks. Settlement dynamics
Q3 · Deprivation, by borough, in London, UK, an HIC in Europe, in 2015
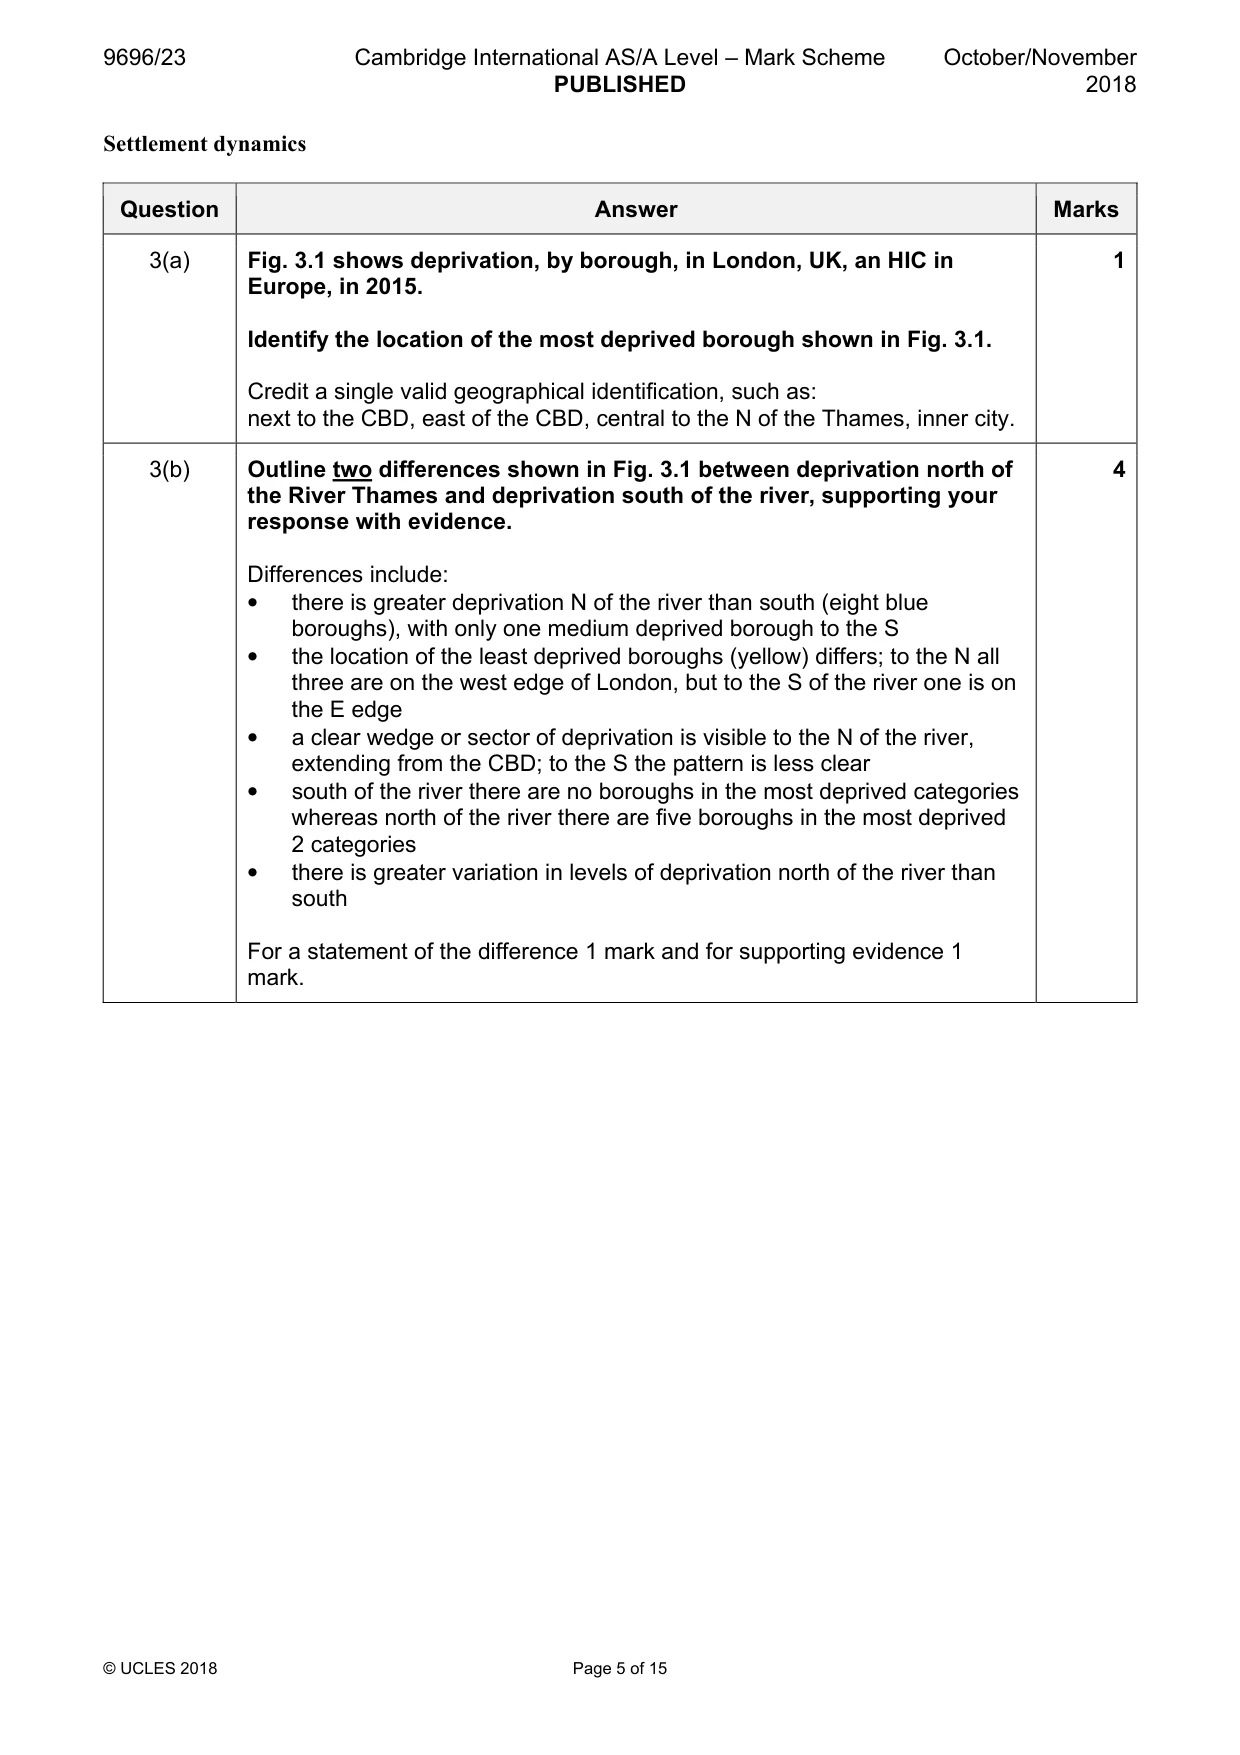
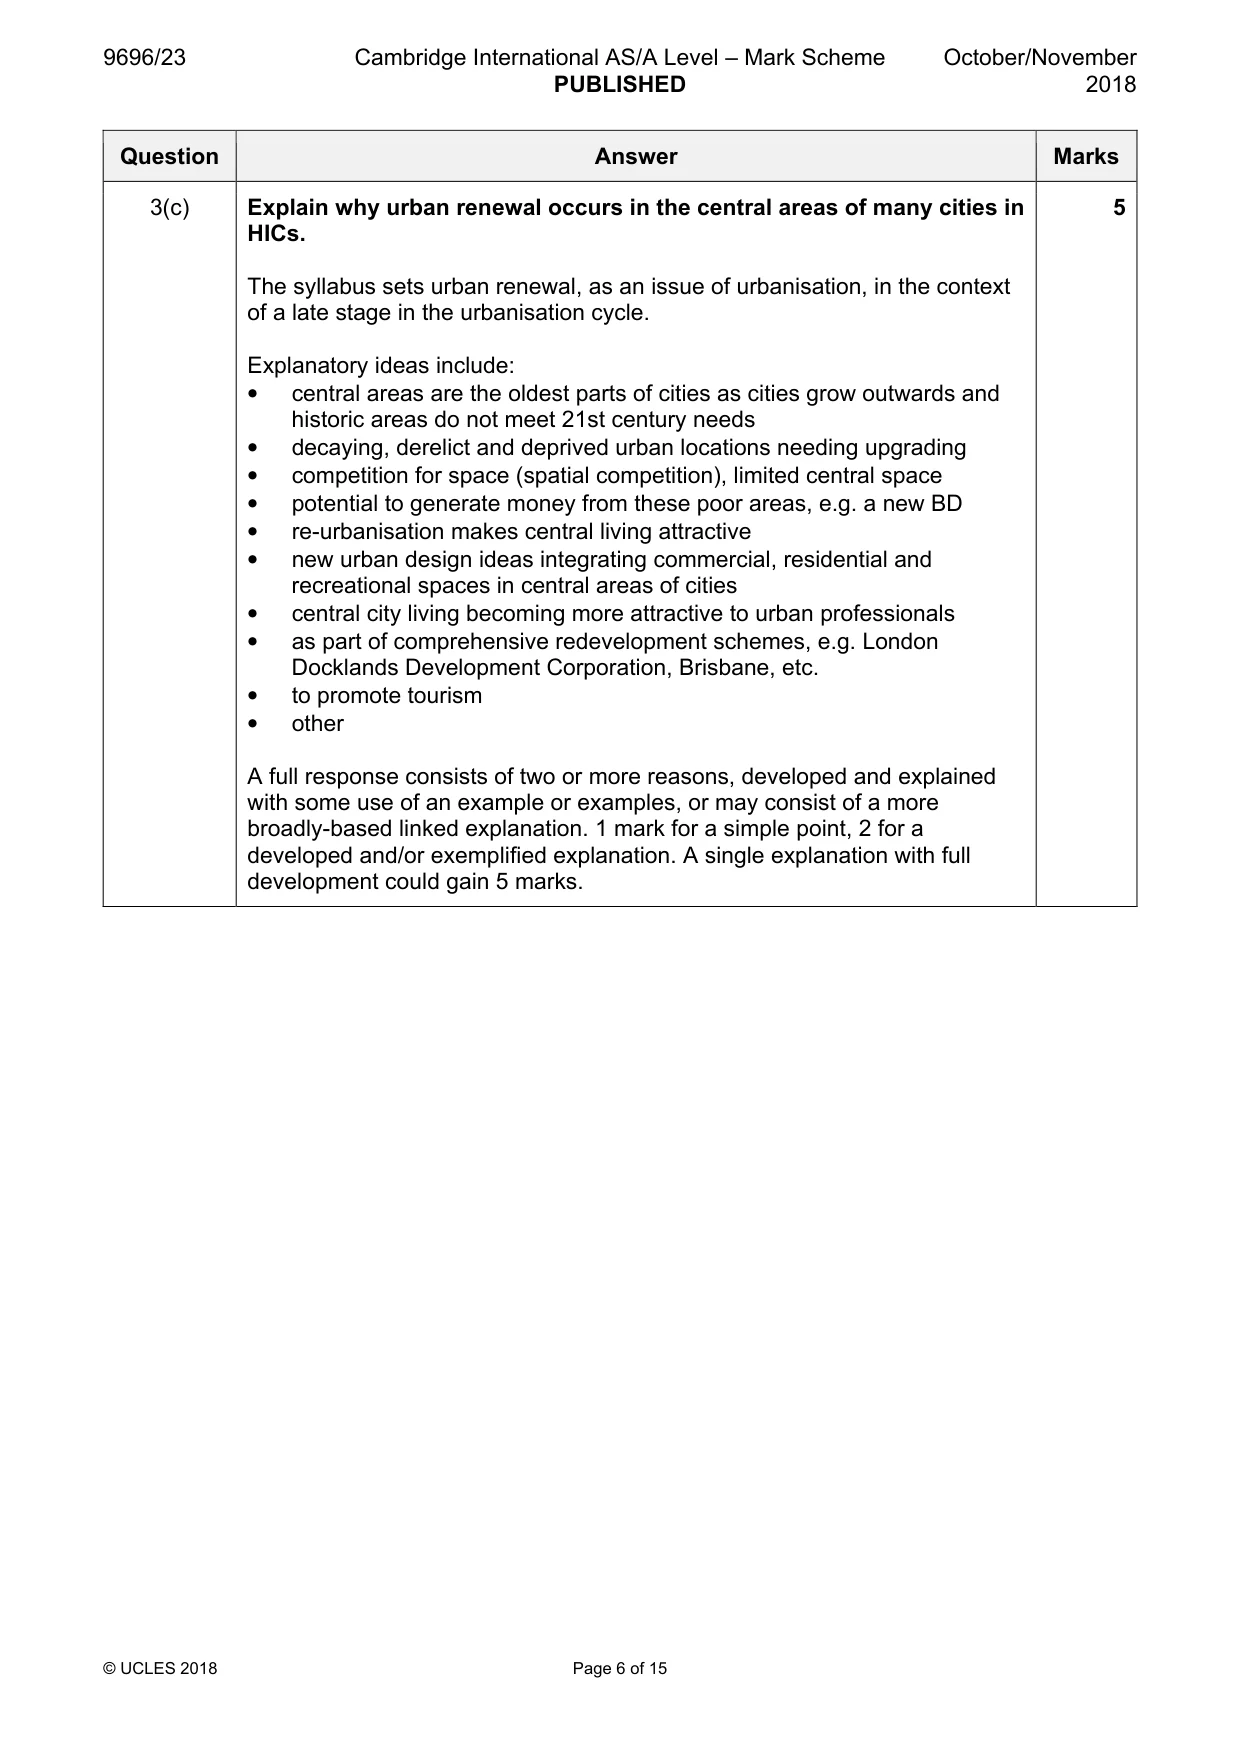
3 Fig. 3.1 shows deprivation, by borough, in London, UK, an HIC in Europe, in 2015. (a) Identify the location of the most deprived borough shown in Fig. 3.1. [1] (b) Outline two differences shown in Fig. 3.1 between deprivation north of the River Thames and deprivation south of the river, supporting your response with evidence. [4] (c) Explain why urban renewal occurs in the central areas of many cities in HICs. [5] [Total: 10]
Mark scheme: 3(a) Fig. 3.1 shows deprivation, by borough, in London, UK, an HIC in 1 Europe, in 2015. Identify the location of the most deprived borough shown in Fig. 3.1. Credit a single valid geographical identification, such as: next to the CBD, east of the CBD, central to the N of the Thames, inner city. 3(b) Outline two differences shown in Fig. 3.1 between deprivation north of 4 the River Thames and deprivation south of the river, supporting your response with evidence. Differences include: • there is greater deprivation N of the river than south (eight blue boroughs), with only one medium deprived borough to the S • the location of the least deprived boroughs (yellow) differs; to the N all three are on the west edge of London, but to the S of the river one is on the E edge • a clear wedge or sector of deprivation is visible to the N of the river, extending from the CBD; to the S the pattern is less clear • south of the river there are no boroughs in the most deprived categories whereas north of the river there are five boroughs in the most deprived 2 categories • there is greater variation in levels of deprivation north of the river than south For a statement of the difference 1 mark and for supporting evidence 1 mark. 3(c) Explain why urban renewal occurs in the central areas of many cities in 5 HICs. The syllabus sets urban renewal, as an issue of urbanisation, in the context of a late stage in the urbanisation cycle. Explanatory ideas include: • central areas are the oldest parts of cities as cities grow outwards and historic areas do not meet 21st century needs • decaying, derelict and deprived urban locations needing upgrading • competition for space (spatial competition), limited central space • potential to generate money from these poor areas, e.g. a new BD • re-urbanisation makes central living attractive • new urban design ideas integrating commercial, residential and recreational spaces in central areas of cities • central city living becoming more attractive to urban professionals • as part of comprehensive redevelopment schemes, e.g. London Docklands Development Corporation, Brisbane, etc. • to promote tourism • other A full response consists of two or more reasons, developed and explained with some use of an example or examples, or may consist of a more broadly-based linked explanation. 1 mark for a simple point, 2 for a developed and/or exemplified explanation. A single explanation with full development could gain 5 marks. Section B Answer one question from this section. Population/Migration
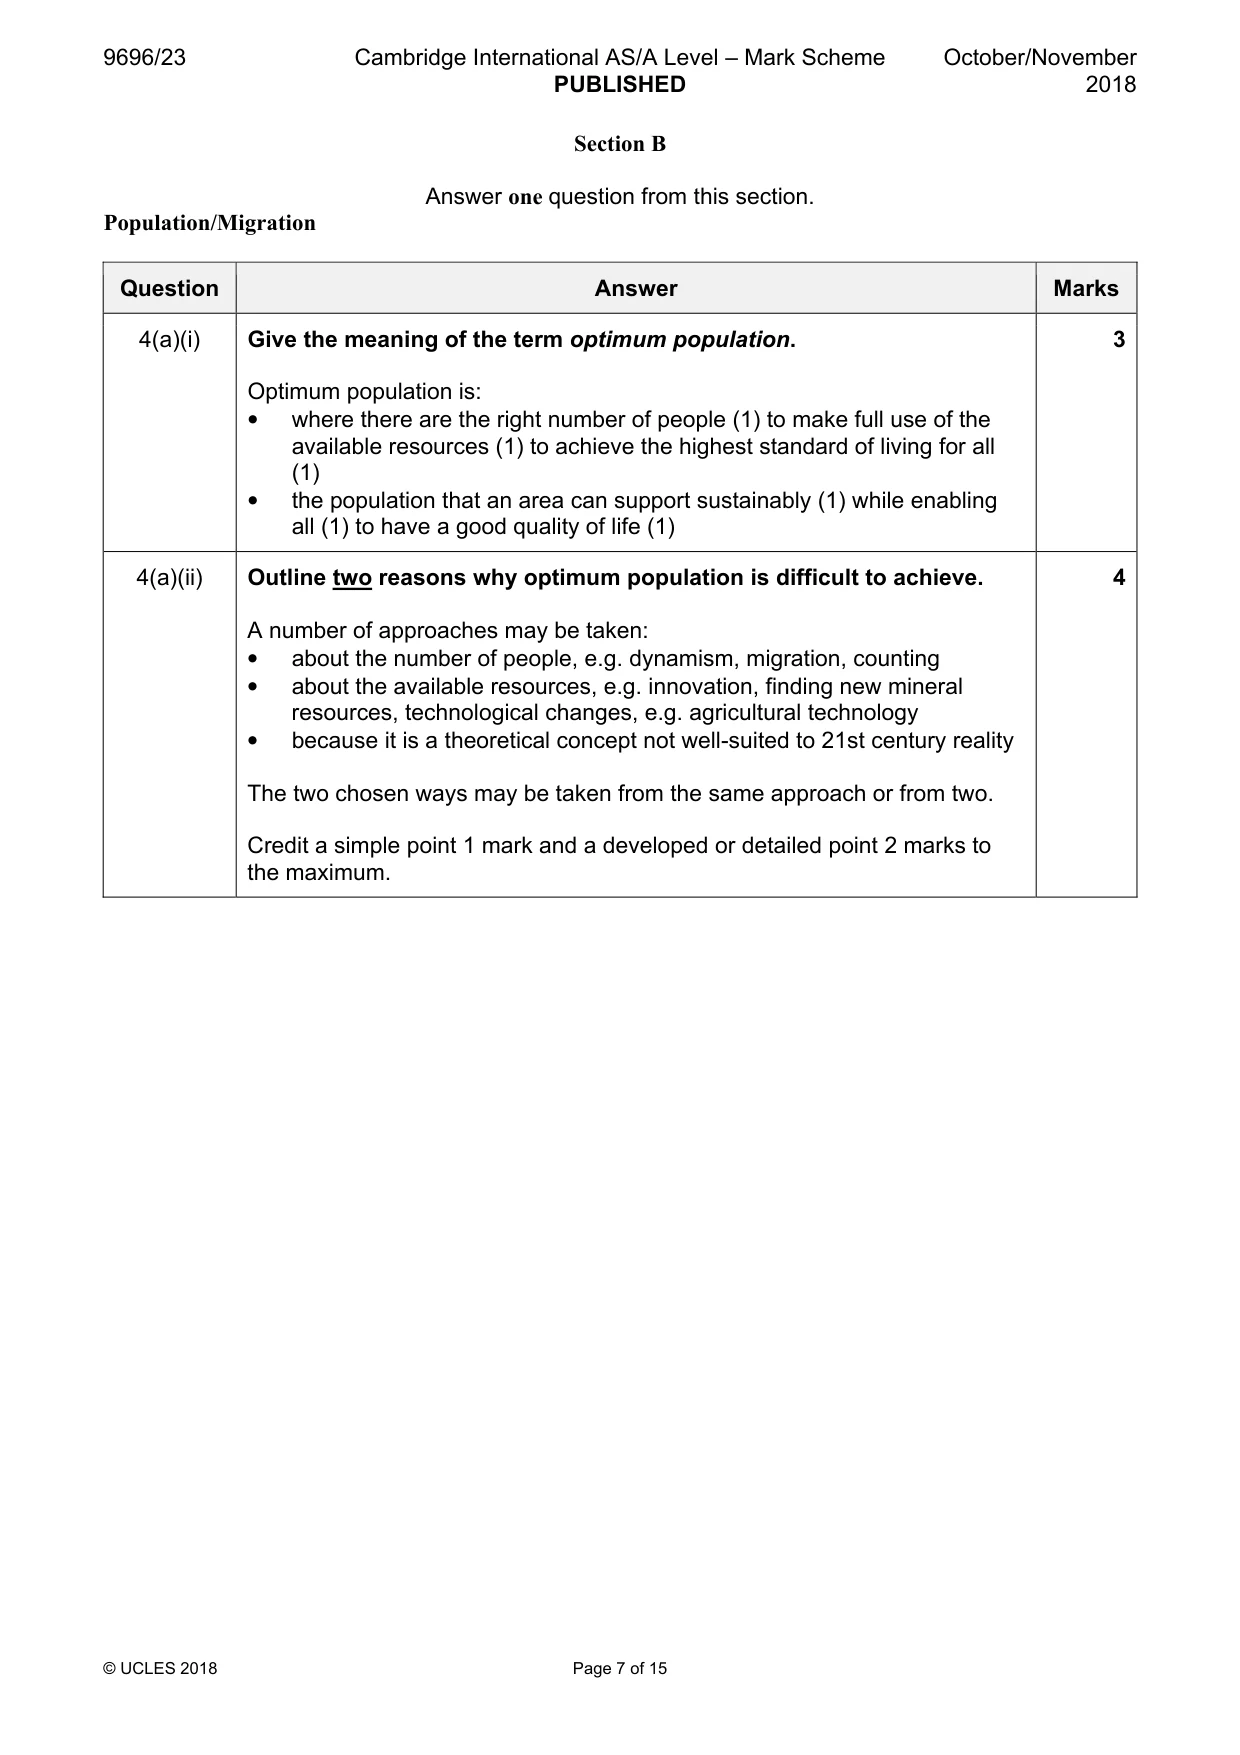
Q4 · Give the meaning of the term optimum population
4 (a) (i) Give the meaning of the term optimum population. [3] (ii) Outline two reasons why optimum population is difficult to achieve. [4] (b) With the help of examples, explain the causes of food shortages. [8] (c) ‘The consequences of food shortage are always negative.’ With the aid of one or more examples, how far do you agree? [15] [Total: 30] Migration
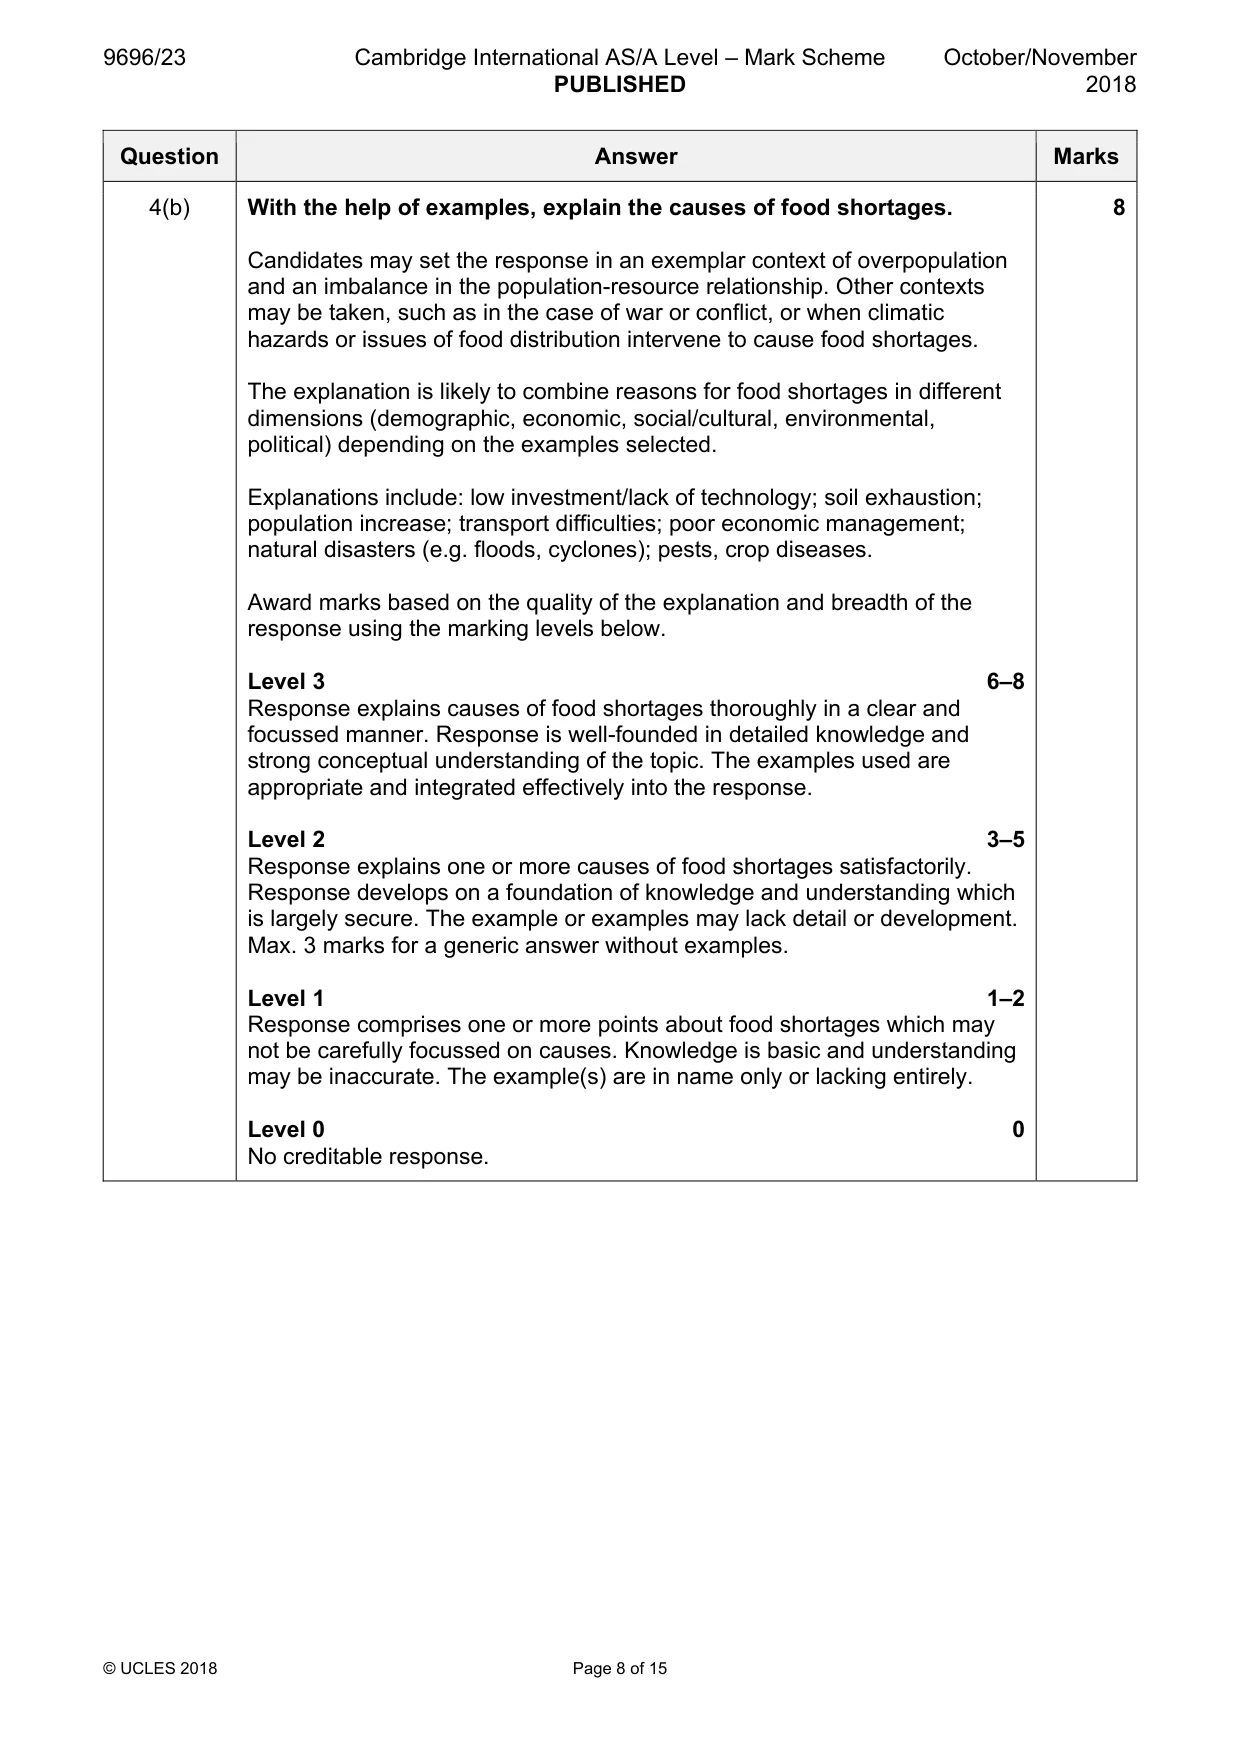
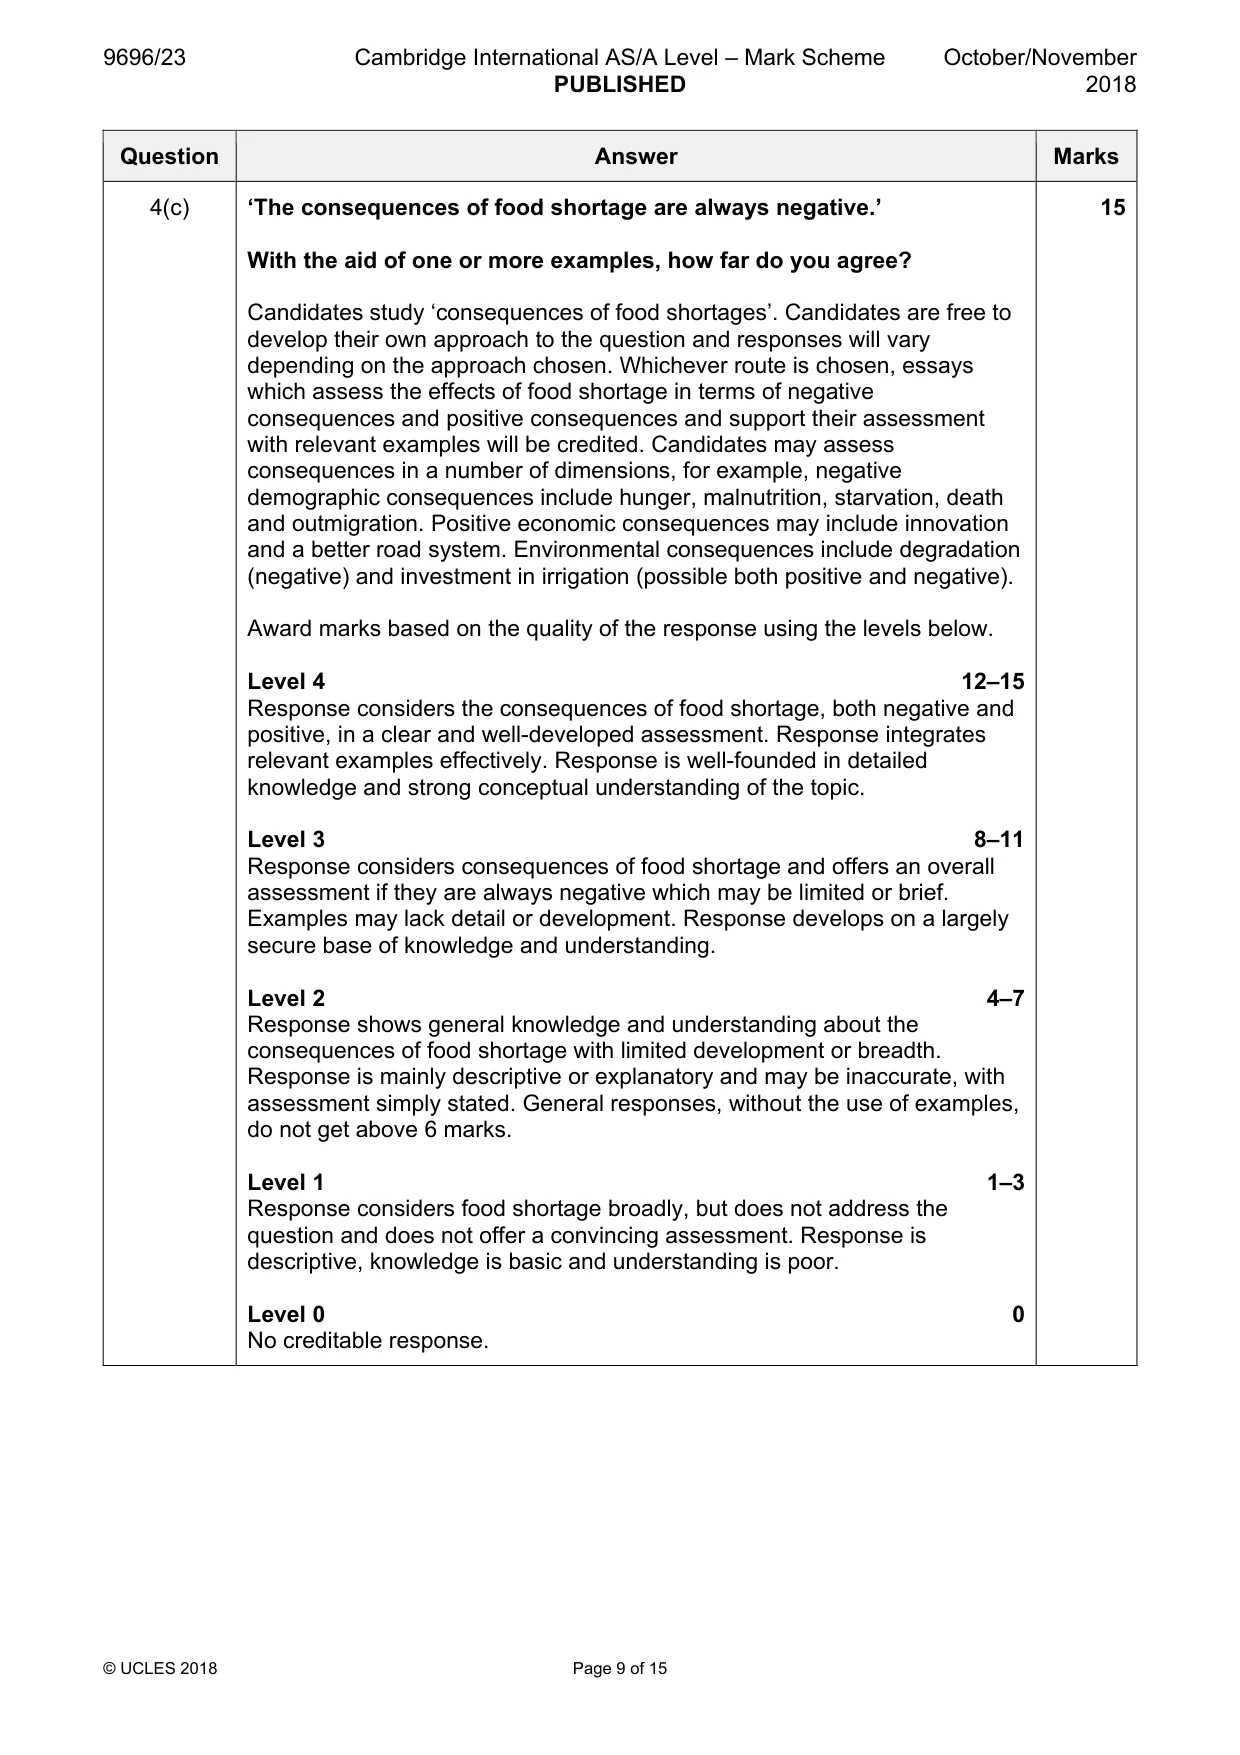
Mark scheme: 4(a)(i) Give the meaning of the term optimum population. 3 Optimum population is: • where there are the right number of people (1) to make full use of the available resources (1) to achieve the highest standard of living for all (1) • the population that an area can support sustainably (1) while enabling all (1) to have a good quality of life (1) 4(a)(ii) Outline two reasons why optimum population is difficult to achieve. 4 A number of approaches may be taken: • about the number of people, e.g. dynamism, migration, counting • about the available resources, e.g. innovation, finding new mineral resources, technological changes, e.g. agricultural technology • because it is a theoretical concept not well-suited to 21st century reality The two chosen ways may be taken from the same approach or from two. Credit a simple point 1 mark and a developed or detailed point 2 marks to the maximum. 4(b) With the help of examples, explain the causes of food shortages. 8 Candidates may set the response in an exemplar context of overpopulation and an imbalance in the population-resource relationship. Other contexts may be taken, such as in the case of war or conflict, or when climatic hazards or issues of food distribution intervene to cause food shortages. The explanation is likely to combine reasons for food shortages in different dimensions (demographic, economic, social/cultural, environmental, political) depending on the examples selected. Explanations include: low investment/lack of technology; soil exhaustion; population increase; transport difficulties; poor economic management; natural disasters (e.g. floods, cyclones); pests, crop diseases. Award marks based on the quality of the explanation and breadth of the response using the marking levels below. Level 3 6–8 Response explains causes of food shortages thoroughly in a clear and focussed manner. Response is well-founded in detailed knowledge and strong conceptual understanding of the topic. The examples used are appropriate and integrated effectively into the response. Level 2 3–5 Response explains one or more causes of food shortages satisfactorily. Response develops on a foundation of knowledge and understanding which is largely secure. The example or examples may lack detail or development. Max. 3 marks for a generic answer without examples. Level 1 1–2 Response comprises one or more points about food shortages which may not be carefully focussed on causes. Knowledge is basic and understanding may be inaccurate. The example(s) are in name only or lacking entirely. Level 0 0 No creditable response. 4(c) ‘The consequences of food shortage are always negative.’ 15 With the aid of one or more examples, how far do you agree? Candidates study ‘consequences of food shortages’. Candidates are free to develop their own approach to the question and responses will vary depending on the approach chosen. Whichever route is chosen, essays which assess the effects of food shortage in terms of negative consequences and positive consequences and support their assessment with relevant examples will be credited. Candidates may assess consequences in a number of dimensions, for example, negative demographic consequences include hunger, malnutrition, starvation, death and outmigration. Positive economic consequences may include innovation and a better road system. Environmental consequences include degradation (negative) and investment in irrigation (possible both positive and negative). Award marks based on the quality of the response using the levels below. Level 4 12–15 Response considers the consequences of food shortage, both negative and positive, in a clear and well-developed assessment. Response integrates relevant examples effectively. Response is well-founded in detailed knowledge and strong conceptual understanding of the topic. Level 3 8–11 Response considers consequences of food shortage and offers an overall assessment if they are always negative which may be limited or brief. Examples may lack detail or development. Response develops on a largely secure base of knowledge and understanding. Level 2 4–7 Response shows general knowledge and understanding about the consequences of food shortage with limited development or breadth. Response is mainly descriptive or explanatory and may be inaccurate, with assessment simply stated. General responses, without the use of examples, do not get above 6 marks. Level 1 1–3 Response considers food shortage broadly, but does not address the question and does not offer a convincing assessment. Response is descriptive, knowledge is basic and understanding is poor. Level 0 0 No creditable response. Migration
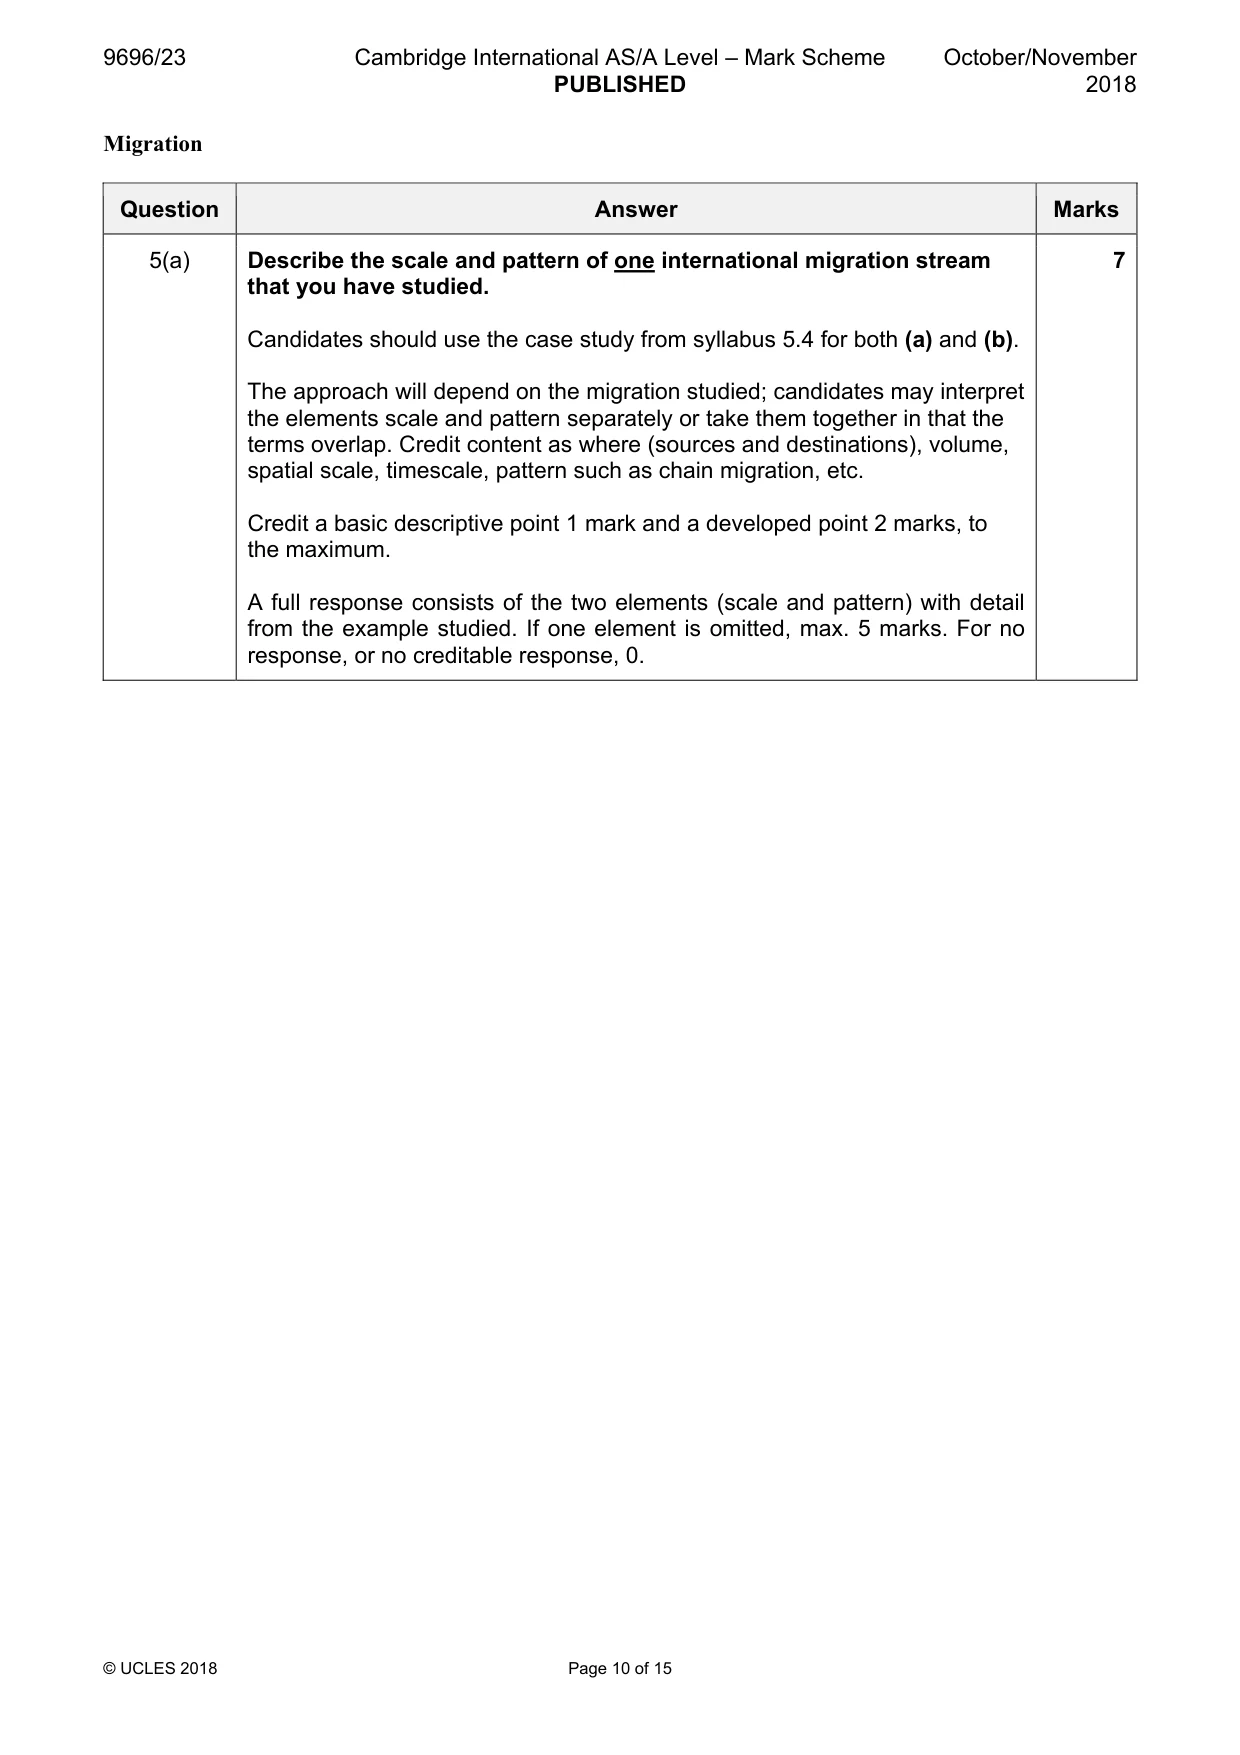
Q5 · Describe the scale and pattern of one international migration stream that you have studied
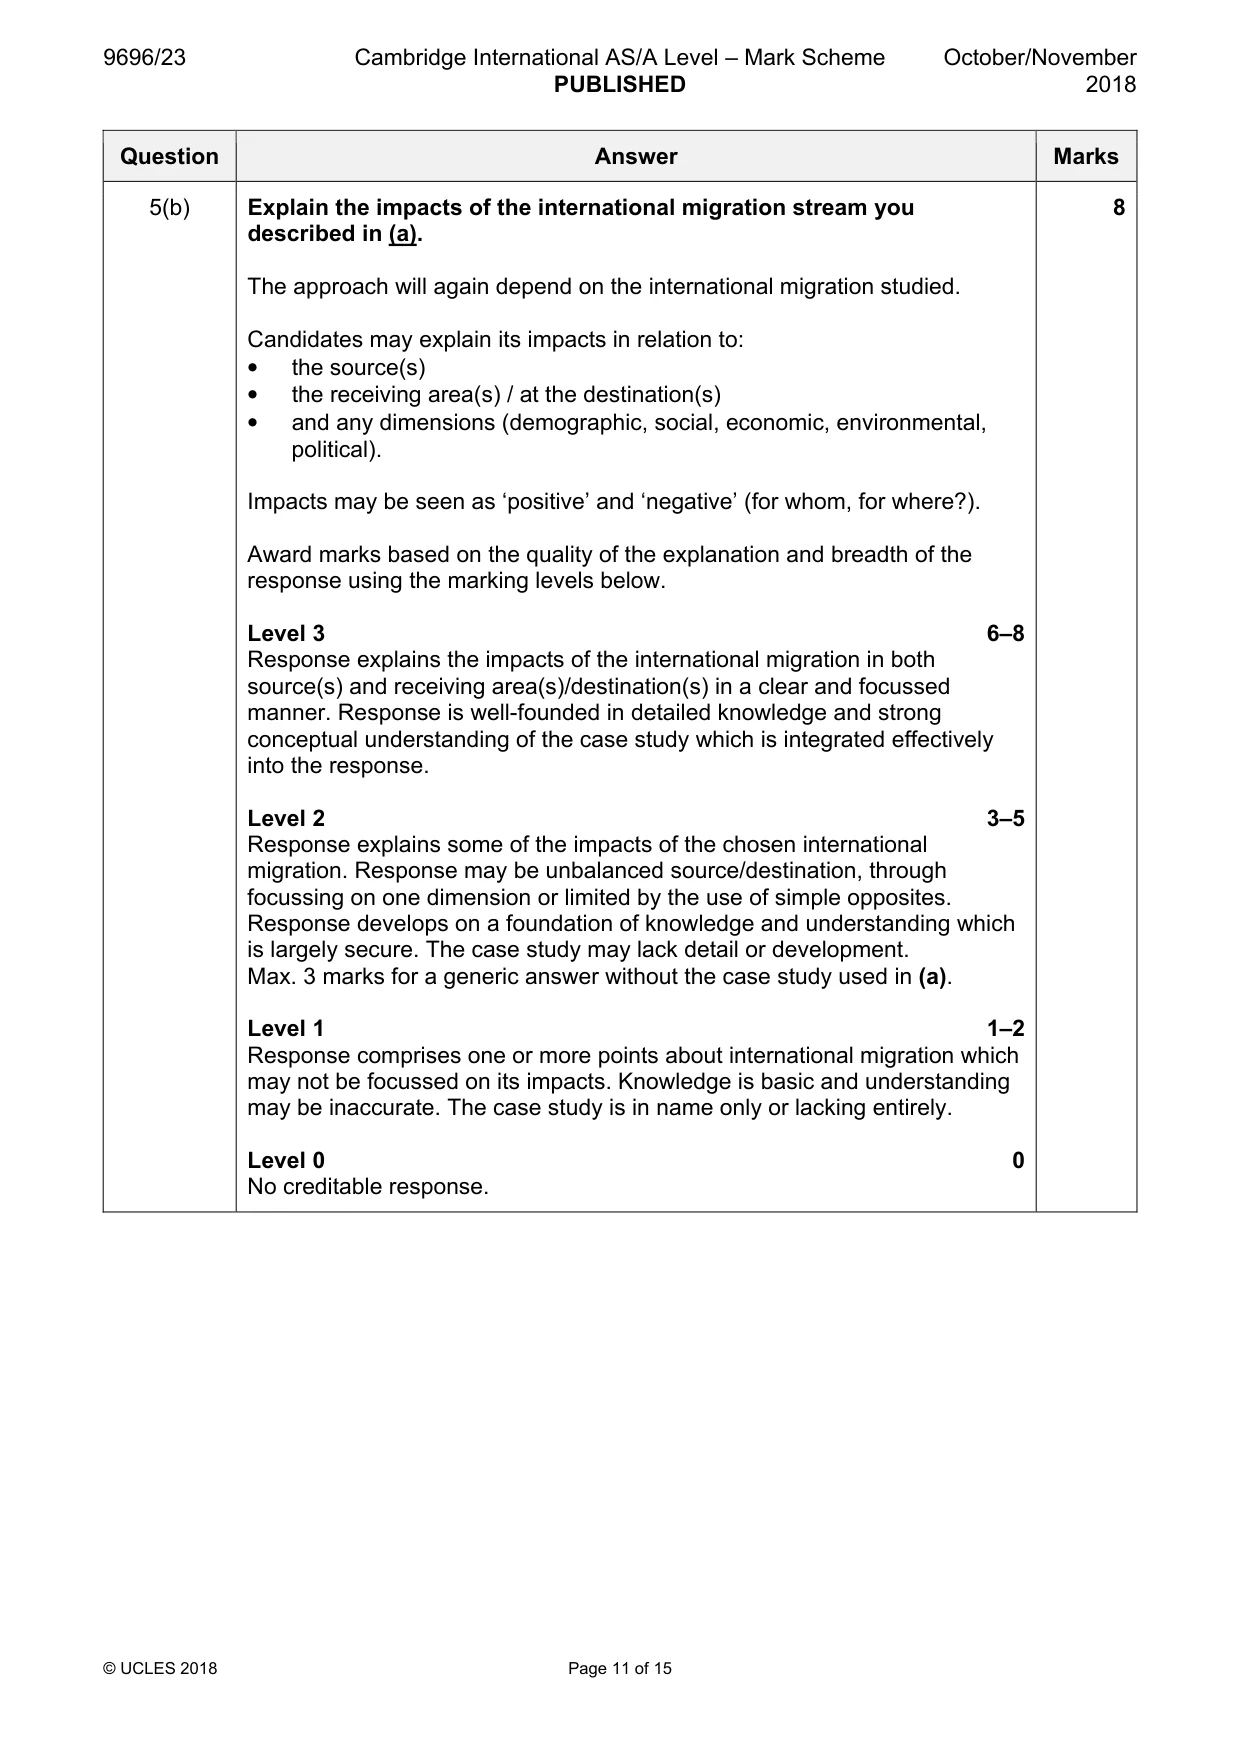
5 (a) Describe the scale and pattern of one international migration stream that you have studied. [7] (b) Explain the impacts of the international migration stream you described in (a). [8] (c) With the aid of examples, assess why international migration is increasing. [15] [Total: 30] Settlement dynamics
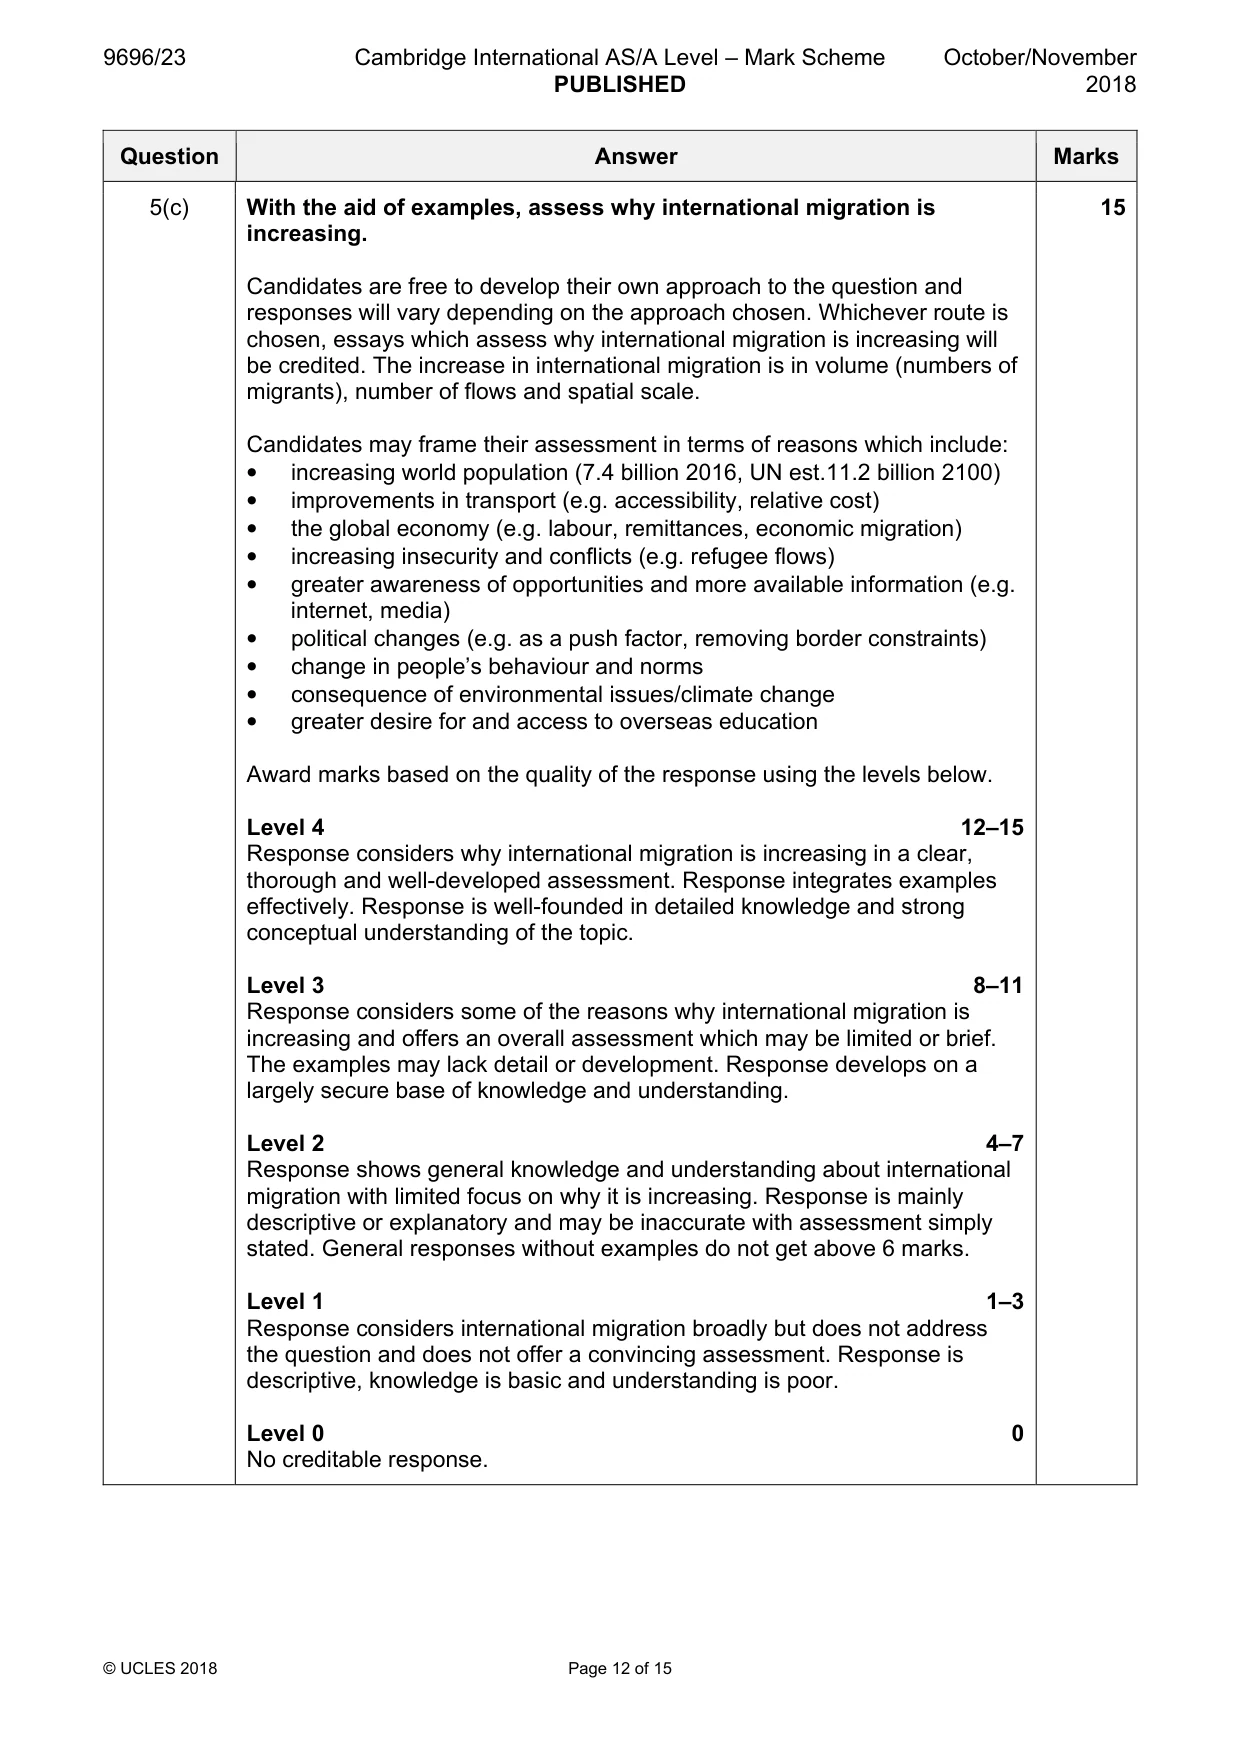
Mark scheme: 5(a) Describe the scale and pattern of one international migration stream 7 that you have studied. Candidates should use the case study from syllabus 5.4 for both (a) and (b). The approach will depend on the migration studied; candidates may interpret the elements scale and pattern separately or take them together in that the terms overlap. Credit content as where (sources and destinations), volume, spatial scale, timescale, pattern such as chain migration, etc. Credit a basic descriptive point 1 mark and a developed point 2 marks, to the maximum. A full response consists of the two elements (scale and pattern) with detail from the example studied. If one element is omitted, max. 5 marks. For no response, or no creditable response, 0. 5(b) Explain the impacts of the international migration stream you 8 described in (a). The approach will again depend on the international migration studied. Candidates may explain its impacts in relation to: • the source(s) • the receiving area(s) / at the destination(s) • and any dimensions (demographic, social, economic, environmental, political). Impacts may be seen as ‘positive’ and ‘negative’ (for whom, for where?). Award marks based on the quality of the explanation and breadth of the response using the marking levels below. Level 3 6–8 Response explains the impacts of the international migration in both source(s) and receiving area(s)/destination(s) in a clear and focussed manner. Response is well-founded in detailed knowledge and strong conceptual understanding of the case study which is integrated effectively into the response. Level 2 3–5 Response explains some of the impacts of the chosen international migration. Response may be unbalanced source/destination, through focussing on one dimension or limited by the use of simple opposites. Response develops on a foundation of knowledge and understanding which is largely secure. The case study may lack detail or development. Max. 3 marks for a generic answer without the case study used in (a). Level 1 1–2 Response comprises one or more points about international migration which may not be focussed on its impacts. Knowledge is basic and understanding may be inaccurate. The case study is in name only or lacking entirely. Level 0 0 No creditable response. 5(c) With the aid of examples, assess why international migration is 15 increasing. Candidates are free to develop their own approach to the question and responses will vary depending on the approach chosen. Whichever route is chosen, essays which assess why international migration is increasing will be credited. The increase in international migration is in volume (numbers of migrants), number of flows and spatial scale. Candidates may frame their assessment in terms of reasons which include: • increasing world population (7.4 billion 2016, UN est.11.2 billion 2100) • improvements in transport (e.g. accessibility, relative cost) • the global economy (e.g. labour, remittances, economic migration) • increasing insecurity and conflicts (e.g. refugee flows) • greater awareness of opportunities and more available information (e.g. internet, media) • political changes (e.g. as a push factor, removing border constraints) • change in people’s behaviour and norms • consequence of environmental issues/climate change • greater desire for and access to overseas education Award marks based on the quality of the response using the levels below. Level 4 12–15 Response considers why international migration is increasing in a clear, thorough and well-developed assessment. Response integrates examples effectively. Response is well-founded in detailed knowledge and strong conceptual understanding of the topic. Level 3 8–11 Response considers some of the reasons why international migration is increasing and offers an overall assessment which may be limited or brief. The examples may lack detail or development. Response develops on a largely secure base of knowledge and understanding. Level 2 4–7 Response shows general knowledge and understanding about international migration with limited focus on why it is increasing. Response is mainly descriptive or explanatory and may be inaccurate with assessment simply stated. General responses without examples do not get above 6 marks. Level 1 1–3 Response considers international migration broadly but does not address the question and does not offer a convincing assessment. Response is descriptive, knowledge is basic and understanding is poor. Level 0 0 No creditable response. Settlement dynamics
Q6 · Explain why many urban settlements need better infrastructure
6 (a) Explain why many urban settlements need better infrastructure. [7] (b) Describe one or more attempts to provide infrastructure (either power or transport) for a city you have studied. [8] (c) How far do you agree that the attempt(s) to provide infrastructure described in (b) caused as many problems as they solved? [15] [Total: 30]
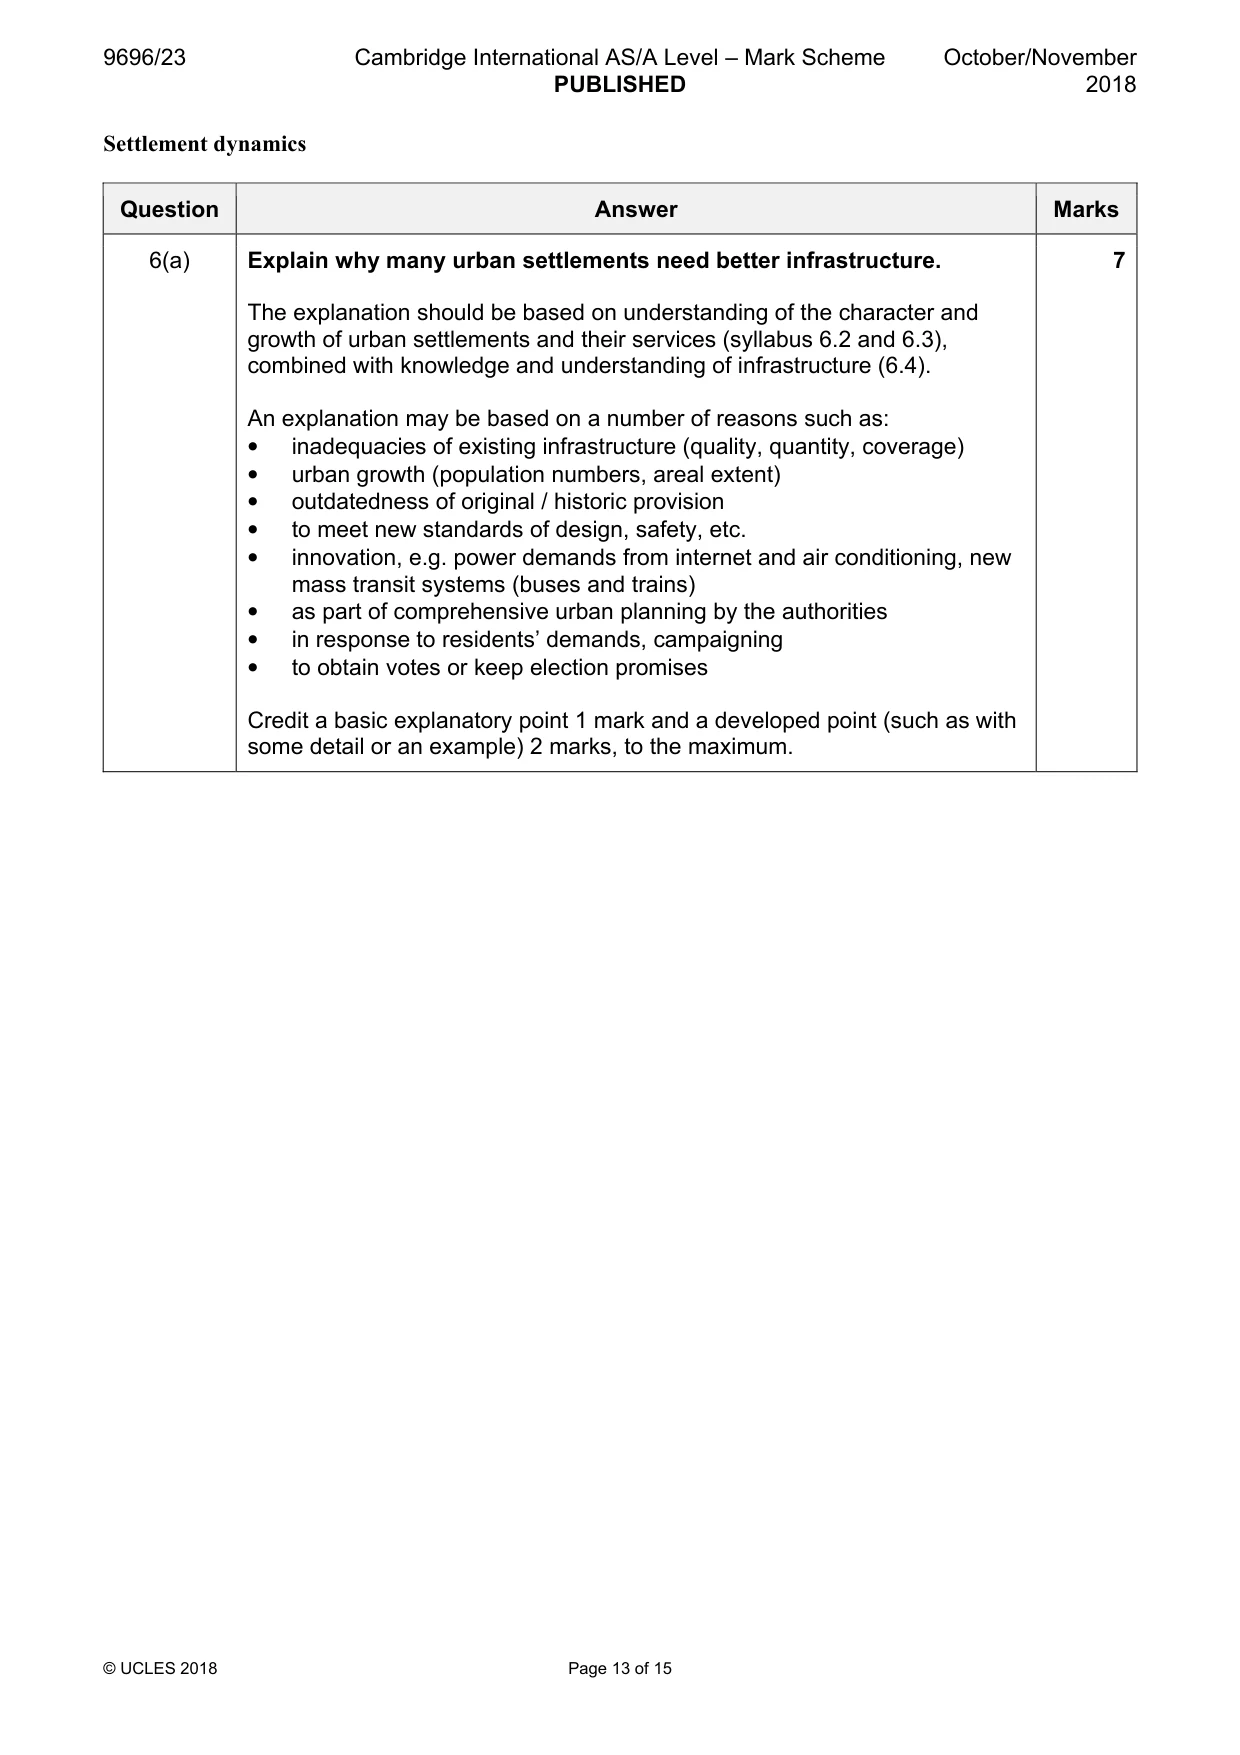
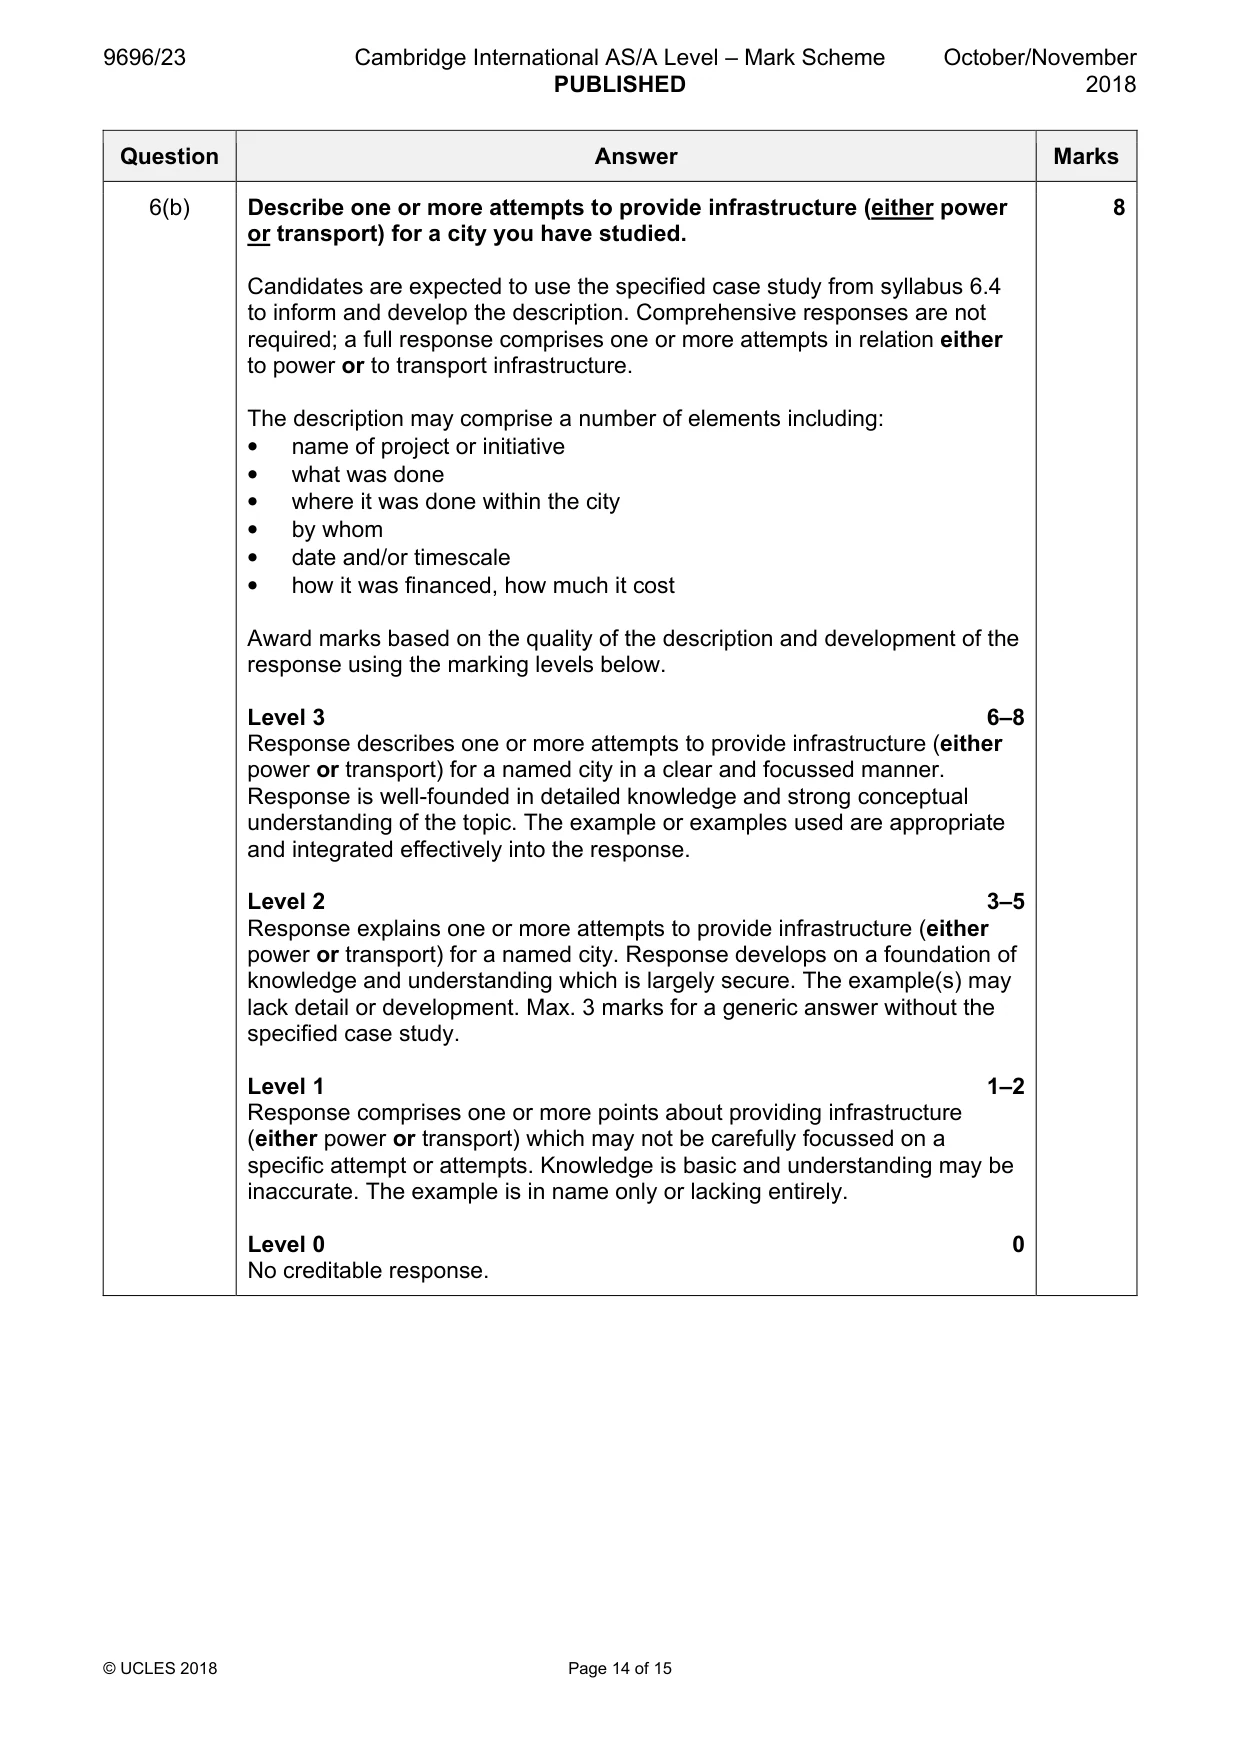
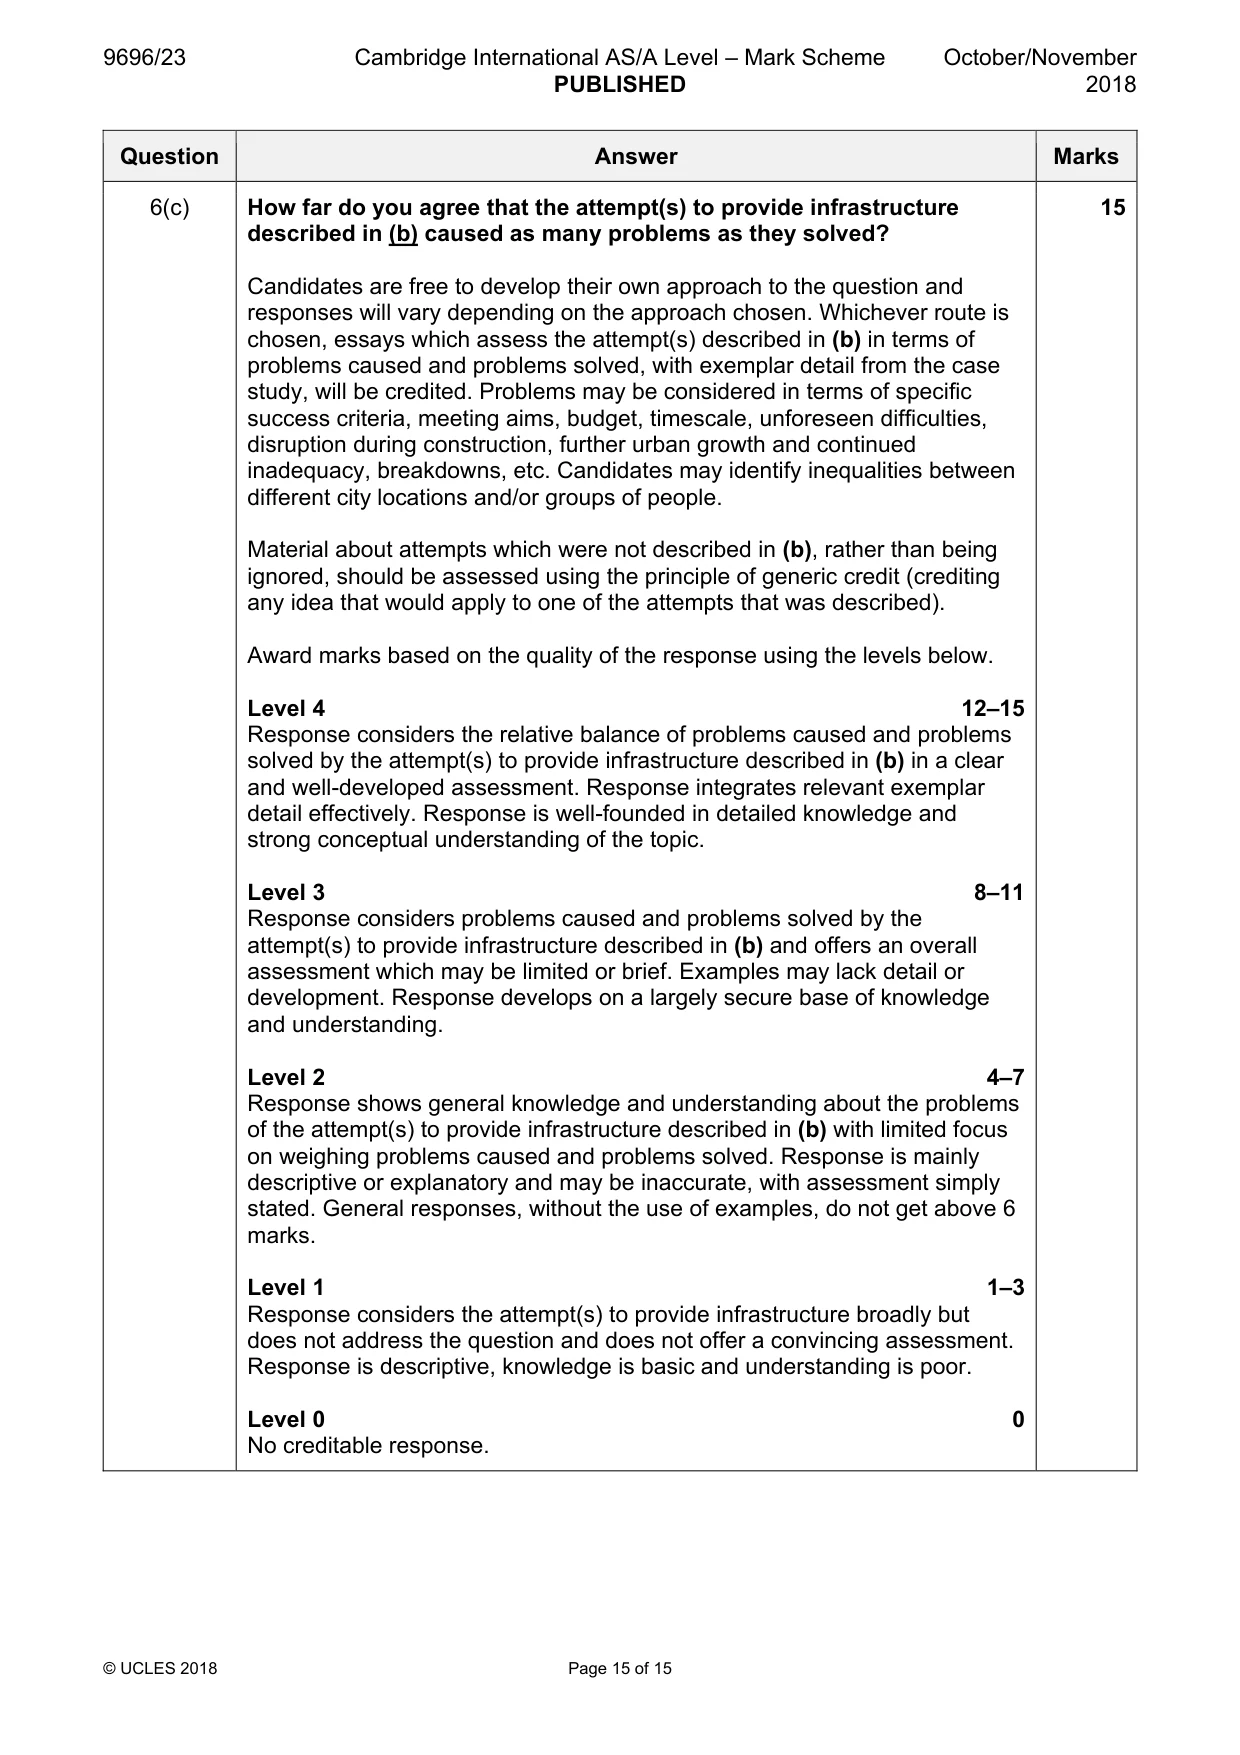
Mark scheme: 6(a) Explain why many urban settlements need better infrastructure. 7 The explanation should be based on understanding of the character and growth of urban settlements and their services (syllabus 6.2 and 6.3), combined with knowledge and understanding of infrastructure (6.4). An explanation may be based on a number of reasons such as: • inadequacies of existing infrastructure (quality, quantity, coverage) • urban growth (population numbers, areal extent) • outdatedness of original / historic provision • to meet new standards of design, safety, etc. • innovation, e.g. power demands from internet and air conditioning, new mass transit systems (buses and trains) • as part of comprehensive urban planning by the authorities • in response to residents’ demands, campaigning • to obtain votes or keep election promises Credit a basic explanatory point 1 mark and a developed point (such as with some detail or an example) 2 marks, to the maximum. 6(b) Describe one or more attempts to provide infrastructure (either power 8 or transport) for a city you have studied. Candidates are expected to use the specified case study from syllabus 6.4 to inform and develop the description. Comprehensive responses are not required; a full response comprises one or more attempts in relation either to power or to transport infrastructure. The description may comprise a number of elements including: • name of project or initiative • what was done • where it was done within the city • by whom • date and/or timescale • how it was financed, how much it cost Award marks based on the quality of the description and development of the response using the marking levels below. Level 3 6–8 Response describes one or more attempts to provide infrastructure (either power or transport) for a named city in a clear and focussed manner. Response is well-founded in detailed knowledge and strong conceptual understanding of the topic. The example or examples used are appropriate and integrated effectively into the response. Level 2 3–5 Response explains one or more attempts to provide infrastructure (either power or transport) for a named city. Response develops on a foundation of knowledge and understanding which is largely secure. The example(s) may lack detail or development. Max. 3 marks for a generic answer without the specified case study. Level 1 1–2 Response comprises one or more points about providing infrastructure (either power or transport) which may not be carefully focussed on a specific attempt or attempts. Knowledge is basic and understanding may be inaccurate. The example is in name only or lacking entirely. Level 0 0 No creditable response. 6(c) How far do you agree that the attempt(s) to provide infrastructure 15 described in (b) caused as many problems as they solved? Candidates are free to develop their own approach to the question and responses will vary depending on the approach chosen. Whichever route is chosen, essays which assess the attempt(s) described in (b) in terms of problems caused and problems solved, with exemplar detail from the case study, will be credited. Problems may be considered in terms of specific success criteria, meeting aims, budget, timescale, unforeseen difficulties, disruption during construction, further urban growth and continued inadequacy, breakdowns, etc. Candidates may identify inequalities between different city locations and/or groups of people. Material about attempts which were not described in (b), rather than being ignored, should be assessed using the principle of generic credit (crediting any idea that would apply to one of the attempts that was described). Award marks based on the quality of the response using the levels below. Level 4 12–15 Response considers the relative balance of problems caused and problems solved by the attempt(s) to provide infrastructure described in (b) in a clear and well-developed assessment. Response integrates relevant exemplar detail effectively. Response is well-founded in detailed knowledge and strong conceptual understanding of the topic. Level 3 8–11 Response considers problems caused and problems solved by the attempt(s) to provide infrastructure described in (b) and offers an overall assessment which may be limited or brief. Examples may lack detail or development. Response develops on a largely secure base of knowledge and understanding. Level 2 4–7 Response shows general knowledge and understanding about the problems of the attempt(s) to provide infrastructure described in (b) with limited focus on weighing problems caused and problems solved. Response is mainly descriptive or explanatory and may be inaccurate, with assessment simply stated. General responses, without the use of examples, do not get above 6 marks. Level 1 1–3 Response considers the attempt(s) to provide infrastructure broadly but does not address the question and does not offer a convincing assessment. Response is descriptive, knowledge is basic and understanding is poor. Level 0 0 No creditable response.
What was in this paper
The subtopics covered by these 6 questions, and how many questions each got. Open one in a new tab to see every Cambridge question on it.
What you needed in this session
Cambridge’s own grade thresholds for 2018 Oct/Nov, Paper 2 · Variant 3. A higher threshold means an easier paper — the bar moves with how the cohort did.