Cambridge A Level Geography 9696 — 2018 Oct/Nov Paper 2 · Variant 2
9696/22/O/N/18 · 6 questions · 60 marks · ≈68 min
The question paper and its mark scheme, free to read here and free to download. This is Cambridge’s own paper, exactly as it was sat.
Question paper4 pages

Mark scheme15 pages
Answers below. Sit the paper first if you are practising.


Questions as text
Q1 · Actual total fertility rate (TFR) and predicted TFR for selected LICs
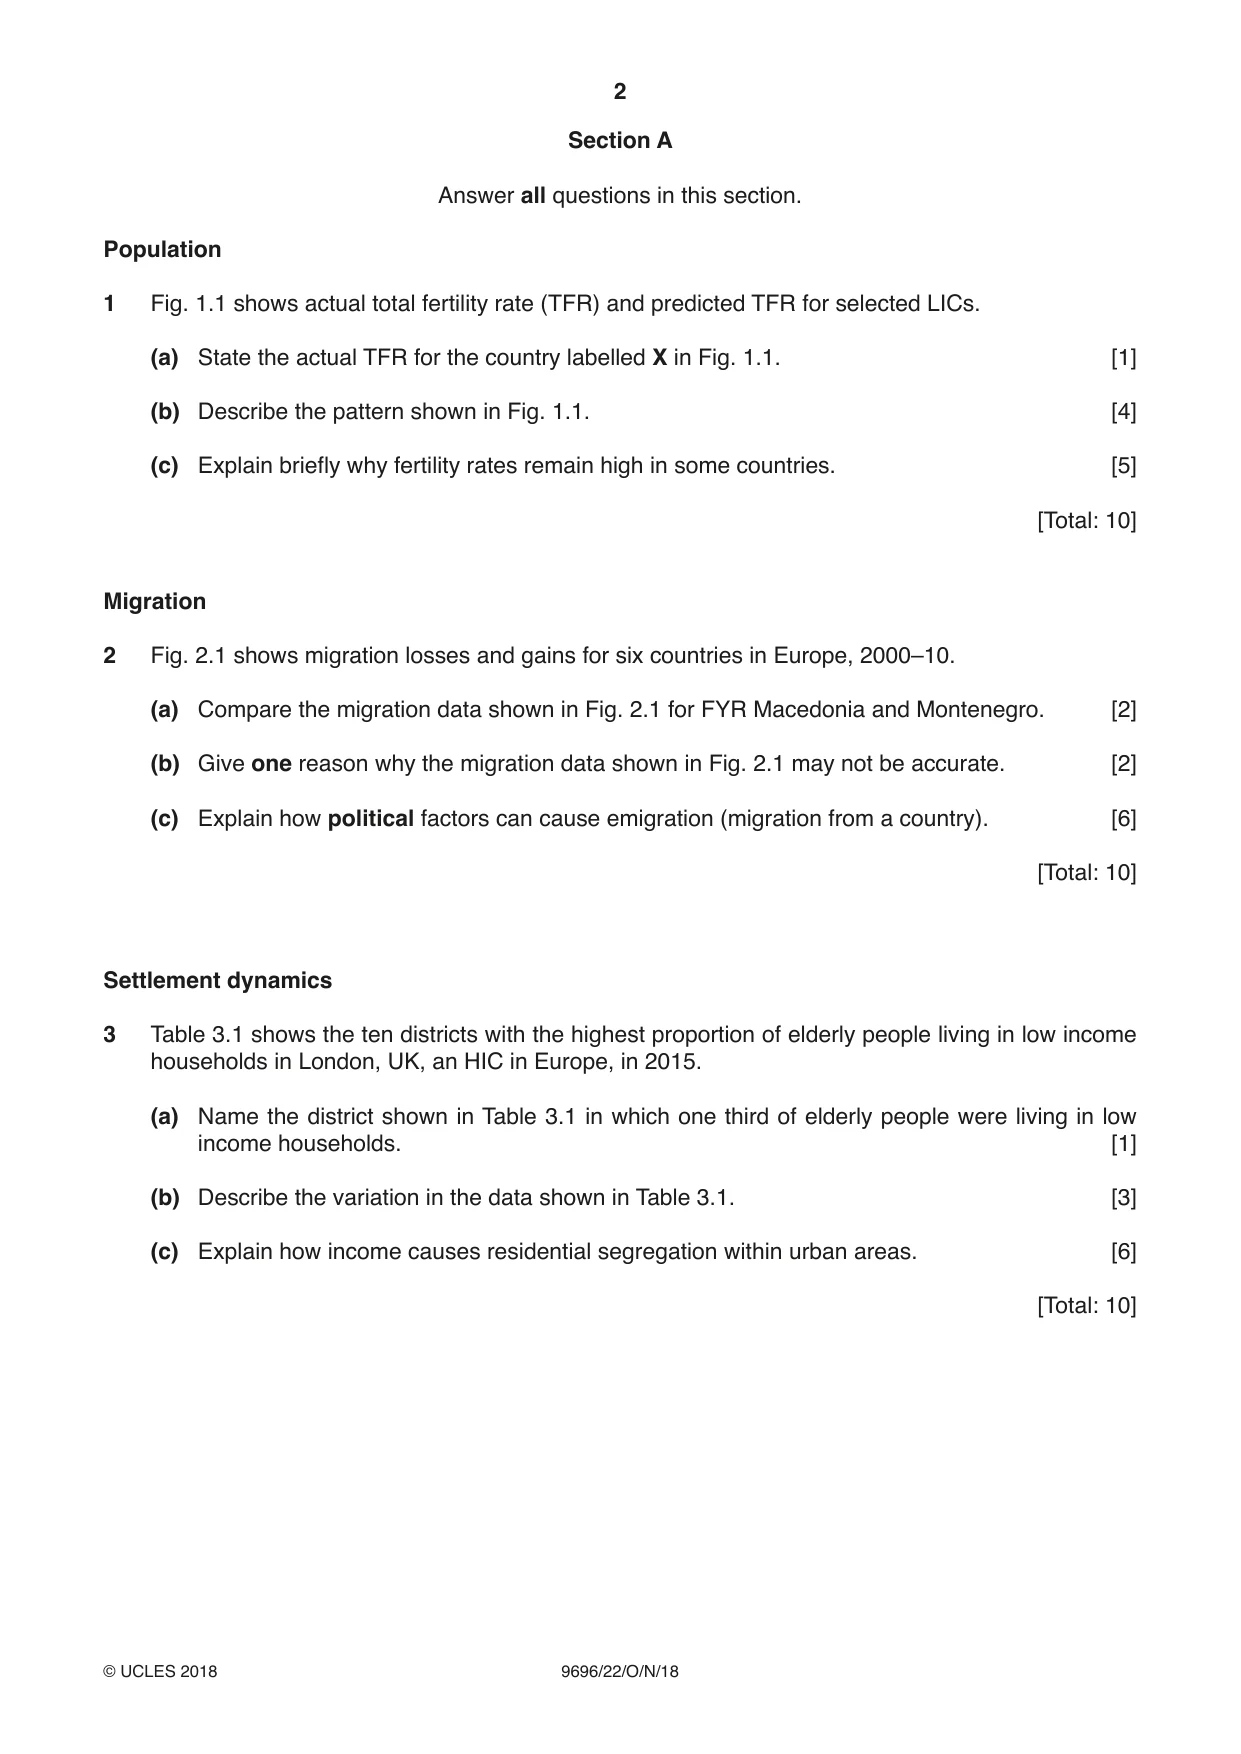
1 Fig. 1.1 shows actual total fertility rate (TFR) and predicted TFR for selected LICs. (a) State the actual TFR for the country labelled X in Fig. 1.1. [1] (b) Describe the pattern shown in Fig. 1.1. [4] (c) Explain briefly why fertility rates remain high in some countries. [5] [Total: 10] Migration
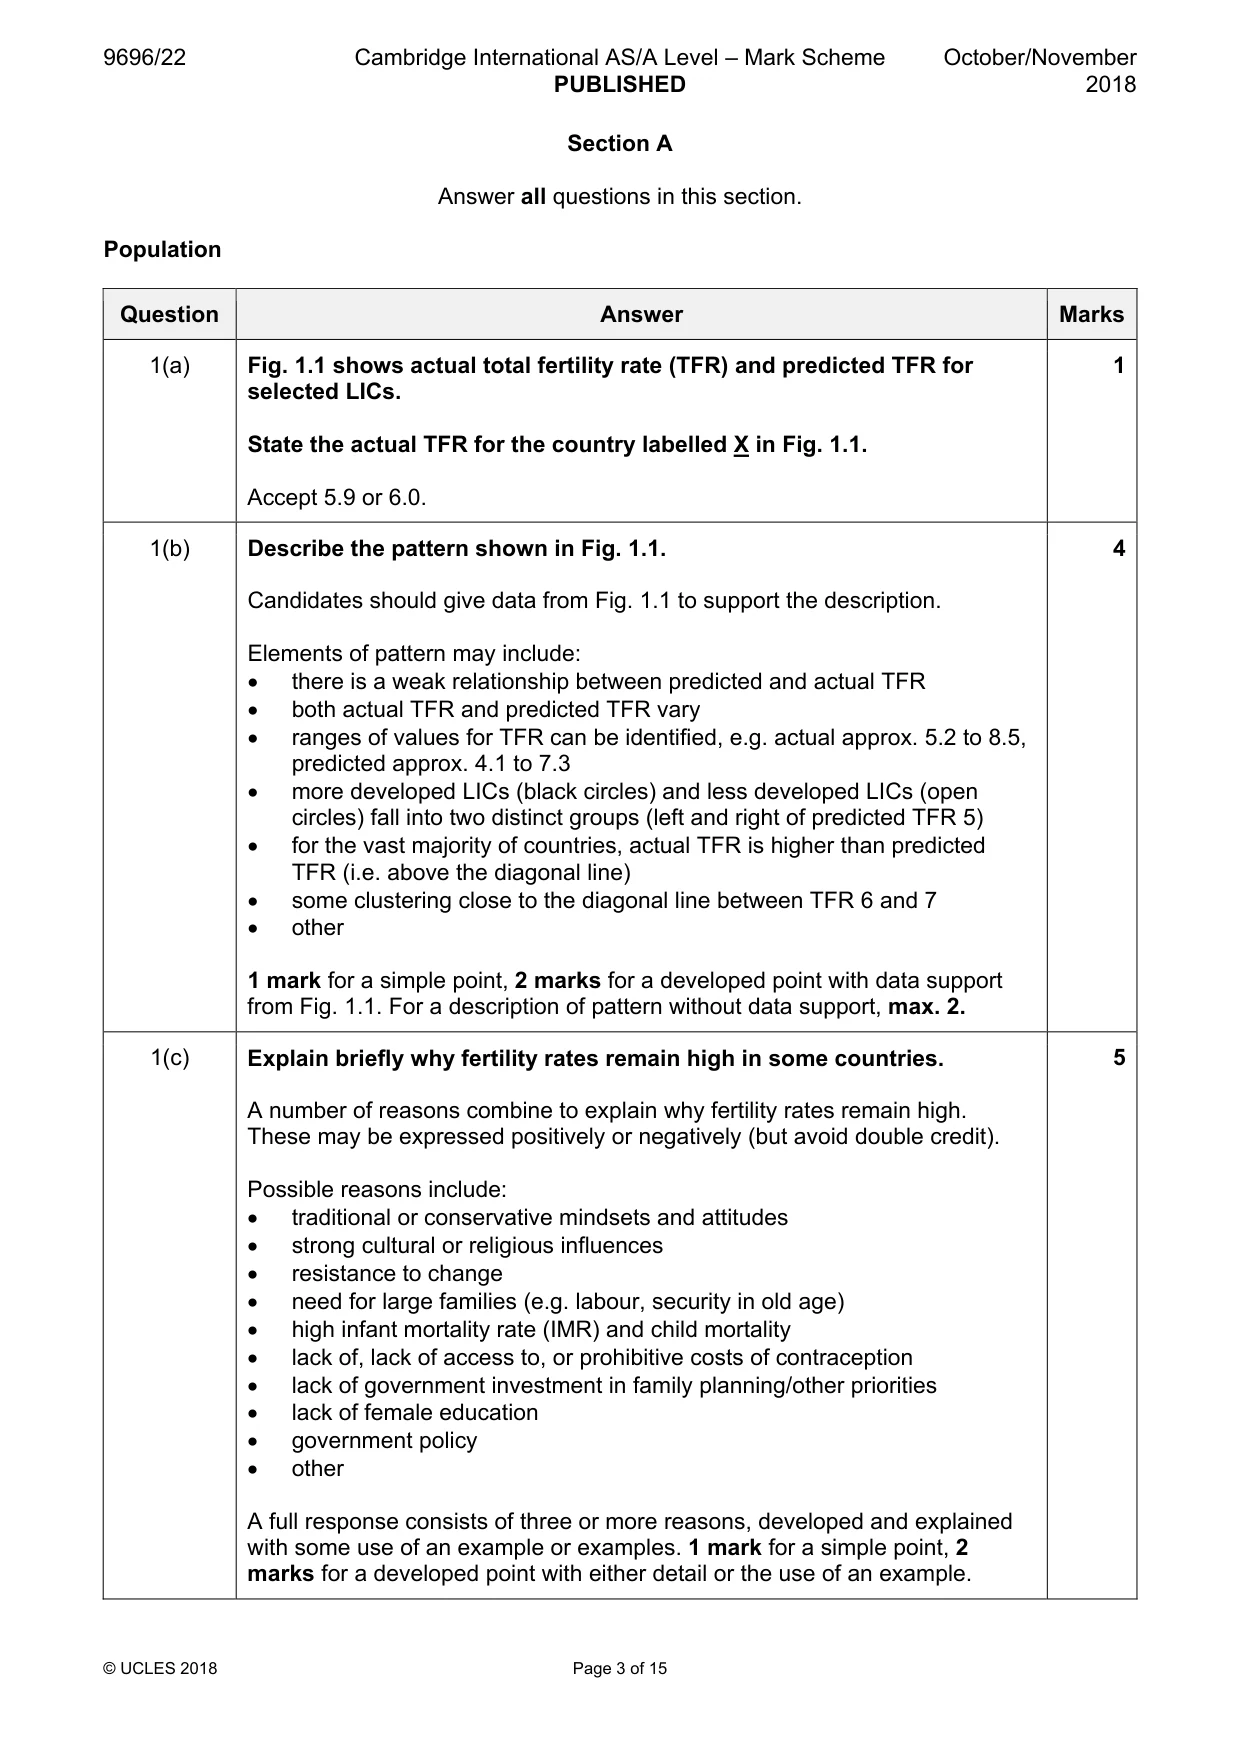
Mark scheme: Question Answer Marks 1(a) Fig. 1.1 shows actual total fertility rate (TFR) and predicted TFR for 1 selected LICs. State the actual TFR for the country labelled X in Fig. 1.1. Accept 5.9 or 6.0. 1(b) Describe the pattern shown in Fig. 1.1. 4 Candidates should give data from Fig. 1.1 to support the description. Elements of pattern may include: • there is a weak relationship between predicted and actual TFR • both actual TFR and predicted TFR vary • ranges of values for TFR can be identified, e.g. actual approx. 5.2 to 8.5, predicted approx. 4.1 to 7.3 • more developed LICs (black circles) and less developed LICs (open circles) fall into two distinct groups (left and right of predicted TFR 5) • for the vast majority of countries, actual TFR is higher than predicted TFR (i.e. above the diagonal line) • some clustering close to the diagonal line between TFR 6 and 7 • other 1 mark for a simple point, 2 marks for a developed point with data support from Fig. 1.1. For a description of pattern without data support, max. 2. 1(c) Explain briefly why fertility rates remain high in some countries. 5 A number of reasons combine to explain why fertility rates remain high. These may be expressed positively or negatively (but avoid double credit). Possible reasons include: • traditional or conservative mindsets and attitudes • strong cultural or religious influences • resistance to change • need for large families (e.g. labour, security in old age) • high infant mortality rate (IMR) and child mortality • lack of, lack of access to, or prohibitive costs of contraception • lack of government investment in family planning/other priorities • lack of female education • government policy • other A full response consists of three or more reasons, developed and explained with some use of an example or examples. 1 mark for a simple point, 2 marks for a developed point with either detail or the use of an example. Migration
Q2 · Migration losses and gains for six countries in Europe, 2000–10
2 Fig. 2.1 shows migration losses and gains for six countries in Europe, 2000–10. (a) Compare the migration data shown in Fig. 2.1 for FYR Macedonia and Montenegro. [2] (b) Give one reason why the migration data shown in Fig. 2.1 may not be accurate. [2] (c) Explain how political factors can cause emigration (migration from a country). [6] [Total: 10] Settlement dynamics
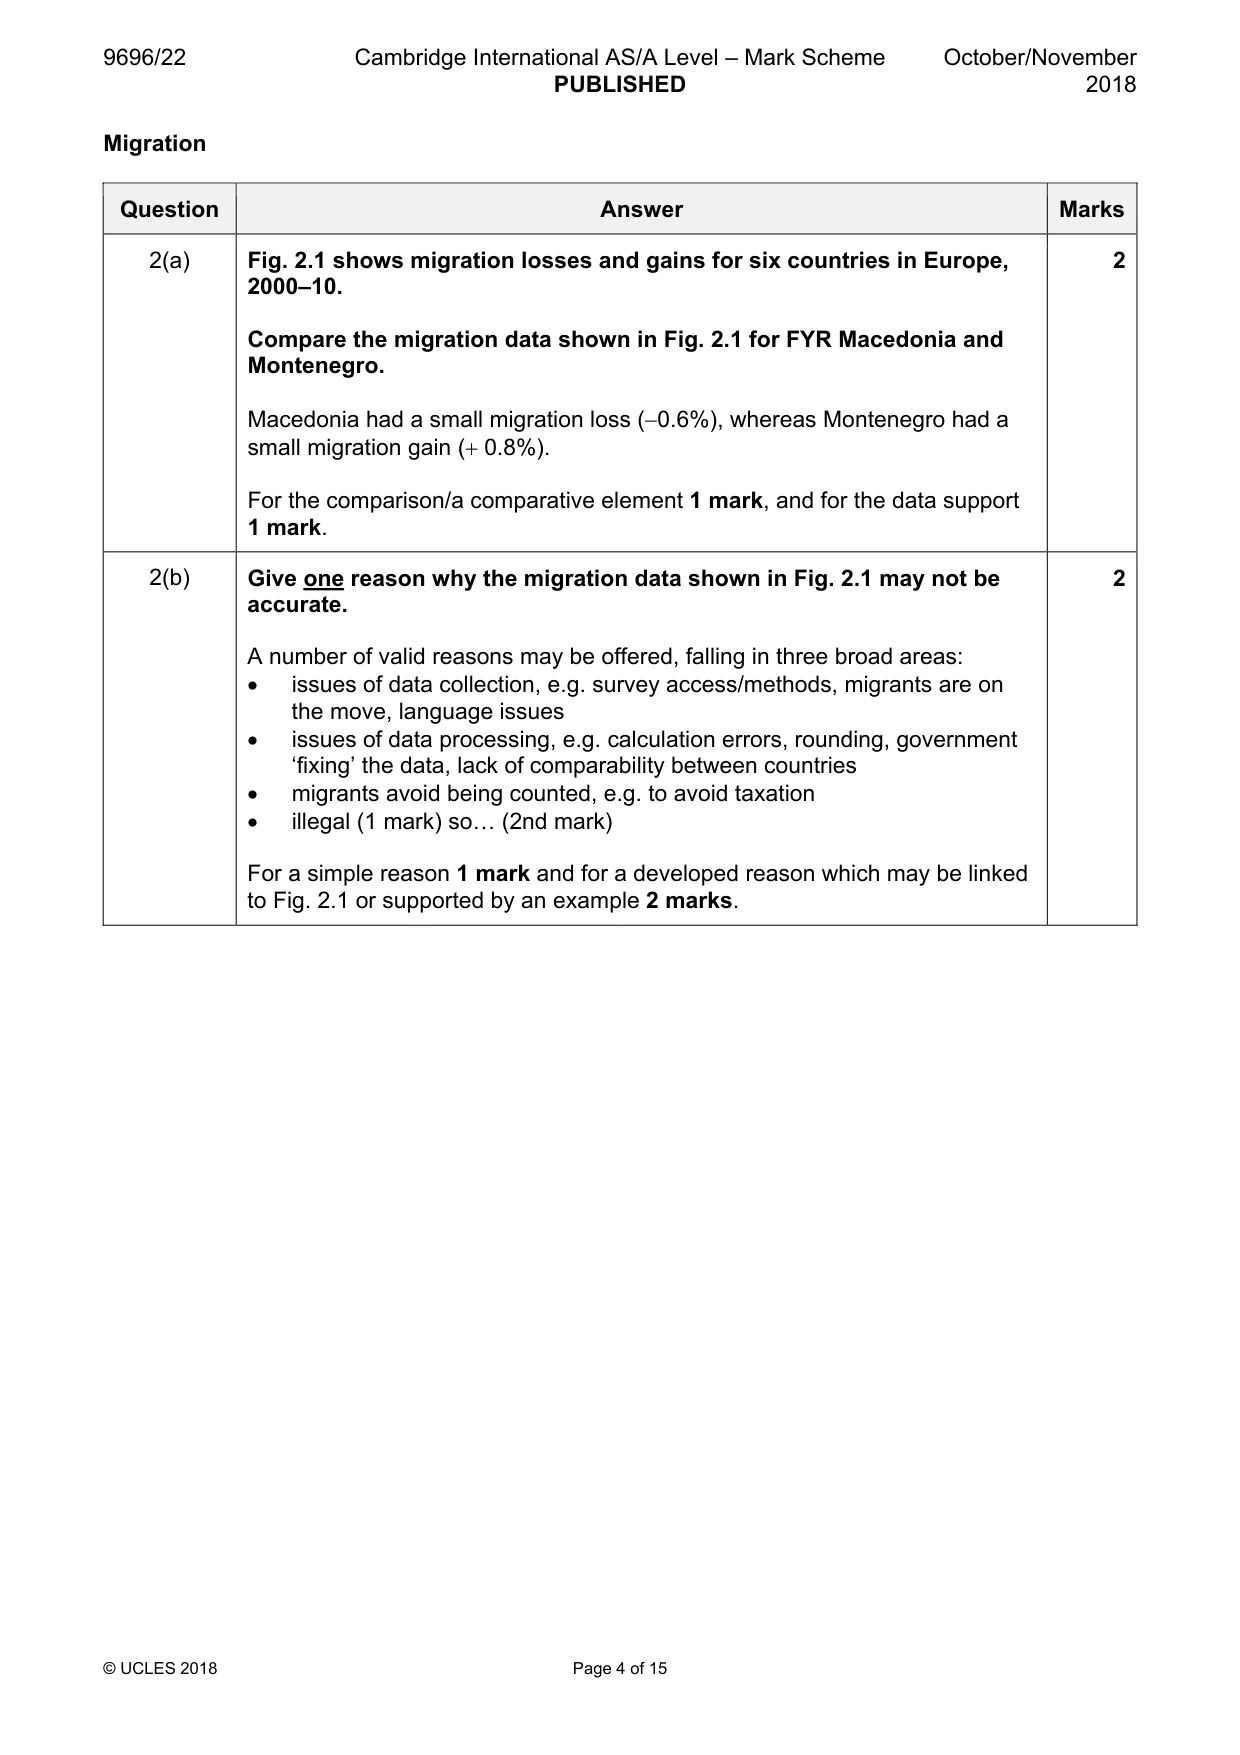
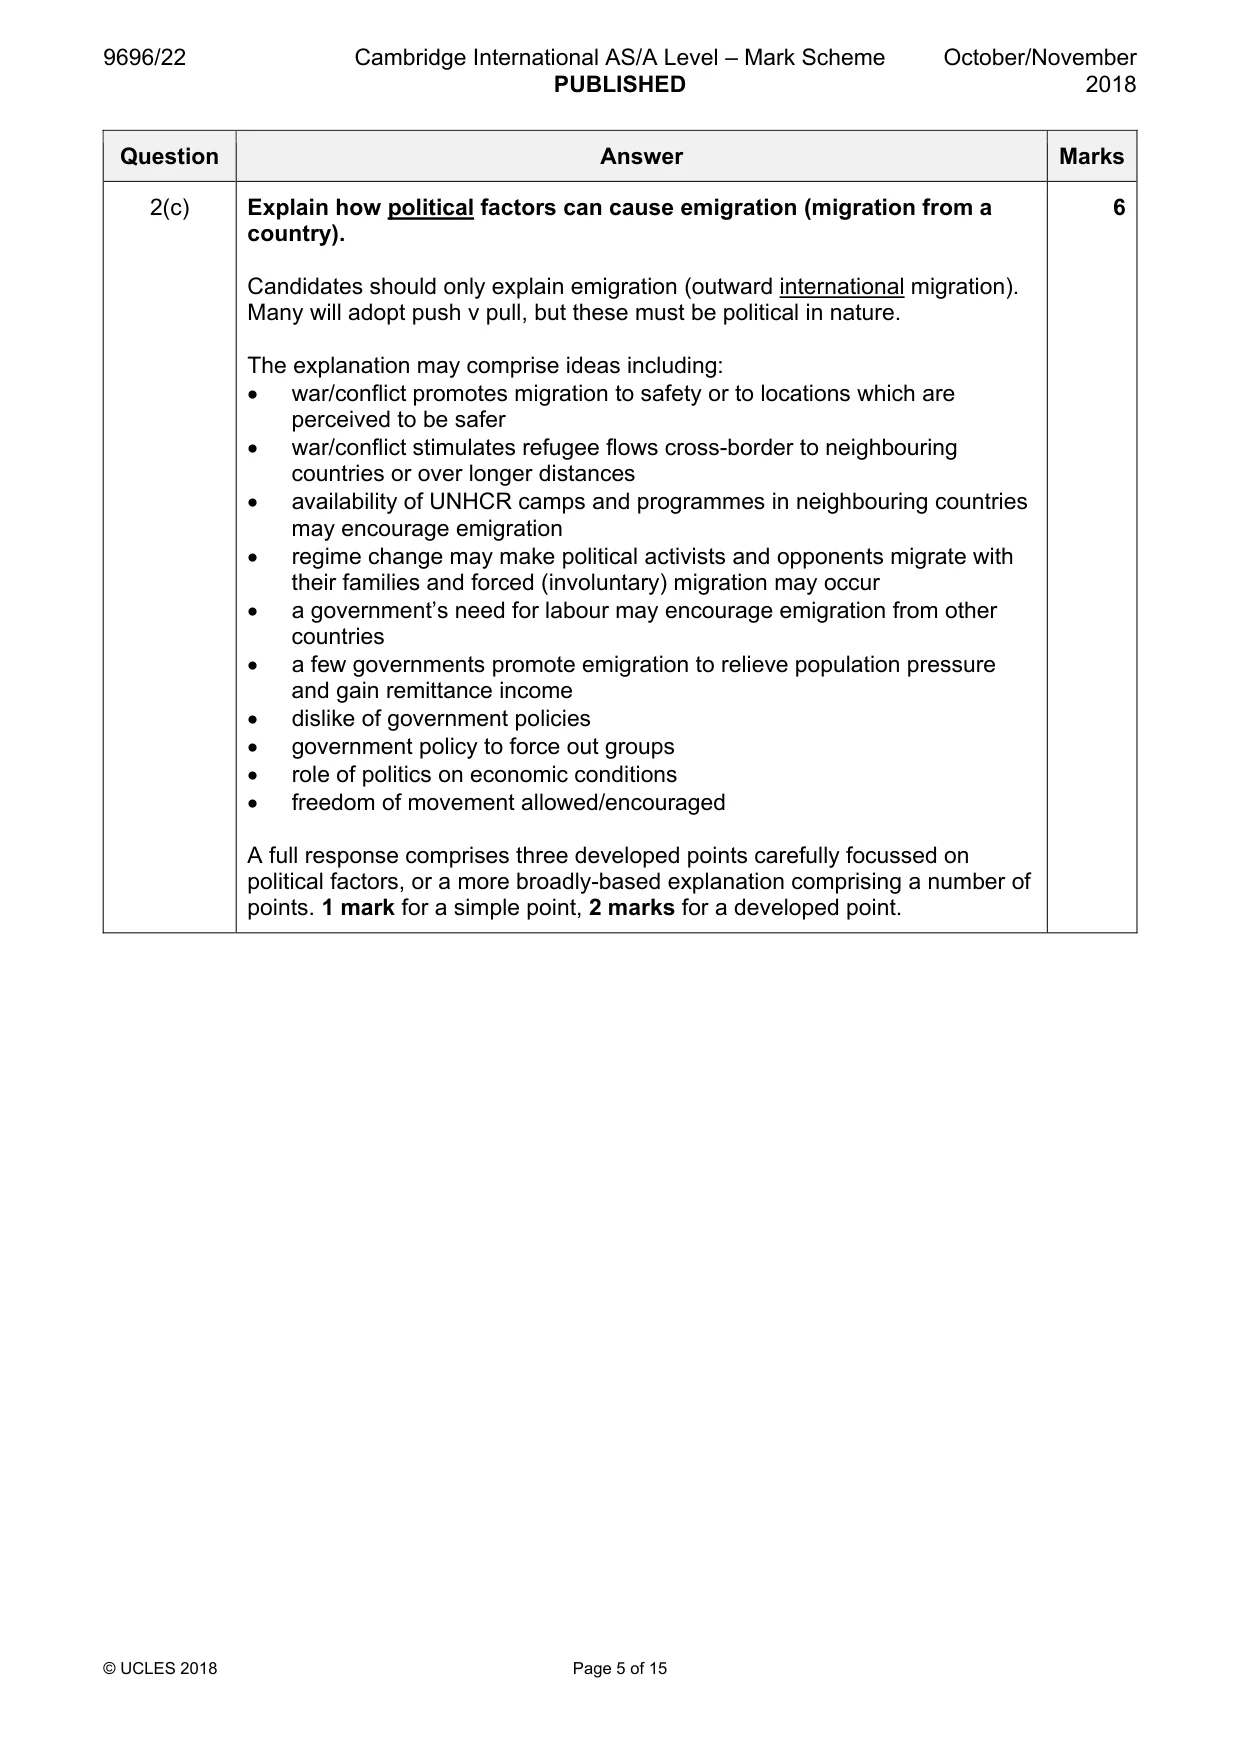
Mark scheme: 2(a) Fig. 2.1 shows migration losses and gains for six countries in Europe, 2 2000–10. Compare the migration data shown in Fig. 2.1 for FYR Macedonia and Montenegro. Macedonia had a small migration loss (−0.6%), whereas Montenegro had a small migration gain (+ 0.8%). For the comparison/a comparative element 1 mark, and for the data support 1 mark. 2(b) Give one reason why the migration data shown in Fig. 2.1 may not be 2 accurate. A number of valid reasons may be offered, falling in three broad areas: • issues of data collection, e.g. survey access/methods, migrants are on the move, language issues • issues of data processing, e.g. calculation errors, rounding, government ‘fixing’ the data, lack of comparability between countries • migrants avoid being counted, e.g. to avoid taxation • illegal (1 mark) so« (2nd mark) For a simple reason 1 mark and for a developed reason which may be linked to Fig. 2.1 or supported by an example 2 marks. 2(c) Explain how political factors can cause emigration (migration from a 6 country). Candidates should only explain emigration (outward international migration). Many will adopt push v pull, but these must be political in nature. The explanation may comprise ideas including: • war/conflict promotes migration to safety or to locations which are perceived to be safer • war/conflict stimulates refugee flows cross-border to neighbouring countries or over longer distances • availability of UNHCR camps and programmes in neighbouring countries may encourage emigration • regime change may make political activists and opponents migrate with their families and forced (involuntary) migration may occur • a government’s need for labour may encourage emigration from other countries • a few governments promote emigration to relieve population pressure and gain remittance income • dislike of government policies • government policy to force out groups • role of politics on economic conditions • freedom of movement allowed/encouraged A full response comprises three developed points carefully focussed on political factors, or a more broadly-based explanation comprising a number of points. 1 mark for a simple point, 2 marks for a developed point. Settlement dynamics
Q3 · The ten districts with the highest proportion of elderly people living in low income…
3 Table 3.1 shows the ten districts with the highest proportion of elderly people living in low income households in London, UK, an HIC in Europe, in 2015. (a) Name the district shown in Table 3.1 in which one third of elderly people were living in low income households. [1] (b) Describe the variation in the data shown in Table 3.1. [3] (c) Explain how income causes residential segregation within urban areas. [6] [Total: 10]
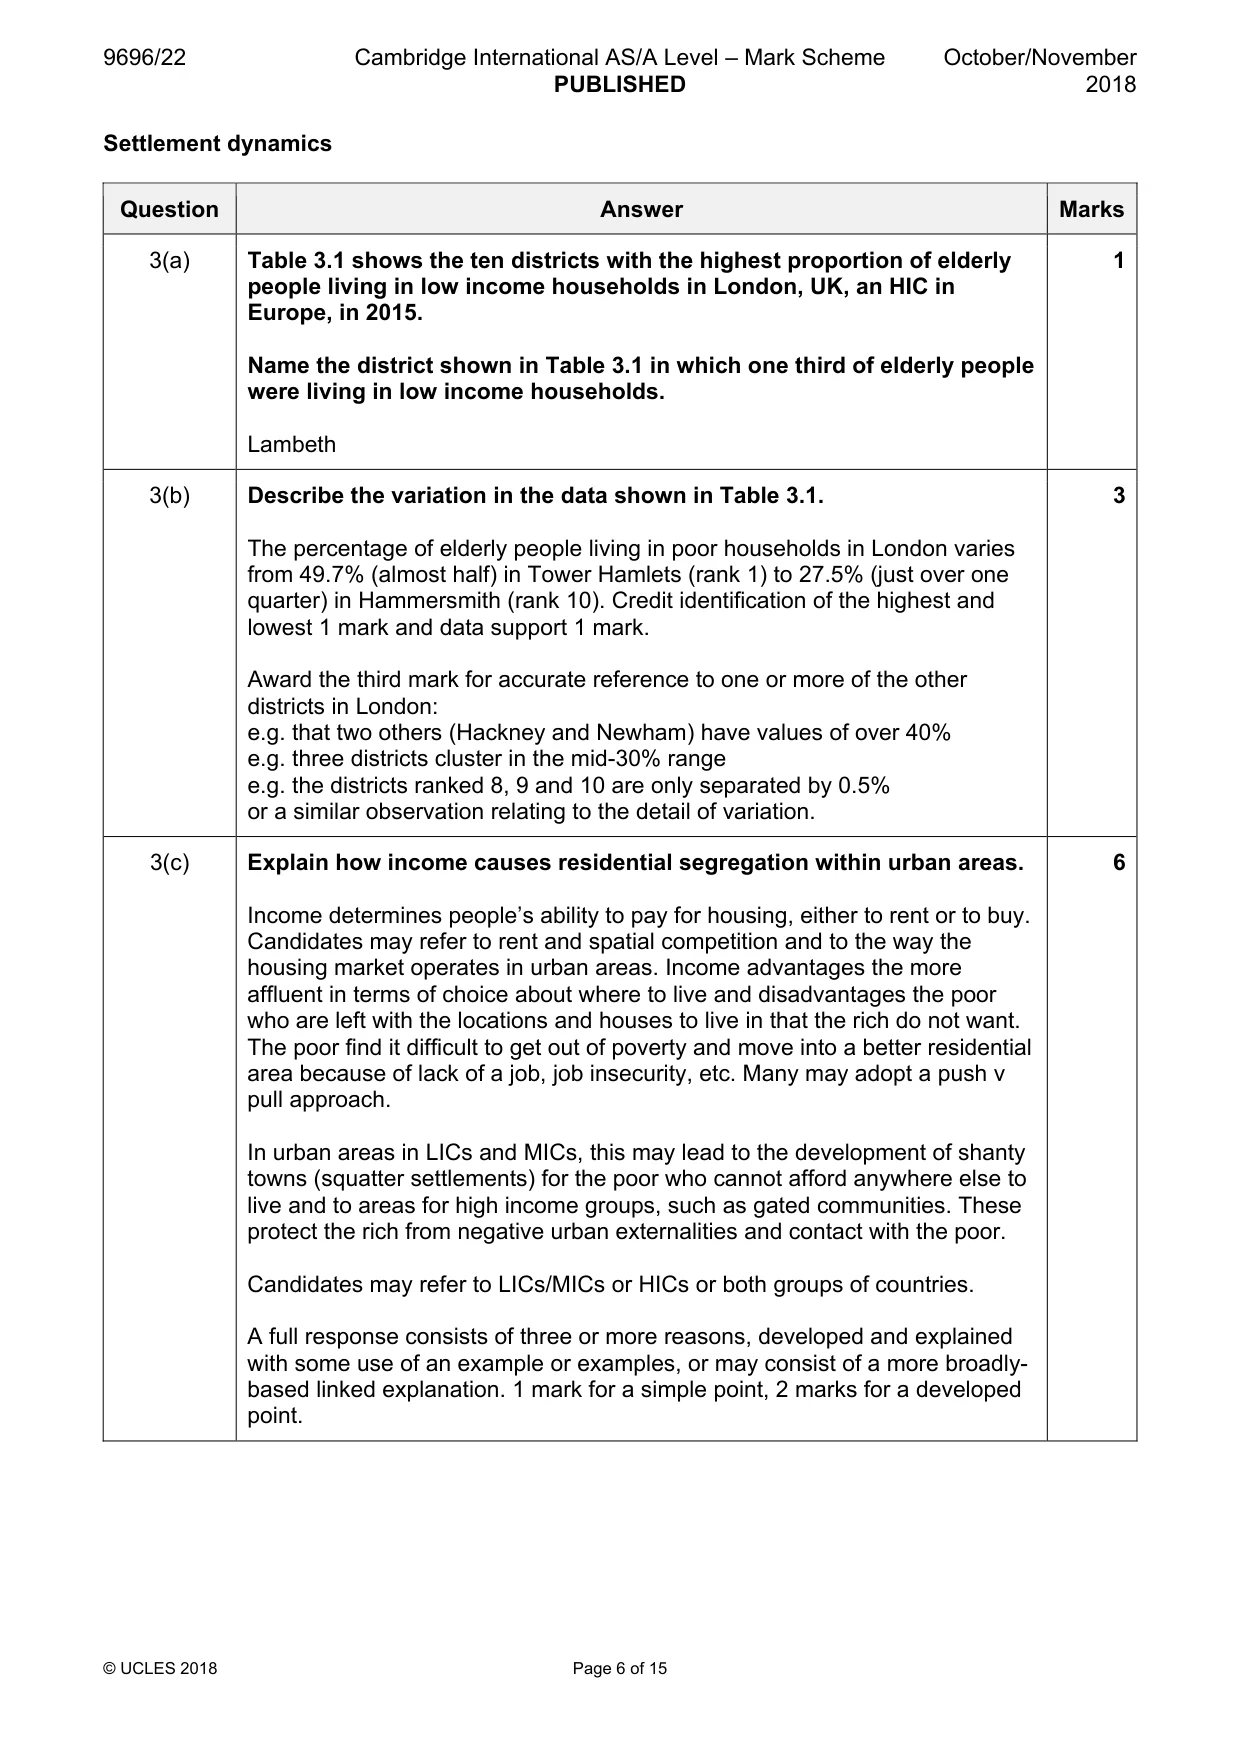
Mark scheme: 3(a) Table 3.1 shows the ten districts with the highest proportion of elderly 1 people living in low income households in London, UK, an HIC in Europe, in 2015. Name the district shown in Table 3.1 in which one third of elderly people were living in low income households. Lambeth 3(b) Describe the variation in the data shown in Table 3.1. 3 The percentage of elderly people living in poor households in London varies from 49.7% (almost half) in Tower Hamlets (rank 1) to 27.5% (just over one quarter) in Hammersmith (rank 10). Credit identification of the highest and lowest 1 mark and data support 1 mark. Award the third mark for accurate reference to one or more of the other districts in London: e.g. that two others (Hackney and Newham) have values of over 40% e.g. three districts cluster in the mid-30% range e.g. the districts ranked 8, 9 and 10 are only separated by 0.5% or a similar observation relating to the detail of variation. 3(c) Explain how income causes residential segregation within urban areas. 6 Income determines people’s ability to pay for housing, either to rent or to buy. Candidates may refer to rent and spatial competition and to the way the housing market operates in urban areas. Income advantages the more affluent in terms of choice about where to live and disadvantages the poor who are left with the locations and houses to live in that the rich do not want. The poor find it difficult to get out of poverty and move into a better residential area because of lack of a job, job insecurity, etc. Many may adopt a push v pull approach. In urban areas in LICs and MICs, this may lead to the development of shanty towns (squatter settlements) for the poor who cannot afford anywhere else to live and to areas for high income groups, such as gated communities. These protect the rich from negative urban externalities and contact with the poor. Candidates may refer to LICs/MICs or HICs or both groups of countries. A full response consists of three or more reasons, developed and explained with some use of an example or examples, or may consist of a more broadly- based linked explanation. 1 mark for a simple point, 2 marks for a developed point. Section B Answer one question from this section. Population/Migration
Q4 · Describe how to calculate a dependency ratio
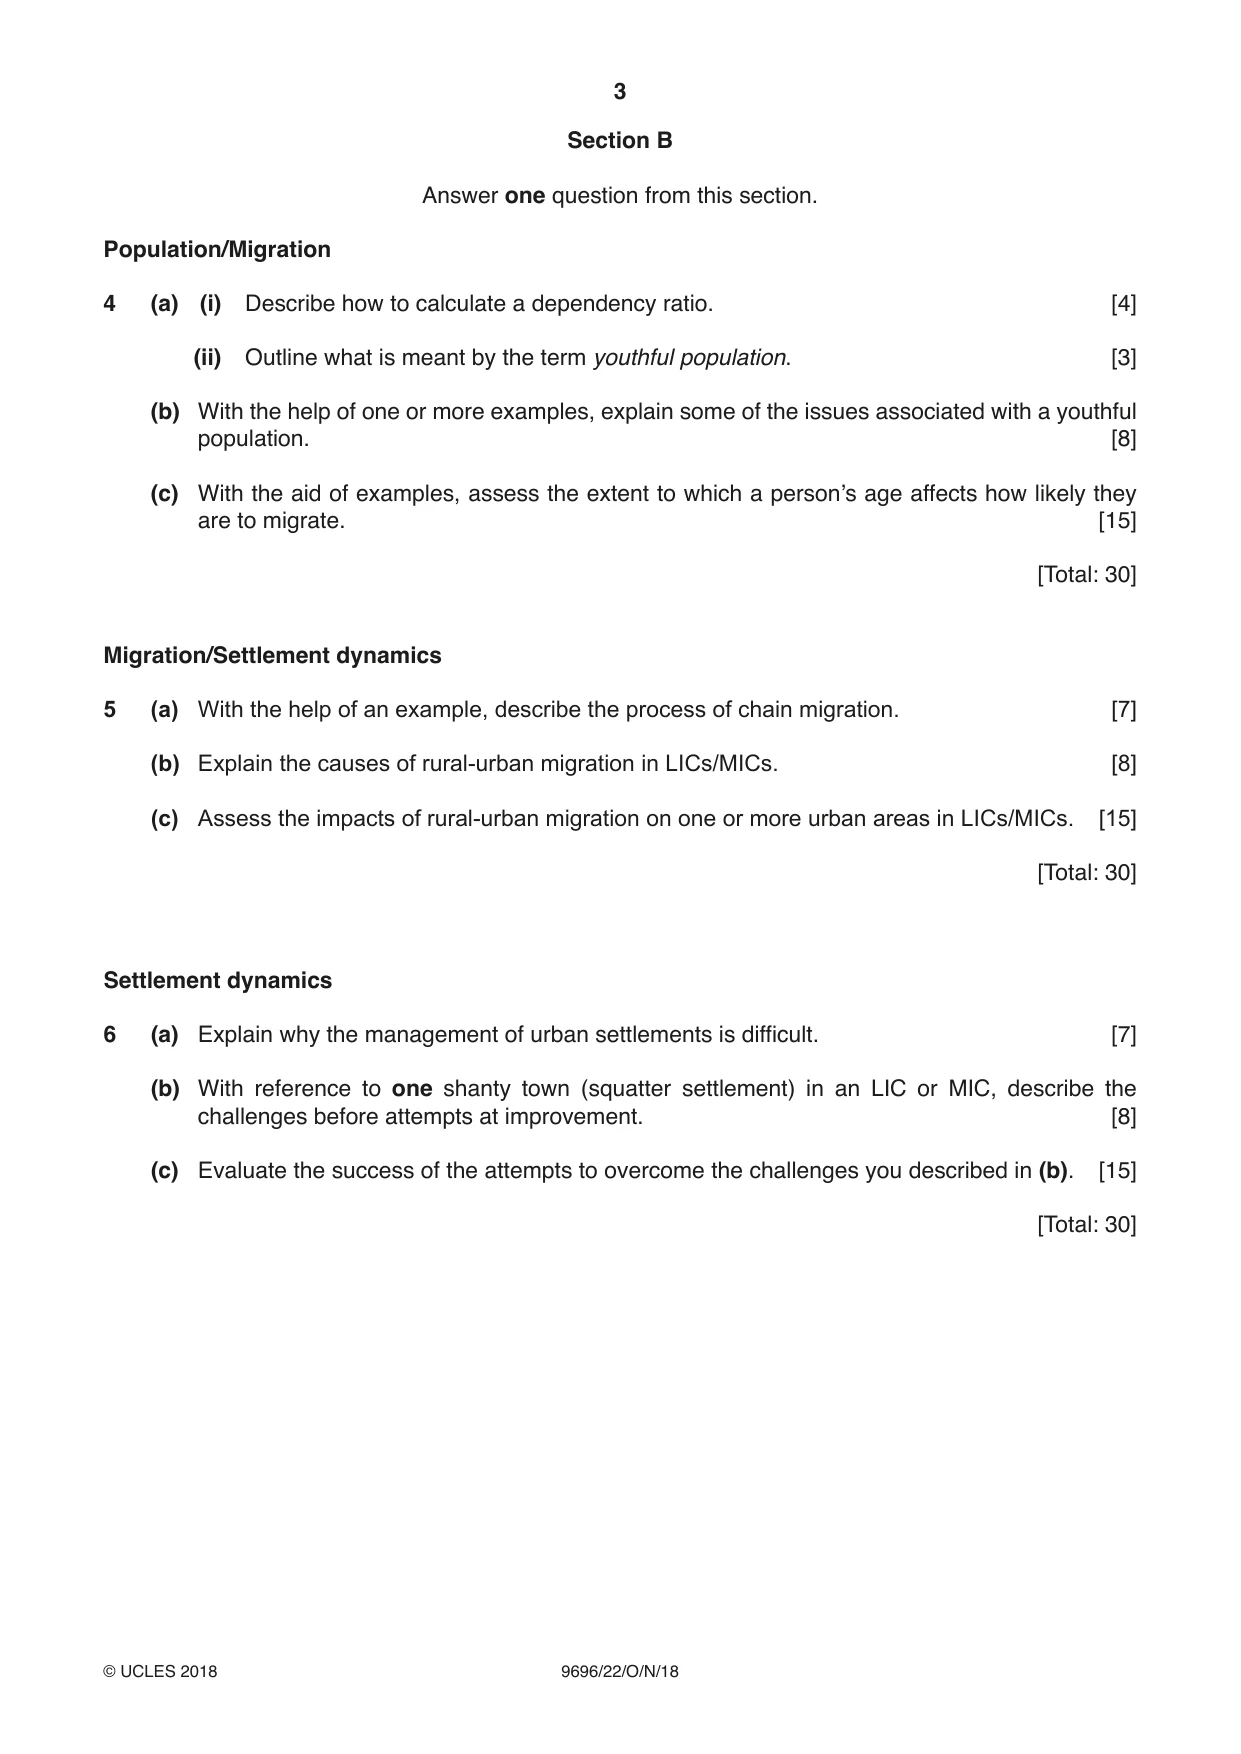
4 (a) (i) Describe how to calculate a dependency ratio. [4] (ii) Outline what is meant by the term youthful population. [3] (b) With the help of one or more examples, explain some of the issues associated with a youthful population. [8] (c) With the aid of examples, assess the extent to which a person’s age affects how likely they are to migrate. [15] [Total: 30] Migration/Settlement dynamics
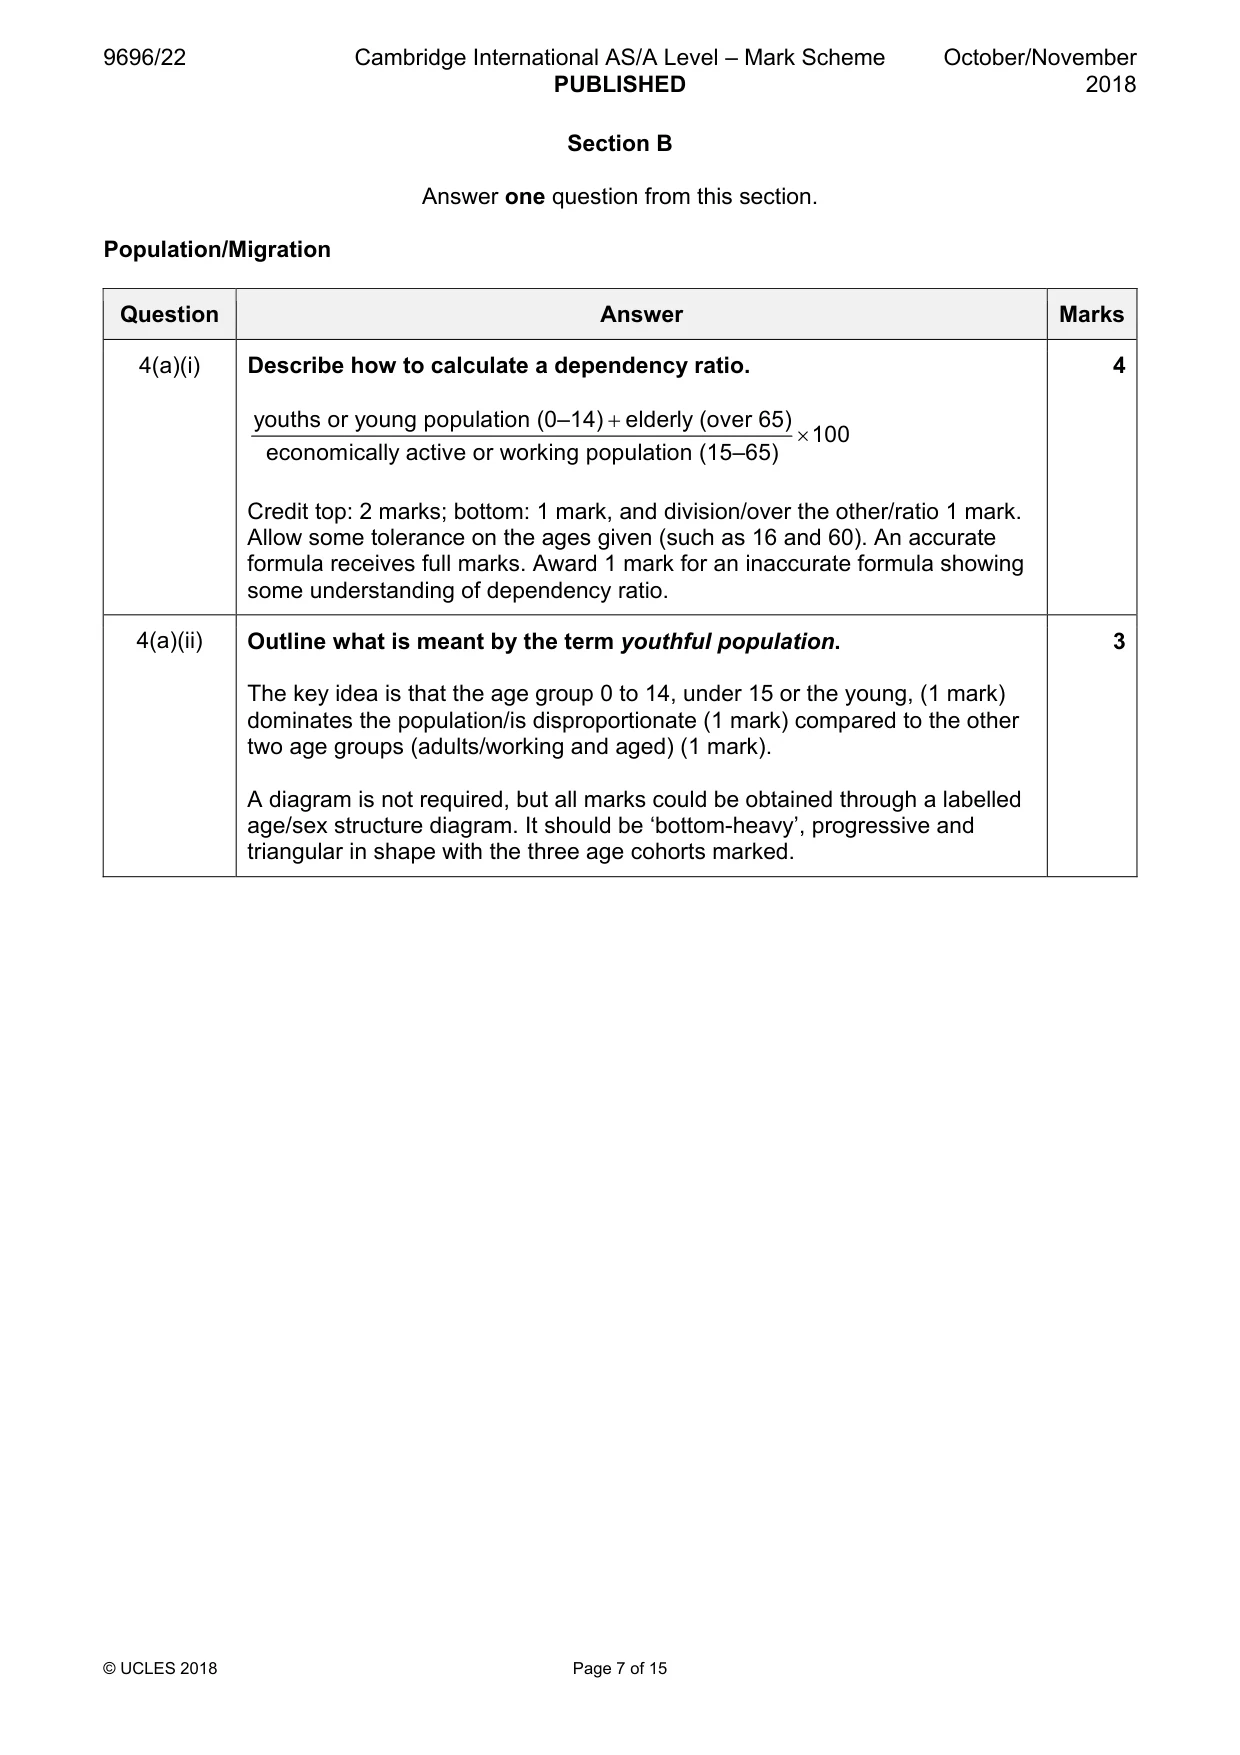
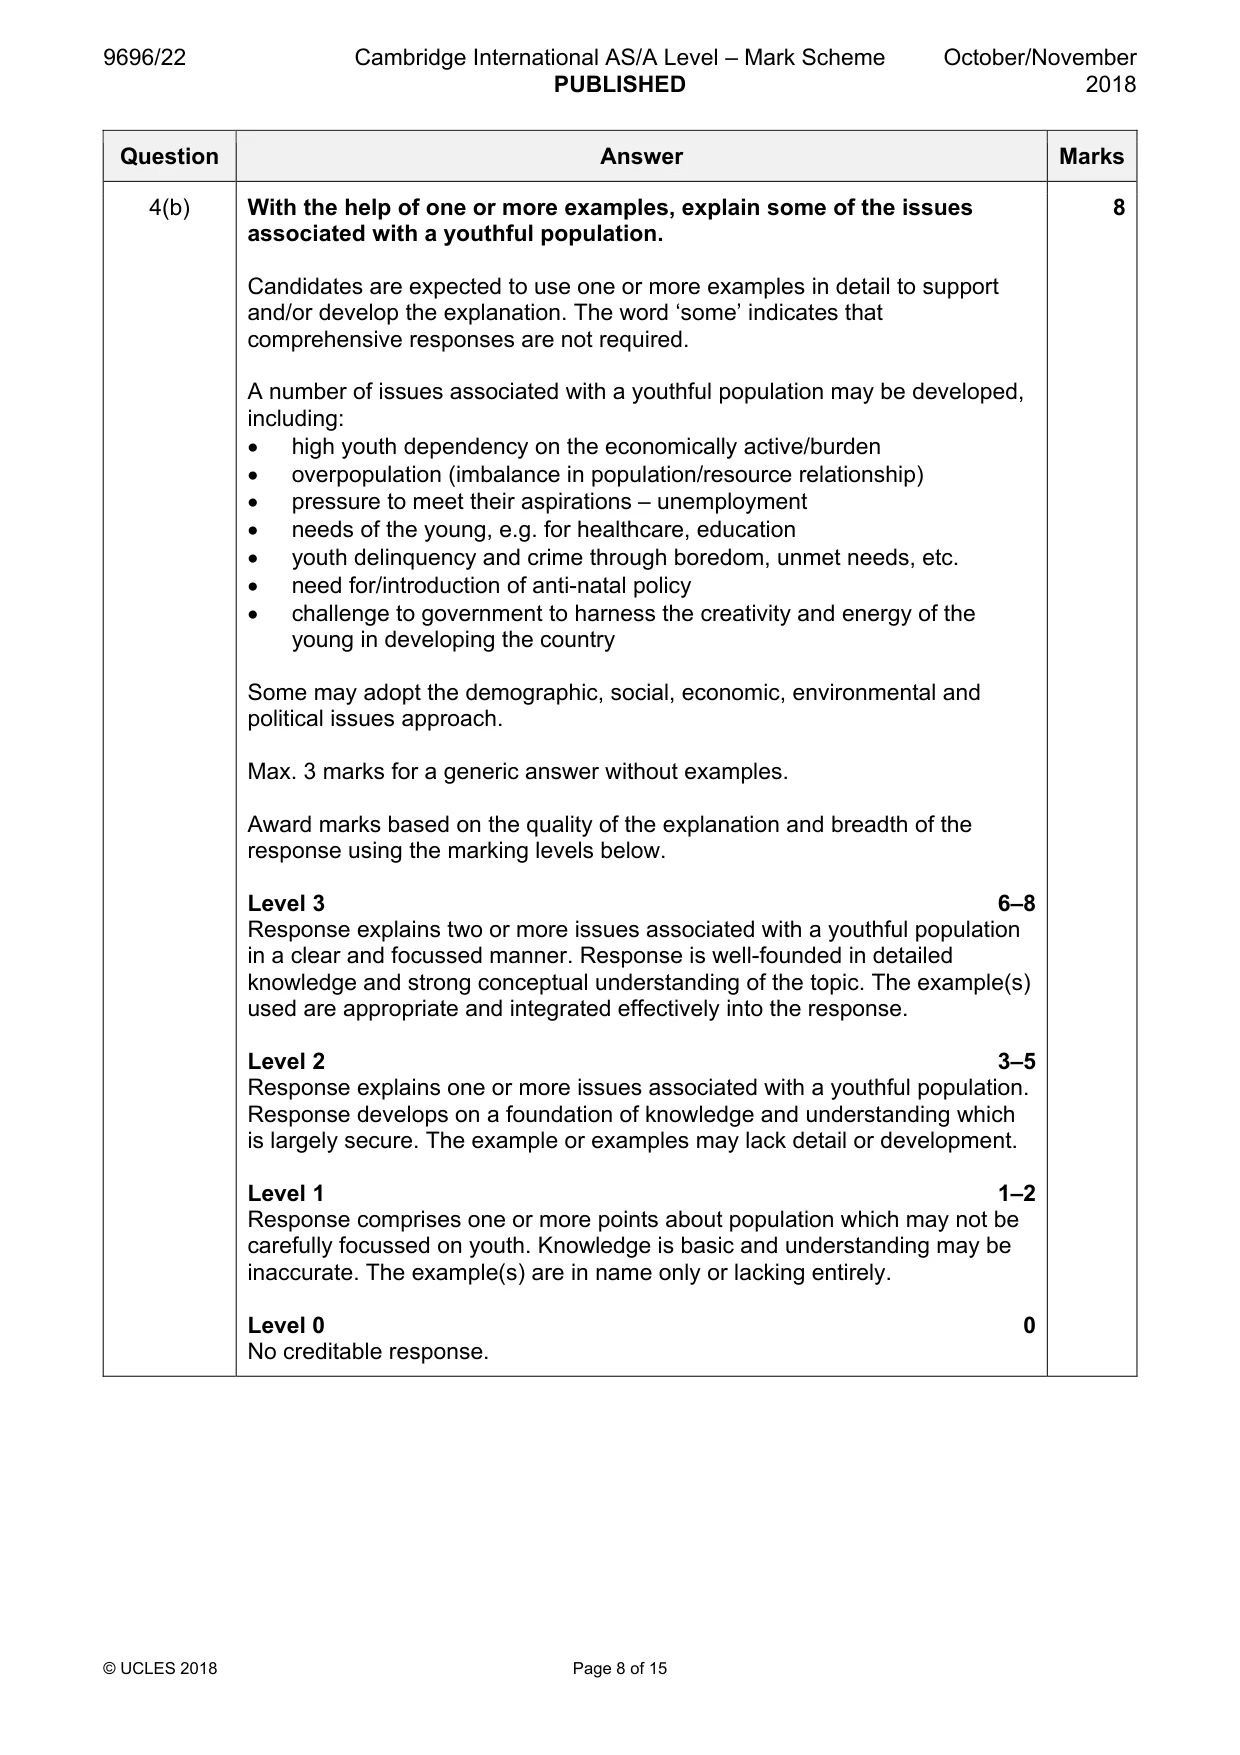
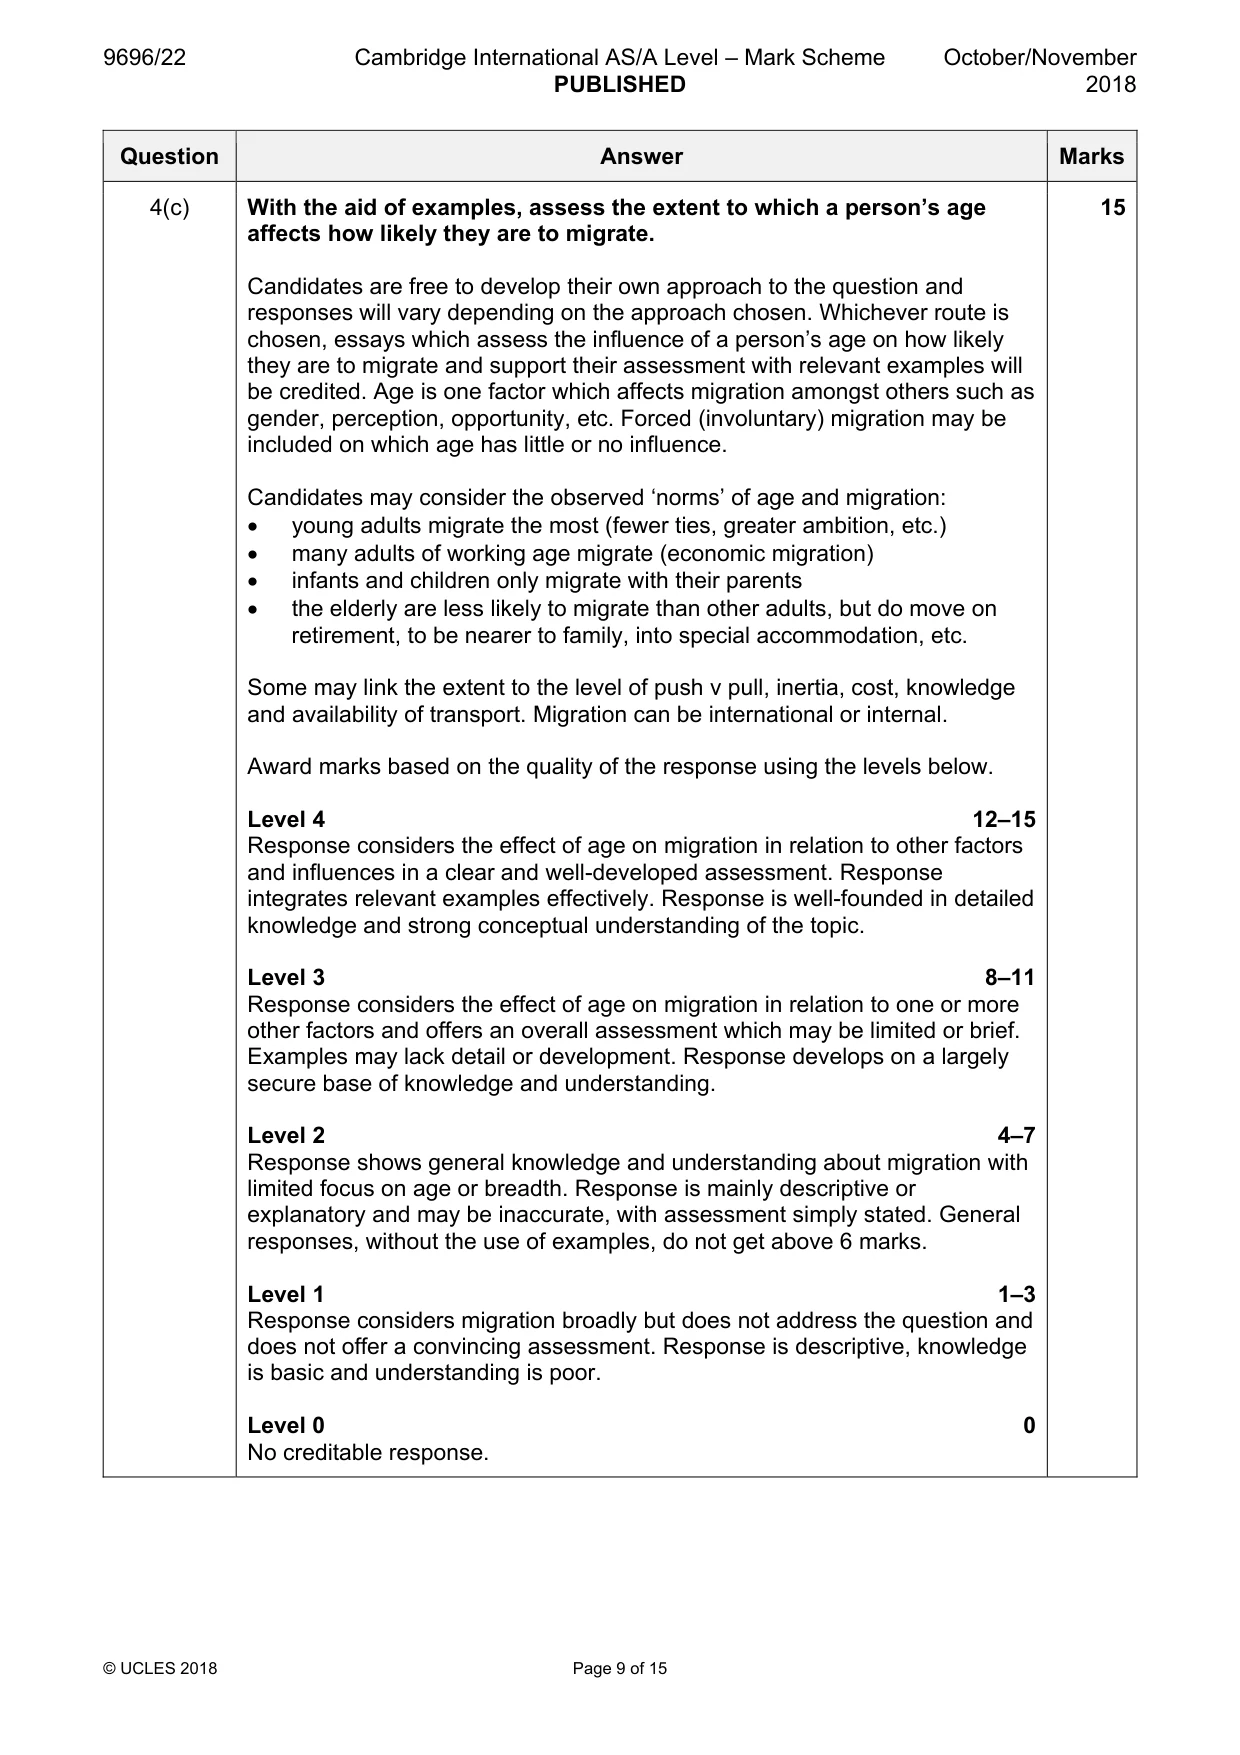
Mark scheme: 4(a)(i) Describe how to calculate a dependency ratio. 4 youths or young population (0–14) + elderly (over 65) × 10 0 economically active or working population (1 5–65) Credit top: 2 marks; bottom: 1 mark, and division/over the other/ratio 1 mark. Allow some tolerance on the ages given (such as 16 and 60). An accurate formula receives full marks. Award 1 mark for an inaccurate formula showing some understanding of dependency ratio. 4(a)(ii) Outline what is meant by the term youthful population. 3 The key idea is that the age group 0 to 14, under 15 or the young, (1 mark) dominates the population/is disproportionate (1 mark) compared to the other two age groups (adults/working and aged) (1 mark). A diagram is not required, but all marks could be obtained through a labelled age/sex structure diagram. It should be ‘bottom-heavy’, progressive and triangular in shape with the three age cohorts marked. 4(b) With the help of one or more examples, explain some of the issues 8 associated with a youthful population. Candidates are expected to use one or more examples in detail to support and/or develop the explanation. The word ‘some’ indicates that comprehensive responses are not required. A number of issues associated with a youthful population may be developed, including: • high youth dependency on the economically active/burden • overpopulation (imbalance in population/resource relationship) • pressure to meet their aspirations – unemployment • needs of the young, e.g. for healthcare, education • youth delinquency and crime through boredom, unmet needs, etc. • need for/introduction of anti-natal policy • challenge to government to harness the creativity and energy of the young in developing the country Some may adopt the demographic, social, economic, environmental and political issues approach. Max. 3 marks for a generic answer without examples. Award marks based on the quality of the explanation and breadth of the response using the marking levels below. Level 3 6–8 Response explains two or more issues associated with a youthful population in a clear and focussed manner. Response is well-founded in detailed knowledge and strong conceptual understanding of the topic. The example(s) used are appropriate and integrated effectively into the response. Level 2 3–5 Response explains one or more issues associated with a youthful population. Response develops on a foundation of knowledge and understanding which is largely secure. The example or examples may lack detail or development. Level 1 1–2 Response comprises one or more points about population which may not be carefully focussed on youth. Knowledge is basic and understanding may be inaccurate. The example(s) are in name only or lacking entirely. Level 0 0 No creditable response. 4(c) With the aid of examples, assess the extent to which a person’s age 15 affects how likely they are to migrate. Candidates are free to develop their own approach to the question and responses will vary depending on the approach chosen. Whichever route is chosen, essays which assess the influence of a person’s age on how likely they are to migrate and support their assessment with relevant examples will be credited. Age is one factor which affects migration amongst others such as gender, perception, opportunity, etc. Forced (involuntary) migration may be included on which age has little or no influence. Candidates may consider the observed ‘norms’ of age and migration: • young adults migrate the most (fewer ties, greater ambition, etc.) • many adults of working age migrate (economic migration) • infants and children only migrate with their parents • the elderly are less likely to migrate than other adults, but do move on retirement, to be nearer to family, into special accommodation, etc. Some may link the extent to the level of push v pull, inertia, cost, knowledge and availability of transport. Migration can be international or internal. Award marks based on the quality of the response using the levels below. Level 4 12–15 Response considers the effect of age on migration in relation to other factors and influences in a clear and well-developed assessment. Response integrates relevant examples effectively. Response is well-founded in detailed knowledge and strong conceptual understanding of the topic. Level 3 8–11 Response considers the effect of age on migration in relation to one or more other factors and offers an overall assessment which may be limited or brief. Examples may lack detail or development. Response develops on a largely secure base of knowledge and understanding. Level 2 4–7 Response shows general knowledge and understanding about migration with limited focus on age or breadth. Response is mainly descriptive or explanatory and may be inaccurate, with assessment simply stated. General responses, without the use of examples, do not get above 6 marks. Level 1 1–3 Response considers migration broadly but does not address the question and does not offer a convincing assessment. Response is descriptive, knowledge is basic and understanding is poor. Level 0 0 No creditable response. Migration/Settlement dynamics
Q5 · With the help of an example, describe the process of chain migration
5 (a) With the help of an example, describe the process of chain migration. [7] (b) Explain the causes of rural-urban migration in LICs/MICs. [8] (c) Assess the impacts of rural-urban migration on one or more urban areas in LICs/MICs. [15] [Total: 30] Settlement dynamics
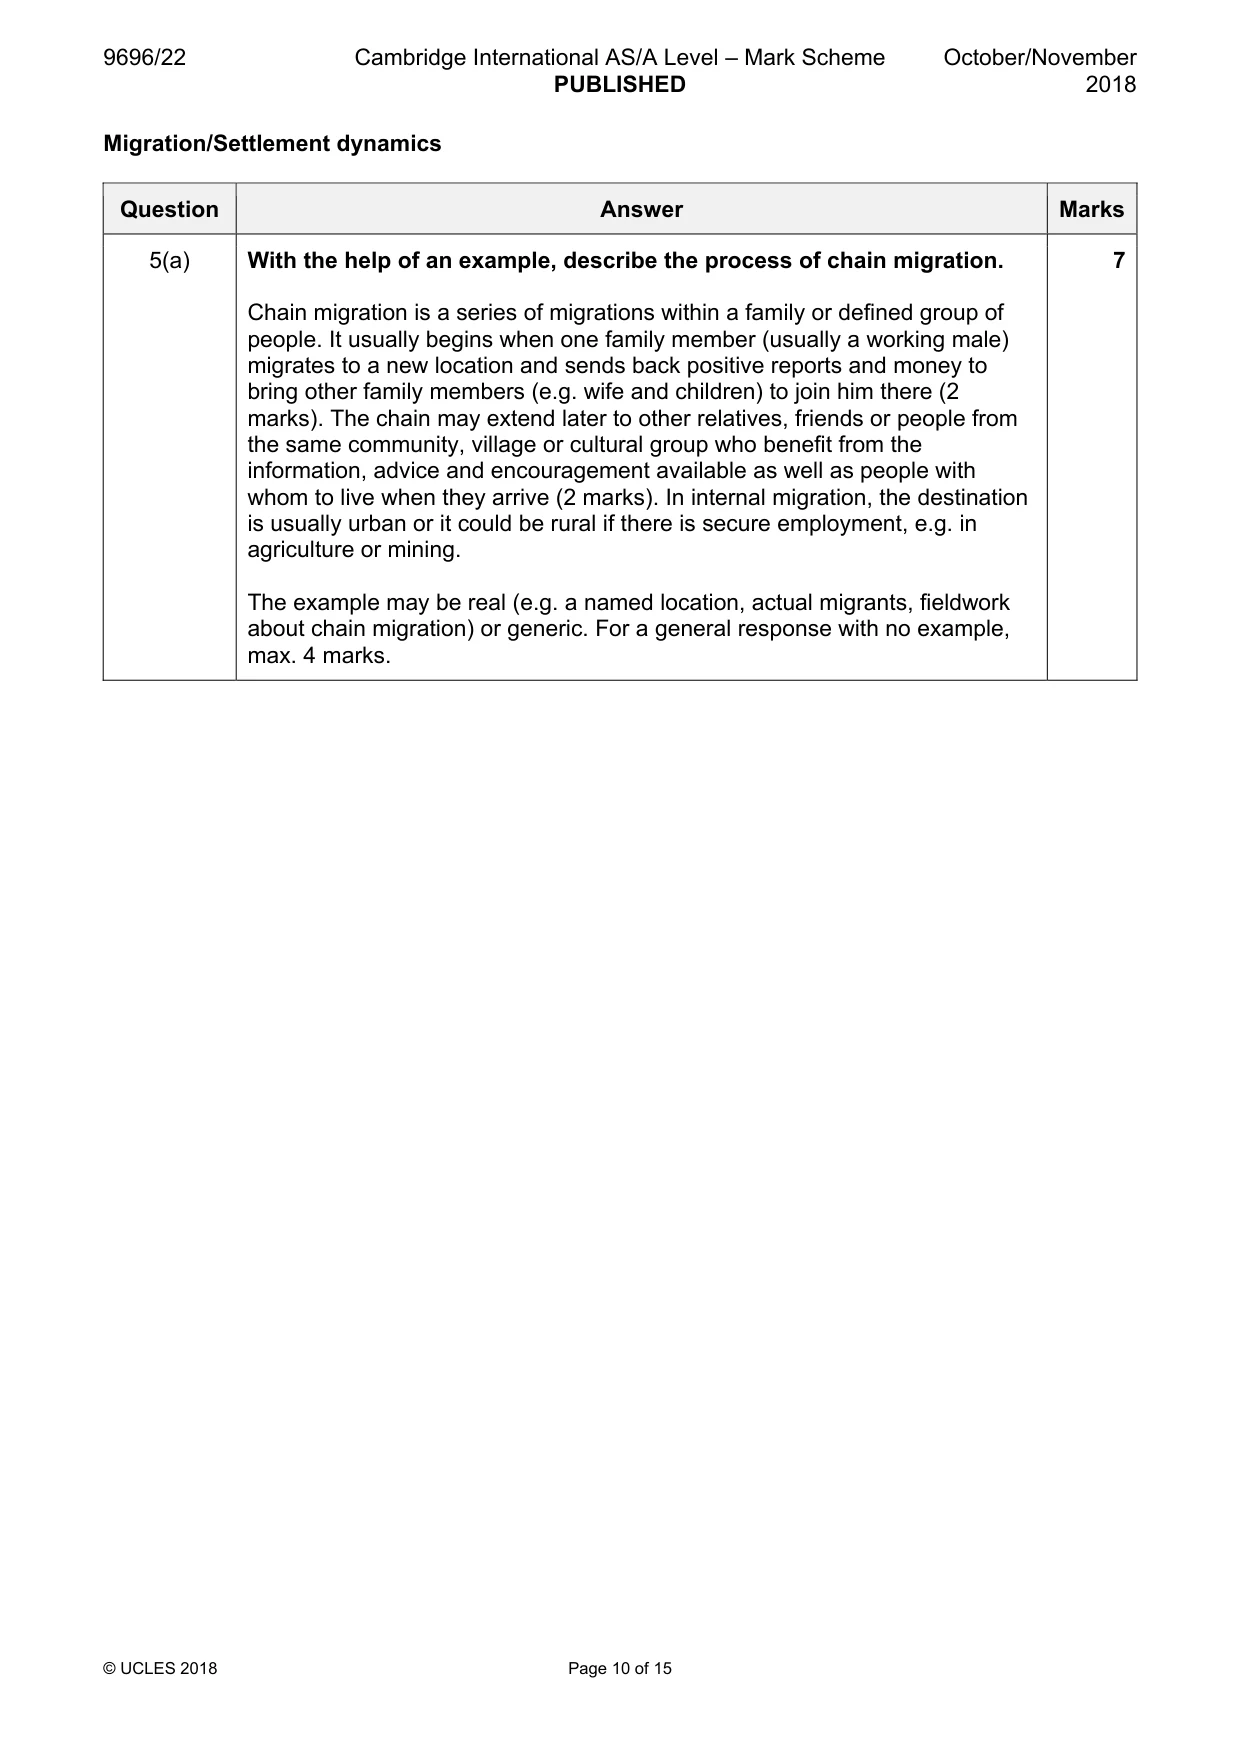
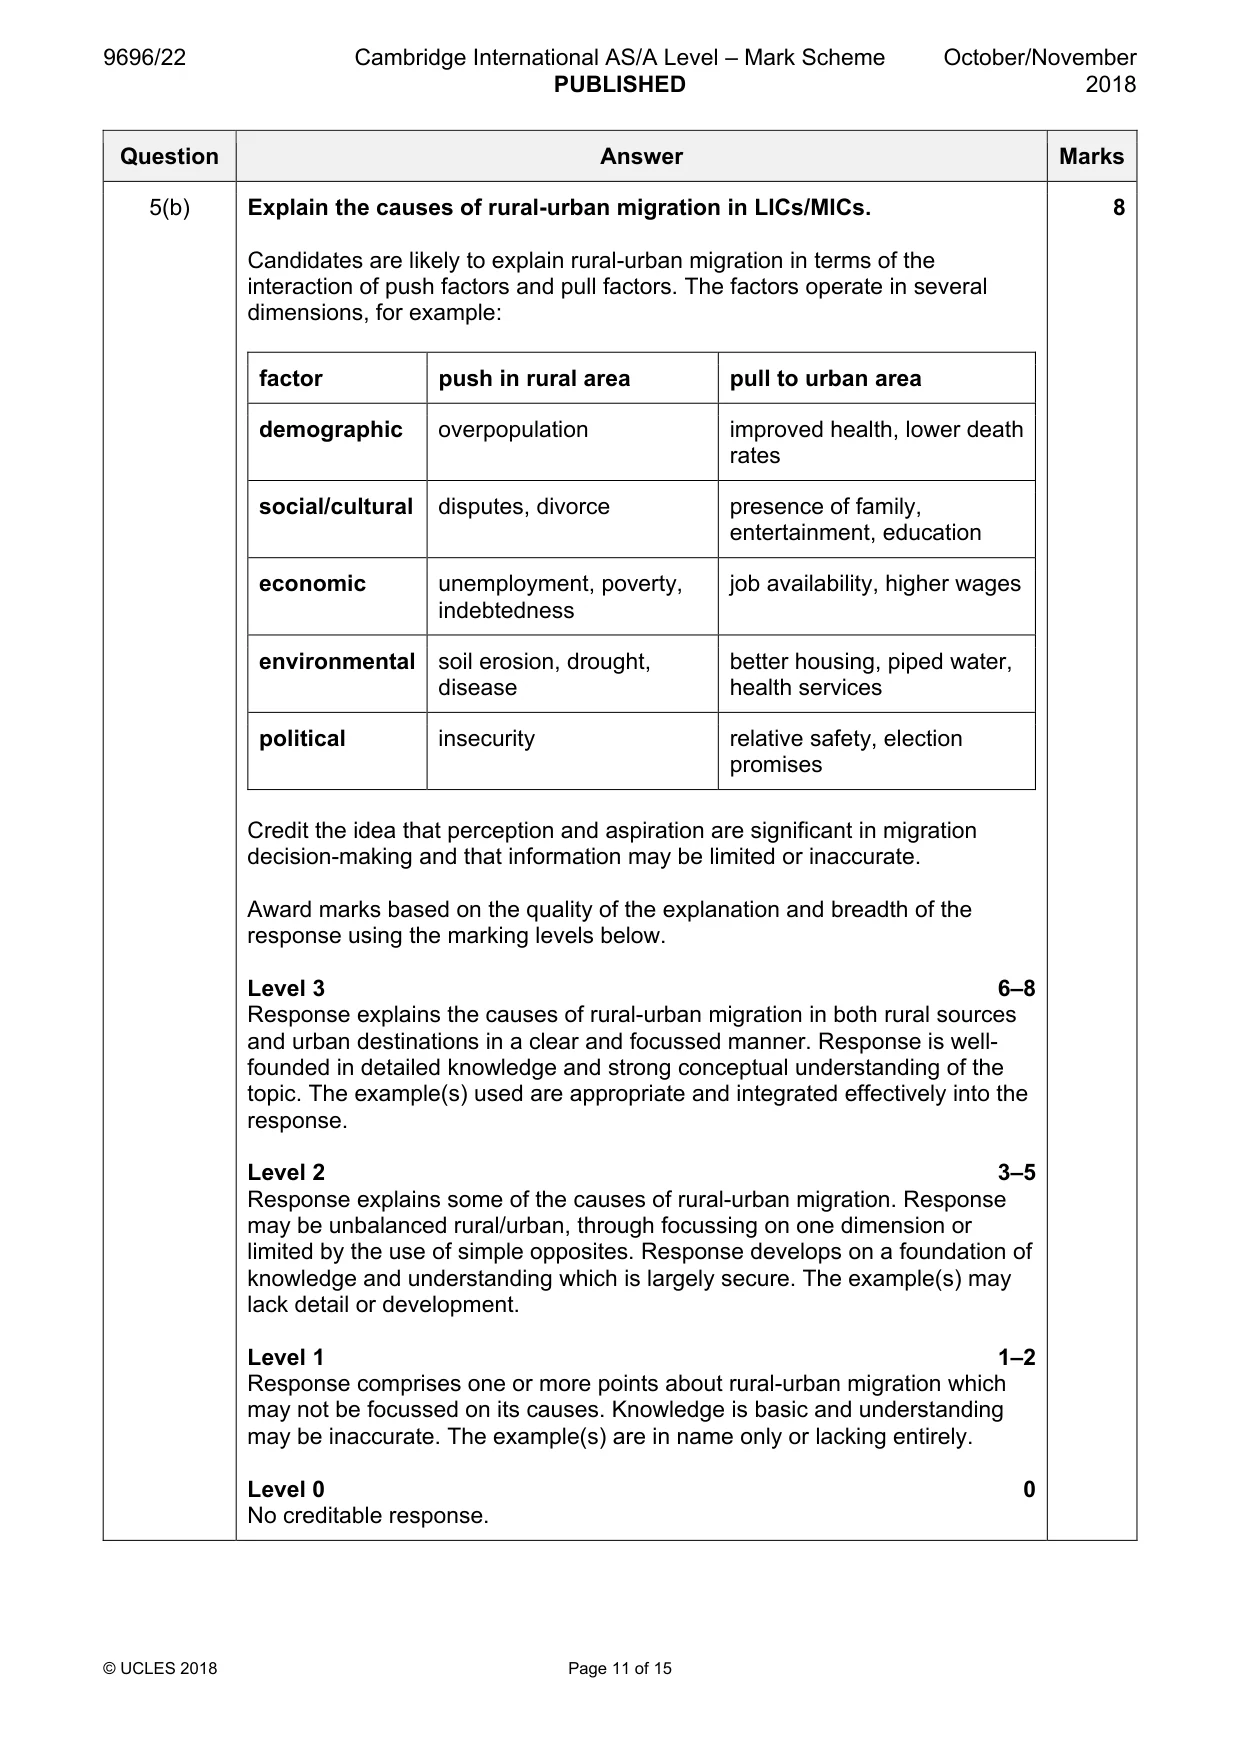
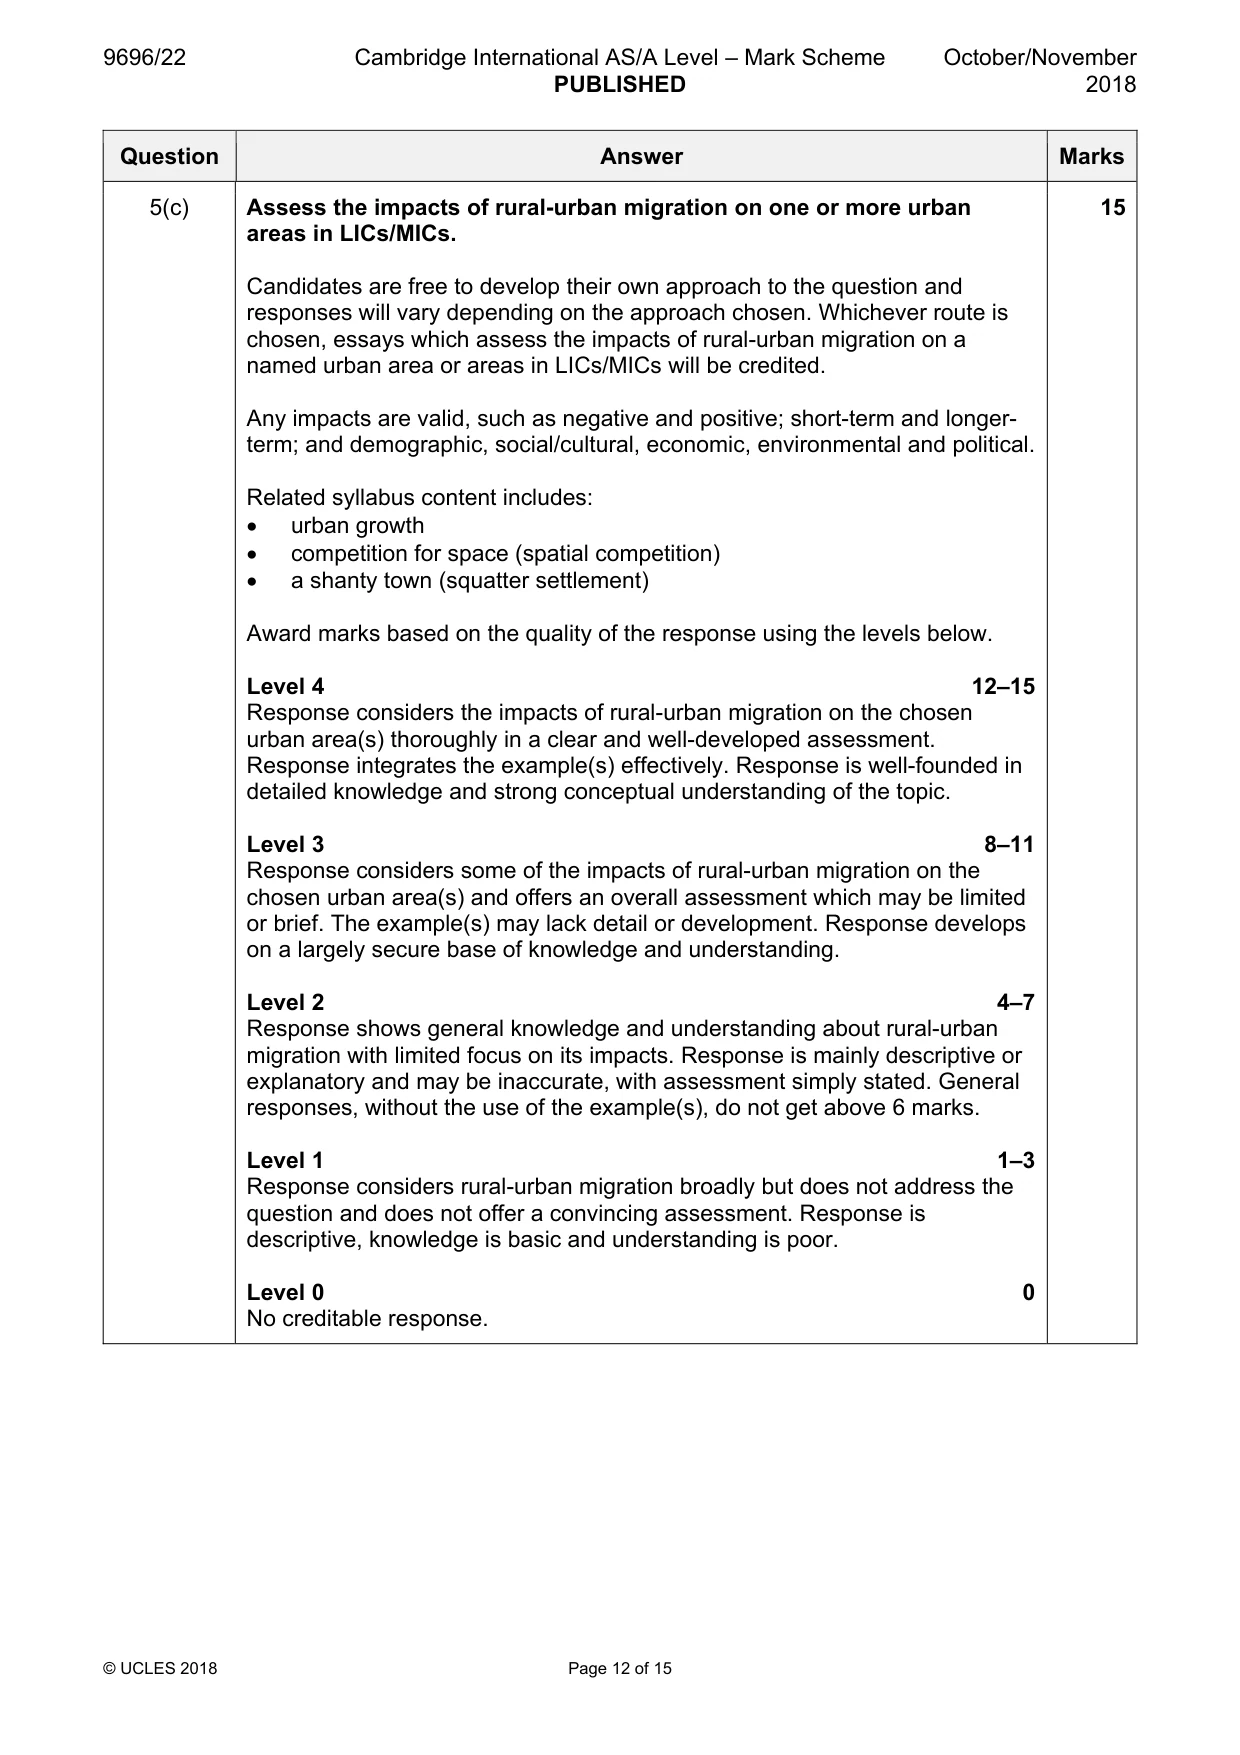
Mark scheme: 5(a) With the help of an example, describe the process of chain migration. 7 Chain migration is a series of migrations within a family or defined group of people. It usually begins when one family member (usually a working male) migrates to a new location and sends back positive reports and money to bring other family members (e.g. wife and children) to join him there (2 marks). The chain may extend later to other relatives, friends or people from the same community, village or cultural group who benefit from the information, advice and encouragement available as well as people with whom to live when they arrive (2 marks). In internal migration, the destination is usually urban or it could be rural if there is secure employment, e.g. in agriculture or mining. The example may be real (e.g. a named location, actual migrants, fieldwork about chain migration) or generic. For a general response with no example, max. 4 marks. 5(b) Explain the causes of rural-urban migration in LICs/MICs. 8 Candidates are likely to explain rural-urban migration in terms of the interaction of push factors and pull factors. The factors operate in several dimensions, for example: factor push in rural area pull to urban area demographic overpopulation improved health, lower death rates social/cultural disputes, divorce presence of family, entertainment, education economic unemployment, poverty, job availability, higher wages indebtedness environmental soil erosion, drought, better housing, piped water, disease health services political insecurity relative safety, election promises Credit the idea that perception and aspiration are significant in migration decision-making and that information may be limited or inaccurate. Award marks based on the quality of the explanation and breadth of the response using the marking levels below. Level 3 6–8 Response explains the causes of rural-urban migration in both rural sources and urban destinations in a clear and focussed manner. Response is well- founded in detailed knowledge and strong conceptual understanding of the topic. The example(s) used are appropriate and integrated effectively into the response. Level 2 3–5 Response explains some of the causes of rural-urban migration. Response may be unbalanced rural/urban, through focussing on one dimension or limited by the use of simple opposites. Response develops on a foundation of knowledge and understanding which is largely secure. The example(s) may lack detail or development. Level 1 1–2 Response comprises one or more points about rural-urban migration which may not be focussed on its causes. Knowledge is basic and understanding may be inaccurate. The example(s) are in name only or lacking entirely. Level 0 0 No creditable response. 5(c) Assess the impacts of rural-urban migration on one or more urban 15 areas in LICs/MICs. Candidates are free to develop their own approach to the question and responses will vary depending on the approach chosen. Whichever route is chosen, essays which assess the impacts of rural-urban migration on a named urban area or areas in LICs/MICs will be credited. Any impacts are valid, such as negative and positive; short-term and longer- term; and demographic, social/cultural, economic, environmental and political. Related syllabus content includes: • urban growth • competition for space (spatial competition) • a shanty town (squatter settlement) Award marks based on the quality of the response using the levels below. Level 4 12–15 Response considers the impacts of rural-urban migration on the chosen urban area(s) thoroughly in a clear and well-developed assessment. Response integrates the example(s) effectively. Response is well-founded in detailed knowledge and strong conceptual understanding of the topic. Level 3 8–11 Response considers some of the impacts of rural-urban migration on the chosen urban area(s) and offers an overall assessment which may be limited or brief. The example(s) may lack detail or development. Response develops on a largely secure base of knowledge and understanding. Level 2 4–7 Response shows general knowledge and understanding about rural-urban migration with limited focus on its impacts. Response is mainly descriptive or explanatory and may be inaccurate, with assessment simply stated. General responses, without the use of the example(s), do not get above 6 marks. Level 1 1–3 Response considers rural-urban migration broadly but does not address the question and does not offer a convincing assessment. Response is descriptive, knowledge is basic and understanding is poor. Level 0 0 No creditable response. Settlement dynamics
Q6 · Explain why the management of urban settlements is difficult
6 (a) Explain why the management of urban settlements is difficult. [7] (b) With reference to one shanty town (squatter settlement) in an LIC or MIC, describe the challenges before attempts at improvement. [8] (c) Evaluate the success of the attempts to overcome the challenges you described in (b). [15] [Total: 30]
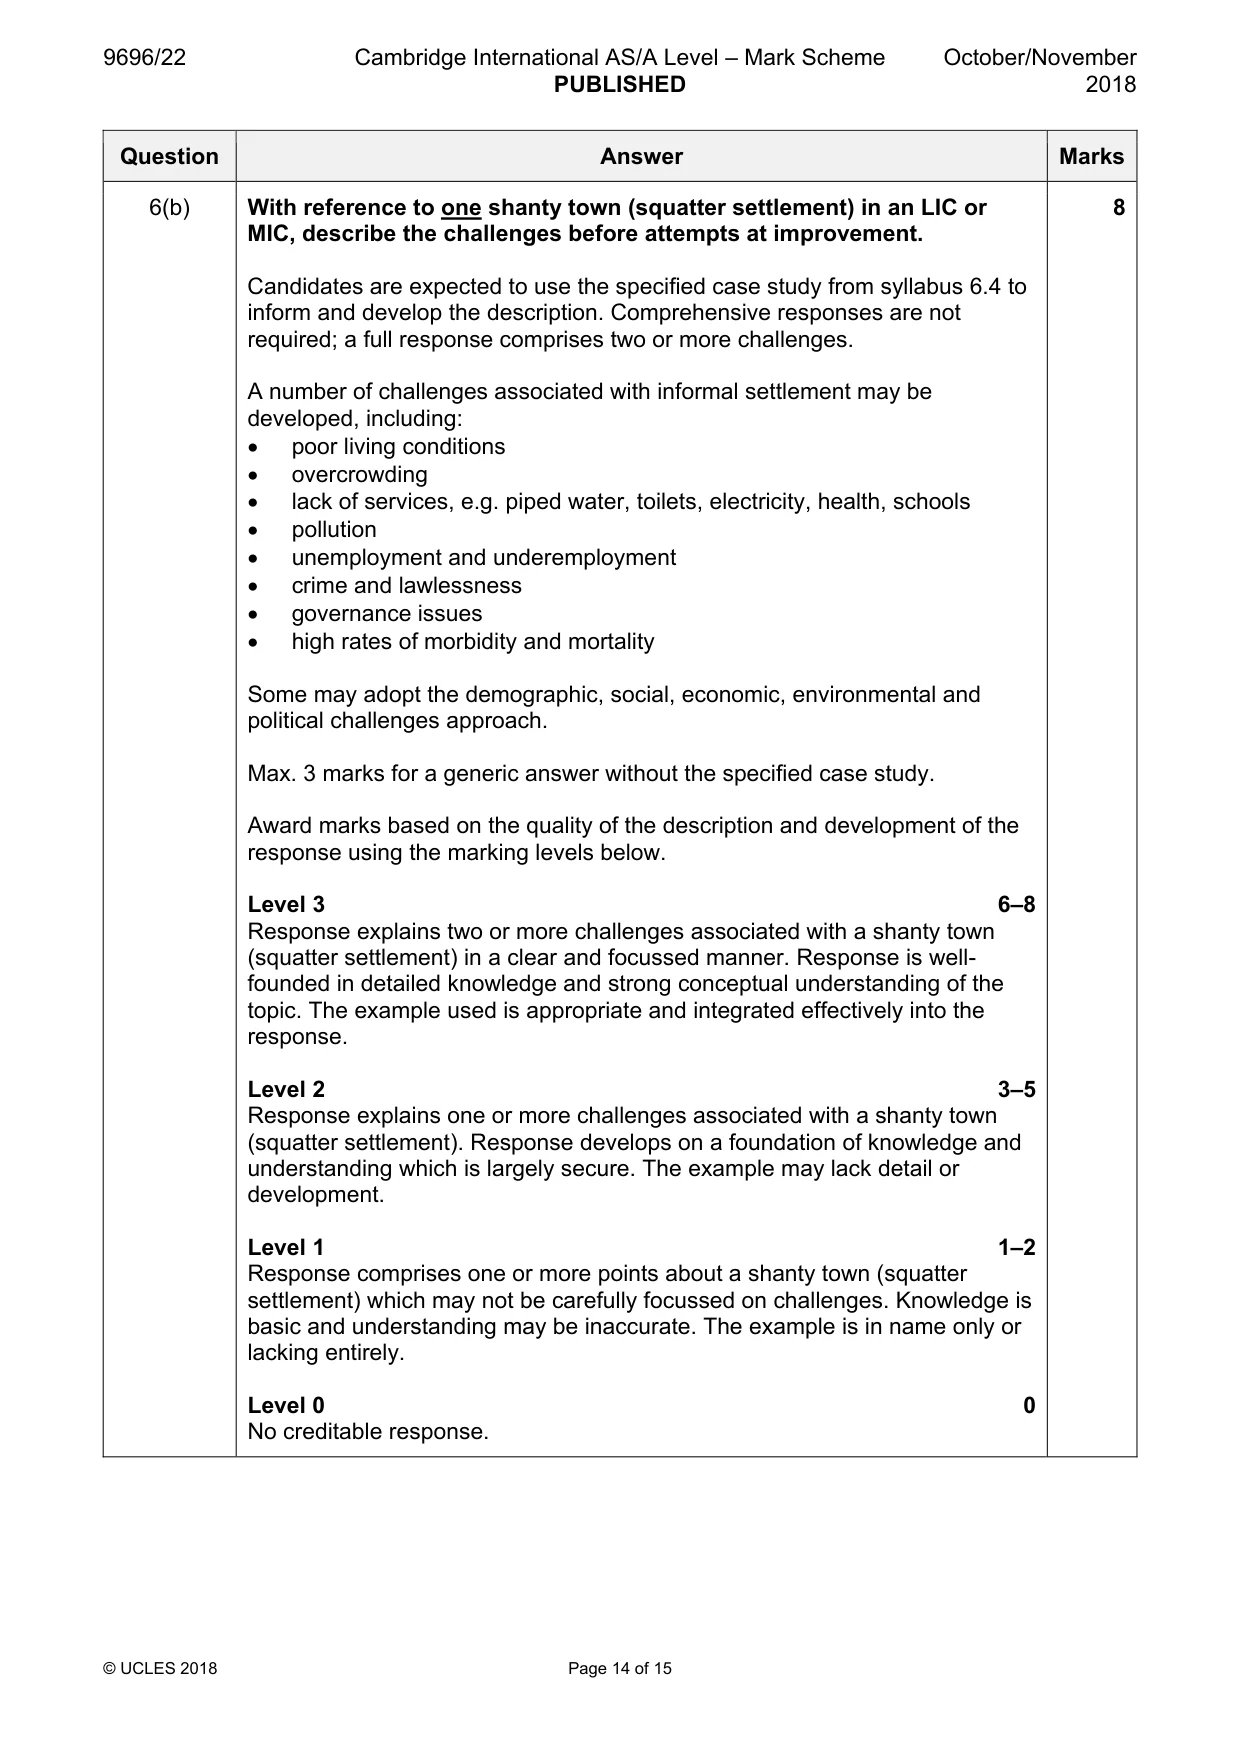
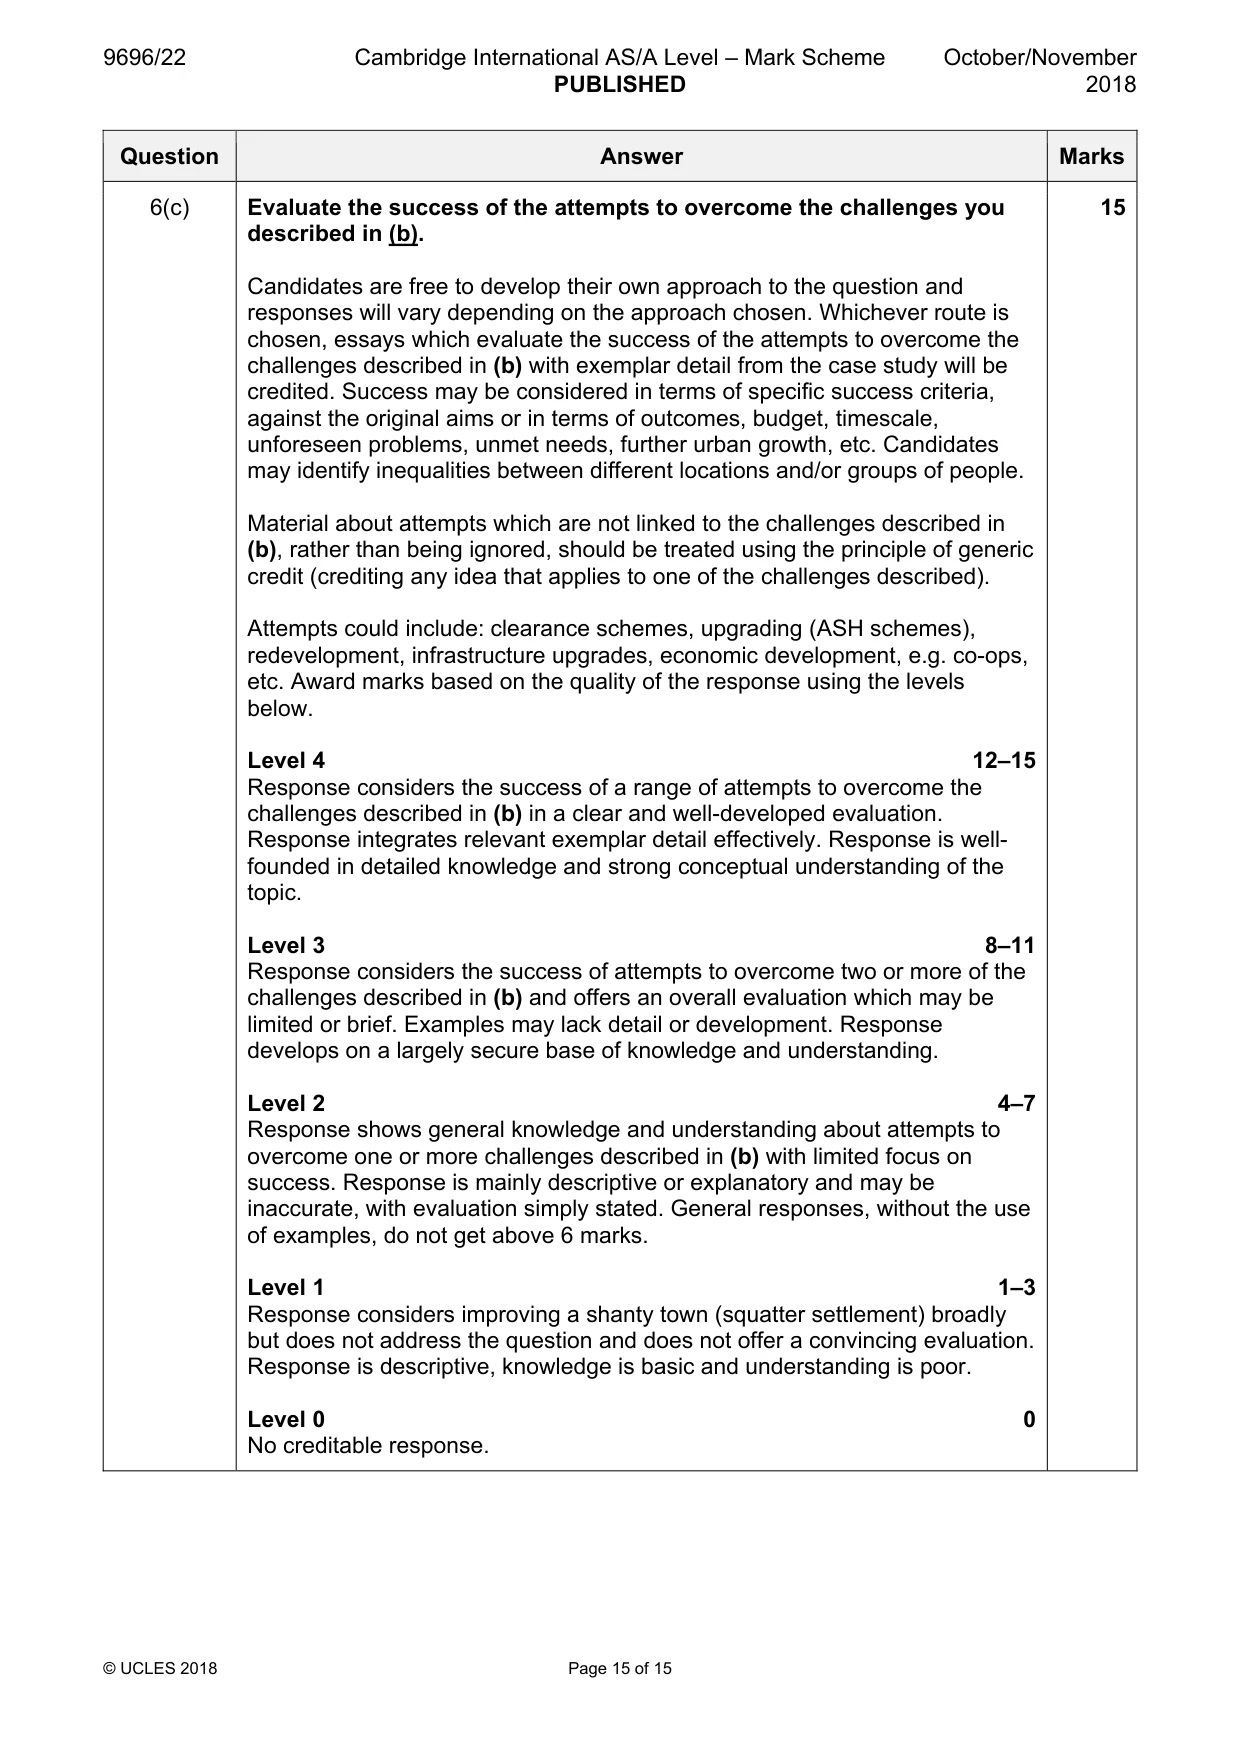
Mark scheme: 6(a) Explain why the management of urban settlements is difficult. 7 Managing urban settlements is difficult because of the dynamic combination of a number of factors operating at different scales. Candidates may develop an explanation on the basis of ideas including: • scale, e.g. world cities, megacities (10 million +) • complexity, e.g. number of businesses, networks • LIC/HIC contexts and capabilities • environmental constraints, e.g. surrounding mountains, lack of water • urban growth and urban expansion (areal extent) • competing interests, e.g. business, residents, tourism sector • lack of urban space • outdated or inadequate infrastructure • governance issues, e.g. instability, corruption, political divisions • pressure from one-off events, e.g. international sport • urban settlements change rapidly • other Credit a basic explanatory point 1 mark and a developed point (such as with some detail or an example) 2 marks, to the maximum. 6(b) With reference to one shanty town (squatter settlement) in an LIC or 8 MIC, describe the challenges before attempts at improvement. Candidates are expected to use the specified case study from syllabus 6.4 to inform and develop the description. Comprehensive responses are not required; a full response comprises two or more challenges. A number of challenges associated with informal settlement may be developed, including: • poor living conditions • overcrowding • lack of services, e.g. piped water, toilets, electricity, health, schools • pollution • unemployment and underemployment • crime and lawlessness • governance issues • high rates of morbidity and mortality Some may adopt the demographic, social, economic, environmental and political challenges approach. Max. 3 marks for a generic answer without the specified case study. Award marks based on the quality of the description and development of the response using the marking levels below. Level 3 6–8 Response explains two or more challenges associated with a shanty town (squatter settlement) in a clear and focussed manner. Response is well- founded in detailed knowledge and strong conceptual understanding of the topic. The example used is appropriate and integrated effectively into the response. Level 2 3–5 Response explains one or more challenges associated with a shanty town (squatter settlement). Response develops on a foundation of knowledge and understanding which is largely secure. The example may lack detail or development. Level 1 1–2 Response comprises one or more points about a shanty town (squatter settlement) which may not be carefully focussed on challenges. Knowledge is basic and understanding may be inaccurate. The example is in name only or lacking entirely. Level 0 0 No creditable response. 6(c) Evaluate the success of the attempts to overcome the challenges you 15 described in (b). Candidates are free to develop their own approach to the question and responses will vary depending on the approach chosen. Whichever route is chosen, essays which evaluate the success of the attempts to overcome the challenges described in (b) with exemplar detail from the case study will be credited. Success may be considered in terms of specific success criteria, against the original aims or in terms of outcomes, budget, timescale, unforeseen problems, unmet needs, further urban growth, etc. Candidates may identify inequalities between different locations and/or groups of people. Material about attempts which are not linked to the challenges described in (b), rather than being ignored, should be treated using the principle of generic credit (crediting any idea that applies to one of the challenges described). Attempts could include: clearance schemes, upgrading (ASH schemes), redevelopment, infrastructure upgrades, economic development, e.g. co-ops, etc. Award marks based on the quality of the response using the levels below. Level 4 12–15 Response considers the success of a range of attempts to overcome the challenges described in (b) in a clear and well-developed evaluation. Response integrates relevant exemplar detail effectively. Response is well- founded in detailed knowledge and strong conceptual understanding of the topic. Level 3 8–11 Response considers the success of attempts to overcome two or more of the challenges described in (b) and offers an overall evaluation which may be limited or brief. Examples may lack detail or development. Response develops on a largely secure base of knowledge and understanding. Level 2 4–7 Response shows general knowledge and understanding about attempts to overcome one or more challenges described in (b) with limited focus on success. Response is mainly descriptive or explanatory and may be inaccurate, with evaluation simply stated. General responses, without the use of examples, do not get above 6 marks. Level 1 1–3 Response considers improving a shanty town (squatter settlement) broadly but does not address the question and does not offer a convincing evaluation. Response is descriptive, knowledge is basic and understanding is poor. Level 0 0 No creditable response.
What was in this paper
The subtopics covered by these 6 questions, and how many questions each got. Open one in a new tab to see every Cambridge question on it.
What you needed in this session
Cambridge’s own grade thresholds for 2018 Oct/Nov, Paper 2 · Variant 2. A higher threshold means an easier paper — the bar moves with how the cohort did.