Cambridge A Level Geography 9696 — 2017 May/June Paper 2 · Variant 2
9696/22/M/J/17 · 50 marks · ≈56 min
The question paper and its mark scheme, free to read here and free to download. This is Cambridge’s own paper, exactly as it was sat.
Question paper4 pages

Mark scheme15 pages
Answers below. Sit the paper first if you are practising.
Paper as text
Question paper, page 1
* 9 8 1 4 3 9 0 1 3 1 * This document consists of 3 printed pages, 1 blank page and 2 Inserts. DC (AL) 134153/2 © UCLES 2017 [Turn over Cambridge International Examinations Cambridge International Advanced Subsidiary and Advanced Level GEOGRAPHY 9696/22 Paper 2 Advanced Physical Options May/June 2017 1 hour 30 minutes No Additional Materials are required. READ THESE INSTRUCTIONS FIRST An answer booklet is provided inside this question paper. You should follow the instructions on the front cover of the answer booklet. If you need additional answer paper ask the invigilator for a continuation booklet. Answer two questions only. Each question answered must be from a different topic. Sketch maps and diagrams should be drawn whenever they serve to illustrate an answer. You should make reference to appropriate examples studied in the field or the classroom, even where such examples are not specifically requested by the question. All the Figures and the Photograph referred to in the questions are contained in the Insert. The number of marks is given in brackets [ ] at the end of each question or part question.
Question paper, page 2
2 9696/22/M/J/17 © UCLES 2017 Tropical environments Only one question may be answered from this topic. 1 (a) For a savanna ecosystem, describe the structure of vegetation and explain how the nutrients are cycled. [10] (b) Fig. 1 shows the atmospheric circulation pattern over the Amazon rainforest, South America. Assess the role of air masses and the ITCZ in the formation of a humid tropical climate, such as that of the Amazon rainforest, as shown in Fig. 1. [15] 2 (a) For any one named tropical ecosystem, describe the characteristics of its soil profile and associated plant community. [10] (b) Describe the problems of sustainable management within either a tropical rainforest ecosystem or a savanna ecosystem. Evaluate attempted solutions to the problems you have described. [15] Coastal environments Only one question may be answered from this topic. 3 (a) Explain the importance of rock type, structure and erosional history on the evolution of cliff profiles. [10] (b) Fig. 2 shows risk of damage and threats to the world’s coral reefs. Using Fig. 2, explain the threats to coral reefs. Assess some possible management strategies to minimise these threats to coral reefs. [15] 4 (a) Compare the characteristics of constructive and destructive waves. Explain the effects of waves on the development of beach profiles (cross section). [10] (b) To what extent do human activities impact on different coastal landforms? [15]
Question paper, page 3
3 9696/22/M/J/17 © UCLES 2017 Hazardous environments Only one question may be answered from this topic. 5 (a) Describe the global distribution of tropical storms (cyclones) and explain the factors causing their development. [10] (b) With the aid of diagrams, describe the characteristics of convergent and conservative plate margins. To what extent are the hazards different at convergent and conservative plate margins? [15] 6 (a) Fig. 3 shows tsunami height above average sea level after the Chilean earthquake, September 2015. Explain which areas may be most at risk from the hazardous effects of tsunami, such as the one shown in Fig. 3. [10] (b) Explain the techniques used to monitor volcanoes. Assess the extent to which prediction can reduce the hazardous effects of volcanic eruptions. [15] Arid and semi-arid environments Only one question may be answered from this topic. 7 (a) Describe the distribution of hot arid environments and explain the main causes of aridity. [10] (b) Photograph A shows a stream and some desert landforms in the Canyon de Chelly, Arizona, USA. Discuss the role of episodic rainfall in the development of desert landforms such as those shown in Photograph A. [15] 8 (a) Describe and explain the main characteristics of soils in both arid and semi-arid environments. [10] (b) Using an example, evaluate ways in which either arid or semi-arid areas can be developed sustainably. [15]
Question paper, page 4
4 9696/22/M/J/17 © UCLES 2017 BLANK PAGE Permission to reproduce items where third-party owned material protected by copyright is included has been sought and cleared where possible. Every reasonable effort has been made by the publisher (UCLES) to trace copyright holders, but if any items requiring clearance have unwittingly been included, the publisher will be pleased to make amends at the earliest possible opportunity. To avoid the issue of disclosure of answer-related information to candidates, all copyright acknowledgements are reproduced online in the Cambridge International Examinations Copyright Acknowledgements Booklet. This is produced for each series of examinations and is freely available to download at www.cie.org.uk after the live examination series. Cambridge International Examinations is part of the Cambridge Assessment Group. Cambridge Assessment is the brand name of University of Cambridge Local Examinations Syndicate (UCLES), which is itself a department of the University of Cambridge.
Mark scheme, page 1
® IGCSE is a registered trademark. This document consists of 15 printed pages. © UCLES 2017 [Turn over Cambridge International Examinations Cambridge International Advanced Subsidiary and Advanced Level GEOGRAPHY 9696/22 Paper 2 Advanced Physical Options May/June 2017 MARK SCHEME Maximum Mark: 50 Published This mark scheme is published as an aid to teachers and candidates, to indicate the requirements of the examination. It shows the basis on which Examiners were instructed to award marks. It does not indicate the details of the discussions that took place at an Examiners’ meeting before marking began, which would have considered the acceptability of alternative answers. Mark schemes should be read in conjunction with the question paper and the Principal Examiner Report for Teachers. Cambridge will not enter into discussions about these mark schemes. Cambridge is publishing the mark schemes for the May/June 2017 series for most Cambridge IGCSE®, Cambridge International A and AS Level and Cambridge Pre-U components, and some Cambridge O Level components.
Mark scheme, page 2
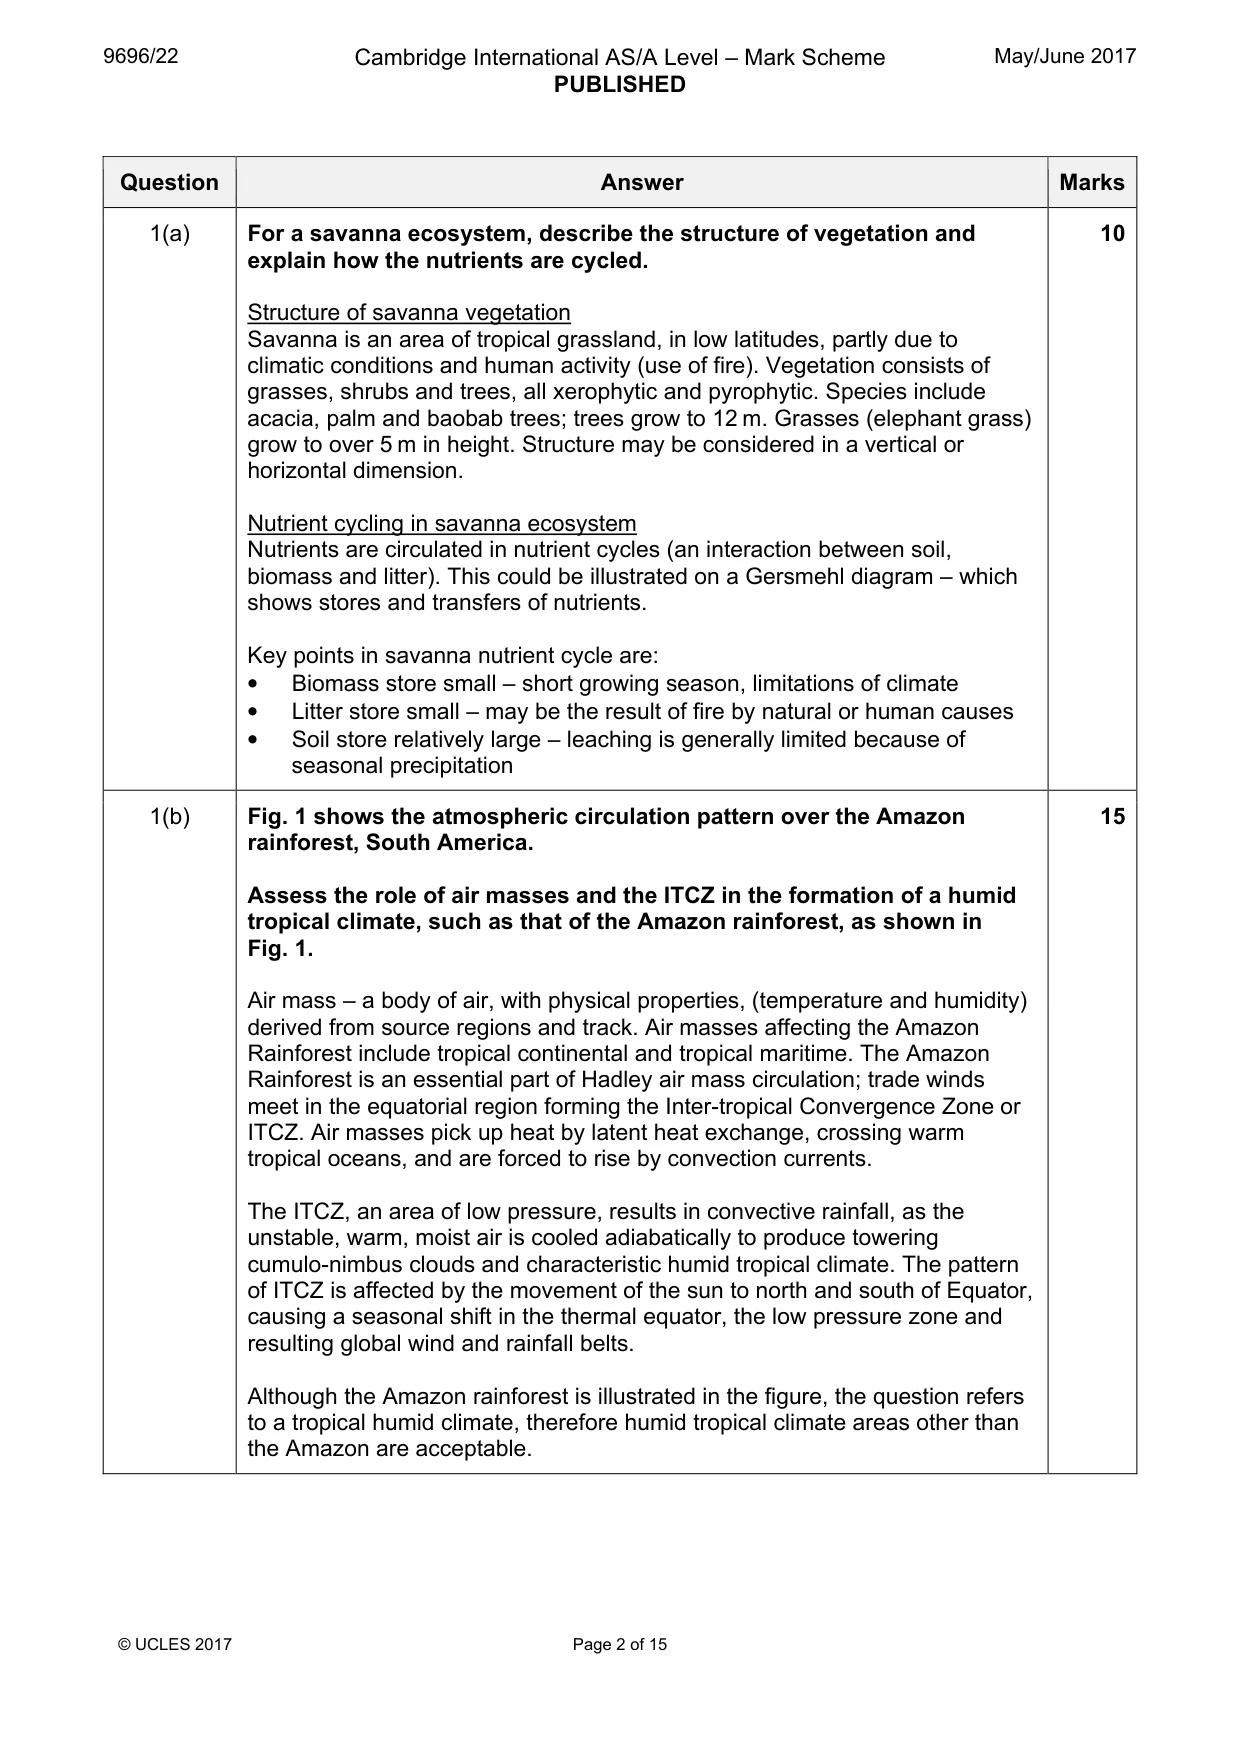
9696/22 Cambridge International AS/A Level – Mark Scheme PUBLISHED May/June 2017 © UCLES 2017 Page 2 of 15 Question Answer Marks 1(a) For a savanna ecosystem, describe the structure of vegetation and explain how the nutrients are cycled. Structure of savanna vegetation Savanna is an area of tropical grassland, in low latitudes, partly due to climatic conditions and human activity (use of fire). Vegetation consists of grasses, shrubs and trees, all xerophytic and pyrophytic. Species include acacia, palm and baobab trees; trees grow to 12 m. Grasses (elephant grass) grow to over 5 m in height. Structure may be considered in a vertical or horizontal dimension. Nutrient cycling in savanna ecosystem Nutrients are circulated in nutrient cycles (an interaction between soil, biomass and litter). This could be illustrated on a Gersmehl diagram – which shows stores and transfers of nutrients. Key points in savanna nutrient cycle are: • Biomass store small – short growing season, limitations of climate • Litter store small – may be the result of fire by natural or human causes • Soil store relatively large – leaching is generally limited because of seasonal precipitation 10 1(b) Fig. 1 shows the atmospheric circulation pattern over the Amazon rainforest, South America. Assess the role of air masses and the ITCZ in the formation of a humid tropical climate, such as that of the Amazon rainforest, as shown in Fig. 1. Air mass – a body of air, with physical properties, (temperature and humidity) derived from source regions and track. Air masses affecting the Amazon Rainforest include tropical continental and tropical maritime. The Amazon Rainforest is an essential part of Hadley air mass circulation; trade winds meet in the equatorial region forming the Inter-tropical Convergence Zone or ITCZ. Air masses pick up heat by latent heat exchange, crossing warm tropical oceans, and are forced to rise by convection currents. The ITCZ, an area of low pressure, results in convective rainfall, as the unstable, warm, moist air is cooled adiabatically to produce towering cumulo-nimbus clouds and characteristic humid tropical climate. The pattern of ITCZ is affected by the movement of the sun to north and south of Equator, causing a seasonal shift in the thermal equator, the low pressure zone and resulting global wind and rainfall belts. Although the Amazon rainforest is illustrated in the figure, the question refers to a tropical humid climate, therefore humid tropical climate areas other than the Amazon are acceptable. 15
Mark scheme, page 3
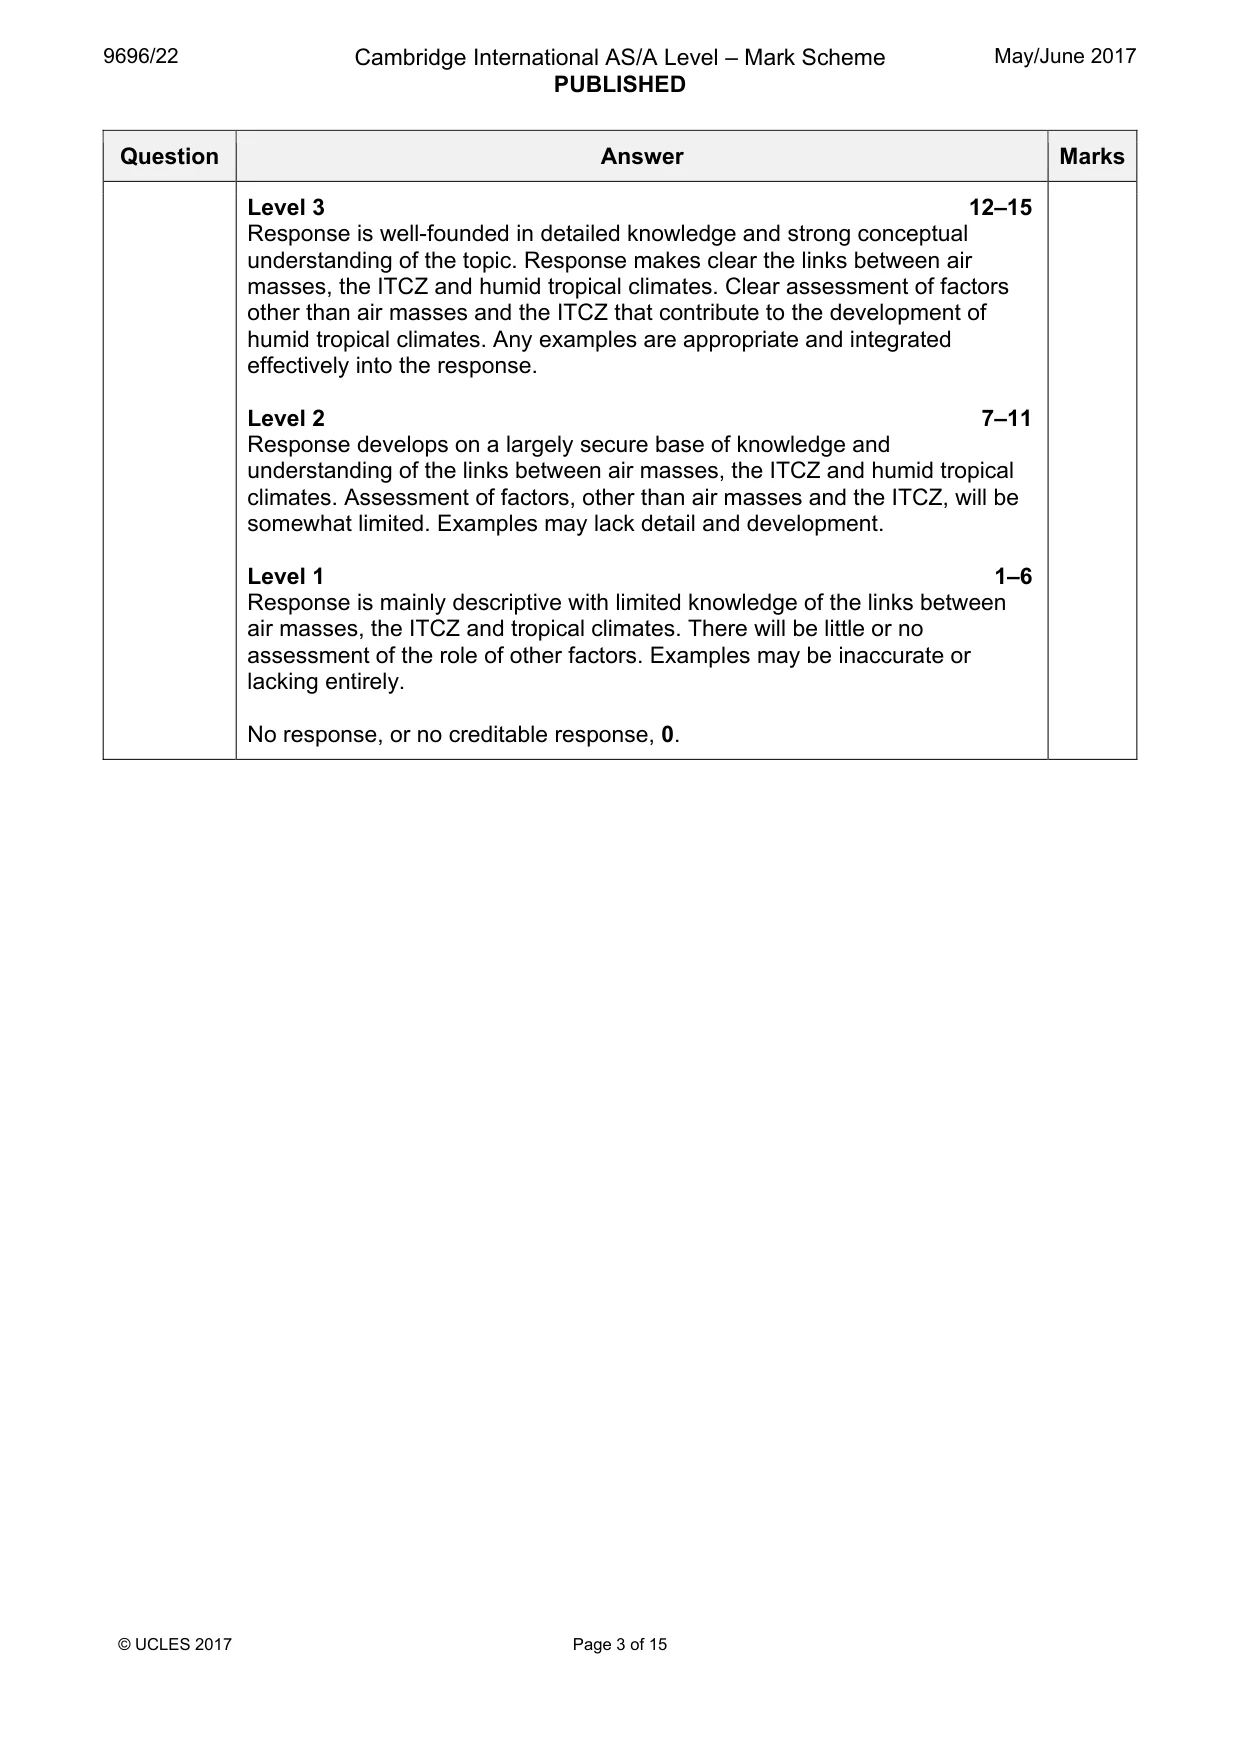
9696/22 Cambridge International AS/A Level – Mark Scheme PUBLISHED May/June 2017 © UCLES 2017 Page 3 of 15 Question Answer Marks Level 3 12–15 Response is well-founded in detailed knowledge and strong conceptual understanding of the topic. Response makes clear the links between air masses, the ITCZ and humid tropical climates. Clear assessment of factors other than air masses and the ITCZ that contribute to the development of humid tropical climates. Any examples are appropriate and integrated effectively into the response. Level 2 7–11 Response develops on a largely secure base of knowledge and understanding of the links between air masses, the ITCZ and humid tropical climates. Assessment of factors, other than air masses and the ITCZ, will be somewhat limited. Examples may lack detail and development. Level 1 1–6 Response is mainly descriptive with limited knowledge of the links between air masses, the ITCZ and tropical climates. There will be little or no assessment of the role of other factors. Examples may be inaccurate or lacking entirely. No response, or no creditable response, 0.
Mark scheme, page 4
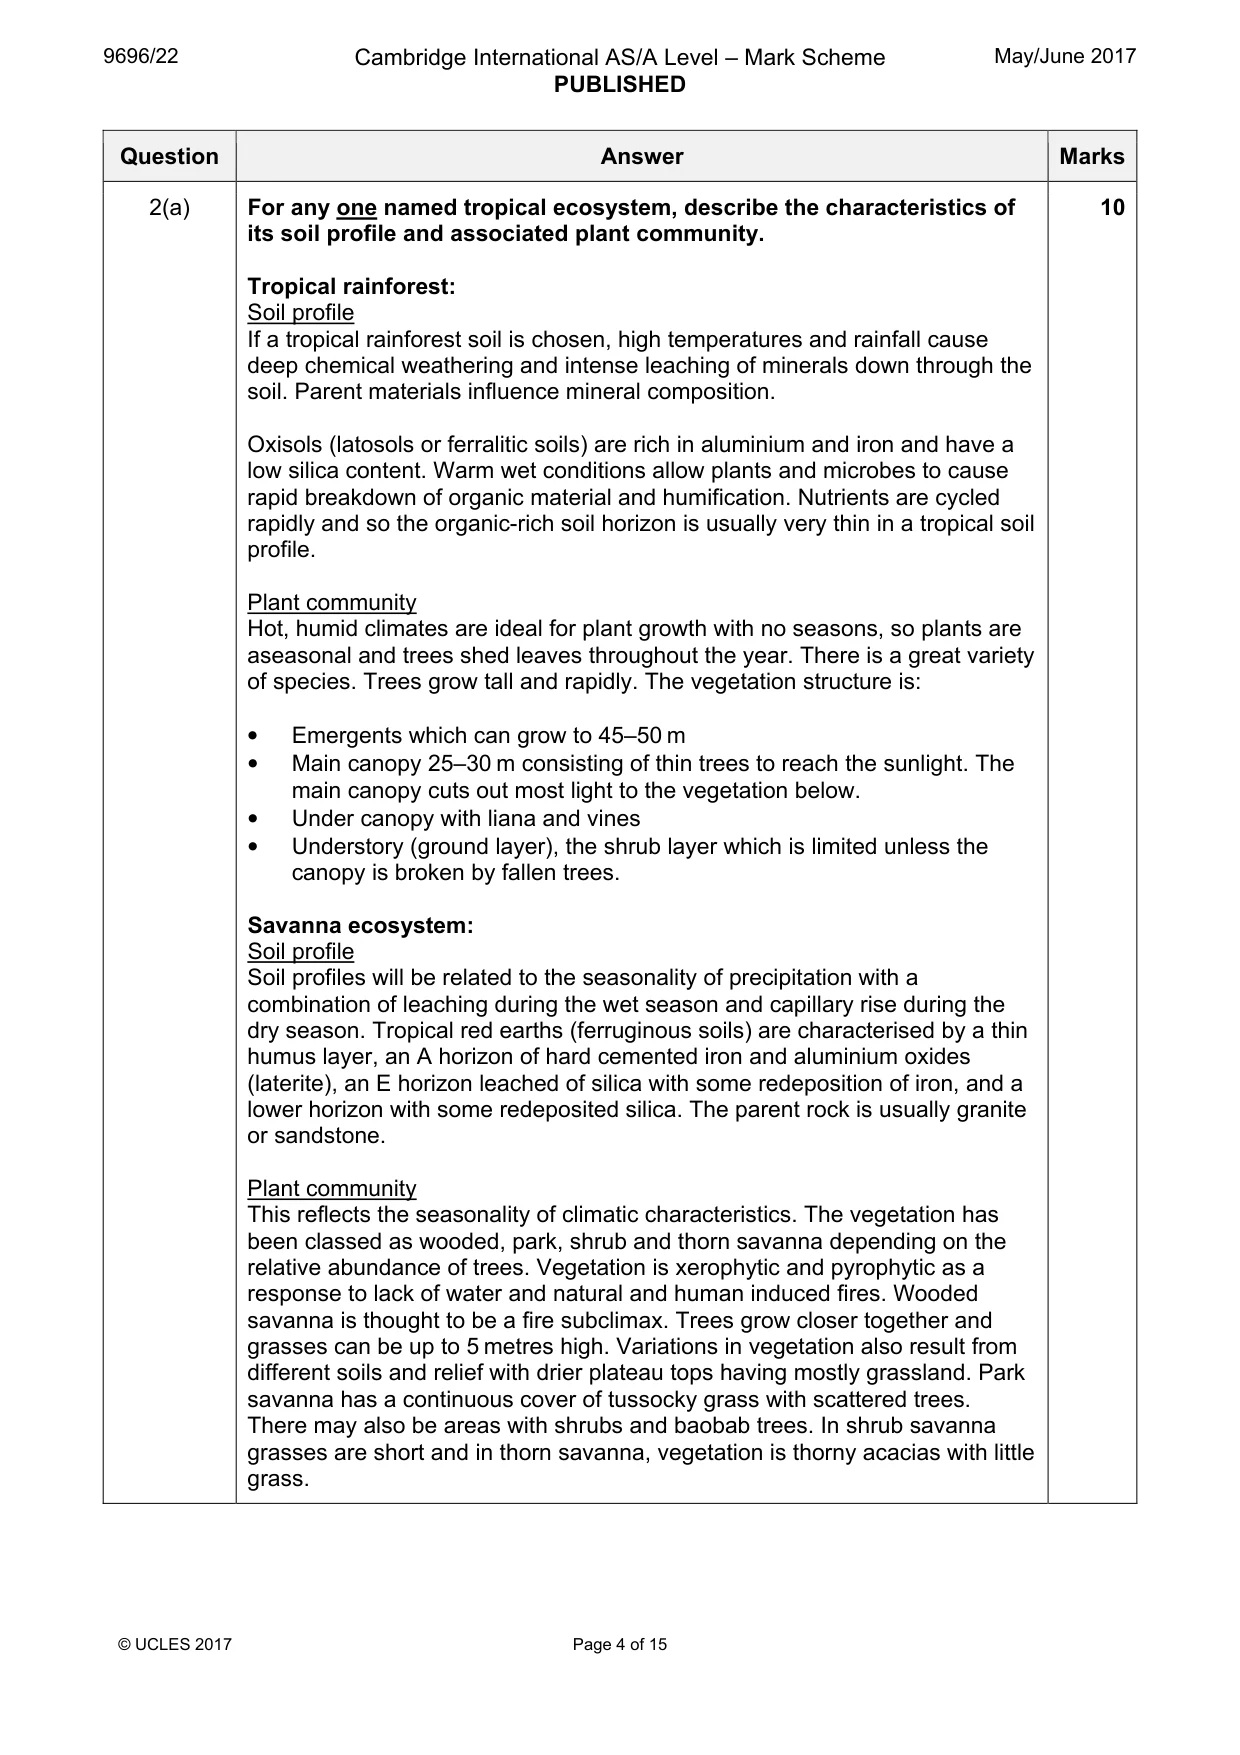
9696/22 Cambridge International AS/A Level – Mark Scheme PUBLISHED May/June 2017 © UCLES 2017 Page 4 of 15 Question Answer Marks 2(a) For any one named tropical ecosystem, describe the characteristics of its soil profile and associated plant community. Tropical rainforest: Soil profile If a tropical rainforest soil is chosen, high temperatures and rainfall cause deep chemical weathering and intense leaching of minerals down through the soil. Parent materials influence mineral composition. Oxisols (latosols or ferralitic soils) are rich in aluminium and iron and have a low silica content. Warm wet conditions allow plants and microbes to cause rapid breakdown of organic material and humification. Nutrients are cycled rapidly and so the organic-rich soil horizon is usually very thin in a tropical soil profile. Plant community Hot, humid climates are ideal for plant growth with no seasons, so plants are aseasonal and trees shed leaves throughout the year. There is a great variety of species. Trees grow tall and rapidly. The vegetation structure is: • Emergents which can grow to 45–50 m • Main canopy 25–30 m consisting of thin trees to reach the sunlight. The main canopy cuts out most light to the vegetation below. • Under canopy with liana and vines • Understory (ground layer), the shrub layer which is limited unless the canopy is broken by fallen trees. Savanna ecosystem: Soil profile Soil profiles will be related to the seasonality of precipitation with a combination of leaching during the wet season and capillary rise during the dry season. Tropical red earths (ferruginous soils) are characterised by a thin humus layer, an A horizon of hard cemented iron and aluminium oxides (laterite), an E horizon leached of silica with some redeposition of iron, and a lower horizon with some redeposited silica. The parent rock is usually granite or sandstone. Plant community This reflects the seasonality of climatic characteristics. The vegetation has been classed as wooded, park, shrub and thorn savanna depending on the relative abundance of trees. Vegetation is xerophytic and pyrophytic as a response to lack of water and natural and human induced fires. Wooded savanna is thought to be a fire subclimax. Trees grow closer together and grasses can be up to 5 metres high. Variations in vegetation also result from different soils and relief with drier plateau tops having mostly grassland. Park savanna has a continuous cover of tussocky grass with scattered trees. There may also be areas with shrubs and baobab trees. In shrub savanna grasses are short and in thorn savanna, vegetation is thorny acacias with little grass. 10
Mark scheme, page 5
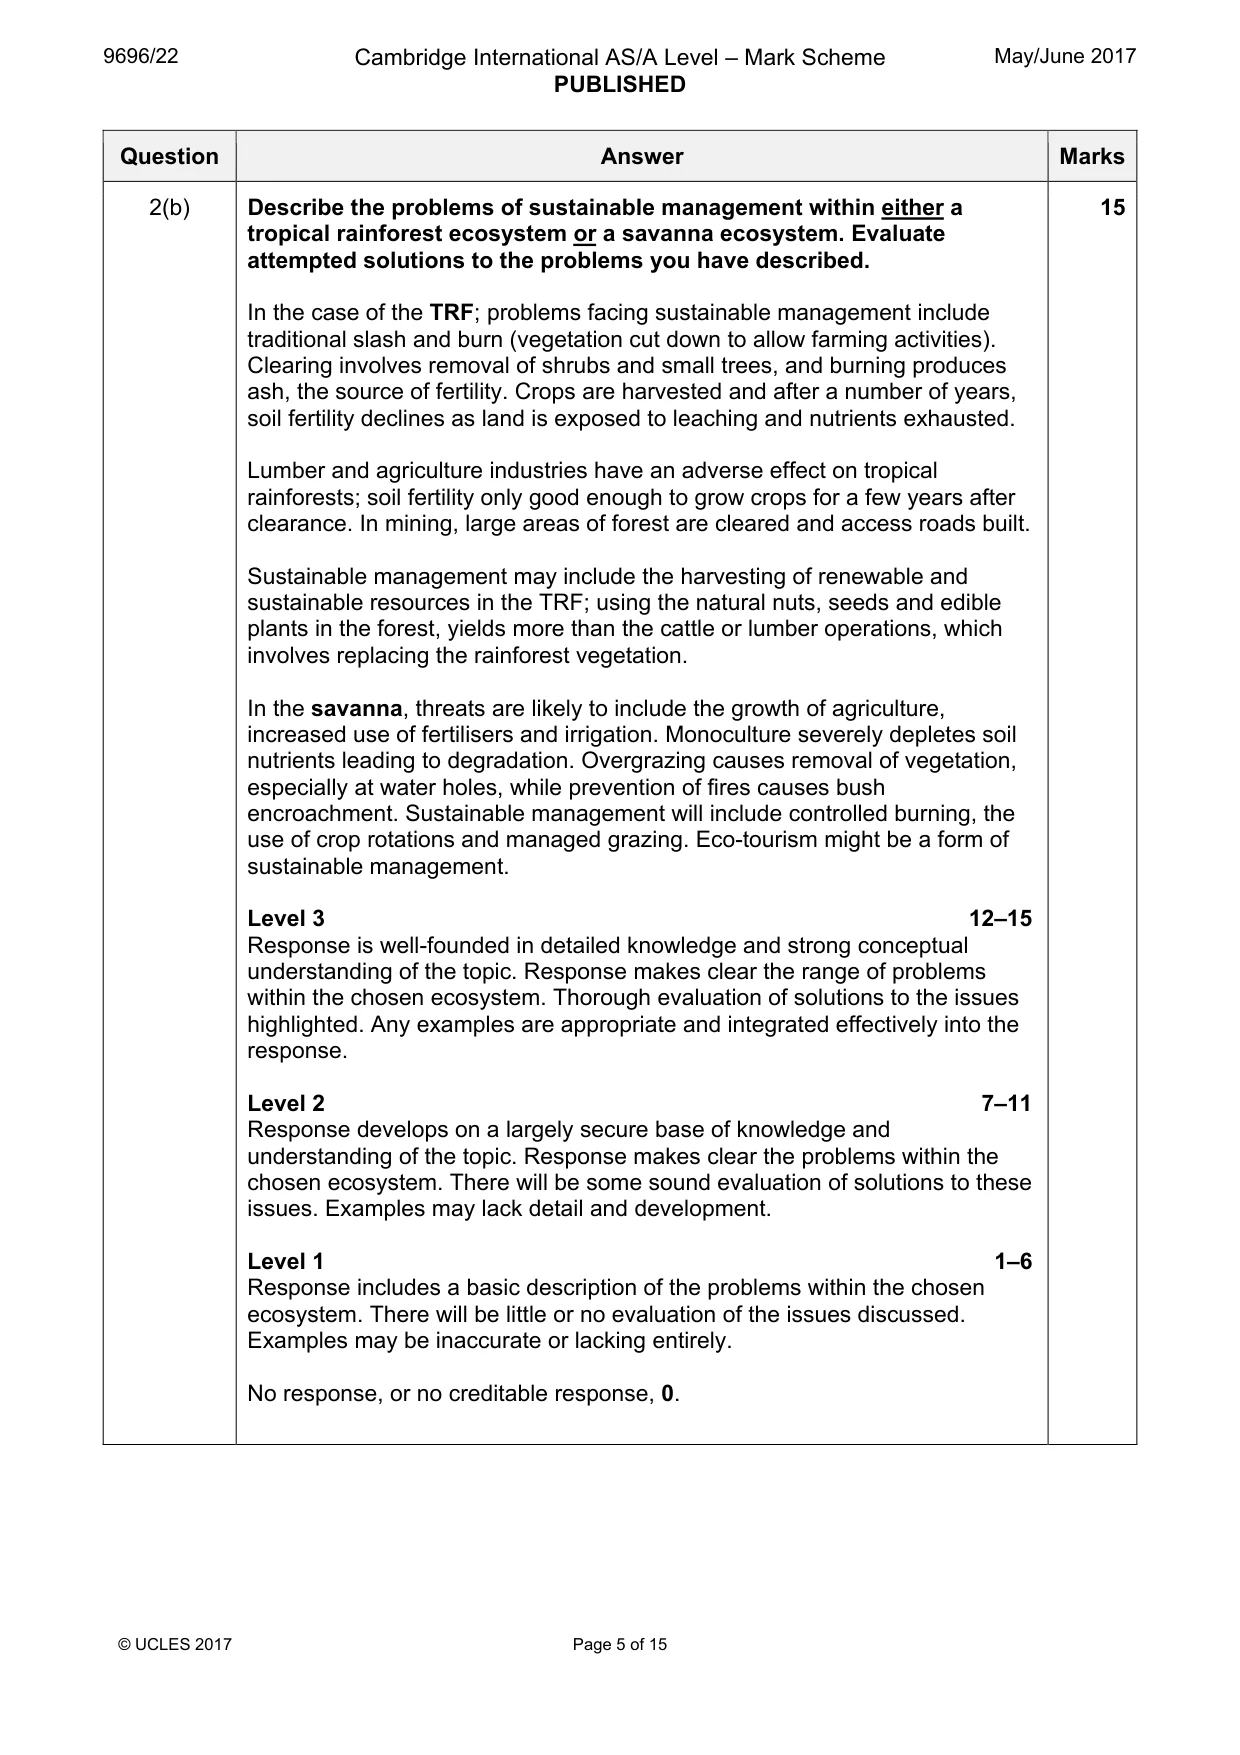
9696/22 Cambridge International AS/A Level – Mark Scheme PUBLISHED May/June 2017 © UCLES 2017 Page 5 of 15 Question Answer Marks 2(b) Describe the problems of sustainable management within either a tropical rainforest ecosystem or a savanna ecosystem. Evaluate attempted solutions to the problems you have described. In the case of the TRF; problems facing sustainable management include traditional slash and burn (vegetation cut down to allow farming activities). Clearing involves removal of shrubs and small trees, and burning produces ash, the source of fertility. Crops are harvested and after a number of years, soil fertility declines as land is exposed to leaching and nutrients exhausted. Lumber and agriculture industries have an adverse effect on tropical rainforests; soil fertility only good enough to grow crops for a few years after clearance. In mining, large areas of forest are cleared and access roads built. Sustainable management may include the harvesting of renewable and sustainable resources in the TRF; using the natural nuts, seeds and edible plants in the forest, yields more than the cattle or lumber operations, which involves replacing the rainforest vegetation. In the savanna, threats are likely to include the growth of agriculture, increased use of fertilisers and irrigation. Monoculture severely depletes soil nutrients leading to degradation. Overgrazing causes removal of vegetation, especially at water holes, while prevention of fires causes bush encroachment. Sustainable management will include controlled burning, the use of crop rotations and managed grazing. Eco-tourism might be a form of sustainable management. Level 3 12–15 Response is well-founded in detailed knowledge and strong conceptual understanding of the topic. Response makes clear the range of problems within the chosen ecosystem. Thorough evaluation of solutions to the issues highlighted. Any examples are appropriate and integrated effectively into the response. Level 2 7–11 Response develops on a largely secure base of knowledge and understanding of the topic. Response makes clear the problems within the chosen ecosystem. There will be some sound evaluation of solutions to these issues. Examples may lack detail and development. Level 1 1–6 Response includes a basic description of the problems within the chosen ecosystem. There will be little or no evaluation of the issues discussed. Examples may be inaccurate or lacking entirely. No response, or no creditable response, 0. 15
Mark scheme, page 6
9696/22 Cambridge International AS/A Level – Mark Scheme PUBLISHED May/June 2017 © UCLES 2017 Page 6 of 15 Question Answer Marks 3(a) Explain the importance of rock type, structure and erosional history on the evolution of cliff profiles. Cliff profiles are influenced by a range of factors. Rock types, such as limestone and granite, and structure (jointing and bedding) control the cliff profile. Well-developed jointing and bedding can create steep, angular cliff faces with flat tops. Some cliffs are formed of a mixture of rock types – the exact shape of the profile being dependant on strength and structure of rock, relative hardness and the nature of the waves. Lines of weakness are opened up by erosion and complete blocks fall away leaving overhangs and caves. The dip of the bedding planes will create different cliff profiles – bedding dipping steeply seaward forms shelving cliffs with landslips. Beds dipping vertically create a sheer cliff face. Beds dipping landward tends to result in steep, possibly jagged, profiles with rockfalls. Erosional history may involve discussion of sub-aerial processes and changes in sea level. Cliff retreat will be slower in resistant rocks such as granite, and faster in glacial till. 10
Mark scheme, page 7
9696/22 Cambridge International AS/A Level – Mark Scheme PUBLISHED May/June 2017 © UCLES 2017 Page 7 of 15 Question Answer Marks 3(b) Fig. 2 shows risk of damage and threats to the world’s coral reefs. Using Fig. 2, explain the threats to coral reefs. Assess some possible management strategies to minimise these threats to coral reefs. The threats are actions that alter the sensitive conditions needed for coral growth and development. Fig. 2 shows over exploitation, inland pollution and marine and coastal development. % may be quoted but not expected. Marine threats include any changes to the ocean environment. Natural stresses come from storms, seismic activity, fresh water intrusions and predators such as crown of thorns starfish. Increased CO2 emissions lead to atmospheric warming that in turn influences ocean acidification, ocean temperature, storm severity and sea-level rise. Water depth is vital to the existence of coral; too deep and it will not receive enough sunlight for photosynthesis, and too shallow and coral will be bleached or damaged by wave action. Sea-level therefore plays a key part in the formation of coral reefs and hence is a major threat to coral reefs. The contribution of other threats to corals may be considered such as poor land management practices which damage the reefs with sediments, nutrients and other pollutants. Pollution from land based activities such as farming and industry and the impact of shipping will contribute to the decline of coral reefs. Level 3 12–15 Response is well-founded in detailed knowledge and strong conceptual understanding of the topic. Response provides a thorough explanation of the threats to coral reefs. There is a thorough assessment of management strategies to minimise these threats. Any examples are appropriate and integrated effectively into the response. Level 2 7–11 Response develops on a largely secure base of knowledge and understanding of the topic. Response provides a clear explanation of the threats to coral reefs. There will be a sound assessment of the management strategies to minimise these threats. Examples may lack detail and development. Level 1 1–6 Response includes a basic explanation of the threats to coral reefs. There will be little or no assessment of the management strategies to minimise these threats. Examples may be inaccurate or lacking entirely. No response, or no creditable response, 0. 15
Mark scheme, page 8
9696/22 Cambridge International AS/A Level – Mark Scheme PUBLISHED May/June 2017 © UCLES 2017 Page 8 of 15 Question Answer Marks 4(a) Compare the characteristics of constructive and destructive waves. Explain the effects of waves on the development of beach profiles (cross section). Constructive waves have lower frequency and larger wavelengths and are generated far offshore. Swash surges up gentle gradient and backwash is weaker. Water movement is elliptical. Destructive waves are generated more locally with higher frequency and shorter wavelengths. Rapid increase in friction causes circular water movement. Energy translated onto the beach and waves. Backwash is greater than the swash. Beach profiles are affected by wave characteristics, tidal range and by the size, shape, and composition of beach materials which influence percolation rates. Storm waves are more frequent in winter and swell waves are more important in summer, so many beaches differ in their winter and summer profiles (cut and fill profiles). Beach angle also changes as destructive waves reduce beach angle, while constructive waves increase it. 10 4(b) To what extent do human activities impact on different coastal landforms? The landforms chosen will depend on the nature of the coastline studied. Human activities can affect both erosional and depositional landforms. Erosional landforms may include cliffs and depositional landforms may include spits, sand dunes, salt marshes and beaches. Level 3 12–15 Response is well-founded in detailed knowledge and strong conceptual understanding of the topic. Response provides a thorough assessment of the extent to which human activities impact on coastal landforms. Any examples are appropriate and integrated effectively into the response. Level 2 7–11 Response develops on a largely secure base of knowledge and understanding of the topic. Response provides a clear assessment of the extent to which human activities impact on coastal landforms. Examples may lack detail and development. Level 1 1–6 Response includes a basic knowledge and understanding of the topic. There will be little or no assessment of the extent to which human activities impact on coastal landforms. Examples may be inaccurate or lacking entirely. No response, or no creditable response, 0. 15
Mark scheme, page 9
9696/22 Cambridge International AS/A Level – Mark Scheme PUBLISHED May/June 2017 © UCLES 2017 Page 9 of 15 Question Answer Marks 5(a) Describe the global distribution of tropical storms (cyclones) and explain the factors causing their development. Tropical storms (cyclones) start within 8–15° north and south of the Equator where sea surface temperatures reach 27 °C. Global distribution includes islands of the Caribbean, the SE coast of USA and low lying coasts in the Indian and Pacific Oceans. Cyclones develop along the boundary between cold air and warm moist air. They are characterised by areas of low pressure, below 920 mb and strong winds, with a spiral form. Massive amounts of moisture are uplifted from warm oceans over which storms develop, causing cumulonimbus clouds and large quantities of rain in coastal margins. The release of latent heat on condensation reinforces the rapid uplift of air. Intense low pressure creates strong winds as air is drawn in and spirals round a central calm eye, due to the Coriolis force. 10 5(b) With the aid of diagrams, describe the characteristics of convergent and conservative plate margins. To what extent are the hazards different at convergent and conservative plate margins? Convergent plate margins are of two types: Destructive where oceanic crust moves towards continental crust, and being denser subducts, forming deep sea trenches and island arcs with explosive volcanoes. Collision zones, where two continental crusts collide, and fold mountains are formed. Hazards with convergent margins; the oceanic plate is subducted, friction and pressure increases, and heat from the asthenosphere melts the crust. Some of the molten material works its way through the crust and collects in magma chambers, re-emerging at the surface to create a range of volcanic mountains or if the plates colliding are both oceanic, a volcanic island arc is created. Volcanoes tend to be explosive, because of silica rich magma and gases. Earthquakes (both shallow and deep focus) also occur at convergent margins caused by movement of the plates grinding past each other. Collision boundaries result in earthquakes but no volcanic activity. Conservative margins involve plates passing sideways in different directions or passing at different speeds, friction builds up and parts of faults lock; stress released sends shock waves through the earth’s crust. Earthquakes result in a fairly narrow belt. At conservative plate margins volcanoes and mountains are not formed and crust is not destroyed. 15
Mark scheme, page 10
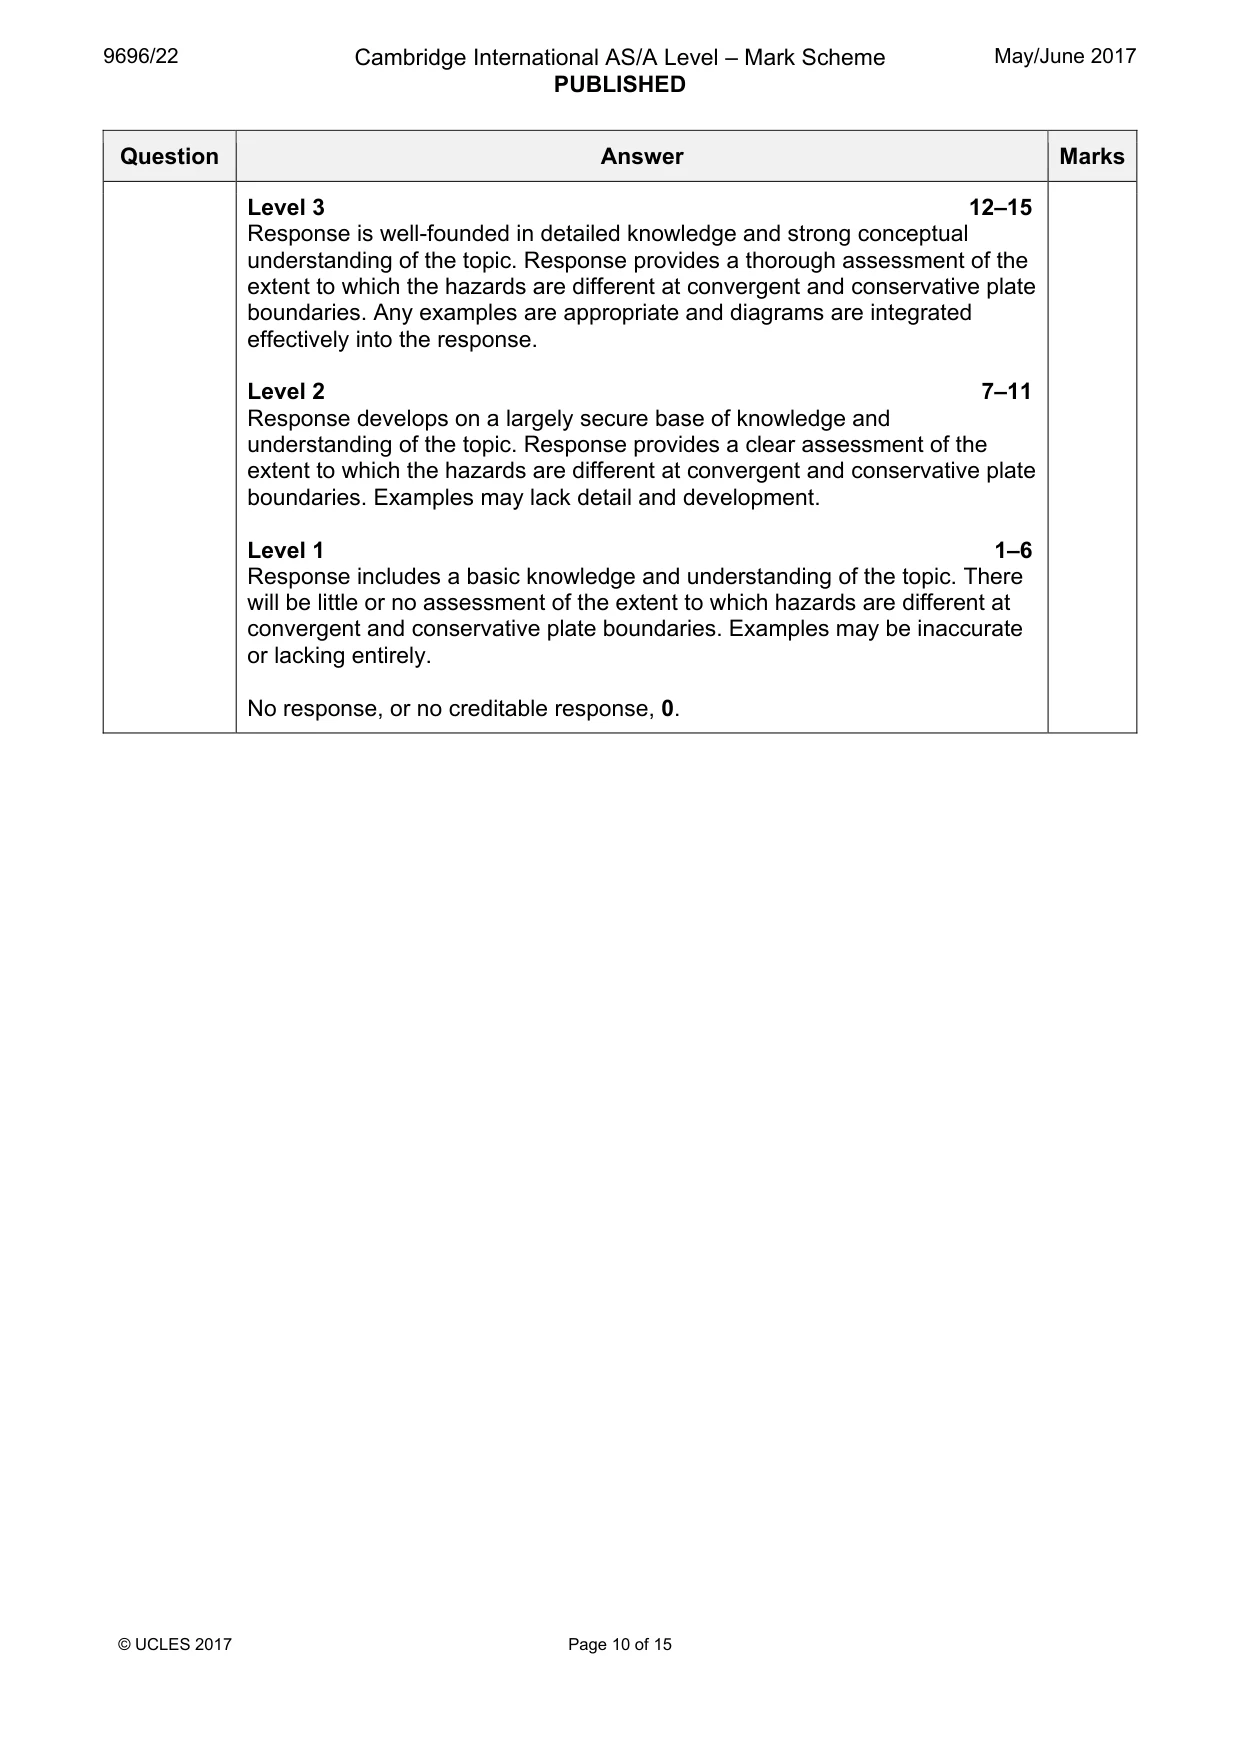
9696/22 Cambridge International AS/A Level – Mark Scheme PUBLISHED May/June 2017 © UCLES 2017 Page 10 of 15 Question Answer Marks Level 3 12–15 Response is well-founded in detailed knowledge and strong conceptual understanding of the topic. Response provides a thorough assessment of the extent to which the hazards are different at convergent and conservative plate boundaries. Any examples are appropriate and diagrams are integrated effectively into the response. Level 2 7–11 Response develops on a largely secure base of knowledge and understanding of the topic. Response provides a clear assessment of the extent to which the hazards are different at convergent and conservative plate boundaries. Examples may lack detail and development. Level 1 1–6 Response includes a basic knowledge and understanding of the topic. There will be little or no assessment of the extent to which hazards are different at convergent and conservative plate boundaries. Examples may be inaccurate or lacking entirely. No response, or no creditable response, 0.
Mark scheme, page 11
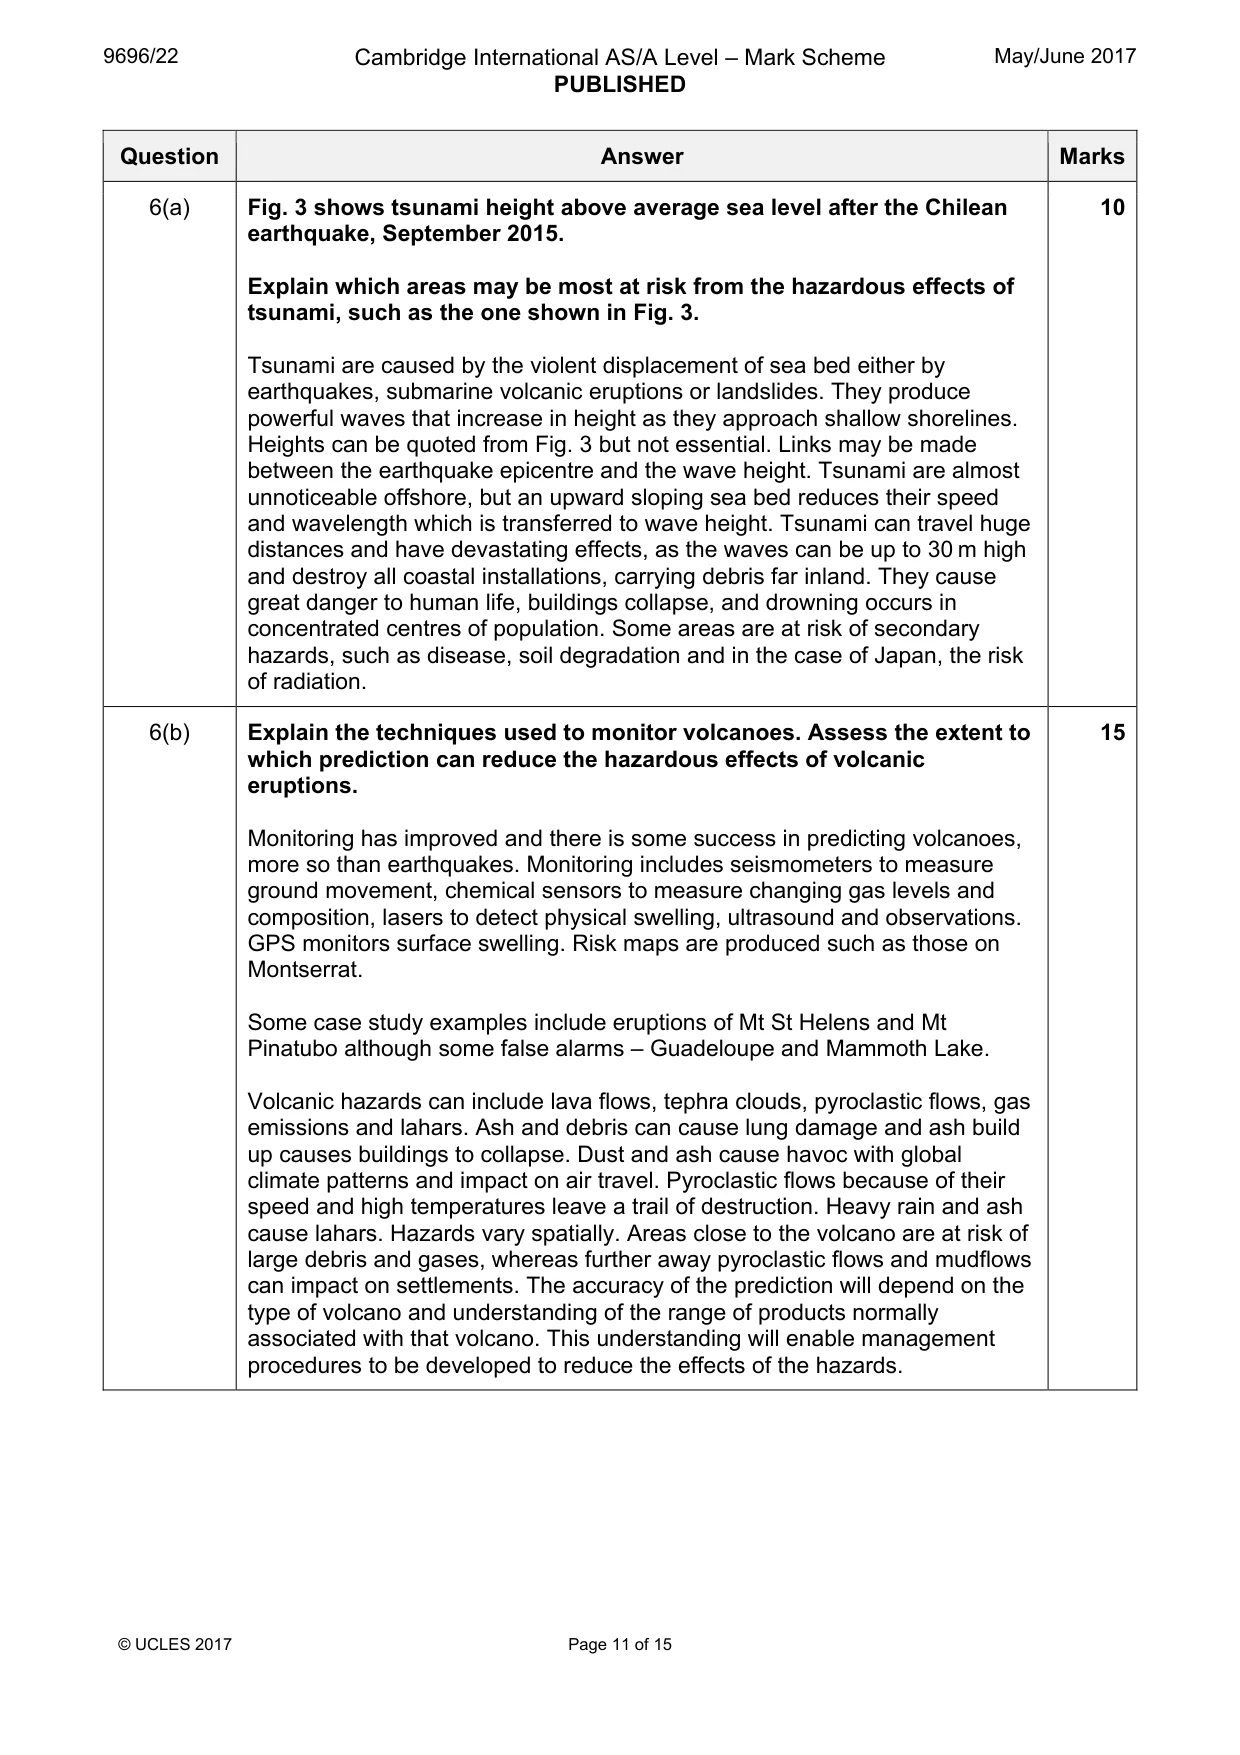
9696/22 Cambridge International AS/A Level – Mark Scheme PUBLISHED May/June 2017 © UCLES 2017 Page 11 of 15 Question Answer Marks 6(a) Fig. 3 shows tsunami height above average sea level after the Chilean earthquake, September 2015. Explain which areas may be most at risk from the hazardous effects of tsunami, such as the one shown in Fig. 3. Tsunami are caused by the violent displacement of sea bed either by earthquakes, submarine volcanic eruptions or landslides. They produce powerful waves that increase in height as they approach shallow shorelines. Heights can be quoted from Fig. 3 but not essential. Links may be made between the earthquake epicentre and the wave height. Tsunami are almost unnoticeable offshore, but an upward sloping sea bed reduces their speed and wavelength which is transferred to wave height. Tsunami can travel huge distances and have devastating effects, as the waves can be up to 30 m high and destroy all coastal installations, carrying debris far inland. They cause great danger to human life, buildings collapse, and drowning occurs in concentrated centres of population. Some areas are at risk of secondary hazards, such as disease, soil degradation and in the case of Japan, the risk of radiation. 10 6(b) Explain the techniques used to monitor volcanoes. Assess the extent to which prediction can reduce the hazardous effects of volcanic eruptions. Monitoring has improved and there is some success in predicting volcanoes, more so than earthquakes. Monitoring includes seismometers to measure ground movement, chemical sensors to measure changing gas levels and composition, lasers to detect physical swelling, ultrasound and observations. GPS monitors surface swelling. Risk maps are produced such as those on Montserrat. Some case study examples include eruptions of Mt St Helens and Mt Pinatubo although some false alarms – Guadeloupe and Mammoth Lake. Volcanic hazards can include lava flows, tephra clouds, pyroclastic flows, gas emissions and lahars. Ash and debris can cause lung damage and ash build up causes buildings to collapse. Dust and ash cause havoc with global climate patterns and impact on air travel. Pyroclastic flows because of their speed and high temperatures leave a trail of destruction. Heavy rain and ash cause lahars. Hazards vary spatially. Areas close to the volcano are at risk of large debris and gases, whereas further away pyroclastic flows and mudflows can impact on settlements. The accuracy of the prediction will depend on the type of volcano and understanding of the range of products normally associated with that volcano. This understanding will enable management procedures to be developed to reduce the effects of the hazards. 15
Mark scheme, page 12
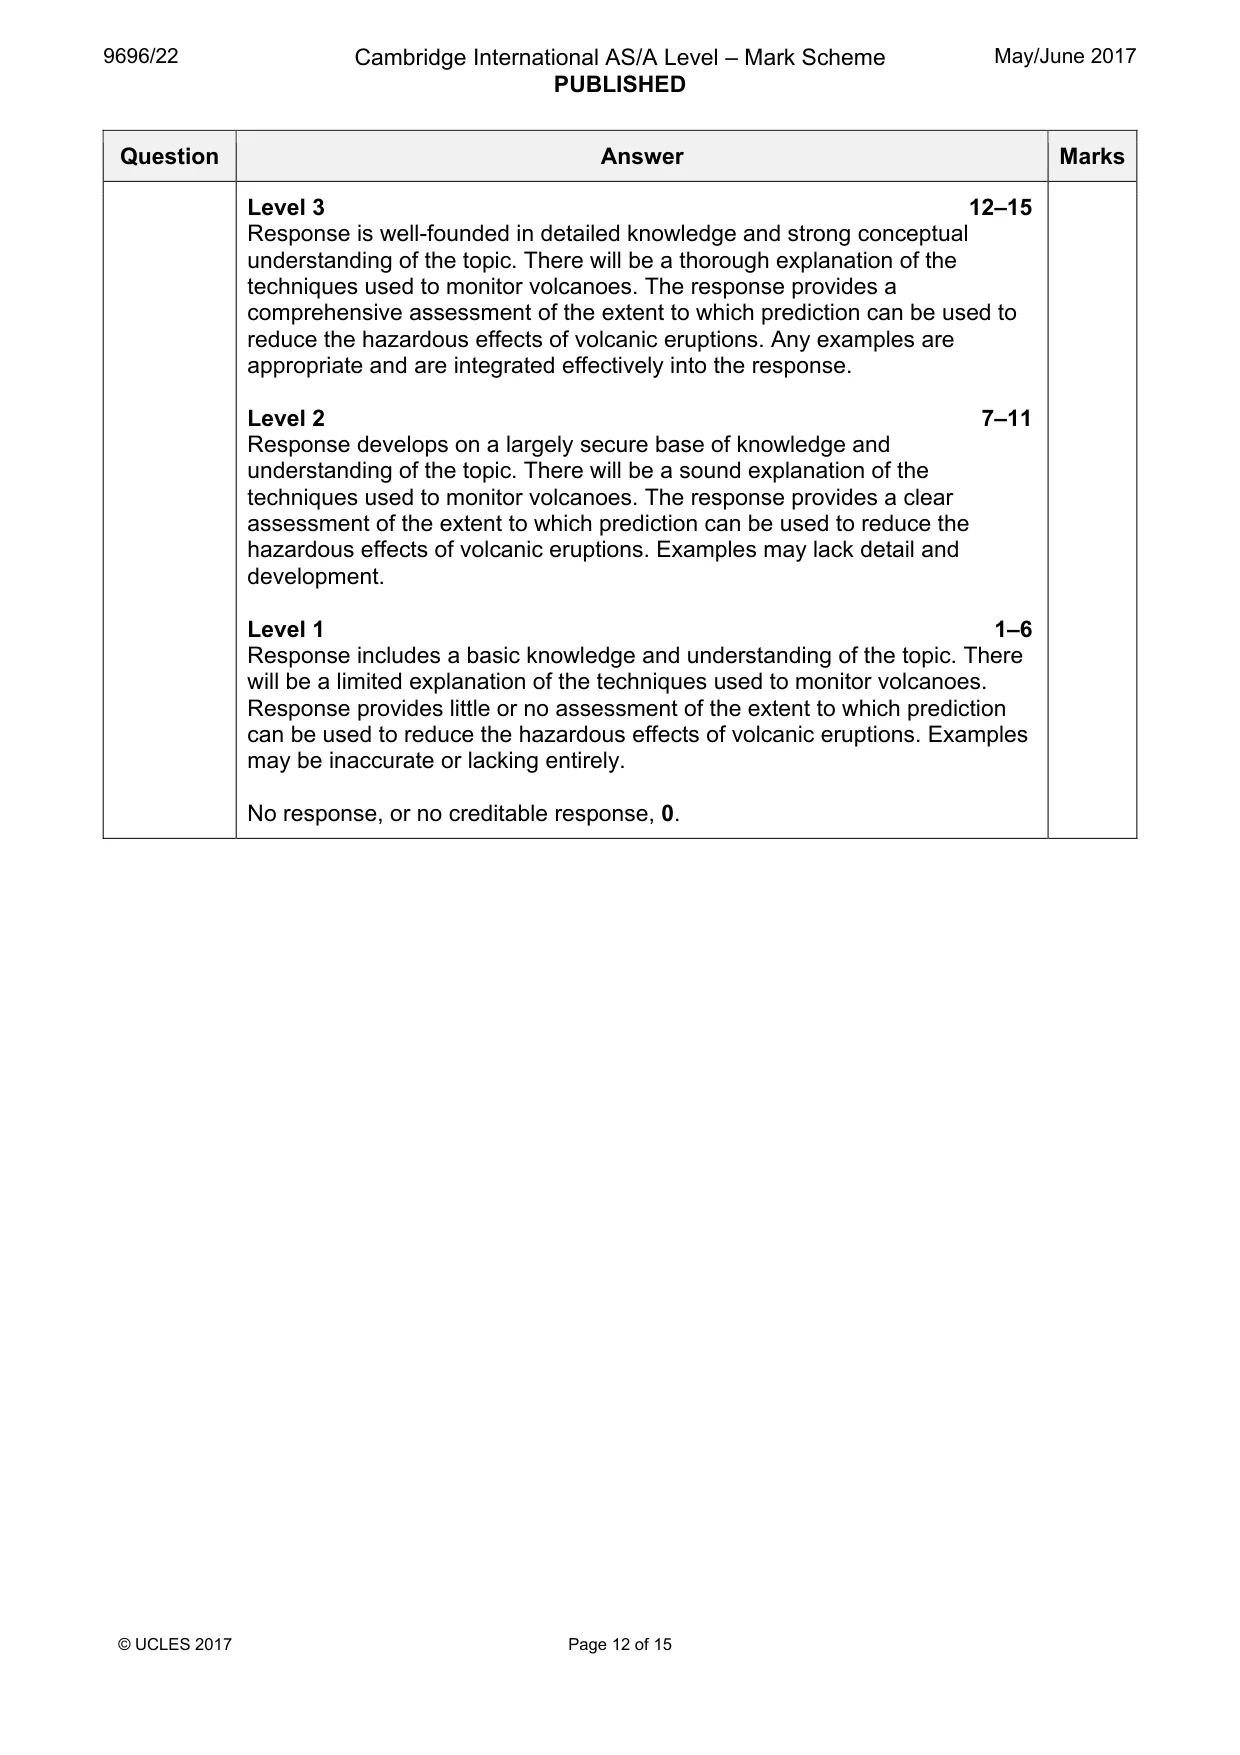
9696/22 Cambridge International AS/A Level – Mark Scheme PUBLISHED May/June 2017 © UCLES 2017 Page 12 of 15 Question Answer Marks Level 3 12–15 Response is well-founded in detailed knowledge and strong conceptual understanding of the topic. There will be a thorough explanation of the techniques used to monitor volcanoes. The response provides a comprehensive assessment of the extent to which prediction can be used to reduce the hazardous effects of volcanic eruptions. Any examples are appropriate and are integrated effectively into the response. Level 2 7–11 Response develops on a largely secure base of knowledge and understanding of the topic. There will be a sound explanation of the techniques used to monitor volcanoes. The response provides a clear assessment of the extent to which prediction can be used to reduce the hazardous effects of volcanic eruptions. Examples may lack detail and development. Level 1 1–6 Response includes a basic knowledge and understanding of the topic. There will be a limited explanation of the techniques used to monitor volcanoes. Response provides little or no assessment of the extent to which prediction can be used to reduce the hazardous effects of volcanic eruptions. Examples may be inaccurate or lacking entirely. No response, or no creditable response, 0.
Mark scheme, page 13
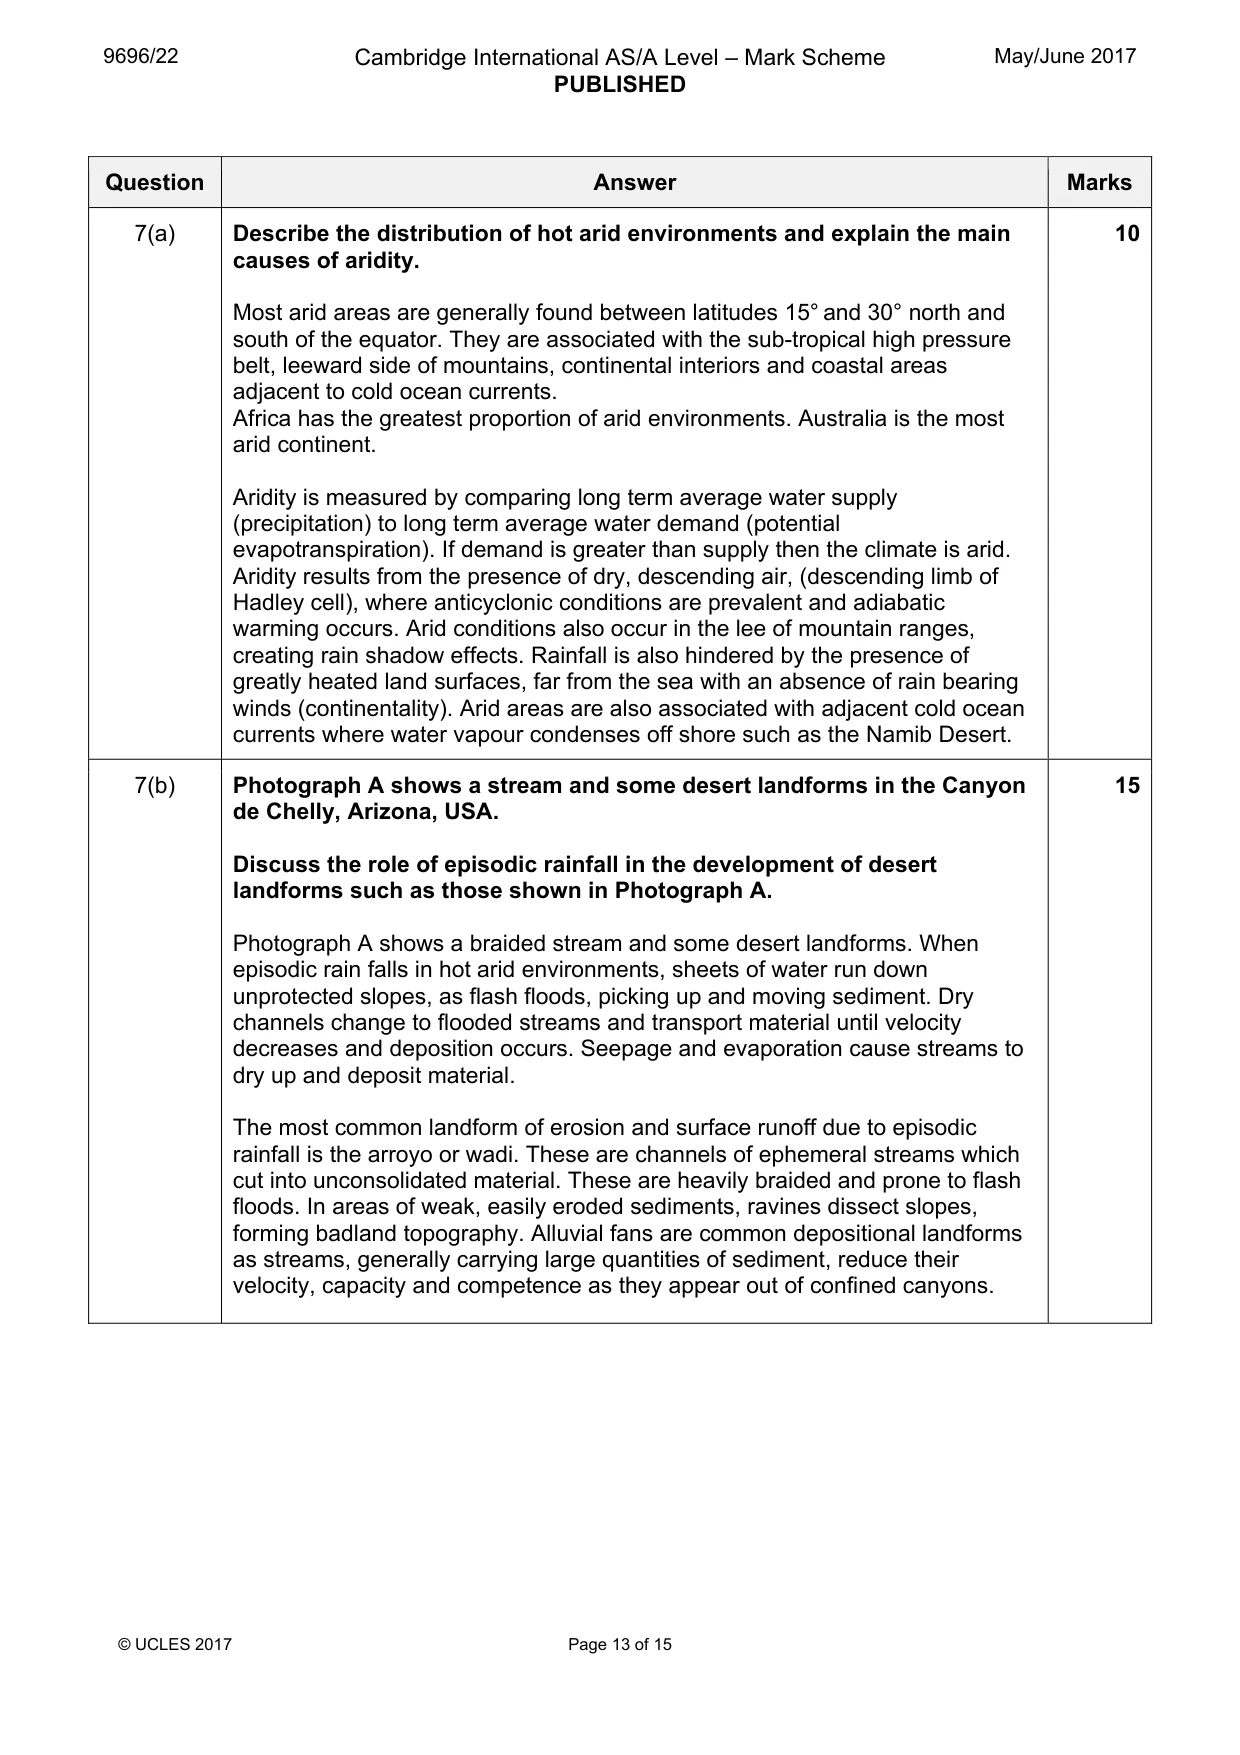
9696/22 Cambridge International AS/A Level – Mark Scheme PUBLISHED May/June 2017 © UCLES 2017 Page 13 of 15 Question Answer Marks 7(a) Describe the distribution of hot arid environments and explain the main causes of aridity. Most arid areas are generally found between latitudes 15° and 30° north and south of the equator. They are associated with the sub-tropical high pressure belt, leeward side of mountains, continental interiors and coastal areas adjacent to cold ocean currents. Africa has the greatest proportion of arid environments. Australia is the most arid continent. Aridity is measured by comparing long term average water supply (precipitation) to long term average water demand (potential evapotranspiration). If demand is greater than supply then the climate is arid. Aridity results from the presence of dry, descending air, (descending limb of Hadley cell), where anticyclonic conditions are prevalent and adiabatic warming occurs. Arid conditions also occur in the lee of mountain ranges, creating rain shadow effects. Rainfall is also hindered by the presence of greatly heated land surfaces, far from the sea with an absence of rain bearing winds (continentality). Arid areas are also associated with adjacent cold ocean currents where water vapour condenses off shore such as the Namib Desert. 10 7(b) Photograph A shows a stream and some desert landforms in the Canyon de Chelly, Arizona, USA. Discuss the role of episodic rainfall in the development of desert landforms such as those shown in Photograph A. Photograph A shows a braided stream and some desert landforms. When episodic rain falls in hot arid environments, sheets of water run down unprotected slopes, as flash floods, picking up and moving sediment. Dry channels change to flooded streams and transport material until velocity decreases and deposition occurs. Seepage and evaporation cause streams to dry up and deposit material. The most common landform of erosion and surface runoff due to episodic rainfall is the arroyo or wadi. These are channels of ephemeral streams which cut into unconsolidated material. These are heavily braided and prone to flash floods. In areas of weak, easily eroded sediments, ravines dissect slopes, forming badland topography. Alluvial fans are common depositional landforms as streams, generally carrying large quantities of sediment, reduce their velocity, capacity and competence as they appear out of confined canyons. 15
Mark scheme, page 14
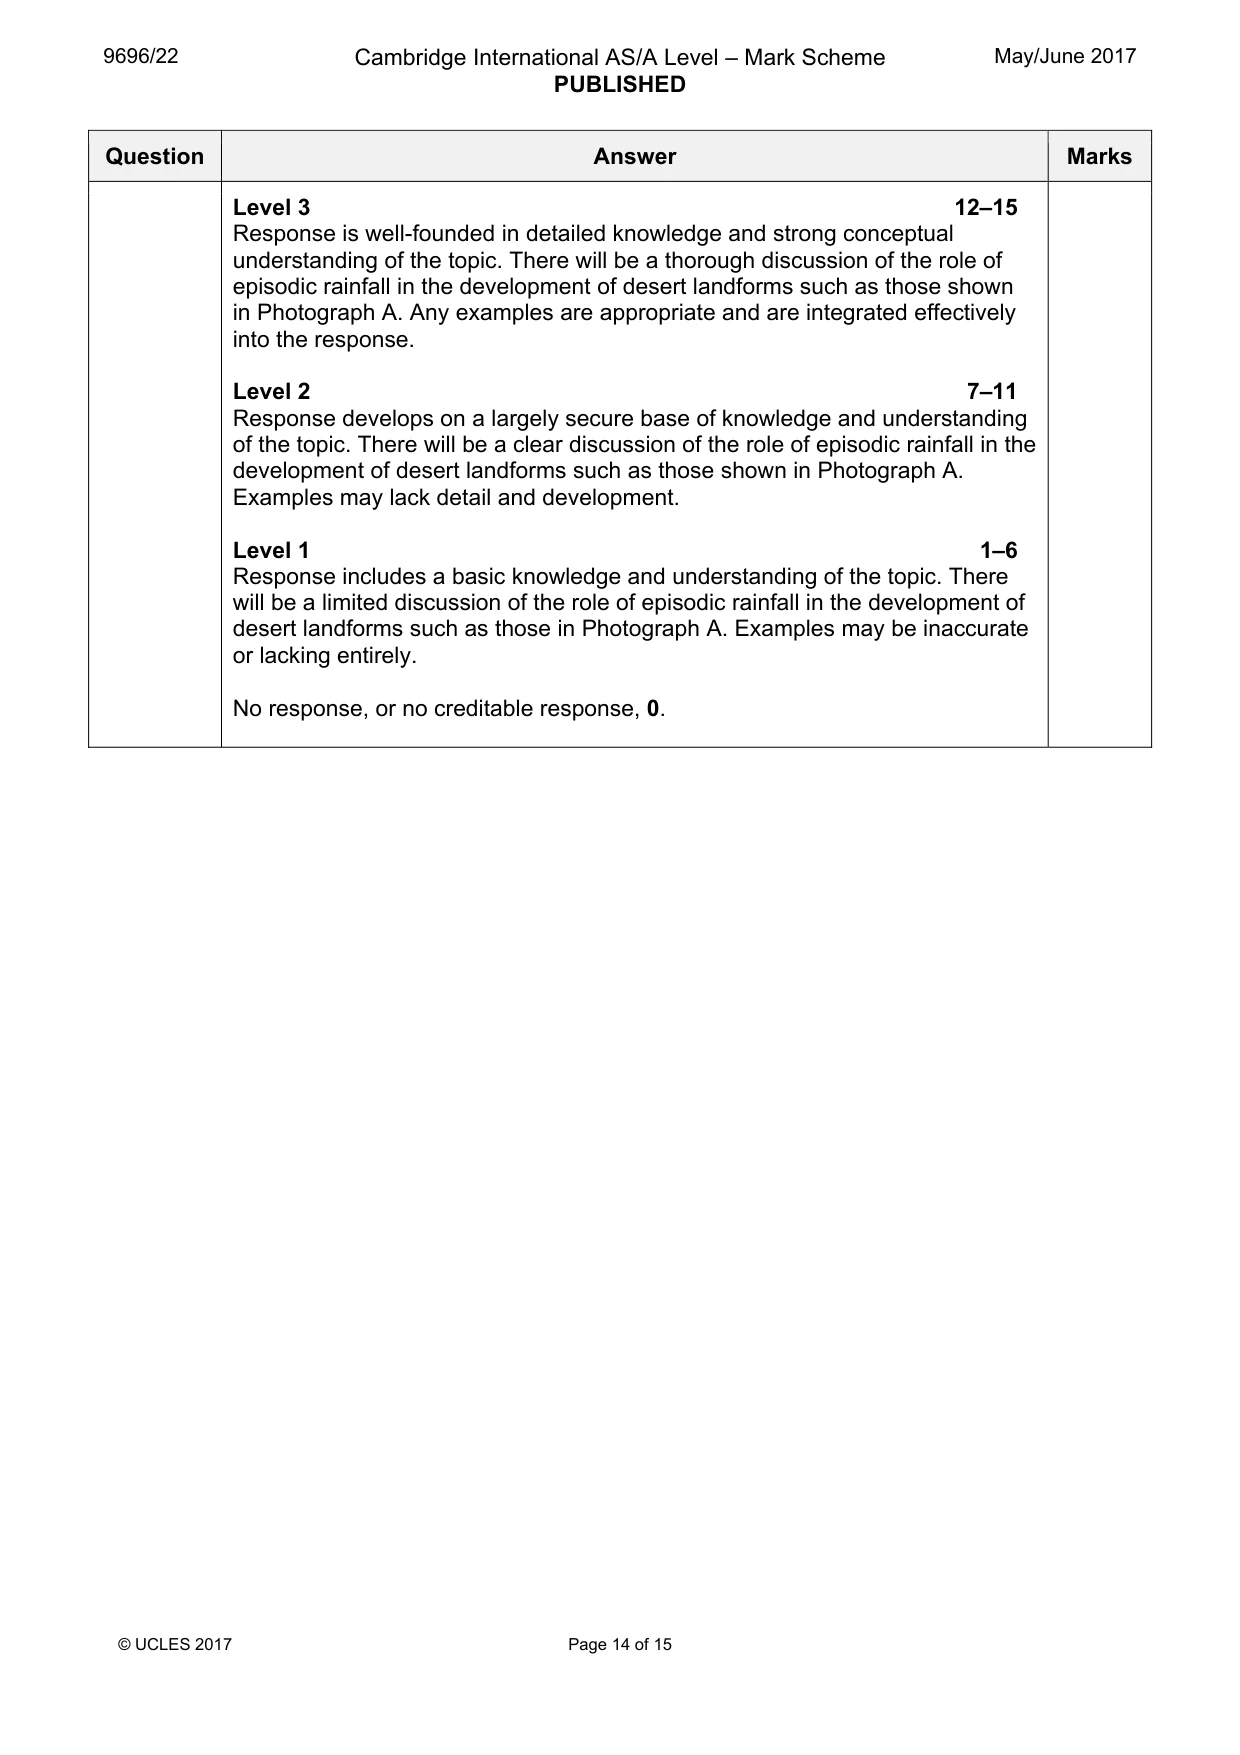
9696/22 Cambridge International AS/A Level – Mark Scheme PUBLISHED May/June 2017 © UCLES 2017 Page 14 of 15 Question Answer Marks Level 3 12–15 Response is well-founded in detailed knowledge and strong conceptual understanding of the topic. There will be a thorough discussion of the role of episodic rainfall in the development of desert landforms such as those shown in Photograph A. Any examples are appropriate and are integrated effectively into the response. Level 2 7–11 Response develops on a largely secure base of knowledge and understanding of the topic. There will be a clear discussion of the role of episodic rainfall in the development of desert landforms such as those shown in Photograph A. Examples may lack detail and development. Level 1 1–6 Response includes a basic knowledge and understanding of the topic. There will be a limited discussion of the role of episodic rainfall in the development of desert landforms such as those in Photograph A. Examples may be inaccurate or lacking entirely. No response, or no creditable response, 0.
Mark scheme, page 15
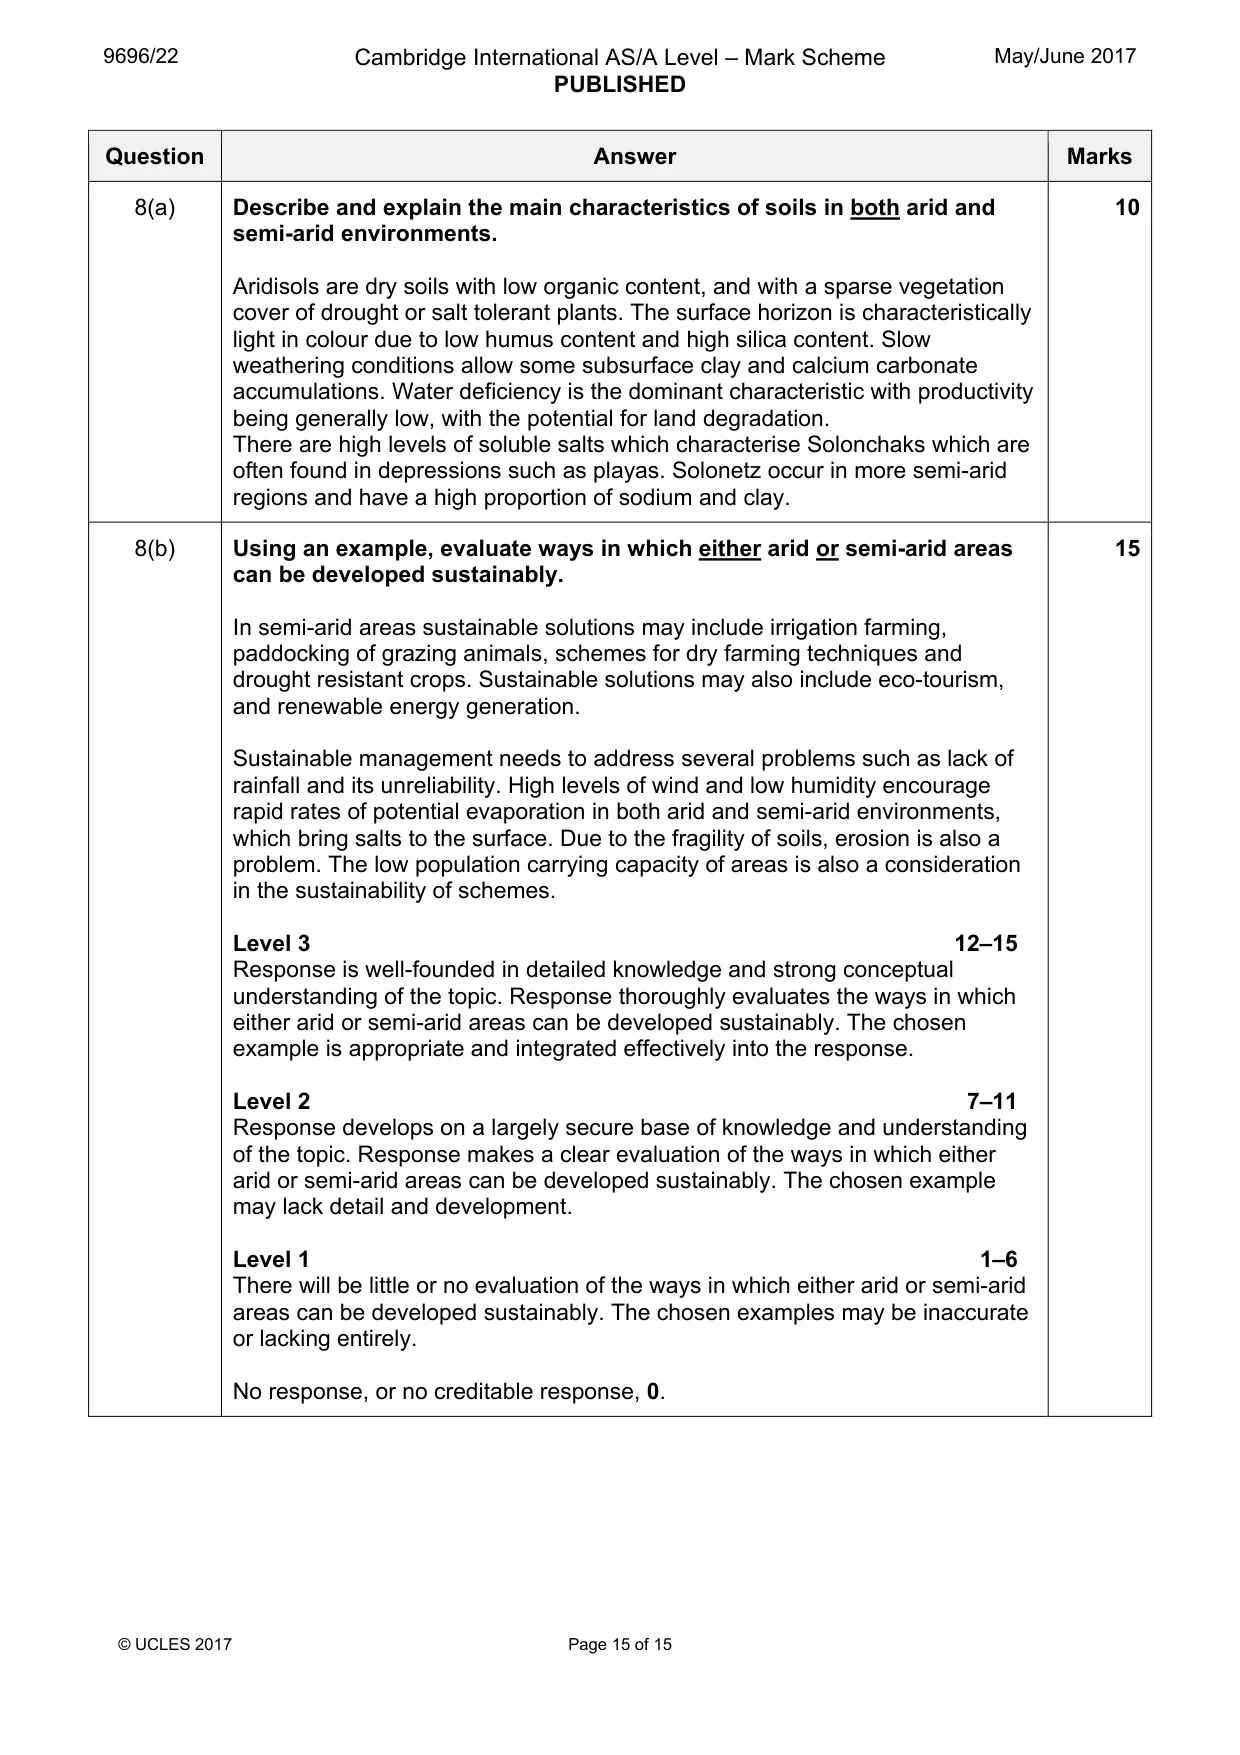
9696/22 Cambridge International AS/A Level – Mark Scheme PUBLISHED May/June 2017 © UCLES 2017 Page 15 of 15 Question Answer Marks 8(a) Describe and explain the main characteristics of soils in both arid and semi-arid environments. Aridisols are dry soils with low organic content, and with a sparse vegetation cover of drought or salt tolerant plants. The surface horizon is characteristically light in colour due to low humus content and high silica content. Slow weathering conditions allow some subsurface clay and calcium carbonate accumulations. Water deficiency is the dominant characteristic with productivity being generally low, with the potential for land degradation. There are high levels of soluble salts which characterise Solonchaks which are often found in depressions such as playas. Solonetz occur in more semi-arid regions and have a high proportion of sodium and clay. 10 8(b) Using an example, evaluate ways in which either arid or semi-arid areas can be developed sustainably. In semi-arid areas sustainable solutions may include irrigation farming, paddocking of grazing animals, schemes for dry farming techniques and drought resistant crops. Sustainable solutions may also include eco-tourism, and renewable energy generation. Sustainable management needs to address several problems such as lack of rainfall and its unreliability. High levels of wind and low humidity encourage rapid rates of potential evaporation in both arid and semi-arid environments, which bring salts to the surface. Due to the fragility of soils, erosion is also a problem. The low population carrying capacity of areas is also a consideration in the sustainability of schemes. Level 3 12–15 Response is well-founded in detailed knowledge and strong conceptual understanding of the topic. Response thoroughly evaluates the ways in which either arid or semi-arid areas can be developed sustainably. The chosen example is appropriate and integrated effectively into the response. Level 2 7–11 Response develops on a largely secure base of knowledge and understanding of the topic. Response makes a clear evaluation of the ways in which either arid or semi-arid areas can be developed sustainably. The chosen example may lack detail and development. Level 1 1–6 There will be little or no evaluation of the ways in which either arid or semi-arid areas can be developed sustainably. The chosen examples may be inaccurate or lacking entirely. No response, or no creditable response, 0. 15
What you needed in this session
Cambridge’s own grade thresholds for 2017 May/June, Paper 2 · Variant 2. A higher threshold means an easier paper — the bar moves with how the cohort did.