Cambridge A Level Geography 9696 — 2015 Oct/Nov Paper 3 · Variant 2
9696/32/O/N/15 · 50 marks · ≈56 min
The question paper and its mark scheme, free to read here and free to download. This is Cambridge’s own paper, exactly as it was sat.
Question paper4 pages

Mark scheme11 pages
Answers below. Sit the paper first if you are practising.


Paper as text
Question paper, page 1
This document consists of 3 printed pages, 1 blank page and 2 Inserts. DC (LEG) 114705 © UCLES 2015 [Turn over Cambridge International Examinations Cambridge International Advanced Subsidiary and Advanced Level * 2 0 2 9 7 7 8 7 1 9 * GEOGRAPHY 9696/32 Paper 3 Advanced Human Options October/November 2015 1 hour 30 minutes No Additional Materials are required. READ THESE INSTRUCTIONS FIRST An answer booklet is provided inside this question paper. You should follow the instructions on the front cover of the answer booklet. If you need additional answer paper ask the invigilator for a continuation booklet. Answer two questions only. Each question answered must be from a different topic. Sketch maps and diagrams should be drawn whenever they serve to illustrate an answer. You should make reference to appropriate examples studied in the field or the classroom, even where such examples are not specifically requested by the question. All the Figures referred to in the questions are contained in the Insert. The number of marks is given in brackets [ ] at the end of each question or part question.
Question paper, page 2
2 9696/32/O/N/15 © UCLES 2015 Production, location and change Only one question may be answered from this topic. 1 (a) For one named agricultural system (arable or pastoral) which you have studied: (i) describe the system’s inputs and its outputs; [5] (ii) explain how physical factors affect agricultural land-use and practices in this system. [5] (b) To what extent are changes in agriculture the result of economic factors? [15] 2 (a) Figs 1A and 1B show two stages in production and location of manufacturing industry in cities. Describe, and suggest reasons for, the changes between Fig. 1A and Fig. 1B. [10] (b) With the help of examples, explain the concept of functional linkages and assess their significance for manufacturing. [15] Environmental management Only one question may be answered from this topic. 3 (a) Explain why demand for energy is increasing in most countries. [10] (b) ‘The future of energy production is in renewable resources.’ With the help of examples, how far do you agree with this statement? [15] 4 (a) Fig. 2 shows the loss of forested area, by country, 1990–2000. With the help of examples, suggest reasons why deforestation varies globally. [10] (b) Assess the success of one attempt to improve the quality of a degraded environment you have studied. [15]
Question paper, page 3
3 9696/32/O/N/15 © UCLES 2015 Global interdependence Only one question may be answered from this topic. 5 (a) Fig. 3 shows the largest trade flows in 2010, the fastest growing trade flows 2000–10 and information about world output of selected commodities. (i) Describe the pattern of the fastest growing trade flows, supporting your response with evidence from Fig. 3. [4] (ii) How does resource endowment help explain the largest trade flows in Fig. 3? [6] (b) Discuss the view that trade is preferable to tourism as the basis for a country’s economic development. [15] 6 (a) Account for the growth of international tourism. [10] (b) How far do you agree that for tourist destinations the benefits received from tourism are far greater than the costs? [15] Economic transition Only one question may be answered from this topic. 7 (a) Fig. 4 shows gross national income (GNI) per person and one measure of happiness for selected countries in 2008. (i) Describe the relationship between the measures, supporting your response with information from Fig. 4. [4] (ii) Compare the strengths and limitations of the measures in Fig. 4 in showing social and economic wellbeing. [6] (b) To what extent does globalisation help to explain global inequalities in development? [15] 8 With reference to one country: (a) describe how social and economic development varies between regions; [10] (b) assess the reasons why the country’s regional development remains uneven. [15]
Question paper, page 4
4 9696/32/O/N/15 © UCLES 2015 Permission to reproduce items where third-party owned material protected by copyright is included has been sought and cleared where possible. Every reasonable effort has been made by the publisher (UCLES) to trace copyright holders, but if any items requiring clearance have unwittingly been included, the publisher will be pleased to make amends at the earliest possible opportunity. To avoid the issue of disclosure of answer-related information to candidates, all copyright acknowledgements are reproduced online in the Cambridge International Examinations Copyright Acknowledgements Booklet. This is produced for each series of examinations and is freely available to download at www.cie.org.uk after the live examination series. Cambridge International Examinations is part of the Cambridge Assessment Group. Cambridge Assessment is the brand name of University of Cambridge Local Examinations Syndicate (UCLES), which is itself a department of the University of Cambridge. BLANK PAGE
Mark scheme, page 1
® IGCSE is the registered trademark of Cambridge International Examinations. CAMBRIDGE INTERNATIONAL EXAMINATIONS Cambridge International Advanced Subsidiary and Advanced Level MARK SCHEME for the October/November 2015 series 9696 GEOGRAPHY 9696/32 Paper 3 (Advanced Human Options), maximum raw mark 50 This mark scheme is published as an aid to teachers and candidates, to indicate the requirements of the examination. It shows the basis on which Examiners were instructed to award marks. It does not indicate the details of the discussions that took place at an Examiners’ meeting before marking began, which would have considered the acceptability of alternative answers. Mark schemes should be read in conjunction with the question paper and the Principal Examiner Report for Teachers. Cambridge will not enter into discussions about these mark schemes. Cambridge is publishing the mark schemes for the October/November 2015 series for most Cambridge IGCSE®, Cambridge International A and AS Level components and some Cambridge O Level components.
Mark scheme, page 2
Page 2 Mark Scheme Syllabus Paper Cambridge International AS/A Level – October/November 2015 9696 32 © Cambridge International Examinations 2015 Production, location and change 1 (a) For one named agricultural system (arable or pastoral) which you have studied: Much depends, clearly, on the system chosen. In the past, systems which are identified clearly, named and located performed better. If a candidate chooses something which is not a system using the classic definition, such as ‘the Green Revolution’ or ‘the CAP’, mark on merit up to the top of Level 2 in (b) and its equivalent in (a), 7/10. If a different system is chosen for (ii) than (i), credit the better and allow 1 for the other if the terms are understood and treated robustly. (i) describe the system’s inputs and its outputs; [5] This requires a little more development than a list. Inputs of land (extent, quality, soil, etc.), labour (and skills), capital (for machinery, seeds, livestock, fertilisers, etc.) and climate. Raw outputs and/or processed products if done on the farm or in an associated enterprise, plus wastes. For a list max. 2. For either inputs or outputs, max. 3. (ii) explain how physical factors affect agricultural land-use and practices in this system. [5] Here physical factors cover land, soil, aspect, climate, climatic hazards and pests and diseases. Mark holistically, bearing in mind three bands of marks, 1–2, 3–4 and 5. If only land-use or practices, max. 4. (b) To what extent are changes in agriculture the result of economic factors? [15] Candidates may interpret changes as they choose, given the material they have. In many cases other factors, such as social or behavioural ones (the farmers’ choices) and political ones, may be significant, enabling an assessment. Candidates will probably: Level 3 Structure their response as an assessment, show detailed knowledge of agriculture in more than one context. Argue convincingly and critically, with respect to factors in at least one other dimension, using the example(s) effectively. [12–15] Level 2 Produce a sound response, which may be good in parts, but which remains limited and/or unbalanced in overall detail or development. May offer evaluative comments after a satisfactory descriptive or narrative response. [7–11] Level 1 Make a basic answer which may be general, have a weak focus on change in agriculture or be faulty conceptually. Make one or more valid points, but offer little or no meaningful assessment. Notes and fragments remain in this level. [1–6] For no response, or no creditable response, 0.
Mark scheme, page 3
Page 3 Mark Scheme Syllabus Paper Cambridge International AS/A Level – October/November 2015 9696 32 © Cambridge International Examinations 2015 2 (a) Figs 1A and 1B show two stages in production and location of manufacturing industry in cities. Describe, and suggest reasons for, the changes between Fig. 1A and Fig. 1B. [10] A full description covers changes between Figs 1A and 1B in: • spatial scale, describing the spread and dispersion of production • the separation of production from control functions (6 to 12 units) • the increasing complexity of flows which results. Reasons for this decentralisation are many, but should cover disadvantages for production of the existing central locations, e.g. traffic congestion, lack of room to expand, and the advantages of the new suburban locations, e.g. good access, purpose-built factories suited to modern methods, financial incentives, space, etc. Examples that support and develop the reasons may be credited, but a general or generic response could achieve full marks. Mark on overall quality, bearing in mind three bands of marks and levels of response: 1–4, 5–7 and 8–10. For either the description or suggesting reasons, max. 6. (b) With the help of examples, explain the concept of functional linkages and assess their significance for manufacturing. [15] functional linkages are the relationships or links between one industry and another. They take a number of forms: – forward to the industry that consumes the industrial product – backward to the industry that provides the raw material/component – vertical a raw material goes through several successive processes – horizontal an industry relies on several/many others for supplies – diagonal an industry makes something which can be used in several linked industries, e.g. screws A broader view of linkages includes related services, e.g. finance, maintenance, advertising, packaging, transport, etc. Significance is in terms of productivity, efficiency, production networks, ‘just-in-time’ working and as a locational factor.
Mark scheme, page 4
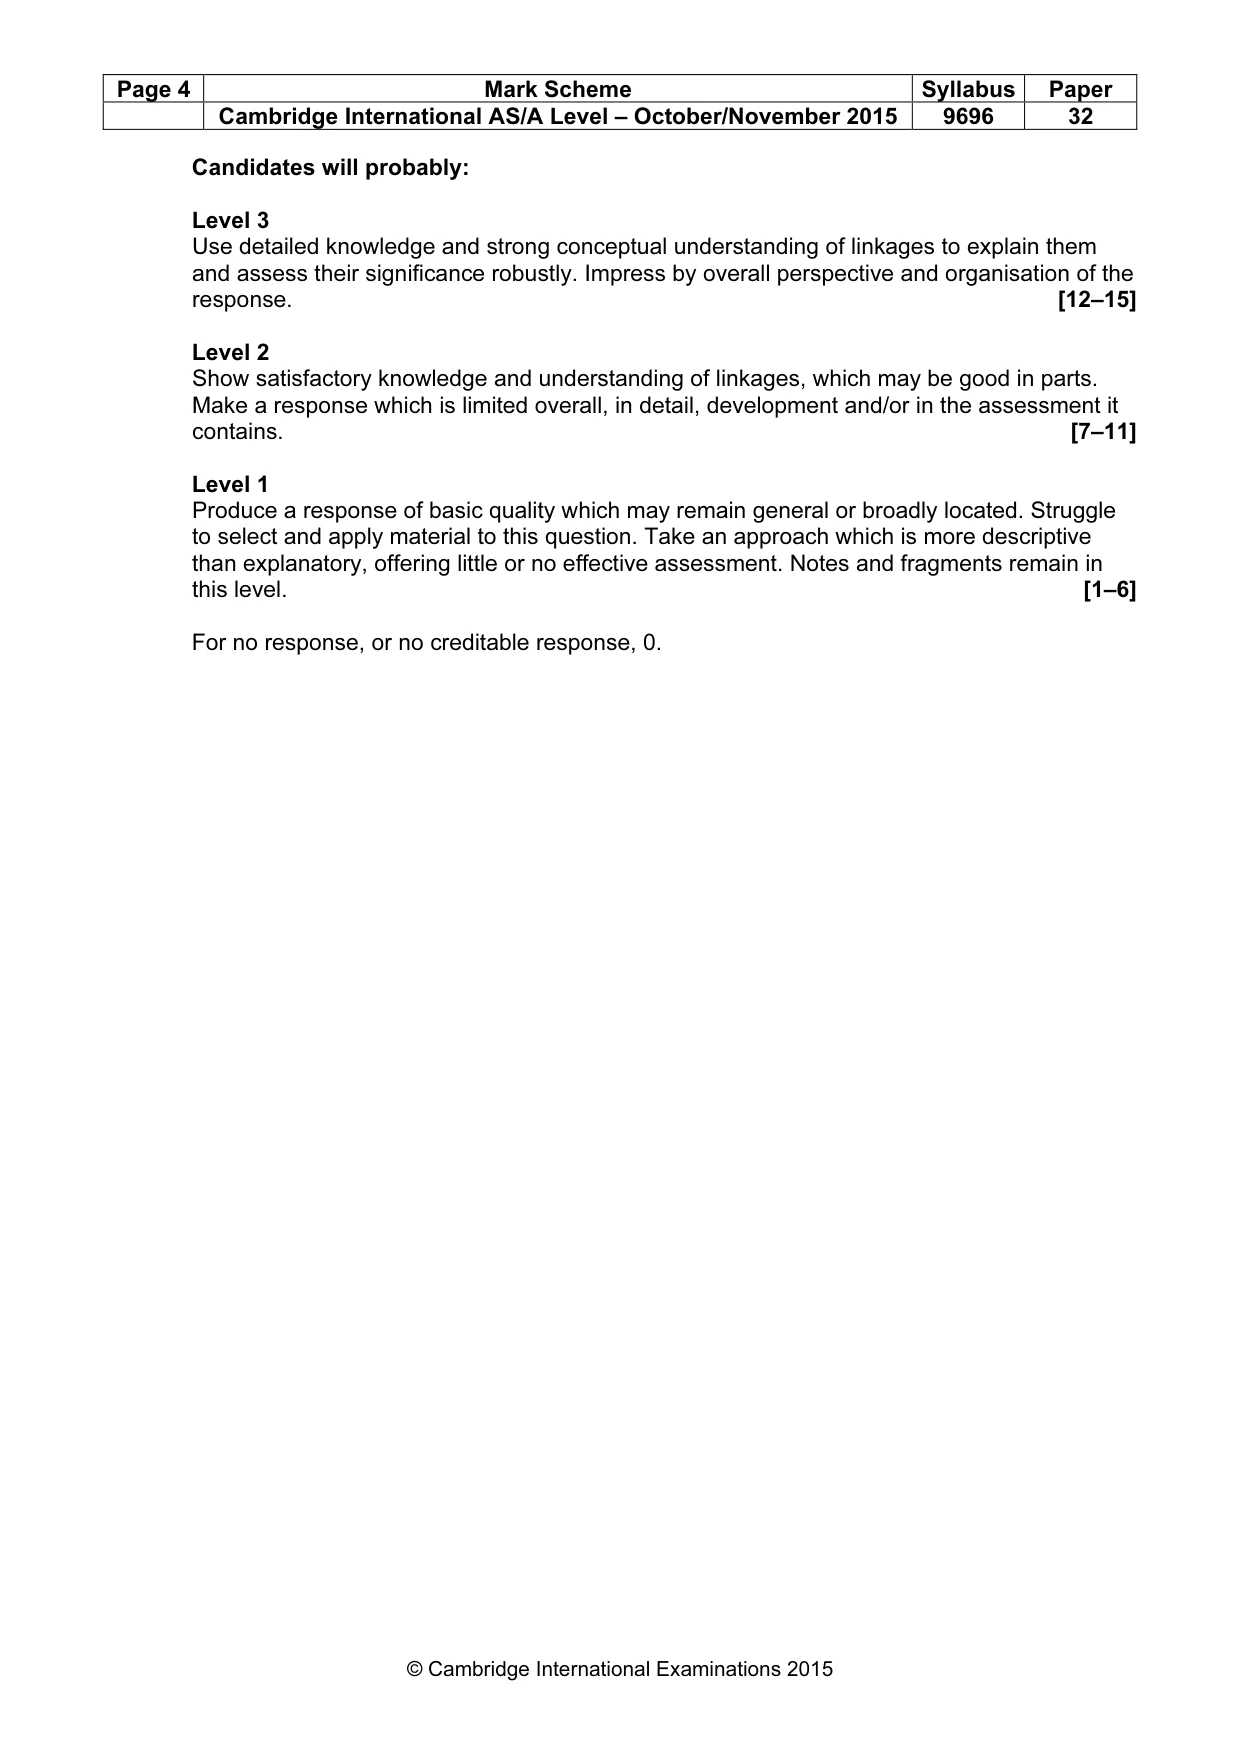
Page 4 Mark Scheme Syllabus Paper Cambridge International AS/A Level – October/November 2015 9696 32 © Cambridge International Examinations 2015 Candidates will probably: Level 3 Use detailed knowledge and strong conceptual understanding of linkages to explain them and assess their significance robustly. Impress by overall perspective and organisation of the response. [12–15] Level 2 Show satisfactory knowledge and understanding of linkages, which may be good in parts. Make a response which is limited overall, in detail, development and/or in the assessment it contains. [7–11] Level 1 Produce a response of basic quality which may remain general or broadly located. Struggle to select and apply material to this question. Take an approach which is more descriptive than explanatory, offering little or no effective assessment. Notes and fragments remain in this level. [1–6] For no response, or no creditable response, 0.
Mark scheme, page 5
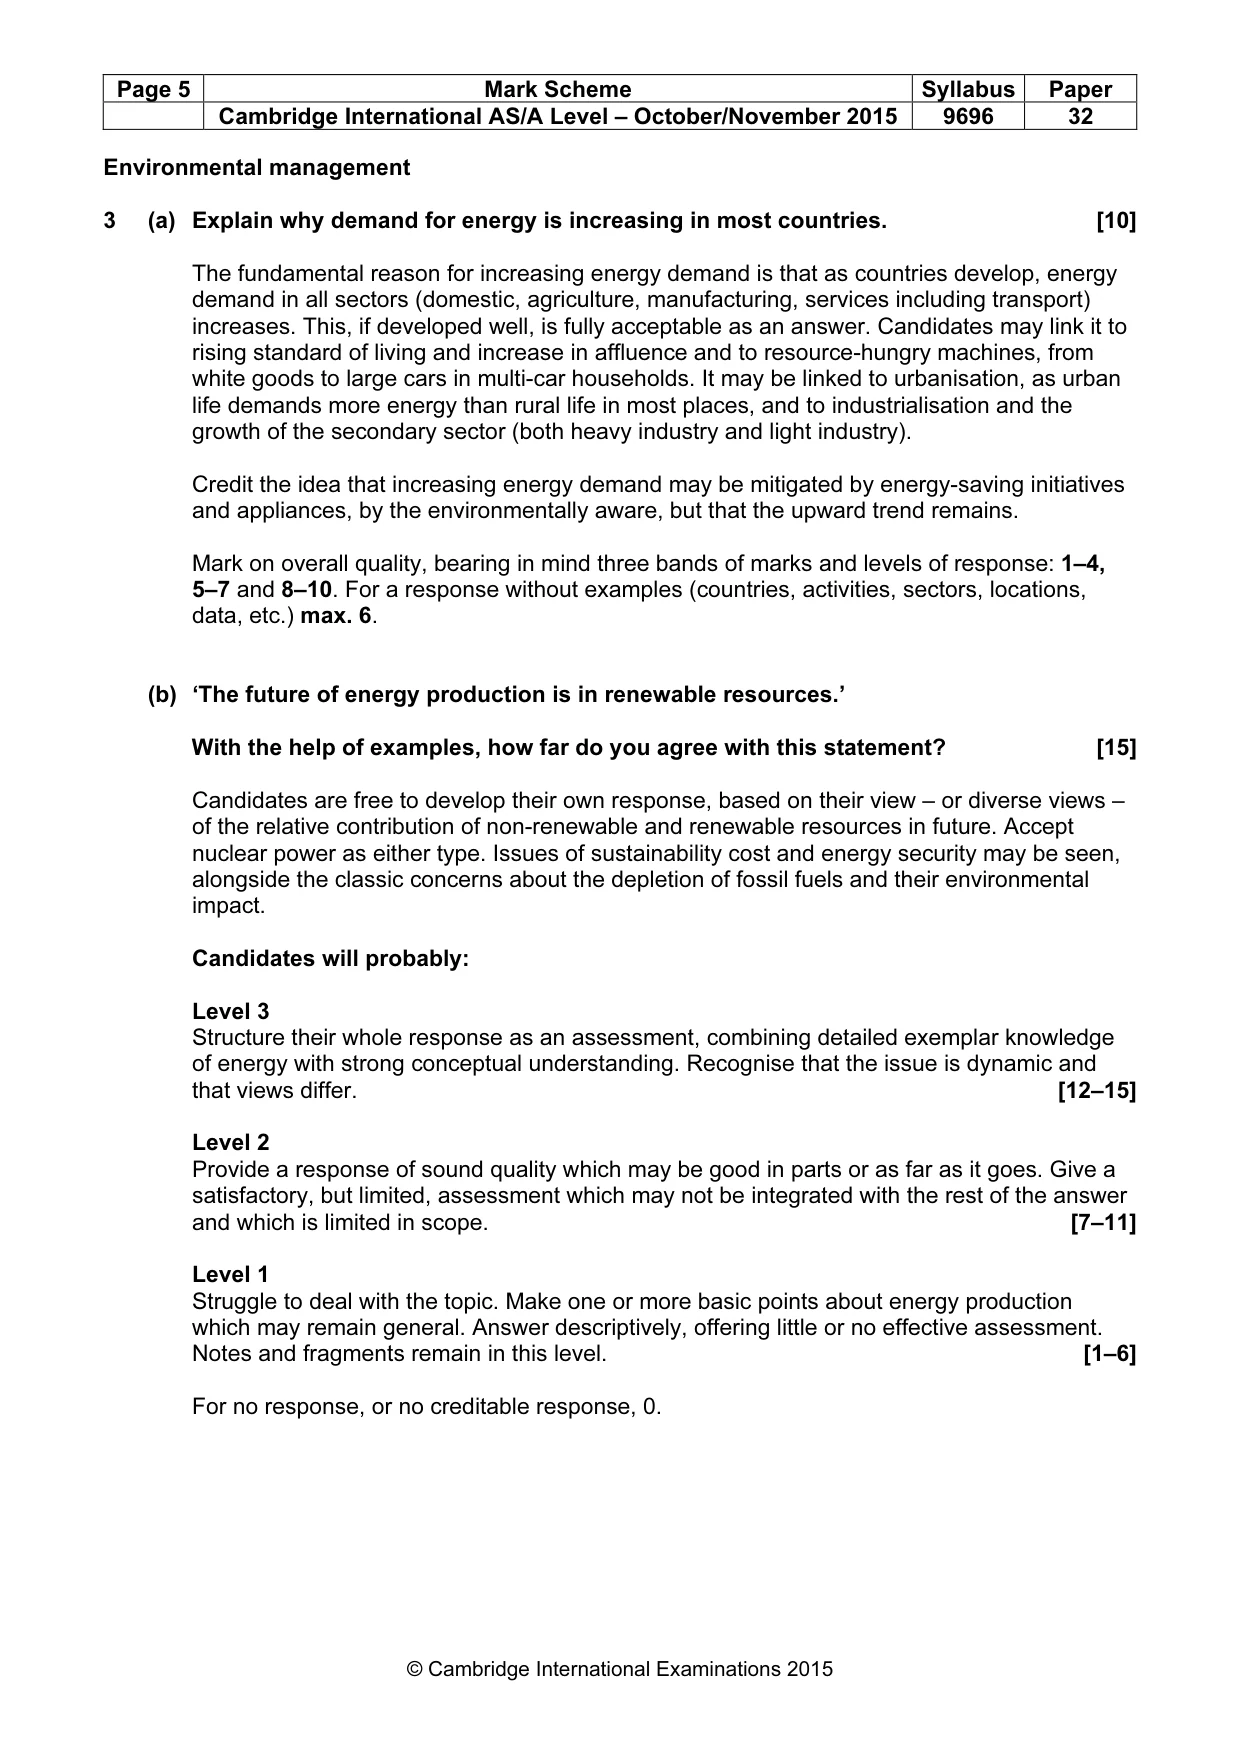
Page 5 Mark Scheme Syllabus Paper Cambridge International AS/A Level – October/November 2015 9696 32 © Cambridge International Examinations 2015 Environmental management 3 (a) Explain why demand for energy is increasing in most countries. [10] The fundamental reason for increasing energy demand is that as countries develop, energy demand in all sectors (domestic, agriculture, manufacturing, services including transport) increases. This, if developed well, is fully acceptable as an answer. Candidates may link it to rising standard of living and increase in affluence and to resource-hungry machines, from white goods to large cars in multi-car households. It may be linked to urbanisation, as urban life demands more energy than rural life in most places, and to industrialisation and the growth of the secondary sector (both heavy industry and light industry). Credit the idea that increasing energy demand may be mitigated by energy-saving initiatives and appliances, by the environmentally aware, but that the upward trend remains. Mark on overall quality, bearing in mind three bands of marks and levels of response: 1–4, 5–7 and 8–10. For a response without examples (countries, activities, sectors, locations, data, etc.) max. 6. (b) ‘The future of energy production is in renewable resources.’ With the help of examples, how far do you agree with this statement? [15] Candidates are free to develop their own response, based on their view – or diverse views – of the relative contribution of non-renewable and renewable resources in future. Accept nuclear power as either type. Issues of sustainability cost and energy security may be seen, alongside the classic concerns about the depletion of fossil fuels and their environmental impact. Candidates will probably: Level 3 Structure their whole response as an assessment, combining detailed exemplar knowledge of energy with strong conceptual understanding. Recognise that the issue is dynamic and that views differ. [12–15] Level 2 Provide a response of sound quality which may be good in parts or as far as it goes. Give a satisfactory, but limited, assessment which may not be integrated with the rest of the answer and which is limited in scope. [7–11] Level 1 Struggle to deal with the topic. Make one or more basic points about energy production which may remain general. Answer descriptively, offering little or no effective assessment. Notes and fragments remain in this level. [1–6] For no response, or no creditable response, 0.
Mark scheme, page 6
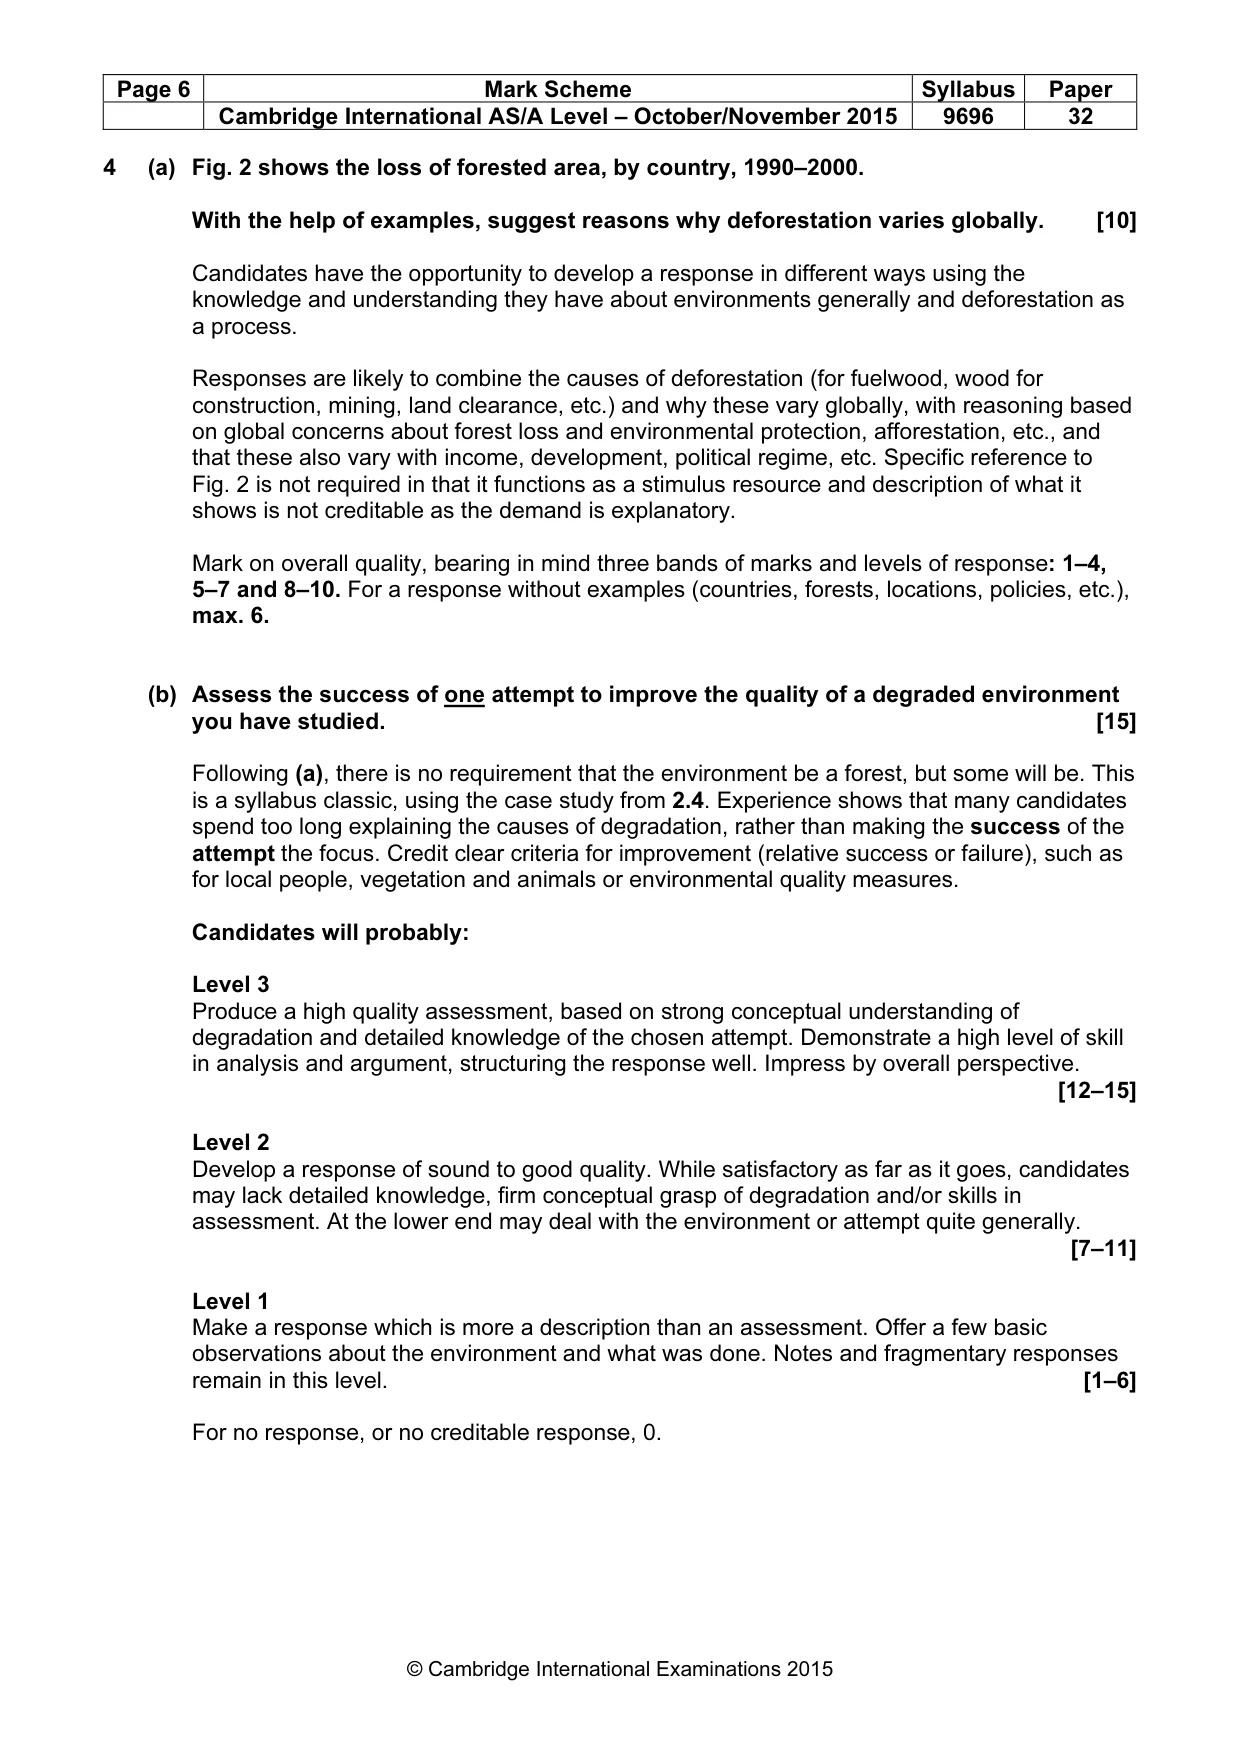
Page 6 Mark Scheme Syllabus Paper Cambridge International AS/A Level – October/November 2015 9696 32 © Cambridge International Examinations 2015 4 (a) Fig. 2 shows the loss of forested area, by country, 1990–2000. With the help of examples, suggest reasons why deforestation varies globally. [10] Candidates have the opportunity to develop a response in different ways using the knowledge and understanding they have about environments generally and deforestation as a process. Responses are likely to combine the causes of deforestation (for fuelwood, wood for construction, mining, land clearance, etc.) and why these vary globally, with reasoning based on global concerns about forest loss and environmental protection, afforestation, etc., and that these also vary with income, development, political regime, etc. Specific reference to Fig. 2 is not required in that it functions as a stimulus resource and description of what it shows is not creditable as the demand is explanatory. Mark on overall quality, bearing in mind three bands of marks and levels of response: 1–4, 5–7 and 8–10. For a response without examples (countries, forests, locations, policies, etc.), max. 6. (b) Assess the success of one attempt to improve the quality of a degraded environment you have studied. [15] Following (a), there is no requirement that the environment be a forest, but some will be. This is a syllabus classic, using the case study from 2.4. Experience shows that many candidates spend too long explaining the causes of degradation, rather than making the success of the attempt the focus. Credit clear criteria for improvement (relative success or failure), such as for local people, vegetation and animals or environmental quality measures. Candidates will probably: Level 3 Produce a high quality assessment, based on strong conceptual understanding of degradation and detailed knowledge of the chosen attempt. Demonstrate a high level of skill in analysis and argument, structuring the response well. Impress by overall perspective. [12–15] Level 2 Develop a response of sound to good quality. While satisfactory as far as it goes, candidates may lack detailed knowledge, firm conceptual grasp of degradation and/or skills in assessment. At the lower end may deal with the environment or attempt quite generally. [7–11] Level 1 Make a response which is more a description than an assessment. Offer a few basic observations about the environment and what was done. Notes and fragmentary responses remain in this level. [1–6] For no response, or no creditable response, 0.
Mark scheme, page 7
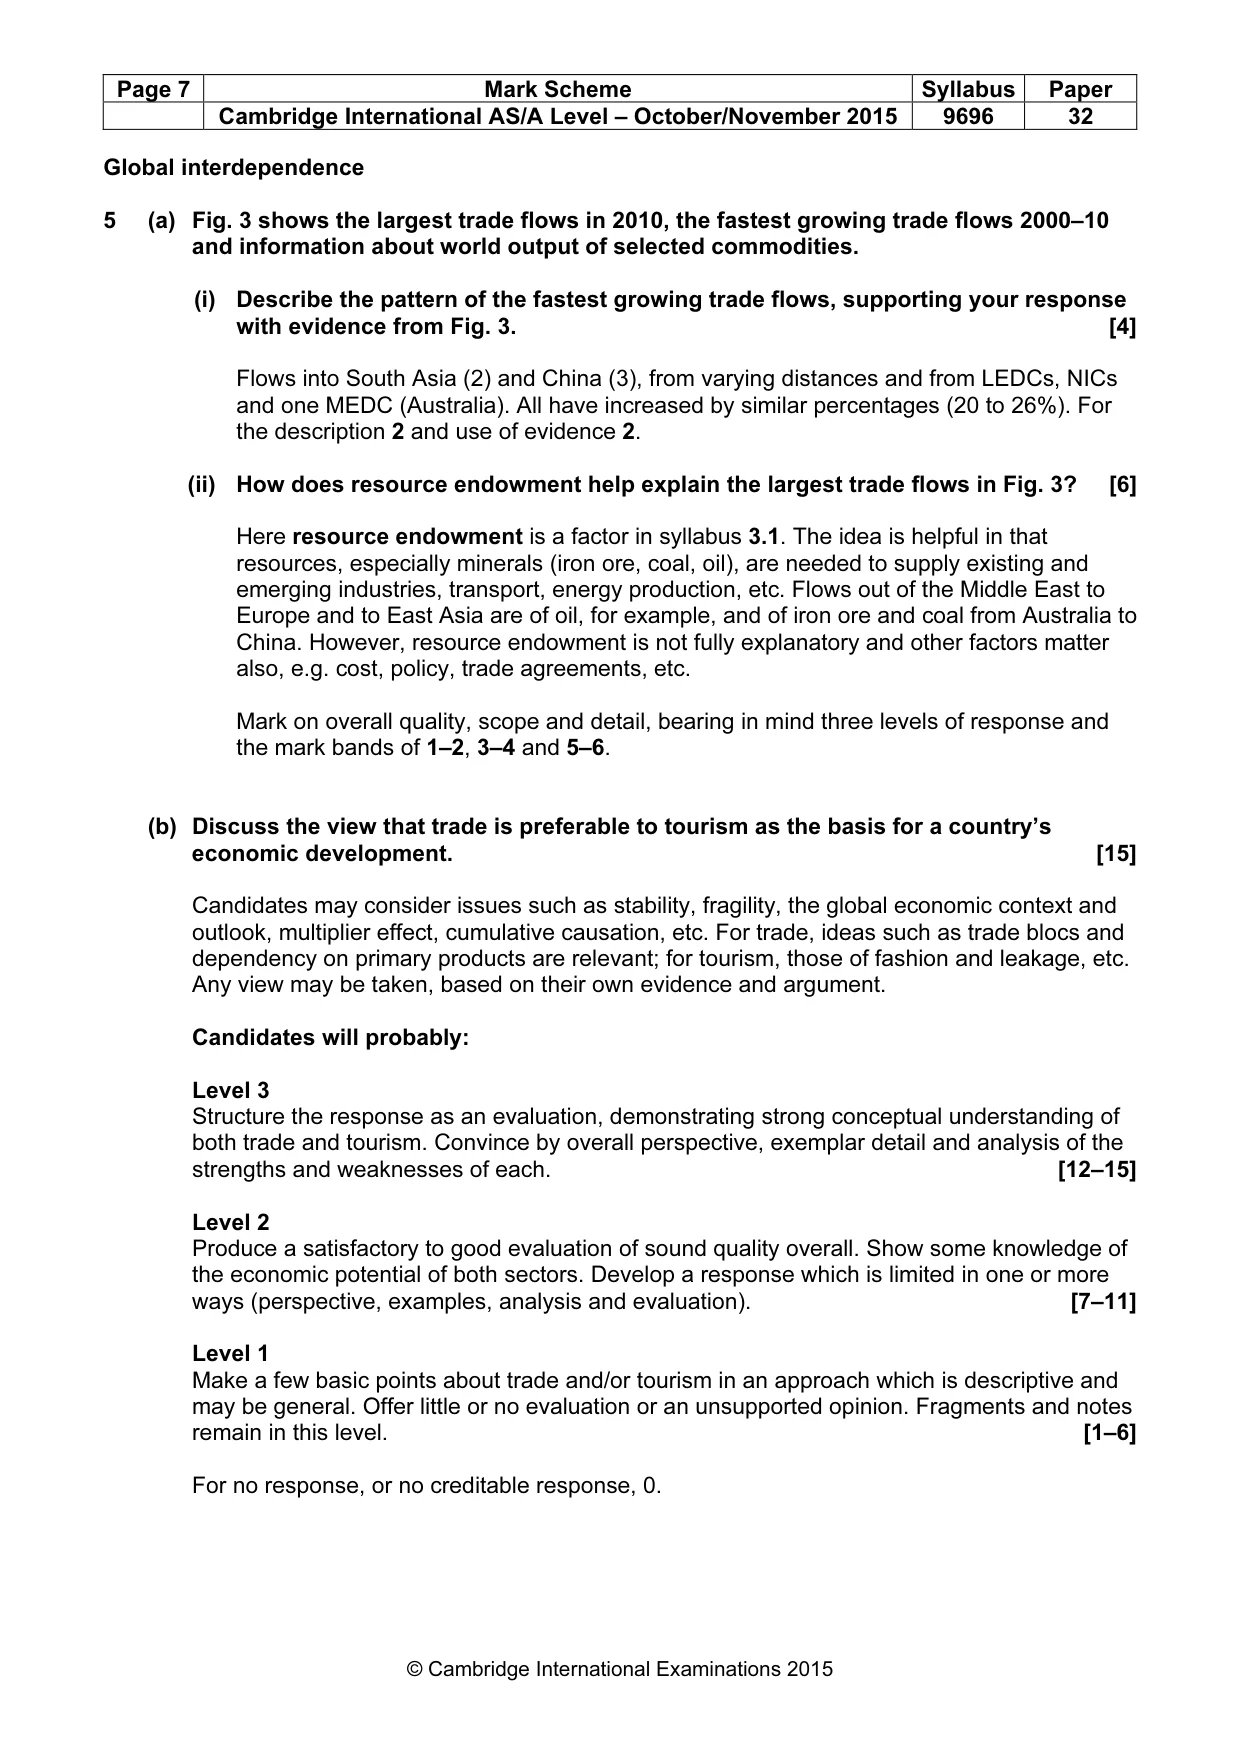
Page 7 Mark Scheme Syllabus Paper Cambridge International AS/A Level – October/November 2015 9696 32 © Cambridge International Examinations 2015 Global interdependence 5 (a) Fig. 3 shows the largest trade flows in 2010, the fastest growing trade flows 2000–10 and information about world output of selected commodities. (i) Describe the pattern of the fastest growing trade flows, supporting your response with evidence from Fig. 3. [4] Flows into South Asia (2) and China (3), from varying distances and from LEDCs, NICs and one MEDC (Australia). All have increased by similar percentages (20 to 26%). For the description 2 and use of evidence 2. (ii) How does resource endowment help explain the largest trade flows in Fig. 3? [6] Here resource endowment is a factor in syllabus 3.1. The idea is helpful in that resources, especially minerals (iron ore, coal, oil), are needed to supply existing and emerging industries, transport, energy production, etc. Flows out of the Middle East to Europe and to East Asia are of oil, for example, and of iron ore and coal from Australia to China. However, resource endowment is not fully explanatory and other factors matter also, e.g. cost, policy, trade agreements, etc. Mark on overall quality, scope and detail, bearing in mind three levels of response and the mark bands of 1–2, 3–4 and 5–6. (b) Discuss the view that trade is preferable to tourism as the basis for a country’s economic development. [15] Candidates may consider issues such as stability, fragility, the global economic context and outlook, multiplier effect, cumulative causation, etc. For trade, ideas such as trade blocs and dependency on primary products are relevant; for tourism, those of fashion and leakage, etc. Any view may be taken, based on their own evidence and argument. Candidates will probably: Level 3 Structure the response as an evaluation, demonstrating strong conceptual understanding of both trade and tourism. Convince by overall perspective, exemplar detail and analysis of the strengths and weaknesses of each. [12–15] Level 2 Produce a satisfactory to good evaluation of sound quality overall. Show some knowledge of the economic potential of both sectors. Develop a response which is limited in one or more ways (perspective, examples, analysis and evaluation). [7–11] Level 1 Make a few basic points about trade and/or tourism in an approach which is descriptive and may be general. Offer little or no evaluation or an unsupported opinion. Fragments and notes remain in this level. [1–6] For no response, or no creditable response, 0.
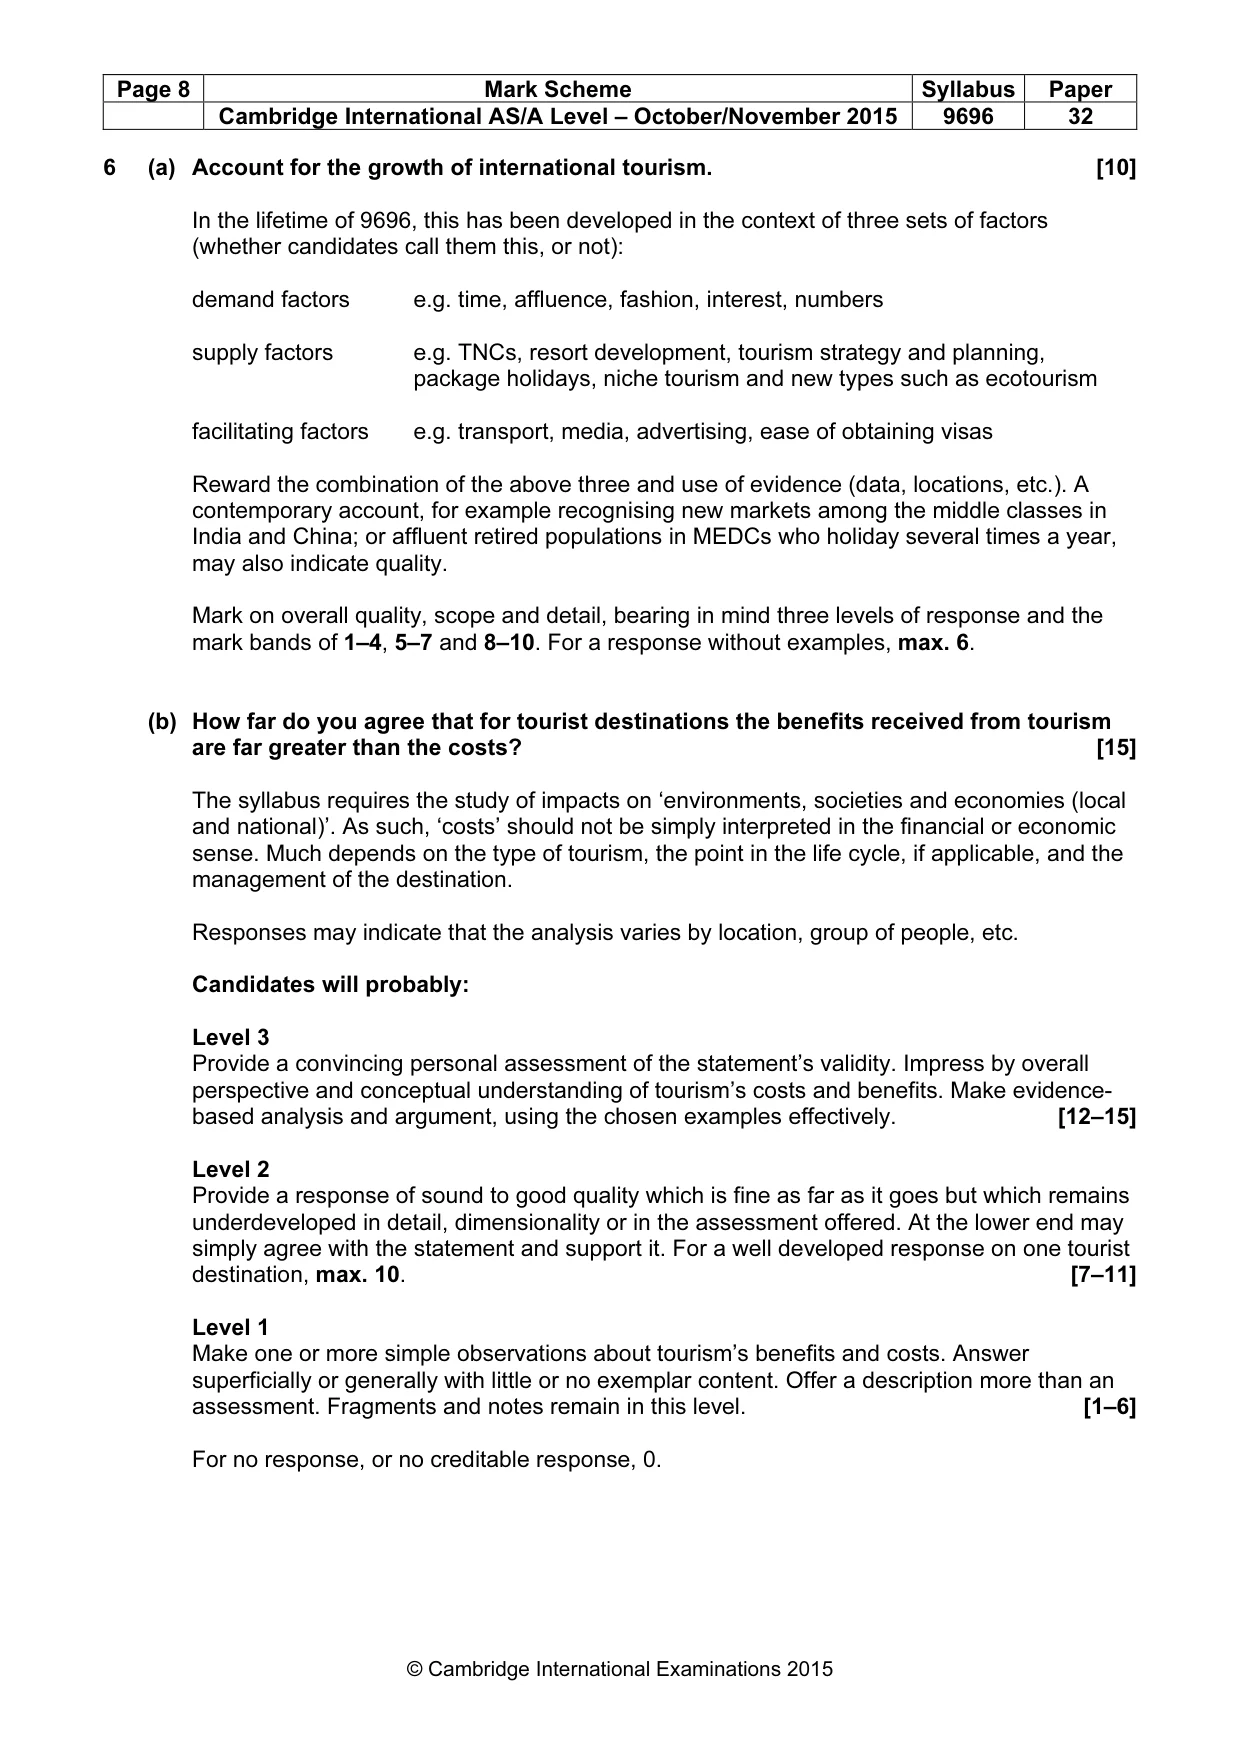
Mark scheme, page 8
Page 8 Mark Scheme Syllabus Paper Cambridge International AS/A Level – October/November 2015 9696 32 © Cambridge International Examinations 2015 6 (a) Account for the growth of international tourism. [10] In the lifetime of 9696, this has been developed in the context of three sets of factors (whether candidates call them this, or not): demand factors e.g. time, affluence, fashion, interest, numbers supply factors e.g. TNCs, resort development, tourism strategy and planning, package holidays, niche tourism and new types such as ecotourism facilitating factors e.g. transport, media, advertising, ease of obtaining visas Reward the combination of the above three and use of evidence (data, locations, etc.). A contemporary account, for example recognising new markets among the middle classes in India and China; or affluent retired populations in MEDCs who holiday several times a year, may also indicate quality. Mark on overall quality, scope and detail, bearing in mind three levels of response and the mark bands of 1–4, 5–7 and 8–10. For a response without examples, max. 6. (b) How far do you agree that for tourist destinations the benefits received from tourism are far greater than the costs? [15] The syllabus requires the study of impacts on ‘environments, societies and economies (local and national)’. As such, ‘costs’ should not be simply interpreted in the financial or economic sense. Much depends on the type of tourism, the point in the life cycle, if applicable, and the management of the destination. Responses may indicate that the analysis varies by location, group of people, etc. Candidates will probably: Level 3 Provide a convincing personal assessment of the statement’s validity. Impress by overall perspective and conceptual understanding of tourism’s costs and benefits. Make evidence- based analysis and argument, using the chosen examples effectively. [12–15] Level 2 Provide a response of sound to good quality which is fine as far as it goes but which remains underdeveloped in detail, dimensionality or in the assessment offered. At the lower end may simply agree with the statement and support it. For a well developed response on one tourist destination, max. 10. [7–11] Level 1 Make one or more simple observations about tourism’s benefits and costs. Answer superficially or generally with little or no exemplar content. Offer a description more than an assessment. Fragments and notes remain in this level. [1–6] For no response, or no creditable response, 0.
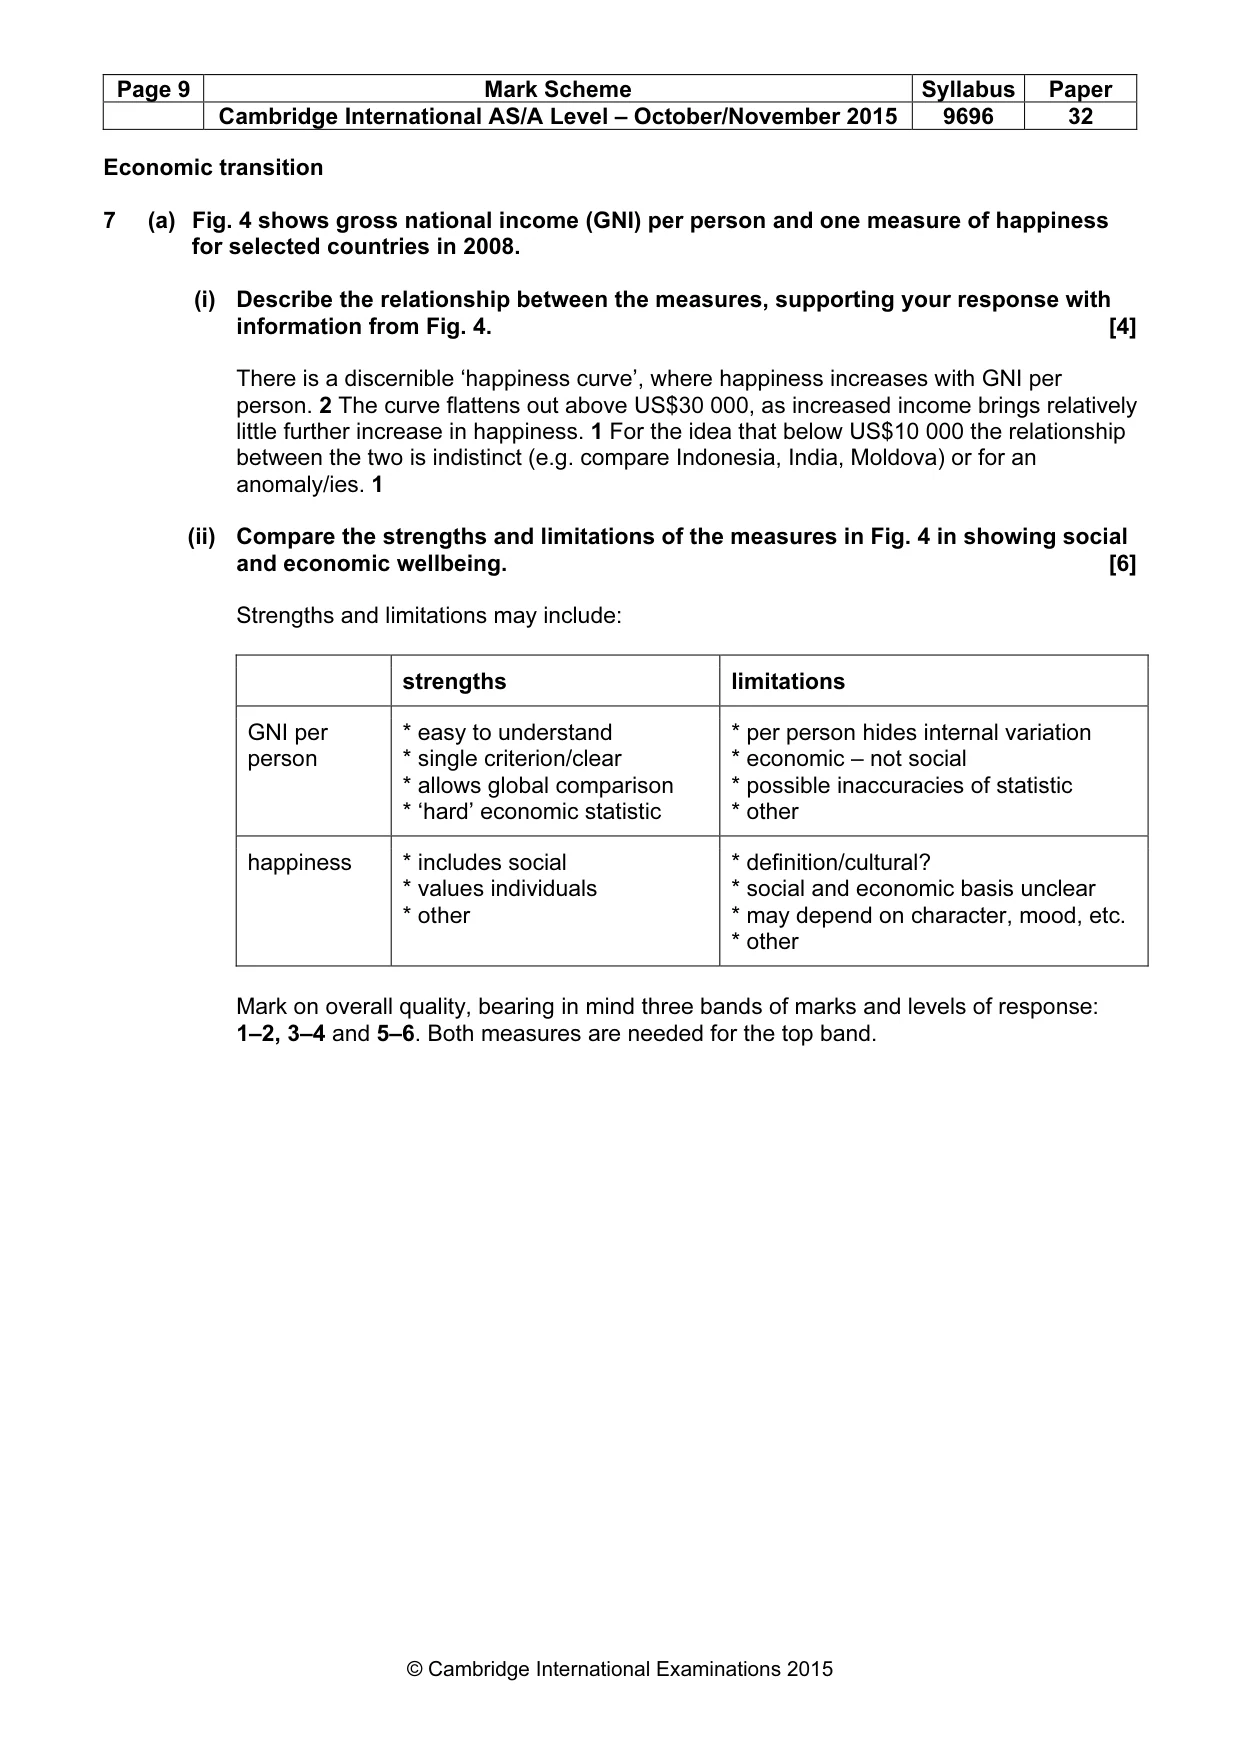
Mark scheme, page 9
Page 9 Mark Scheme Syllabus Paper Cambridge International AS/A Level – October/November 2015 9696 32 © Cambridge International Examinations 2015 Economic transition 7 (a) Fig. 4 shows gross national income (GNI) per person and one measure of happiness for selected countries in 2008. (i) Describe the relationship between the measures, supporting your response with information from Fig. 4. [4] There is a discernible ‘happiness curve’, where happiness increases with GNI per person. 2 The curve flattens out above US$30 000, as increased income brings relatively little further increase in happiness. 1 For the idea that below US$10 000 the relationship between the two is indistinct (e.g. compare Indonesia, India, Moldova) or for an anomaly/ies. 1 (ii) Compare the strengths and limitations of the measures in Fig. 4 in showing social and economic wellbeing. [6] Strengths and limitations may include: strengths limitations GNI per person * easy to understand * single criterion/clear * allows global comparison * ‘hard’ economic statistic * per person hides internal variation * economic – not social * possible inaccuracies of statistic * other happiness * includes social * values individuals * other * definition/cultural? * social and economic basis unclear * may depend on character, mood, etc. * other Mark on overall quality, bearing in mind three bands of marks and levels of response: 1–2, 3–4 and 5–6. Both measures are needed for the top band.
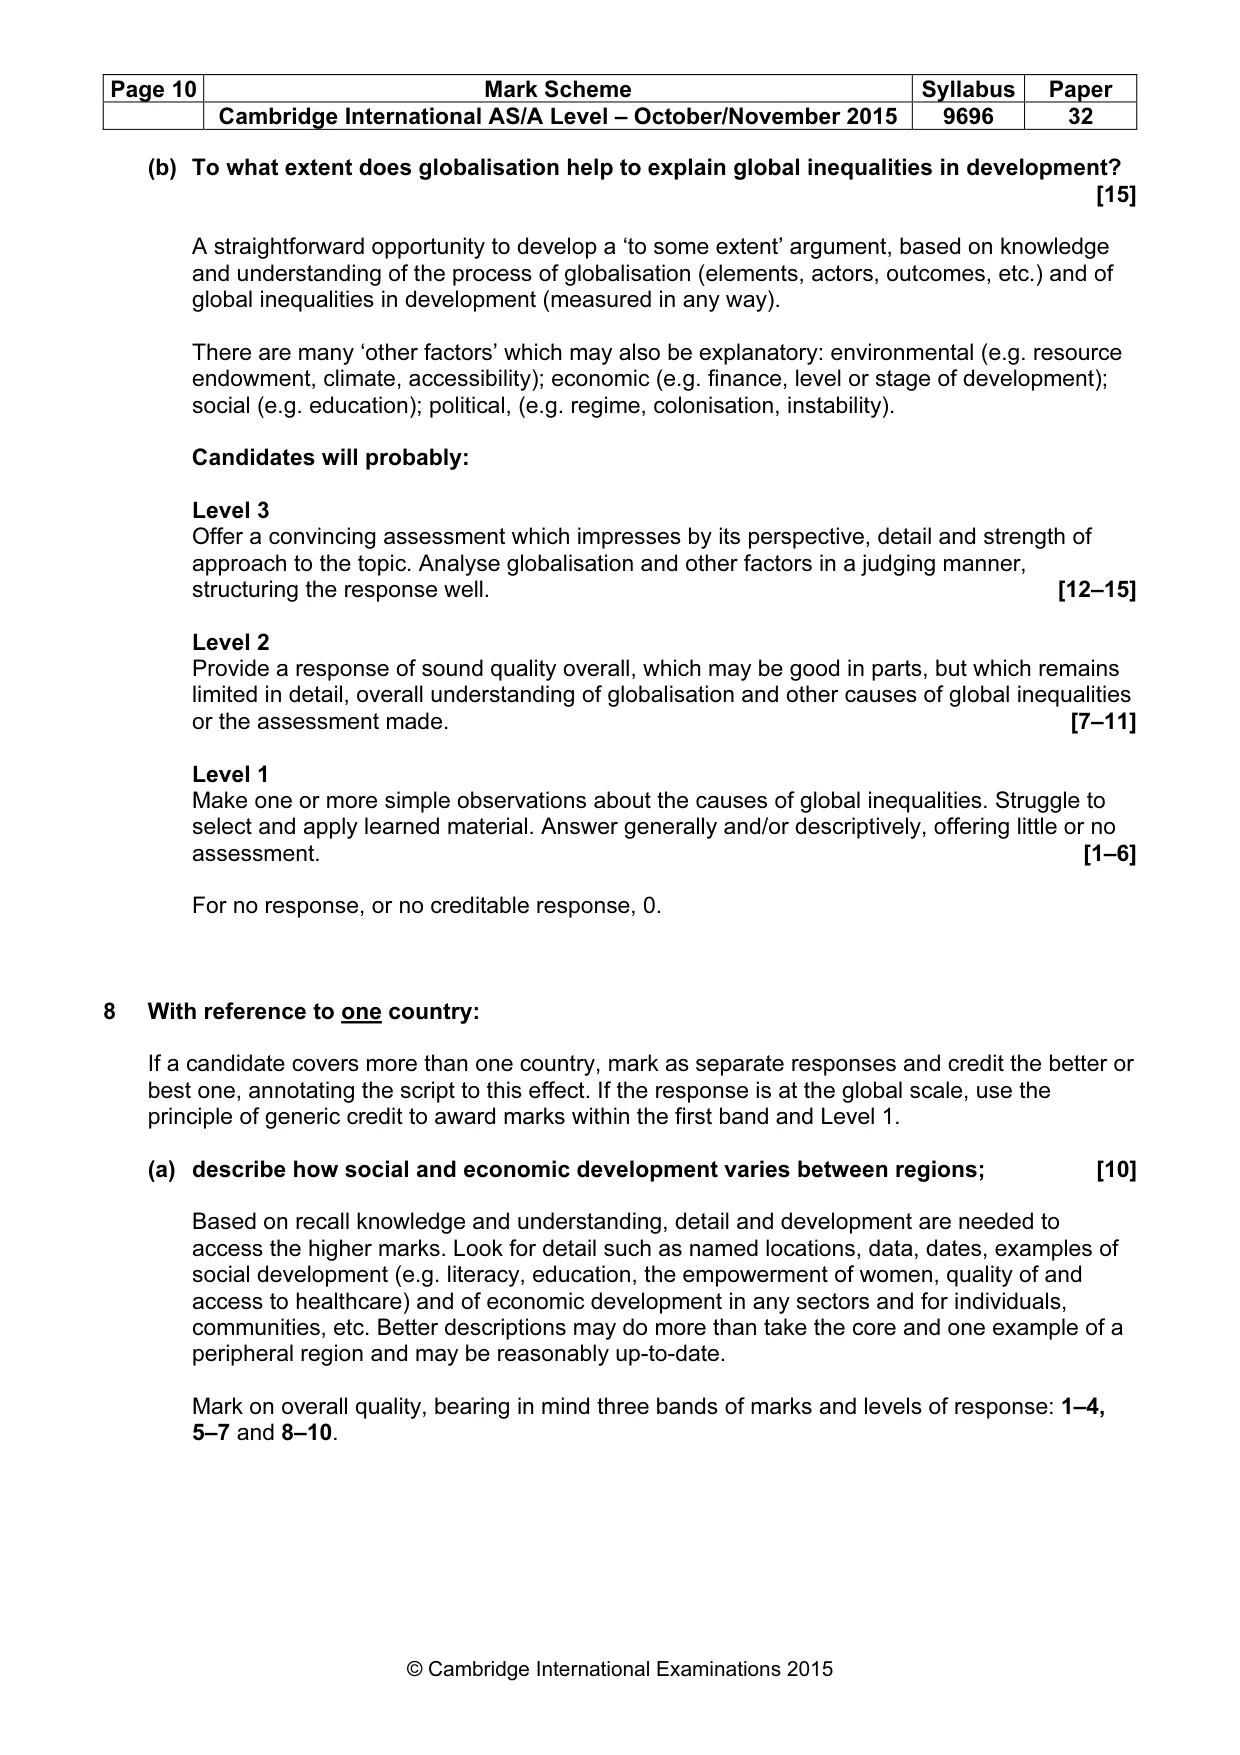
Mark scheme, page 10
Page 10 Mark Scheme Syllabus Paper Cambridge International AS/A Level – October/November 2015 9696 32 © Cambridge International Examinations 2015 (b) To what extent does globalisation help to explain global inequalities in development? [15] A straightforward opportunity to develop a ‘to some extent’ argument, based on knowledge and understanding of the process of globalisation (elements, actors, outcomes, etc.) and of global inequalities in development (measured in any way). There are many ‘other factors’ which may also be explanatory: environmental (e.g. resource endowment, climate, accessibility); economic (e.g. finance, level or stage of development); social (e.g. education); political, (e.g. regime, colonisation, instability). Candidates will probably: Level 3 Offer a convincing assessment which impresses by its perspective, detail and strength of approach to the topic. Analyse globalisation and other factors in a judging manner, structuring the response well. [12–15] Level 2 Provide a response of sound quality overall, which may be good in parts, but which remains limited in detail, overall understanding of globalisation and other causes of global inequalities or the assessment made. [7–11] Level 1 Make one or more simple observations about the causes of global inequalities. Struggle to select and apply learned material. Answer generally and/or descriptively, offering little or no assessment. [1–6] For no response, or no creditable response, 0. 8 With reference to one country: If a candidate covers more than one country, mark as separate responses and credit the better or best one, annotating the script to this effect. If the response is at the global scale, use the principle of generic credit to award marks within the first band and Level 1. (a) describe how social and economic development varies between regions; [10] Based on recall knowledge and understanding, detail and development are needed to access the higher marks. Look for detail such as named locations, data, dates, examples of social development (e.g. literacy, education, the empowerment of women, quality of and access to healthcare) and of economic development in any sectors and for individuals, communities, etc. Better descriptions may do more than take the core and one example of a peripheral region and may be reasonably up-to-date. Mark on overall quality, bearing in mind three bands of marks and levels of response: 1–4, 5–7 and 8–10.
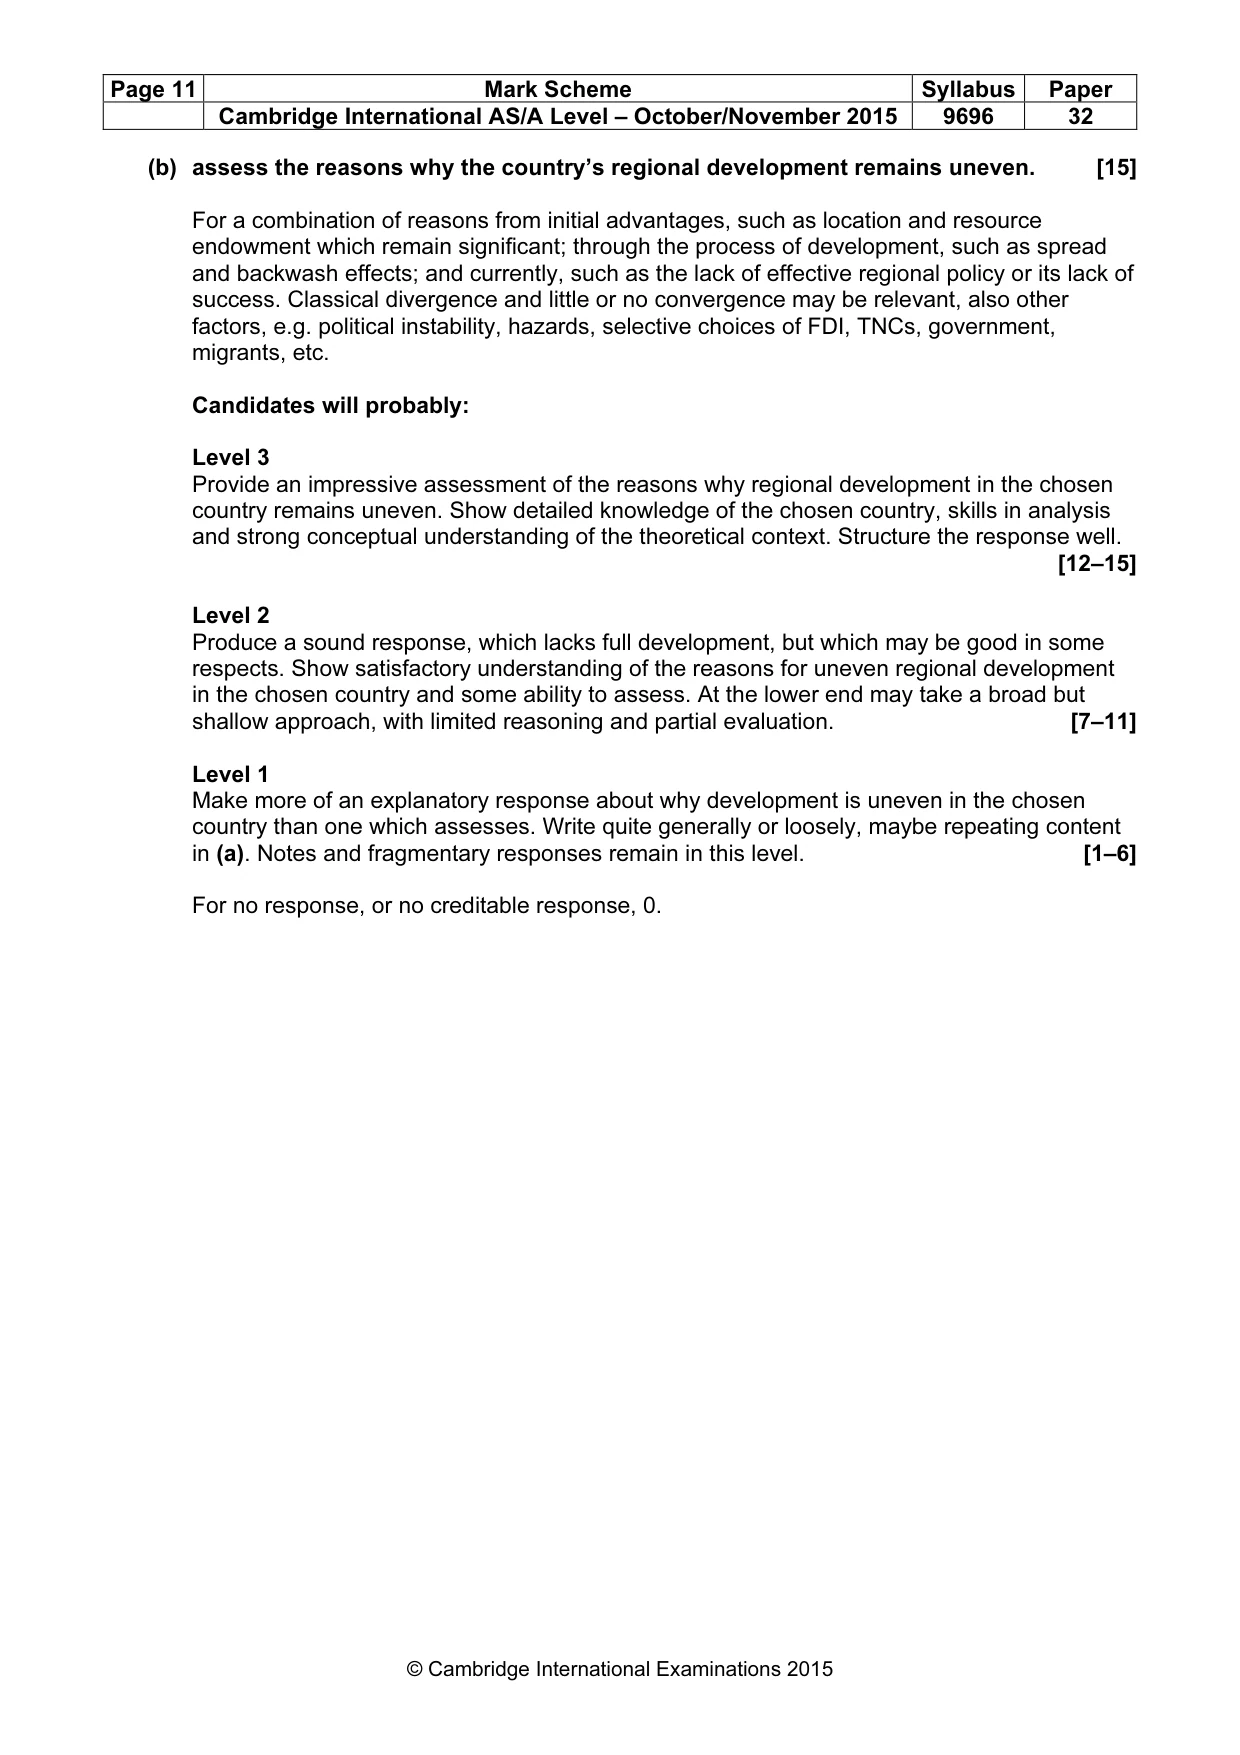
Mark scheme, page 11
Page 11 Mark Scheme Syllabus Paper Cambridge International AS/A Level – October/November 2015 9696 32 © Cambridge International Examinations 2015 (b) assess the reasons why the country’s regional development remains uneven. [15] For a combination of reasons from initial advantages, such as location and resource endowment which remain significant; through the process of development, such as spread and backwash effects; and currently, such as the lack of effective regional policy or its lack of success. Classical divergence and little or no convergence may be relevant, also other factors, e.g. political instability, hazards, selective choices of FDI, TNCs, government, migrants, etc. Candidates will probably: Level 3 Provide an impressive assessment of the reasons why regional development in the chosen country remains uneven. Show detailed knowledge of the chosen country, skills in analysis and strong conceptual understanding of the theoretical context. Structure the response well. [12–15] Level 2 Produce a sound response, which lacks full development, but which may be good in some respects. Show satisfactory understanding of the reasons for uneven regional development in the chosen country and some ability to assess. At the lower end may take a broad but shallow approach, with limited reasoning and partial evaluation. [7–11] Level 1 Make more of an explanatory response about why development is uneven in the chosen country than one which assesses. Write quite generally or loosely, maybe repeating content in (a). Notes and fragmentary responses remain in this level. [1–6] For no response, or no creditable response, 0.
What you needed in this session
Cambridge’s own grade thresholds for 2015 Oct/Nov, Paper 3 · Variant 2. A higher threshold means an easier paper — the bar moves with how the cohort did.